1. Introduction
Despite the efforts of the European Union’s Water Framework Directive (WFD), aquatic ecosystems continue to face growing threats from a variety of contaminants. This persistent challenge underscores the need for innovative approaches to restoration and management. Biological remediation has increasingly been recognised as an effective method for rehabilitating degraded aquatic environments, offering significant potential to enhance water quality in contaminated reservoirs [
1,
2,
3]. However, complex cases, particularly in flow-through reservoirs, require integrated remediation strategies, as these systems are continuously exposed to pollutant inflows from tributary rivers. The concept of biomechanical remediation represents a contemporary approach to environmental restoration, especially for reservoirs where sediment particulates trigger slow-release reactions. While biotechnological interventions have demonstrated promising improvements in water quality, the unique challenges of flow-through reservoirs, such as the accumulation of both natural and anthropogenic sediments, dictate tailor-made combinations of remediation techniques [
4]. Such dual approaches are critical for managing the multiple sources of pollution that contribute to the degradation of these aquatic systems.
Sedimentation processes in reservoirs can be broadly categorised into two types. The first type involves natural shallowing caused by interrupted sediment transport, typically occurring over decades without major impacts on water quality. In such cases, sediment removal can be a solution, and the extracted material can be repurposed for industrial applications without requiring extensive purification [
5].
The second type involves the deposition of mineral–organic suspensions originating from seasonal biological activity and the influx of organic pollutants, leading to the accumulation of soft organic fractions (SOFs) on the reservoir bed. These SOFs undergo biological decomposition, altering key water quality parameters [
6]. The decomposition of accumulated sediments often leads to severe environmental challenges, including oxygen depletion and the production of various toxic and odorous by-products [
7]. In eutrophicated reservoirs, intensive and prolonged sedimentation results in SOF layers exceeding one metre in thickness [
8], with dissolved oxygen (DO) levels indicating the development of anaerobic zones in near-bottom sediments [
9].
The release of biogenic substances from organic matter decomposition, coupled with organic pollutants in the water, promotes recurring algal blooms during the growing season (April–September). These blooms reduce the euphotic zone, accelerate the decline of planktonic algae biomass, and intensify sedimentation during spring and summer [
10]. These interconnected processes highlight the complex ecological imbalances characteristic of eutrophicated environments and emphasise the need for comprehensive remediation strategies to restore ecological equilibrium. Monitoring eutrophication and the response of reservoirs to restoration actions is commonly based on in-situ sampling. These measurements provide high analytical accuracy but are spatially sparse and may miss short-lived events and strong within-reservoir gradients. Satellite Earth observation offers synoptic and repeatable information on optically active constituents and bloom indicators, and it is increasingly used to support operational assessment of inland waters and management decisions [
11,
12]. Sentinel-2 MultiSpectral Instrument (MSI) data combine 10–20 m spatial resolution with red-edge bands that are sensitive to high chlorophyll-a concentrations and surface scums, enabling the detection of spatial heterogeneity even in relatively small reservoirs when atmospheric correction and mixed-pixel effects are treated carefully [
13,
14,
15].
In this study, Sentinel-2 data were used to map spatial and temporal variation in a red edge chlorophyll proxy within the portion of the reservoir classified as optically open water. The imagery provided spatial context for the field programme and helped identify heterogeneous areas that could not be represented fully by point sampling. It was not used to estimate exact changes in water surface area or to derive quantitative chlorophyll a concentrations.
Microbiological bioremediation has emerged as a crucial method for improving water quality and reducing organic matter accumulation in the benthic zone of various water bodies [
16,
17,
18]. Numerous studies across aquatic reservoirs have demonstrated its transformative impact, particularly in significantly enhancing DO levels within near-bottom layers [
3,
19]. Nevertheless, persistent algal blooms remain a concern, driven by excessive nutrient release during the degradation of existing pollutants in both the water column and bottom sediments [
9,
20].
Recent findings have also highlighted the adaptive capacity of densely vegetated reservoirs, where aquatic macrophytes effectively bioaccumulate nutrients and compete with planktonic algae, restricting algal growth [
21,
22,
23]. However, as macrophytes proliferate, their seasonal decay contributes to increasing phosphorus levels in the water column. To mitigate this, remediation strategies recommend autumn biomass removal before natural decomposition, enabling the elimination of substantial amounts of biogenic substances, including organic phosphorus [
3]. The combined application of microbiological bioremediation and controlled macrophyte proliferation extends and strengthens the cleansing processes and sediment reduction, particularly in low-flow water bodies. Such integrated strategies help prevent artificial eutrophication, promoting the sustainability of aquatic ecosystems [
23]. Reservoirs facing similar environmental threats are widespread across Europe, especially within the temperate climate zone [
24]. Selecting ecologically safe and economically justified remediation methods is therefore crucial for maintaining the ecological standards mandated by the EU Water Framework Directive (WFD).
These reservoirs highlight the urgent need for strategic actions that address contamination while also promoting ecological sustainability and economic viability. It is essential to maintain and restore these aquatic systems not only to comply with regulations but also to preserve biodiversity, protect water resources, and ensure the health of surrounding environments. Achieving this balance requires careful planning, innovative solutions, and a commitment to integrating ecological integrity with cost-effective remediation [
25].
The aim of this study was to assess environmental changes observed during an integrated programme of microbiological bioremediation and macrophyte management in a small eutrophic flow through reservoir. The specific objectives were to quantify changes in soft organic fractions, sediment properties, and selected water quality variables; document the practical consequences of macrophyte management; describe spatial and seasonal variation in the Sentinel-2 Maximum Chlorophyll Index during 2021 and 2022; and place the intervention within the historical catchment context represented by the CORINE Land Cover and Nutrient Delivery Ratio scenarios for 1990–2018. The study was designed as a monitored environmental case study rather than as a controlled experiment. The results are therefore interpreted as temporal patterns observed during the management programme and not as proof of an isolated treatment effect.
1.1. Environmental Parameters and Characterisation of the Investigated Water Reservoir
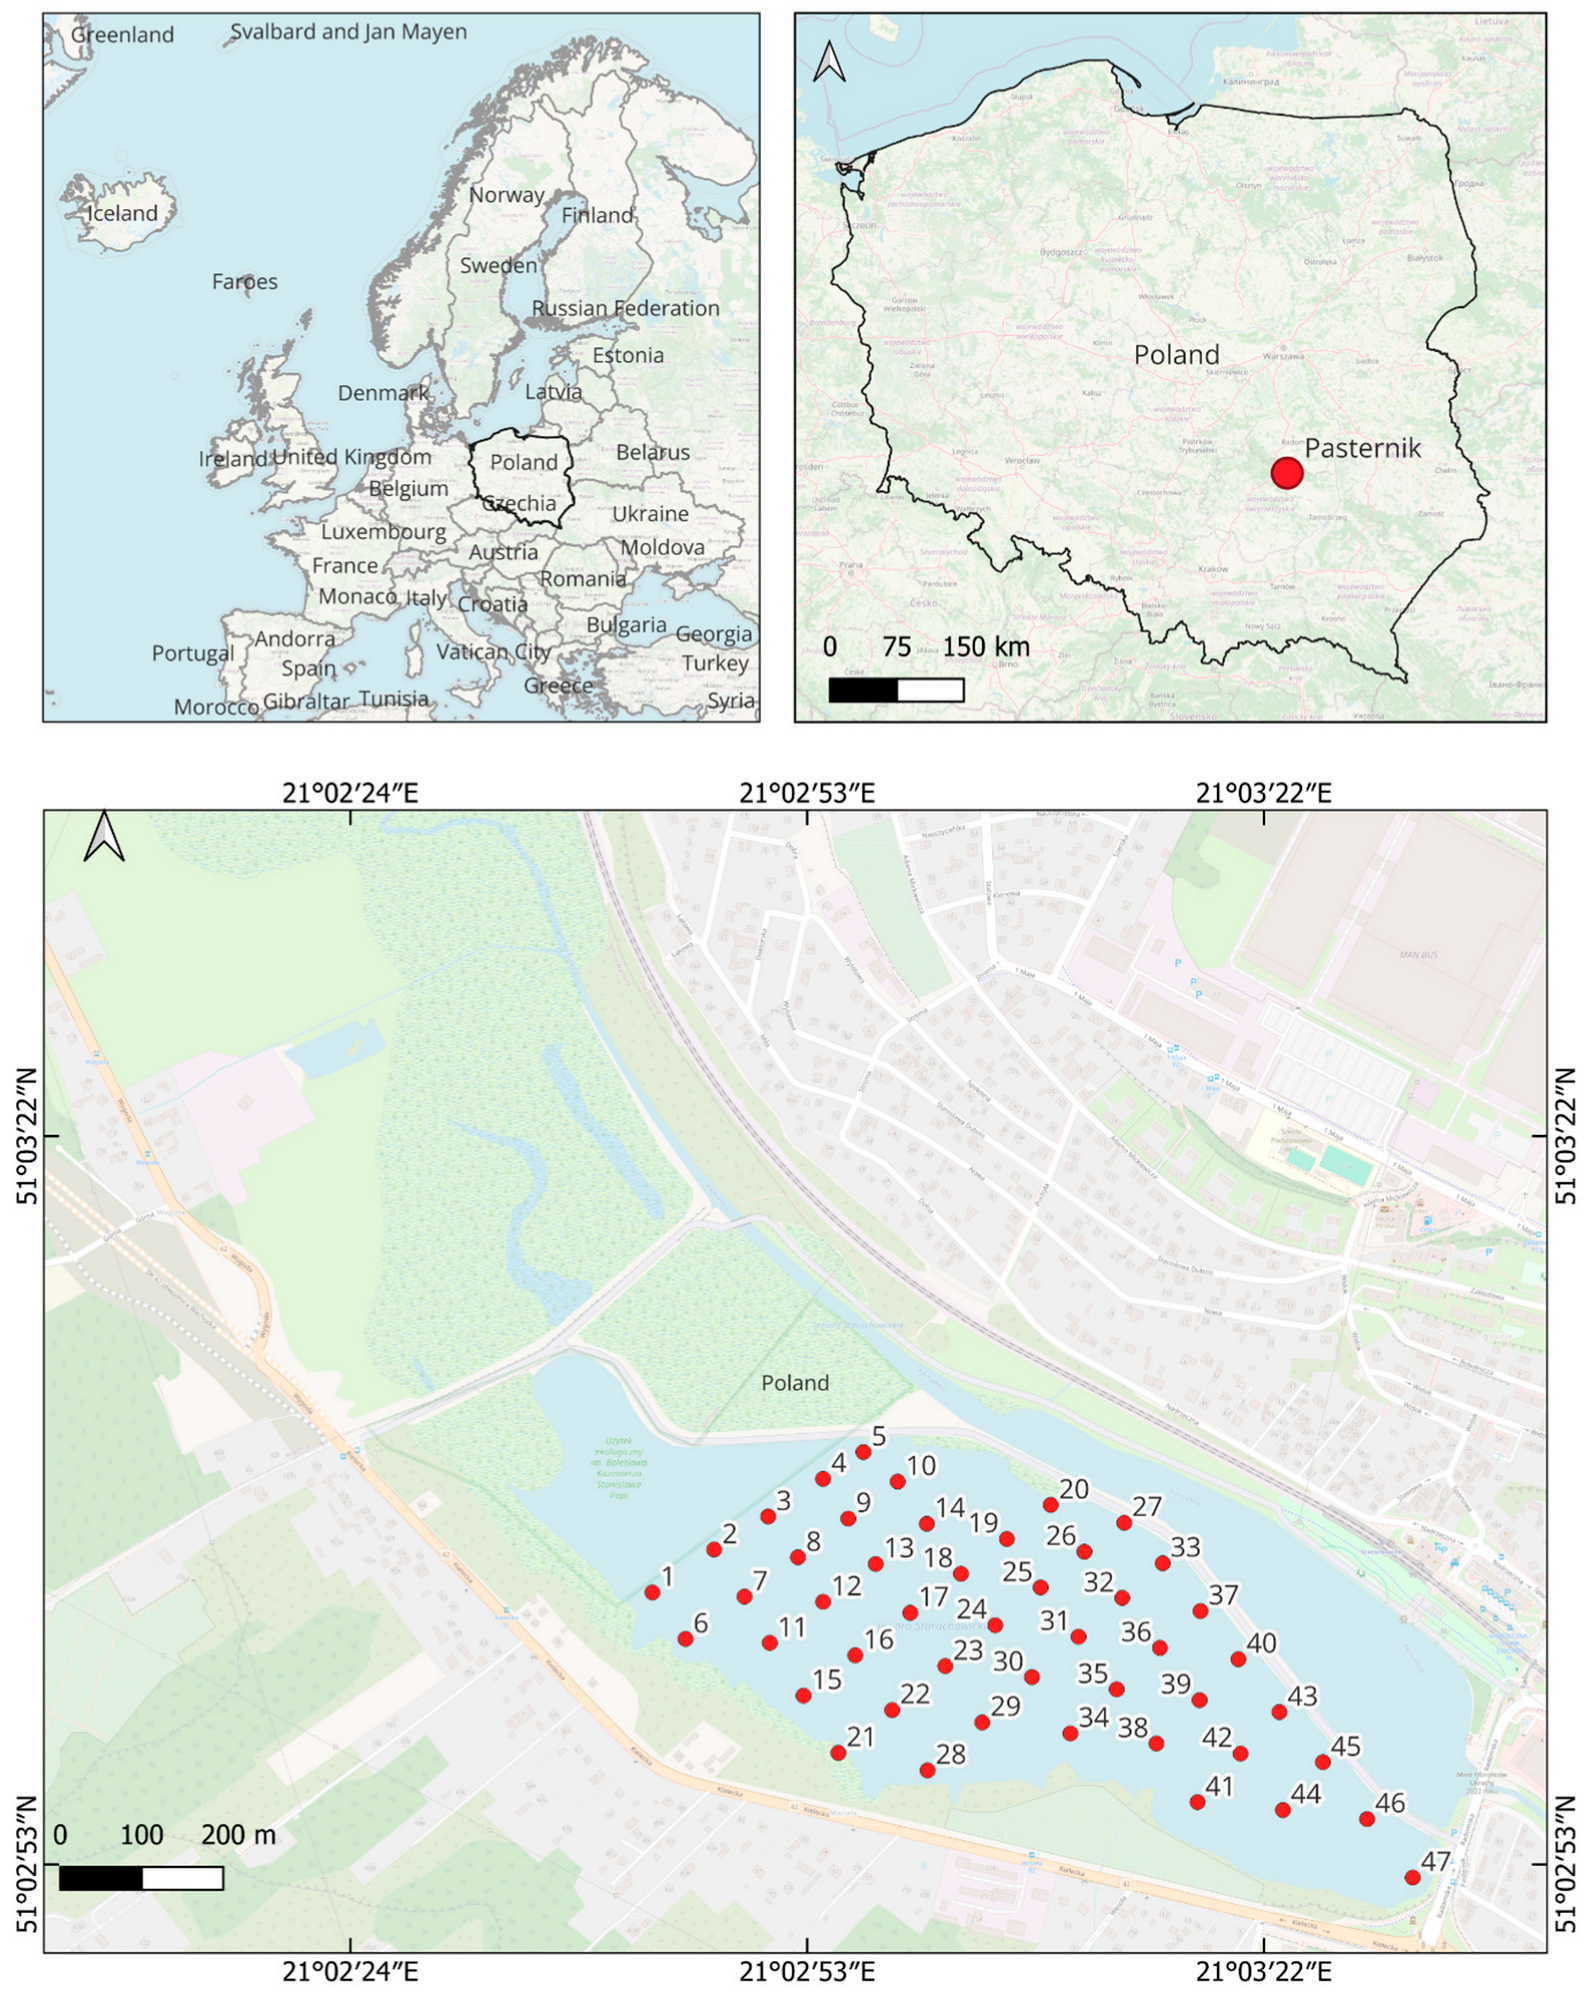
The Pasternik Reservoir in Starachowice is an artificial water body that was built in 1920, and it is fed by the waters of the Kamienna River. Its basic parameters and location are listed in
Table 1,
Figure 1.
The ongoing influx of pollutants presents significant challenges to the reservoir’s ecosystem, disrupting its natural balance and degrading water quality.
Pasternik Lake is classified as an Integrated Part of Surface Waters (JCWP) PLRW2000823439, located along the Kamienna River from Żarnówka to the Brody Iłżeckie Reservoir. The Kamienna River falls under abiotic type N. 8, which is classified as a small upland river of siliceous-western type according to the Polish Water Framework Directive (WFD) classification system. The ecological status of the river section from Żarnówka to the Brody Iłżeckie Reservoir is poor. However, in the Pasternik reservoir section, the quantitative and chemical conditions of the water are characterized as good (
Table 2).
During the summer, the average flow of the Kamienna River in the flowing section is approximately 2.2 m
3/s, while in winter, it rises to around 3.0 m
3/s. The reservoir is divided by a man-made causeway made of soil and rock into two sections: one part acts as a flow-through segment along the Kamienna River, and the other serves as a recreational retention reservoir. Since 2006, the north-western section has been designated as a protected ecological area. This 12.6 hectare protected region provides habitat for over 25 species of nesting waterfowl. Additionally, plant communities, including aquatic macrophytes, cover 33.2 hectares of the total 52.3 hectares of the reservoir and display a diverse range of species. Water reservoirs and wetlands, such as Pasternik, offer vital ecosystem services and are under numerous legal regulations that strictly protect the reservoir area from secondary transformations and negative impacts on the aquatic environment and natural conditions [
26].
1.2. Quality Parameters of the Reservoir Before the Intervention Process
The initial studies included in the report on the water environment status of the Pasternik reservoir area in Starachowice revealed that sediment thickness at ten measurement points varied from 0 to 95 cm. Subsequent investigations, conducted before the intervention procedures, encompassed 47 measurement points arranged on a geodetic grid (
Figure 1). The findings indicated that the average thickness of bottom sediments (SOF) was 85 cm, with a range between 10 and 170 cm. The initial intervention report identified excessive dissolved organic carbon and low oxygen levels in the near-bottom zone. The analysis of other Water Framework Directive (WFD) parameters classified the water’s ecological status as good. However, later examinations conducted prior to the intervention process revealed a significant oxygen deficit in the near-bottom zone, with levels approaching zero (0 mg O
2/dm
3). In contrast, surface water oxygen concentration was adequate due to abundant aquatic vegetation, varying between 1.5 and 8.28 mg O
2/dm
3.
Additionally, the results indicated elevated levels of chemical oxygen demand (COD), ranging from 43 to 73 mg O2/dm3, which confirmed the earlier findings from the preliminary report for the Regional Environmental Inspectorate (WIOŚ). The euphotic zone, as determined in the initial analysis, also displayed variability, ranging from 10 to 60 cm, with an average depth of 40 cm. This suggests a significant decrease in light penetration, resulting in unfavourable conditions for the development of aquatic ecosystems.
The initial qualitative assessments of the reservoir prior to the intervention process did not reveal any excess nutrient concentrations in the tested water samples. However, the sediments exhibited high levels of Ntot and Ptot.
2. Methodology
In accordance with the integrated approach, each method will be elaborated upon in a dedicated section.
2.1. Methods for Water and Bottom Sediment Quality Analysis
All methods and equipment used for water and bottom sediment analysis parameters are described in
Supplementary Materials Tables S13 and S14. Measurements were conducted as per a research plan at various points throughout the reservoir, both before and after the intervention process. Seven points were used for water and sediment sample analysis, and 47 points measured sediment layer thickness (SOF) (
Figure 2). Monitoring occurred at the same times in both seasons, considering rain-free periods and algal blooms, avoiding rainy high-flow periods.
Water quality research included both in-situ assessments, such as measuring dissolved oxygen levels and water clarity, as well as laboratory analyses of the collected samples to determine additional quality metrics. The first series of bioremediation experiments took place throughout 2021, involving four measurements of water quality parameters at specific intervals from August 2021 to July 2022.
2.2. Analytical Methods of In-Situ Data
The statistical analysis was performed using Statistica 13.3 software non-parametric Wilcoxon matched-pairs signed-rank test (alfa = 0.05), to evaluate the statistical significance of the differences observed between the data pairs, graphically represented mean and interquartile ranges.
2.3. NDR Modelling
The InVEST software’s (3.14.2) Nutrient Delivery Ratio component was employed to model the nutrient spread across the watershed under study. The NDR model, integral to this process, uses geographical data layers within a GIS framework, yielding spatially detailed maps of both phosphate (P
tot) and nitrate (N
tot) dispersal from land to aquatic systems. This model evaluates how human activity affects water quality by calculating nutrient influx from varied land uses like agriculture, urban environments, forests, and other areas within the drainage basin [
27,
28,
29].
A straightforward material balance methodology underpins the NDR model, quantifying nutrient flow across a given watershed or sub-watershed. The model outputs the amount of nutrients in terms of kilograms per standard pixel area (kg·px
−1), taking into account land use and land cover classifications to estimate nutrient movement through the landscape [
28,
30]. The NDR output maps serve as indicators of potential nutrient pollution risks within different regions, highlighting areas that might be more susceptible to contamination issues. These visual representations facilitate an expedient assessment and comparison of regions based on contamination risks. However, it’s crucial to recognise that the NDR model produces estimates and that actual nutrient levels in water bodies may deviate due to real-world variables, including precipitation patterns and farming techniques [
31,
32,
33,
34,
35].
Five historical scenarios were prepared using the comparable CORINE Land Cover reference years 1990, 2000, 2006, 2012, and 2018. The 2018 scenario is the final member of this historical series. The model was not extrapolated to 2021 or 2022, and the NDR outputs are therefore used as catchment context rather than as a contemporaneous estimate of nutrient loading during the management programme.
2.4. Land Cover Quantification
Land cover in the Pasternik catchment was characterised using CORINE Land Cover status layers for 1990, 2000, 2006, 2012, and 2018. Each layer was clipped to the same catchment boundary and assigned to the land use and land cover categories used in the NDR scenarios. The area of each category was divided by the total catchment area and reported as a whole percentage in
Table 3.
Table 3 summarises catchment wide composition after category assignment and rounding. It is not a pixel-by-pixel land cover change matrix. Local boundary shifts, changes within a category, or changes too small to alter the rounded catchment share may therefore occur without changing the percentage shown in the table.
The increase in urban and built-up land between 1990 and 2012 was accompanied by a decline in the agricultural categories. By contrast, the reported shares of evergreen needleleaf forest, mixed forest, and water bodies remained unchanged at the precision used in the table. The category shares obtained for 2012 and 2018 were identical. Both dates were retained as separate official CLC reference years, but no land cover driven difference between the 2012 and 2018 NDR scenarios is inferred.
2.5. Satellite Data Processing and Analysis
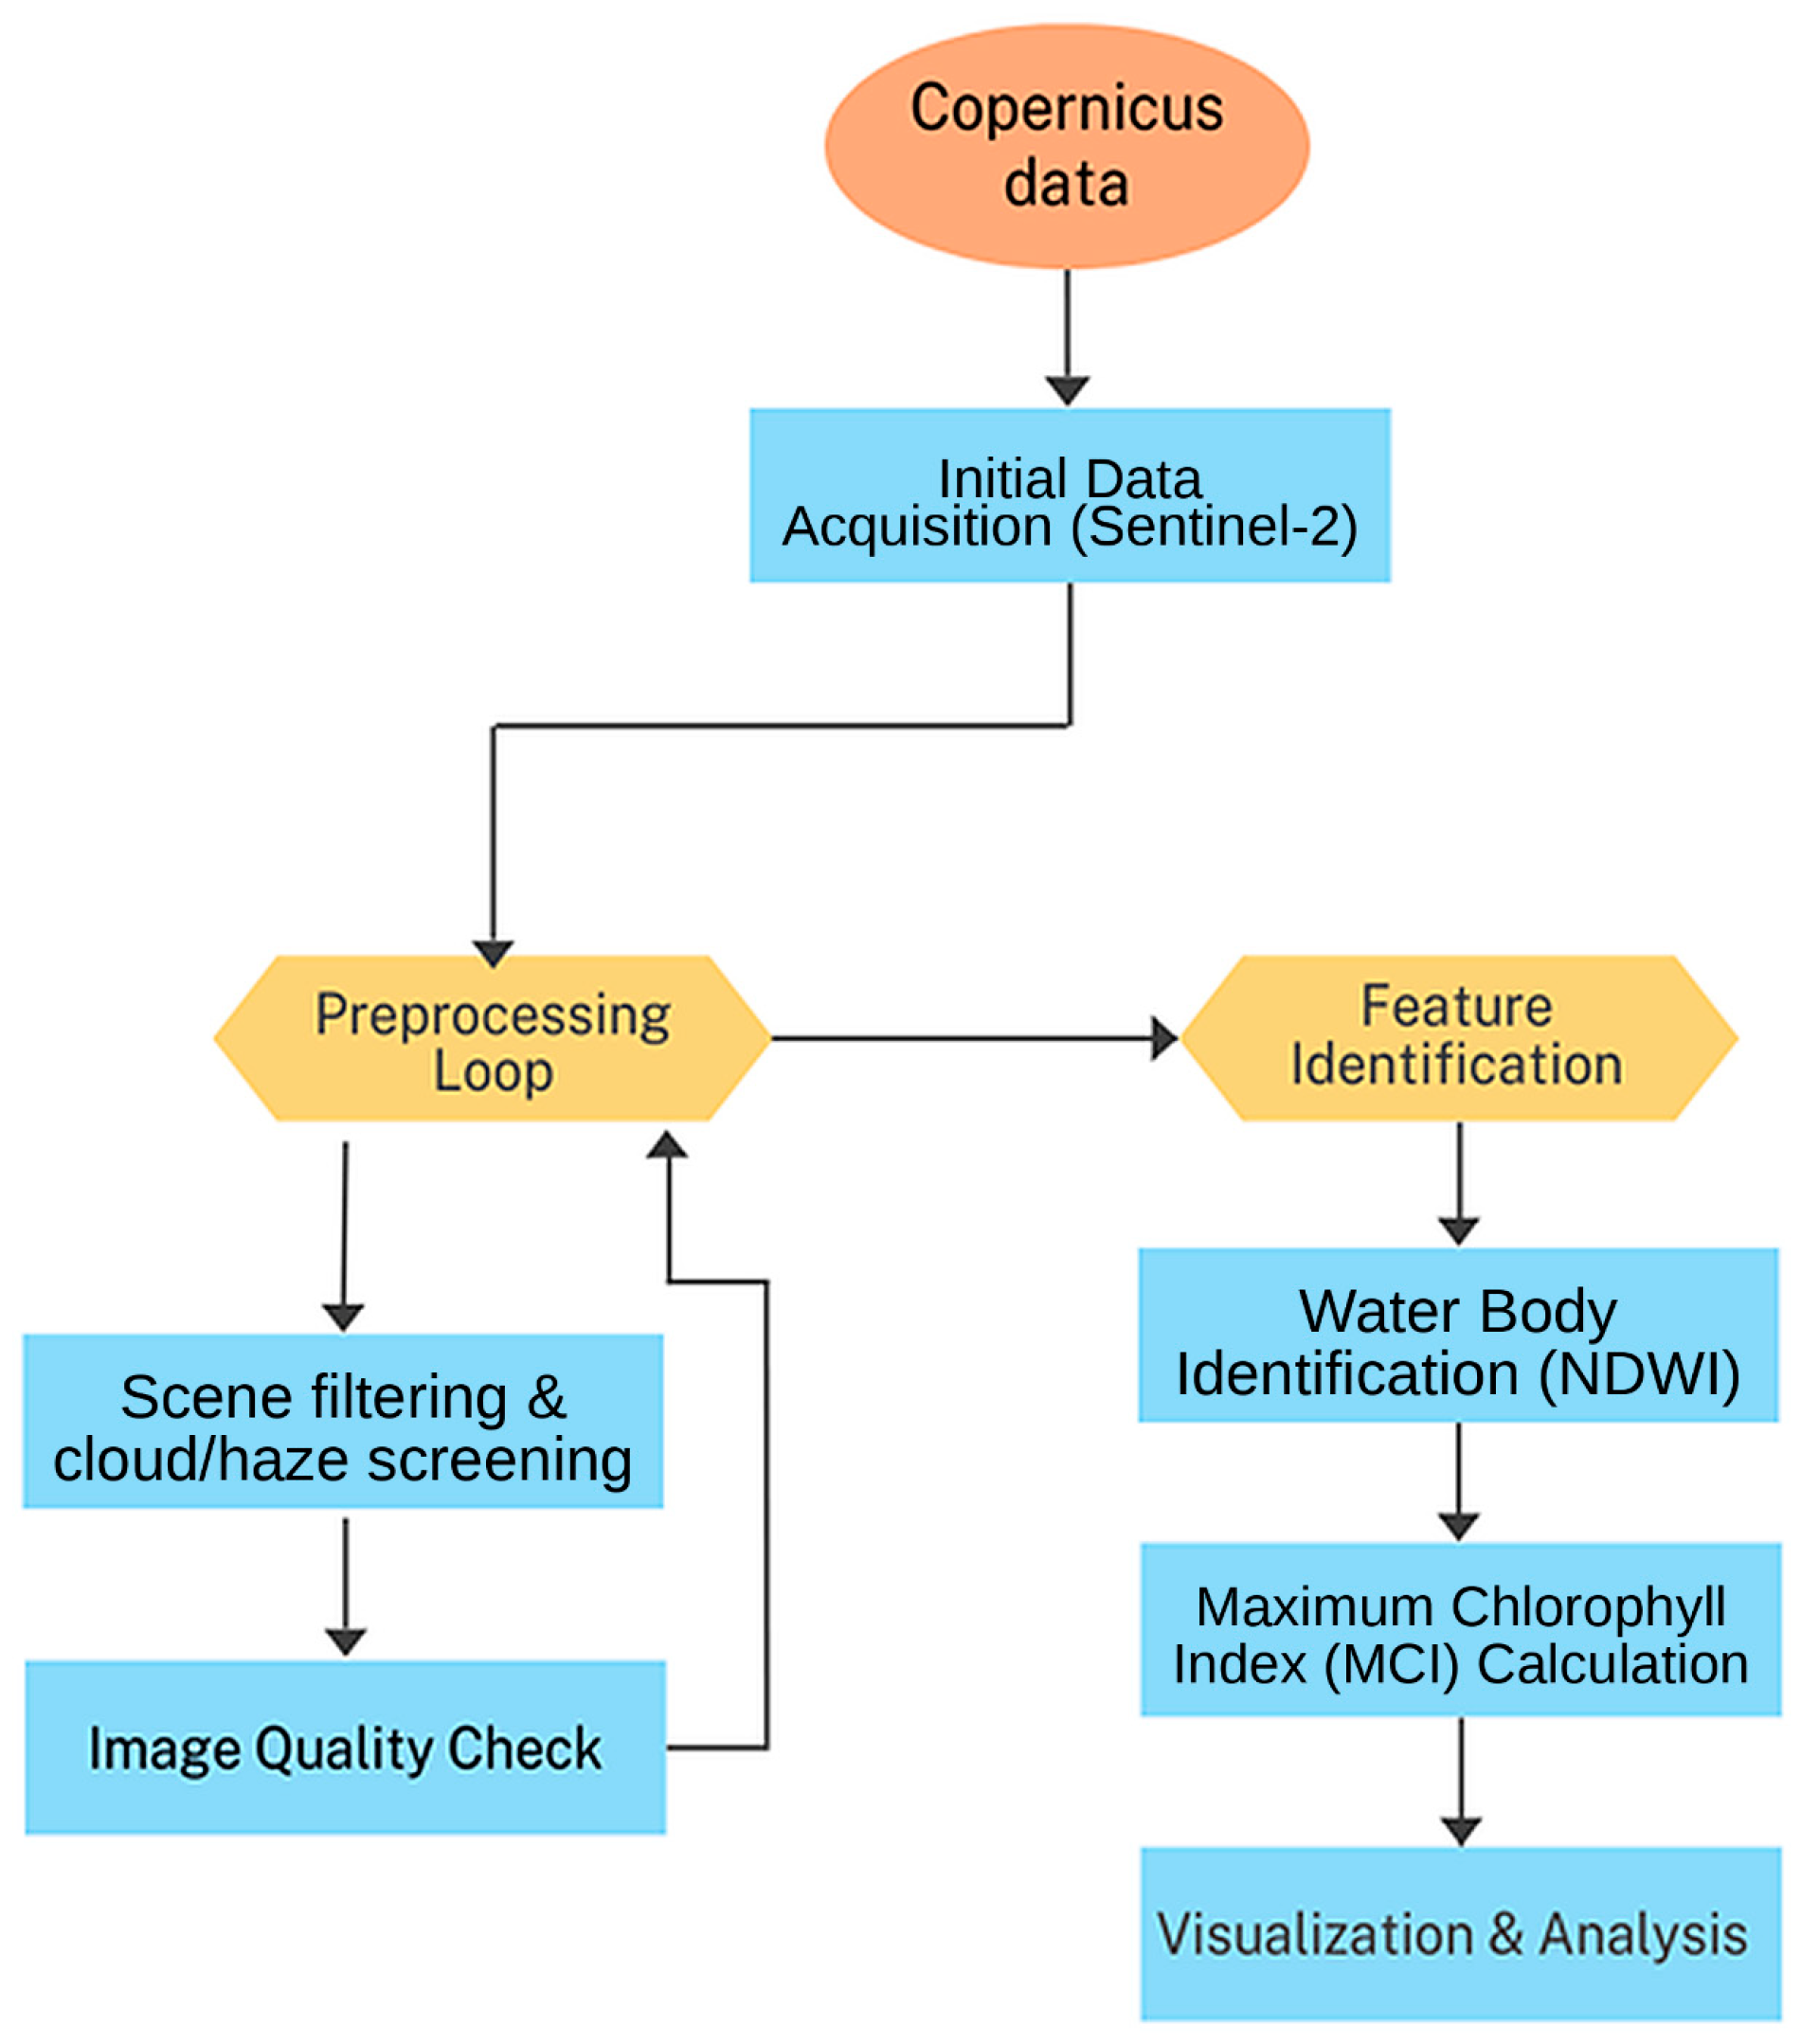
Sentinel-2 MSI Level-2A surface reflectance imagery was processed in Google Earth Engine using the COPERNICUS/S2_SR collection. The acquisitions presented in Figures 6 and 7 cover April to October 2021 and March to September 2022. Images were filtered to the Pasternik Reservoir area and screened using scene level CLOUD_COVERAGE_ASSESSMENT values below 10%. When more than one acquisition was available for a date, the scene with the lowest reported cloud cover was retained. No additional pixel level SCL or QA60 mask was applied in the workflow used to prepare the figures [
36]. Candidate scenes were therefore inspected visually, and images affected by cloud, cloud shadow, or haze over the reservoir were excluded (
Figure 2).
Open water pixels were delineated using the Normalized Difference Water Index (NDWI) [
37], computed from the green and near-infrared bands (B3 and B8) [
37]:
Pixels with NDWI greater than 0.0 were retained as optically open water. The same threshold was applied to all acquisitions and was not adjusted separately for individual dates. The original workflow did not include a formal sensitivity analysis of alternative NDWI thresholds. The mask was therefore used only to exclude clearly non-water areas before MCI visualisation. It was not used to estimate exact shoreline position, open water area, or quantitative change in water extent. Nearshore pixels and areas affected by floating or emergent vegetation were treated as uncertain, and interpretation focused on recurring patterns within the reservoir interior.
The Maximum Chlorophyll Index was calculated from bands B4, B5, and B6 as a relative indicator of the red edge optical signal [
38,
39,
40]:
where
ρ665,
ρ705, and
ρ740 are Sentinel-2 Level-2A surface reflectance values in bands B4, B5, and B6, respectively. Because bands B5 and B6 have a native spatial resolution of 20 m, the effective spatial resolution of MCI is 20 m. The maps were exported at 10 m for figure layout, which represents display resampling and not an increase in the information content of the index.
The final processing workflow used MCI for all panels in Figures 6 and 7. Sentinel-2 Level-2A reflectance is stored with a scale factor of 10,000. The maps were displayed using one common range from −50 to 150 in the scaled representation, equivalent to MCI × 104. MCI was treated as a relative optical indicator and was not converted to chlorophyll a concentration.
The field monitoring programme was not designed as a satellite calibration experiment and did not provide a sufficient series of independent, quality-controlled matchups for a robust empirical relationship. The MCI maps and chlorophyll a measurements were therefore interpreted as complementary observations rather than as a calibrated or independently validated dataset.
2.6. The Methodology of Applying Biopreparations Within the Pasternik Reservoir Area
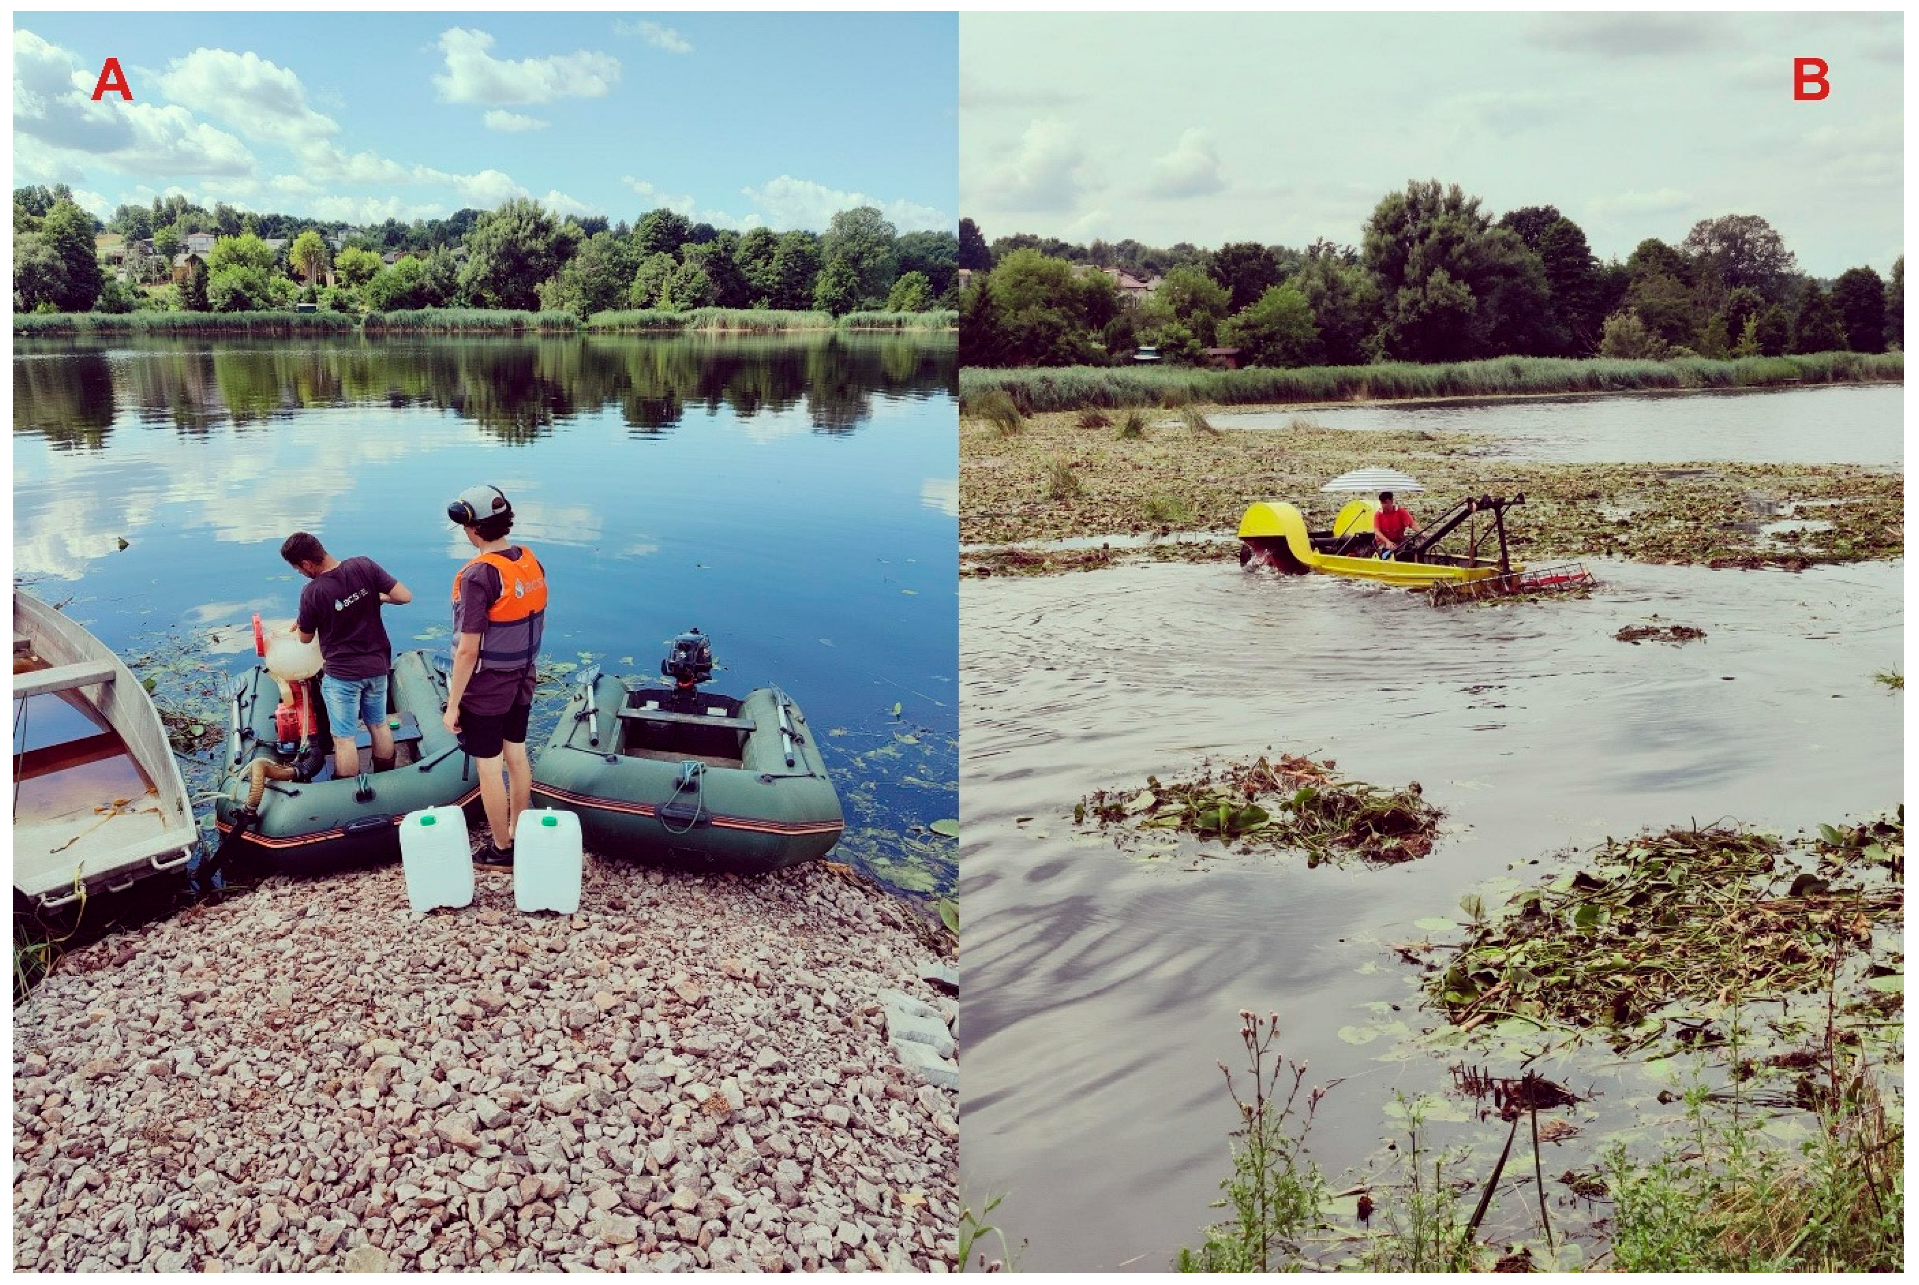
The biopreparation application process took place in July 2021, with water temperatures exceeding 20 °C by ACS (Environmental Biotechnology Holding Group). The Water Surface application used high-flow injector streams to achieve efficient water mixing and enhance oxygenation, thus promoting better adaptation of consortia to the new critical environment. Biomixtures were systematically introduced into the macrophyte zone, providing a secure environment for their development and shielding against the harmful effects of sunlight and UV radiation. This application is carried out by various technical groups across designated quadrants of the reservoir (
Figure 3A).
The aquatic vegetation cutting works was carried out according to the scenario presented in the intervention process project (
Figure 3B). Cutting was carried out with the use of an aquatic harvester in previously defined reservoir zones.
The biopreparation named Dr. Fish applied for water treatment and SOF reduction consists of water, sugar cane molasses, and effective microorganisms, which include the main strains: Lactobacillus casei, Lactobacillus plantarum at a concentration of 5.0 × 10⁶ cfu·mL−1, and Saccharomyces cerevisiae at a concentration of 5.0 × 10³ cfu·mL−1.
3. Results
The results are presented according to the principal components of the monitoring programme: sediment changes, water quality, macrophyte management, satellite observations, and historical catchment modelling.
3.1. Changes in Soft Organic Fraction Thickness and Sediment Properties
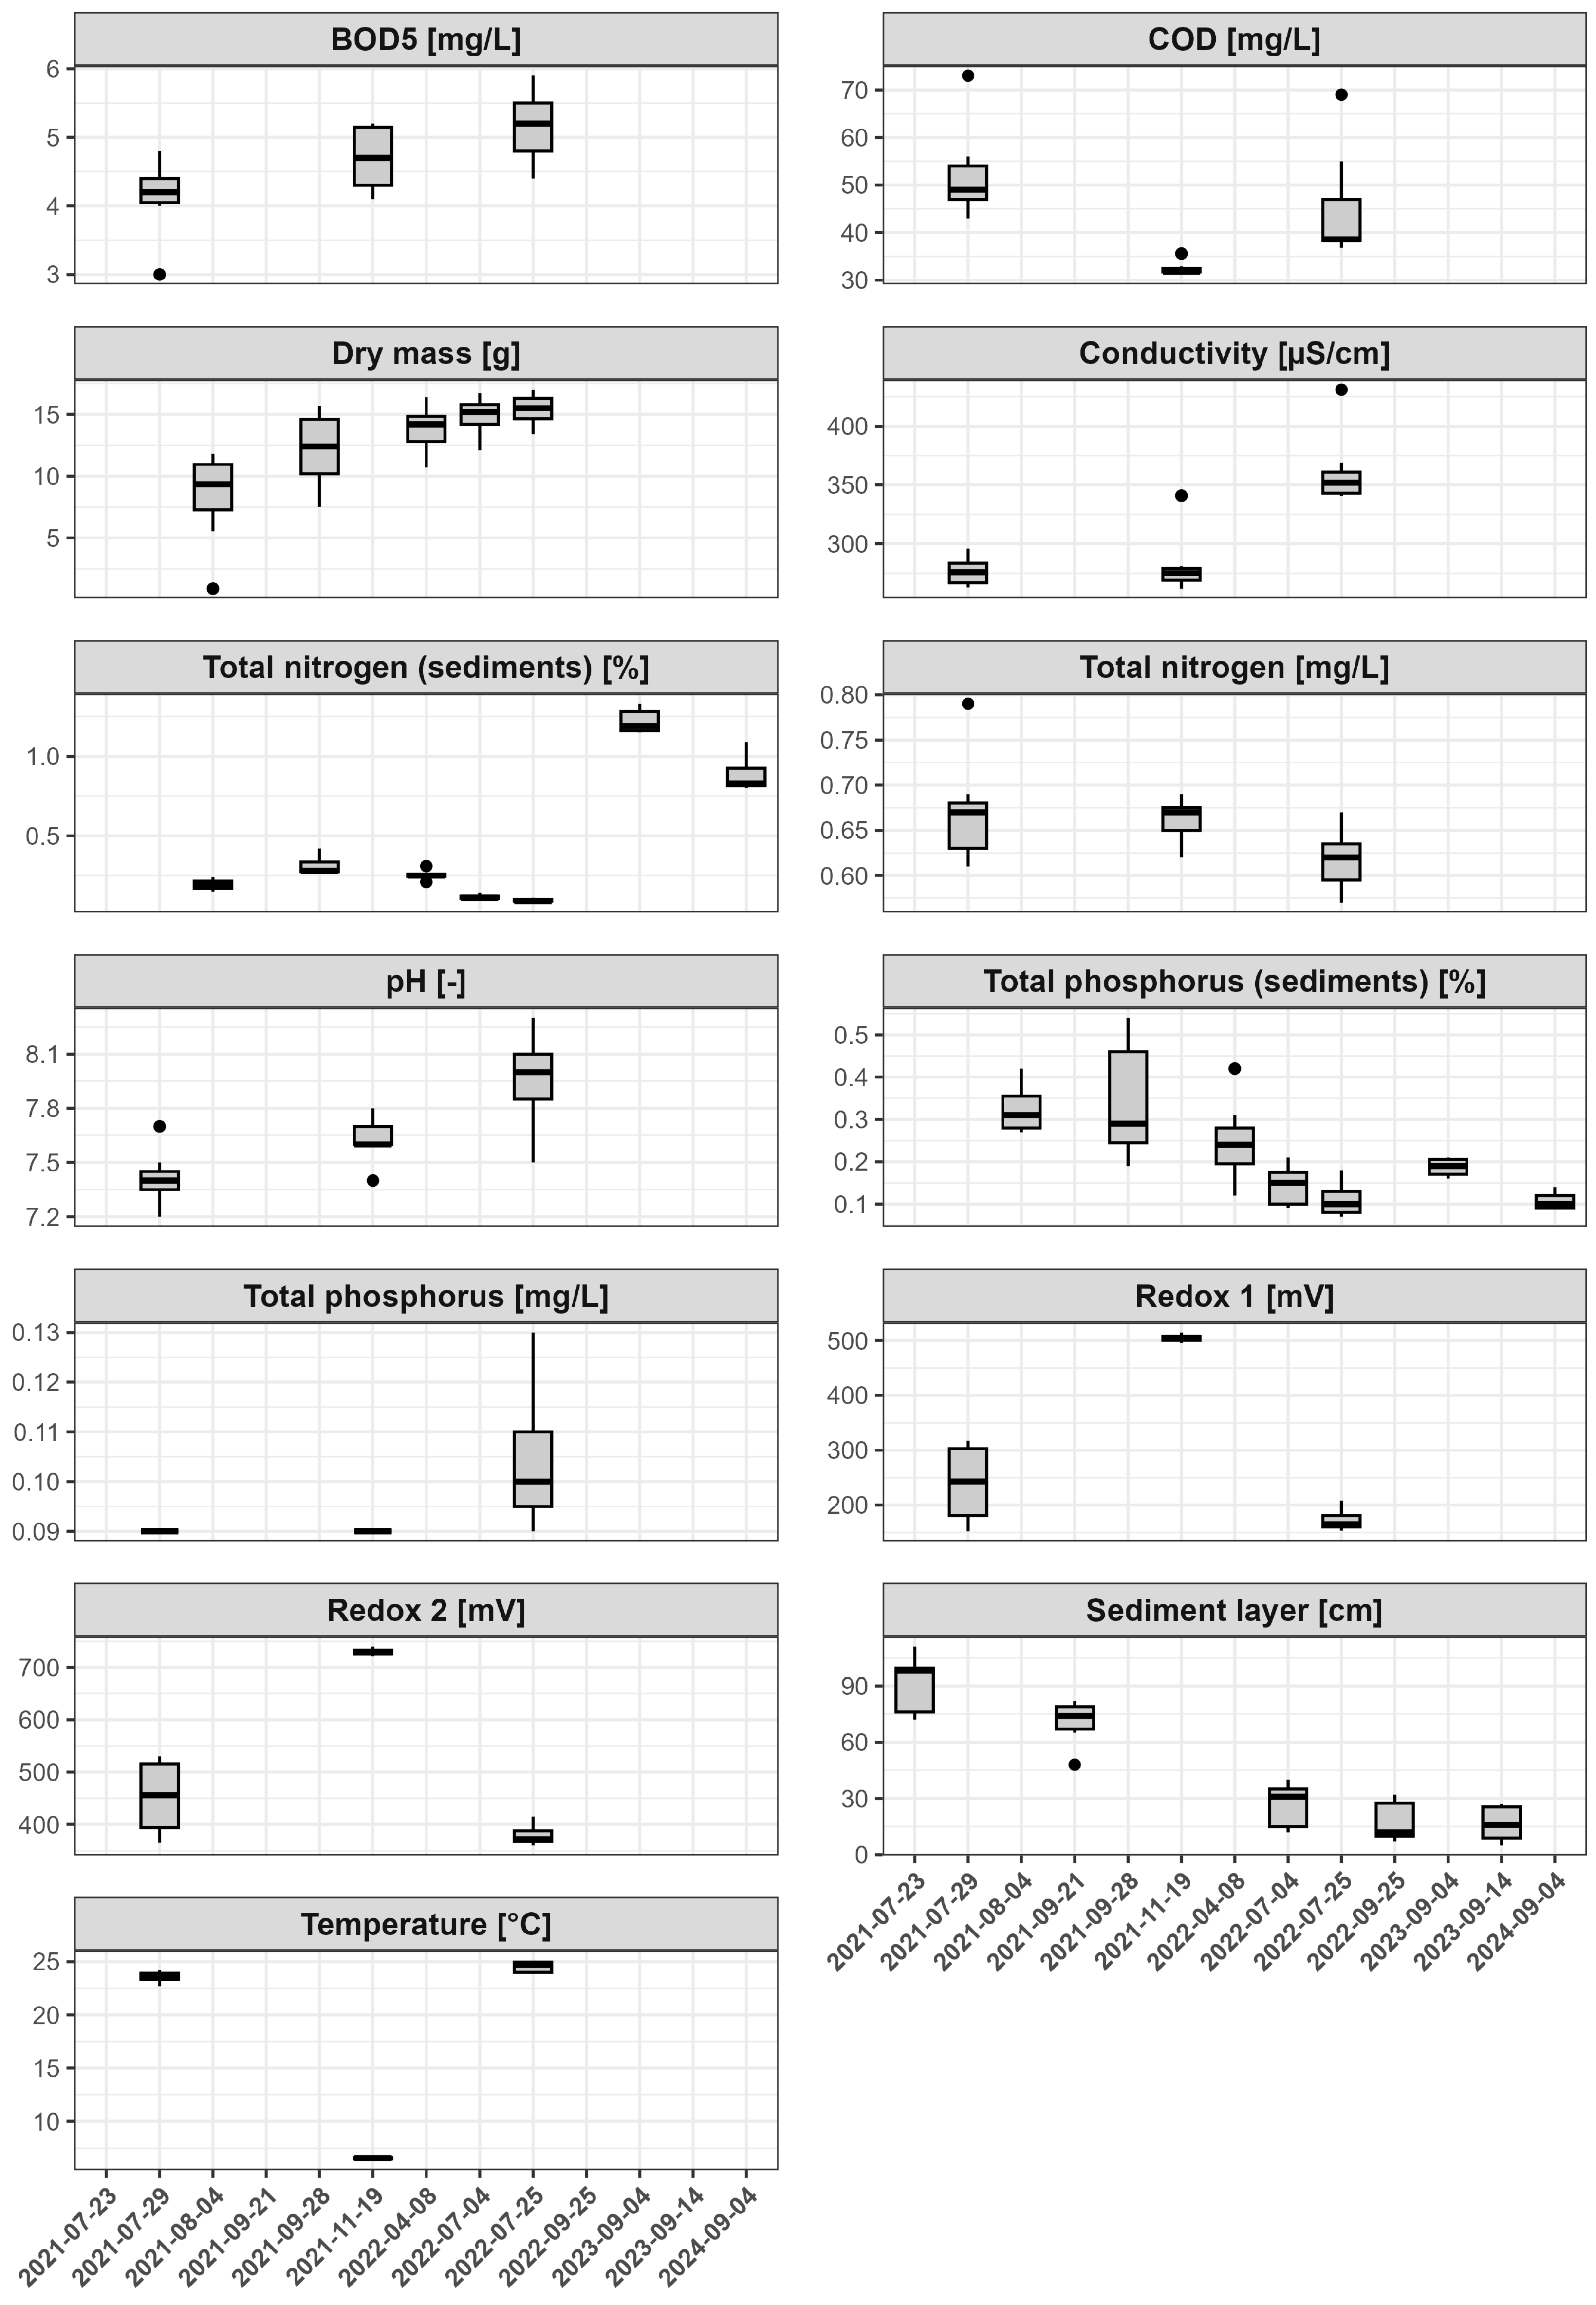
Before the management programme, soft organic fraction thickness varied from 10 to 170 cm across the 47-point grid, with a mean value of 85 cm. Successive surveys showed a pronounced reduction in the monitored layer. The mean SOF thickness recorded in the final survey was 78% lower than the initial value. The distribution shifted towards lower values across the reservoir, although spatial differences among individual grid points remained. The paired comparison confirmed a statistically significant change; the full test output is reported in
Supplementary Materials (
Figure 4).
The reduction in SOF thickness was accompanied by a gradual increase in sediment dry mass at the seven sampling stations. Dry organic matter decreased from 47.3% in the initial campaign to 18.9% in the final campaign. Differences in dry mass between the monitoring periods were statistically significant according to the Wilcoxon analysis presented in
Supplementary Materials. These results document a change in the physical composition of the upper sediment layer during the monitoring period.
Sediment total phosphorus showed an overall decline after the higher values recorded during the early campaigns, although the course was not strictly monotonic and a temporary increase occurred in one of the later surveys. Total nitrogen was more variable. It remained comparatively low during the early campaigns, increased markedly in a later follow-up survey, and declined again in the final survey. The nitrogen and phosphorus series therefore followed different temporal patterns and should not be interpreted as a uniform decline in sediment nutrient content.
3.2. Water Transparency, Turbidity, and Chlorophyll a
Initial Secchi depth ranged from 10 to 60 cm, with a mean of approximately 40 cm. Water transparency increased between July and August 2021, and the difference between these measurements was statistically significant. During the following season, mean transparency was more than 20% higher than the initial value, although the corresponding comparison was not statistically significant. The measurements remained spatially variable, and the distributions recorded during successive campaigns partly overlapped.
Turbidity also differed between monitoring periods. The statistical analysis indicated significant differences, but the temporal pattern was not monotonic. Higher values occurred during periods of active vegetation management, while lower values were recorded in several later campaigns. The data therefore show substantial short-term variability rather than a continuous decline throughout the complete monitoring record.
Chlorophyll a was relatively high before the intervention and decreased in the first campaign following the application of the biopreparation. Lower concentrations were also recorded during several later observations, and the comparisons between monitoring periods were statistically significant. At least two short-lived bloom events were nevertheless observed during the subsequent season. The field record therefore indicates lower chlorophyll a during several campaigns, but it does not support a statement that algal blooms were completely absent throughout the study.
3.3. Dissolved Oxygen and Organic Matter Indicators
The initial measurements showed a pronounced oxygen deficit in the near-bottom water, with dissolved oxygen approaching 0 mg O
2 dm
−3 at some sampling locations. During later campaigns, near-bottom concentrations commonly reached approximately 4–6 mg O
2 dm
−3. The comparison of analogous monitoring periods showed a statistically significant increase, as documented in the
Supplementary Materials.
Surface water was better oxygenated at baseline, with concentrations ranging from 1.5 to 8.28 mg O2 dm−3. Surface dissolved oxygen also increased during the later monitoring campaigns, although the magnitude of change varied among stations. The corresponding paired comparison was statistically significant. Because the campaigns were conducted under different temperature conditions, the observed oxygen pattern is interpreted further in the Discussion.
BOD5 remained within a relatively narrow range, and differences between the compared periods were not statistically significant. COD showed greater variability. The mean value was approximately 15% lower in the later season, but this change was not statistically significant. Thus, the strongest change among the oxygen-related variables concerned dissolved oxygen, whereas BOD5 remained broadly stable and the reduction in COD was moderate.
3.4. Nutrient Concentrations in the Water Column
Total nitrogen and total phosphorus concentrations in the water column varied less strongly than the sediment variables. No hazardous exceedances were reported for the analysed samples. Most comparisons between successive monitoring periods were not statistically significant, and neither variable showed a consistent monotonic increase or decrease throughout the monitoring record.
Total nitrogen remained within a comparatively narrow range, with overlapping distributions between campaigns. Total phosphorus also showed limited variation, although one later campaign contained a wider spread and several higher observations. The water-column nutrient series therefore did not mirror the temporary changes recorded in sediment nitrogen and phosphorus.
The occurrence of short-lived bloom events was not accompanied by a uniform increase in both total nitrogen and total phosphorus at all seven sampling stations. The available measurements indicate that the temporal behaviour of chlorophyll a and bloom observations cannot be explained by a simple simultaneous change in the two bulk nutrient concentrations alone.
3.5. Other Physicochemical Variables
Water temperature reflected the seasonal timing of the field campaigns. Most measurements were obtained under warm growing season conditions, whereas one campaign was conducted at a substantially lower temperature. This contrast is relevant when comparing dissolved oxygen and other temperature-sensitive variables between dates.
The pH remained within a neutral to mildly alkaline range and showed no abrupt shift during the monitoring period. Specific electrical conductivity was also relatively stable during most campaigns, although isolated higher observations occurred. Neither variable showed a continuous directional trend across the full series.
Redox potential varied between monitoring campaigns, and the two reported redox series differed in their absolute values because they were referenced using different conventions. Neither series followed a simple temporal pattern comparable with the decline in SOF thickness. Overall, these supporting physicochemical variables were more variable and less directional than the changes observed in the sediment layer and dissolved oxygen.
3.6. Macrophyte Management and Surface Conditions
Macrophyte cutting was carried out in the designated management zones using an aquatic harvester. Vegetation regenerated rapidly during the growing season, and more than one cutting operation was required to maintain access to open water. The repeated regrowth increased the operational effort and cost of vegetation management.
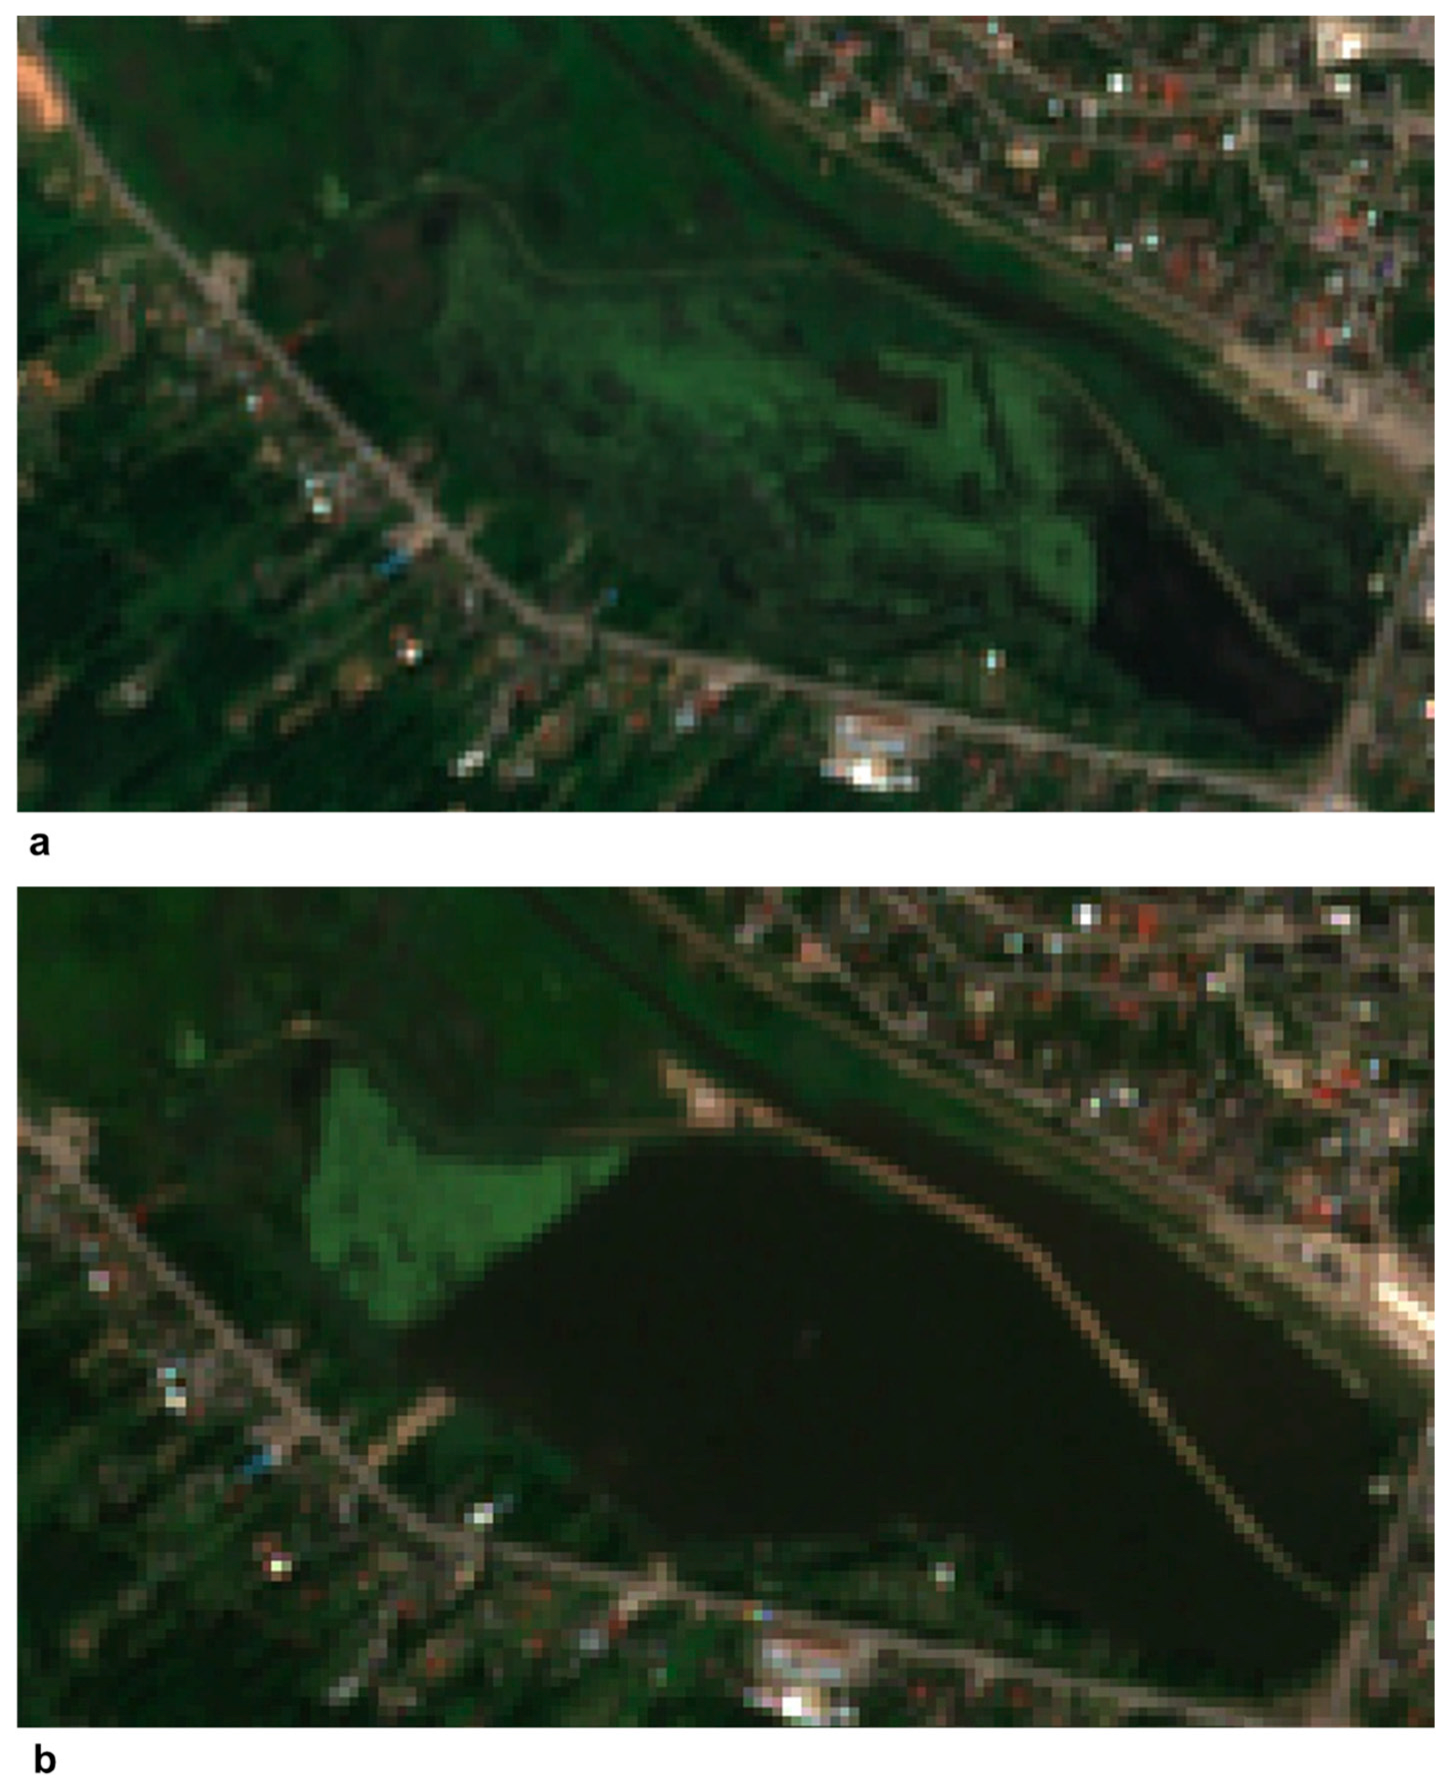
The true colour Sentinel-2 images in
Figure 5 show a marked difference in the optical appearance of the reservoir before and after vegetation removal. The later image contains a larger dark open-water area, particularly in the wider retention basin. These images provide visual documentation of the change in surface cover, but they do not quantify macrophyte area, removed biomass, or water quality. Differences between the two dates may also reflect seasonal development, water level, turbidity, illumination, and atmospheric conditions.
Water-quality variables did not show an immediate and uniform response to each cutting event. Turbidity remained variable, and changes in dissolved oxygen, chlorophyll a, and nutrient concentrations did not occur simultaneously. The separate contribution of the installed artificial ecotones and floating plant islands could not be distinguished from the influence of the naturally occurring macrophyte community on the basis of the available measurements.
3.7. Spatial and Temporal Patterns of the Maximum Chlorophyll Index
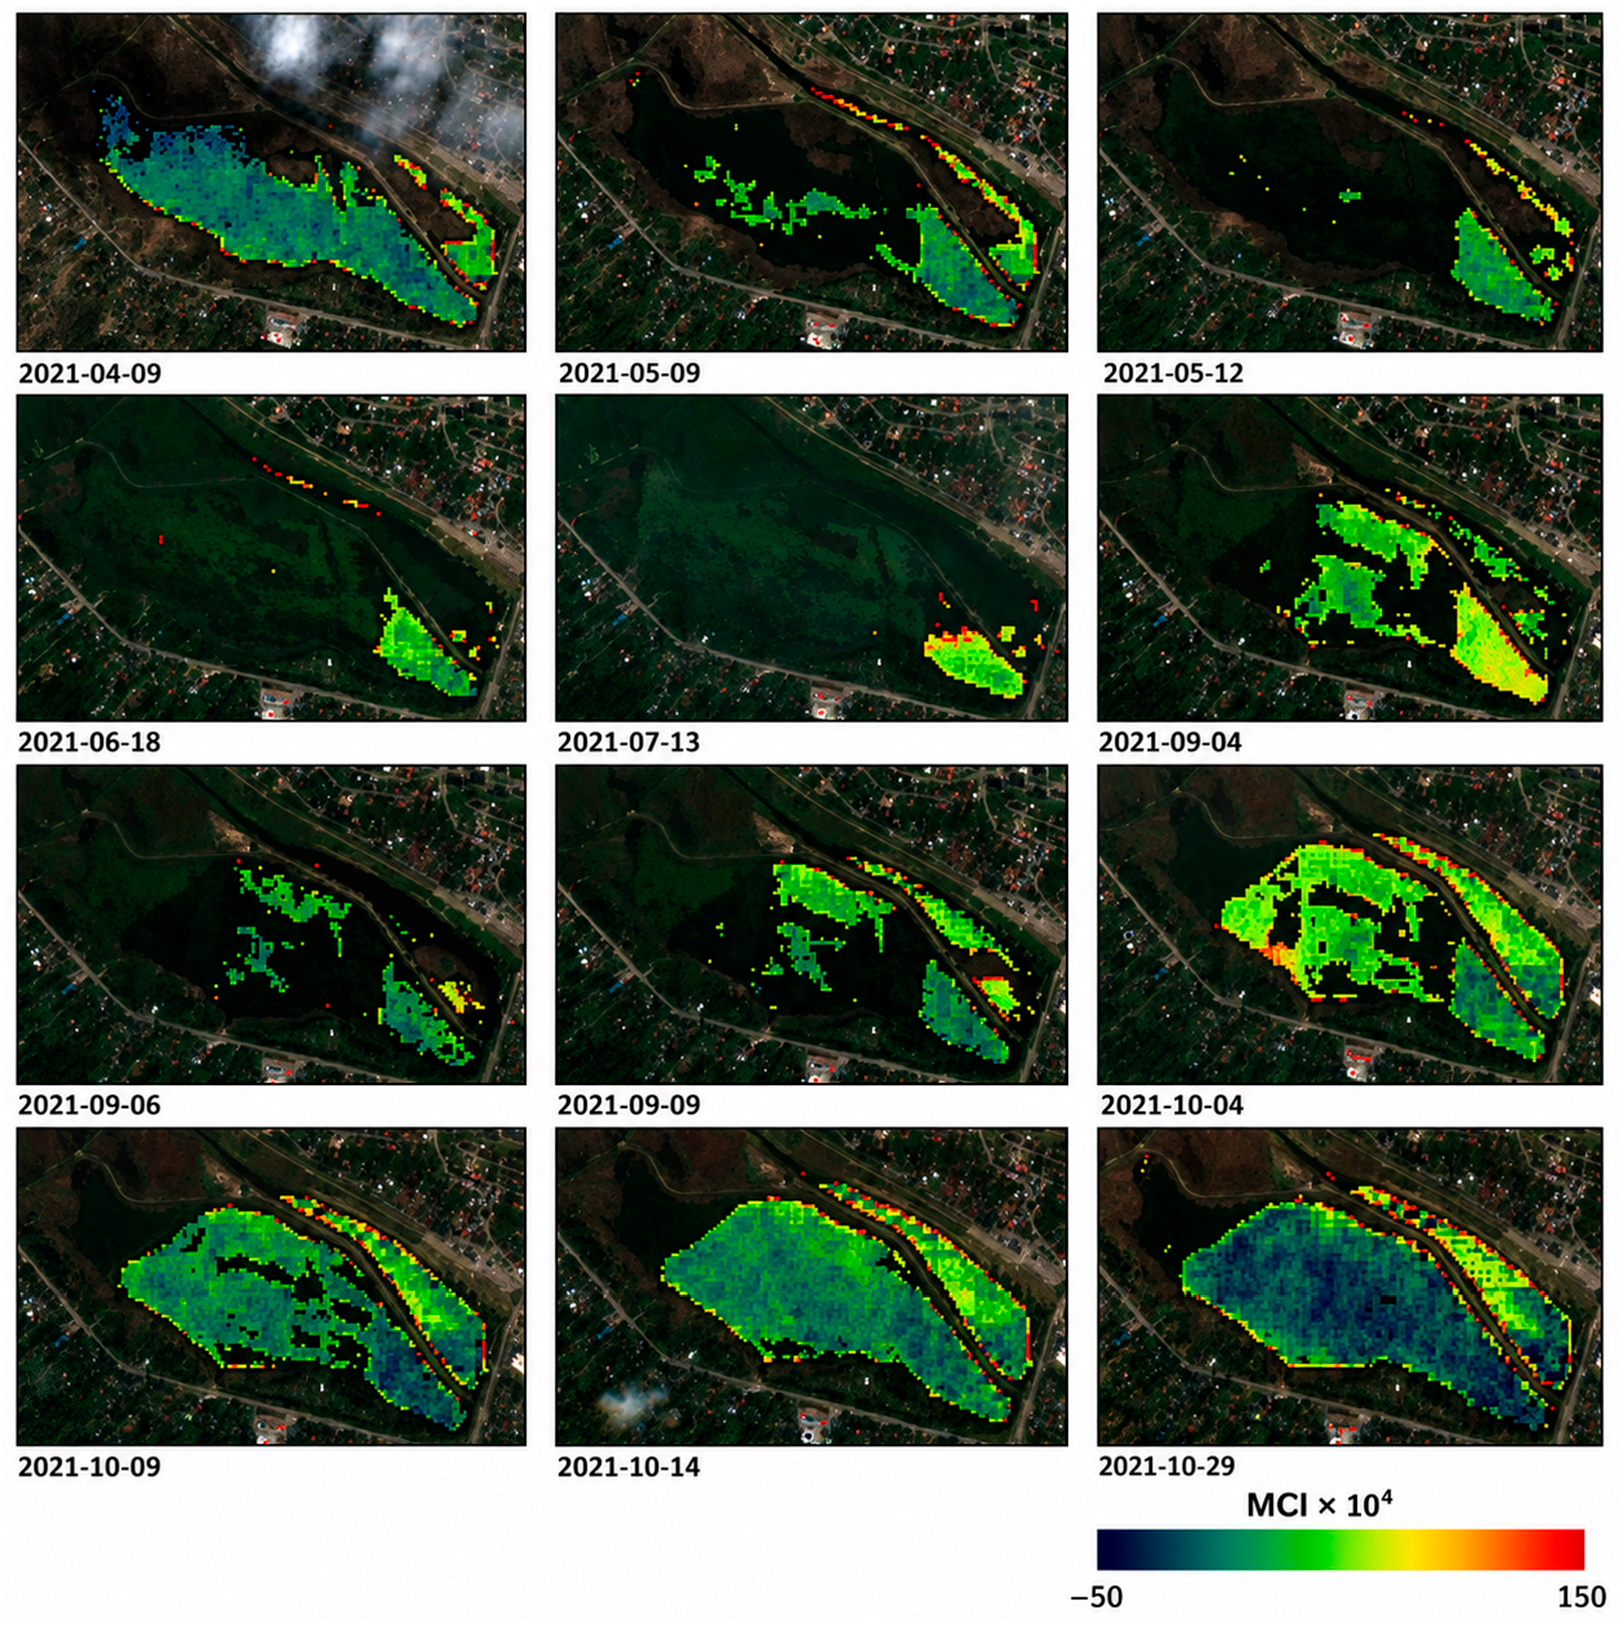
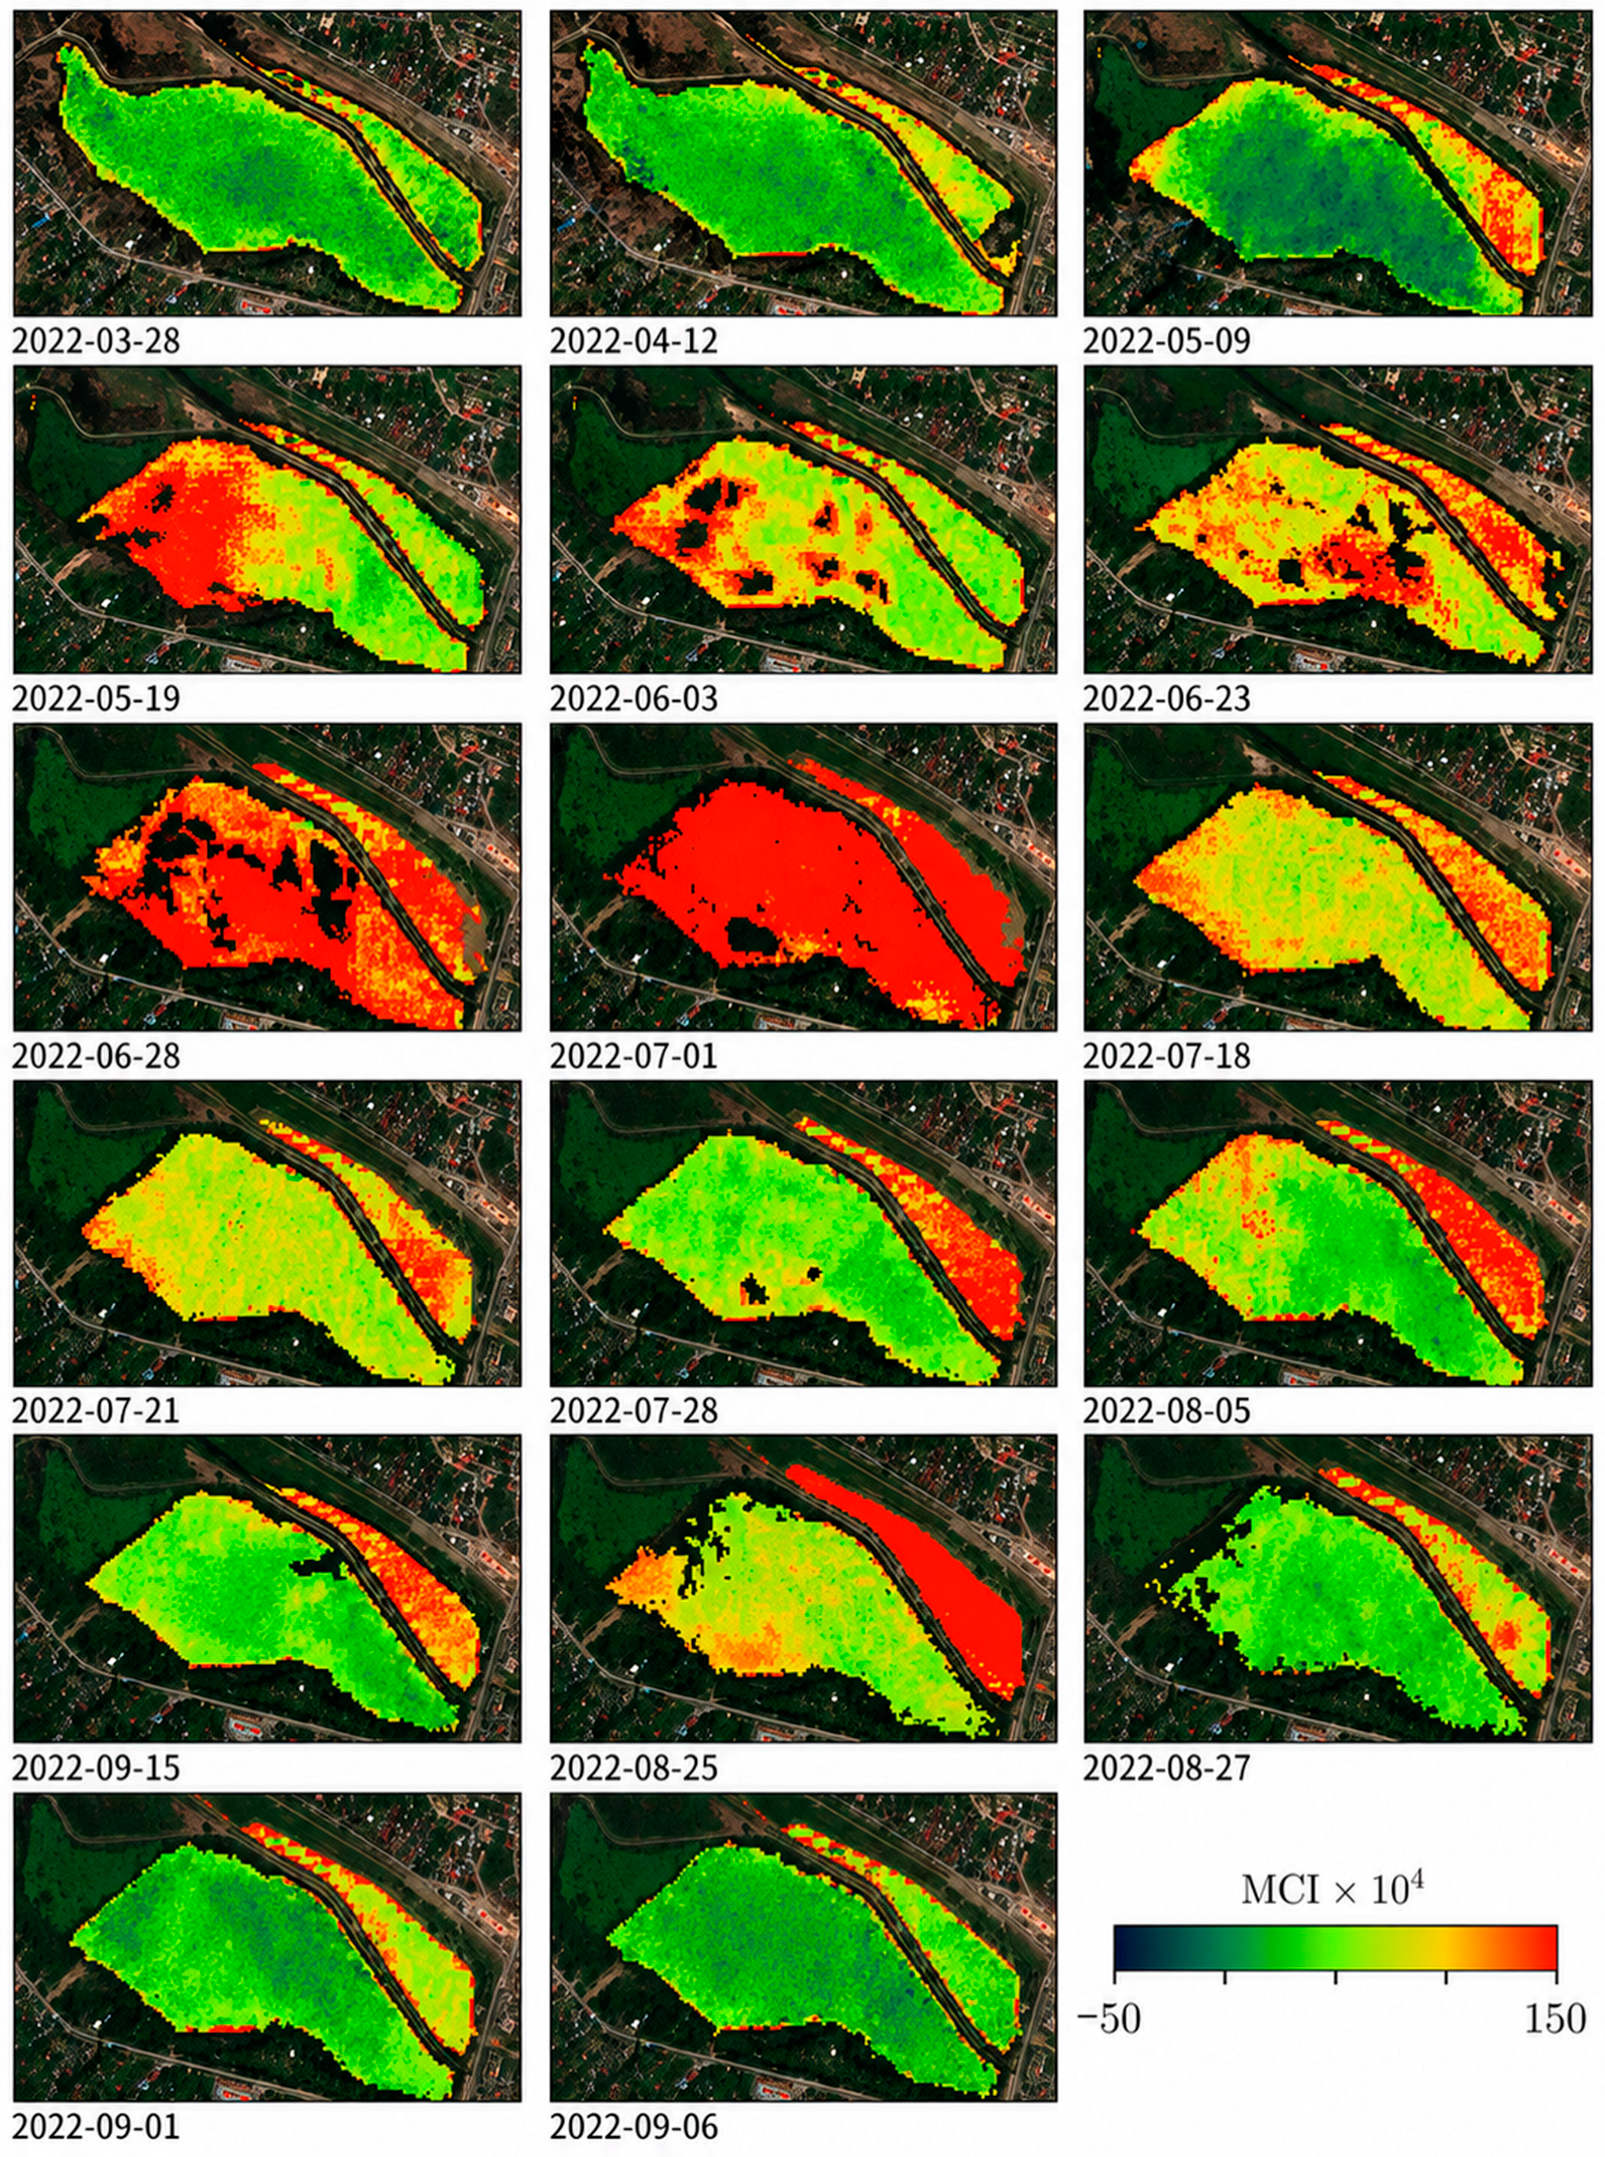
The Sentinel-2 sequence comprised 12 acquisitions from April to October 2021 and 17 acquisitions from March to September 2022 (
Figure 6 and
Figure 7). The same colour scale was used for all dates. The maps revealed clear spatial differences between the narrow flow through basin aligned with the Kamienna River and the wider retention basin.
In April and early May 2021, most valid pixels within the reservoir interior showed low-to-moderate MCI values. The area retained by the NDWI mask became much smaller on 12 May and 18 June, when dense aquatic vegetation limited the portion of the reservoir that could be treated as optically open water. Localised areas of elevated MCI appeared in the wider basin in August and early September. A broader increase was visible on several September and early October acquisitions, while the later October scenes generally showed lower-to-moderate values over much of the reservoir interior.
The 2022 sequence began with predominantly low-to-moderate MCI values in March and April. From the second half of May through early July, elevated values occupied a larger part of the wider basin. The strongest and most spatially extensive signals were visible on several acquisitions in late May, June, and 1 July. During the second half of July and in August, the central part of the wider basin generally shifted towards moderate or lower classes, although high values persisted in parts of the narrow basin and along selected shoreline sections. The acquisitions of 1 and 6 September were dominated by lower-to-moderate values across most of the valid reservoir interior.
Across both years, the narrow basin frequently displayed a persistent band of relatively high MCI along the channel and adjacent shoreline. The wider basin was more variable, with elevated areas changing in position and extent between acquisitions. Persistent high values close to the reservoir boundary were not interpreted as direct evidence of phytoplankton biomass because shallow water, floating or emergent vegetation, mixed pixels, and adjacency effects may contribute to the red-edge signal.
The MCI maps therefore provide comparative information on within reservoir spatial heterogeneity and its seasonal development. They do not represent chlorophyll a concentrations, and the varying area retained by the NDWI mask should not be interpreted as a quantitative measure of changing water-surface extent.
3.8. Historical Catchment Context from NDR Modelling
The NDR scenarios represent the CORINE Land Cover reference years 1990, 2000, 2006, 2012, and 2018. At the level of the broad categories reported in
Table 3, urban and built-up land increased from 12% in 1990 to 27% in 2012 and remained at 27% in 2018. Construction sites accounted for 2% in 1990 and were not reported in the later scenarios. Complex cultivation patterns decreased from 14% in 1990 and 2000 to 6% in 2006 and were not reported in 2012 or 2018. Land principally occupied by agriculture with significant areas of natural vegetation was reported only in 2006, when it accounted for 6%.
The reported shares of evergreen needleleaf forest, mixed forest, and water bodies remained at 39%, 30%, and 4%, respectively. These values are broad catchment wide proportions rounded to whole percentage points. They are not a pixel-level transition matrix and do not exclude local boundary shifts, changes within a category, or changes too small to alter the rounded share.
The reported land-cover composition was the same in 2012 and 2018. Both dates were retained as separate official CLC reference years, but no land cover-driven difference between the corresponding NDR scenarios is inferred. In particular, the maps are not interpreted as evidence of a redistribution of phosphorus or nitrogen caused by land cover change between 2012 and 2018.
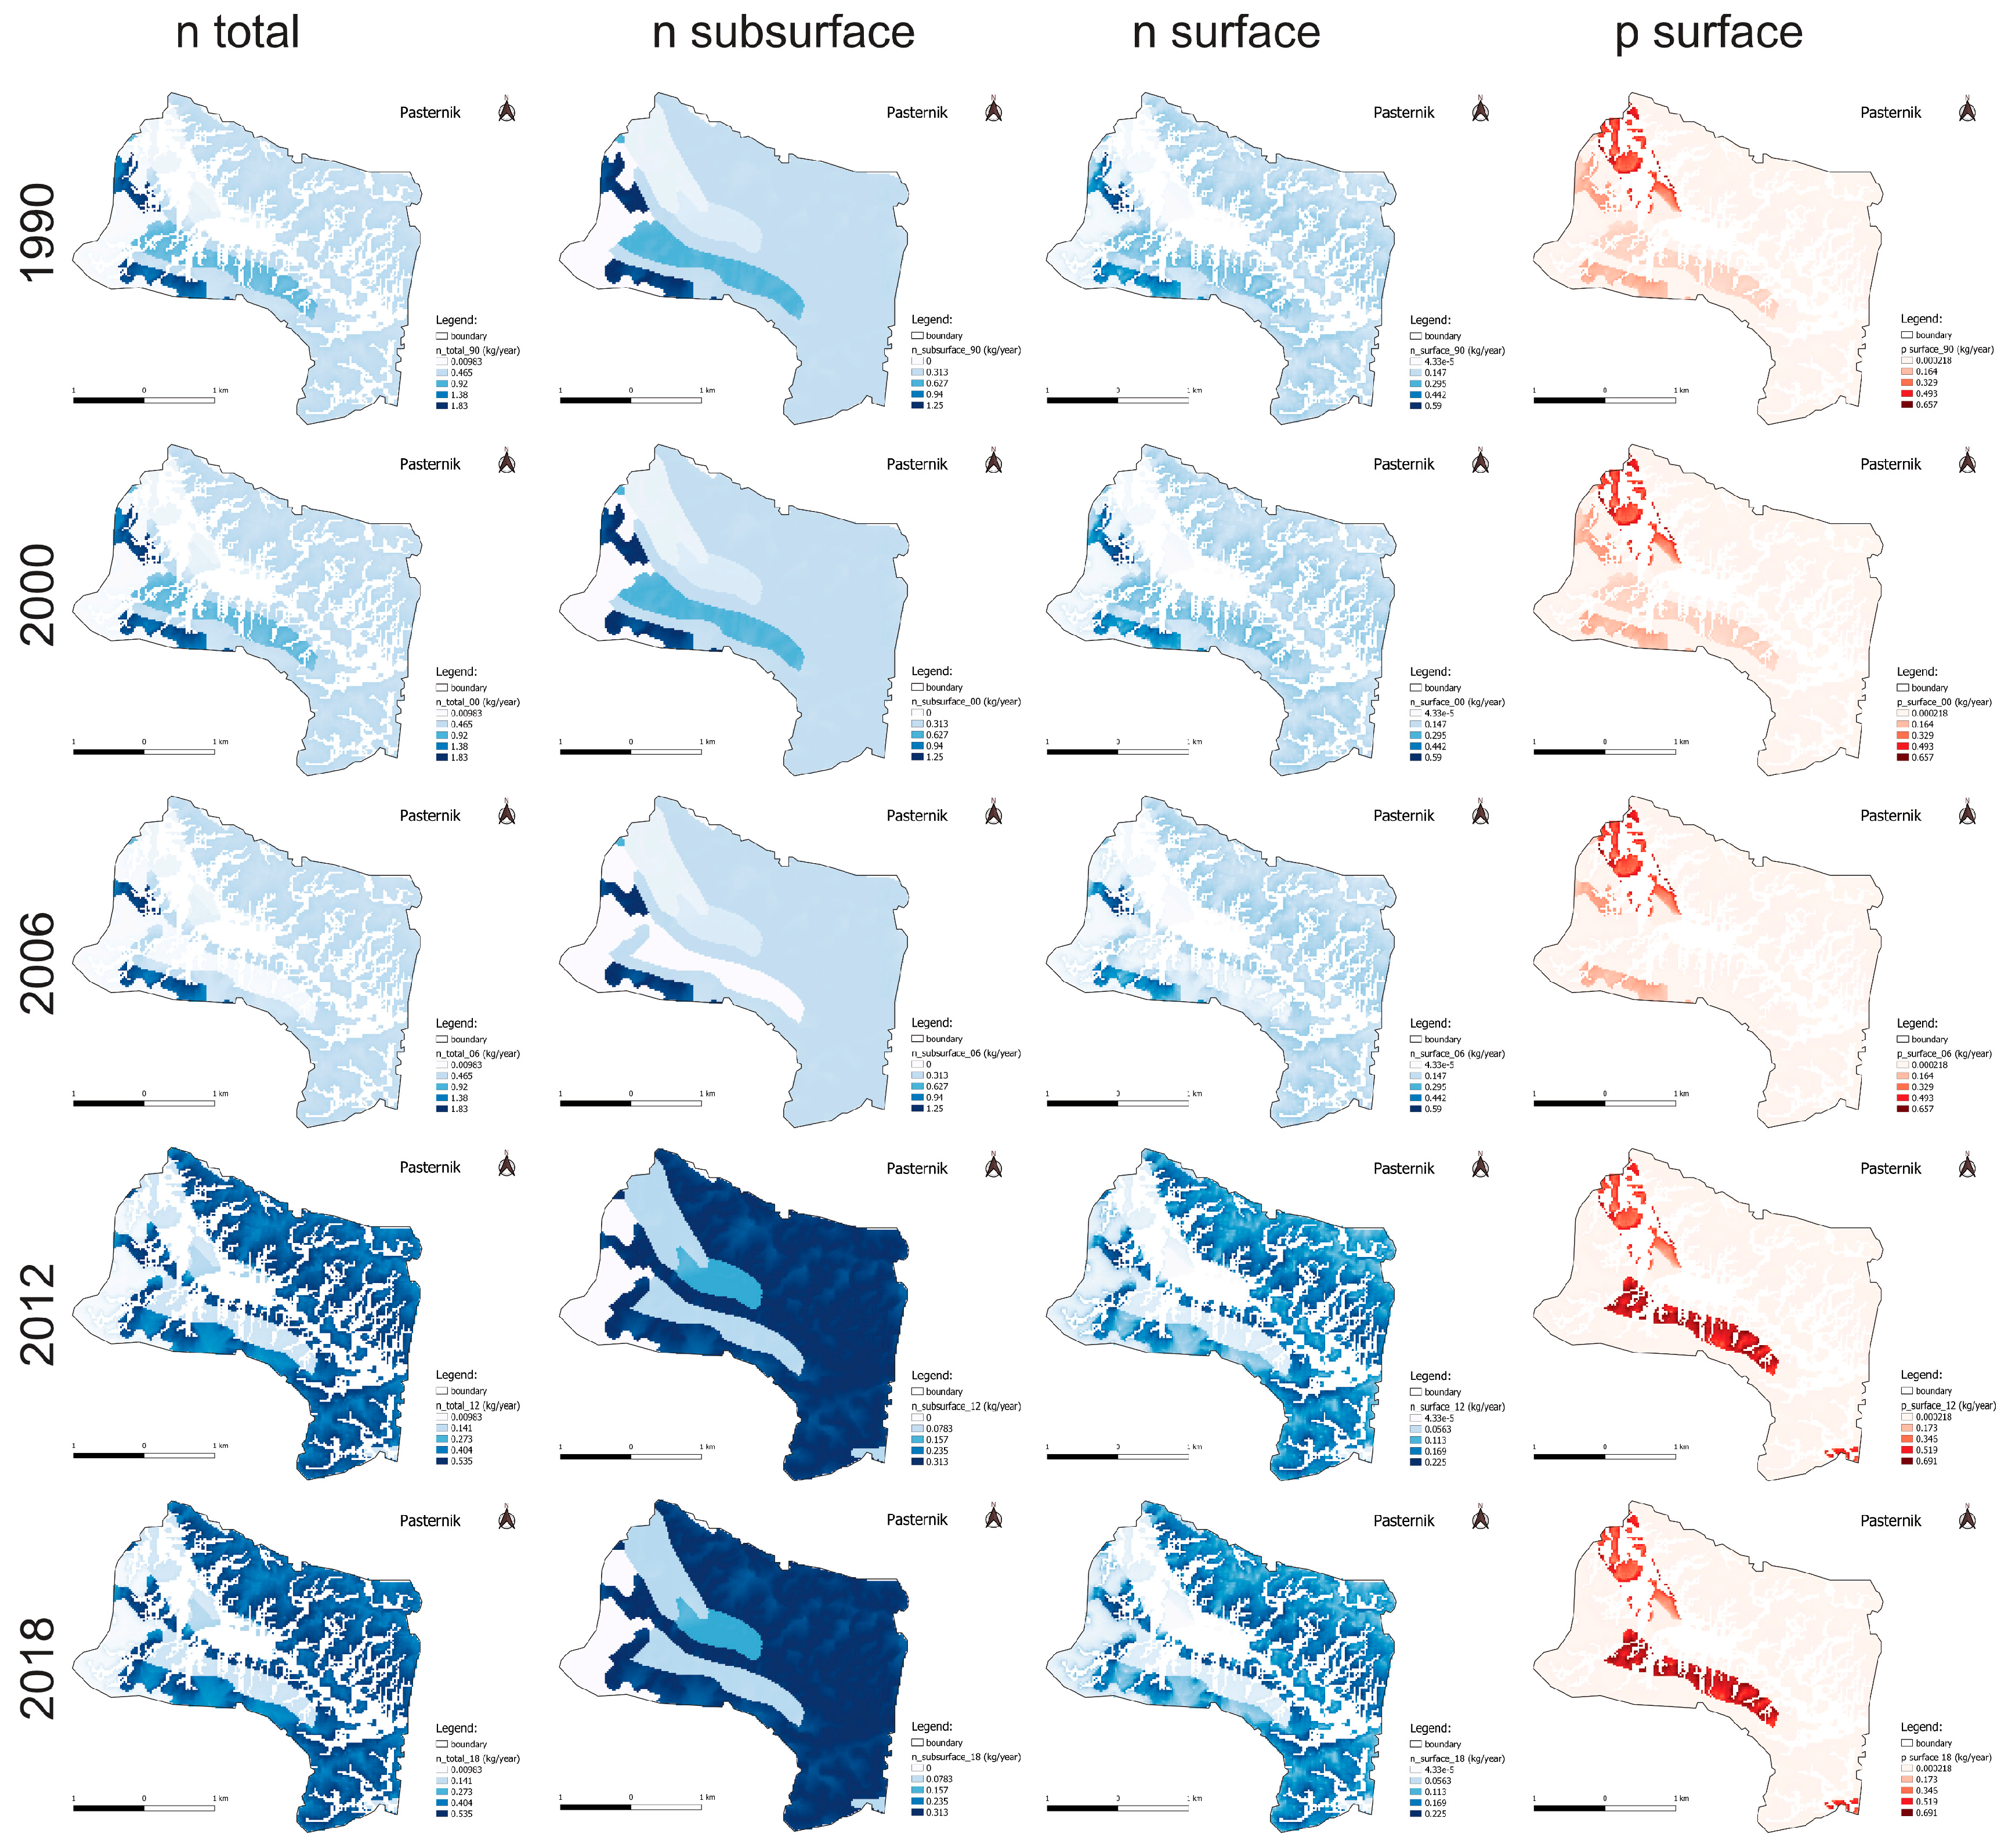
Figure 8 shows the spatial distribution of modelled phosphorus surface export and nitrogen surface, subsurface, and total export. Surface phosphorus was concentrated in relatively localised parts of the catchment, whereas surface nitrogen was more diffuse. Subsurface nitrogen formed broader spatial zones, and the total nitrogen output combined the surface and subsurface components into a more integrated pattern.
The NDR outputs represent modelled nutrient export or delivery per grid cell, not measured nutrient concentrations in reservoir water. The series ends in 2018 and is used only as historical catchment context. It does not describe the actual nutrient-loading conditions during the 2021–2022 management programme and is not treated as a direct temporal continuation of the Sentinel-2 MCI sequence.
4. Discussion
4.1. Sediment Response and Water Column Changes
The clearest response recorded during the monitoring programme was the reduction in SOF thickness, accompanied by an increase in sediment dry mass and a decrease in dry organic matter. Similar changes have been reported in studies of microbiological treatment in degraded reservoirs [
3,
7,
9,
16,
18,
19]. In the Pasternik Reservoir, the 78% decrease was observed across a 47-point grid rather than at a single location, which strengthens the evidence that the upper sediment layer changed at the scale of the reservoir.
The mechanism responsible for this change cannot, however, be identified from the present design alone. The study concerns one reservoir and does not include an untreated reference site. Natural consolidation, spatial redistribution of fine material, seasonal differences in deposition, river flow, and the management activities themselves may all have contributed to the observed pattern. The statistically significant differences between campaigns demonstrate that the measured distributions changed, but they do not isolate the effect of the biopreparation from other environmental controls.
The sediment nitrogen and phosphorus series also show why the physical reduction in SOF should not be equated directly with a uniform decline in nutrient content [
41]. Organic matter decomposition may temporarily mobilise nutrients before they are retained in sediment, taken up by biota, transported downstream, or returned to the water column [
8,
42,
43]. The temporary changes in sediment P and the later increase in sediment N are therefore consistent with a dynamic system rather than a simple one-directional purification process.
Several water-quality variables changed in a favourable direction, but their temporal courses were not identical. Near-bottom and surface dissolved oxygen increased, whereas BOD5 remained comparatively stable and the decline in COD was not statistically significant. Dissolved oxygen in shallow reservoirs is influenced by temperature, mixing, primary production, and the rate of organic matter decomposition [
44,
45,
46]. The lower water temperature during one of the campaigns probably contributed to the higher oxygen concentrations. The oxygen record is therefore compatible with improved conditions during the monitoring period, but it does not provide an independent estimate of the treatment effect.
The transparency, turbidity, and chlorophyll a results show a similar need for cautious interpretation. Transparency increased and chlorophyll a was lower during several later campaigns, while turbidity remained variable. River discharge, suspended mineral matter, phytoplankton, macrophyte cutting, and changing water level can all alter the optical condition of a shallow flow through reservoir [
47,
48,
49]. At least two short-lived bloom events were observed, despite lower chlorophyll a during several campaigns. This is consistent with the episodic character of bloom development in eutrophic systems, where favourable conditions may arise rapidly and may not be represented fully by periodic field sampling [
10,
50,
51,
52,
53].
Water column total nitrogen and total phosphorus remained comparatively stable and most differences were not statistically significant. This does not demonstrate that nutrient cycling was unchanged. Bulk concentrations measured at seven stations integrate external inflow, biological uptake, settling, mineralisation, and downstream export. The absence of a sustained increase in water column nutrients during periods of changing sediment composition may reflect several concurrent processes, but the present data do not allow their individual contributions to be quantified.
4.2. Macrophytes as an Ecological Component and a Management Constraint
Macrophytes played a dual role in the Pasternik Reservoir. Aquatic vegetation can assimilate nutrients, stabilise bottom sediments, provide habitat, and compete with phytoplankton [
20,
21,
22,
23]. In a shallow reservoir, these functions may help maintain local clear-water conditions. At the same time, excessive vegetation restricts open water use, interferes with recreation, complicates monitoring, and may return nutrients to the water during senescence and decomposition [
50,
54,
55,
56].
The rapid regrowth recorded after cutting demonstrates that the reservoir remained highly productive. Repeated harvesting increased the operational burden and cost, while the field data did not show an immediate and uniform water quality response to each cutting event. This is not unexpected. Mechanical removal changes habitat structure and may temporarily resuspend fine material, whereas the removal of nutrients depends on the amount, composition, and disposal of harvested biomass. These quantities were not measured in the present study.
A late-season harvest may be considered in future management planning because it could remove biomass before winter decomposition, but the present study did not compare alternative mowing schedules. It should therefore be treated as a management hypothesis rather than as a demonstrated cost-saving measure. The separate effect of floating plant islands and artificial ecotones was also not quantified, and no specific reservoir-scale response can be attributed to these structures from the available observations.
4.3. Contribution and Limitations of Sentinel-2 Monitoring
The Sentinel-2 analysis added a spatial dimension that could not be obtained from seven field stations alone. Earth-observation data are particularly useful in heterogeneous inland waters because they provide repeated, synoptic coverage and can reveal gradients or localised features between field campaigns [
11,
12,
13,
14,
15]. In Pasternik, the MCI sequence showed that the narrow flow through basin and the wider retention basin often displayed different patterns and that areas of elevated red-edge signal changed position between acquisitions.
The temporal sequence also illustrates the influence of macrophytes on satellite-based monitoring. Dense vegetation reduced the area retained by the NDWI mask during parts of 2021, whereas a larger proportion of the reservoir could be viewed as optically open water after vegetation removal. This improved spatial coverage does not by itself demonstrate an increase in true water surface area, because the result depends on the fixed threshold and on the spectral response of shallow water and vegetation.
MCI was originally developed to identify strong red-edge signals associated with high chlorophyll and surface bloom conditions [
38,
39]. Its use in small, optically complex inland waters requires caution. Floating and emergent vegetation, shallow-bottom reflectance, turbidity, mixed shoreline pixels, adjacency effects, and uncertainty in atmospheric correction can all alter the red and red-edge bands [
14,
15,
38,
39,
40]. For this reason, the persistent high values close to the reservoir margin were not interpreted as quantitative evidence of phytoplankton biomass.
The fixed NDWI threshold of 0.0 was applied consistently to all images, but no formal sensitivity analysis was performed. Accordingly, the mask was used to support qualitative interpretation within the reservoir interior, not to calculate exact shoreline position or changes in open-water area. Similarly, no empirical conversion from MCI to chlorophyll a was derived. The field programme was not designed as a satellite calibration campaign and did not provide a sufficient set of independent, quality-controlled spatial and temporal matchups. A simple correlation based on the seven stations could therefore be misleading if treated as validation. In this study, field chlorophyll a and MCI are complementary observations at different spatial and temporal scales.
The practical value of the satellite record lies in identifying when and where additional field inspection may be needed. The broad increase in MCI during late spring and early summer 2022, followed by lower values over much of the wider basin later in the season, provides information on spatial development that point sampling alone cannot reconstruct. Future monitoring should coordinate field sampling with Sentinel-2 overpasses and include explicit quality control for shoreline and macrophyte contamination.
4.4. Interpretation of the Historical NDR Scenarios
The NDR analysis addresses the catchment scale and should be interpreted separately from the reservoir-scale MCI maps. NDR estimates potential nutrient export and delivery from land-cover and terrain inputs under model assumptions; it does not reproduce measured nutrient concentrations in the receiving water [
27,
28,
30,
31,
32,
33,
34,
35]. The maps are useful for locating parts of the catchment that may contribute disproportionately to nutrient delivery, but they are sensitive to the classification and parameterisation of the input data.
Table 3 presents broad reclassified categories rounded to whole percentage points. It is therefore suitable for describing general catchment composition but not for identifying small local transitions. The unchanged reported shares of forest and water categories should be understood at this level of aggregation. Most importantly, the 2012 and 2018 scenarios have the same reported land cover composition. The NDR results cannot therefore support a land-cover-driven interpretation of change between these two dates, and the former statement concerning a significant redistribution of phosphorus has been removed.
The final CLC scenario predates the 2021–2022 management programme.
Figure 8 is retained to provide historical catchment context rather than a contemporaneous estimate of nutrient loading. Adding a later scenario from a different land cover product would reduce comparability with the internally consistent CLC sequence and would still not make NDR directly comparable with MCI, because the two products describe different variables, spatial domains, and time periods.
4.5. Integrated Assessment, Study Limitations, and Management Implications
The principal contribution of the study is the integration of sediment surveys, water-quality measurements, observations of vegetation management, Sentinel-2 imagery, and catchment modelling within an operational restoration programme. The field measurements documented temporal change at fixed locations, the satellite data revealed within-reservoir heterogeneity, and NDR placed the reservoir within a broader historical catchment setting. Used together, these components provide a more complete monitoring framework than any single source of information [
57].
The study also has clear limitations. It is a before and after case study of one reservoir without an untreated reference site. The number of water and sediment stations was limited, some environmental variables were strongly seasonal, and the satellite and field observations were not collected as a dedicated validation dataset. The NDWI threshold was not tested for sensitivity, and the NDR sequence ends before the intervention period. These limitations restrict causal attribution and quantitative comparison among the monitoring components.
The observed changes are nevertheless relevant for adaptive management. The decline in SOF thickness and the improvement in oxygen conditions identify variables that merit continued monitoring. Rapid macrophyte regrowth shows that vegetation management must be planned as a recurring operation rather than a one-time intervention. Sentinel-2 can help direct field teams towards spatially variable areas, provided that nearshore and vegetation affected pixels are treated cautiously. Catchment management remains important because long term restoration cannot rely solely on in-reservoir measures where external nutrient inputs persist [
25,
52,
53,
58].
Future studies should combine longer pre-intervention and post-intervention records with an untreated reference reservoir or comparable river reach. Field sampling should be scheduled close to satellite overpasses, and the water mask should be evaluated against alternative thresholds or independent shoreline information. Quantifying harvested biomass and its nutrient content would also allow the effect of macrophyte removal to be assessed more directly. Such additions would improve causal inference without changing the practical value of the integrated monitoring approach demonstrated here.
5. Conclusions
This study assessed environmental changes observed during an integrated programme of microbiological bioremediation and macrophyte management in a small eutrophic flow-through reservoir. During the monitoring period, the mean thickness of soft organic fractions decreased, sediment dry matter increased, and several water quality variables showed favourable temporal changes. Rapid macrophyte regrowth also demonstrated the practical difficulty and cost of repeated vegetation management.
Sentinel-2 MCI maps provided useful information on spatial and seasonal variation within the reservoir, but they were interpreted as relative optical indicators rather than as quantitative chlorophyll a estimates. The NDR scenarios provided historical catchment context and did not represent nutrient loading during the 2021 and 2022 management programme.
Because the study involved one reservoir and did not include an untreated reference site, the observed changes cannot be attributed exclusively to the management actions. The principal contribution of the work is a practical monitoring framework that combines sediment surveys, water quality measurements, satellite imagery, and catchment information. Longer monitoring, a controlled comparative design, and field sampling coordinated with satellite acquisitions are needed to determine the persistence, causes, and transferability of the observed responses.




 ,
,