Article

Differences in Public Space Perception and Satisfaction Between Residents and Tourists in Fenghuang Historic Town, Southern Shaanxi, China

College of Landscape Architecture and Arts, Northwest A&F University, Xianyang 712100, China
*
Author to whom correspondence should be addressed.
Sustainability 2026, 18(15), 7919; https://doi.org/10.3390/su18157919
Submission received: 5 June 2026 / Revised: 28 July 2026 / Accepted: 1 August 2026 / Published: 4 August 2026
(This article belongs to the Special Issue Sustainable Heritage Tourism)

Abstract

Understanding residents’ and tourists’ public space perceptions and satisfaction was essential for the sustainable planning and tourism development of historic towns. However, limited attention has been paid to the different perceptions between the two groups, as well as the nonlinear relationship between public space perception and satisfaction. Taking Fenghuang Ancient Town as the study area, this study used independent sample t-tests to examine the differences between residents and tourists. The XGBoost-SHAP model was further applied to identify key influencing factors and nonlinear interaction mechanisms affecting satisfaction. The results showed that: (1) residents perceived higher public awareness, space openness, and accessibility, whereas tourists reported higher crowd density and business prosperity; (2) color harmony most strongly influenced residents’ satisfaction, while spatial comfort had the strongest influence on tourists’ satisfaction; (3) color harmony and spatial comfort positively affected satisfaction, whereas space openness (residents) and crowd density (tourists) showed U-shaped relationships; and (4) for residents, the strongest interaction was between color harmony and business prosperity (0.015), while for tourists it was between spatial comfort and color harmony (0.038). These findings provided evidence-based guidance for sustainable public space planning and cultural heritage tourism management, contributing to inclusive governance and the long-term sustainability of historic towns.

1. Introduction

Historic towns, as cultural heritage integrating both tangible and intangible elements, embody significant historical, cultural, social, and economic values [1]. They are regarded as “living fossils” of Chinese rural cultural and natural heritages [2]. The public spaces are communal areas shared by all people and distinguished from private courtyards [3]. They are physical settings for daily activities, playing a vital role in maintaining community cohesion, preserving local culture, and sustaining social networks [4]. The quality of public spaces is closely associated with key social functions, including meeting needs, facilitating social interaction, and enhancing community identity [5]. Under the pressures of modernization and commercialization, public spaces in historic towns have experienced serious morphological degradation and functional decline, gradually losing their original cultural significance and social functions [6]. These challenges are commonly manifested in insufficient humanistic care, homogenized spatial forms [7], limited functional diversity, and a mismatch between spatial provision and users’ needs [8]. Therefore, there is an urgent need to improve public space quality to support the sustainable development of historic towns.
Satisfaction evaluation has been widely adopted in disciplines such as urban planning and human geography since the mid-20th century [9]. It reflects users’ comprehensive perceptions of spatial environments in terms of their functional, cultural, and psychological dimensions, as well as their attitudes toward public space quality [10]. Therefore, evaluating public space satisfaction provides an effective approach for understanding users’ attitudes and offers suggestions for historic town planning. Existing studies have focused on urban contexts and have demonstrated that public space satisfaction is influenced by various factors such as culture, society, environment, and functionality. In comparison, the papers on historic towns were relatively limited [11]. For example, Shen et al. (2025) discussed the effects of landscape characteristics on visual landscape quality across four dimensions—natural, cultural, agricultural, and living landscapes [12]. Shi et al. (2025) took urban parks as a case study to explore the relationships between harmony, color richness, openness, and landscape quality [13]. Wang et al. (2025) examined the effects of public environmental quality on individuals’ satisfaction from the aspects of spatial accessibility, usability, and environmental comfort in old residential communities [14]. Wang et al. (2023) used the Suzhou historic districts as a case study to explore the influences of material space, historical culture and psychological perception on satisfaction of public space [15].
Residents and tourists constitute the major user groups of public spaces within historic towns. Due to differences between these two groups in spatial use purposes, behaviors, emotional experiences, and value orientations, their perceptions of and satisfaction with public spaces also vary to some extent [16]. Previous papers have always focused on residents or tourists separately, while the differences between these two groups have often been overlooked. For instance, Zhang Chao-Yu et al. (2025) assessed the residents’ satisfaction with public spaces in historic towns and analyzed the primary influencing factors [11]. Li et al. (2025) analyzed the complex relationship between the artistic sense of public space and residents’ satisfaction [17]. Therefore, it is necessary to move beyond the perspective of single-user-group studies and systematically examine the relationships between public space perception and satisfaction in historic towns. Comparative analysis between residents and tourists is further needed to reveal the differential effects of space perception factors on satisfaction among the two user groups.
Among the previous studies, the statistical methods, such as the Analytic Hierarchy Process (AHP) [18], Importance-Performance Analysis (IPA) [19], the Semantic Differential (SD) method [20], Principal Component Analysis (PCA) [21], Structural Equation Modeling (SEM) [22], as well as multiple linear regression [23] and logistic regression [24], were used to analyze the association between individual’s perception and satisfaction [17]. Although these approaches have been widely used, they exhibit inherent limitations when addressing complex scenarios involving the combined effects of multidimensional factors. Existing studies have confirmed that the relationships between individuals’ satisfaction and spatial perception exhibit complex nonlinear characteristics. The traditional linear models have limitations in capturing nonlinear patterns and multidimensional interactions among variables, and thus fail to fully reveal the underlying relationships. Therefore, there is an urgent need for more advanced methods. In recent years, machine learning models such as Gradient Boosted Decision Trees (GBDTs), ensemble learning algorithms (XGBoost), Random Forests (RFs), and Multi-Layer Perceptrons (MLPs), owing to their strong capability in handling high-dimensional and nonlinear data, have been increasingly applied in environmental perception, cultural heritage, and tourism research [25]. Among these methods, XGBoost, a tree-based ensemble model based on gradient boosting, demonstrates excellent fitting ability and predictive performance in handling nonlinear and complex interaction structures, and has been used to explore the complex relationships between landscape environmental characteristics and perception evaluations. For example, Zhu et al. (2025) applied the XGBoost-SHAP model to investigate the nonlinear effects of urban visual environments on residents’ psychological perceptions [26]. Overall, existing studies on the influence mechanisms of space perception on satisfaction have mainly relied on traditional linear models. Meanwhile, applications of machine learning methods in landscape perception studies have primarily focused on urban environments, and their use in historic town public spaces remains relatively limited [27]. Therefore, introducing interpretable machine learning methods (e.g., XGBoost-SHAP) is of great significance for revealing the complex mechanisms underlying the effects of public space perception factors on satisfaction in historic towns.
To address the gaps of insufficient comparative research between resident and tourist groups, lack of nonlinear interaction mechanism analysis, and rare application of XGBoost-SHAP in historic town public space research, this paper chose the Fenghuang Historic Town in Shaanxi Province as a case study, discussed the difference in public space satisfaction between residents and tourists, and used the XGBoost-SHAP model to explore the significant factors affecting individual’s satisfaction. The specific objectives are as follows:
(1)
To analyze the differences in public space perception and satisfaction between residents and tourists.
(2)
To examine the nonlinear relationship between public space perception factors and satisfaction and to identify the key factors.

2. Materials and Methods

2.1. Study Area

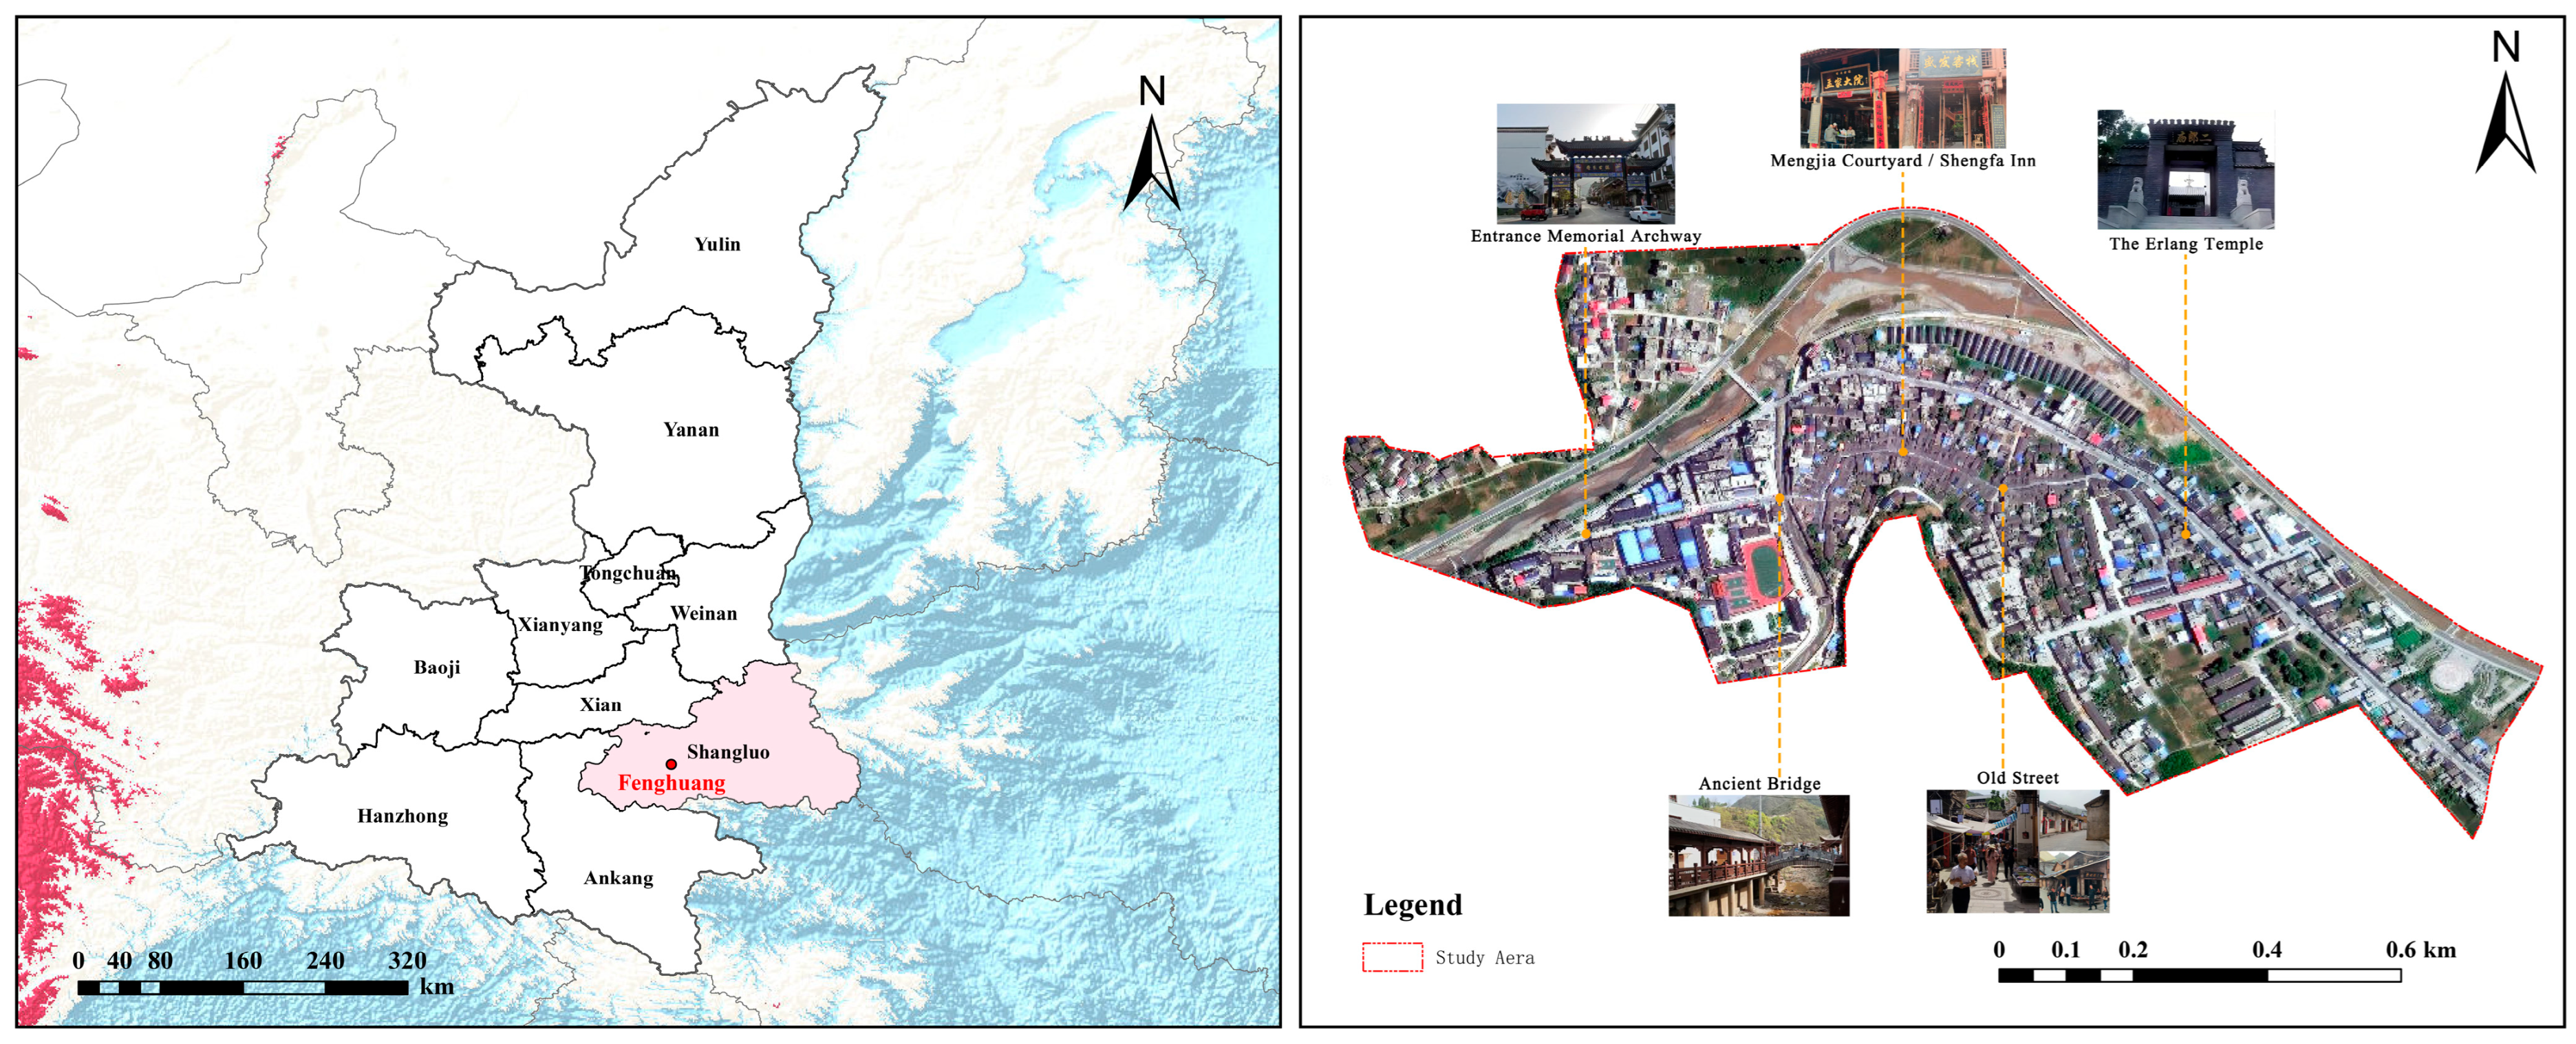
Fenghuang Historic Town is located at the southern foothills of the Qinling Mountains, in Shaanxi Province. The historic town was first established during the Tang Dynasty and flourished in the late Ming and early Qing Dynasties. With a history spanning 1400 years, it is an important representative of regional cultural heritage. This study focused on the core area (62.52 hectares) of the historic town (Figure 1). The area contains several valuable cultural heritage sites, such as the Erlang Temple, Mengjia Courtyard and Shengfa Inn. The architecture is predominantly Huizhou-style, featuring a mixed residential–commercial “front shop, rear dwelling” layout with narrow frontages and deep interiors, while elements such as courtyard drainage systems and firewalls reflect both aesthetic value and climatic adaptability. In addition to residential buildings, the town preserves characteristic spaces such as mule alleys, blacksmith workshops, wells, and an ancient bridge. It also remains rich in intangible cultural heritage, including Yugu, Han-tune Erhuang, and Shehuo, as well as traditional crafts such as papermaking, metalworking, and brewing.

2.2. Data Collection

This study employed a structured questionnaire survey to systematically collect respondents’ perceptions and satisfaction with public space in historic towns. The questionnaire consisted of three sections. The first section was the respondents’ basic demographic information, including gender, age, education level, occupation, and length of residence. The second section aimed to collect respondents’ perceptions of public space from five dimensions: cultural value, social identity, townscape harmony, environmental features, and functional features (Table 1). The selection of perception indicators was based on previous studies on public space perception and satisfaction evaluation. Specifically, indicators related to cultural value and social identity were mainly derived from Wang et al. (2023) [15]; indicators related to townscape harmony and environmental features were informed by Shi et al. (2025) [13] and Shen et al. (2025) [12]. Indicators related to functional features, such as business prosperity, were selected with reference to Gu et al. (2023) [19], while other indicators were comprehensively selected based on the studies of Song et al. (2023) [5], Qi et al. (2024) [8], and Wang et al. (2025) [14]. Based on these studies, the indicators were further screened and adjusted according to the spatial characteristics of Fenghuang Historic Town, including historical buildings, cultural landscapes, waterfront spaces, and community interactions. Through this process, a preliminary set of perception indicators was selected. A pre-survey was conducted in early April 2025, and the indicators were further optimized and revised based on the feedback, and 16 perception indicators were finally determined. The third section measured respondents’ overall satisfaction with public space. Both the second and third sections were measured using the five-point Likert scale (1 = Very low perception/very dissatisfied, 5 = Very high perception/very satisfied). This scale has been widely used in studies on space perception and satisfaction. In this study, it was applied to measure residents’ and tourists’ public space satisfaction and perception levels of various factors, ensuring consistency and comparability among different variables.
Data were collected in May 2025 in Fenghuang Historic Town, Zhashui County, Shangluo City, Shaanxi Province. Based on the functional characteristics and activity types of public spaces, the study area was divided into six strata: street spaces, architectural spaces, neighborhood interaction spaces, gateway spaces, recreational and leisure spaces/squares, and waterfront linear spaces. Representative public spaces with frequent daily activities of residents or tourist activities were selected from each stratum for questionnaire distribution to ensure adequate coverage of different spatial functions and user groups. Questionnaires for local residents were distributed through face-to-face surveys, while the tourists were administered online via WJX (a widely used platform for data collection, https://www.wjx.cn/ accessed on 28 July 2026). In terms of gender distribution, both samples showed a slightly higher proportion of females than males, with an overall balanced distribution. The proportions of female respondents among residents and tourists were 57.4% and 56.5%, respectively. Regarding age structure, the resident sample covered a relatively wide range of age groups and was mainly composed of middle-aged and older respondents, with the 31–40 age group accounting for the largest proportion (21.5%). In contrast, the tourist sample was highly concentrated in the 18–30 age group (98%). In terms of educational background, tourists had a higher education level than residents, with residents mainly having a junior high school education (43.4%), while 92% of tourists reported an educational level of undergraduate or above. The resident sample was mainly composed of long-term residents, with 54.3% having lived in the area for more than 15 years. All surveys were conducted on a voluntary basis. Respondents were informed about the purpose of the study before providing their agreement to participate. Throughout the investigation, anonymity was ensured, and all survey data were handled in a confidential manner. A total of 374 questionnaires were distributed and collected, including 278 from residents and 96 from tourists.

2.3. Procedures

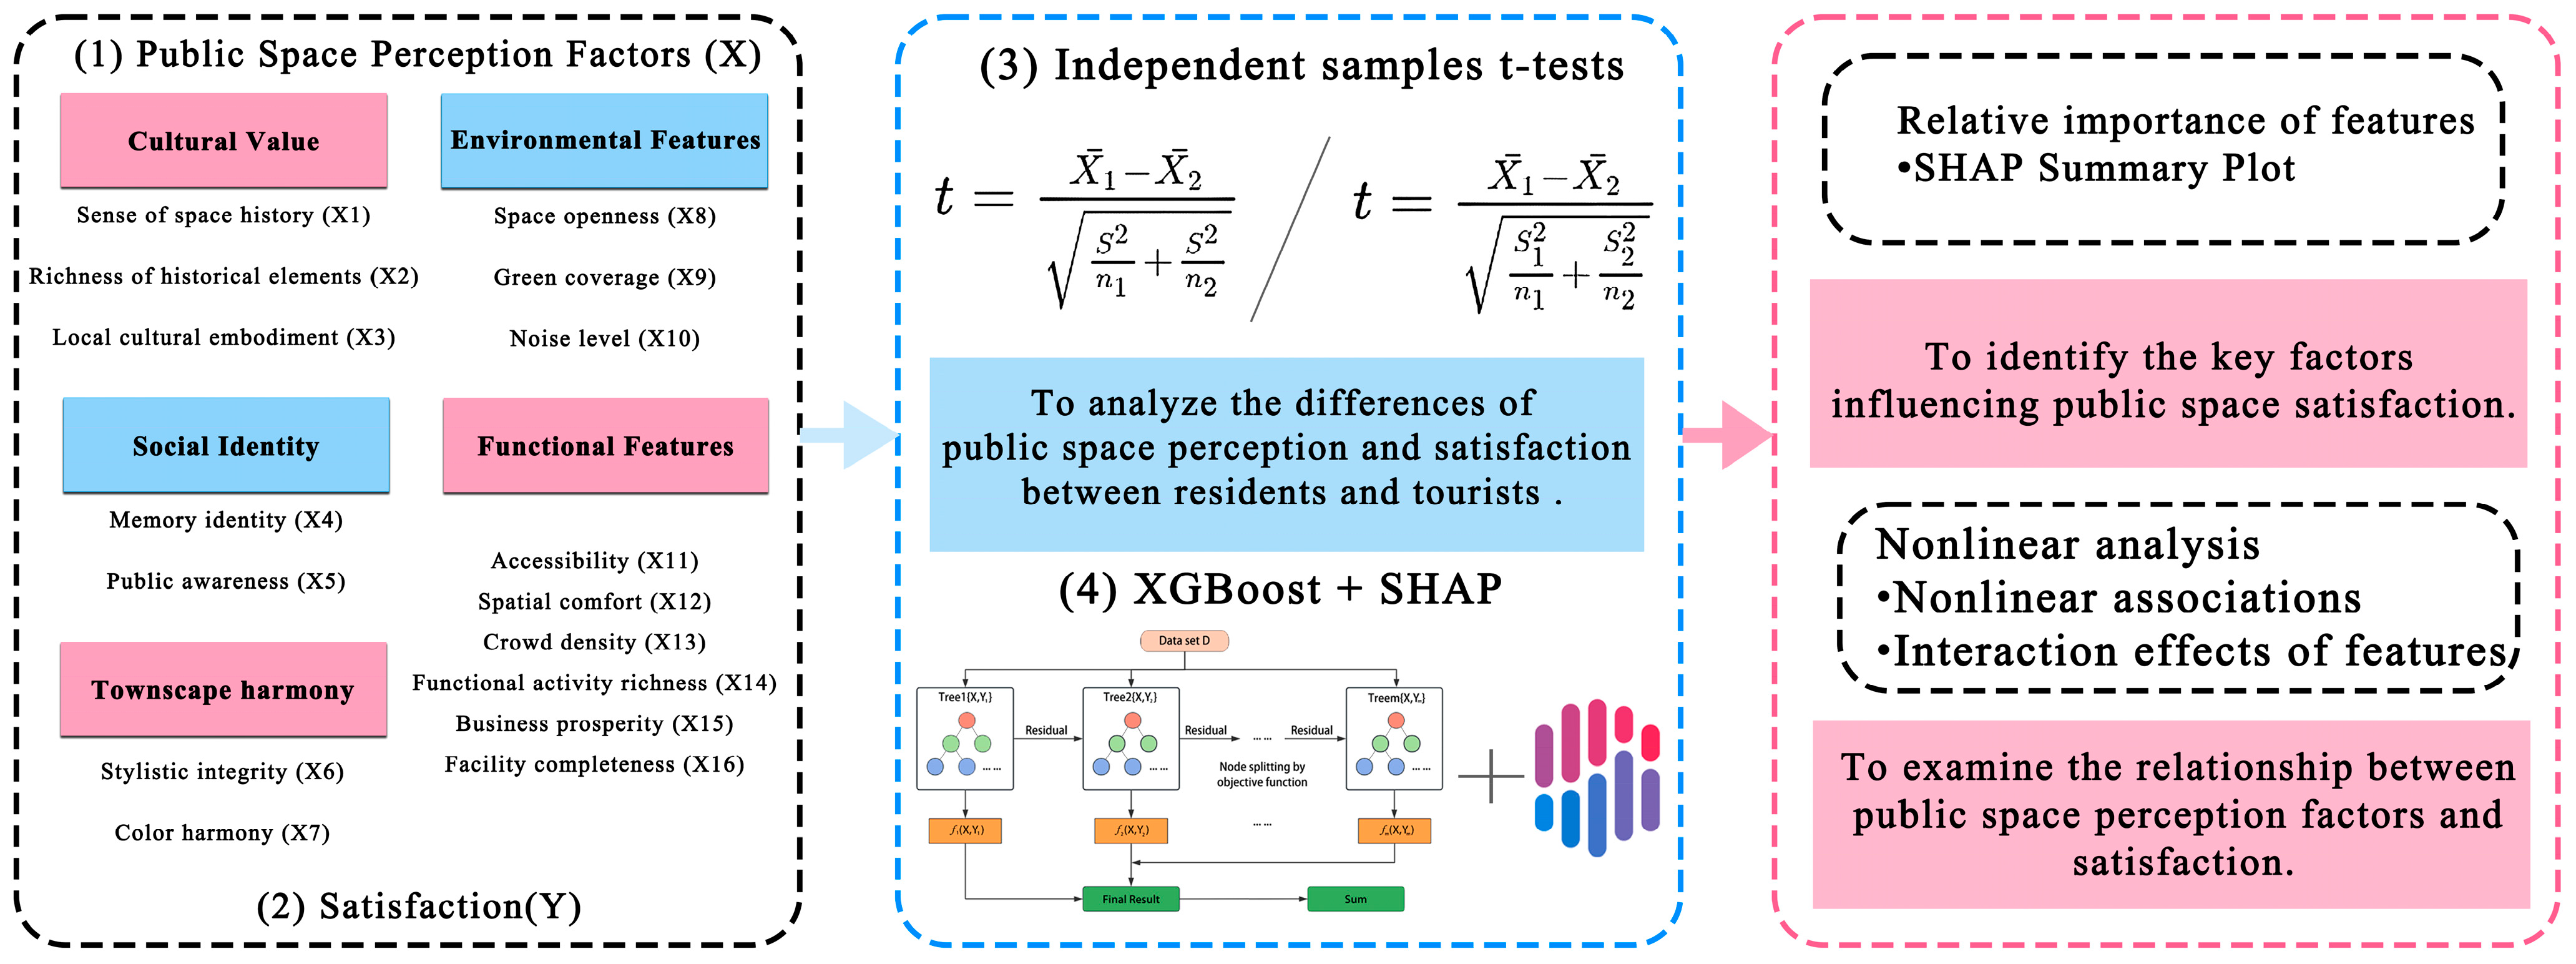
The overall research framework was presented in Figure 2. First, this paper used independent samples t-tests to explore the differences in public space perception and satisfaction between residents and tourists. A significance level below 0.05 showed that differences between the two groups were statistically significant. Second, the XGBoost-SHAP model was employed to explore how public space perception factors influenced residents’ and tourists’ satisfaction. Sixteen public space perception factors were selected as independent variables, and satisfaction was the dependent variable. The XGBoost regression model was applied for modeling and prediction. The objective function L ( F ) consists of the loss function and the regularization term, as shown in Equation (1):
L ( F ) = i = 1 n l ( y i , F ( x i ) ) + k = 1 K Ω ( f k ) ,
The loss function l ( y i , F ( x i ) ) measures the discrepancy between the predicted value F ( x i ) and the true value y i . The regularization term Ω ( f k ) is introduced to reduce model complexity and prevent overfitting [28].
Unlike conventional statistical models that rely on predefined functional forms, XGBoost and other machine learning algorithms do not have a universal sample size threshold. Previous studies have shown that the sample size requirements of machine learning models are jointly influenced by factors such as the number of features, model complexity, and the nonlinearity of predictor–response relationships, and that ensemble methods such as Random Forest (RF) and XGBoost (XGB) can still outperform traditional parametric methods under limited sample sizes when appropriate hyperparameter tuning is applied [29]. Therefore, this study employed five-fold cross-validation and Bayesian hyperparameter optimization to reduce overfitting risk and enhance model generalization ability. The sample data were randomly divided into training and testing sets at a ratio of 80% and 20%, respectively. Since separate XGBoost models were developed for residents and tourists, hyperparameter optimization was performed independently for each model (Table 2).
Furthermore, this study evaluated the model performance using the mean absolute error (MAE), root mean square error (RMSE), and coefficient of determination (R2). Lower MAE and RMSE values and a higher R2 indicated better predictive performance. The final XGBoost models demonstrated satisfactory predictive performance. For the residents’ model, the model achieved an R2 of 0.5750, an RMSE of 0.4966, and an MAE of 0.4070 on the testing set. For the tourists’ model, the model achieved an R2 of 0.6875, an RMSE of 0.3101, and an MAE of 0.2181 on the testing set.
Machine learning models are commonly regarded as “black-box” methods, with insufficient interpretability standing as one of their key limitations. To address this issue, this study adopted the SHapley Additive exPlanations (SHAP) method to enhance the interpretability and transparency of the XGBoost model [13]. Rooted in game theory, SHAP computes Shapley values by treating model predictions as the outcome of a cooperative game among all features. It evaluates the marginal contribution of each feature under different feature combinations to quantify its impact on the dependent variable. A positive SHAP value suggests a positive effect on public space satisfaction, whereas a negative value implies a negative effect [30]. This method enables both global feature importance assessment and interpretation at the individual observation level. Furthermore, this study visualized the SHAP values of the XGBoost model to interpret model outputs. The Shapley value is defined as follows (see Equation (2)):
φ i = S Ν \ { i } | S | ! ( | N | | S | 1 ) ! | N | ! ( f ( S { i } )     f ( S ) ) ,
N denotes the entire collection of features; and S represents an arbitrary subset that does not contain feature i ; | S | denotes the number of features in subset S ; f ( S ) quantifies the contribution of feature subset S to the model output, while f ( S { i } ) represents the contribution of the subset S { i } [28].
After calculating the global SHAP values of individual features, this study further introduced SHAP interaction values based on the Shapley interaction index to reveal the nonlinear interaction mechanisms among multiple variables. The SHAP interaction value was defined as follows (see Equation (3)):
φ i , j = S N { i , j } | S | ! ( | N | | S | 2 ) ! 2 ( | N | 1 ) ! ( f ( S { i , j } ) f ( S { i } ) f ( S { j } ) + f ( S ) ) ,
In this formula, i and j denote the two interacting feature variables; N denotes the complete set of features; S represents all possible subsets of features excluding i and j; | N | and | S | denote the numbers of features in the complete feature set and the subset, respectively; and f denotes the model output contribution under a given feature subset.

3. Results

After data screening, 357 valid questionnaires were retained (265 residents and 92 tourists), with effective response rates of 95.3% and 95.8%, respectively. The reliability and validity analyses were conducted using IBM SPSS Statistics 27.0 (IBM Corp., Armonk, NY, USA). The KMO values of residents and tourists were 0.861 and 0.803, both surpassing the recommended threshold.

3.1. The Perception and Satisfaction of Public Spaces Across the Two Groups

Independent samples t-tests were conducted using IBM SPSS Statistics 27.0 to examine the differences in perception and satisfaction regarding public spaces between residents and tourists. The results of the two-tailed t-tests showed that X5 (Public awareness), X8 (Space openness), X11 (Accessibility), X13 (Crowd density), and X15 (Business prosperity) exhibited statistically significant differences between residents and tourists (all p < 0.05). Specifically, residents scored significantly higher than tourists in terms of X5 (Public awareness), X8 (Space openness), and X11 (Accessibility), while tourists scored significantly higher on X13 (Crowd density) and X15 (Business prosperity). There was no significant difference in Y(satisfaction) between residents and tourists (p > 0.05). The average satisfaction score of residents (3.73) was slightly lower than that of tourists (3.79) (Table 3).

3.2. The Key Public Space Perceptions Affecting Individual’s Satisfaction

3.2.1. Ranking of the Importance of Influencing Factors

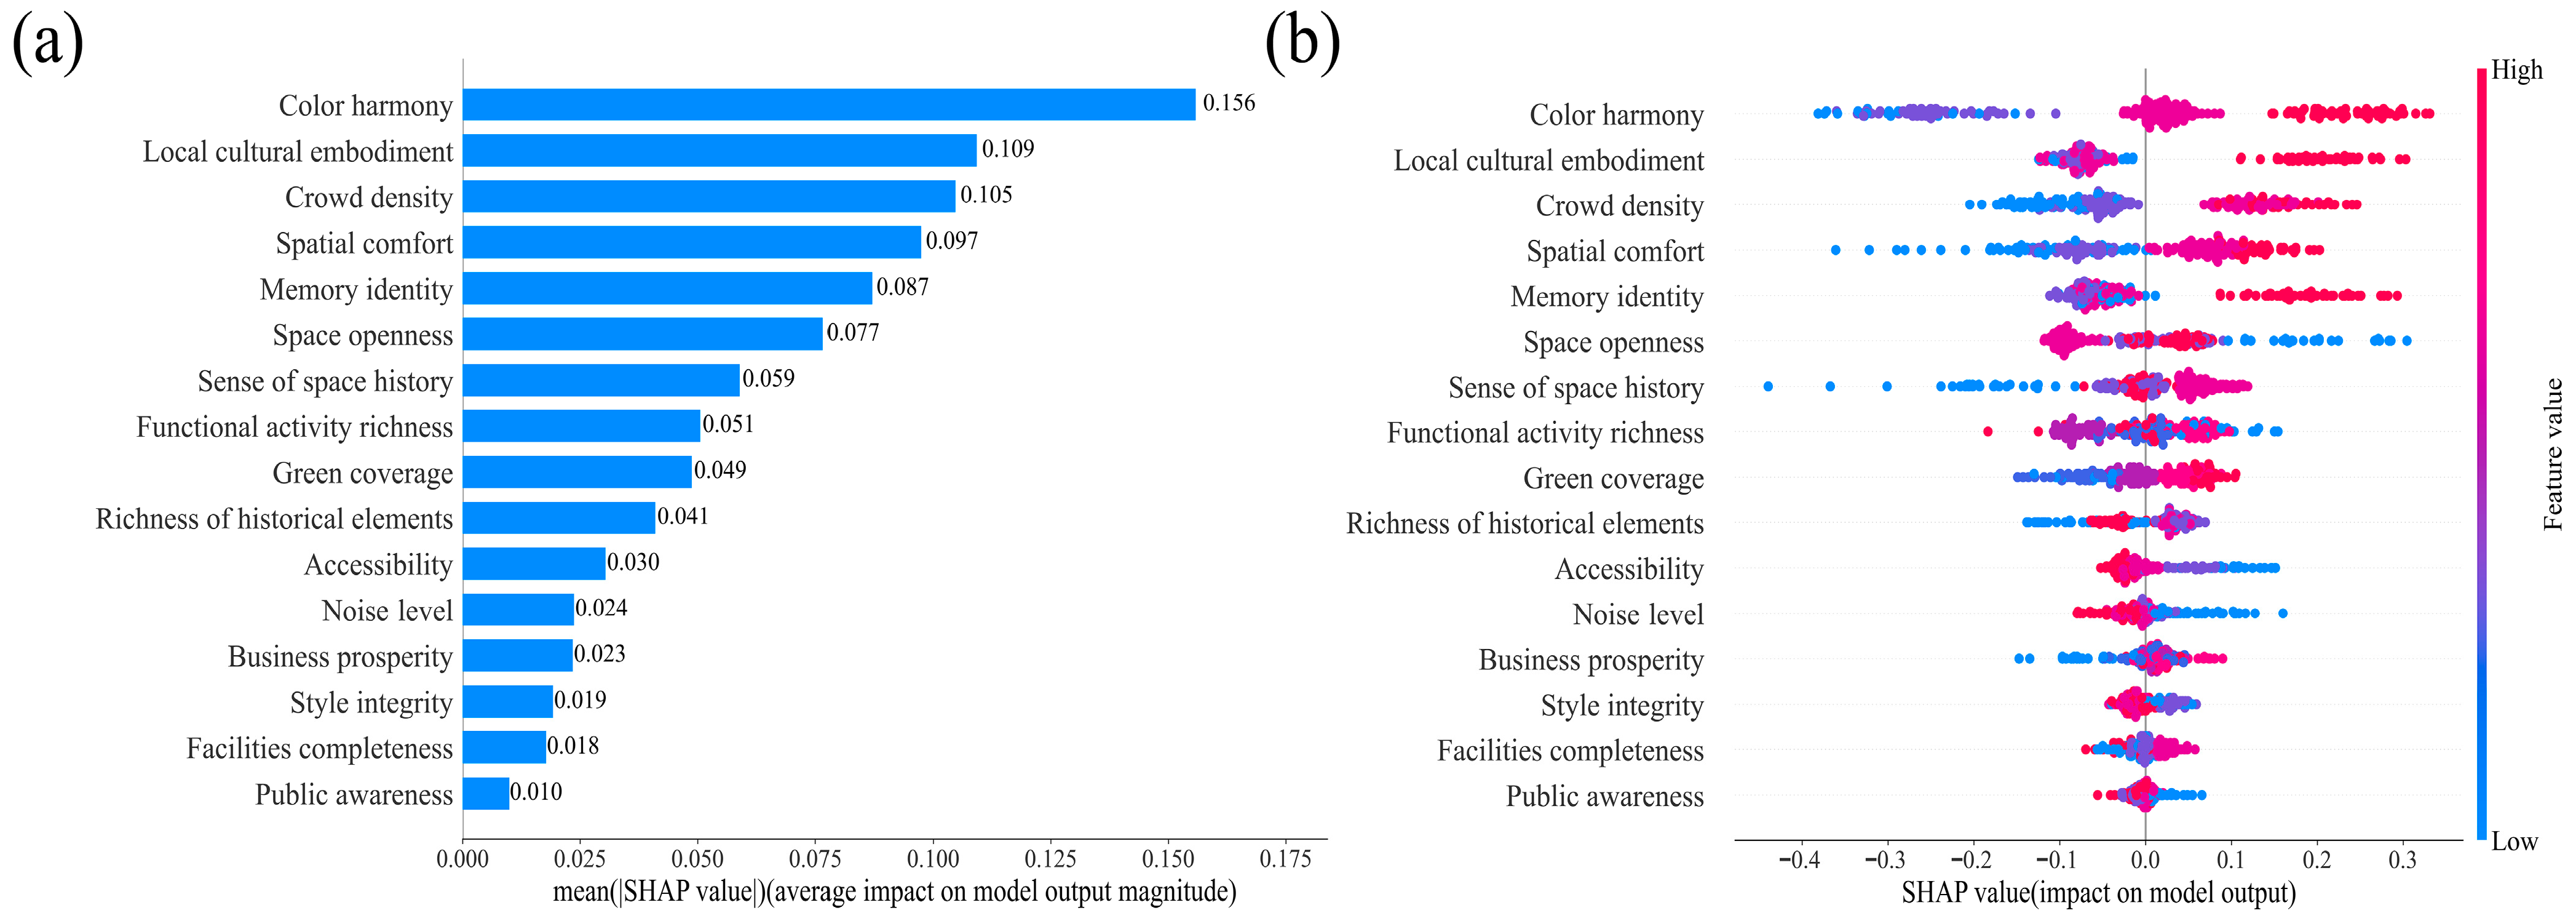
For residents, in the figure of SHAP feature importance ranking (Figure 3a), the horizontal axis represents the average absolute contribution of each variable to the model’s output. The vertical axis displays the variables ranked according to their importance. Figure 3a indicates that color harmony exhibits the highest relative contribution (>0.15), making it the most important factor influencing residents’ satisfaction. Local cultural embodiment and crowd density ranked second and third, respectively. The contribution values of spatial comfort, memory identity, space openness, sense of space history, and activity richness ranged from 0.05 to 0.1. The remaining variables had contribution values below 0.05, indicating limited influence on residents’ satisfaction. The SHAP beeswarm plot illustrates the distribution of SHAP values at the individual sample level. Feature names are displayed on the vertical axis, while each point represents a sample and the color indicates the value of each feature, ranging from low (blue) to high (red). The horizontal axis represents the SHAP value, which reflects the direction and degree of the feature’s influence on the model output. SHAP values above 0 indicate a positive contribution to the model output, whereas values below 0 indicate a negative contribution. Figure 3b revealed that higher levels of color harmony were associated with higher SHAP values, indicating a stronger positive effect on residents’ satisfaction. Local cultural embodiment, crowd density, and spatial comfort showed similar positive associations with satisfaction. As space openness increased, the SHAP values decreased and then increased, exhibiting a nonlinear characteristic. In contrast, higher noise level and accessibility were associated with lower SHAP values, indicating stronger negative effects on satisfaction and negative associations with satisfaction.
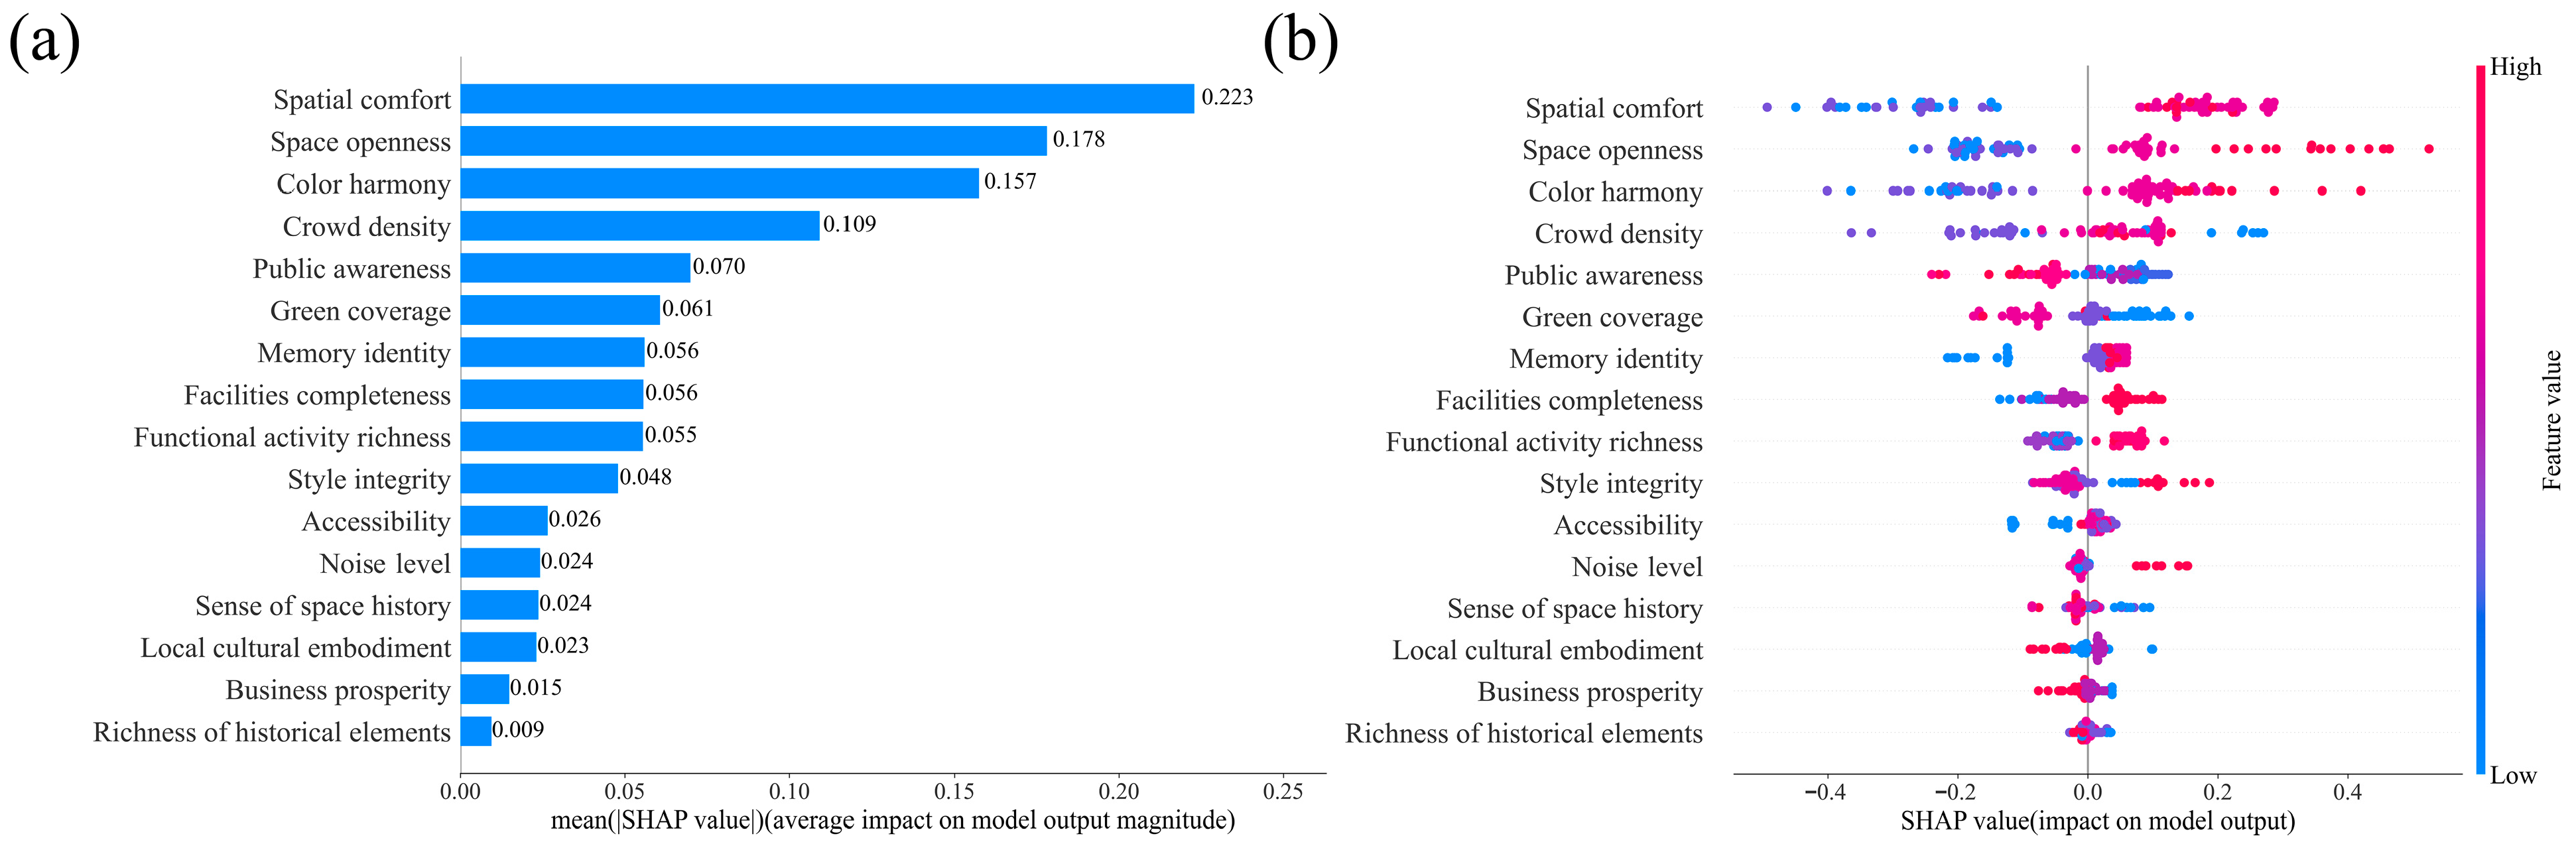
For tourists, Figure 4a showed that spatial comfort exhibited the highest average absolute SHAP value (0.223), making it the most important factor influencing tourists’ satisfaction. Space openness, color harmony, and crowd density represented the second most important group of features, with average absolute SHAP values exceeding 0.1. Public awareness, green coverage, memory identity, facility completeness, and activity richness were classified as moderate contributors, with average absolute SHAP values of 0.05–0.1. The remaining variables showed relatively weak contributions, with average absolute SHAP values below 0.05, indicating a limited contribution to the overall model prediction. Figure 4b showed that spatial comfort, space openness and color harmony showed positive correlations with tourists’ satisfaction. Higher feature values were associated with higher SHAP values. A relatively complex nonlinear relationship was observed between crowd density and satisfaction, with both low and high feature values concentrated within the positive SHAP range. In contrast, public awareness and green coverage showed negative correlations with satisfaction, with higher feature values being associated with lower SHAP values.

3.2.2. The Nonlinear Effects of Public Space Perception on Satisfaction

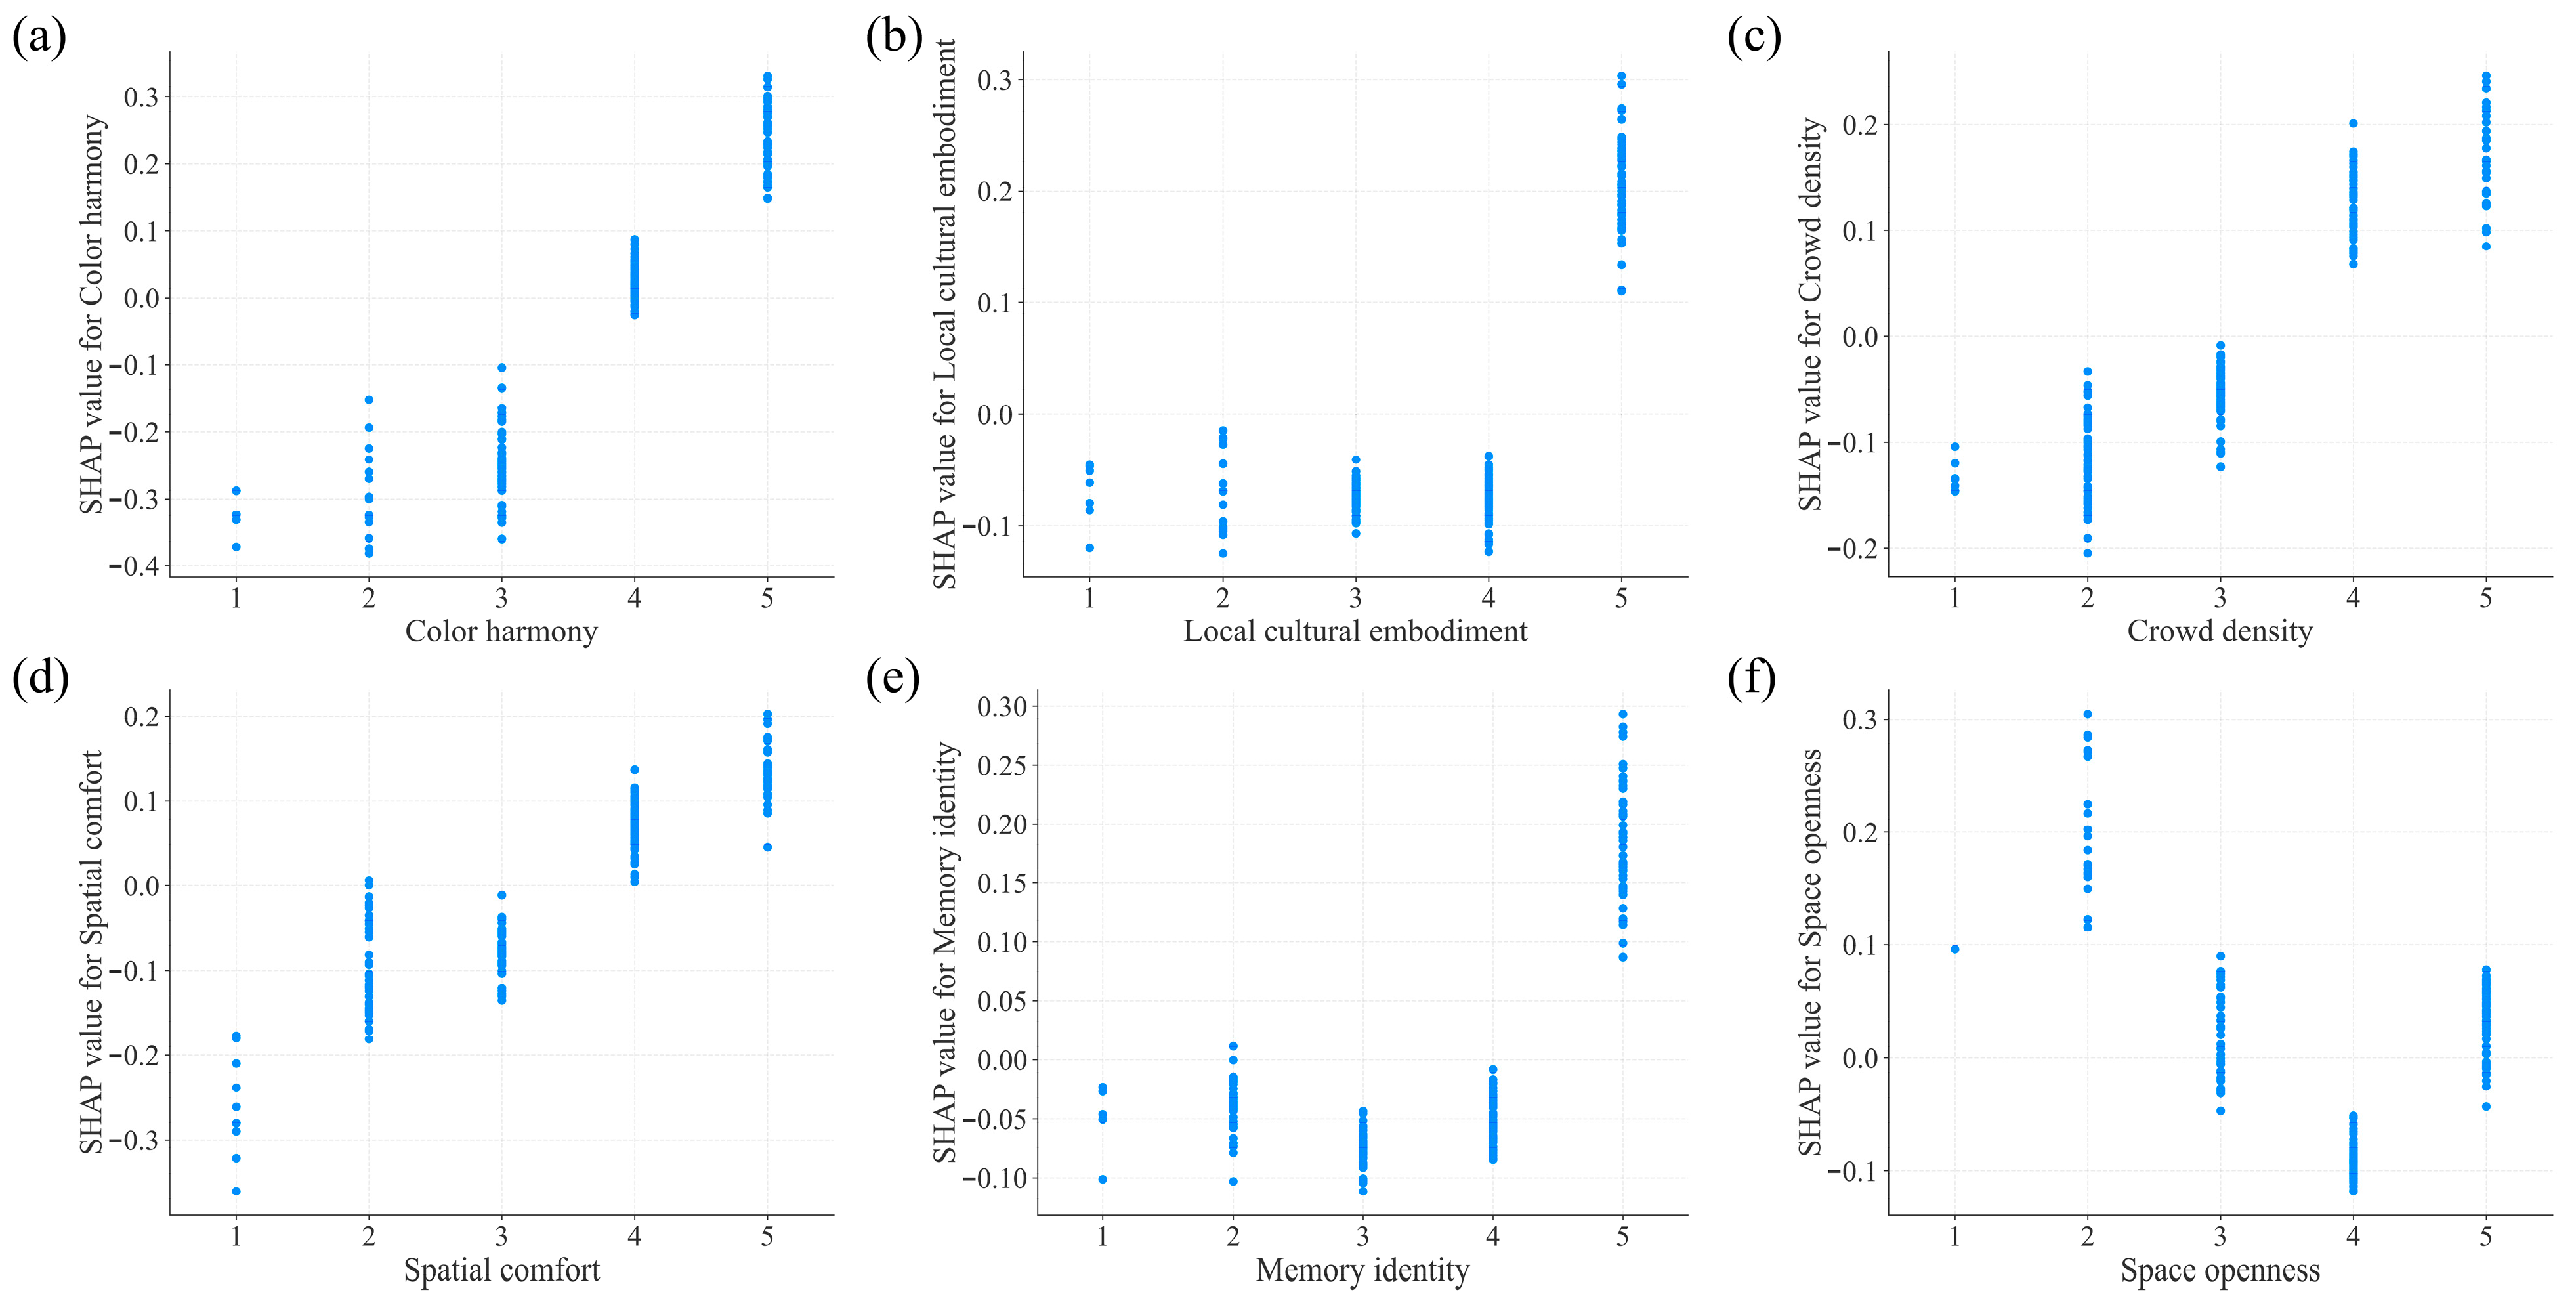
This paper selected the six most influential variables associated with residents’ satisfaction for further analysis, namely color harmony, crowd density, local cultural embodiment, memory identity, space openness, and spatial comfort. To further analyze the nonlinear relationship between individuals’ perceptions and satisfaction, we constructed SHAP dependence plots for analysis (Figure 5). The SHAP dependence plot was presented as a scatter diagram, with the horizontal axis representing the values of the target feature, and the vertical axis displaying the corresponding SHAP values.
For residents, when color harmony, crowd density, and spatial comfort were at low to moderate levels (1–3), their SHAP values were negative, indicating negative effects on satisfaction. Once these variables reached high levels (4–5), the SHAP values gradually became positive and continued to increase, suggesting a transition from negative to positive effects on satisfaction. Local cultural embodiment and memory identity exhibited negative effects on satisfaction when their values did not exceed 4. However, once this threshold was surpassed, the SHAP values rapidly shifted to positive and increased substantially, indicating that high levels of local cultural embodiment and memory identity can markedly enhance satisfaction. Space openness exhibited a U-shaped relationship with satisfaction. When the degree of openness was relatively low (1–2), the SHAP value was positive. As openness increased to 4, the SHAP value decreased and became negative, thereby changing the effect on satisfaction from positive to negative. At the highest levels (5), the SHAP value increased again and became positive.
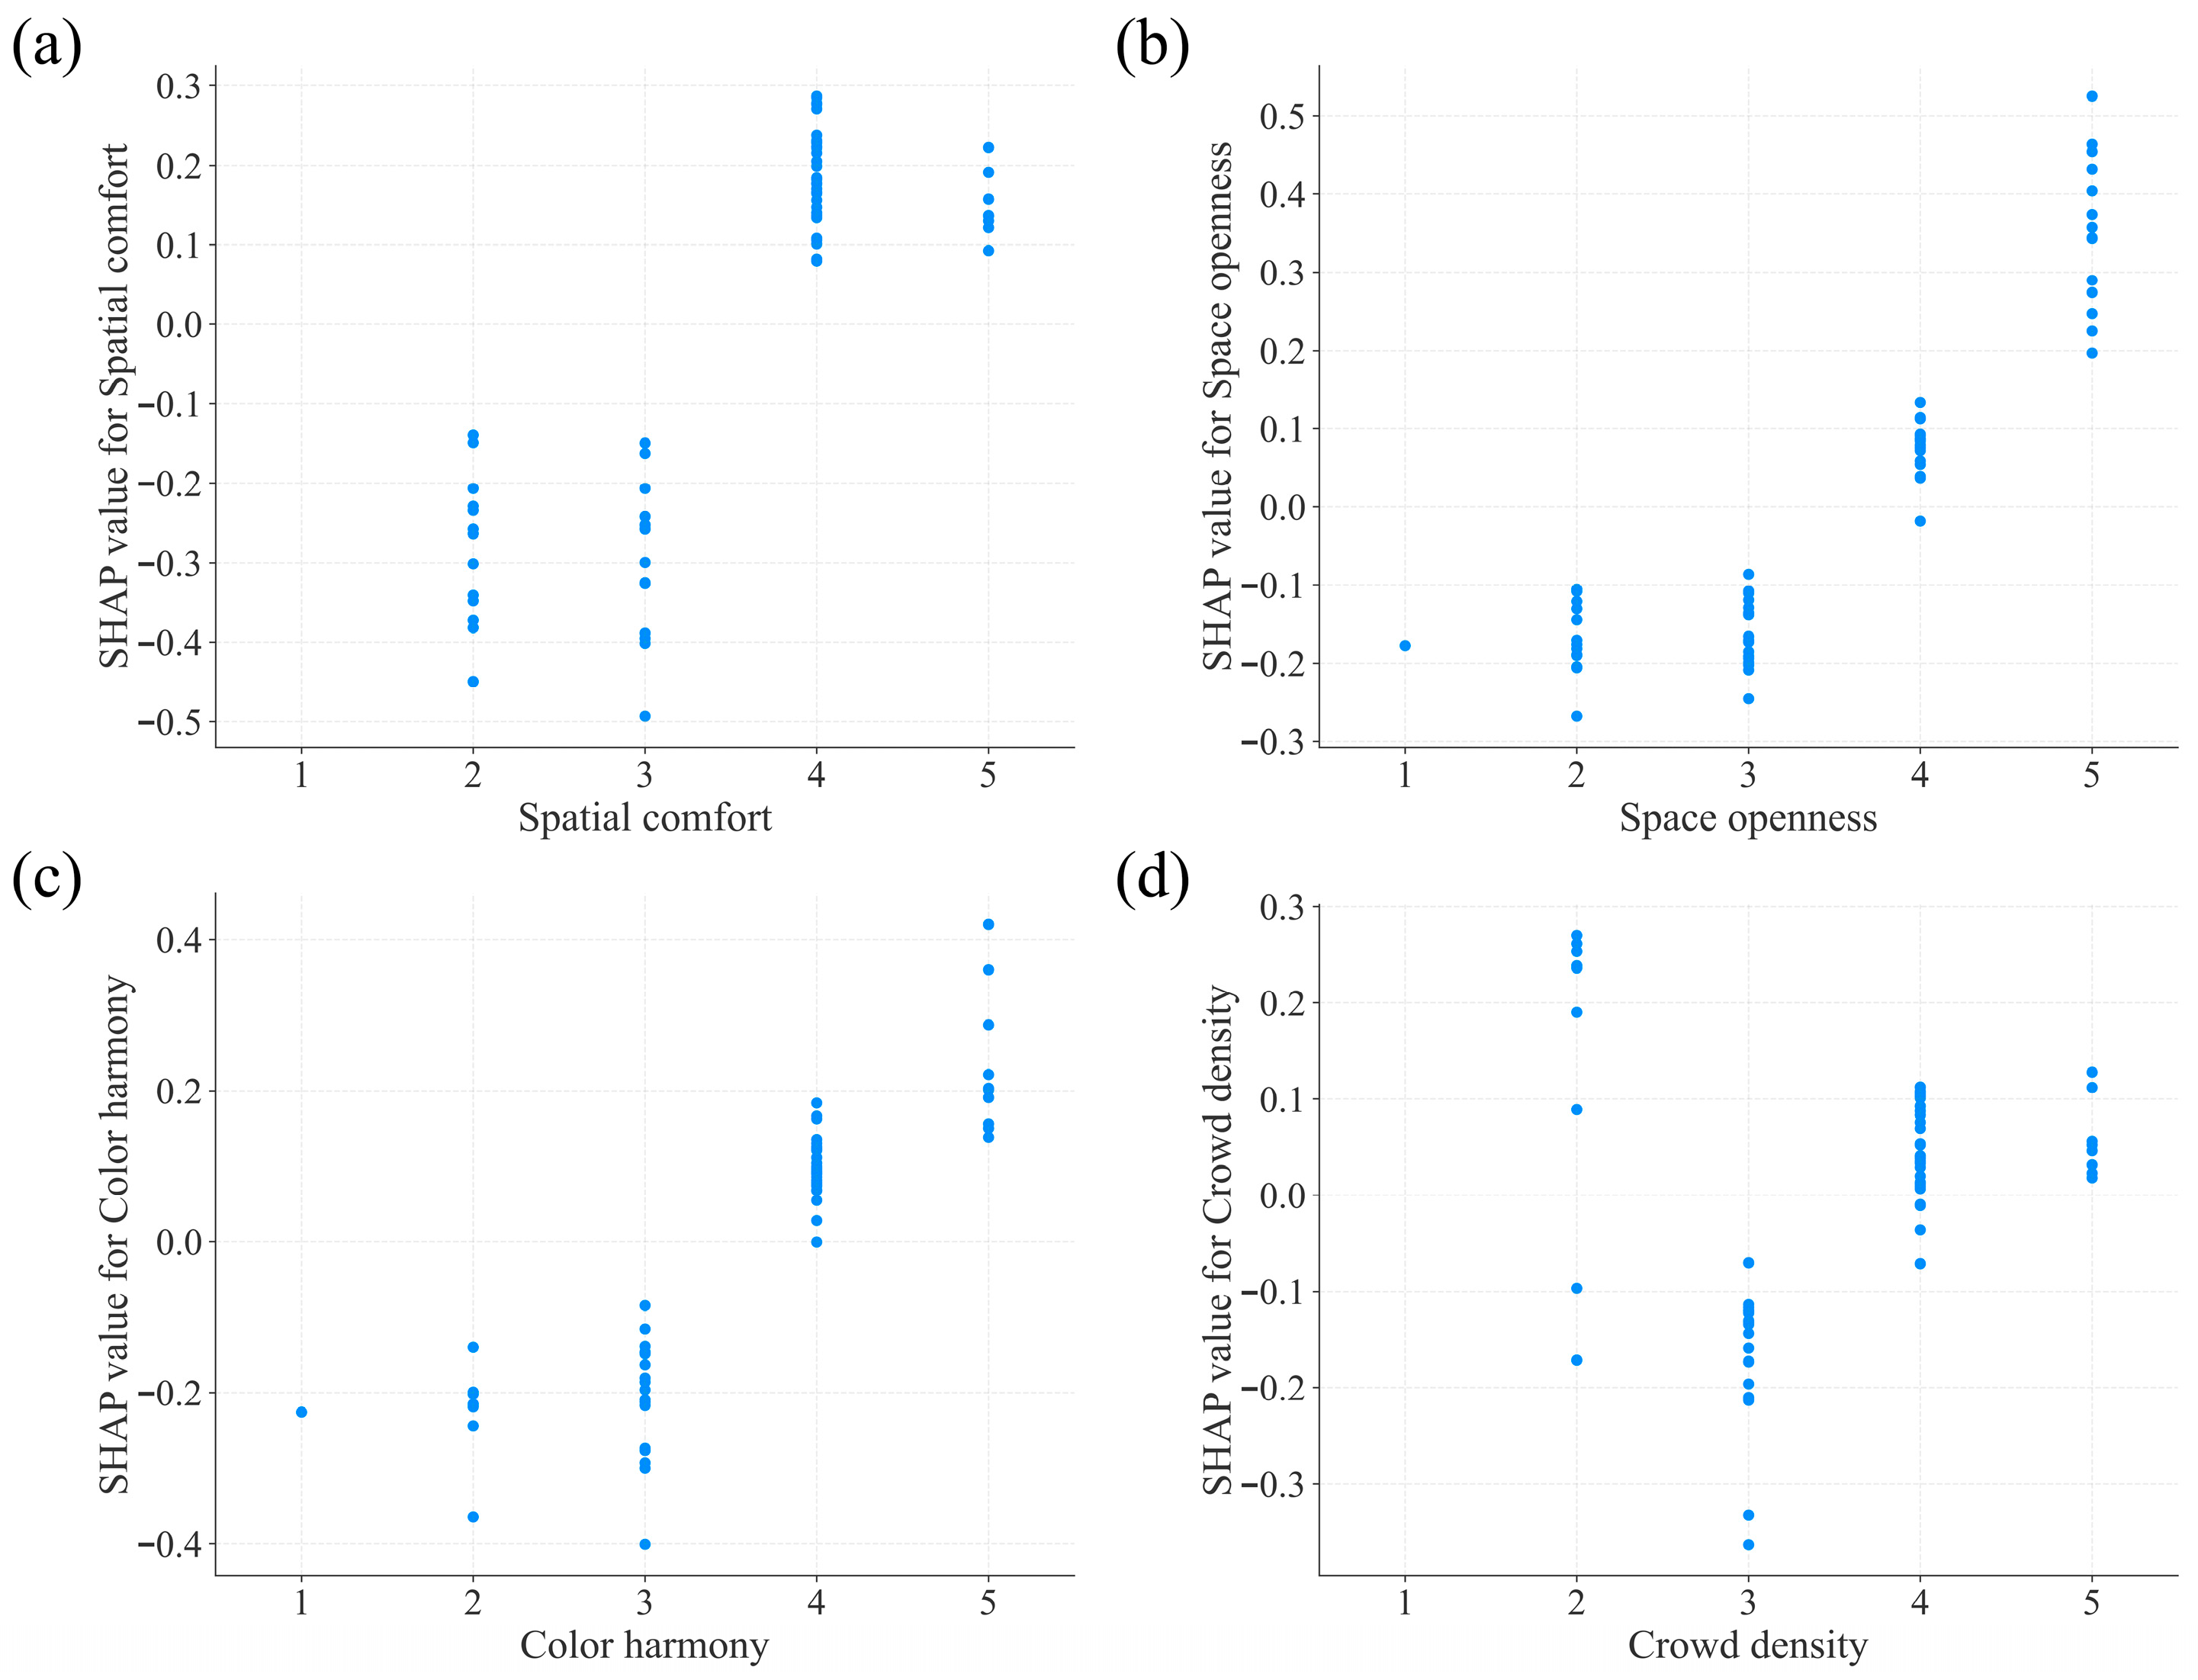
For tourists, four key variables were selected based on their importance, namely color harmony, crowd density, space openness, and spatial comfort. The results showed that when space openness, color harmony, and spatial comfort were at low and moderate levels (≤3), their SHAP values were near zero or negative. As these levels increased to higher levels (4–5), the SHAP values became significantly positive and continued to increase, indicating that the low and moderate levels had negative effects on satisfaction, while the higher levels were associated with positive contributions to satisfaction. Crowd density showed a U-shaped relationship. At low and high density levels, its SHAP values were relatively high, while in the moderate range (3), they were lower. This indicated that moderate crowd density had a negative effect on tourists’ satisfaction, while low and high density levels were associated with positive effects on satisfaction (Figure 6).

3.2.3. The Interaction Effects of Influencing Factors on Satisfaction

Main and Interaction Effects of Perception Factors
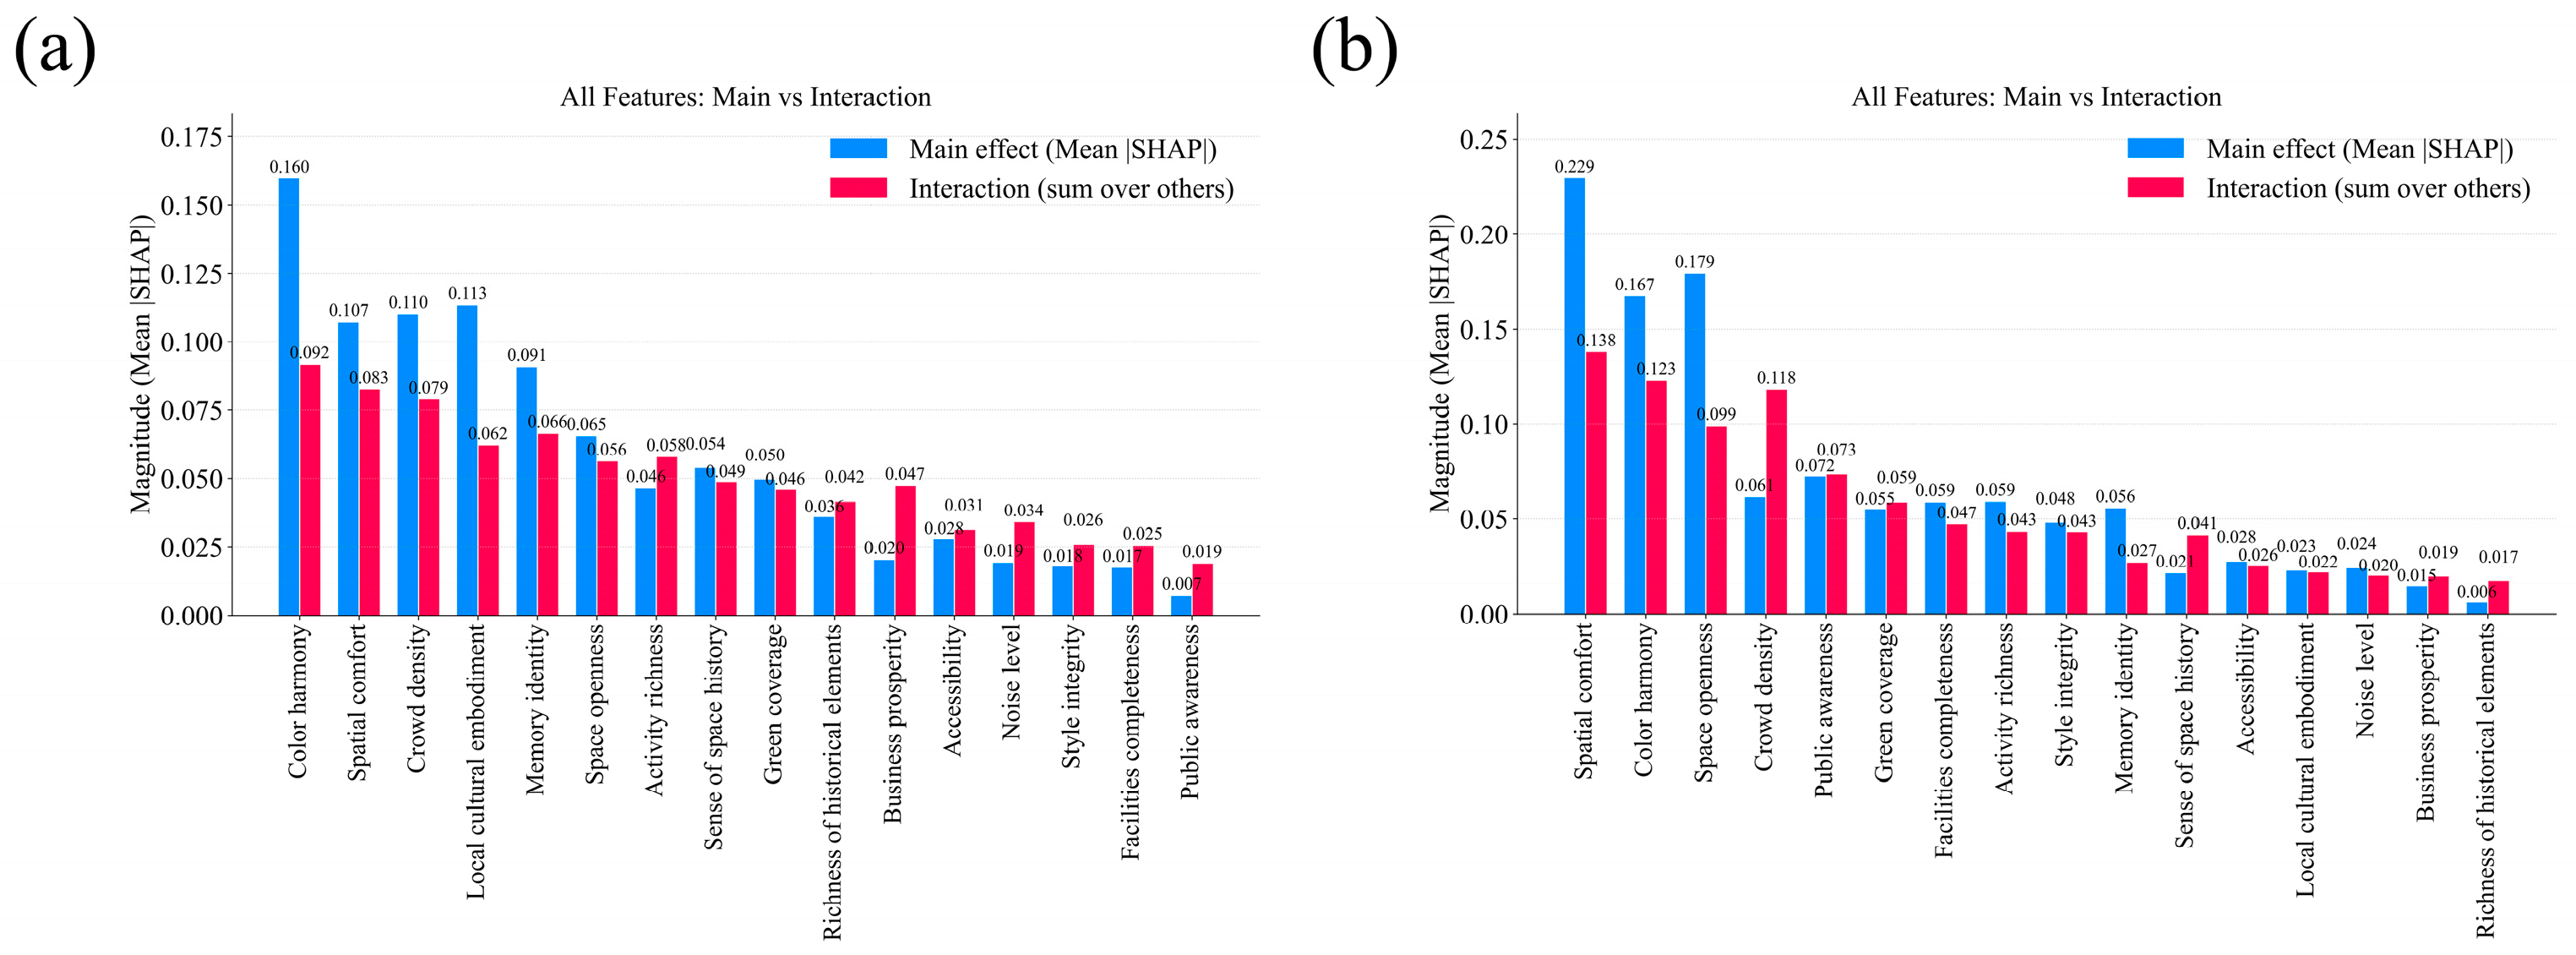
Figure 7 compares the main and interaction effects of perception factors on public space satisfaction. Overall, satisfaction among residents and tourists was not determined by a single factor, but by the combined effects of multiple perception dimensions. For residents, the main effects ranged from 0.007 to 0.160, while the interaction effects ranged from 0.019 to 0.092. The strongest main effect was approximately 1.74 times the strongest interaction effect, indicating that residents’ satisfaction was mainly shaped by the independent contribution of key factors. Among them, color harmony showed the highest main effect, suggesting that it played a dominant role in residents’ evaluation of public space. Regarding interaction effects, seven factors had interaction effects greater than 0.050, and some lower-ranked factors showed stronger interaction effects than their own main effects. These interactions mainly reflected the regulatory role of combined spatial perception in shaping satisfaction. They could strengthen the positive contribution of core factors, while reducing the negative influence of less favorable conditions. For example, business prosperity, public awareness, and facility completeness did not independently dominate residents’ satisfaction, but their effects could be enhanced when combined with color harmony, spatial comfort, or local cultural embodiment. This indicated that residents’ satisfaction was jointly shaped by visual coordination, daily activity, cultural identity, and spatial comfort.
For tourists, both main and interaction effects were generally stronger. The main effects ranged from 0.006 to 0.229, and the interaction effects ranged from 0.017 to 0.138. Compared with residents, the maximum main effect increased from 0.160 to 0.229, representing an increase of approximately 43.1%. The maximum interaction effect increased from 0.092 to 0.138, representing an increase of approximately 50.0%. In addition, the average main effect for tourists was approximately 0.069, higher than that for residents (0.059), and the average interaction effect was also higher for tourists (0.057) than for residents (0.051). These results indicated that tourists’ satisfaction was more sensitive to changes in perception factors and their combinations. Further, the effect structure for tourists showed a clear hierarchy. Spatial comfort, space openness, and color harmony had the strongest main effects. In contrast, crowd density showed a stronger interaction effect than main effect, suggesting that its influence depended more on contextual conditions rather than acting independently. Similar patterns were found for sense of space history, business prosperity, and richness of historical elements, whose effects were mainly expressed through interactions. Thus, tourists’ satisfaction was shaped by a compound perception process dominated by spatial quality and modified by contextual experiential factors.
Pairwise Interaction Effects Among Perception Factors
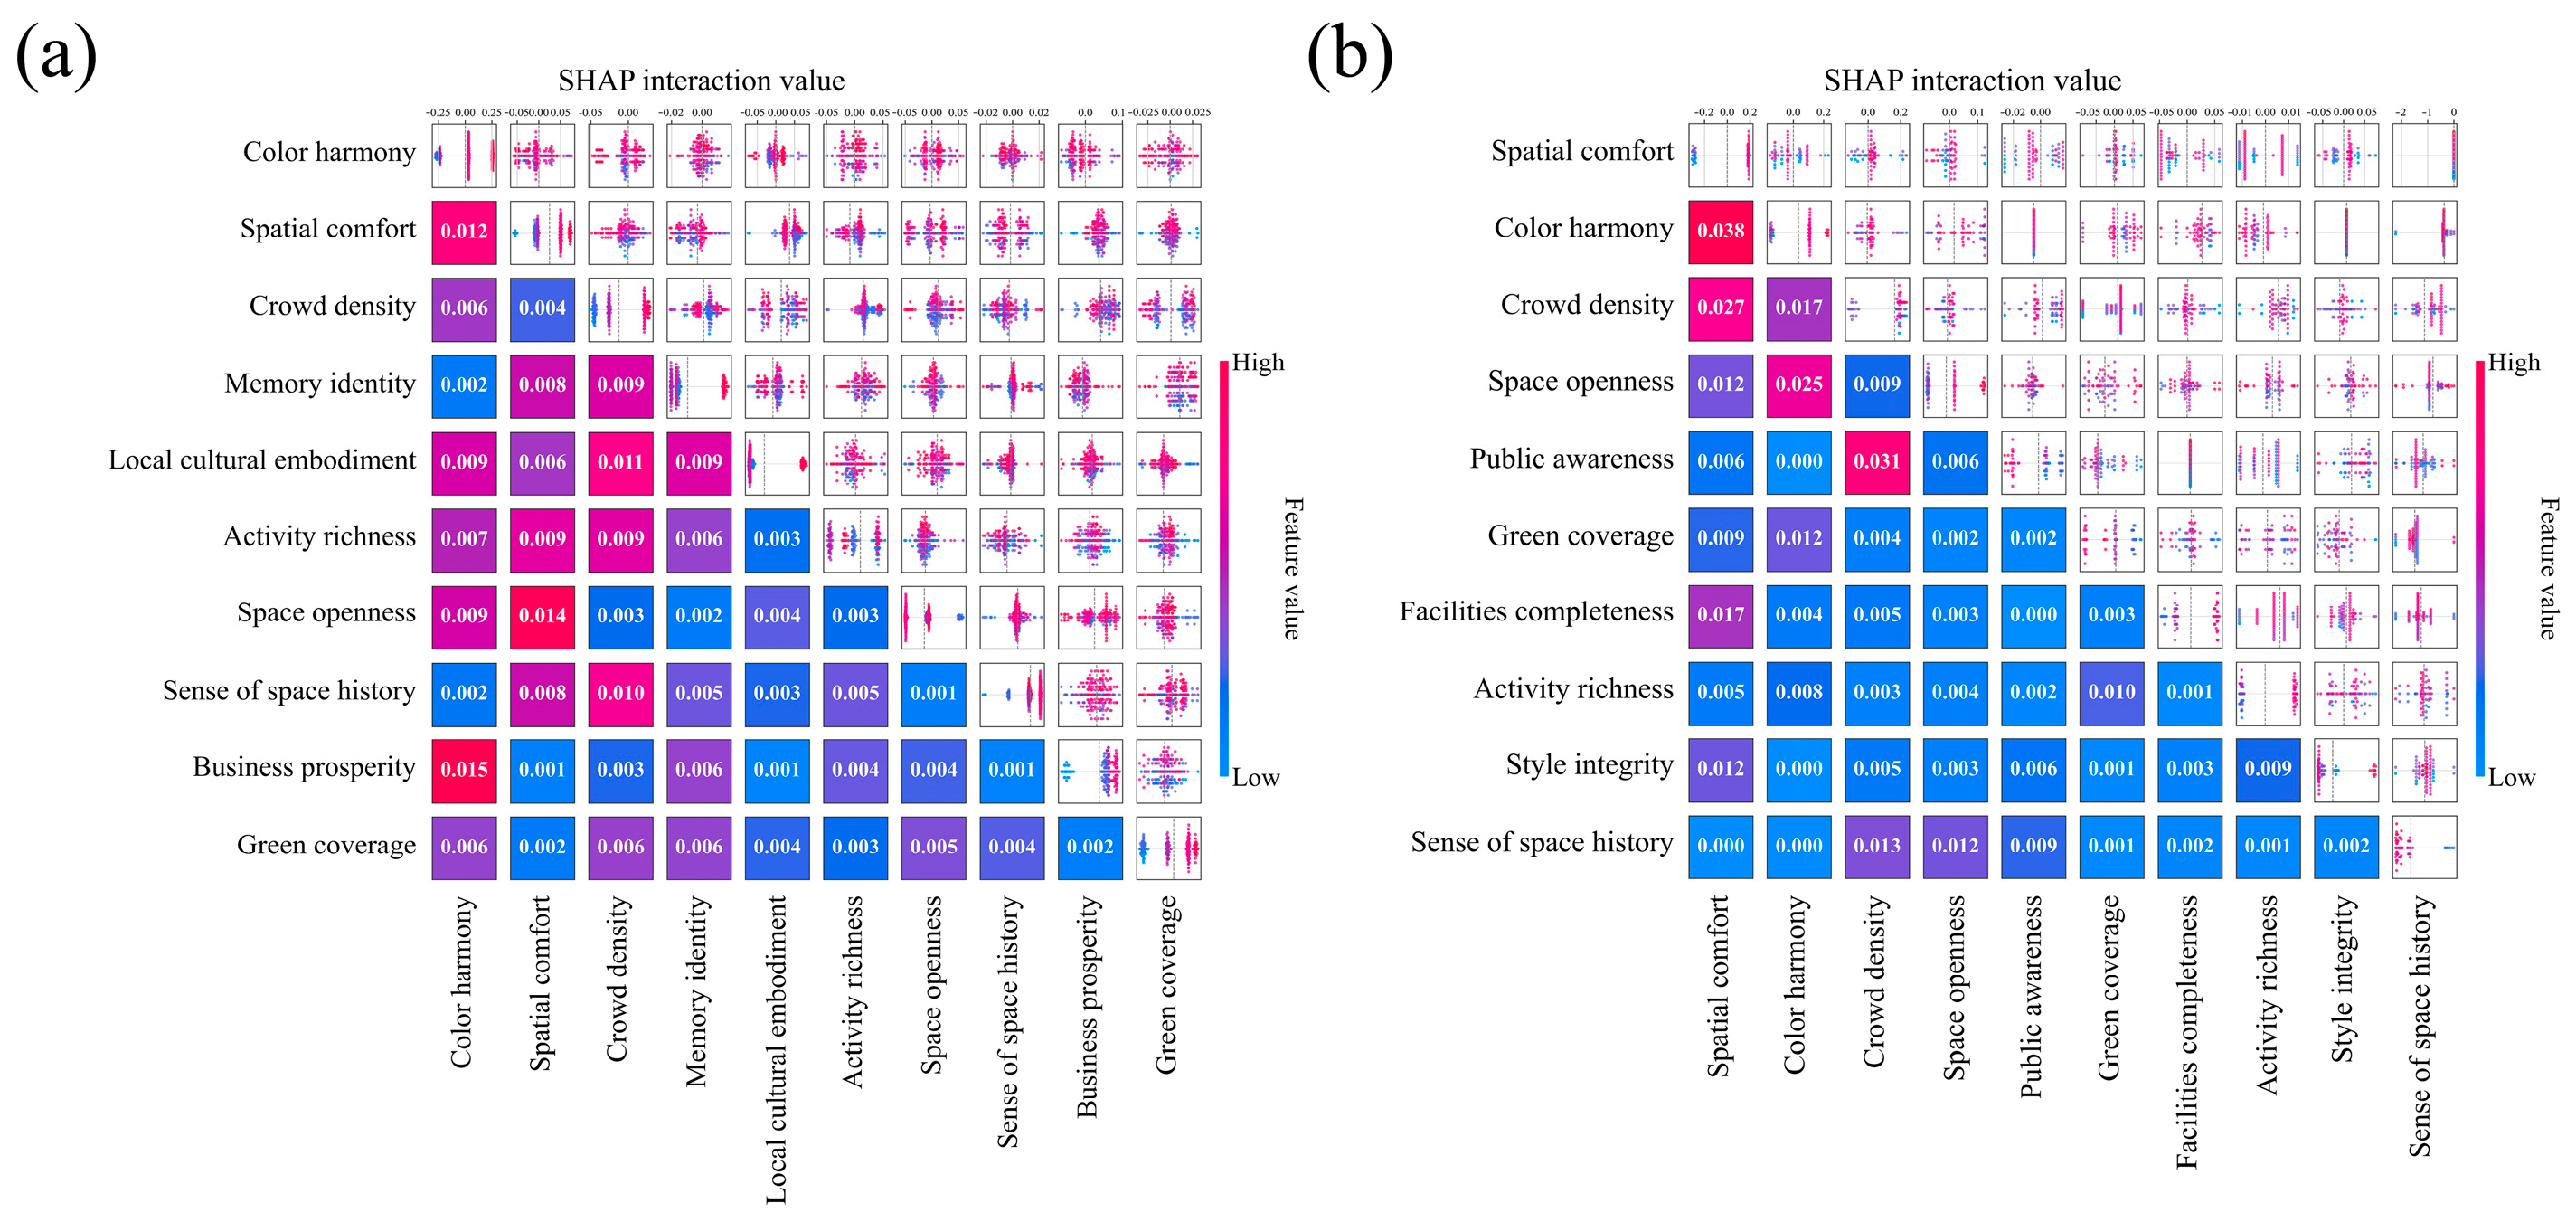
Figure 8 further revealed the pairwise interaction structure among perception factors. For residents, most of the pairwise interaction values were below 0.010. The stronger interaction appeared between color harmony and business prosperity, with a value of 0.015, followed by the interaction between spatial comfort and space openness (0.014), color harmony and spatial comfort (0.012), and crowd density and local cultural embodiment (0.011). These results indicated that residents’ satisfaction was affected by the coupling of visual order, commercial atmosphere and cultural perception.
For tourists, the interaction structure was stronger. The interaction between color harmony and spatial comfort was the greatest, reaching 0.038, which was about 2.53 times the maximum value observed for residents (0.015). Several interaction pairs also showed relatively higher values, including 0.031, 0.027, and 0.025, which indicated that tourists were more sensitive to the combined effects of multiple perception dimensions. In particular, the stronger interactions were mainly associated with color harmony, spatial comfort, crowd density, public awareness, and space openness, suggesting that tourists’ satisfaction depended more on the joint perception of visual quality, spatial experience and crowding condition.
Dominant Interaction Pairs in Residents and Tourists
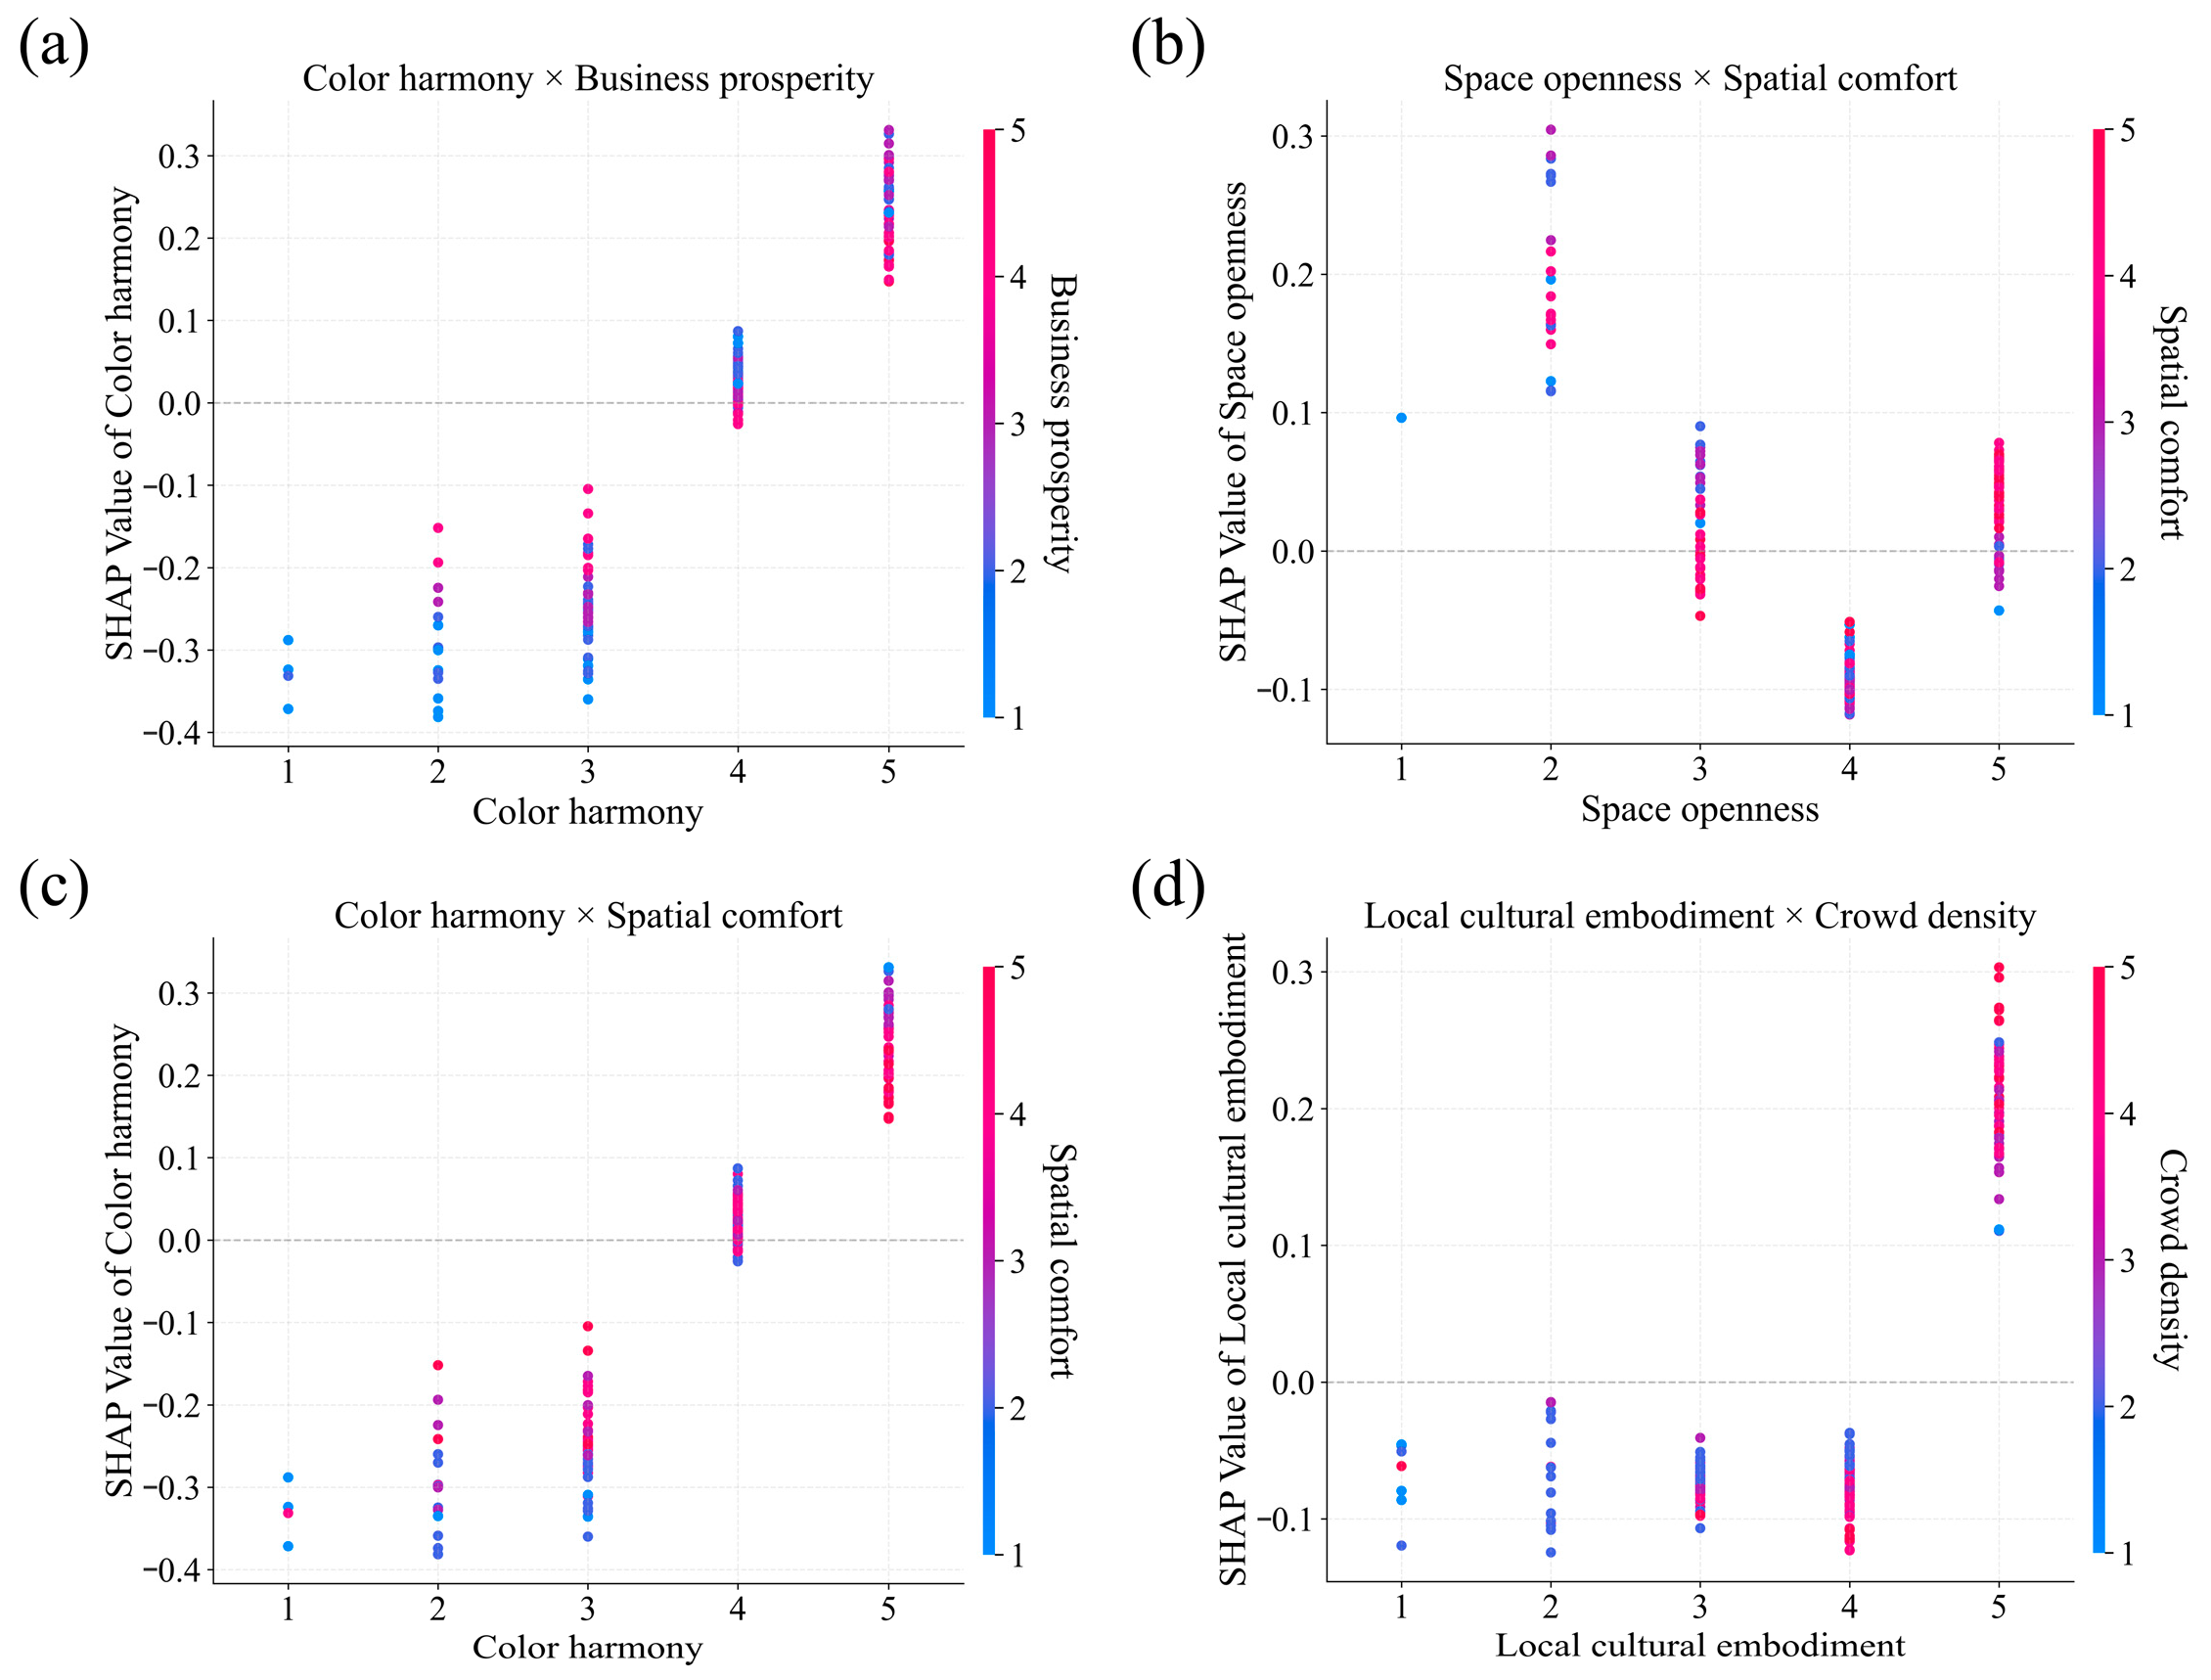
For residents, the four indicator pairs with relatively high interaction values were selected, as shown in Figure 8a, including color harmony × business prosperity, space openness × spatial comfort, color harmony × spatial comfort, and local cultural embodiment × crowd density (Figure 9a–d). The four interaction plots clearly revealed threshold and moderating effects. As shown in Figure 9a, color harmony exhibited negative effects at low to moderate levels (1–3), with SHAP values ranging from approximately −0.38 to −0.10. At this stage, higher business prosperity attenuated the negative effect of color harmony. When color harmony reached higher levels, SHAP values turned positive, and lower business prosperity further strengthened its positive effect on satisfaction. This indicated that color harmony improved residents’ satisfaction only after reaching a relatively high level, while business prosperity mainly served as a moderator. Figure 9b showed a nonlinear interaction relationship between space openness and spatial comfort. At moderate levels, its interaction with higher spatial comfort produced negative effects. At the highest level, a positive interaction between spatial comfort and openness emerged. These results suggested that residents did not simply prefer more open spaces, but tended to seek a balance between openness and comfort. Figure 9c exhibited a pattern similar to Figure 9a, confirming the dominant threshold role of color harmony. Spatial comfort modified the distribution of SHAP values but did not change the overall transition from negative to positive effects. At higher levels, lower spatial comfort was associated with stronger positive contributions. Figure 9d revealed a clear threshold effect for local cultural embodiment. When its level was between 3 and 4, higher crowd density intensified its negative effect. However, at the highest level (5), its contribution increased markedly, and crowd density further enhanced its positive effect on satisfaction. This suggested that crowding improved satisfaction only when strong local cultural expression was perceived; otherwise, higher density could deteriorate the spatial experience.
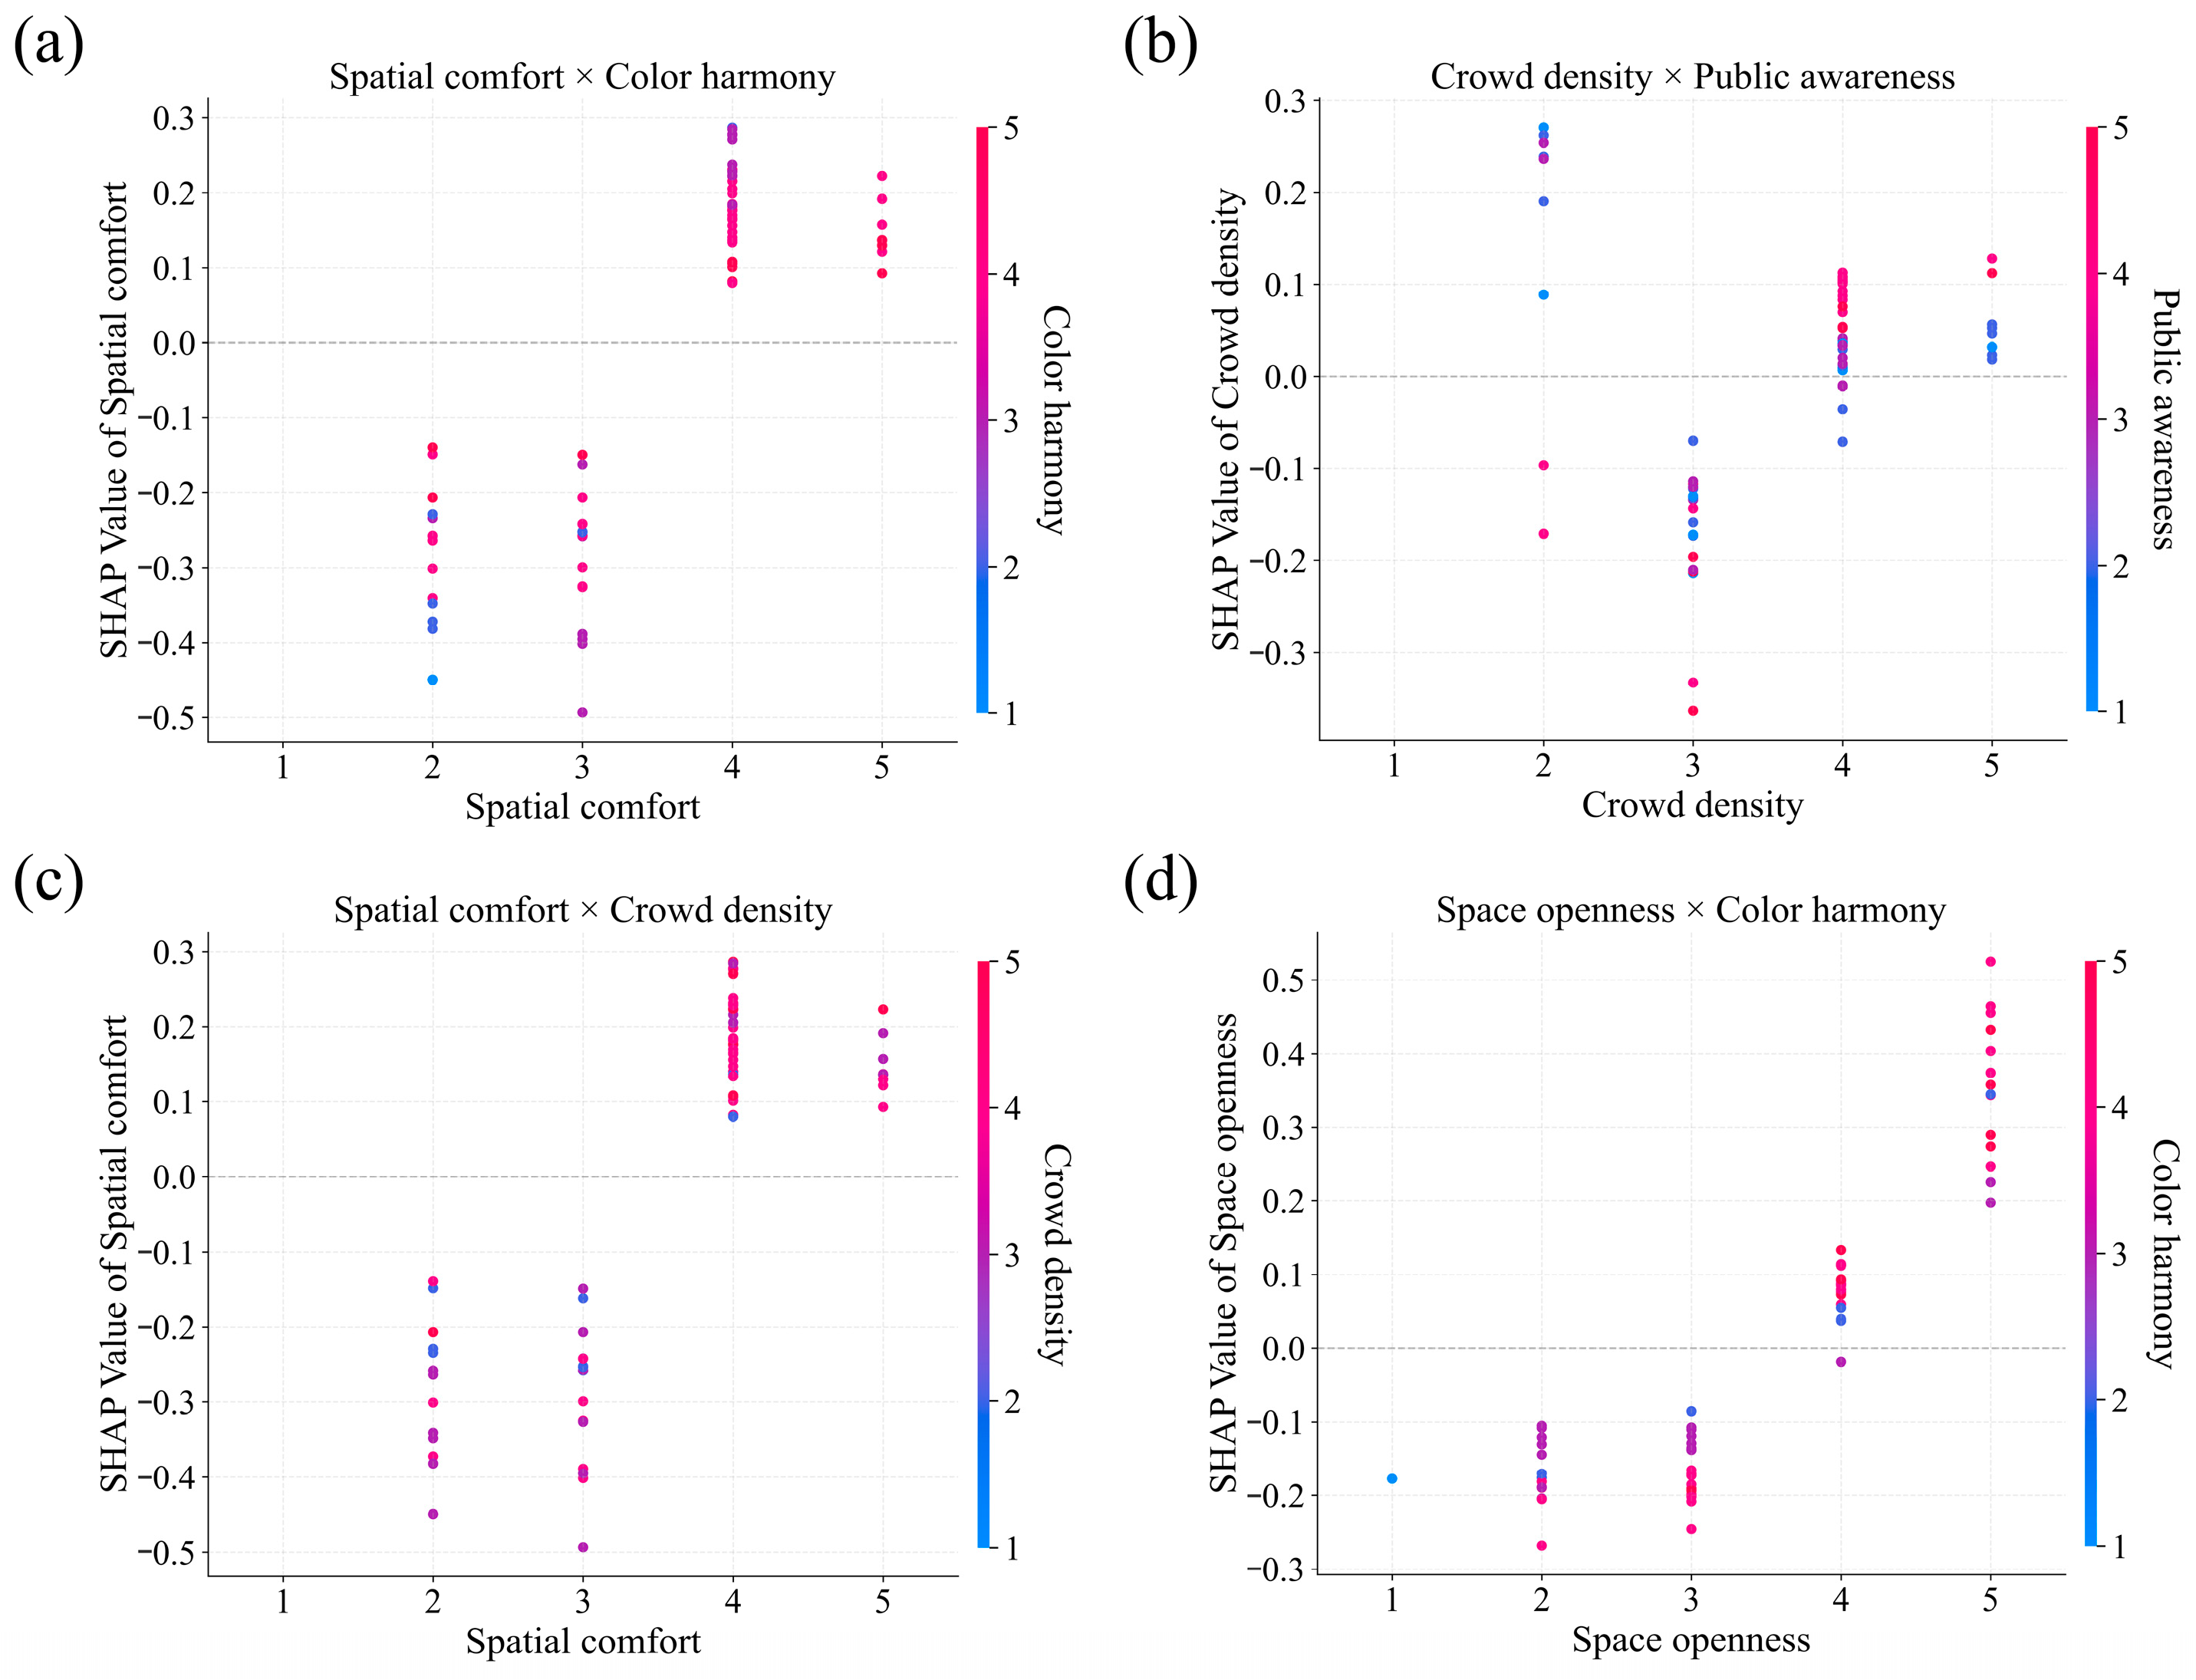
Regarding the interaction effects of tourists, the main interactions occurred between color harmony and spatial comfort, public awareness and crowd density, spatial comfort and crowd density, and color harmony and space openness (Figure 10a–d). Compared with residents, tourists showed stronger interaction fluctuations, indicating that their satisfaction was more easily affected by the combined changes in multiple perception factors. Figure 10a–d showed that the interaction effects for tourists were mainly reflected in threshold responses and moderating effects among spatial experience, visual quality, and behavioral perception factors. In Figure 10a, when spatial comfort reached relatively high levels (4–5), its contribution shifted from negative to positive, with SHAP values increasing to approximately 0.08–0.28. This indicated that spatial comfort enhanced tourists’ satisfaction only after reaching a relatively high level, while higher color harmony further strengthened this positive effect. Figure 10b showed that at level 2, crowd density and public awareness exhibited a positive association, jointly contributing to increased satisfaction. However, at higher crowd density levels, their interaction became more complex, showing both positive and negative effects. Higher public awareness further increased SHAP values above zero, thereby mitigating the negative effects, and the interaction was stronger than under lower public awareness levels. In Figure 10c, both spatial comfort and crowd density showed positive interaction effects when their levels reached 4–5. Figure 10d revealed a clear enhancement effect of space openness. Low levels of openness generated negative contributions, whereas the highest level (5) produced the strongest positive contribution, with SHAP values reaching approximately 0.20–0.52. Higher color harmony further strengthened this positive effect. These findings suggested that tourists tended to prefer more open spatial environments, particularly when accompanied by highly coordinated color composition, reflecting a mutually reinforcing relationship between space openness and color harmony.

4. Discussion

4.1. Differences in Public Space Perception and Satisfaction Among the Two Groups

The results of independent samples t-tests indicated that significant differences were found between the two groups in their perceptions of public space. Residents perceived higher levels of public awareness, space openness, and accessibility than tourists, whereas tourists reported higher perceptions of crowd density and business prosperity than residents.
In terms of space openness, the perception level of residents was higher than that of tourists. This result was consistent with some previous studies. Zhang et al. pointed out that residents were more familiar with the public space and tended to pay greater attention to daily environmental quality, making them less sensitive to spatial scale and openness [31]. Also, Kuang et al.’s research found that tourists were more likely to focus on landscape characteristics and visual attractions rather than on the structural qualities of spatial openness [32]. Residents perceived higher accessibility than tourists. This difference may be attributed to variations in travel demand. Residents had relatively stable daily travel needs and required fewer transportation transfers, resulting in higher perceived accessibility. In contrast, tourists had to navigate multiple modes of transport in an unfamiliar environment, which increased perceived inconvenience and reduced their evaluation of transportation convenience. This finding was in line with that of Chen et al. [33], who found that tourists placed greater emphasis on immediate experiences, such as convenience. The residents had a higher level of public awareness compared to tourists. This was mainly because residents, through deeper social integration and continuous interaction with the place, developed a stronger sense of place identity and a more comprehensive understanding of the area, whereas tourists primarily relied on visual cues and external impressions to construct their perceptions of the place [34].
In terms of crowd density, tourists had a higher perception than local residents. Residents’ activities were dispersed across various public spaces, while tourists’ activities were concentrated in the core scenic areas, which led to a stronger perception of congestion [35]. Tourists perceived the business prosperity more than the residents did, which aligns with the results reported by Wang Fang et al. [36]. For residents, commercial activities mainly served daily needs, resulting in relatively low commercial demands. In contrast, tourists, as short-term visitors, valued both functional consumption and local commercial characteristics, such as souvenir purchasing and experiential consumption. Therefore, business prosperity directly influenced tourists’ overall tourism experience.

4.2. The Relationship of the Public Space Perceptions and Satisfaction

The results indicated consistency in the key perception factors affecting residents’ and tourists’ satisfaction, with color harmony, spatial comfort, space openness, and crowd density identified as the primary factors in both groups. For residents, color harmony and crowd density were the most influential factors, whereas for tourists, spatial comfort and space openness were the most important factors. This differed from the research results of Kuang et al., who believed that tourists were more sensitive to aesthetics, while residents placed greater emphasis on features related to functional comfort [32]. This difference might be attributed to differences in spatial context and user composition. In this study, the public spaces surveyed were mainly used by residents for daily activities, which might reflect the stable aesthetic preferences formed through long-term interaction with the environment. In contrast, tourists’ satisfaction tended to depend more on immediate physical comfort and environmental experience. These factors were mainly positively associated with satisfaction, whereas space openness in relation to residents’ satisfaction and crowd density in relation to tourists’ satisfaction exhibited significant nonlinear characteristics. In addition, interaction effects among perception factors were also observed.
For both residents and tourists, color harmony and spatial comfort were positively associated with satisfaction. When the perception levels of these two factors reached 4–5, both significantly enhanced satisfaction. These effects did not exhibit simple linear patterns, but instead showed nonlinear characteristics across different perception levels. Further interaction analysis revealed significant nonlinear interaction effects between color harmony and spatial comfort. Specifically, when color harmony was high and spatial comfort was low, or vice versa, the two factors exhibited a positive interaction effect. This suggests that a potential trade-off or balancing relationship may exist between the two factors, rather than a simple synergistic enhancement effect. On this basis, an appropriate color balance could only effectively enhance the aesthetic appeal of public spaces under specific comfortable environmental conditions and further improve the overall experience quality. Therefore, in the process of public space renewal, excessive optimization of these two factors should be avoided. Instead, a dynamic balance between visual quality and comfort experience should be achieved within an appropriate range to enhance the overall experiential quality. For spaces facing residents, greater emphasis should be placed on color harmony, as residents have long-term connections with the traditional environment. The coordination of building and landscape colors helps maintain the continuity of traditional landscape features and enhances belonging among residents. In contrast, for areas targeting tourists, priority should be given to spatial comfort, as tourists usually stay for a shorter period and mainly evaluate the historical environment based on immediate experiences. Furthermore, a synergistic weakening effect between color harmony and business prosperity on residents’ satisfaction was observed. When color harmony was at a high level (4–5), higher business prosperity reduced the positive effect of color harmony on satisfaction. Chen et al. argued that areas with higher business prosperity tend to exhibit more diverse but less harmonious colors [37]. This color disharmony reduced environmental coherence, leading to visual confusion and lower satisfaction [38].
Space openness was positively associated with tourists’ satisfaction. When the openness exceeded 3, it had a positive effect on satisfaction. This indicated that open and visually transparent environments were more likely to promote positive spatial experiences. This finding was consistent with Kuang et al., who noted that tourists tended to prefer spaces with broad and open views [32]. Further analysis of the interaction effects revealed that higher levels of space openness and color harmony exhibited a synergistic enhancement effect. Zhang et al. also pointed out that wide open environments provided a more inclusive visual experience, while deeper visual perspectives enriched spatial layering and visual information, thereby improving overall perceptual level [39]. However, a U-shaped relationship was observed between residents’ satisfaction and space openness, indicating that both relatively low and high levels of openness could contribute to higher satisfaction. This pattern may be attributed to the diverse spatial forms and functional characteristics of public spaces in Fenghuang Historic Town. Low-openness spaces, such as traditional alleys and semi-enclosed neighborhood interaction areas, contributed to residents’ sense of familiarity, supporting daily communication and interaction. In contrast, highly open spaces, such as squares, offered greater spatial capacity for collective activities [40]. However, at intermediate levels of openness, some spaces lacked both the intimacy of low-open spaces and the large-scale activity capacity of high-open spaces, resulting in relatively lower satisfaction. The further interaction between openness and comfort suggested that spaces with an appropriate level of openness should also provide comfortable walking and resting experiences to maintain residents’ perceived comfort, thereby further enhancing satisfaction.
Local cultural embodiment, memory identity, and crowd density all had a positive correlation with the residents’ satisfaction. Satisfaction increased significantly when local cultural embodiment reached level 5, and memory identity and crowd density remained within the 4–5 range. These findings suggested that rich cultural resources and strong psychological identification strengthened residents’ sense of place attachment and enhanced overall subjective well-being [41]. Furthermore, a synergistic relationship was observed between crowd density and local cultural embodiment at higher perception levels, which was generally expressed as a positive interaction. Long et al. pointed out that crowd density could enhance spatial vitality and local attractiveness [42], thereby facilitating a more vivid perception of local cultural characteristics. Similarly, Huang proposed that local traditional culture could serve as a medium for strengthening social connections among people [43], thereby contributing to improvements in residents’ satisfaction. However, tourist satisfaction exhibited a U-shaped relationship with crowd density, with higher satisfaction observed under both low and high density conditions. Further analysis of interaction effects revealed that crowd density demonstrated synergistic enhancement effects with both spatial comfort and public awareness at specific perception levels. From a spatial perspective, low-density environments provided sufficient space for sightseeing, photography, and appreciation of historical landscapes, facilitating free movement and enhancing visitors’ comfort [44]. In Fenghuang Historic Town, some traditional alleys and non-core tourist areas had relatively lower visitor intensity, allowing tourists to experience historical buildings and street patterns in a more leisurely manner. In contrast, high-density environments mainly occurred in core streets and commercial nodes where tourist activities were concentrated. A certain level of visitor concentration could enhance the tourism atmosphere while promoting richer social interactions; the presence of other tourists could further strengthen shared experiences and collective identity, thereby enhancing experiential value [45]. From a social perspective, crowd density served as an external signal of destination popularity, influencing tourists’ perceptions of destination attractiveness and their evaluation judgments. In historical tourism destinations such as Fenghuang Historic Town, visitor aggregation may strengthen tourists’ perceptions of destination popularity and recognition. However, although lower visitor density weakened the social signal of destination popularity, it may also indicate less tourism interference for some visitors, allowing them to pay greater attention to historical environmental features and cultural values. Accordingly, heterogeneous preferences were observed: some tourists preferred destinations that were both well-known and crowded [46], whereas others showed a preference for destinations with lower reputation and lower crowd density [47].

4.3. Strategies to Enhance Public Space Satisfaction

The findings of this study provided empirical evidence for improving and revitalizing public spaces in historic towns. Based on these results, a set of strategies was proposed to optimize public spaces, as outlined below:
(1)
Implement differentiated optimization strategies to enhance public space perception for two user groups. For residents, efforts should focus on improving commercial service facilities, enhancing commercial vitality, and promoting interactive public activities. For tourists, planning strategies should prioritize spatial accessibility, open and comfortable environments, reduced crowding in daily activities, and strengthened promotion to enhance the popularity of the historical town.
(2)
The overall color harmony and spatial comfort should be further improved. The results indicated that residents placed greater importance on color harmony, whereas tourists were more concerned with spatial comfort. Therefore, public space renewal should simultaneously address the different needs of the two groups. On the one hand, some areas of Fenghuang Historic Town exhibit poor building color coordination and inconsistent commercial signage, undermining the overall coherence of the townscape. Future renewal projects should strengthen the conservation of local architectural styles. Through facade improvements, commercial signage regulation, and landscape color planning, overall color harmony can be enhanced while preserving the historic character and visual identity valued by residents. On the other hand, seating and shading facilities, rest areas, and multifunctional activity spaces should be improved to provide tourists with a more comfortable visiting environment.
(3)
Space openness and crowd density should be managed within an appropriate range. The results indicated that both space openness and crowd density had significant nonlinear effects on satisfaction. For resident-oriented public spaces, a combination of semi-enclosed and open spatial layouts should be adopted according to different functional requirements. Neighborhood interaction spaces should adopt a moderately enclosed design to enhance community interaction, whereas the activity areas such as squares and waterfront spaces should maintain a high degree of openness to meet the needs of leisure and group activities. In contrast, tourist-oriented public spaces should maintain greater visual openness to enhance the sightseeing experience. Meanwhile, organizing community activities, traditional festivals and cultural experience activities in resident-oriented spaces can maintain an appropriate crowd density and enhance the vitality of public spaces. During peak tourism periods, visitor management measures, such as visitor capacity control, activity zoning, route optimization, and real-time visitor flow guidance, should be implemented to prevent excessive crowding in localized areas and improve the overall visitor experience.

4.4. Limitations

This study, based on independent samples t-tests and the XGBoost-SHAP model, systematically analyzed differences in satisfaction with public space in historical ancient towns and their influencing factors. However, certain limitations remain. Firstly, this study discussed the effect of public space perception on satisfaction, but the selection of objective factors was limited. The perception factors covered dimensions such as culture value, social identity, townscape harmony, environmental features, and functional features; however, the incorporation of objective natural environmental indicators—including climatic conditions, sunlight exposure, thermal comfort, spatial accessibility and actual traffic volume—remained relatively limited. Future research could integrate subjective perception with objective spatial and environmental indicators to provide a more comprehensive understanding of the factors influencing public space satisfaction. Secondly, this study primarily relied on subjective questionnaire data collected from residents and tourists. Although data quality was ensured through reliability and validity testing, data collection was time-consuming and labor-intensive. With the widespread application of street view big data, future studies may consider integrating multi-source data, such as street view images, social media data, and mobile trajectory data. By leveraging deep learning and computer vision techniques, more efficient identification and quantitative analysis of public space perception factors can be achieved. Thirdly, this study had a limitation regarding the unequal sample sizes between residents and tourists. Although two groups met the requirements for model construction and provided effective data support for evaluating public space perception and satisfaction, the difference in sample size may influence the interpretation of comparison results between the two groups. Future research can further expand the sample size of tourists and adopt more balanced sampling strategies to improve the reliability of comparisons between different user groups. Fourthly, this study focused on a single case, Fenghuang Historic Town in Southern Shaanxi, China. As a result, the findings may be context-dependent, and their applicability to other historic towns with different geographical settings, tourism development stages, and cultural contexts remains to be verified. Future research should conduct comparative studies across multiple historic towns, thereby enhancing the generalizability and transferability of the research findings. Finally, this study was based on cross-sectional survey data collected during a single survey period and therefore could not capture long-term changes in public space perception and satisfaction. In addition, the potential effects of seasonal variations in tourist flow and differences between peak and off-peak tourism periods were not explicitly examined. Future research should adopt longitudinal survey designs or collect data across multiple time periods to investigate the dynamic relationships between public space perception and satisfaction under different seasonal and tourism conditions.

5. Conclusions

This study used independent samples t-tests to examine differences in public space perception between residents and tourists, while the XGBoost-SHAP model was employed to explore the relationship between public space perception factors and satisfaction.
Independent samples t-tests indicated that local residents perceived higher levels of public awareness, space openness, and accessibility in public spaces than tourists, while tourists reported higher perceived levels of crowd density and business prosperity. Residents placed greater emphasis on the daily functional use and social identity of public spaces, whereas tourists focused more on spatial vitality and the quality of tourism experiences.
The XGBoost-SHAP analysis further identified substantial differences in the key factors influencing satisfaction between residents and tourists. Color harmony was the most important factor influencing residents’ satisfaction (SHAP value = 0.156), followed by local cultural embodiment and crowd density, suggesting that residents were more sensitive to visual aesthetics, cultural expression, and spatial vitality. In contrast, spatial comfort was the dominant factor influencing tourists’ satisfaction (SHAP value = 0.223), followed by space openness and color harmony, indicating that tourists placed greater emphasis on comfort, openness and spatial configuration characteristics. Furthermore, public space perception factors exhibited significant nonlinear effects on satisfaction. For residents, color harmony, crowd density, spatial comfort, local cultural embodiment, and memory identity were positively associated with satisfaction, whereas space openness showed a U-shaped relationship. For tourists, space openness, color harmony, and spatial comfort were positively associated with satisfaction, while crowd density exhibited a U-shaped relationship. Interaction effects further revealed clear heterogeneity between the two groups. For residents, the strongest interaction was observed between color harmony and business prosperity (interaction value = 0.015), indicating that lower levels of business prosperity enhanced the positive effect of high color harmony on satisfaction. This was followed by the interaction between space openness and spatial comfort (0.014), which also exhibited nonlinear characteristics. For tourists, the most pronounced interaction occurred between spatial comfort and color harmony (0.038), showing a synergistic enhancement effect when both factors were at high levels. This was followed by crowd density and public awareness (0.031), where higher public awareness strengthened the positive effect of crowd density on satisfaction. Planners should carefully consider the diverse needs of both residents and tourists, including maintaining color harmony and enhancing visual aesthetics, reasonably managing crowd density, and optimizing spatial design and spatial comfort. Strengthening historical and cultural heritage conservation and promoting sustainable and inclusive public space renewal in historic towns can enhance satisfaction and spatial experiences for both residents and tourists.

Author Contributions

Conceptualization, M.Z. and H.Y.; methodology, M.Z. and J.X.; software, M.Z., J.X. and Z.Y.; formal analysis, M.Z. and Z.Y.; investigation, Q.Z. and H.Y.; resources, M.Z. and Q.Z.; data curation, M.Z. and J.X.; writing—original draft preparation, M.Z.; writing—review and editing, M.Z. and H.Y.; supervision, H.Y. All authors have read and agreed to the published version of the manuscript.

Funding

This research was funded by the Innovation Project for College Students (No. XN2026024096) and the Ministry of Education Humanities and Social Sciences Fund (23YJC760079).

Institutional Review Board Statement

Ethical review and approval were waived for this study in accordance with the current research governance practices at Northwest A&F University. Ethical approval is not required for studies that (1) do not involve human biomedical intervention, (2) do not collect personal or sensitive data, and (3) are based on anonymous, voluntary responses. The questionnaire-based survey conducted in this study does not fall under the category of research requiring ethical approval under the University’s regulations. As the study involved a non-interventional, anonymous survey on perceptions and satisfaction with public spaces in historic towns and did not collect any personally identifiable or sensitive information, ethical review and approval were not required.

Informed Consent Statement

Informed consent for participation was obtained from all subjects involved in the study.

Data Availability Statement

Due to confidentiality and privacy restrictions concerning the questionnaire responses of human participants, the data used in this study are available from the corresponding author upon reasonable request.

Acknowledgments

We would like to express our gratitude to Chensheng Ji, Lanbo Li, Weijing Yuan and Ruiqi Zhao of the College of Landscape Architecture and Arts, Northwest A&F University, China, for her valuable support and suggestions during the data collection process.

Conflicts of Interest

The authors declare no conflicts of interest.

References

  1. Housing and Urban-Rural Development Ministry, Culture Ministry, National Cultural Heritage Administration, Ministry of Finance. Notice on the Survey of Traditional Villages. Available online: https://www.mohurd.gov.cn/gongkai/zc/wjk/art/2012/art_17339_209619.html (accessed on 6 January 2026).
  2. Asfour, O.S.; Hossain, S.T. Assessing the impact of design quality attributes of public open spaces on users’ satisfaction: Insights from a case study in Saudi Arabia. Architecture 2025, 5, 55. [Google Scholar] [CrossRef]
  3. Chen, M. Public places and social stratum in Tibetan villages: A case study from Chabanang Village of Qüxü County, TAR. China Tibetol. 2010, 2, 96–102. [Google Scholar]
  4. Zhang, H.; Chen, J.; Zhou, C. Research review and prospects of traditional villages in China. City Plan. Rev. 2017, 41, 74–80. Available online: http://www.planning.com.cn/WKE2/WebPublication/paperDigest.aspx?paperID=6b64f980-354d-4146-99f8-4dad1d2f51b2 (accessed on 31 July 2026).
  5. Song, Y.; Wang, Y.; Zhou, M. Public space satisfaction evaluation of new centralized communities in urban fringe areas—A study of Suzhou, China. Int. J. Environ. Res. Public Health 2022, 20, 753. [Google Scholar] [CrossRef] [PubMed]
  6. Zhao, X.; Ju, S.; Wang, W.; Su, H.; Wang, L. Intergenerational and gender differences in satisfaction of farmers with rural public space: Insights from traditional village in Northwest China. Appl. Geogr. 2022, 146, 102770. [Google Scholar] [CrossRef]
  7. Peng, Y.; Qiu, H.; Wang, X. The influence of spatial functions on the public space system of traditional settlements. Sustainability 2023, 15, 8632. [Google Scholar] [CrossRef]
  8. Dong, Q.; Chen, Y.; Liu, Y.; Qi, Y.; Galli, B.; Wang, Y. Developing a method to evaluate public space perception in river valley plain villages of the Loess Gully Area based on villagers’ perspectives. Buildings 2024, 14, 3602. [Google Scholar] [CrossRef]
  9. Jaffar, N.; Harun, N.Z.; Abdullah, A. Enlivening the mosque as a public space for social sustainability of traditional Malay settlements. Plan. Malays. 2020, 18, 145–157. [Google Scholar] [CrossRef]
  10. Cui, C.; Ma, H.; Li, J.; Wang, M. Research on the spatial quality of urban village main streets in Shenzhen from the perspective of nighttime pedestrian demands. Land 2023, 12, 1854. [Google Scholar] [CrossRef]
  11. Zhang, C.; Meng, S.; Zhang, H.; Zhang, Y. Evaluation of villagers’ satisfaction to public spaces in traditional villages and identification of obstacle factors: A case study based on Nanjiao Village in Beijing. South Archit. 2025, 3, 50–61. [Google Scholar] [CrossRef]
  12. Shen, H.; Aziz, N.F.; Lv, X. Using 360-degree panoramic technology to explore the mechanisms underlying the influence of landscape features on visual landscape quality in traditional villages. Ecol. Inform. 2025, 86, 103036. [Google Scholar] [CrossRef]
  13. Shi, J.; Mei, L.; Meng, Y.; Gao, W. Revealing the relationship between urban park landscape features and visual aesthetics by deep learning-driven and spatial analysis. Buildings 2025, 15, 2487. [Google Scholar] [CrossRef]
  14. Wang, J.; Zhao, D. Residents’ satisfaction with public spaces in old urban residential communities: A PLS-SEM and IPMA-based case study of Nankai District, Tianjin. Land 2025, 14, 2363. [Google Scholar] [CrossRef]
  15. Wang, Y.; Cui, J.; Ni, Y. A study on resident satisfaction with the quality of public space in historical cultural districts based on structural equation modeling: Taking Suzhou Pingjiang Historic District as an example. Mod. Urban Res. 2023, 4, 89. [Google Scholar] [CrossRef]
  16. Zhao, M.; Zhong, Y.; Wang, S.; Dai, M. Comparing street space perception of stakeholders: A case study of Enning Road in Guangzhou. Hum. Geogr. 2014, 29, 72–79. [Google Scholar] [CrossRef]
  17. Li, P.; Zhang, W. Intervention and co-creation: Art-led transformation of spatial practices and cultural values in rural public spaces. Land 2025, 14, 1353. [Google Scholar] [CrossRef]
  18. Ai, J.; Pei, H.; Huang, W.; Huang, Q. Evaluation of arcade historical blocks landscape satisfaction based on AHP. Dev. Small Cities Towns 2019, 37, 108–114. [Google Scholar] [CrossRef]
  19. Gu, S.; Li, J.; Wang, M.; Ma, H. Post-renewal evaluation of an urbanized village with cultural resources based on multi public satisfaction: A case study of Nantou Ancient City in Shenzhen. Land 2023, 12, 211. [Google Scholar] [CrossRef]
  20. Xing, Y.; Leng, J. Evaluation of public space in traditional villages based on eye tracking technology. J. Asian Archit. Build. Eng. 2024, 23, 125–139. [Google Scholar] [CrossRef]
  21. Li, B.; Yang, J.; Liu, P.; Chen, C.; Liu, Y. Landscape value perception and evaluation of residents on traditional villages—A case study of Zhangguying Village. J. Huazhong Norm. Univ. (Nat. Sci.) 2018, 52, 248–255. [Google Scholar] [CrossRef]
  22. Yao, X.; Leng, H. Study on satisfaction of park recreation space based on structural equation model: A case study of Chang Chun. Archit. J. 2017, 64, 32–37. [Google Scholar]
  23. Liu, E.; Wu, X.; Cui, T.; Chen, J. Factor analysis based impact evaluation of tourist satisfaction in Xishan Forest Park, Kunming City. J. West China For. Sci. 2024, 53, 172–187. [Google Scholar] [CrossRef]
  24. Yung, E.H.K.; Ho, W.K.O.; Chan, E.H.W. Elderly satisfaction with planning and design of public parks in high density old districts: An ordered logit model. Landsc. Urban Plan. 2017, 165, 39–53. [Google Scholar] [CrossRef]
  25. Zheng, X.; Huang, Y.; Xie, Z.; Zheng, A. Quantifying tourist perception of cultural landscapes in traditional towns in China using multimodal machine learning. npj Herit. Sci. 2025, 13, 320. [Google Scholar] [CrossRef]
  26. Zhu, J.; Wang, S.; Ma, H.; Shan, T.; Xu, D.; Sun, F. Nonlinear effect of urban visual environment on residents’ psychological perception—An analysis based on XGBoost and SHAP interpretation model. City Environ. Interact. 2025, 27, 100202. [Google Scholar] [CrossRef]
  27. Gong, S.; Zhang, L.; Zhang, J.; Duan, Y. Rural local landscape perception evaluation: Integrating street view images and machine learning. ISPRS Int. J. Geo-Inf. 2025, 14, 251. [Google Scholar] [CrossRef]
  28. Zhou, X.; Liu, G.; Wu, Y.; Wang, G.; Xu, Y.; Liu, T. XGBoost-SHAP based multi-scale evaluation and nonlinear response of river health in Guangdong Province. Ecol. Indic. 2025, 178, 114138. [Google Scholar] [CrossRef]
  29. Silvey, S.; Liu, J. Sample size requirements for popular classification algorithms in tabular clinical data: Empirical study. J. Med. Internet Res. 2024, 26, e60231. [Google Scholar] [CrossRef] [PubMed]
  30. Liu, Y.; She, J.; Wang, L.; Li, Z.; Guo, Z. Decoding urban flood resilience in the Henan section of the Yellow River Basin: Insights from an XGBoost–SHAP analysis. J. Environ. Manag. 2025, 394, 127632. [Google Scholar] [CrossRef] [PubMed]
  31. Zhang, X.; Chen, J.; Lyu, P.; Zhang, B.; Chin, C.-L.; Ma, C.-K.; Fu, H.; Cui, H. Balancing residents and tourists: Evaluating public building spaces in ancient towns of Fujian, China, using the IPA–Kano model. Buildings 2026, 16, 1851. [Google Scholar] [CrossRef]
  32. Kuang, B.; Yang, H.; Zhu, Y.; Chang, Z. Explaining urban street perception inequities between residents and tourists using interpretable machine learning. PLoS ONE 2026, 21, e0345073. [Google Scholar] [CrossRef] [PubMed]
  33. Chen, J.; Li, X.; Chen, J.; Xu, L.; Feng, H.; Zhu, R. Identifying and prioritising public space demands in historic districts: Perspectives from tourists and local residents in Yangzhou. Land 2025, 14, 1921. [Google Scholar] [CrossRef]
  34. Stylidis, D.; Sit, J.; Biran, A. An exploratory study of residents’ perception of place image: The case of Kavala. J. Travel Res. 2016, 55, 659–674. [Google Scholar] [CrossRef] [PubMed]
  35. Tang, C.; He, S.; He, C.; Xu, J. A study of the correlations between public spaces and residential and tourist behaviors in ethnic villages in Xiangxi. South Archit. 2024, 5, 29–36. [Google Scholar] [CrossRef]
  36. Wang, F.; Zou, X.; Wu, T. Tourist-resident perception differences in historic districts: A case study of Dazhao Historical and Cultural District in Hohhot. Tour. Trib. 2025, 40, 79–90. [Google Scholar] [CrossRef]
  37. Chen, N.; Wang, L.; Xu, T.; Wang, M. Perception of urban street visual color environment based on the CEP-KASS framework. Landsc. Urban Plan. 2025, 259, 105359. [Google Scholar] [CrossRef]
  38. Wu, Y.; Miao, M.; Ding, Z.; Wu, Y.; Zhan, M. Commercial color impact on traditional heritage features in Suzhou Shiquan Historic District. npj Herit. Sci. 2025, 13, 395. [Google Scholar] [CrossRef]
  39. Zhang, G.; Yang, J.; Wu, G.; Hu, X. Exploring the interactive influence on landscape preference from multiple visual attributes: Openness, richness, order, and depth. Urban For. Urban Green. 2021, 65, 127363. [Google Scholar] [CrossRef]
  40. Shamsuddin, S.; Ujang, N. Making places: The role of attachment in creating the sense of place for traditional streets in Malaysia. Habitat Int. 2008, 32, 399–409. [Google Scholar] [CrossRef]
  41. Li, H.; Han, H.; Luo, T.; Liu, J. Evaluation of landsenses satisfaction degree in historical districts and analysis of its spatial characteristics: Taking Zhangzhou Ancient City as an example. Acta Ecol. Sin. 2025, 45, 11589–11601. [Google Scholar] [CrossRef]
  42. Long, Y.; Jiao, S.; Yu, Y.; Xiao, K. An analysis of spatial vitality distribution and formation mechanisms in historical urban areas based on multi-source big data: A case study of Changsha. Front. Archit. Res. 2025, 14, 1727–1749. [Google Scholar] [CrossRef]
  43. Huang, J. The integration of folk culture into community life under modern social conditions: Significance and strategic approaches. Folk Cult. Forum 2025, 5, 65–72. [Google Scholar] [CrossRef]
  44. Lin, M.; Feng, X.; Yu, S.; Wang, Y. The role of the mechanisms of adjustment in moderating the relationship between perceived crowding and satisfaction in urban forest parks. Forests 2023, 14, 1538. [Google Scholar] [CrossRef]
  45. Zhang, Y.; Yu, X.; Anthony, W.I.; Cheng, J.; Yin, S. Research on the influential mechanism between tourists’ crowding perception and emotions for recreation in ancient village scenic spot: A case study of Xidi and Hongcun ancient villages. Hum. Geogr. 2018, 33, 138–146. [Google Scholar] [CrossRef]
  46. Papadopoulou, N.M.; Ribeiro, M.A.; Prayag, G. Psychological determinants of tourist satisfaction and destination loyalty: The influence of perceived overcrowding and overtourism. J. Travel Res. 2023, 62, 644–662. [Google Scholar] [CrossRef]
  47. Nickerson, N.P.; Jorgenson, J.; Boley, B.B. Are sustainable tourists a higher spending market? Tour. Manag. 2016, 54, 170–177. [Google Scholar] [CrossRef]
Figure 1. Location map.
Sustainability 18 07919 g001
Figure 2. Research framework diagram.
Sustainability 18 07919 g002
Figure 3. Feature importance and distribution of feature SHAP values for residents. (a) SHAP feature importance ranking; (b) SHAP beeswarm plot.
Sustainability 18 07919 g003
Figure 4. Feature importance and distribution of feature SHAP values for tourists. (a) SHAP feature importance ranking; (b) SHAP beeswarm plot.
Sustainability 18 07919 g004
Figure 5. SHAP dependence plots of key factors for residents. (a) Color harmony; (b) Local cultural embodiment; (c) Crowd density; (d) Spatial comfort; (e) Memory identity; (f) Space openness.
Sustainability 18 07919 g005
Figure 6. SHAP dependence plots of key factors for tourists. (a) Spatial comfort; (b) Space openness; (c) Color harmony; (d) Crowd density.
Sustainability 18 07919 g006
Figure 7. Main and interaction effects of perception factors affecting public space satisfaction. (a) Residents; (b) Tourists.
Sustainability 18 07919 g007
Figure 8. SHAP interaction matrix of perception factors influencing public space satisfaction. (a) Residents; (b) Tourists.
Sustainability 18 07919 g008
Figure 9. Dominant SHAP interaction dependence plots of perception factors for residents. (a) Color harmony × Business prosperity; (b) Space openness × Spatial comfort; (c) Color harmony × Spatial comfort; (d) Local cultural embodiment × Crowd density.
Sustainability 18 07919 g009
Figure 10. Dominant SHAP interaction dependence plots of perception factors for tourists. (a) Spatial comfort × Color harmony; (b) Crowd density × Public awareness; (c) Spatial comfort × Crowd density; (d) Space openness × Color harmony.
Sustainability 18 07919 g010
Table 1. Perception factors of public spaces in historic town.
LayerIndicators
Cultural valueSense of space history (X1)
Richness of historical elements (X2)
Local cultural embodiment (X3)
Social identityMemory identity (X4)
Public awareness (X5)
Townscape harmonyStylistic integrity (X6)
Color harmony (X7)
Environmental featuresSpace openness (X8)
Green coverage (X9)
Noise level (X10)
Functional featuresAccessibility (X11)
Spatial comfort (X12)
Crowd density (X13)
Activity richness (X14)
Business prosperity (X15)
Facility completeness (X16)
Table 2. The optimal hyperparameters of XGBoost.
The Optimal HyperparametersValue (Residents)Value (Tourists)
n_estimators250390
learning_rate0.0280.095
max_depth44
min_child_weight21
subsample0.860.95
colsample_bytree0.560.6
gamma0.850.5
reg_alpha0.5520.9
reg_lambda4.54.5
Table 3. Independent sample t-test results.
IndicatorsGroupingMeanGroup Difference
X5 Public awarenessResidents3.75 (1.097)Residents > Tourists
Tourists2.87 (1.277)
X8 Space opennessResidents3.97 (0.967)Residents > Tourists
Tourists3.34 (1.092)
X11 AccessibilityResidents4.12 (0.936)Residents > Tourists
Tourists3.32 (0.913)
X13 Crowd densityResidents3.15 (1.110)Residents < Tourists
Tourists3.60 (0.839)
X15 Business prosperityResidents2.83 (1.123)Residents < Tourists
Tourists3.23 (0.878)
Y SatisfactionResidents3.73 (0.770)
Tourists3.79 (0.734)
Disclaimer/Publisher’s Note: The statements, opinions and data contained in all publications are solely those of the individual author(s) and contributor(s) and not of MDPI and/or the editor(s). MDPI and/or the editor(s) disclaim responsibility for any injury to people or property resulting from any ideas, methods, instructions or products referred to in the content.