Article

Dynamic Characteristics of EICP-Stabilized Fiber-Reinforced Sand Under SHPB Loading

1
Institute of Port, Coastal, and Offshore Engineering, Ocean College, Zhejiang University, Zhoushan 316021, China
2
Russian–Chinese Education and Research Center of System Pathology, South Ural State University, 76 Lenin Prospekt, 454080 Chelyabinsk, Russia
3
Department of Building Materials and Products, Institute of Architecture and Construction, South Ural State University, 76 Lenin Prospekt, 454080 Chelyabinsk, Russia
*
Author to whom correspondence should be addressed.
Sustainability 2026, 18(15), 7903; https://doi.org/10.3390/su18157903
Submission received: 1 June 2026 / Revised: 14 July 2026 / Accepted: 23 July 2026 / Published: 4 August 2026
(This article belongs to the Section Green Building)

Abstract

Calcareous sand is widely used in marine and island reef engineering; however, its low strength and severe particle breakage are further exacerbated under dynamic loading, making the dynamic performance of reinforced calcareous sand critical to engineering safety. Nevertheless, research on the dynamic characteristics of EICP/MICP-reinforced calcareous sand remains very limited. The dynamic performance was evaluated using Split Hopkinson Pressure Bar (SHPB) tests, and the results were compared with UCS data to examine the effects of particle gradation and fiber content on both dynamic and static behaviors. The results show that dynamic strength increases with calcium carbonate content (CCC) and impact pressure. Under the same CCC, the dynamic strength is consistently higher than the static strength, with a maximum difference of up to 2.5 MPa. Fiber incorporation significantly enhances structural integrity, and SEM analysis reveals that this improvement stems from effective bonding between fibers and cementitious materials. Based on the static and dynamic test results, the optimal mix ratio for EICP-reinforced calcareous sand is determined as 50% coarse sand content and 0.4% fiber content by mass, which provides theoretical support and design parameters for sustainable green reinforcement of calcareous sand foundations in marine and island reef engineering.

1. Introduction

The development of islands and reefs is a critical engineering strategy for expanding maritime territory and securing strategic energy channels. Since island and reef projects are generally located in remote areas far from the mainland, the transportation of construction materials incurs high economic and time costs. Accordingly, calcareous sand derived from coral reef sediments is widely adopted as a local filling material [1,2,3]. Nevertheless, calcareous sand particles exhibit high biogenic porosity (45–60%) and their uniaxial compressive strength is only one-third that of quartz sand [4]. These mechanical weaknesses under dynamic loading significantly limit its practical application.
Engineering practices indicate that conventional pile foundation design methodologies are not directly applicable to calcareous sand grounds [5]. Moreover, vibro-compaction techniques may cause significant construction disturbance to island and reef regions, which are characterized by limited land area and highly fragile ecological environments [6]. In contrast, chemical grouting often involves hazardous materials like cement or epoxy resins, posing risks of environmental pollution such as soil and groundwater contamination, volatile emissions, and wider ecological damage [7]. Regarding the environmental footprint, enzyme-induced carbonate precipitation (EICP) demonstrates remarkable advantages over cement-based grouting. The cement industry accounts for approximately 8% of global anthropogenic CO2 emissions [8], whereas EICP is conducted under ambient temperature conditions without requiring high-temperature calcination, resulting in total carbon emissions that are roughly one order of magnitude lower than those of cement production [9]. Furthermore, the ammonia by-product generated during the EICP process can be effectively mitigated by adjusting the pH of the reaction solution [10]. These low-carbon and low-toxicity characteristics render EICP a highly promising and environmentally sustainable reinforcement solution for ecologically fragile island and reef environments [11].
Owing to its environmental compatibility, cost-effectiveness, and operational simplicity, As sustainable alternatives that balance environmental and economic concerns, biomimetic technologies using Microbially Induced Carbonate Precipitation (MICP) and Enzyme-Induced Calcium Carbonate Precipitation (EICP) have attracted growing interest in geotechnical engineering. MICP, first proposed by Whiffin (2004) [12], utilizes bacterial urease to catalyze urea hydrolysis, inducing calcium carbonate precipitation [13,14,15,16,17,18,19,20,21]. Differently, EICP employs free urease extracted from plants to hydrolyze urea [22,23,24,25,26,27,28,29,30,31]. Although the urease sources differ, their mineralization mechanisms are essentially identical: urease hydrolyzes urea to produce carbonate ions, which react with calcium ions to form CaCO3 precipitates that fill soil pores and bind sand particles, thereby enhancing mechanical properties. The simplified reaction sequence is as follows [32]:
CO(NH2)2 + H2O → 2NH3 + CO2
2NH3 + 2H2O ↔ 2NH4+ + 2OH
CO2 + 2OH ↔ HCO3 + OH ↔ CO32− + H2O
Ca2+ + CO32− → CaCO3
Extensive studies have confirmed the application potential of MICP/EICP in concrete repair [33], slope stabilization [34,35], foundation reinforcement [36], water cutoff curtains [37], and sand fixation and water retention [38,39,40,41,42,43]. In terms of mechanical properties, research on UCS under static loading is relatively well established; for instance, the addition of admixtures such as fibers and biochar can achieve UCS values of 1.5–6.34 MPa [44,45,46,47]. However, studies on EICP/MICP-treated sand under dynamic loading are extremely limited. Lv et al. (2025) [48] performed SHPB tests on MICP-reinforced lime sand and found that its strength increased exponentially with strain rate. Li et al. (2024) [49] used a two-phase method to reinforce ISO standard sand. After six cementation treatments, the dynamic strength of the specimens increased by approximately 300% on average.
Although the mechanical properties of MICP/EICP-treated sand under static loading have been extensively investigated, their dynamic response characteristics remain insufficiently understood. Existing dynamic property data have been predominantly obtained through low-strain-rate dynamic triaxial tests [50], whereas island and reef engineering projects, which are frequently subjected to extreme loads such as typhoons, earthquakes, and aircraft landing impacts [50,51,52,53], are more suitably characterized using the split Hopkinson pressure bar (SHPB). To date, the only available SHPB studies have been limited to uniformly graded silica sand or standard sand, and the combined effects of particle gradation and fiber reinforcement on both static and dynamic strengths have not been systematically quantified [54]. These research gaps are particularly critical for island reef airfields and coastal infrastructure that are repeatedly exposed to extreme dynamic disturbances.
To address these issues, this study focuses on EICP-treated calcareous sand and systematically investigates the effects of different fiber contents and three particle size distributions on static and dynamic strength through UCS and SHPB tests. A quantitative relationship between calcium carbonate content and macroscopic mechanical responses is established, and the synergistic reinforcement mechanisms are elucidated through microstructural analysis. This study aims to provide an environmentally friendly and reliable ground improvement strategy for island reef engineering.

2. Materials and Methods

2.1. EICP Solution Preparation

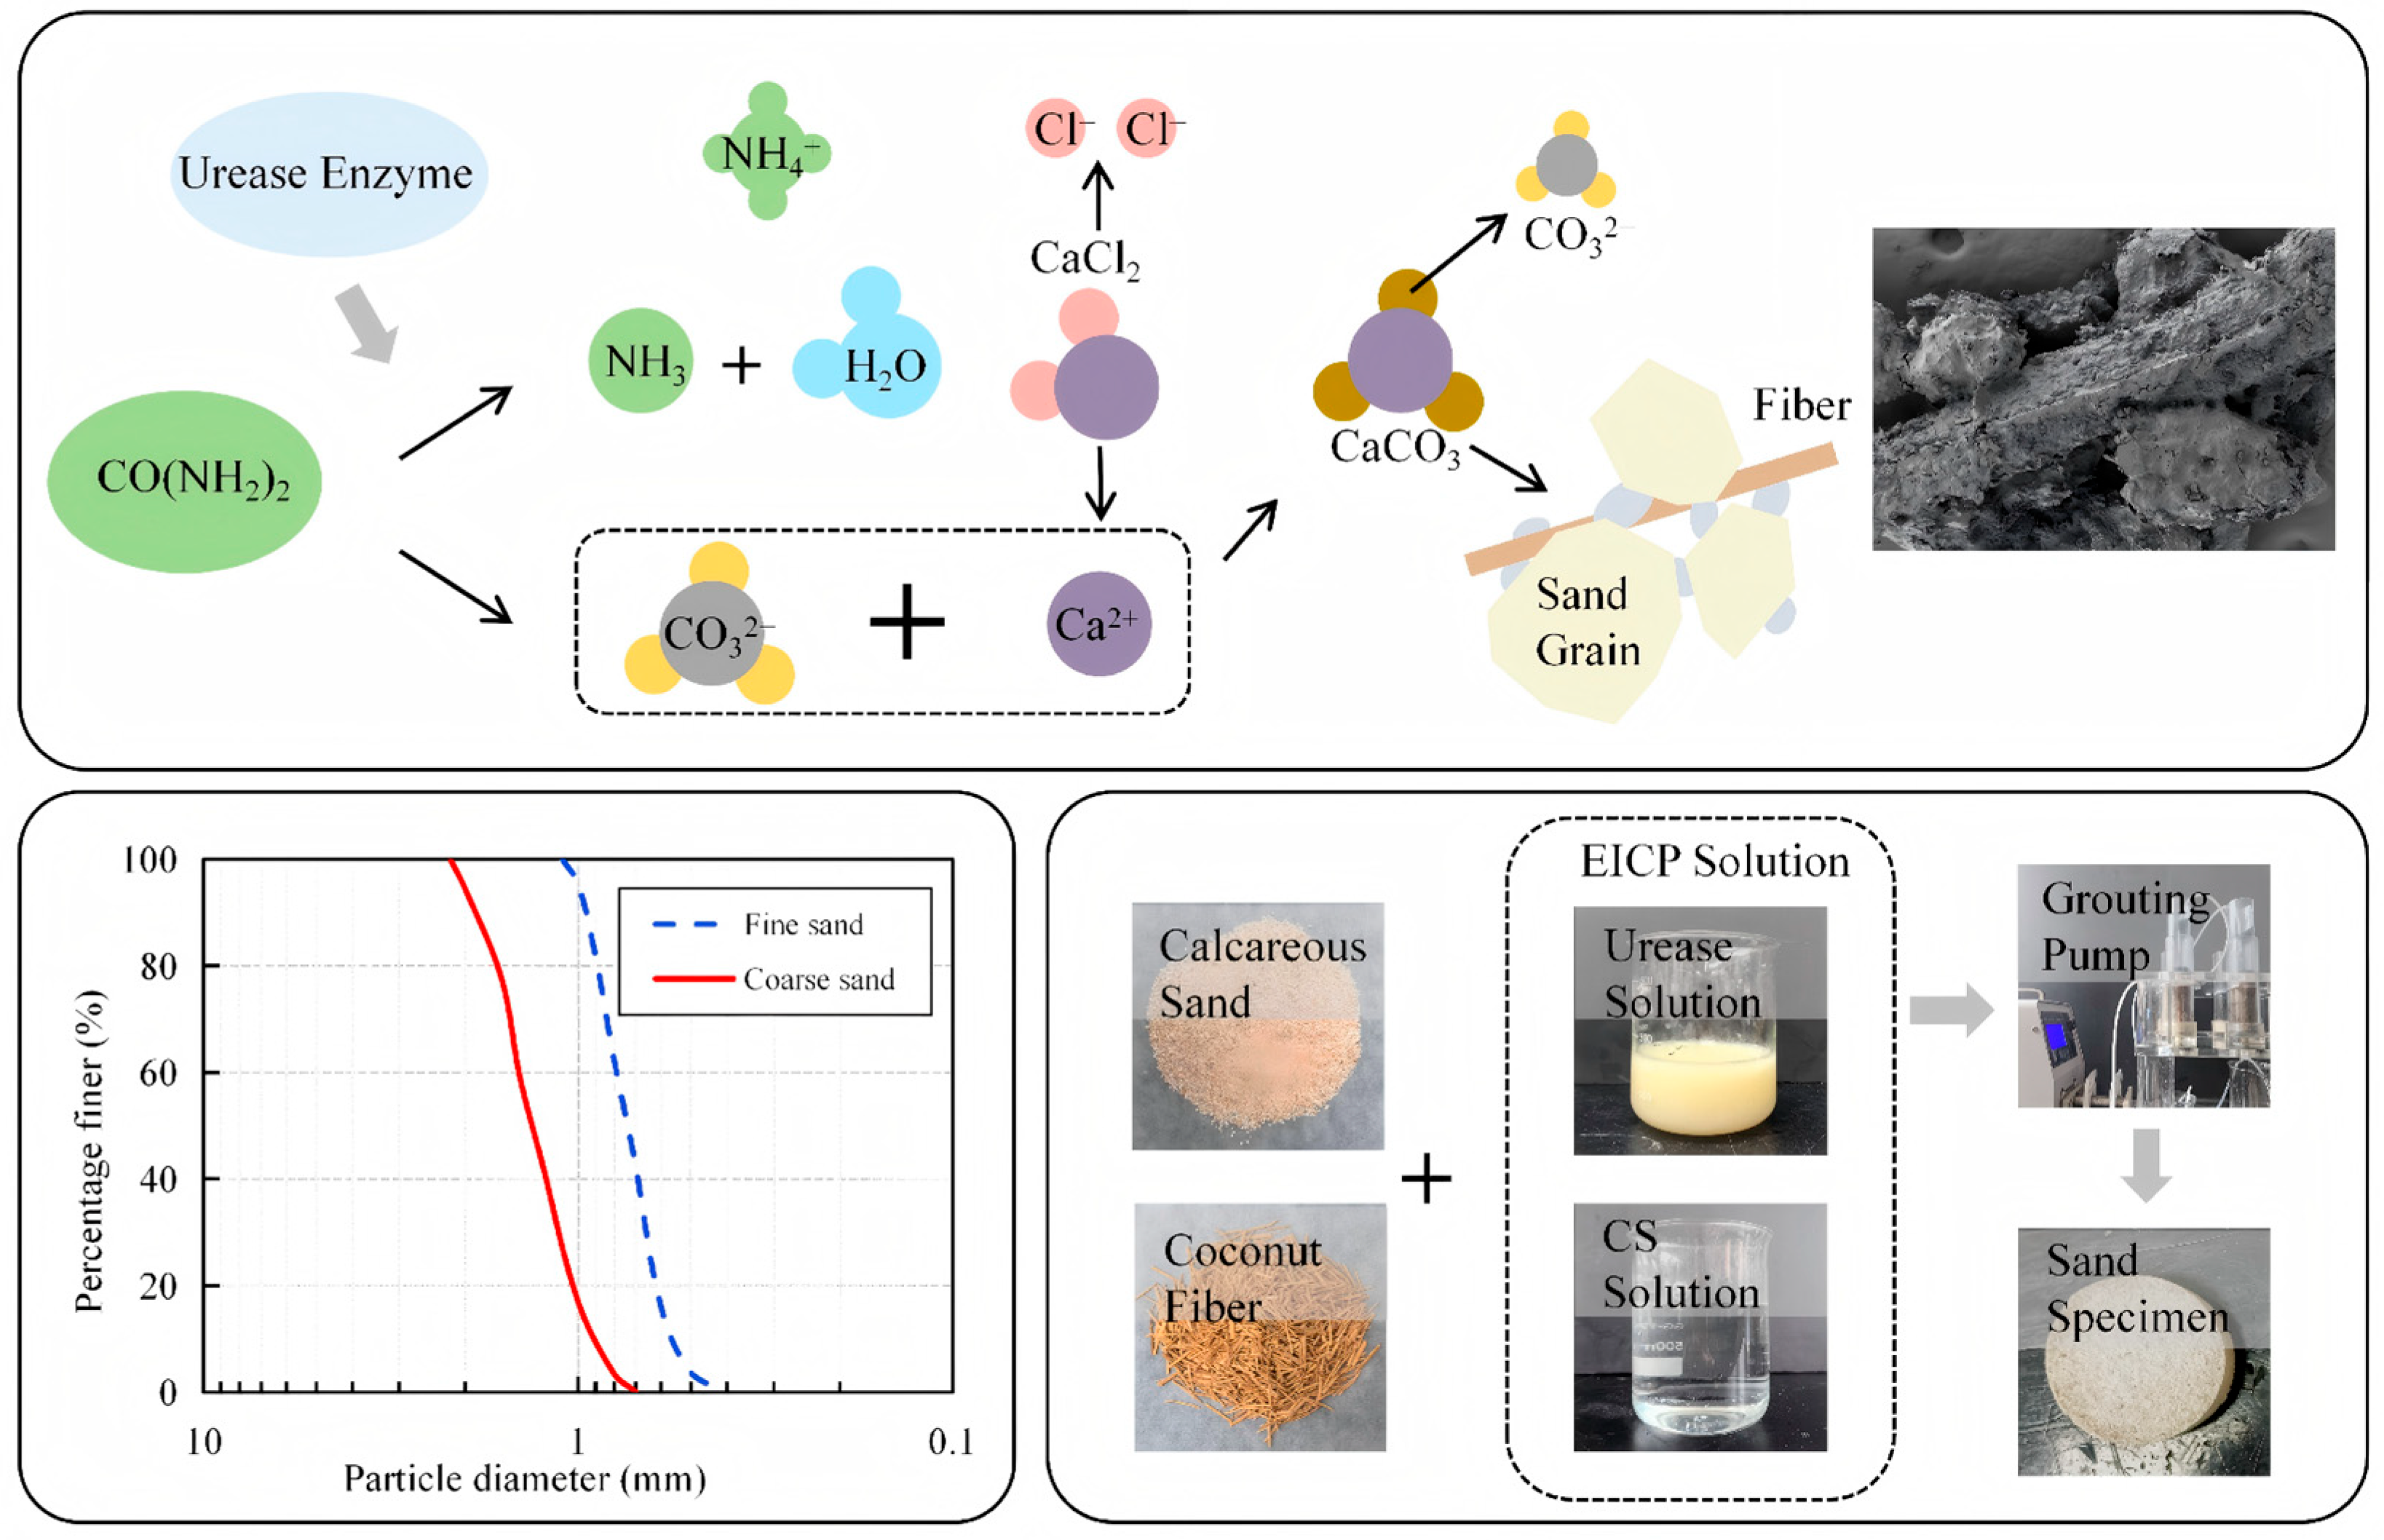
The EICP solution used in this experiment was prepared by mixing a cementation solution (CS), consisting of 1.2 mol/L CaCl2 solution and urea solution of equal concentration, with a urease solution at a volume ratio of 1:1. The detailed procedure for preparing the urease solution followed Gao et al. [55]. The process was as follows: dried soybeans obtained from a local market were ground into powder using a mill and sieved through a 0.2 mm mesh to ensure uniform particle size. Seventy grams of soybean flour was then added to 1 L of deionized water and stirred with a magnetic stirrer for 30 min to obtain a uniform suspension. The suspension was refrigerated at 4 °C for 24 h. After settling, the upper solution was collected and centrifuged at 4 °C and 3000 r/min for 15 min. The resulting supernatant was used as the soybean urease solution. The urease activity of the solution used in this experiment was measured to be approximately 11.8 mmol/(L·min) at room temperature (20 °C). The preparation of EICP reinforcement specimen and its mechanism diagram are shown in Figure 1. In the mechanism diagram, the calcium carbonate cementation between the contact points of particles is highlighted to emphasize the dominant cementation effect at these contact points. In the actual experiment, CaCO3 is simultaneously distributed at the particle contacts in a bridging form, and also exists in the pores and on the particle surfaces in a filling and coating form. This schematic diagram does not represent the only form of the actual deposition morphology.

2.2. Calcareous Sand

The calcareous sand used in this study was purchased from a commercial supplier (a local company in Henan, China) and originated from the South China Sea. Previous studies have reported that calcareous sands from this region have calcium carbonate (CaCO3) contents exceeding 97%, with aragonite and high-magnesium calcite identified as the primary mineral phases [1]. Following the approach of Jiang et al. [56], the sand was divided into two groups: fine sand with particle sizes of 0.5–1 mm and coarse sand with particle sizes of 1–2 mm. The coefficients of curvature (Cc) and uniformity (Cu) for the fine sand are 0.98 and 1.43, respectively, while those for the coarse sand are 0.98 and 1.61, respectively. Figure 1 shows the particle size distribution curves for coarse sand and fine sand.

2.3. Coconut Fiber

Based on the environmental protection requirements of the South China Sea region, natural coir fibers were adopted to enhance the specimen strength, as their renewable characteristics and low environmental impact of degradation products align with the concept of sustainable development. According to the study by Kou et al. [57], the Young’s modulus of coir fiber ranges from 2.5 to 6.0 GPa, and its tensile strength ranges from 108 to 252 MPa. Natural coconut fiber used in this experiment was first washed with deionized water to remove surface lignin and lipid impurities, then dried in an oven to a moisture content ≤ 2%. This treatment prevented organic residues from inhibiting subsequent EICP reactions. To improve fiber dispersion and interfacial bonding, the fibers were cut to a length of 5 mm, which minimizes agglomeration caused by excessive fiber length while allowing cross-lapping to form a spatial network structure [58,59].

2.4. Treatment Methods

In this experiment, EICP-reinforced sand columns were prepared using the unsaturated grouting method. The specific physical properties of the sand columns are listed in Table 1, with specimen numbers detailed in Table 2. The abbreviations used in this paper are summarized at the end of the paper for reference.
Each reinforcement cycle consisted of pre-mixed grouting and CS cyclic grouting. The pre-mixed solution comprised 30 mL of urease solution and 30 mL of CS, whereas the cyclic grouting solution contained 60 mL of CS. The preparation process was as follows: 68 g of calcareous sand was prepared with coarse-to-fine ratios of 1:0, 1:1, or 0:1, where the coarse fraction ranged from 1–2 mm and the fine fraction from 0.5–1 mm. A predetermined fiber content (0%, 0.2%, or 0.4% by weight) was then mixed uniformly into the sand. After thorough mixing, the prepared sand mixture was transferred into a cylindrical mold. The pre-mixed solution was then poured onto the top surface of the sand column, and the effluent collected from the bottom was recirculated to the top approximately ten times to ensure uniform infiltration throughout the specimen. Finally, CS grout was injected through the column from top to bottom using a peristaltic pump at a constant flow rate of 10 mL/min to complete the circulation process. After 24 h, the first reinforcement cycle was completed. The number of reinforcement cycles set in this study was 2–4, so the samples after 48 h of reinforcement cycles has been marked as the sample with 2 treatment times. For UCS tests, two parallel specimens were prepared for each condition, this sample size is consistent with previous studies [60] on bio-cemented sands. For SHPB tests, nine parallel specimens were prepared for each treatment condition.
After reinforcement, the specimens were removed from the acrylic molds, gently rinsed with deionized water to remove residual soluble salts, and oven-dried at 65 °C for 24 h. The final specimens were cylindrical, with a diameter of 50 mm and a height of 25 mm. The final specimens were cylindrical, with a diameter of 50 mm and a height of 25 mm. The dry density of the specimens was determined by the ratio of the dry mass to the total volume, yielding a value of approximately 1.39 g/cm3. Based on the specific gravity of the calcareous sand (Gs = 2.76) [1] and the measured dry density, the initial void ratio was calculated to be approximately 1.00. This relatively high void ratio is consistent with the characteristic porous nature of calcareous sands and falls within the typical range reported for such materials. The initial porosity was accordingly calculated to be approximately 50%.

2.5. Unconfined Compression Strength (UCS) Test

Dried EICP-reinforced sand column specimens were end-trimmed and tested using a universal testing machine at a loading rate of 1.0 mm/min in accordance with the geotechnical test standard GB/T 50123-2019 [61]. The test was terminated when a stable residual stress appeared, and the peak axial stress was taken as the UCS value. Two parallel specimens were tested for each reinforcement condition, and the average value was adopted as the final test result.

2.6. Split Hopkinson Pressure Bar (SHPB) Test

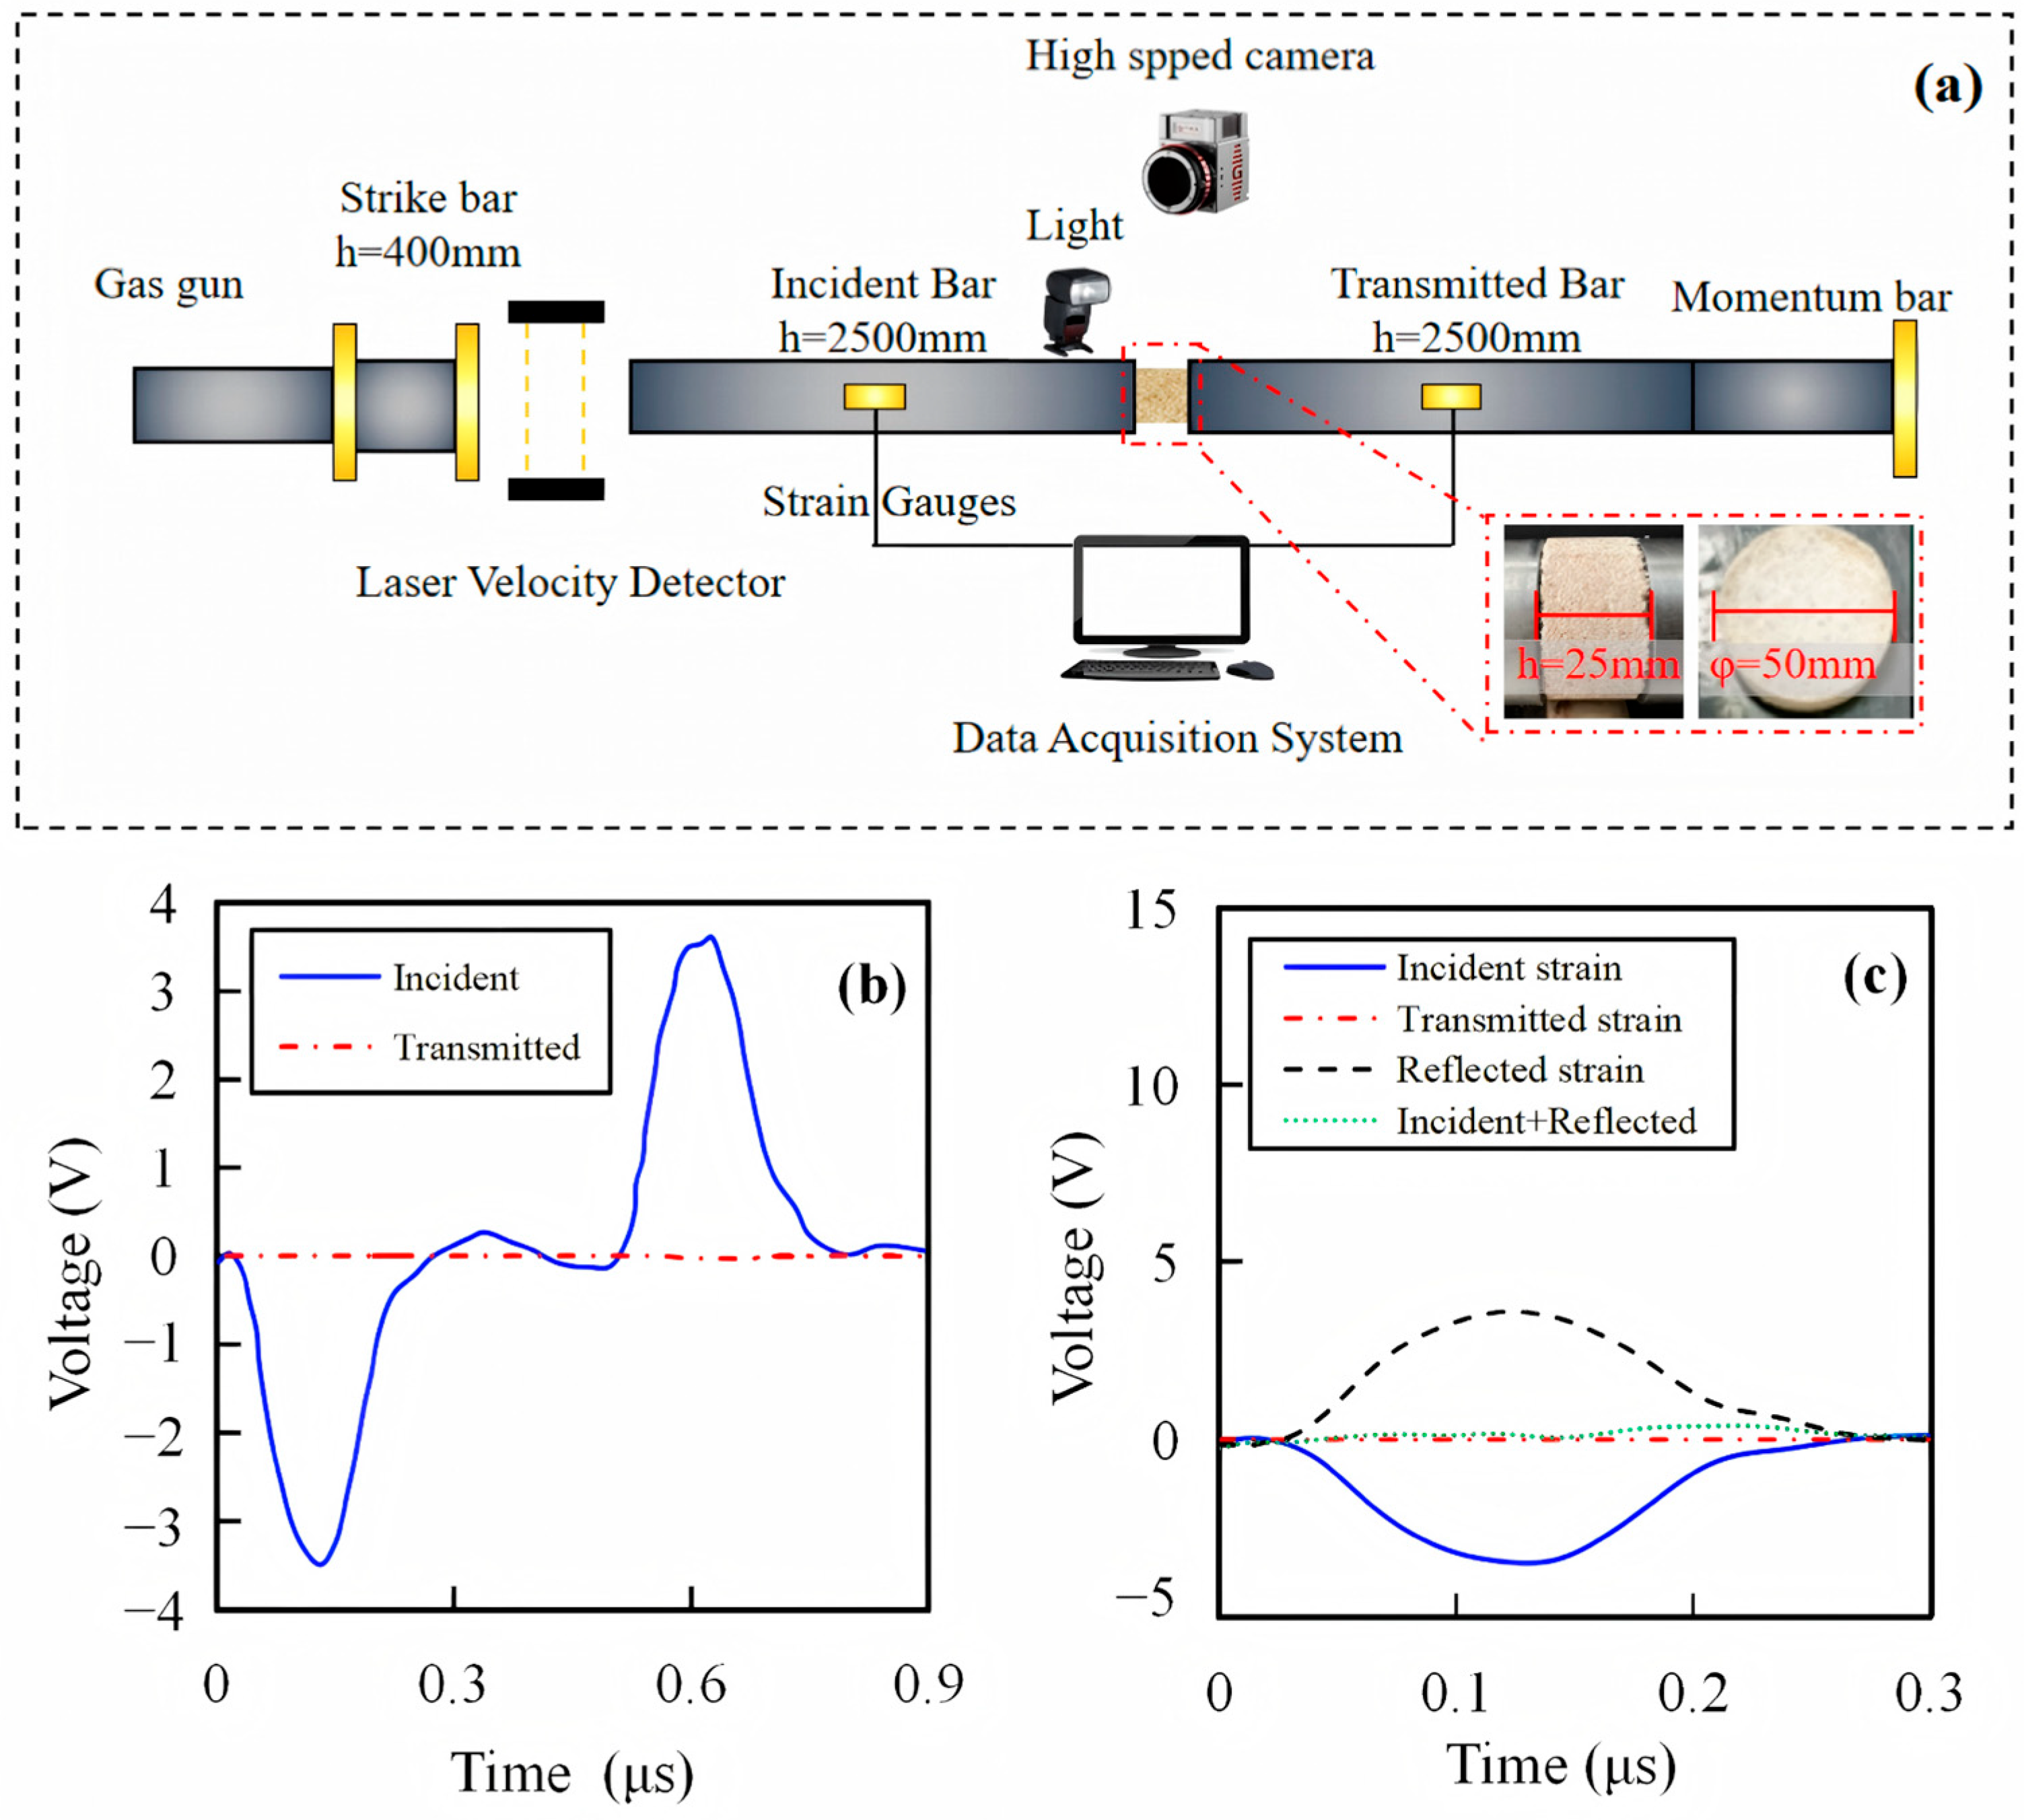
The split Hopkinson pressure bar (SHPB) test is a well-established technique for evaluating the dynamic mechanical behavior of materials subjected to high strain rates. The experimental apparatus consisted of an incident bar, a transmission bar, a specimen clamping system, and a high-speed data acquisition system. The incident bar and transmission bar are a pair of high-precision cylindrical metal rods, both fabricated from high-strength alloy steel to ensure their elastic properties and low stress wave attenuation [62]. At the beginning of the experiment, a strike bar is launched at high velocity to impact one end of the incident bar. The kinetic energy from the strike bar is converted into a compressive stress wave that travels along the incident bar. This stress wave acts as the excitation source for the experiment, moving through the incident bar and reaching the specimen positioned at its center, where it imparts the impact. The stress wave then propagates into the transmission bar, traveling along it as an elastic wave. The transmission bar ensures the stable propagation of this wave, preventing any distortion. Pulse shaping technique was implemented by employing a spindle-shaped striker, which effectively mitigates waveform dispersion, facilitates dynamic stress equilibrium, and enables approximately constant strain-rate loading on the brittle EICP-reinforced calcareous sand specimens. The incident bar and transmission bar had lengths of 400 mm and 2500 mm, respectively, with a diameter of 50 mm. The bar material had a density of 7880 kg/m3 and an elastic modulus of 210 GPa. The longitudinal wave velocity was 5172 m/s.
During testing, the EICP-reinforced calcareous sand specimen was carefully positioned between the incident and transmission bars. A pneumatic launcher propelled a bullet against the free end of the incident bar, generating an incident stress wave. Upon reaching the specimen–bar interface, part of the wave was reflected back into the incident bar, while the remainder was transmitted through the specimen into the transmission bar. High-sensitivity strain gauges attached to the surfaces of both bars simultaneously recorded the time histories of the incident, reflected, and transmitted waves (Figure 2a).
According to the one-dimensional elastic wave theory and assuming stress equilibrium, the difference between the incident and reflected wave amplitudes was used to calculate the average strain rate within the specimen. The amplitude of the transmitted wave was then used to determine the dynamic stress, allowing the construction of dynamic stress–strain curves. The formula is as follows:
σ t   =   E A A s ε t t
ε ˙ t = 2 C 0 L ε r t
ε t = 2 C 0 L 0 t ε τ τ d τ
where ε t denotes the strain in the output bar caused by the transmitted pulse, while ε r represents the strain in the output bar induced by the reflected pulse. E , A and C 0 stand for Young’s modulus, the cross-sectional area, and the elastic wave velocity of the pressure bars, respectively. A s and L are the cross-sectional area and length of the specimen, respectively. Equation (5) indicates that the dynamic stress is proportional to the transmitted strain amplitude; Equation (6) shows that the strain rate is determined by the reflected strain amplitude, with the negative sign indicating opposite wave direction; and Equation (7) obtains the cumulative dynamic strain by integrating the reflected strain history.
A prerequisite for valid SHPB data reduction is dynamic stress equilibrium during loading. According to one-dimensional elastic wave theory, this requires
ε i ( t ) + ε r ( t ) =   ε t ( t )
where ε i   ε r and ε t represent the amplitudes of the incident stress wave, the reflected stress wave, and the transmitted stress wave, respectively.
Figure 2b presents the original SHPB waveforms, while Figure 2c compares the stress histories at both specimen ends, calculated from ε i ( t )   +   ε r ( t ) and ε t ( t ) . The close agreement between the two curves throughout loading confirms that dynamic stress equilibrium was achieved and maintained, validating the recorded data and ensuring the reliability of the derived parameters [63,64].

2.7. Determination of Calcium Carbonate Content

As the acid-washing method is fundamentally based on dissolving calcium carbonate with hydrochloric acid and measuring the resulting mass loss of the insoluble residue to determine the calcium carbonate content, its application is not feasible for calcareous sand substrates. Since the substrate used in this study is itself a carbonate mineral, this method can only measure the total calcium carbonate content and cannot isolate the incremental portion actually precipitated during the EICP process. Therefore, in this study, a mass comparison method was adopted to determine the amount of calcium carbonate precipitated. After the consolidation process is completed, the specimen is removed from the mold and gently rinsed with deionized water to eliminate any residual soluble salts. The specimen is then placed in an oven at 70 °C and dried for 24 h under constant-temperature conditions. Once drying is complete, the specimen is weighed, then the calcium carbonate content can be calculated by subtracting the mass of the original calcareous sand and the mass of the fibers from the total dry mass of the specimen.

2.8. Micro Structure Analysis

A small amount of sand was extracted from the sand column model, dried in an oven at 65 °C, and observed under a scanning electron microscope to evaluate the effectiveness of EICP reinforcement from a microscopic perspective. The electron microscope used in the experiment was a Zeiss Sigma 500 electron scanning microscope (Carl Zeiss Microscopy GmbH, Jena, Germany), with a working distance ranging from 1 to 50 mm. At an accelerating voltage of 1 kV, the resolution is 1.6 nm, and at 15 kV, it can reach 0.8 nm. The magnification ranges from 12 to 1,000,000 times, with an accelerating voltage range of 0.02 kV to 30 kV. The electron gun is a Schottky hot-field emission gun. The electron beam current is 5 pA to 20 nA, with a beam stability better than 0.2%/h and noise resistance better than 1%/h. The column features a magnetic-free design, ensuring imaging of ferromagnetic materials and enabling high-resolution imaging of ferromagnetic substances.

3. Results and Discussion

3.1. Fragmentation Characteristics

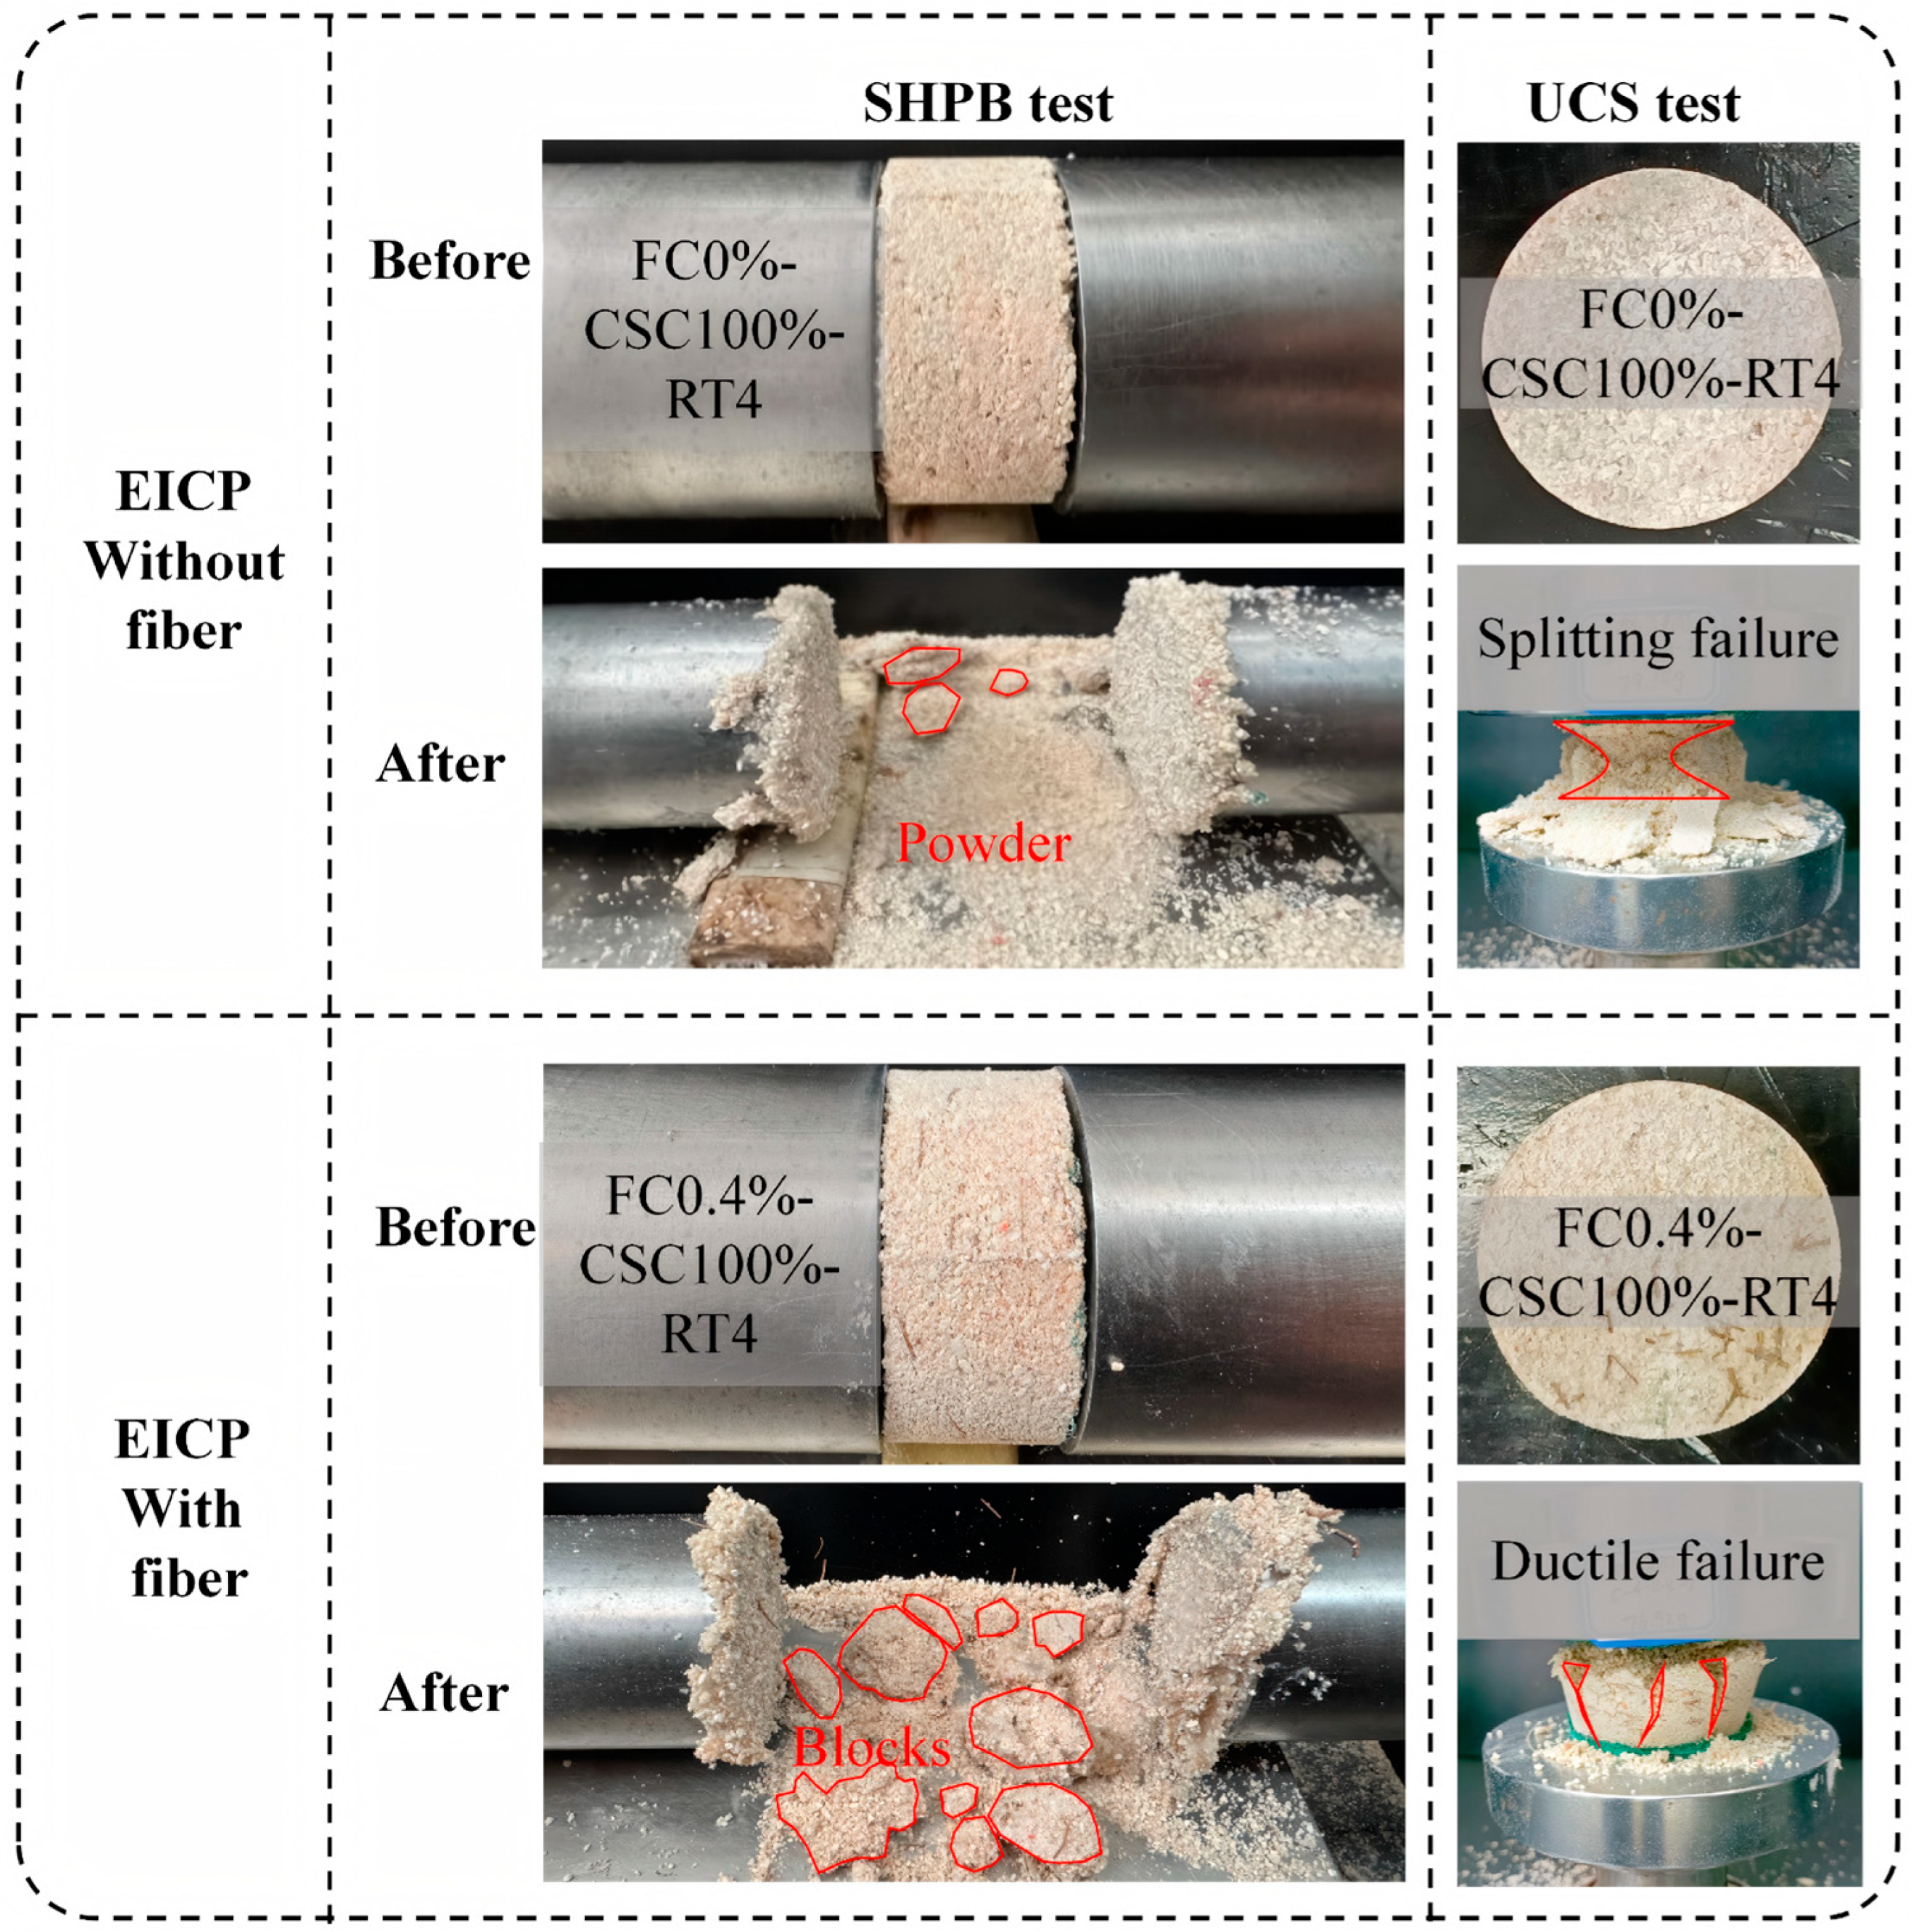
Figure 3 shows specimens fractured during two different testing. The SHPB specimens are shown on the left: the upper-left image shows the specimen without fibers, and the lower-left image shows the specimen with fibers. The UCS specimens are shown on the right: the upper-right image shows the specimen without fibers, and the lower-right image shows the specimen with fibers. During SHPB testing, the specimen without fibers exhibited brittle fracture. Owing to insufficient material strength, these specimens disintegrated completely into fine granular fragments, losing nearly all structural integrity. The specimen with fibers also experienced brittle fracture but exhibited completely different fracture characteristics. Despite the damage, the specimens largely retained their overall integrity, typically forming continuous shear zones or exhibiting longitudinal splitting. The resulting fragments were relatively large and preserved partial features of the original geometry. The same pattern of specimen damage was observed in UCS testing: the specimen without fibers was severely damaged, while the specimens with fibers were locally damaged with only a small amount of sand particles peeled off. This behavior suggests that under extremely high loading rates, stress waves propagate rapidly through the cementitious matrix and particle interfaces. Because the impact energy cannot be dissipated through a limited number of cracks, multiple cracks nucleate and propagate simultaneously, ultimately resulting in pulverized failure. In contrast, fibers bear some of the impact energy, converting it into the tensile deformation energy of fibers, hindering crack propagation, and maintaining the integrity of the fragments.

3.2. The Relationship Between UCS and CCC

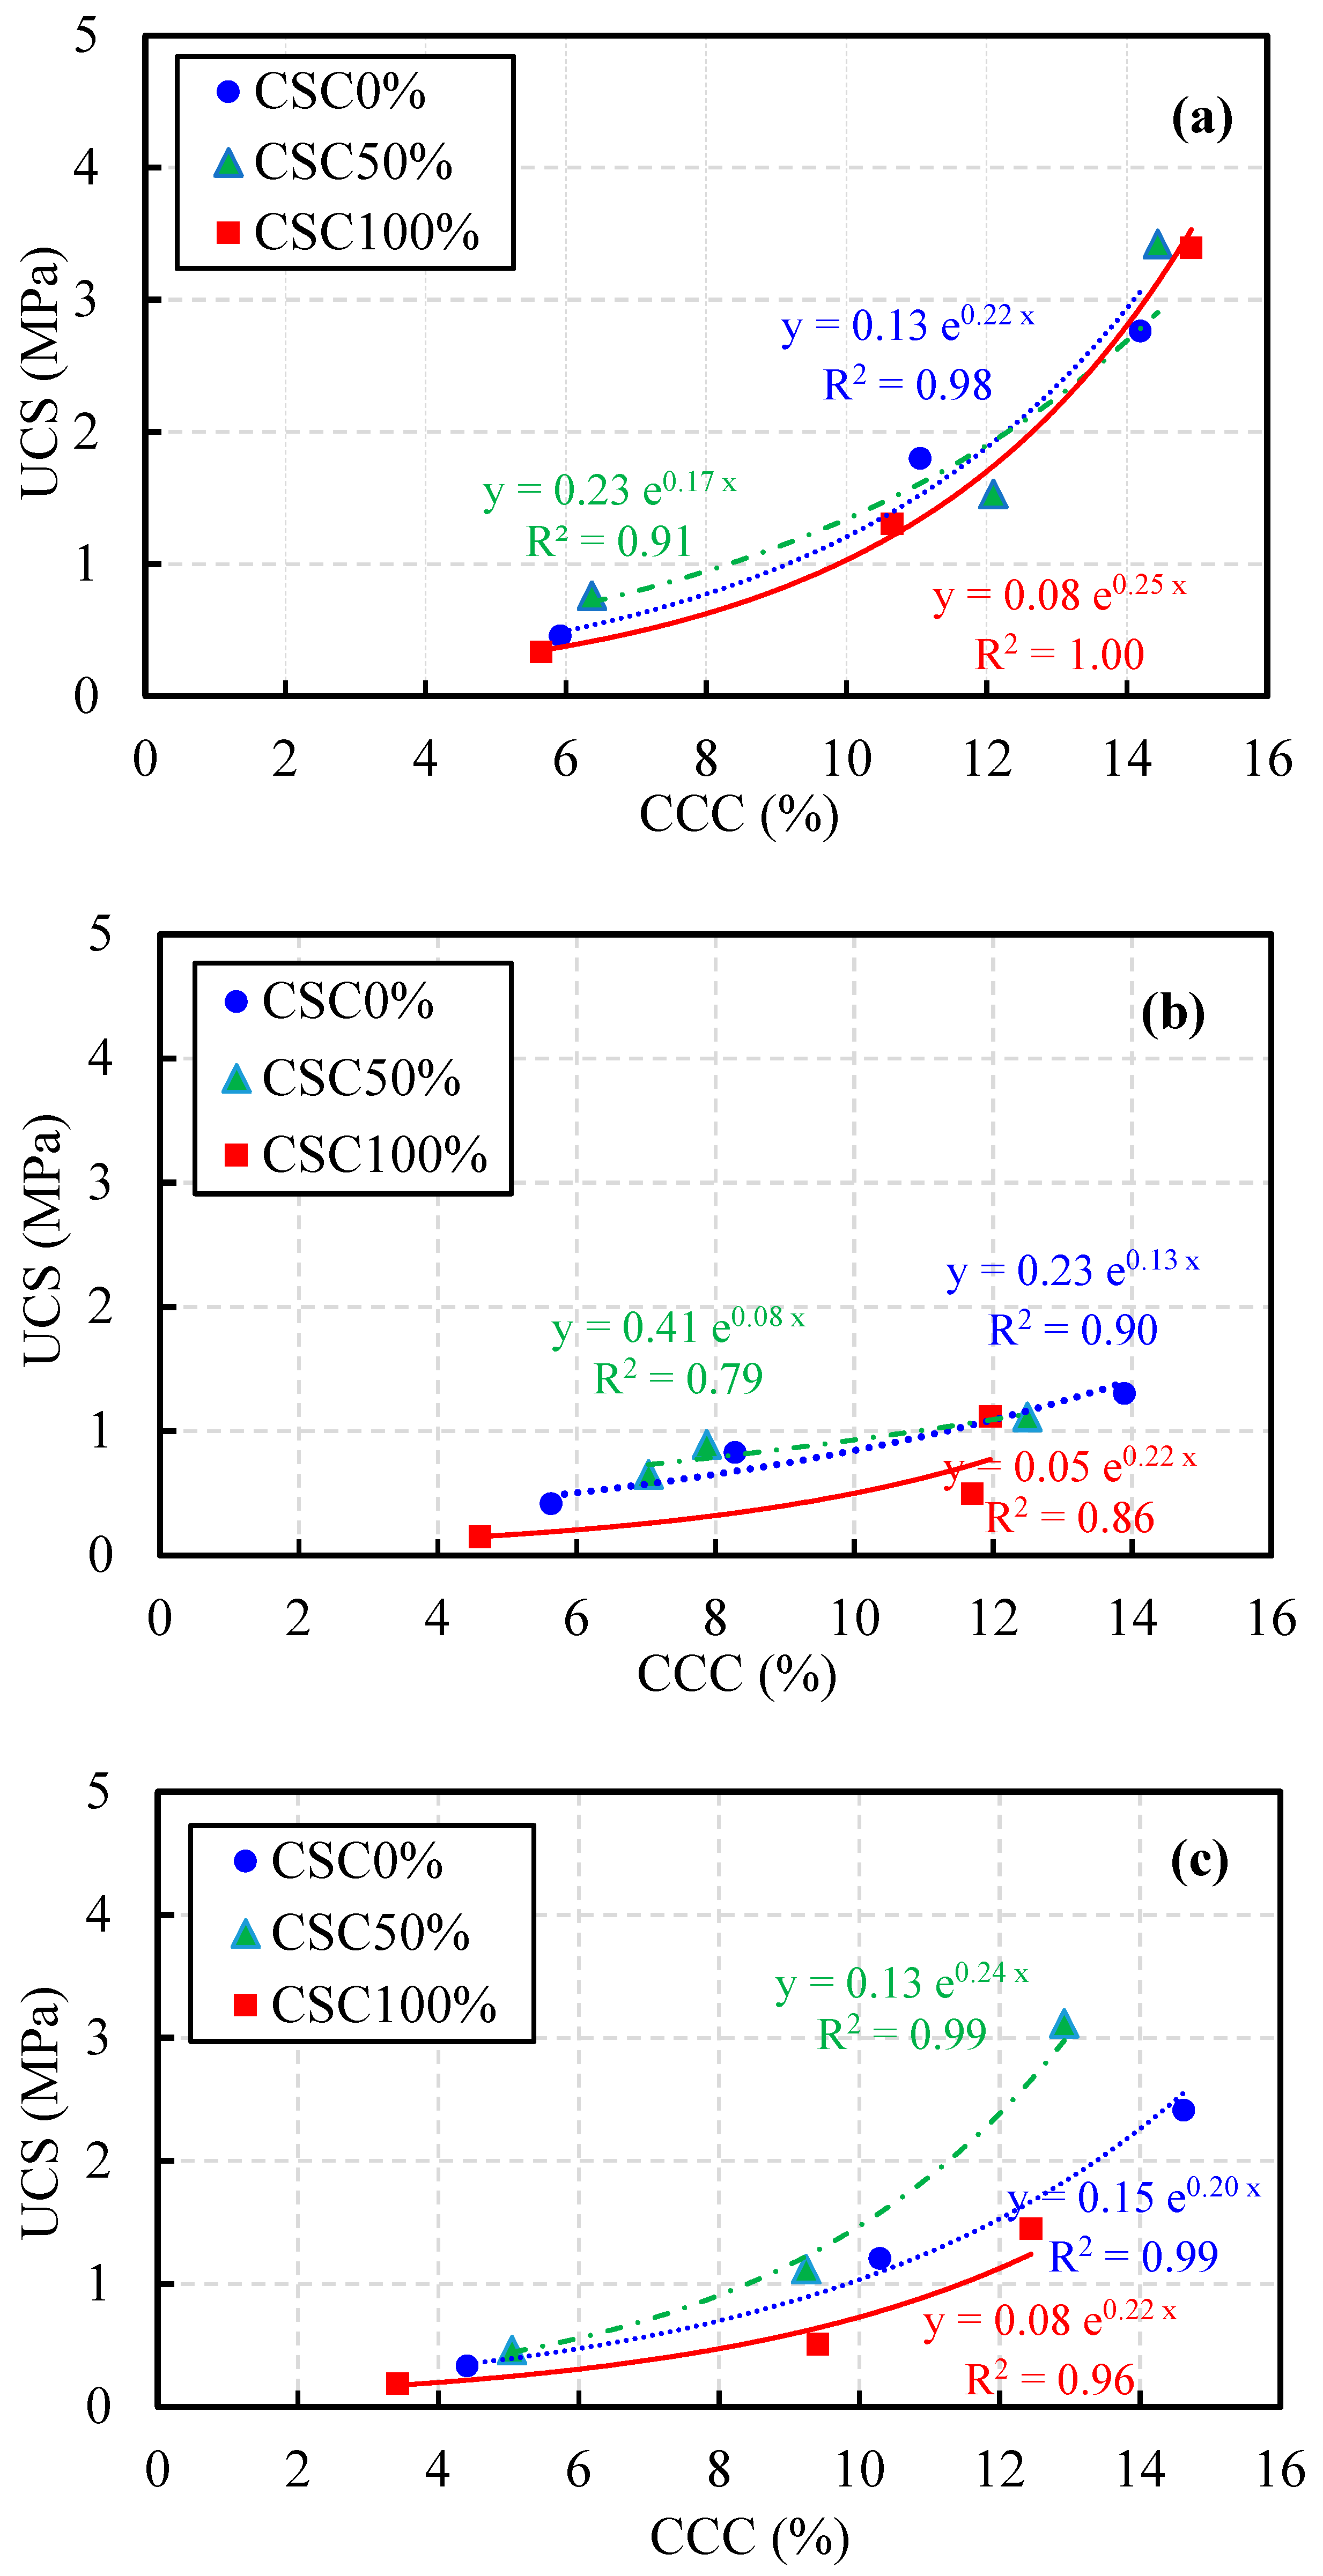
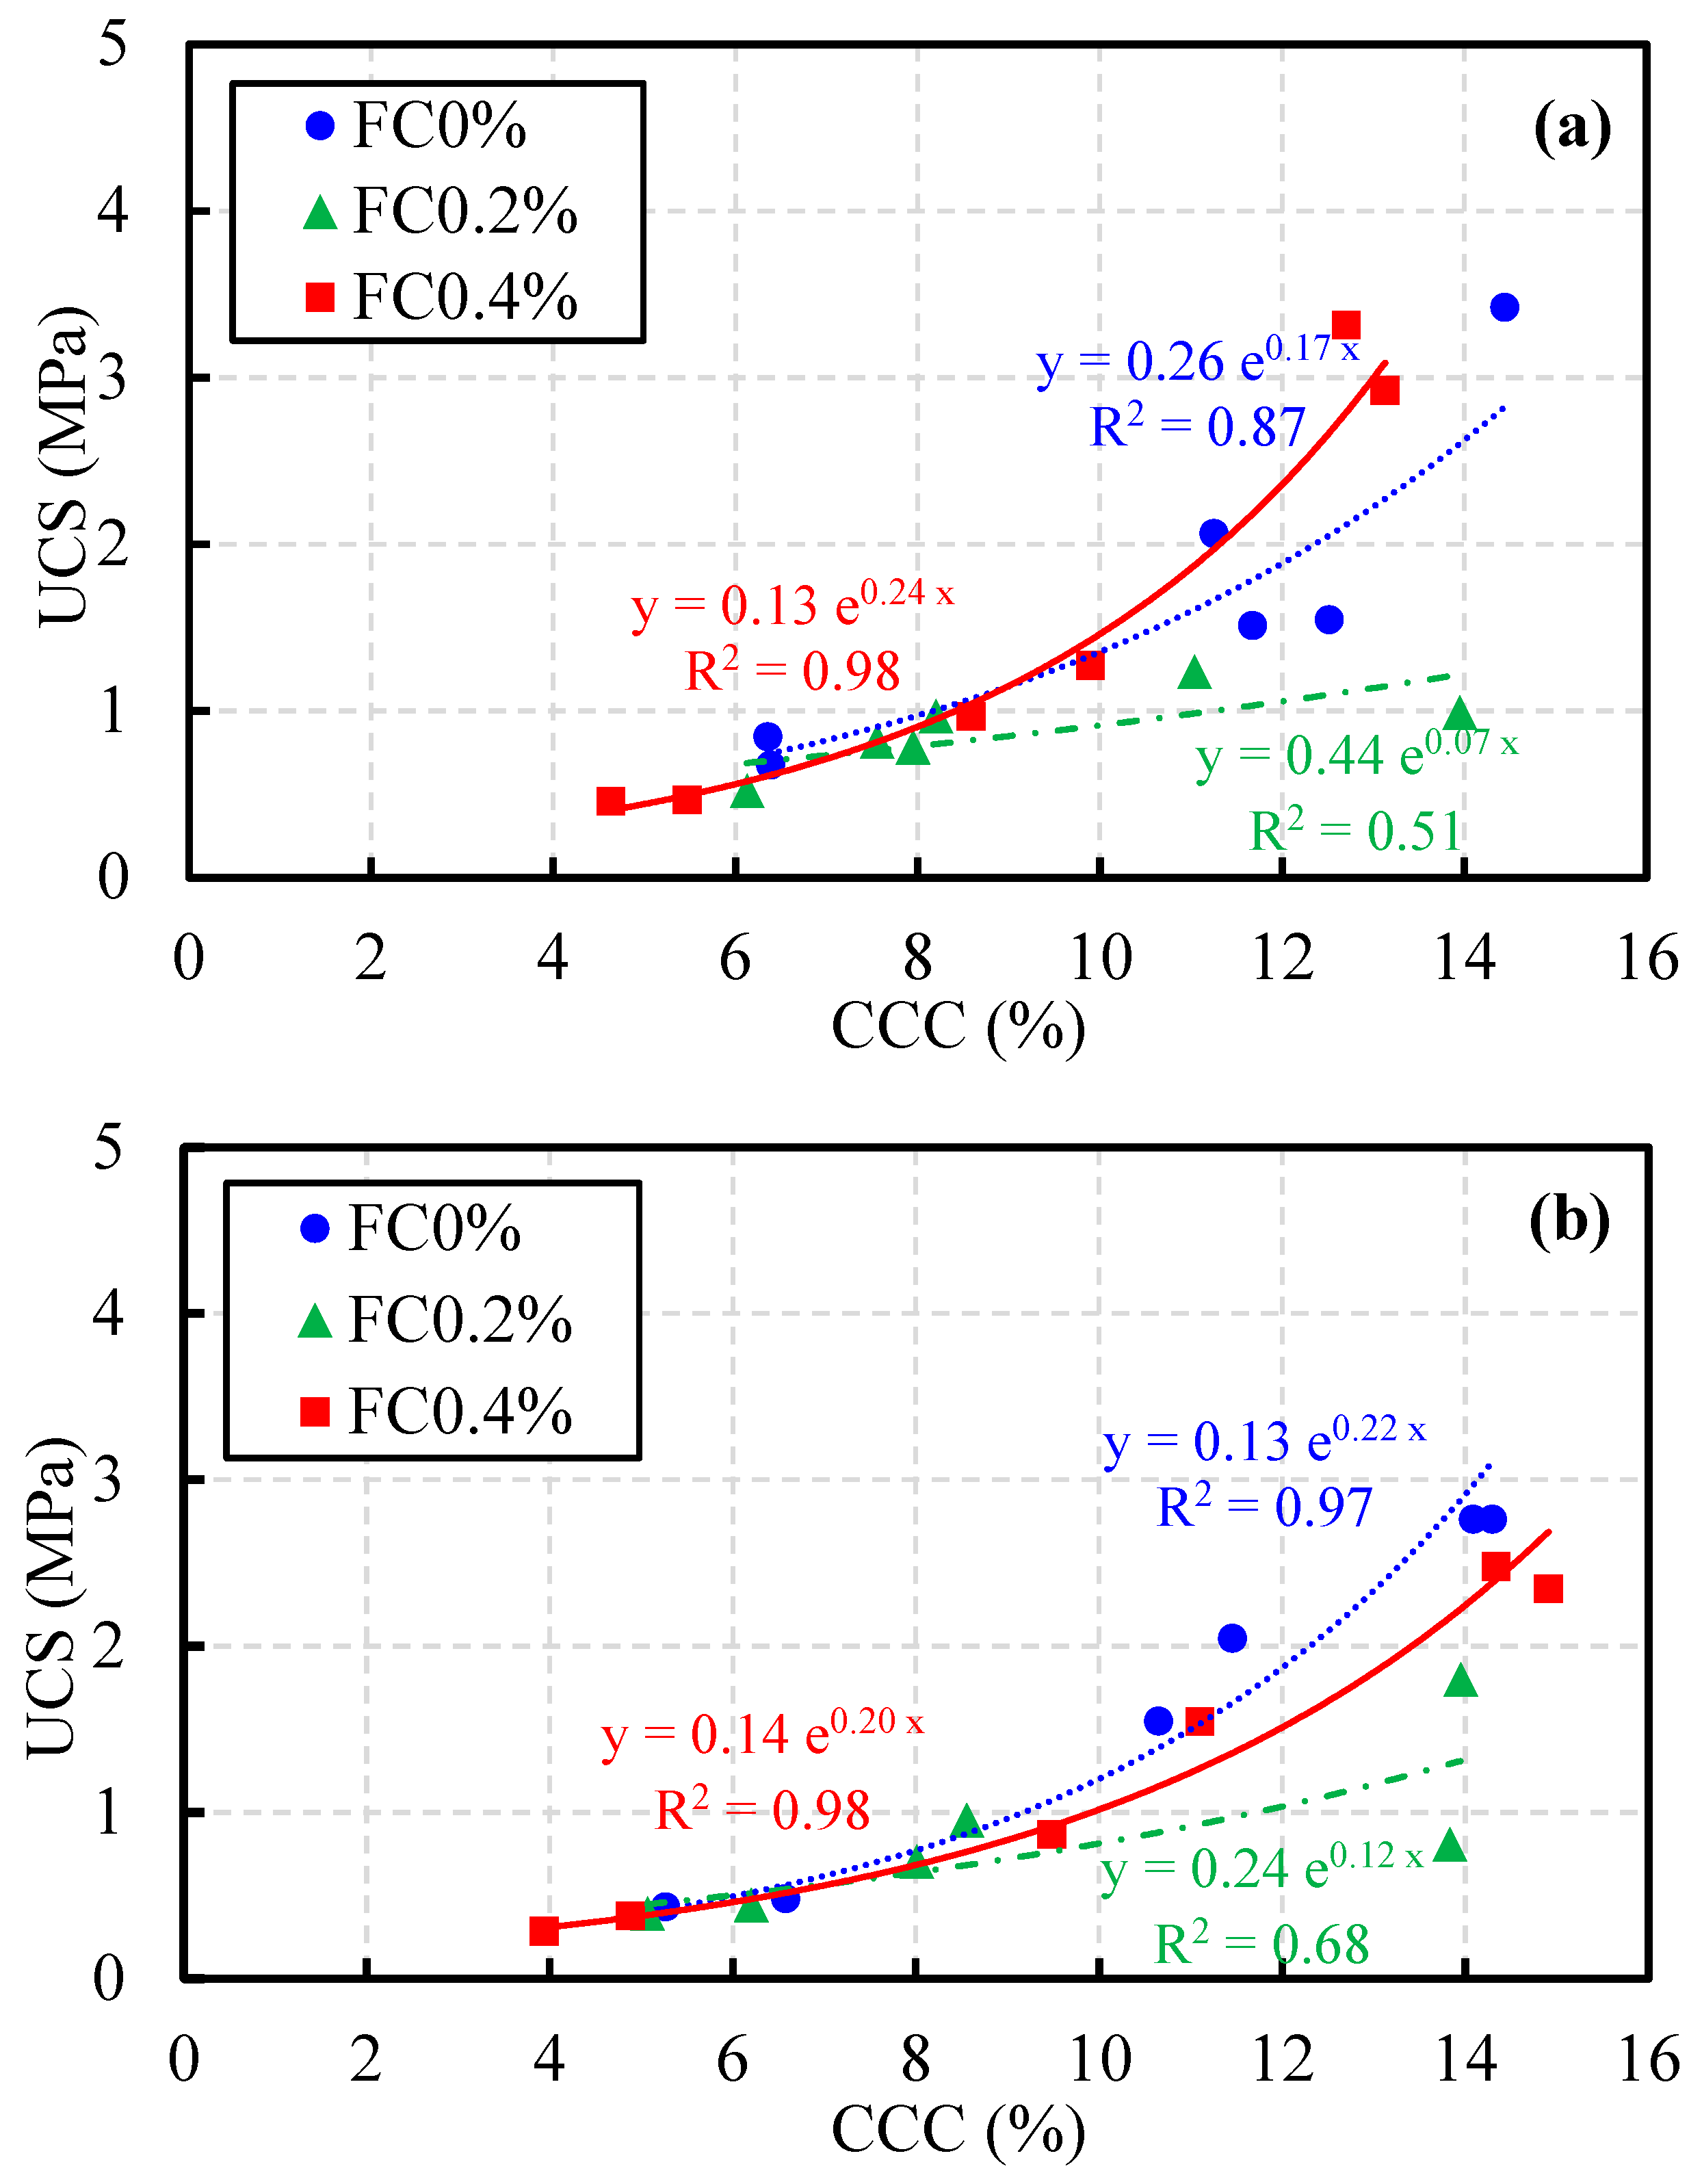
As shown in Figure 4, the strength of all static test specimens increases with rising calcium carbonate content (CCC). The coarse-to-fine sand ratio exerts only a minor influence on specimen strength at fiber contents of 0% and 0.2%. However, at a fiber content of 0.4%, specimens with 50% coarse sand achieve the highest strength, whereas those containing 100% coarse sand exhibit the lowest strength. CCC increased from 3.42% to 14.92%, while UCS rose from 0.19 MPa to 3.39 MPa. At the same fiber content, specimens with a coarse-to-fine sand ratio of 1:1 showed the most rapid increase in unconfined compressive strength (UCS) with calcium carbonate content (CCC), exhibiting an accelerating upward trend (Figure 4b). For pure fine sand in Figure 4a (0:1 ratio), the growth of UCS with CCC was approximately linear. For pure coarse sand in Figure 4c (1:0 ratio), the increase was the slowest, with a slightly lower rate at high CCC compared with the 1:1 mixture. This behavior can be attributed to the moderate void structure of the 1:1 gradation, which facilitates uniform calcium carbonate bonding. In both alternative cases, strength development is limited: the very small voids in pure fine sand hinder solution permeability, and the large voids in pure coarse sand compromise precipitation uniformity.
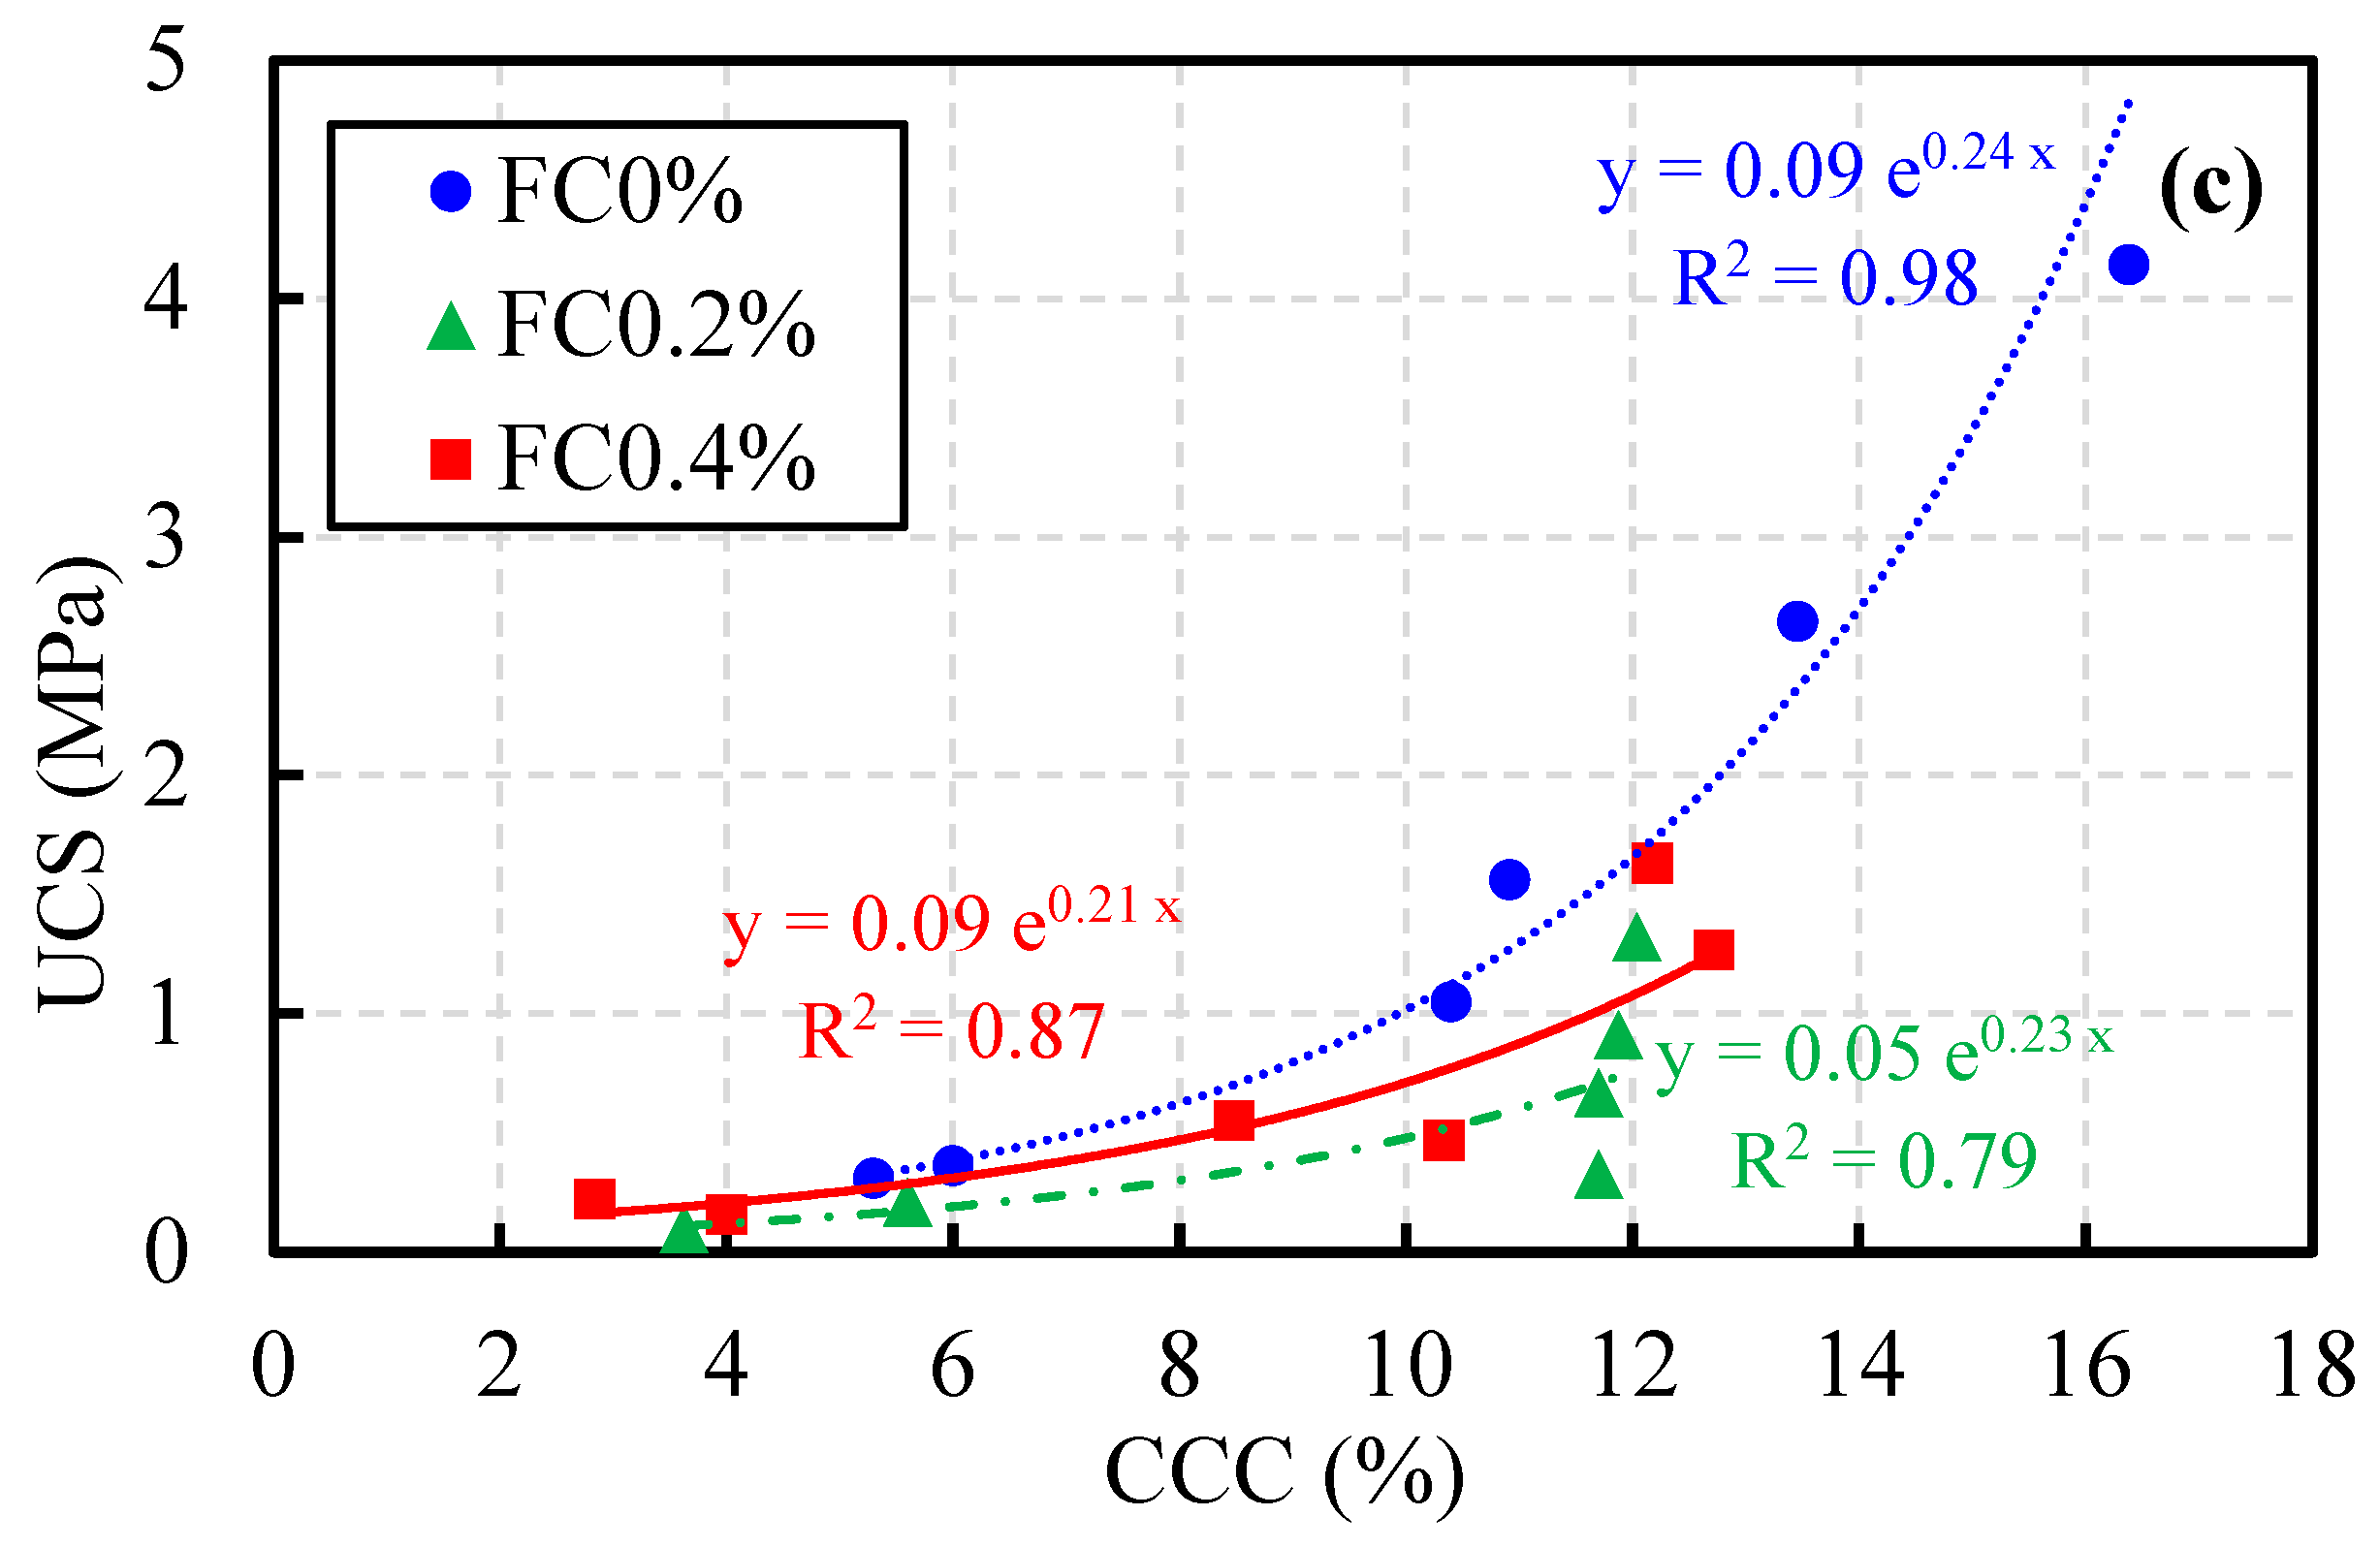
As shown in Figure 5, the strength of all static test specimens increases with increasing CCC. At 0% coarse sand content, specimens with 0.4% fiber show the highest strength, whereas at 50% and 100% coarse sand contents, unreinforced specimens exhibit the highest strength. Specimens containing 0.2% fiber present the lowest strength under all coarse sand contents. The coarse-to-fine sand ratio has a certain influence on the specimen strength; its effect is relatively slight at 0.2% fiber content but becomes more significant at 0% and 0.4% fiber contents. At 0% fiber content, an increase in coarse sand content improves the static unconfined compressive strength (UCS), with the maximum strength rising from 2.8 MPa to 4.8 MPa. In contrast, at 0.4% fiber content, increasing the coarse sand content reduces the UCS, as the maximum strength decreases from 3.1 MPa to 1.3 MPa when the coarse sand content increases from 0% to 100%. Under identical particle size distributions, the influence of fiber content was evident. While the 0.0% and 0.4% fiber groups exhibited similar relationships between UCS and CCC (with the 0.4 group slightly slower), the 0.2% fiber group deviated markedly, generally showing lower UCS values, slower strength growth at higher CCC, and even abnormal reductions. This phenomenon can be attributed to non-uniform distribution of fibers in the sand, which generated weak zones that diminished the reinforcement effect. Fibers oriented perpendicular to the impact direction can significantly enhance the dynamic compressive strength through the crack-bridging effect. It is hypothesized that the relatively low strength of 0.2% fiber specimens may also be attributed to their fibers being predominantly distributed parallel to the loading direction. By contrast, the denser fiber distribution at 0.4% enabled more effective stress transfer through interfacial friction, partially mitigating adverse effects. Overall, UCS increased with higher CCC, but the growth rate was strongly dependent on both particle gradation and fiber content. Future work incorporating fiber orientation measurements is required to validate this hypothesis.

3.3. The Displacement Under Static Loading

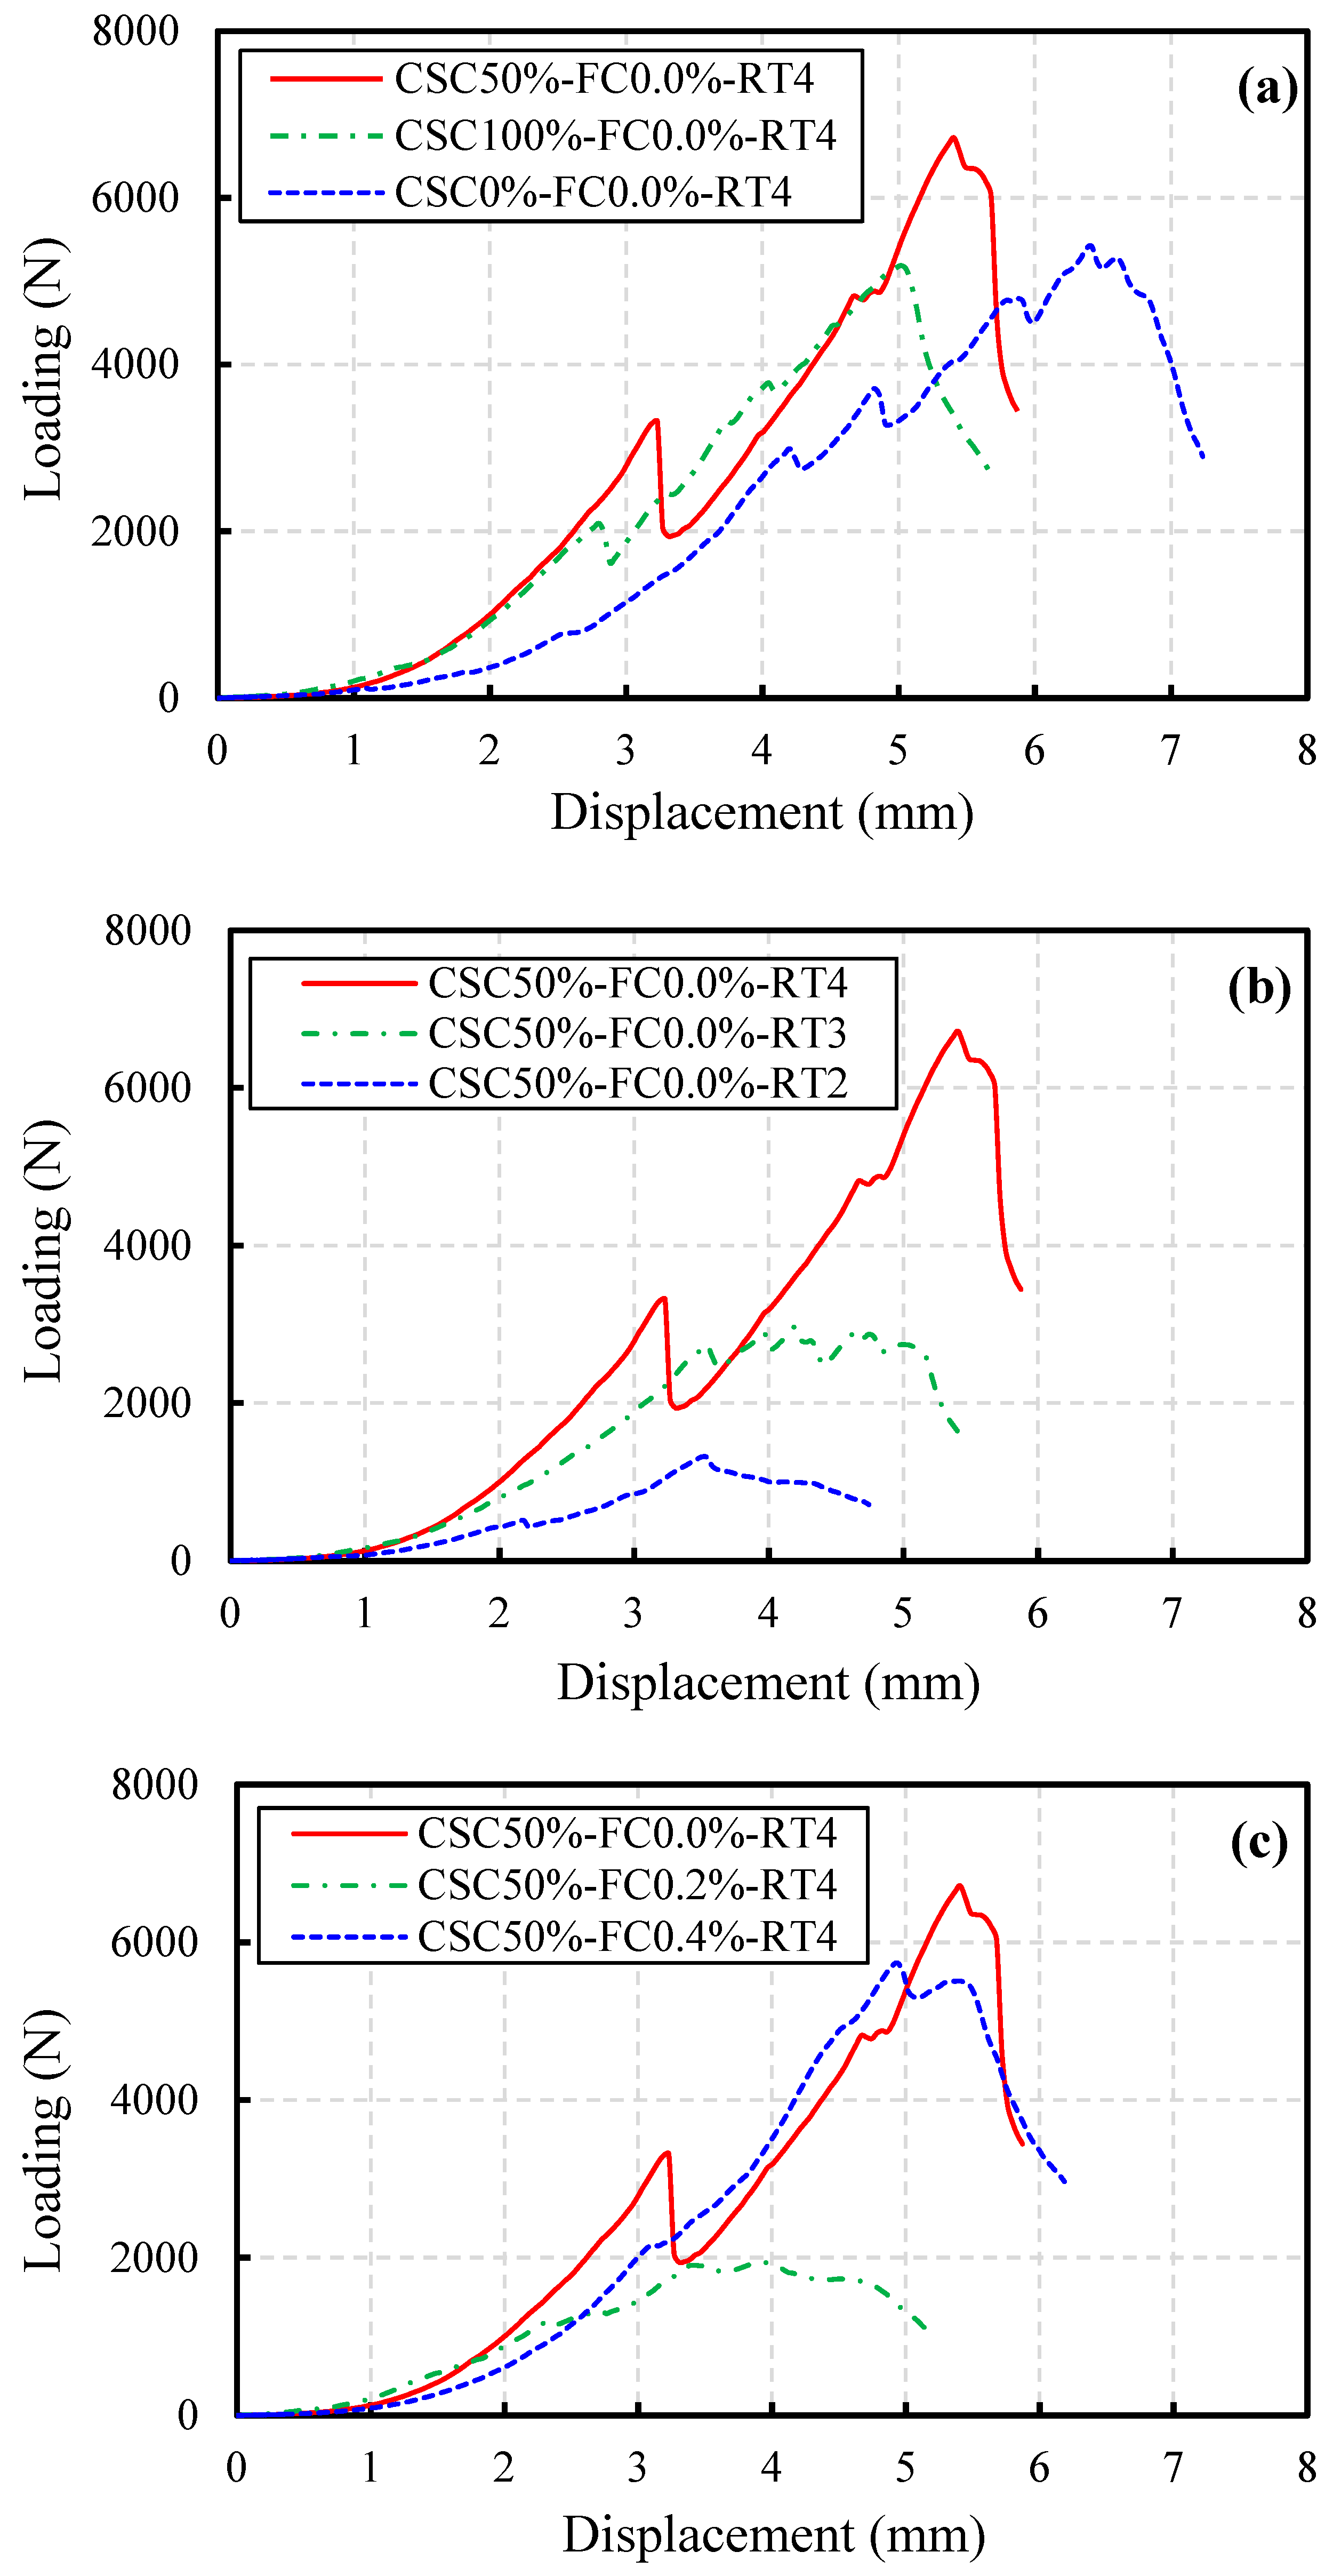
According to Figure 6, a higher calcium carbonate content (CCC) leads to a greater peak bearing capacity and a more complex failure process. A fiber content of 0.4% can effectively alleviate stress concentrations and result in a gradual post-peak load decline. In contrast, 0.2% fiber content leads to significantly degraded mechanical properties due to uneven fiber distribution. For a fixed cementation time and fiber content (Figure 6a), specimens with a 1:1 coarse-to-fine sand ratio achieved the highest peak load of 7000 N, while pure fine and coarse sand specimens both reached approximately 5000 N. The 1:1 graded specimen exhibited a single sharp peak, whereas pure sand specimens showed multiple sequential peaks. For a fixed gradation and fiber content (Figure 6b), increasing CCC improved peak bearing capacity and complicated the failure process. At low CCC, specimens failed in a scattered manner. At medium CCC, multiple peaks appeared due to progressive failure of weak cemented zones. At high CCC, the curve showed an initial peak from skeleton collapse followed by a secondary strengthening stage. For a fixed gradation and cementation time (Figure 6c), specimens with 0.4% fiber reached a peak load of about 5620 N with a gradual post-peak decline, owing to interfacial friction that alleviated stress concentrations. By contrast, unreinforced specimens failed abruptly after reaching the peak load. The 0.2% fiber group exhibited a much lower peak load and unclear failure stages due to uneven fiber distribution.
Based on the results in Figure 4, Figure 5 and Figure 6, the optimal mix ratio was determined as a coarse-to-fine sand ratio of 1:1 with a fiber content of 0.4%.

3.4. The Stress–Strain Curve Under Dynamic Loading

The optimal mix ratio for EICP-reinforced calcareous sand specimens was determined through static loading tests as 50% coarse sand content. In the subsequent dynamic loading tests, this optimal mix ratio was adopted, and three impact gas pressures (0.25 MPa, 0.35 MPa, and 0.45 MPa) were applied using a Hopkinson pressure bar to investigate the strain rate effect of the specimens.
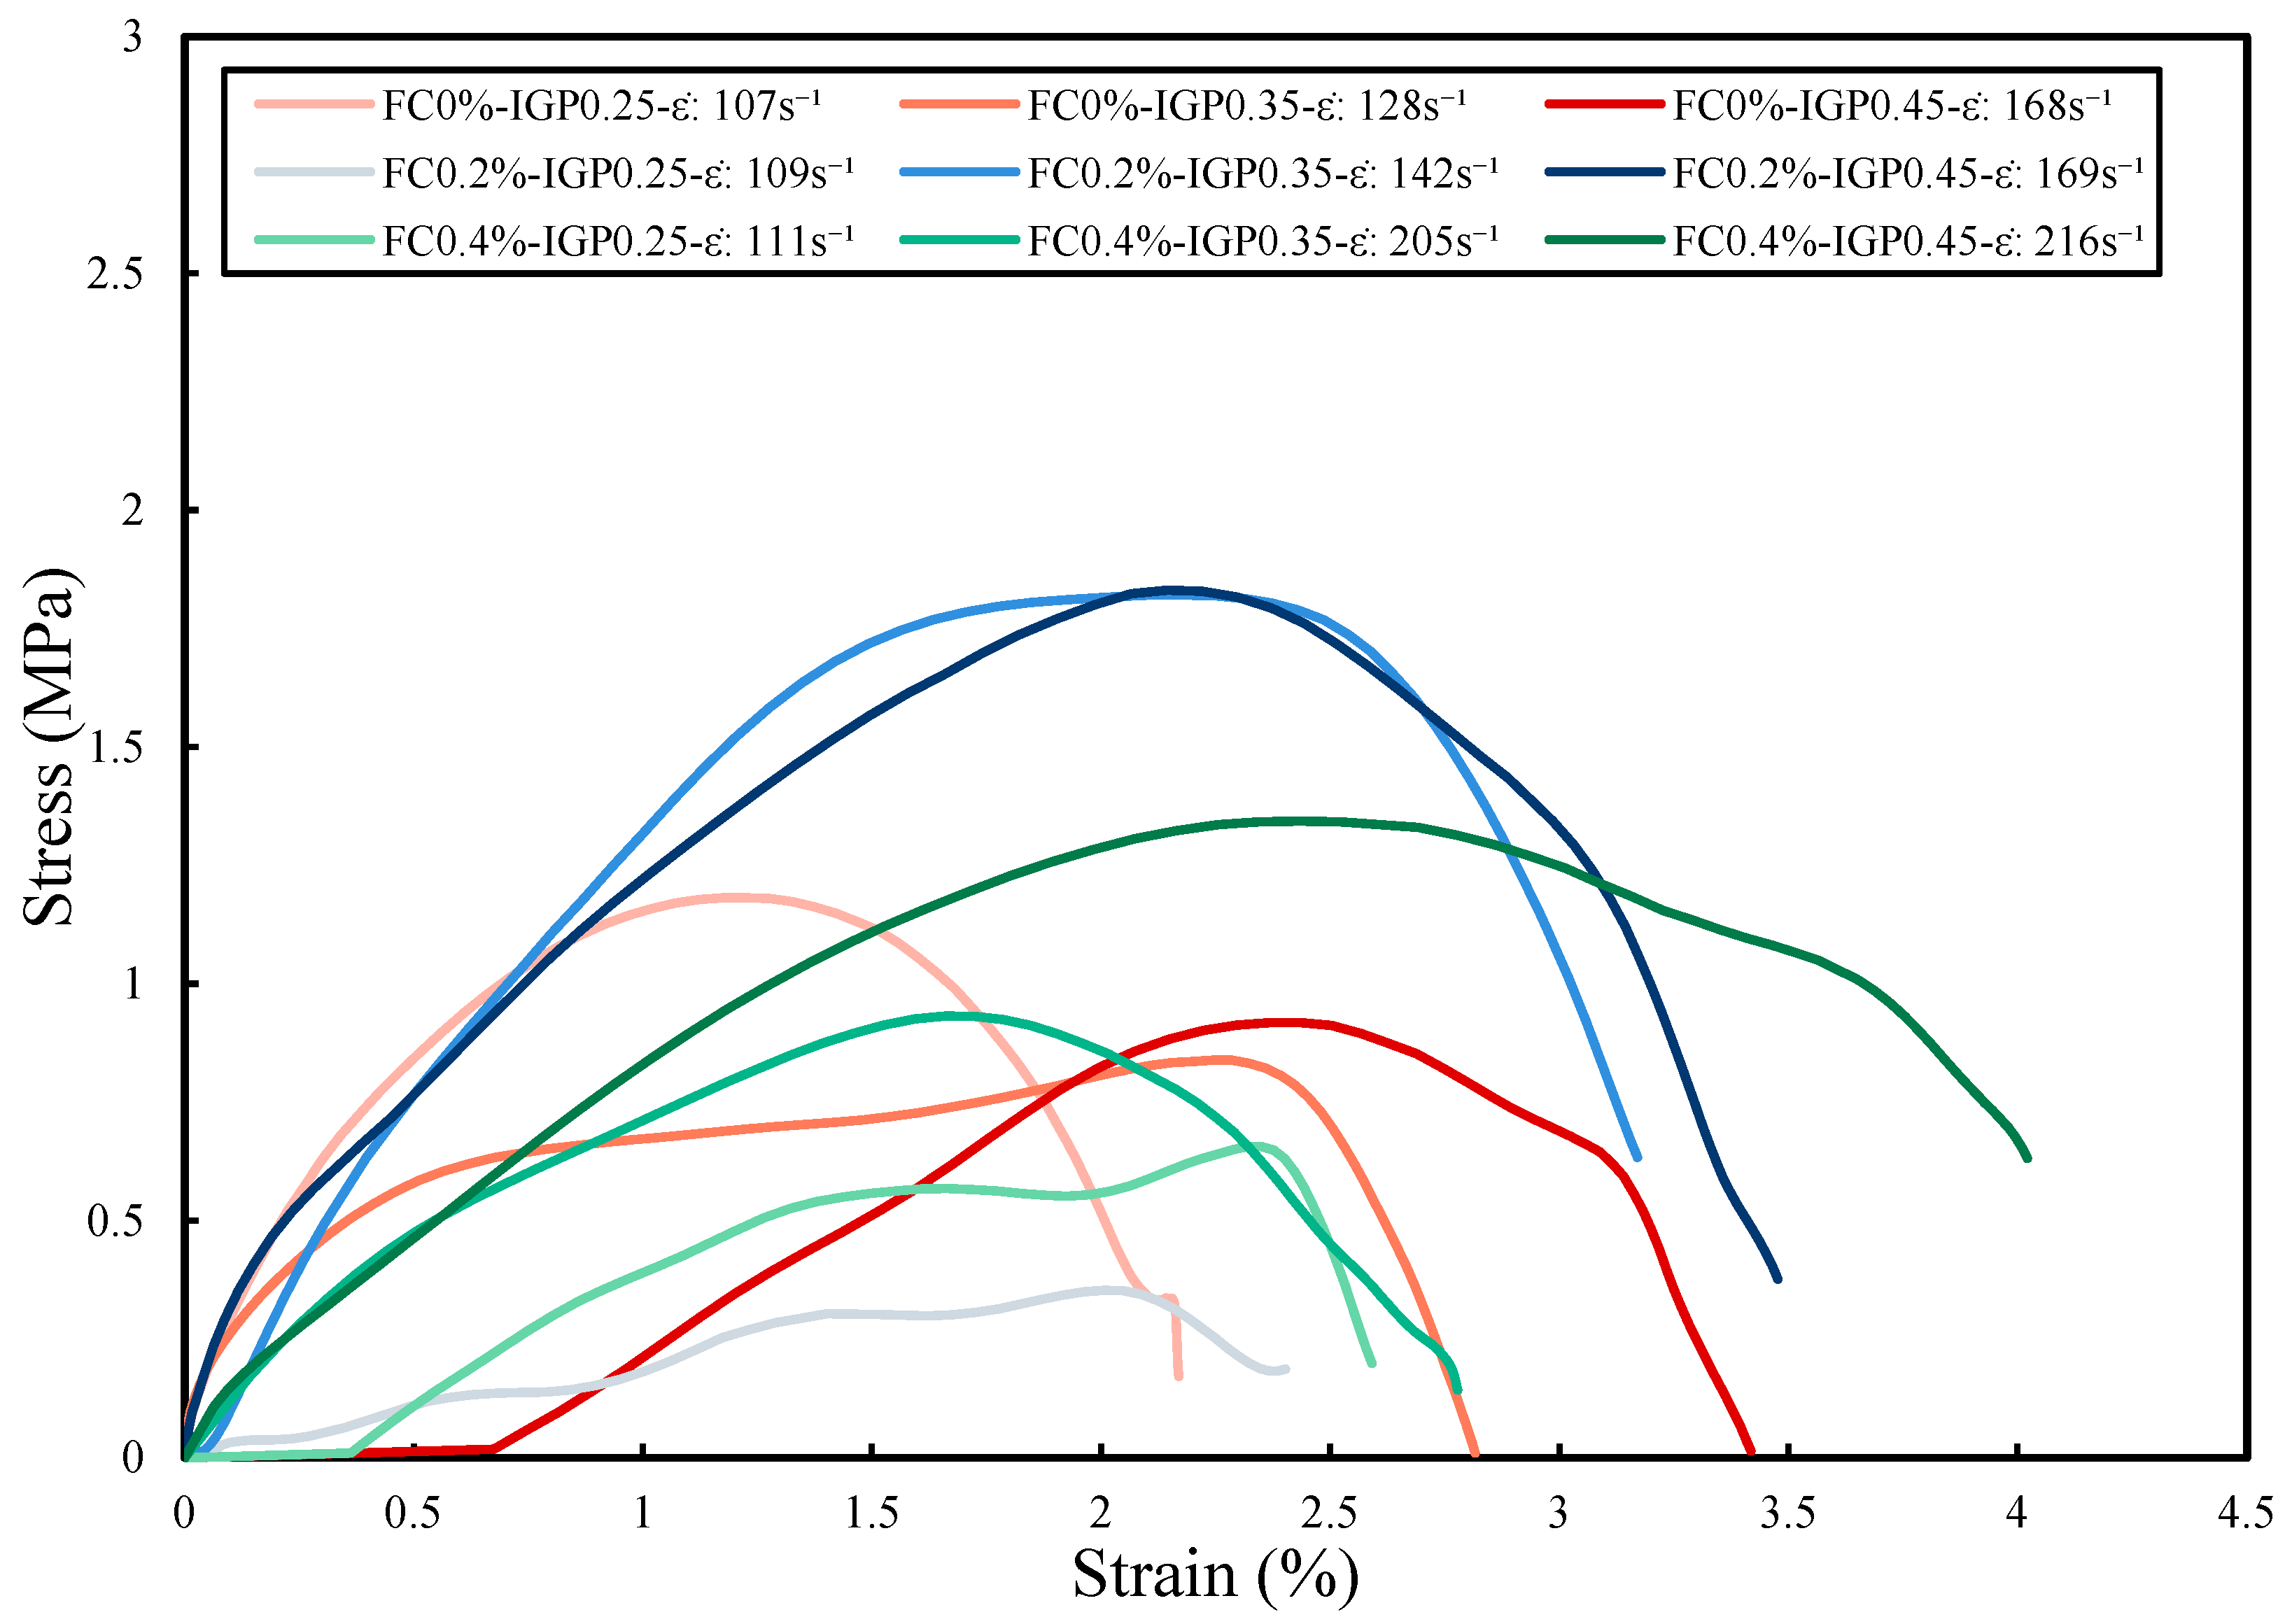
Figure 7 presents the dynamic stress–strain curves of the specimens under different impact gas pressures. For the non-fiber specimens (FC0%), as the impact gas pressure increased from 0.25 MPa to 0.45 MPa, the dynamic compressive strength decreased from 1.1 MPa to 0.9 MPa. For the 0.2% fiber-reinforced specimens, as the impact gas pressure increased from 0.25 MPa to 0.45 MPa, the dynamic compressive strength increased from 0.3 MPa to 1.8 MPa. For the 0.4% fiber-reinforced specimens, as the impact gas pressure increased from 0.25 MPa to 0.45 MPa, the dynamic compressive strength increased from 0.6 MPa to 1.3 MPa.

3.5. The Relationship Between DCS and CCC

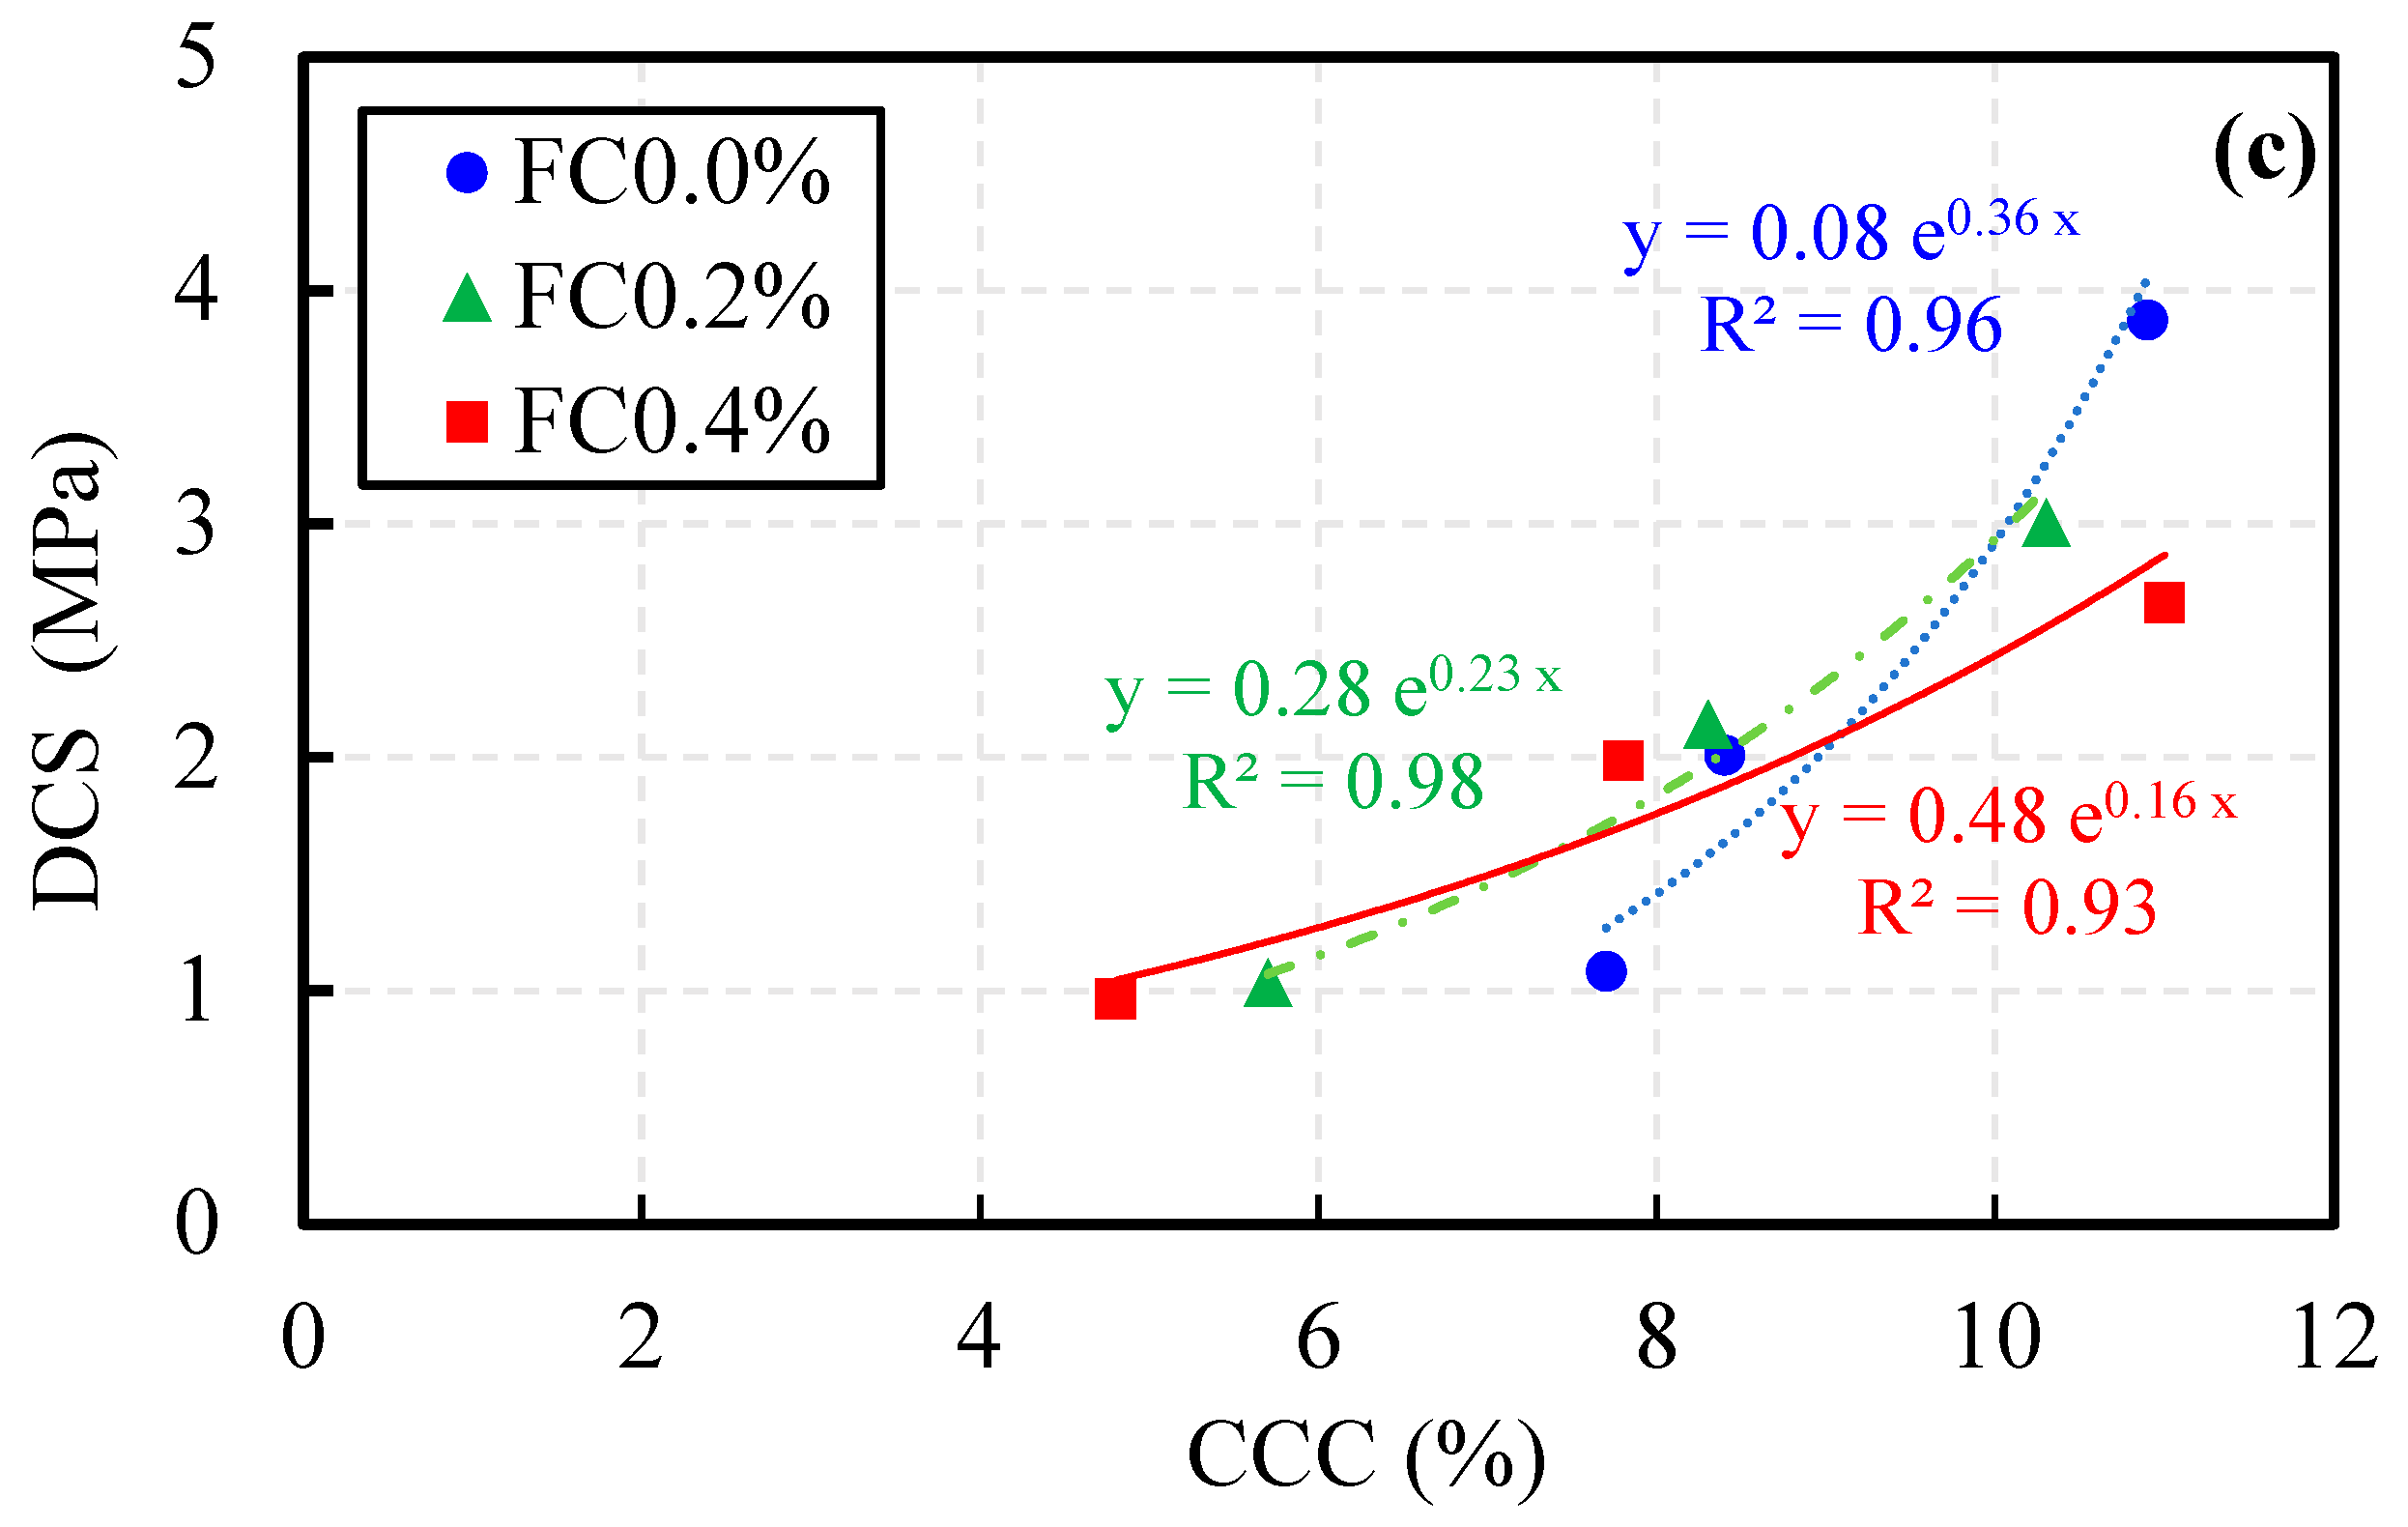
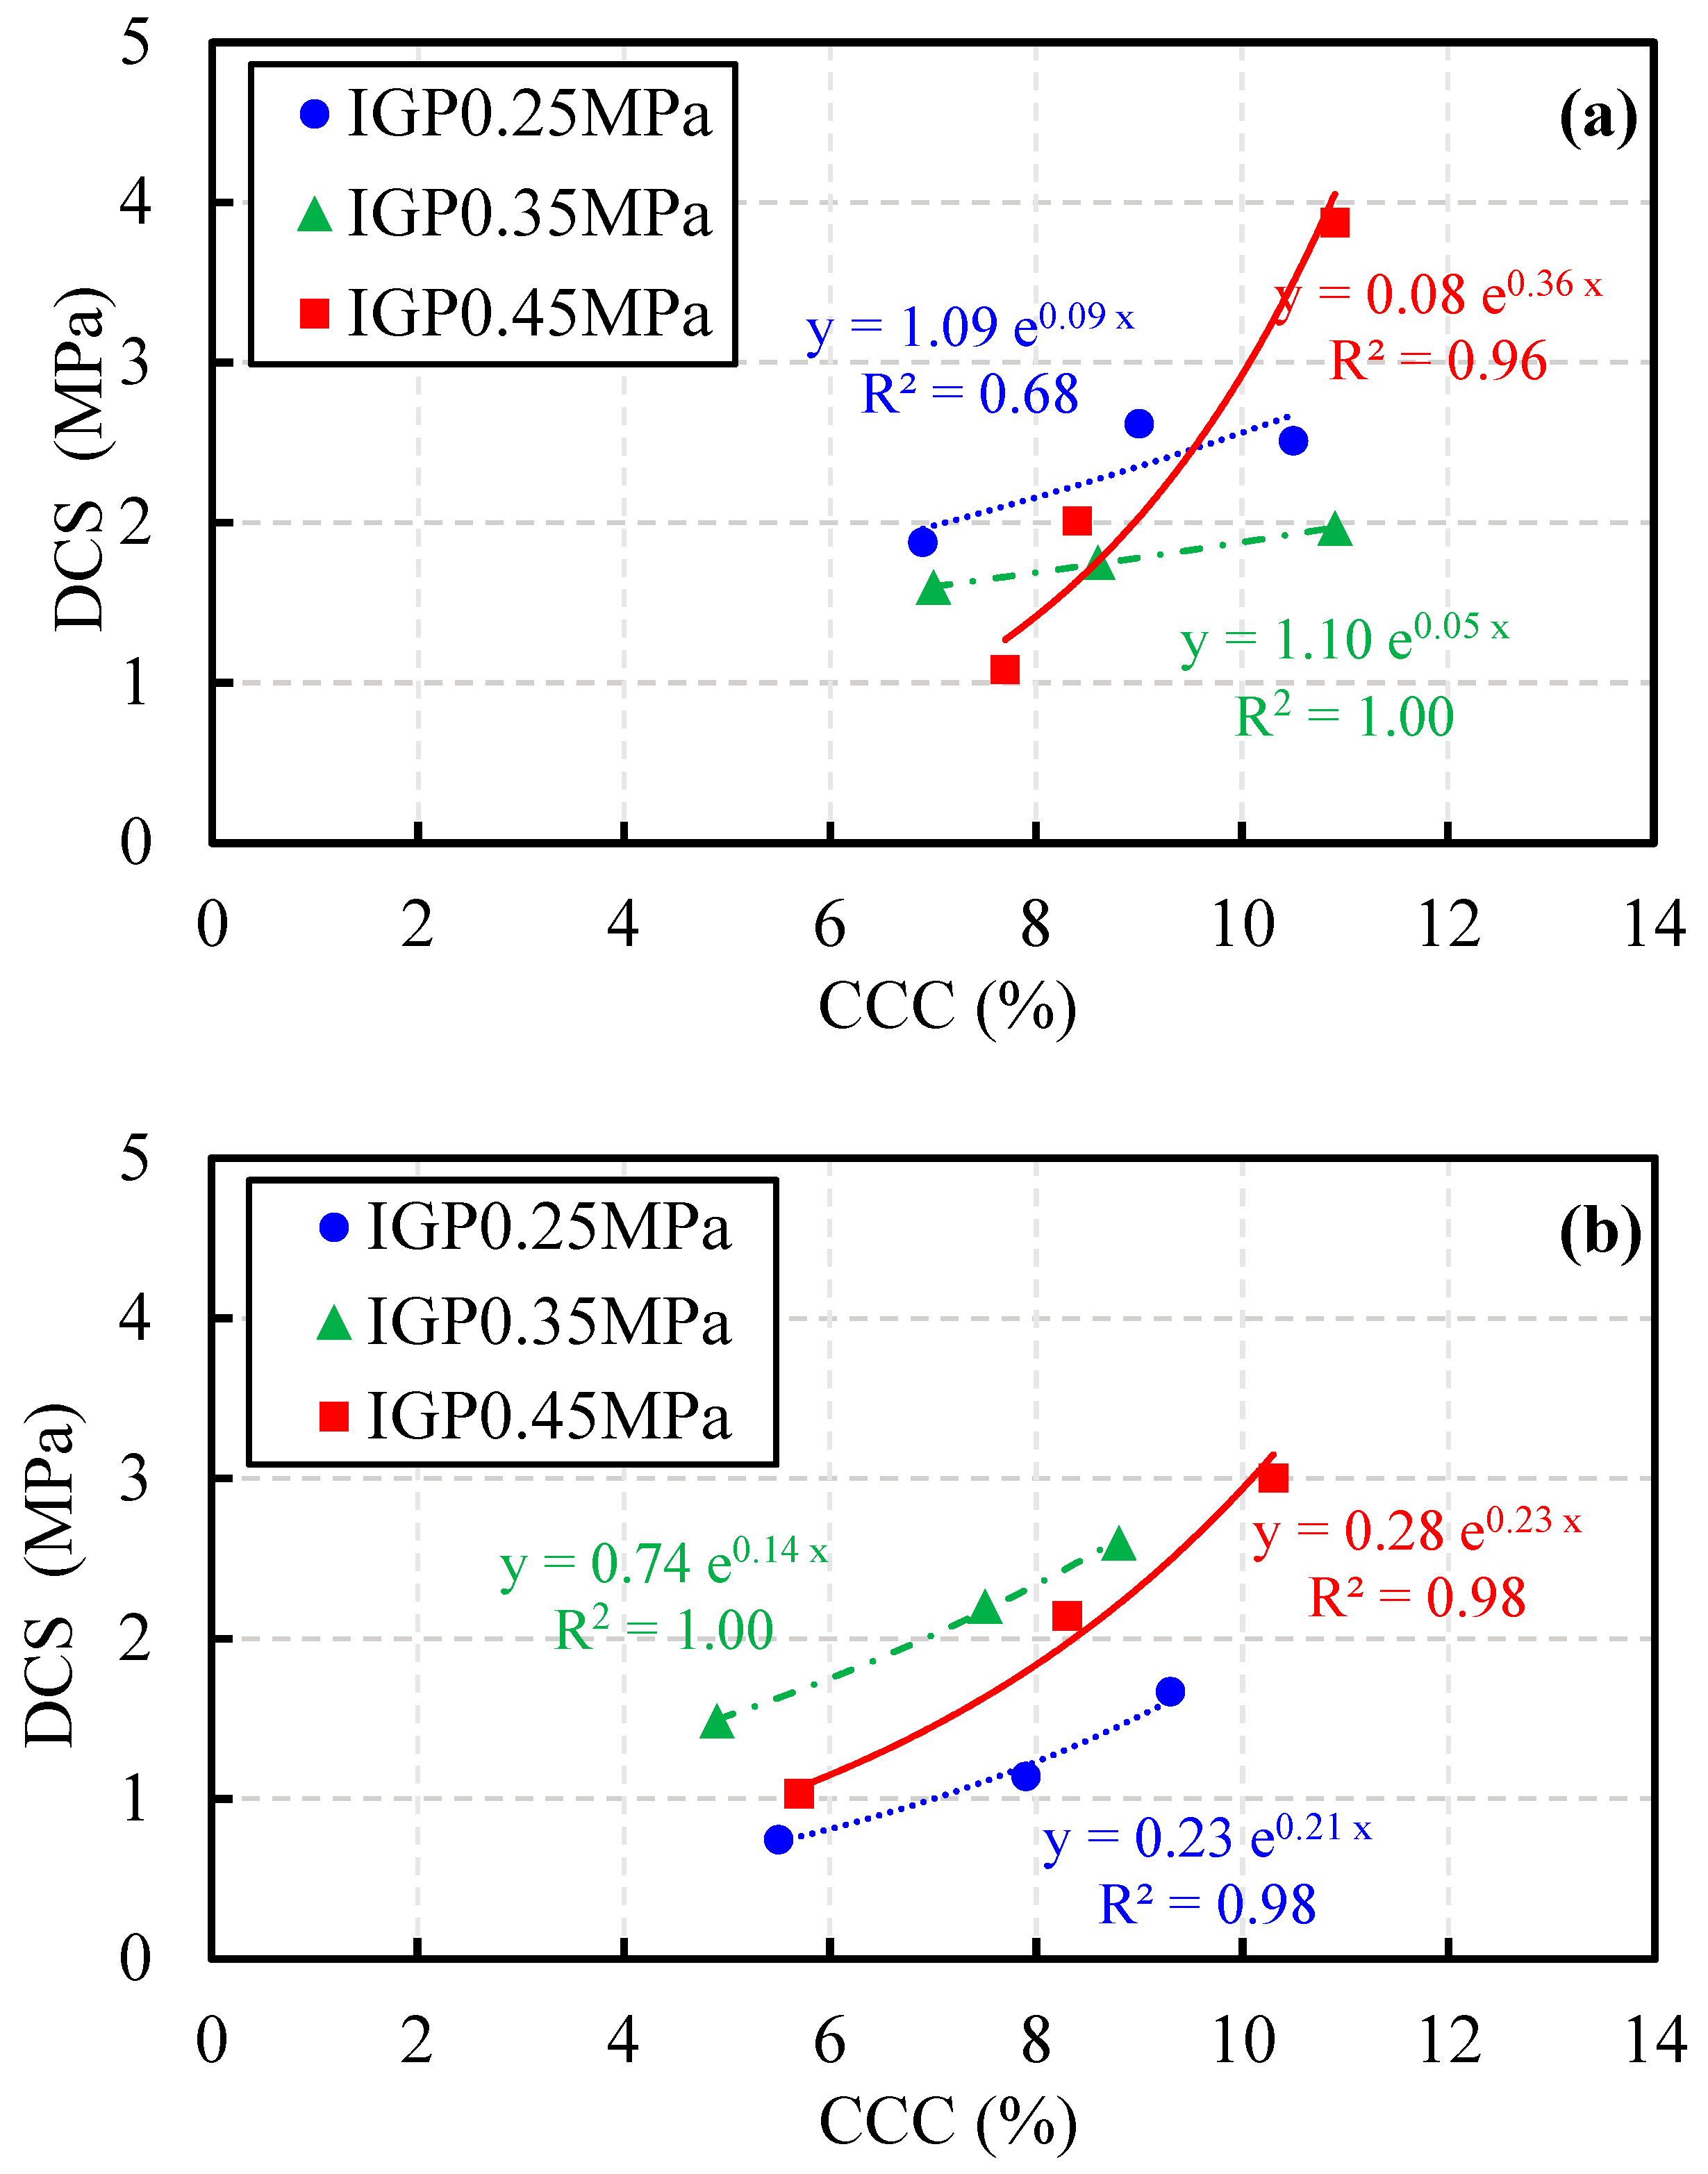
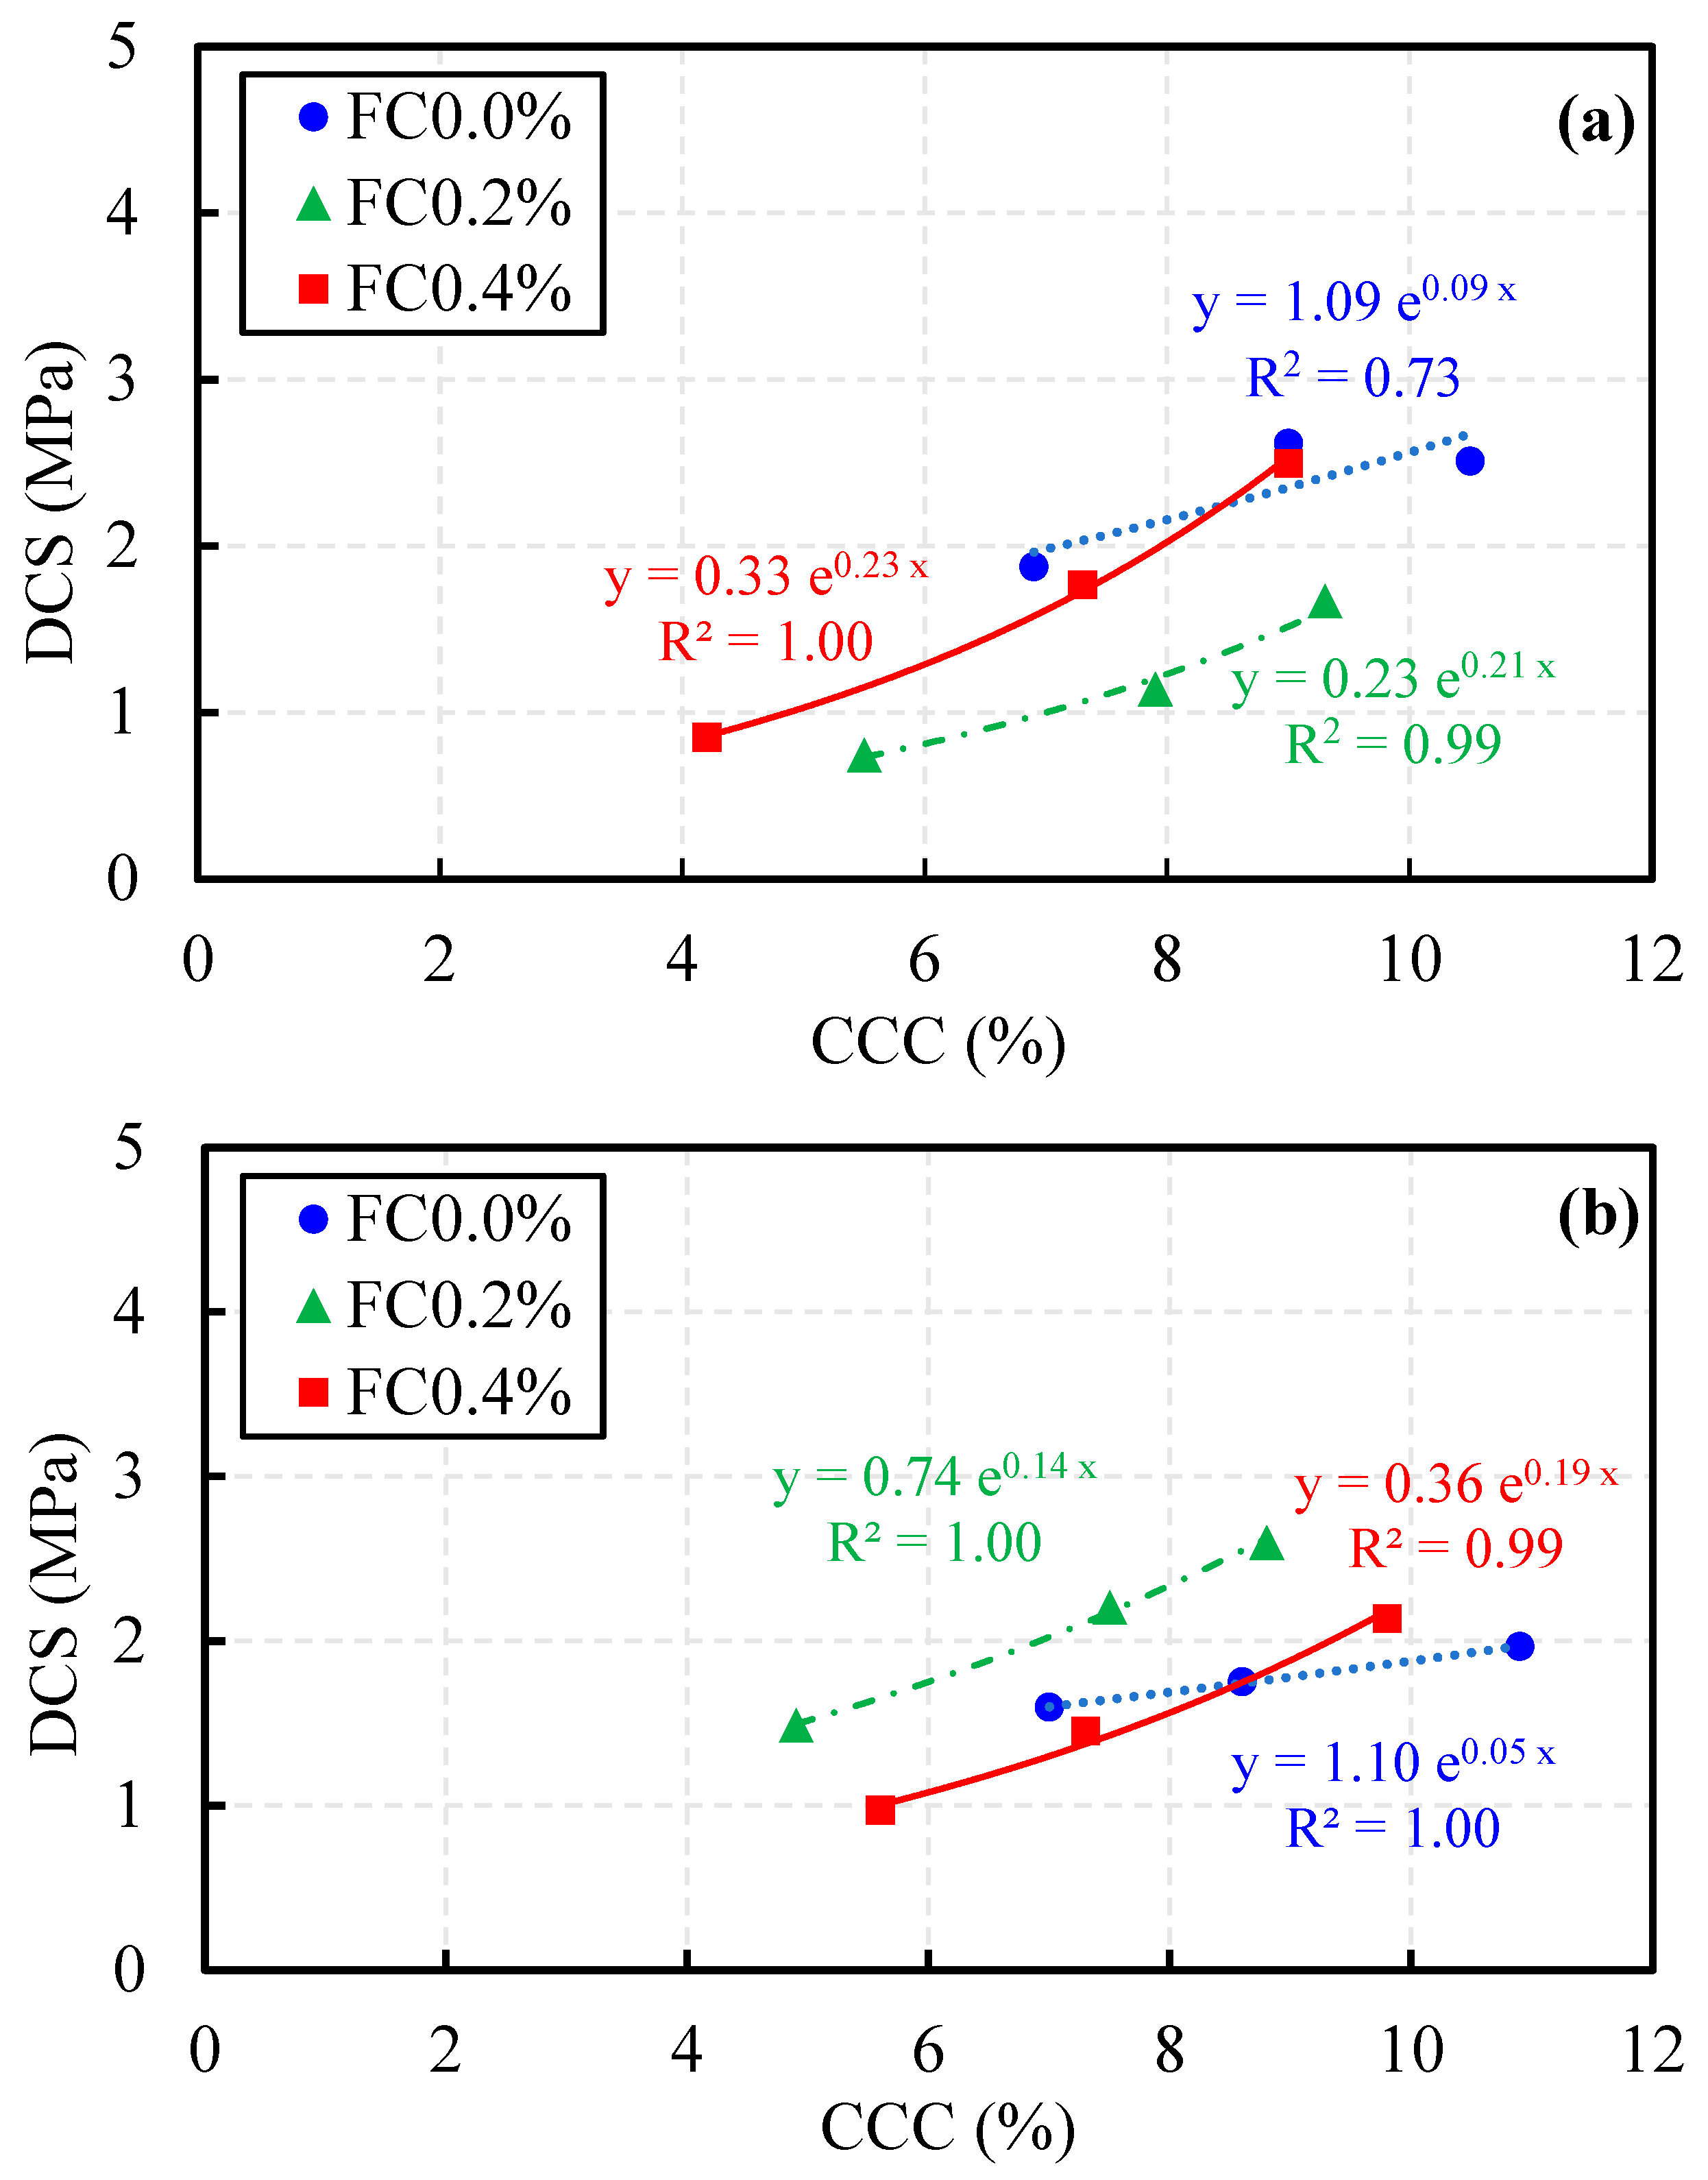
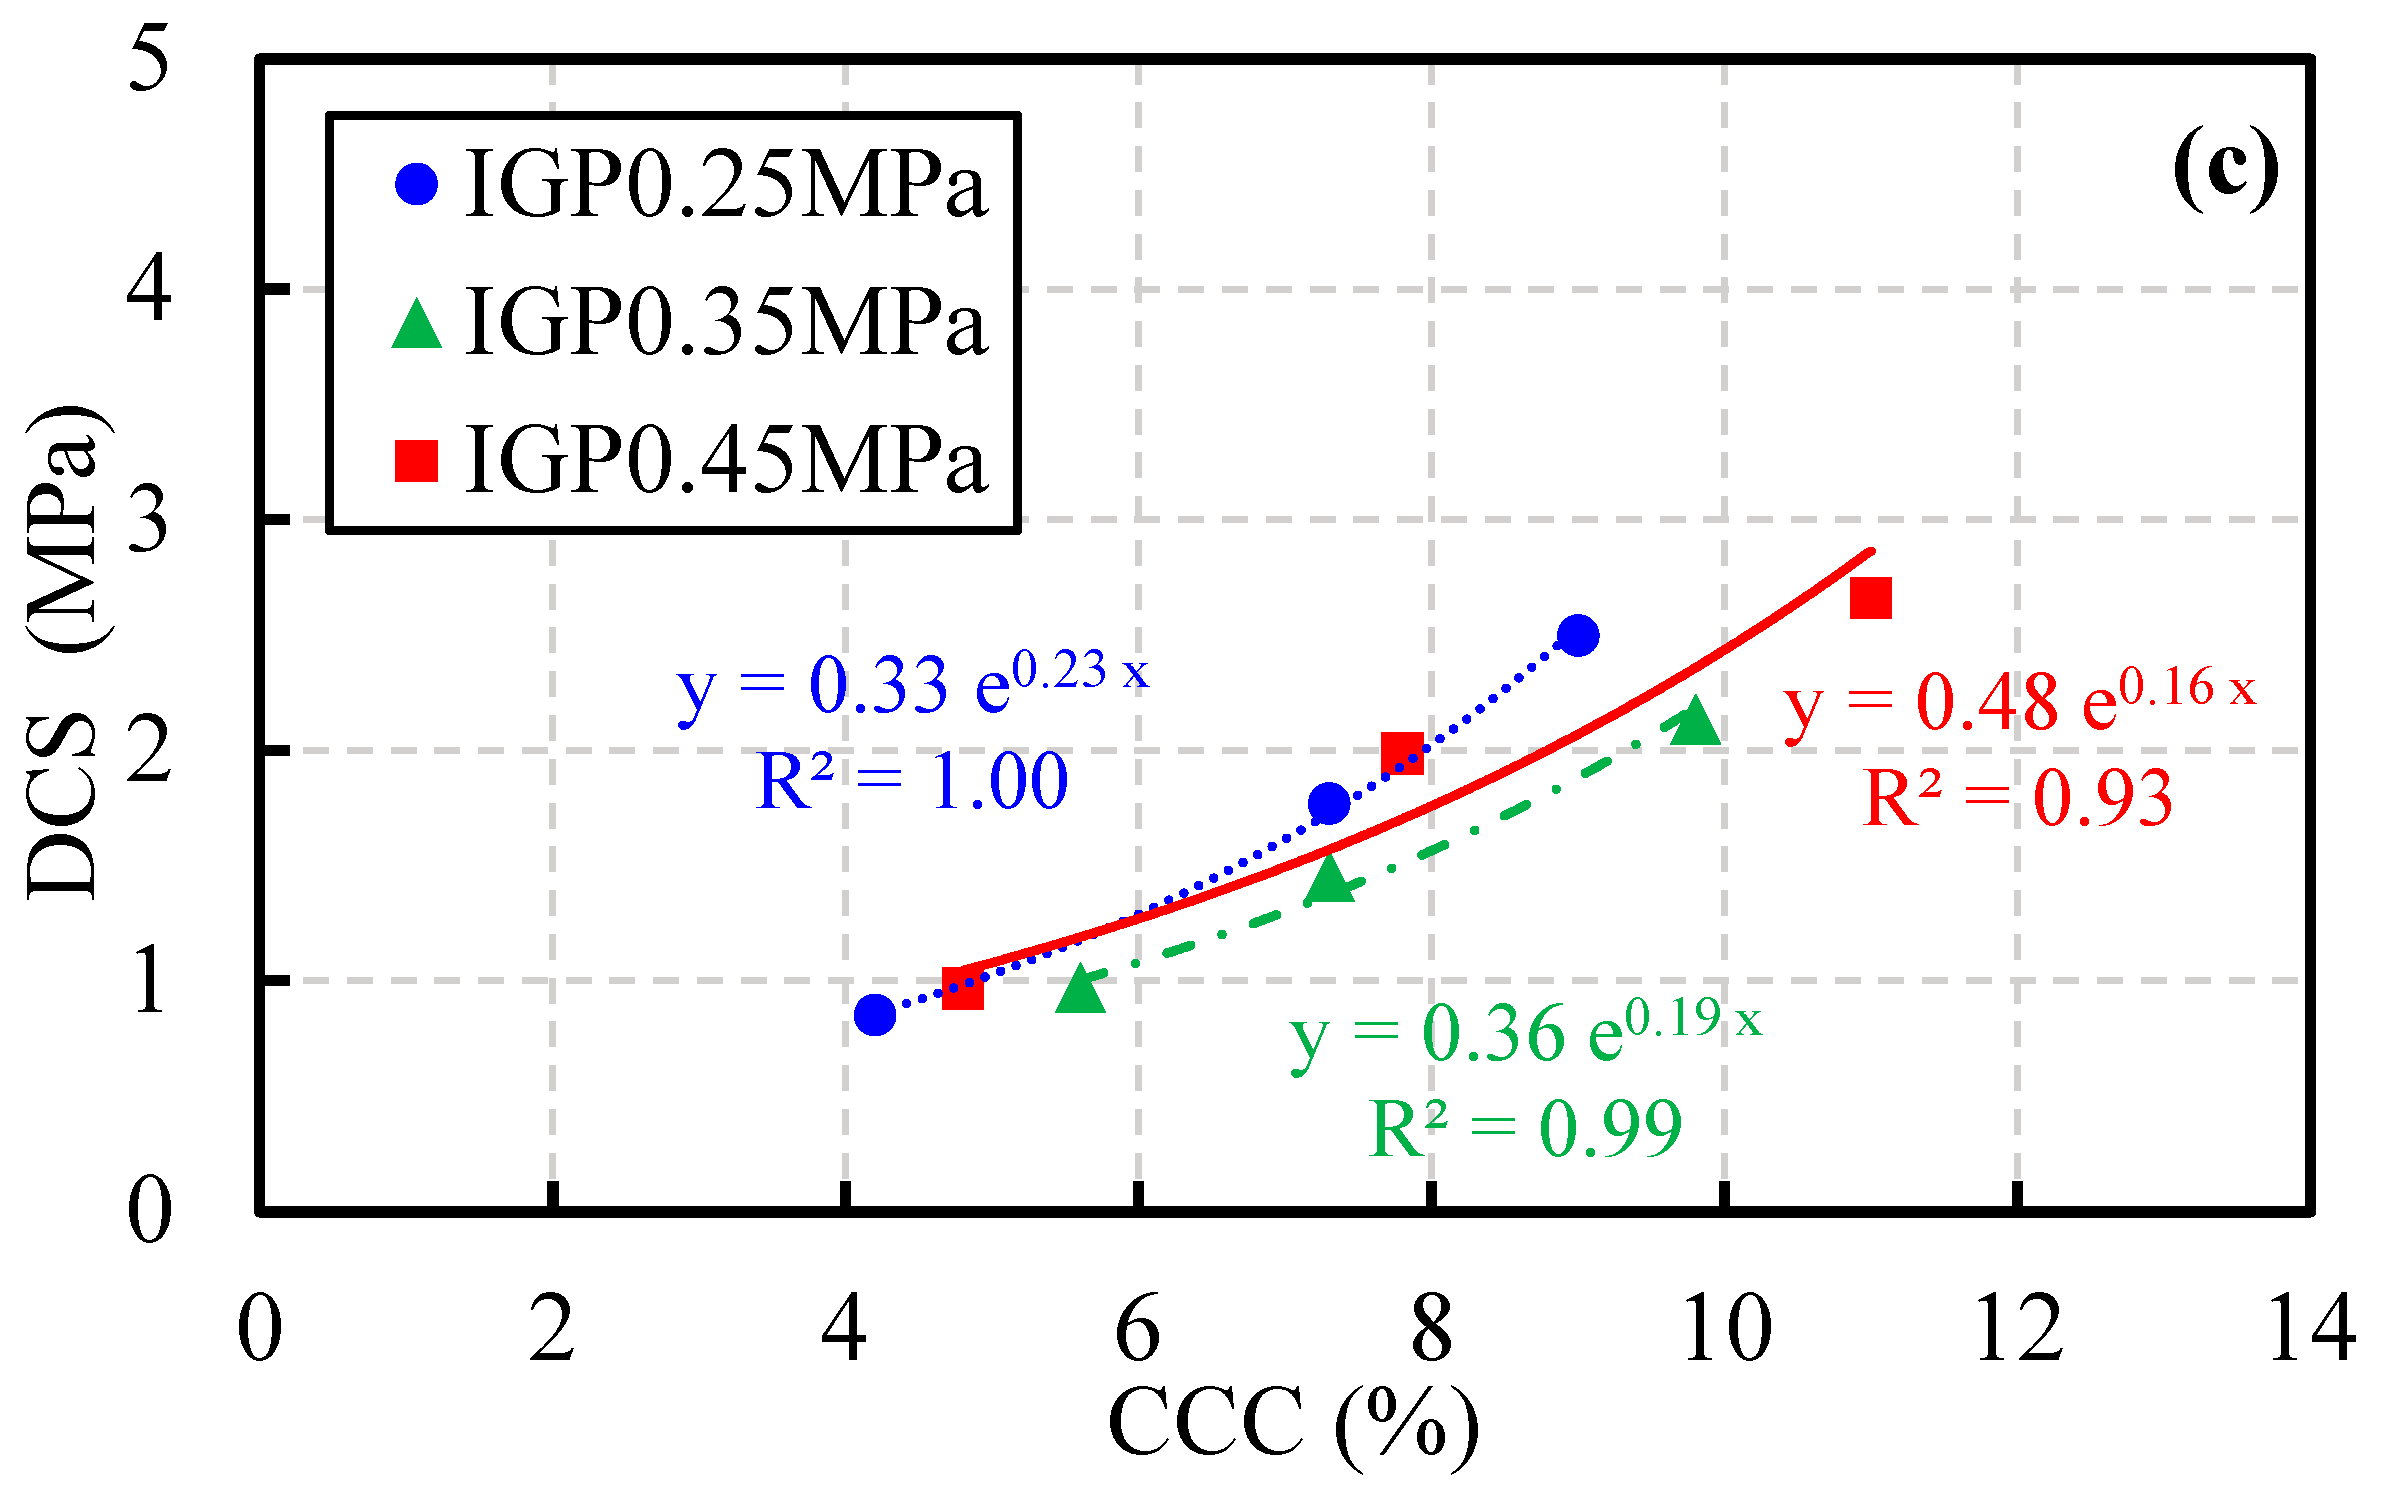
As shown in Figure 8, The dynamic strength increases with the increase in CCC. At an impact pressure of 0.25 MPa, specimens with 0.2% fiber content exhibit the lowest strength. At 0.35 MPa, specimens with 0.2% fiber content show the highest strength, and the strength growth rate decreases for all specimens. At 0.45 MPa, the strength differences among specimens with three fiber contents are relatively small, while the strength growth rate of specimens with 0% fiber content increases significantly. With the increase in impact pressure, the influence of fiber content on specimen strength diminishes. The impact pressure exerts a significant effect on specimens with different fiber contents. At all impact gas pressures, the dynamic compressive strength increased significantly with increasing CCC, indicating that the calcium carbonate-bonded skeleton maintained strong resistance to dynamic loads. The data in Figure 8 and Figure 9 were fitted using an exponential relationship because, as mentioned in the previously cited paper, the fitted relationship between UCS and CCC also adopted an exponential relationship. The observed trend in this study is consistent with the CCC-strength relationship established in existing literature based on a larger dataset [23,38,65,66]. Figure 8a indicates that at an impact gas pressure of 0.25 MPa, specimens with 0.4% fiber content achieved comparable dynamic compressive strength at lower CCC values than the other two specimens. Furthermore, their fitted curve exhibited a steeper slope, suggesting that the strength of the 0.4% fiber-reinforced specimens would surpass that of the others at higher CCC levels, highlighting their superior strengthening efficiency. Figure 8b indicates that for CCC values exceeding 8.6%, the dynamic compressive strength of fiber-reinforced specimens consistently exceeds that of the non-fiber specimens. Figure 8c follows the trend observed in Figure 8a, demonstrating that fiber incorporation significantly enhances strength at low CCC levels. At a CCC of 4.8, specimens with 0.4% fiber content achieved a strength of 1 MPa earlier than other specimens, whereas those with 0.2% fiber and non-fiber specimens reached the same strength threshold at higher CCC values of 5.7 and 7.7, respectively. This progression clearly illustrates the contribution of fiber addition to strength development, with higher fiber content leading to more efficient performance improvement.
As illustrated in Figure 9, the dynamic strength increases with increasing CCC. At 0% fiber content, specimens exhibit the highest dynamic strength under an impact pressure of 0.45 MPa. At 0.2% fiber content, the maximum dynamic strength occurs at 0.35 MPa when CCC is 8.2%. At 0.4% fiber content, the dynamic strength of specimens varies slightly among the three impact pressures. Fiber content has a significant influence on the dynamic strength of specimens under different impact pressures. At 0% fiber content, the strength increases rapidly under 0.45 MPa. At 0.2% fiber content, specimens show similar strength growth trends under different impact pressures. At 0.4% fiber content, the strength values are close across different impact pressures, indicating that the impact pressure has a negligible effect on strength and the stability of specimens is improved. At impact pressures of 0.25 MPa and 0.35 MPa, the strength growth rate increases with rising fiber content, accompanied by an increase in the k-value from 0.09 to 0.23 and from 0.05 to 0.19, respectively. In contrast, at 0.45 MPa, the strength growth rate and the k-value both decrease with increasing fiber content, with the k-value falling from 0.36 to 0.16.

3.6. Strain-Rate Sensitivity and Dynamic Strengthening Mechanisms

Under dynamic loading, the strength of EICP-reinforced calcareous sand significantly exceeds its static strength, a phenomenon fundamentally attributed to the inherent strain-rate sensitivity of geomaterials. This section systematically analyzes the dynamic strengthening mechanisms from three scales—particle scale, crack scale, and cementation scale—and validates them with the experimental results of this study.
The first mechanism is particle inertia effect. During quasi-static loading, calcareous sand particles have sufficient time to rearrange and adapt to external loads; loose particles can undergo structural reorganization through rolling and sliding, thereby dissipating energy to some extent and reducing local stress concentrations. However, under SHPB dynamic impact, the loading duration is extremely short, typically only tens to hundreds of microseconds, and stress waves propagate through the specimen at very high velocities. Under such conditions, relative sliding between particles is forcibly constrained, and the load transfer path shifts from frictional sliding between particles to forced compression of the particle skeleton and cementation failure. This inertial confinement effect causes a sharp increase in inter-particle contact forces, significantly enhancing both the initial stiffness and peak load-bearing capacity of the material.
The second mechanism is crack propagation resistance. Under static loading, due to the slow increase of load, cracks tend to develop along the path of least energy consumption, ultimately forming one or a few major cracks. This progressive failure mode results in relatively limited resistance during crack propagation. However, under dynamic loading, since a single crack cannot obtain sufficient time and energy to propagate continuously, the impact energy must be dissipated by activating more secondary cracks, leading to a significant increase in total fracture surface area and thus greatly enhancing the energy consumption required for crack propagation. This also explains why SHPB specimens disintegrate completely into fine particles.
The third mechanism is the rate-dependent behavior of calcium carbonate cementation bridges. The calcium carbonate crystals generated by EICP form cementation bridges at particle contact points, and these bridges are one of the primary sources of specimen strength. Under static loading, the cementation gradually deteriorates, manifesting as a relatively gentle failure process. However, under dynamic loading, the brittle fracture behavior of calcium carbonate bridges exhibits significant rate sensitivity. High strain rates prevent the bridges from undergoing slow damage accumulation, causing them to undergo brittle fracture at levels closer to their theoretical strength. Meanwhile, the fracture of CaCO3 bridges not only consumes energy but also generates fine particles that may fill surrounding pores, increasing the contact area and friction coefficient between particles, thus maintaining certain residual strength even after failure. This mechanism is consistent with the trend observed in this study, where dynamic strength increases significantly with increasing calcium carbonate content (CCC).
Furthermore, the fiber-bridging effect cannot be overlooked. Under dynamic loading, the interfacial bond resistance between fibers and the matrix exhibits significant strain-rate sensitivity. High strain-rate loading substantially increases the resistance to fiber pull-out, requiring the fibers to overcome greater interfacial shear strength to slide out of the matrix. Meanwhile, the fracture mode of the fibers themselves under dynamic loading may also shift from tensile fracture to shear fracture, further increasing energy dissipation. Therefore, the fiber-bridging effect is significantly enhanced under dynamic conditions, effectively delaying crack propagation and substantially improving the dynamic toughness and overall strength of the specimens. Specimens with 0.4% fiber content exhibited block-like failure during SHPB testing, while unreinforced specimens completely disintegrated, indicating that fiber incorporation effectively maintains the integrity of the fragments.
To quantitatively characterize the strain-rate sensitivity discussed above, the dynamic increase factor (DIF), defined as the ratio of dynamic compressive strength to static unconfined compressive strength, was calculated for each condition. Table 3 summarizes the average strain rates, dynamic compressive strengths, and corresponding DIF values for all tested conditions. The DIF values increase with increasing strain rate across all fiber contents, confirming the significant strain-rate sensitivity of the EICP-reinforced calcareous sand. Among the three fiber contents, the 0.2% fiber-reinforced specimens exhibit the highest DIF values, indicating that the fiber-bridging effect is most effectively activated under dynamic loading at this fiber dosage. Notably, the 0.4% fiber-reinforced specimens, despite exhibiting the highest static UCS, show lower DIF values compared to the 0.2% group. This is because their higher static strength baseline leaves less room for relative amplification, although their absolute dynamic strength remains at a relatively high level. The unreinforced specimens (FC0%) show the lowest DIF values, suggesting limited strain-rate sensitivity in the absence of fibers.
In summary, the dynamic strength enhancement of EICP-reinforced fiber-reinforced calcareous sand is not governed by a single mechanism but results from the synergistic coupling of particle inertial confinement, multi-crack competitive propagation, rate-dependent fracture of CaCO3 bridges, and enhanced fiber-bridging under dynamic loading. These mechanisms interact synergistically at high strain rates, collectively leading to dynamic strength significantly exceeding static strength, with the enhancement magnitude increasing with rising strain rate.

3.7. Data Comparison

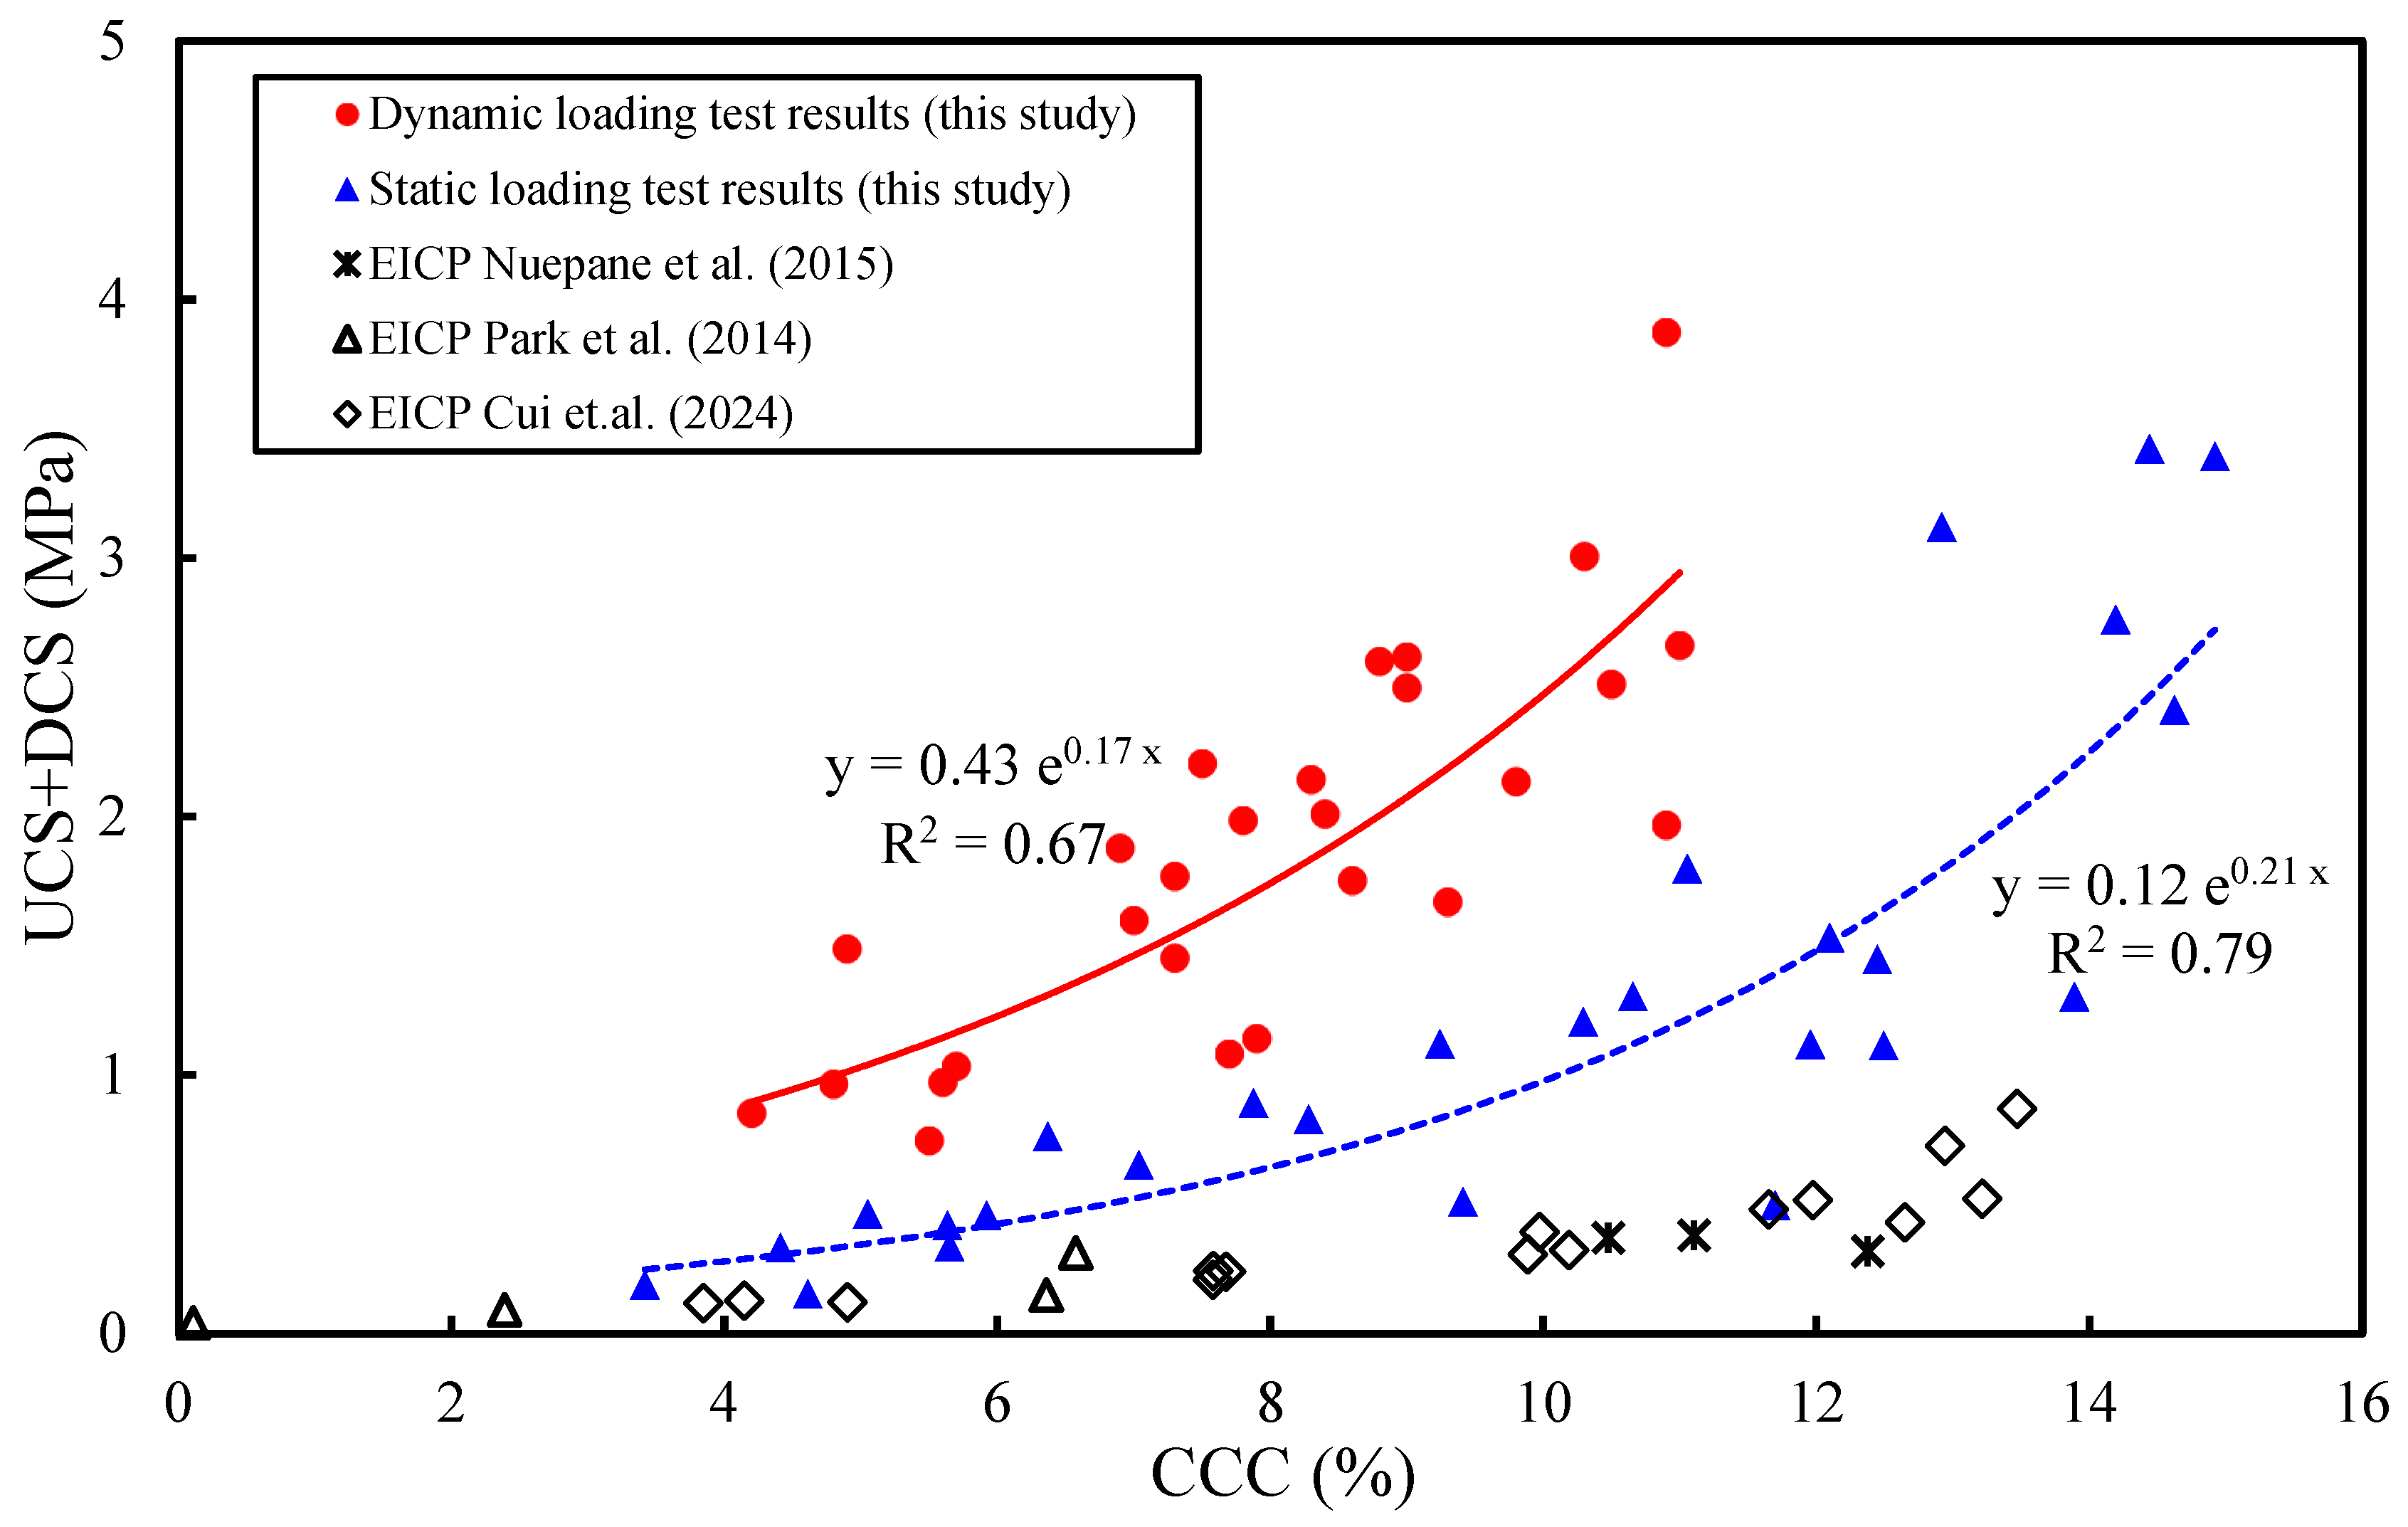
At the same CCC, the dynamic strength is higher than the static strength. Both strengths increase with increasing CCC and exhibit an exponential relationship with CCC. The dynamic strength increases from 0.85 MPa to 3.8 MPa as CCC rises from 4.2% to 10.9%, while the static strength increases from 0.19 MPa to 3.39 MPa with CCC rising from 3.62% to 14.92%. The observed exponential correlation between UCS and CCC was consistent with the trends reported in previous studies [27,42,65,66], thereby corroborating the reliability of the data obtained in this work. As shown in Figure 10, the UCS under static loading in this study is considerably higher than those reported in [4,65,66]. In addition, the UCS under dynamic loading in this study was higher than that in previous works [65,66] at comparable CCC levels. A comparison of the compressive strength under dynamic and static loading conditions reveals that, at the same CCC, the compressive stress of specimens under dynamic loading is on average approximately 1.5 MPa higher, with a maximum increase of 2.5 MPa, compared to those under static loading conditions. This result demonstrates the enhanced strength and superior impact resistance of the EICP-reinforced calcareous sand, ensuring greater structural stability under dynamic loading. Compared with existing studies, this paper obtained higher static and dynamic compressive strengths under similar calcium carbonate content (CCC). The synergistic effect of particle gradation (1:1 mix of fine and coarse sand) and fiber dosage (0.4%) was systematically optimized, leading to a more stable load-bearing skeleton and a more uniform stress transfer path. This specific combination has rarely been systematically discussed in previous research. This study is the first to systematically compare the strength differences of EICP-cemented calcareous sand under static and dynamic loading conditions at the same CCC. Such dynamic-static strength comparison data are still relatively scarce in the existing literature, revealing that biocemented calcareous sand exhibits significant strain rate sensitivity. Therefore, Figure 11 not only provides a comparison of strength values but also intuitively demonstrates the unique contribution of this study in elucidating the synergistic enhancement mechanism of EICP and fibers, as well as its dynamic resistance advantages. This is of great reference value for island and reef engineering structures subjected to transient or impact loads.

3.8. SEM Microscopic Analysis

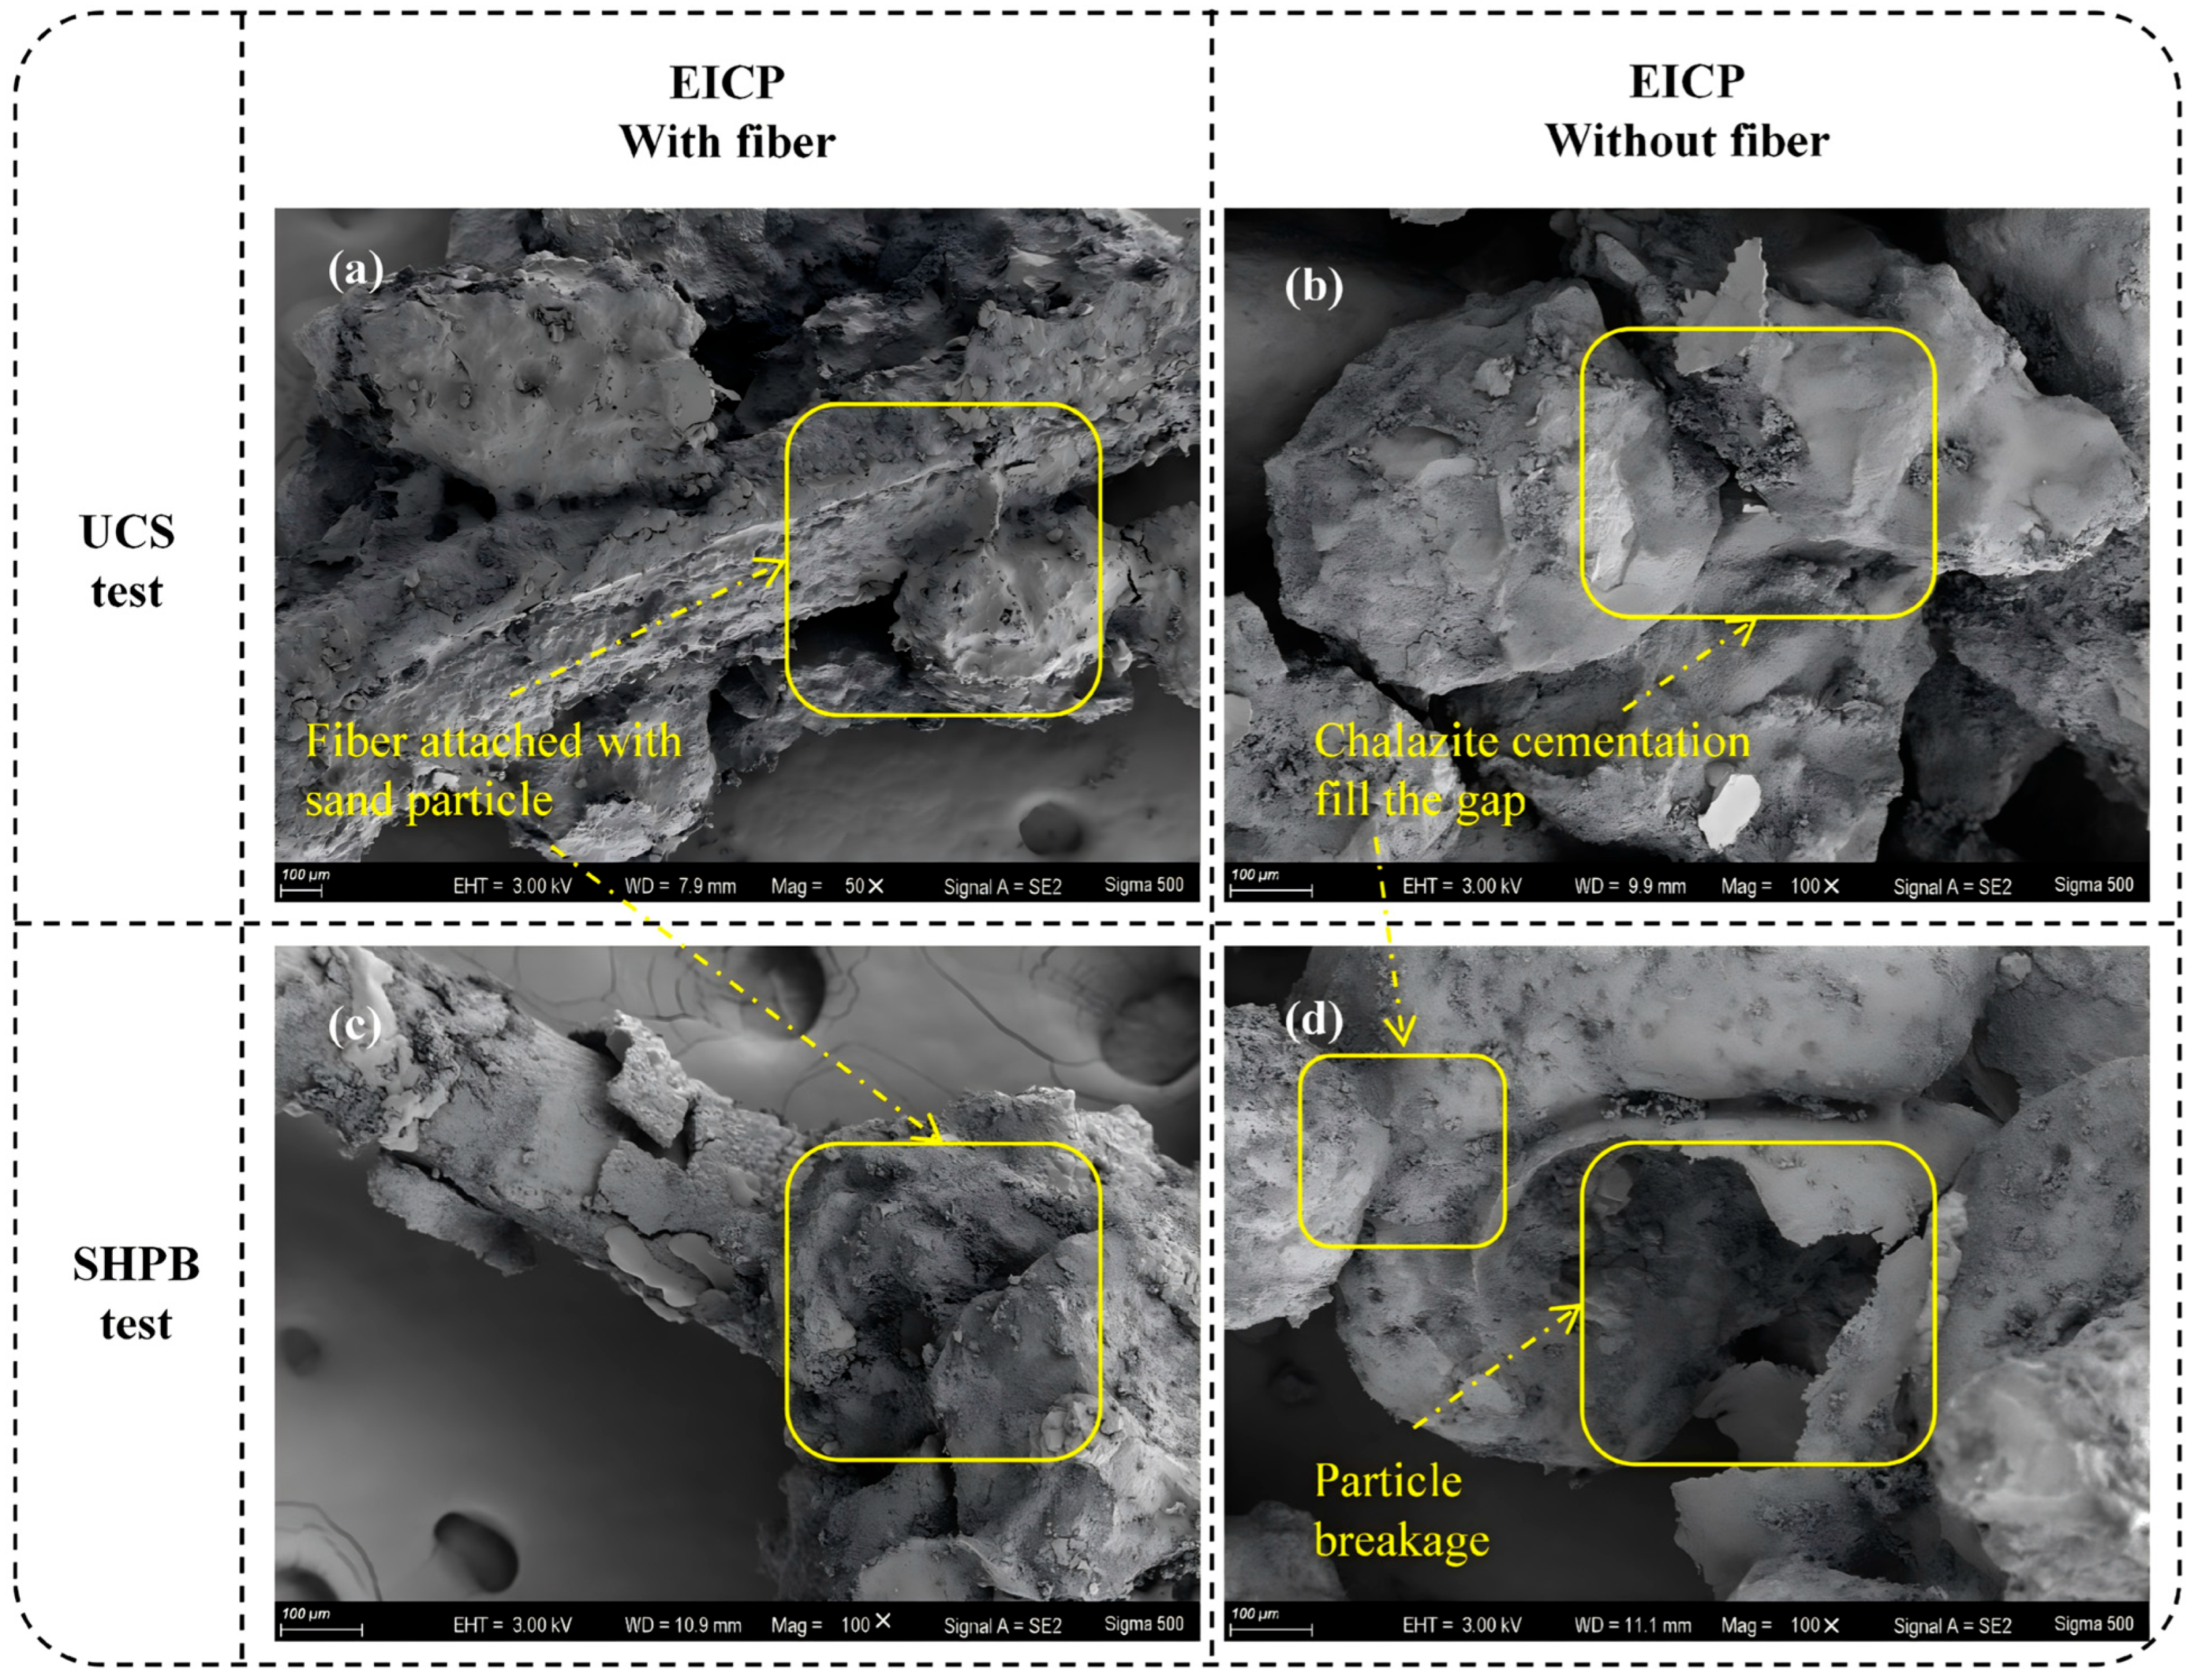
Scanning electron microscopy (SEM) observations revealed that the CaCO3 precipitates consisted of a mixture of blocky and platy morphologies. The blocky particles were predominantly distributed on sand grain surfaces, whereas the platy crystals were more frequently observed bridging adjacent particles, contributing to interparticle cementation. Under dynamic testing, in specimens with fibers, sand particles are cemented to the fibers by calcium carbonate, leading to a stronger structure. However, local fracture of the fibers still occurs. In specimens without fibers, the sand particles are broken upon impact. Under static testing, in specimens with fibers, sand particles adhere to the fibers, and no obvious damage is found at the interfaces between fibers and sand particles. In specimens without fibers, the inter-particle connection between sand grains is relatively weak. Scanning electron microscopy (SEM) observations revealed that after static loading, CaCO3 crystals predominantly appeared as plate-like or block-like structures, filling the voids between sand particles and cementing them into a cohesive matrix, as shown in Figure 11a,b. Damage mainly occurred at the interfaces within the cementitious phase or between the cementitious material and sand particles, and the resulting crack paths were relatively simple and clearly defined. After dynamic loading, fiber-containing specimens exhibited good bonding (Figure 11c), while non-fiber specimens showed particle fragmentation (Figure 11d), indicated disruption of the internal bonding network within the specimens, confirming the macroscopic phenomenon of complete specimen disintegration observed under impact loading.

4. Conclusions

This study examined the engineering properties of calcareous sand cemented with coconut fiber via enzyme-induced carbonate precipitation. The investigation was conducted under both dynamic and static loading conditions, considering different fiber addition ratios and coarse sand contents, and analyzed the micro-scale mechanisms underlying the observed strength variations.
  • SHPB tests indicate that fiber incorporation significantly enhances dynamic strength, and the dynamic compressive strength of both non-fiber and fiber-reinforced specimens increases with increasing impact pressure. Based on static and dynamic tests, the optimal mix ratio for EICP-reinforced calcareous sand is determined as 50% coarse sand content and 0.4% fiber content.
  • Dynamic strength increases with both calcium carbonate content (CCC) and impact pressure. Under identical CCC conditions, the dynamic strength consistently exceeds the static strength, with a maximum difference of up to 2.5 MPa. Both strengths exhibit an exponential correlation with CCC.
  • Fiber incorporation significantly enhances the dynamic strength of EICP-reinforced specimens. Impact pressure has a significant effect on the strength of specimens with different fiber contents: as the impact pressure increases, the influence of fiber content on specimen strength gradually decreases.
  • SEM observations confirm that the strength improvement is attributed to the bonding between fibers and cementitious materials and the filling of inter-particle voids by CaCO3 precipitates. In practical applications, particular attention should be paid to achieving uniform fiber distribution, as locally excessive or insufficient fiber content may compromise the reinforcement effectiveness.

Author Contributions

Y.Z.: writing—original draft and conceptualization; C.W.: writing—review and editing, supervision, and funding acquisition. S.Z.: investigation and data curation; J.Z.: data curation; M.K.: writing—review and editing; T.C.: writing—review and editing. All authors have read and agreed to the published version of the manuscript.

Funding

This research was funded by the National Natural Science Foundation of China, grant numbers 42177141.

Institutional Review Board Statement

Not applicable.

Informed Consent Statement

Not applicable.

Data Availability Statement

The original contributions presented in this study are included in the article. Further inquiries can be directed to the corresponding author(s).

Conflicts of Interest

The authors declare no conflict of interest.

Abbreviations

CCCCalcium carbonate content
CSCementation solution
CSCContent of coarse sand
DCSDynamic compressive strength
DIFDynamic increase factor
EICPEnzyme-Induced Calcium Carbonate Precipitation
FCFiber content
MICPMicrobially Induced Carbonate Precipitation
RTReinforcement times
SEMScanning electron microscopy
SHPBSplit Hopkinson pressure bar
UCSUnconfined compressive strength

References

  1. Wang, X.Z.; Jiao, Y.Y.; Wang, R.; Hu, M.J.; Meng, Q.S.; Tan, F.Y. Engineering Characteristics of the Calcareous Sand in Nansha Islands, South China Sea. Eng. Geol. 2011, 120, 40–47. [Google Scholar] [CrossRef]
  2. Brandes, H.G. Simple Shear Behavior of Calcareous and Quartz Sands. Geotech. Geol. Eng. 2011, 29, 113–126. [Google Scholar] [CrossRef]
  3. Ahmed, T.; Elchalakani, M.; Basarir, H.; Karrech, A.; Sadrossadat, E.; Yang, B. Development of ECO-UHPC Utilizing Gold Mine Tailings as Quartz Sand Alternative. Clean. Eng. Technol. 2021, 4, 100176. [Google Scholar] [CrossRef]
  4. Cui, M.J.; Zhou, J.N.; Lai, H.J.; Zheng, J.J.; Huang, M.; Zhang, Z.C. Seawater-Based Soybean Urease for Calcareous Sand Biomineralization. Acta Geotech. 2024, 19, 6643–6659. [Google Scholar] [CrossRef]
  5. Wang, X.; Liu, J.Q.; Cui, J.; Wang, X.Z.; Shen, J.H.; Zhu, C.Q. Particle Breakage Characteristics of a Foundation Filling Material on Island-Reefs in the South China Sea. Constr. Build. Mater. 2021, 306, 124690. [Google Scholar] [CrossRef]
  6. Ismail, M.A.; Joer, H.A.; Sim, W.H.; Randolph, M.F. Effect of Cement Type on Shear Behavior of Cemented Calcareous Soil. J. Geotech. Geoenviron. Eng. 2002, 128, 520–529. [Google Scholar] [CrossRef]
  7. Zhu, J.X.; Xue, S.Z.; Xu, L.Y.; Lan, J.R.; Huang, B.T.; Dai, J.G. Serpentine-Induced Synergistic Enhancement of Tensile Strength and Ductility in High-Strength Engineered/Strain-Hardening Cementitious Composites (ECC/SHCC). Cem. Concr. Compos. 2026, 168, 106505. [Google Scholar] [CrossRef]
  8. Su, Q.; Latypov, R.; Chen, S.; Zhu, L.; Liu, L.; Guo, X.; Qian, C. Life Cycle Assessment and Environmental Load Management in the Cement Industry. Systems 2025, 13, 611. [Google Scholar] [CrossRef]
  9. Almajed, A.; Moghal, A.A.B.; Nuruddin, M.; Mohammed, S.A.S. Comparative Studies on the Strength and Swell Characteristics of Cohesive Soils Using Lime and Modified Enzyme-Induced Calcite Precipitation Technique. Buildings 2024, 14, 909. [Google Scholar] [CrossRef]
  10. Yan, Z.; Gowthaman, S.; Nakashima, K.; Kawasaki, S. Polymer-Assisted Enzyme Induced Carbonate Precipitation for Non-Ammonia Emission Soil Stabilization. Sci. Rep. 2022, 12, 8821. [Google Scholar] [CrossRef] [PubMed]
  11. Alotaibi, E.; Arab, M.G.; Abdallah, M.; Nassif, N.; Omar, M. Life Cycle Assessment of Biocemented Sands Using Enzyme Induced Carbonate Precipitation (EICP) for Soil Stabilization Applications. Sci. Rep. 2022, 12, 6032. [Google Scholar] [CrossRef] [PubMed]
  12. Whiffin, V.S. Microbial CaCO3 Precipitation for the Production of Biocement. Ph.D. Dissertation, Murdoch University, Murdoch, Australia, 2004. [Google Scholar]
  13. Whiffin, V.S.; Van Paassen, L.A.; Harkes, M.P. Microbial Carbonate Precipitation as a Soil Improvement Technique. Geomicrobiol. J. 2007, 24, 417–423. [Google Scholar] [CrossRef]
  14. Almajed, A.; Lateef, M.A.; Moghal, A.A.B.; Lemboye, K. State-of-the-Art Review of the Applicability and Challenges of Microbial-Induced Calcite Precipitation (MICP) and Enzyme-Induced Calcite Precipitation (EICP) Techniques for Geotechnical and Geoenvironmental Applications. Crystals 2021, 11, 370. [Google Scholar] [CrossRef]
  15. Song, Z.; Wu, C.; Li, Z.; Zhang, S.; Shen, D.; Zhang, F. Permeability Reduction of Rough Rock Fracture Through Microbially Induced Carbonate Precipitation. Rock Mech. Rock Eng. 2026, 1–18. [Google Scholar] [CrossRef]
  16. Kannan, K.; Bindu, J.; Vinod, P. Engineering Behaviour of MICP Treated Marine Clays. Mar. Georesour. Geotechnol. 2020, 38, 761–769. [Google Scholar] [CrossRef]
  17. Hamdan, N.; Kavazanjian, E., Jr. Enzyme-Induced Carbonate Mineral Precipitation for Fugitive Dust Control. Géotechnique 2016, 66, 546–555. [Google Scholar] [CrossRef]
  18. Jiang, N.J.; Yoshioka, H.; Yamamoto, K.; Soga, K. Ureolytic Activities of a Urease-Producing Bacterium and Purified Urease Enzyme in the Anoxic Condition: Implication for Subseafloor Sand Production Control by Microbially Induced Carbonate Precipitation (MICP). Ecol. Eng. 2016, 90, 96–104. [Google Scholar] [CrossRef]
  19. Arab, M.G.; Rohy, H.; Zeiada, W.; Almajed, A.; Omar, M. One-Phase EICP Biotreatment of Sand Exposed to Various Environmental Conditions. J. Mater. Civ. Eng. 2021, 33, 04020489. [Google Scholar] [CrossRef]
  20. Dubey, A.A.; Hooper-Lewis, J.; Ravi, K.; Dhami, N.K.; Mukherjee, A. Biopolymer-Biocement Composite Treatment for Stabilisation of Soil Against Both Current and Wave Erosion. Acta Geotech. 2022, 17, 5391–5410. [Google Scholar] [CrossRef]
  21. Ahenkorah, I.; Rahman, M.M.; Karim, M.R.; Beecham, S. Unconfined Compressive Strength of MICP and EICP Treated Sands Subjected to Cycles of Wetting-Drying, Freezing-Thawing and Elevated Temperature: Experimental and EPR Modelling. J. Rock Mech. Geotech. Eng. 2023, 15, 1226–1247. [Google Scholar] [CrossRef]
  22. Liu, Y.; Gao, Y.; Zhou, Y.; Meng, H.; Li, C. Evaluation of Enzyme-Induced Carbonate Precipitation Using Crude Soybean Urease During Soil Percolation. Acta Geotech. 2024, 19, 1571–1580. [Google Scholar] [CrossRef]
  23. Zhang, S.; Wu, C.; Li, Z.; Song, Z.; Liu, Z.; Zhang, S. Experimental Investigation on the Failure Behavior of EICP Combined with Sisal Fiber-Reinforced Sandy Soil Subjected to Plasma Blasting. Acta Geotech. 2026, 21, 767–789. [Google Scholar] [CrossRef]
  24. Meng, H.; Shu, S.; Gao, Y.; Yan, B.; He, J. Multiple-Phase Enzyme-Induced Carbonate Precipitation (EICP) Method for Soil Improvement. Eng. Geol. 2021, 294, 106374. [Google Scholar] [CrossRef]
  25. Martin, K.; Tirkolaei, H.K.; Kavazanjian, E. Enhancing the Strength of Granular Material with a Modified Enzyme-Induced Carbonate Precipitation (EICP) Treatment Solution. Constr. Build. Mater. 2021, 271, 121529. [Google Scholar] [CrossRef]
  26. Zhang, J.; Yin, Y.; Shi, W.; Bian, H.; Shi, L.; Wu, L.; Han, Z.; Zheng, J.; He, X. Strength and Uniformity of EICP-Treated Sand Under Multi-Factor Coupling Effects. Biogeotechnics 2023, 1, 100007. [Google Scholar] [CrossRef]
  27. Song, Y.; Lai, Y.; Chen, Y.; Chen, G.; Zhang, J.; Zheng, J.; Liu, W. Analysis of Mechanical Properties and Microscopic Mechanism of EICP Synergistic Basalt Fiber Solidified Calcareous Sand. Mar. Georesour. Geotechnol. 2025, 44, 2048–2062. [Google Scholar] [CrossRef]
  28. Mi, T.; Peng, L.; Yu, K.; Zhao, Y. Optimizing Microbial- and Enzyme-Induced Carbonate Precipitation Treatment Regimes to Improve the Performance of Recycled Aggregate Concrete. Case Stud. Constr. Mater. 2023, 19, e02261. [Google Scholar] [CrossRef]
  29. Xu, W.; Zheng, J.; Cui, M.; Lai, H. Enzyme-Induced Carbonate Precipitation for the Stabilization of Heavy Metal-Contaminated Landfill Soils: A Sustainable Approach to Resource Recovery and Environmental Remediation. Sustainability 2025, 17, 4630. [Google Scholar] [CrossRef]
  30. Phua, Y.J.; Røyne, A. Bio-Cementation Through Controlled Dissolution and Recrystallization of Calcium Carbonate. Constr. Build. Mater. 2018, 167, 657–668. [Google Scholar] [CrossRef]
  31. Almajed, A.; Khodadadi Tirkolaei, H.; Kavazanjian, E., Jr. Baseline Investigation on Enzyme-Induced Calcium Carbonate Precipitation. J. Geotech. Geoenviron. Eng. 2018, 144, 04018081. [Google Scholar] [CrossRef]
  32. Lai, H.J.; Cui, M.J.; Chu, J. Effect of pH on Soil Improvement Using One-Phase-Low-pH MICP or EICP Biocementation Method. Acta Geotech. 2023, 18, 3259–3272. [Google Scholar] [CrossRef]
  33. Zhang, S.; Shen, D.; Zhang, R.; Wu, C. The High-Strength Method of Reinforcing Sand Particles Using MICP Combined with Coconut Fiber Under Unsaturated Conditions in Marine and Coastal Regions. Case Stud. Constr. Mater. 2025, 22, e04550. [Google Scholar] [CrossRef]
  34. Stabnikov, V.; Chu, J.; Myo, A.N.; Ivanov, V. Immobilization of Sand Dust and Associated Pollutants Using Bioaggregation. Water Air Soil Pollut. 2013, 224, 1631. [Google Scholar] [CrossRef]
  35. Van Paassen, L.A. Bio-Mediated Ground Improvement: From Laboratory Experiment to Pilot Applications. In Geo-Frontiers 2011: Advances in Geotechnical Engineering; ASCE: Reston, VA, USA, 2011; pp. 4099–4108. [Google Scholar] [CrossRef]
  36. Chu, J. Solutions to Sustainability in Construction: Some Examples. Procedia Eng. 2016, 145, 1127–1134. [Google Scholar] [CrossRef]
  37. Wang, J.; Long, Y.; Zhao, Y.; Liu, X.; Pan, W.; Qu, J.; Wang, H.; Shi, Y. Numerical Simulation of Foundation Pit Dewatering Using Horizontal Seepage Reducing Body. Sci. Rep. 2022, 12, 1397. [Google Scholar] [CrossRef] [PubMed]
  38. DeJong, J.T.; Fritzges, M.B.; Nüsslein, K. Microbially Induced Cementation to Control Sand Response to Undrained Shear. J. Geotech. Geoenviron. Eng. 2006, 132, 1381–1392. [Google Scholar] [CrossRef]
  39. Li, S.; Li, C.; Yao, D.; Wang, S. Feasibility of Microbially Induced Carbonate Precipitation and Straw Checkerboard Barriers on Desertification Control and Ecological Restoration. Ecol. Eng. 2020, 152, 105883. [Google Scholar] [CrossRef]
  40. Li, Z.; Zhang, S.; Wu, C.; Liu, Z.; Shen, D. In Situ Improvement of Desert Sand and Plant Germination with Multiple Treatment of EICP Combined with ASKG. Land Degrad. Dev. 2025, 36, 3641–3654. [Google Scholar] [CrossRef]
  41. Yuan, L.; Li, G.; Liu, J.; Wang, P.; Liu, C.; Zhang, J. Study on Mechanical Properties of Sandy Soil Solidified by Enzyme-Induced Calcium Carbonate Precipitation (EICP). Buildings 2024, 14, 1977. [Google Scholar] [CrossRef]
  42. He, J.; Fang, C.; Mao, X.; Qi, Y.; Zhou, Y.; Kou, H.; Xiao, L. Enzyme-Induced Carbonate Precipitation for the Protection of Earthen Dikes and Embankments Under Surface Runoff: Laboratory Investigations. J. Ocean Univ. China 2022, 21, 306–314. [Google Scholar] [CrossRef]
  43. Zhang, S.; Liu, Z.; Li, Z.; Shen, D.; Wu, C. Experimental Study on the Reinforcement Mechanism and Wave Thumping Resistance of EICP Reinforced Sand Slopes. Biogeotechnics 2023, 1, 100041. [Google Scholar] [CrossRef]
  44. Liu, L.; Gong, L.; Jin, Y.; Shi, M.; Hu, Z.; Zhu, S.; Liu, S.; Hao, T.; Guo, X. Experimental Study on the Mechanical Behavior of EICP-Casein-Treated Calcareous Sand. Mar. Georesour. Geotechnol. 2024, 42, 1348–1367. [Google Scholar] [CrossRef]
  45. Yuan, H.; Ren, G.; Liu, K.; Zhao, Z. Effect of Incorporating Polyvinyl Alcohol Fiber on the Mechanical Properties of EICP-Treated Sand. Materials 2021, 14, 2765. [Google Scholar] [CrossRef] [PubMed]
  46. Liu, W.; Song, Y.; Jiang, J.; Chen, Y.; Yang, C.; Zhang, M.; Zhang, J.; Zheng, J. Mechanical Characterization of Calcareous Sand Reinforced by EICP Multivariate Tests and Synergistic Biochar Reinforcement. Mar. Georesour. Geotechnol. 2025, 43, 1659–1671. [Google Scholar] [CrossRef]
  47. Jiang, X.; Wang, H.; Yang, H.; Wei, Z.; Bao, S.; Fan, W.; Wang, Y. Triaxial Compression Behavior and Damage Model of EICP-Cemented Calcareous Sand. Geotech. Geol. Eng. 2025, 43, 77. [Google Scholar] [CrossRef]
  48. Lv, Y.; Wu, L.; Duan, Z.; Su, Y.; Zhang, D. Impact Behavior and Strain Rate Effects of Artificial Limestone by MICP. Biogeotechnics 2025, 3, 100154. [Google Scholar] [CrossRef]
  49. Li, G.; Hua, X.; Liu, J.; Zhang, Y.; Li, Y. Study on Dynamic Strength Characteristics of Sand Solidified by Enzyme-Induced Calcium Carbonate Precipitation (EICP). Materials 2024, 17, 4976. [Google Scholar] [CrossRef] [PubMed]
  50. Naeem, M.; Arab, M.G.; Elbaz, Y.; Omar, M.; Ezzat, H.; Zeiada, W. Resilient Behavior of Bio-Cemented Sandy Soil Treated with Enzyme-Induced Carbonate Precipitation for Pavement Applications. Constr. Build. Mater. 2024, 411, 134434. [Google Scholar] [CrossRef]
  51. Mahoney, M.; Francis, M.; Kennard, D. Performance of the Kawaihae Harbor Port Facility Resulting from the October 2006 Earthquake. In Solutions to Coastal Disasters 2008; ASCE: Reston, VA, USA, 2008; pp. 925–938. [Google Scholar] [CrossRef]
  52. Luo, H.; Cooper, W.L.; Lu, H. Effects of Particle Size and Moisture on the Compressive Behavior of Dense Eglin Sand Under Confinement at High Strain Rates. Int. J. Impact Eng. 2014, 65, 40–55. [Google Scholar] [CrossRef]
  53. Chen, H.; Zhang, C.; Wei, J.; Li, M.; Wang, Y. A Modified Method for Estimating the Stress State of Granular Materials in the Passive Confined Pressure SHPB Tests. Int. J. Impact Eng. 2022, 160, 104063. [Google Scholar] [CrossRef]
  54. Sun, X.; Miao, L.; Wu, L. Applicability and Theoretical Calculation of Enzymatic Calcium Carbonate Precipitation for Sand Improvement. Geomicrobiol. J. 2020, 37, 389–399. [Google Scholar] [CrossRef]
  55. Gao, Y.; He, J.; Tang, X.; Chu, J. Calcium Carbonate Precipitation Catalyzed by Soybean Urease as an Improvement Method for Fine-Grained Soil. Soils Found. 2019, 59, 1631–1637. [Google Scholar] [CrossRef]
  56. Jiang, Q.W.; Huang, M.; Xu, K.; Cui, M.J.; Jin, G.X.; Zhang, X.P. Effect of Particle Size on Mechanical Properties of Bio-Cemented Sand Using Enzyme-Induced Calcite Precipitation. Geomech. Energy Environ. 2025, 43, 100718. [Google Scholar] [CrossRef]
  57. Kou, H.; He, X.; Li, Z.; Fang, W.; Zhang, X.; An, Z.; Wu, Y. Effect of Drying-Wetting Cycles on the Durability of Calcareous Sand Reinforced by MICP and Recycled Shredded Coconut Coir (RSC). Biogeotechnics 2023, 1, 100038. [Google Scholar] [CrossRef]
  58. Jiang, X.; Wang, H.; Yang, H.; Du, T.; Liu, P.; Duan, J. Triaxial Compression Characteristics and Brittleness Evaluation of Calcareous Sand Cemented with EICP and Coir Fiber. Results Eng. 2025, 25, 104090. [Google Scholar] [CrossRef]
  59. Liu, S.; Yang, J.; Cui, L.; Zhang, Z.; Fang, K. Microcrack Evolution and Mechanical Performance of Fiber-Reinforced High Water-Resistant Concrete Backfill: A Quantitative Multi-Scale Study. Constr. Build. Mater. 2026, 531, 146674. [Google Scholar] [CrossRef]
  60. Yasuhara, H.; Neupane, D.; Hayashi, K.; Okamura, M. Experiments and Predictions of Physical Properties of Sand Cemented by Enzymatically-Induced Carbonate Precipitation. Soils Found. 2012, 52, 539–549. [Google Scholar] [CrossRef]
  61. GB/T 50123-2019; Standard for Geotechnical Testing Method. China Planning Press: Beijing, China, 2019.
  62. Xiong, Z.; Su, Y.; Hu, Z.; Huang, Y.; Wang, Z.; Chen, J.; Lao, W.; Li, L.; Zhou, K.; Kuang, J. Dynamic Compression Study of Seawater Sea Sand Concrete Incorporated with Expansive Agents and Glass Fibre. J. Build. Eng. 2023, 79, 107942. [Google Scholar] [CrossRef]
  63. Lv, T.H.; Chen, X.W.; Chen, G. Analysis on the Waveform Features of the Split Hopkinson Pressure Bar Tests of Plain Concrete Specimen. Int. J. Impact Eng. 2017, 103, 107–123. [Google Scholar] [CrossRef]
  64. Feng, T.; Wang, F.; Tan, Y.; Yue, C.; Xu, W.; Liu, Z.; Yang, Z.; Wu, Y.; Jiang, J. Dynamic Compression Mechanical Properties of Eco-Friendly Ultra-High Performance Concrete Produced with Aeolian Sand: Experimental and Three-Dimensional Mesoscopic Investigation. Int. J. Impact Eng. 2022, 164, 104192. [Google Scholar] [CrossRef]
  65. Neupane, D.; Yasuhara, H.; Kinoshita, N.; Ando, Y. Distribution of Mineralized Carbonate and Its Quantification Method in Enzyme Mediated Calcite Precipitation Technique. Soils Found. 2015, 55, 447–457. [Google Scholar] [CrossRef]
  66. Park, S.S.; Choi, S.G.; Nam, I.H. Effect of Plant-Induced Calcite Precipitation on the Strength of Sand. J. Mater. Civ. Eng. 2014, 26, 06014017. [Google Scholar] [CrossRef]
Figure 1. Mechanism and production of enzyme-induced calcium carbonate specimen. Source: drafted by the authors.
Sustainability 18 07903 g001
Figure 2. Split Hopkinson pressure bar (SHPB) setup and test signals: (a) schematic diagram of the Hopkinson bar system, (b) original waveform, and (c) verification of data validity. Source: drafted by the authors.
Sustainability 18 07903 g002
Figure 3. Failure performance during UCS and SHPB testing. Source: drafted by the authors.
Sustainability 18 07903 g003
Figure 4. UCS of samples with different fiber content under static pressure: (a) 0%, (b) 0.2%, and (c) 0.4%. Source: drafted by the authors.
Sustainability 18 07903 g004
Figure 5. UCS of samples with different coarse sand content under static pressure: (a) 0%; (b) 50%; (c) 100%. Source: drafted by the authors.
Sustainability 18 07903 g005aSustainability 18 07903 g005b
Figure 6. Stress-displacement curves of samples with different treatment conditions under static pressure: (a) coarse sand contents, (b) reinforcement times, and (c) fiber contents. Source: drafted by the authors.
Sustainability 18 07903 g006
Figure 7. The stress–strain curves during SHPB testing under different impact gas pressures. Source: drafted by the authors.
Sustainability 18 07903 g007
Figure 8. Relationship between dynamic compressive strength and CCC of sample with different impact gas pressures: (a) 0.25 MPa, (b) 0.35 MPa, and (c) 0.45 MPa. Source: drafted by the authors.
Sustainability 18 07903 g008aSustainability 18 07903 g008b
Figure 9. Relationship between dynamic compressive strength and CCC of sample with different fiber content: (a) 0%, (b) 0.2%, and (c) 0.4%. Source: drafted by the authors.
Sustainability 18 07903 g009aSustainability 18 07903 g009b
Figure 10. Relationship between compressive strength and CCC obtained from dynamic and static tests: comparison between the present study and previous studies. Comparative literature data are presented as: open crosses for Nuepane et al. (2015) [65]; open triangles for Park et al. (2014) [66]; and open diamonds for Cui et al. (2024) [4]. Source: drafted by the authors.
Sustainability 18 07903 g010
Figure 11. SEM images of samples: (a) sample with 0.4% fiber after UCS test, (b) sample without fiber after UCS test, (c) sample with 0.4% fiber after SHPB test, and (d) sample without fiber after SHPB test. Source: drafted by the authors.
Sustainability 18 07903 g011
Table 1. Physical properties of the sand column specimens.
Particle Size (mm)Specific GravityWeight
(g)
Volume
(cm3)
Pore Volume
(cm3)
Fine sand: 0.5–1
Coarse sand: 1–2
2.86849.06 24.29
Table 2. Experimental groups for EICP treated sand columns.
No.Content of Coarse Sand (%)Fiber Content (%)Reinforcement Times
FC0%-CSC0%-RT2002, 3, 4
FC0%-CSC50%-RT3500
FC0%-CSC100%-RT41000
FC0.2%-CSC0%-RT200.2
FC0.2%-CSC50%-RT3500.2
FC0.2%-CSC0%-RT41000.2
FC0.4%-CSC0%-RT200.4
FC0.4%-CSC50%-RT3500.4
FC0.4%-CSC100%-RT41000.4
Note: (1) The specimen number is fiber content followed by the proportion of coarse sand and then treatment times, “FC” for fiber content, “CSC” for content of coarse sand and “RT” for reinforcement times. (2) Example: FC0%-CSC0%-RT2 indicates the specimen is no fiber, fully fine sand and 2 treatment times.
Table 3. Dynamic compressive strength and DIF of specimens with varying fiber contents.
No.Strain Rate (S−1)DCS (MPa)DIF
FC0%-IGP0.25-ε: 107 s−11071.881.04
FC0%-IGP0.35-ε: 128 s−11281.971.09
FC0%-IGP0.45-ε: 168 s−11682.011.12
FC0.2%-IGP0.25-ε: 109 s−11091.672.01
FC0.2%-IGP0.35-ε: 142 s−11422.603.13
FC0.2%-IGP0.45-ε: 169 s−11693.013.62
FC0.4%-IGP0.25-ε: 111 s−11111.771.46
FC0.4%-IGP0.35-ε: 205 s−12052.131.77
FC0.4%-IGP0.45-ε: 216 s−12162.662.20
Disclaimer/Publisher’s Note: The statements, opinions and data contained in all publications are solely those of the individual author(s) and contributor(s) and not of MDPI and/or the editor(s). MDPI and/or the editor(s) disclaim responsibility for any injury to people or property resulting from any ideas, methods, instructions or products referred to in the content.