Article

Sustainability Assessment of Slurry Application Through Soil Carbon and Nitrogen Dynamics

1
Research Institute of Water and Environmental Engineering, Universitat Politècnica de València, Camino de Vera s/n, 46022 València, Spain
2
Department of Chemistry, Physics, Environmental and Soil Sciences, University of Lleida, Avinguda Alcalde Rovira Roure 191, E-25198 Lleida, Spain
3
Faculty of Agricultural Sciences, National University of Córdoba, Félix Aldo Marrone 746, Ciudad Universitaria, Córdoba X5000HUA, Argentina
*
Author to whom correspondence should be addressed.
Sustainability 2026, 18(15), 7725; https://doi.org/10.3390/su18157725
Submission received: 29 June 2026 / Revised: 20 July 2026 / Accepted: 28 July 2026 / Published: 30 July 2026
(This article belongs to the Section Sustainable Agriculture)

Abstract

The sustainability of agricultural systems is linked to soil organic carbon (SOC) and nitrogen (N) dynamics, both of which are influenced by fertilization management. To investigate the long-term effects of pig slurry, a 10-year field experiment was conducted in a Mediterranean semi-arid rainfed cereal system. Four N treatments were compared: mineral fertilizer (MN), slurry from fattening pigs (FS), slurry from gestating sows (SS), and a zero-N control. Grain and straw yields, SOC and its fractions, microbial biomass and activity, and N mineralization were measured after the final cropping season. Slurry increased grain yield by 21% compared with MN. The FS treatment also increased SOC by 24% compared with the MN treatment, mainly through the mineral-associated organic matter fraction (<0.05 mm). Soil basal respiration dynamics (Gompertz model) and the N mineralization rate (0.04382 day–1; Stanford–Smith model) did not differ among N-fertilized treatments. However, the potentially mineralizable N pool increased under N fertilization, from 19% in MN to 51% in FS relative to the control. These results indicate that repeated applications of pig slurry can replace mineral fertilizer while maintaining or improving crop productivity and soil C storage. Incorporating N mineralization models into fertilization planning could further optimize slurry application rates and timing.

1. Introduction

Conservation of soil organic carbon (SOC) content, due to its role in the prevention of soil degradation, has been included in the European Union strategic plans that Member States are required to implement under the Common Agricultural Policy [1].
The influence of soil management on the maintenance or increase in total SOC stock [2], as well as its influence on the amount of different SOC physical fractions, is of considerable interest, i.e., to address global change [3]. Physical SOC fractionation separates pools with contrasting stabilization mechanisms and turnover rates [4,5]: a labile pool and an intermediate pool associated with coarse (2–0.2 mm) and fine (0.2–0.05 mm) sand-size SOC fractions (mainly plant-derived compounds), and a mineral-associated fraction (<0.05 mm) that turns over more slowly [6]. The outcomes of this decoupling in turnover rates need not differ, since a lower decomposition rate can be offset by a larger pool size [7]. The application of livestock waste generally promotes greater SOC accumulation than the application of equivalent nutrients as mineral fertilizers [8,9].
Soil respiration, measured as CO2 evolution during incubation or field monitoring, is widely used to assess microbial activity [10] and carbon mineralization, offering insights into carbon availability and the functioning of soil microorganisms in response to agricultural practices [11,12]. Soil carbon dynamics in the long-term have also been pointed out as a matter of interest, particularly in pig and poultry manures [13].
Pig slurry is widely used in areas of intensive livestock production, being a source of nutrients and organic matter. Spain is the leader of pig production among the 27 European countries (with a total production of ~132 million heads in 2024) [14]. Thus, large quantities of slurry are generated annually, which are commonly recycled through agricultural land application. Pig slurry composition varies according to animal type and production system [15]. Differences in dry matter, organic carbon, and nitrogen (N) contents may affect the quantity and quality of organic matter added to the soil. Soil microorganisms play a central role in the transformation of slurry-derived carbon and N. Consequently, indicators such as microbial biomass, soil respiration, and N mineralization can provide valuable information on changes in soil quality and nutrient availability resulting from long-term fertilization practices [16,17]. The N and C mineralization dynamics through modeling may provide a quantitative approach for understanding N availability and C release. Furthermore, as changes in soil carbon stocks occur slowly, long-term experiments are required to assess the capacity of organic fertilization to enhance SOC stocks while maintaining crop productivity [18].
Slurry is applied based on an N balance, which requires knowledge of N mineral availability prior to sowing, usually accounted in nitrate form. However, in Mediterranean rainfed systems, soil nitrate content measured at the end of the summer drought (just before sowing) usually underestimates N availability. This occurs because drought temporarily suppresses the activity of ammonia- and nitrite-oxidizing microorganisms, especially in soils exposed to a single prolonged dry period [19]. This constraint may lead to N overfertilization at sowing with the associated environmental problems.
In Spanish dryland areas, winter cereals such as barley (Hordeum vulgare L.) and wheat (Triticum aestivum L.) are the main crops, although barley occupies the largest area [20]. Commonly, N fertilization in barley may have 50 kg N ha–1 applied in the seedbed or shortly after emergence, and the rest of the mineral N is applied in spring in one or two applications up to the first node stage [21]. Currently, mineral N applications can be replaced by N of organic origin, as it can improve the utilization efficiency and rate of fertilizer [22].
We hypothesized that under Mediterranean rainfed conditions, repeated applications of pig slurry at the cereal tillering stage would maintain crop productivity, and they would provide additional benefits compared with mineral fertilization by increasing SOC stock and stimulating soil biological activity, although these effects would differ according to slurry type due to its composition differences. In addition, the study of N mineralization dynamics will allow more precise N fertilization planning. To test the hypothesis, a ten-year field experiment was conducted in a semiarid Mediterranean rainfed cereal system comparing mineral fertilization with applications of slurry from fattening pigs (FS) and from sows (SS). The objectives were to (i) evaluate crop yields; (ii) evaluate the effects of long-term slurry application on SOC fractions and microbial biomass; (iii) assess the influence of fertilization treatments on soil carbon stock and mineralization; and (iv) determine their effects on soil N dynamics through a laboratory incubation experiment.
This study aimed to contribute to a better understanding of the role of pig slurry management in enhancing SOC sequestration, improving soil quality, and sustaining crop productivity in semiarid Mediterranean agroecosystems.

2. Materials and Methods

2.1. Study Site

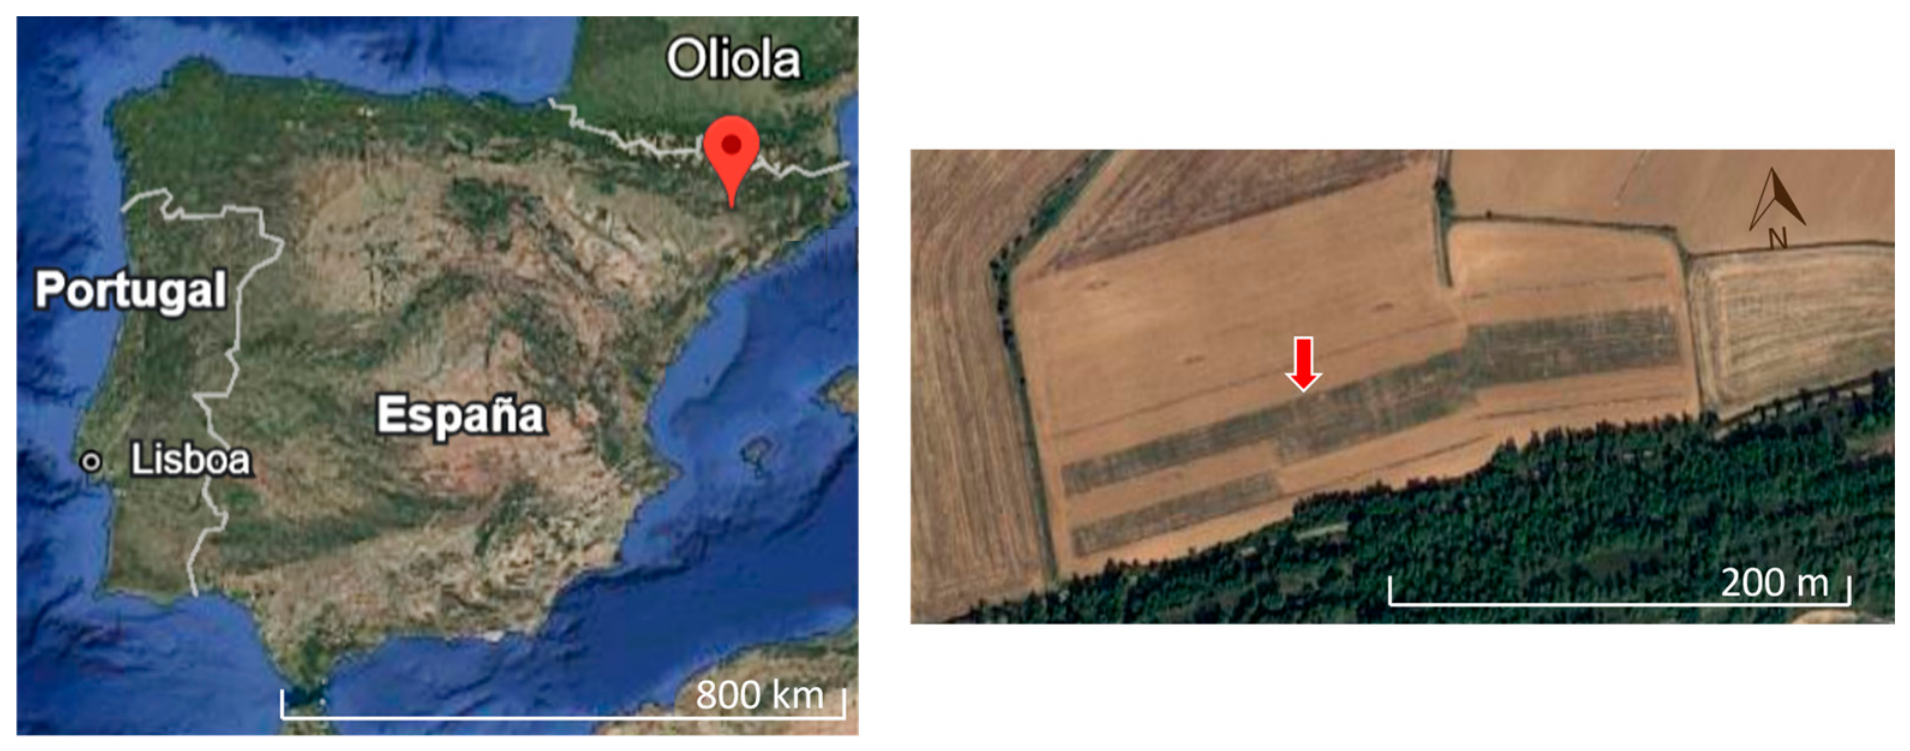
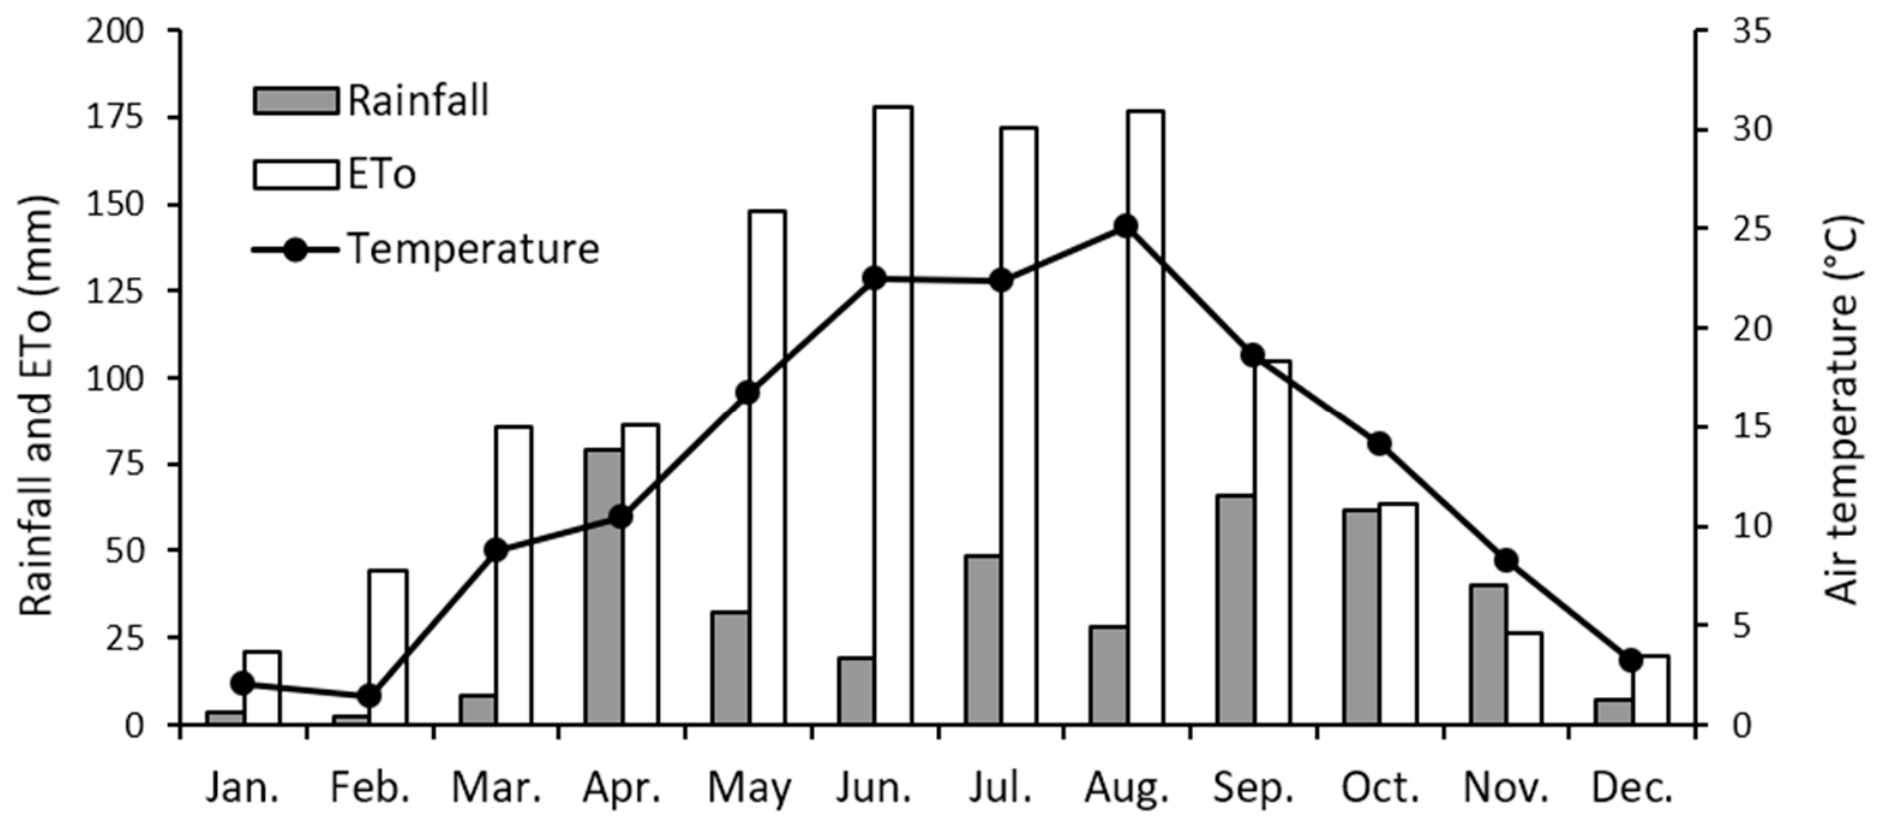
The experiment was established in Oliola (41°52′29″ N; 1°09′10″ E; 443 m a.s.l.) (Figure 1), Northeastern Spain, in 2002. The site has a semiarid Mediterranean climate, with a mean annual precipitation (November–October) of 438 mm (10-year average; range: 328–590 mm), a mean annual temperature of 12.6 °C, and a mean maximum summer temperature of 30.8 °C (Figure 2). During the sampling year, seasonal rainfall during the winter cereal growing period amounted to 298 mm.
The soil was classified as Typic Xerofluvent [24]. The soil texture (0–0.3 m) was silty loam (131 g kg−1 sand, 609 g kg−1 silt, 260 g kg−1 clay), and illite and chlorite were the dominant clay materials. The average bulk density was 1.65 Mg m–3, as determined by the core method after harvest. Soil water retention at –33 kPa (sieved samples, <2 mm) was 0.269 cm3 cm–3. Initial soil properties (0–0.3 m) were pH 8.2 (1:2.5; soil–water), electrical conductivity 0.2 dS m−1 (1:5; soil–water), organic carbon 8.7 g kg−1 (Walkley and Black method, adapted by [25], and approximately 300 g kg−1 CaCO3 (Bernard’s calcimeter method).

2.2. Description of the Experiments and Treatments

The long-term field experiment was established to evaluate different fertilization N treatments in a winter cereal rotation. Treatments were arranged in a randomized block design with three replicates. The experiment was conducted over a ten-year period, comprising nine winter cereal cropping seasons and one fallow season (6th year). The fallow season was excluded from the performed analyses.
Winter wheat rotated with barley: one year wheat and two years barley. The exception to the sequence was the fallow year when barley was not sown, and in the last cropping season (10th year) when barley was sown for the third time in the cropping sequence. Both cereals were sown under rainfed conditions at a seeding rate of 200 kg ha−1 in late October−early November, and they were harvested in late June−early July. Straw was removed, leaving approximately 38% of straw biomass as stubble. Before sowing (from late September onwards), stubble was incorporated (~0.15 m depth) using a disk harrow.
In the last cropping season, four fertilization treatments were sampled: a control (CO), mineral fertilization (MN), and two pig slurry treatments differing in origin (from fattening pigs (FS) and sows (SS)). At sowing, phosphorus and potassium were applied to the CO and MN treatments (42 kg P ha−1 yr−1 and 89 kg K ha−1 yr−1). The control received no N, whereas the mineral treatment received 120 kg N ha−1 as ammonium nitrate (33.5% N). The FS and SS treatments received slurry either from fattening pigs (30 t ha−1 yr−1) or from sows (80 t ha−1 yr−1) and left on the surface of the soil. For slurries, average P and K rates were inferred from earlier studies [15]. All N treatments were applied in early March before stem elongation, at the cereal tillering stage.
Plot size was 137.5 m2 (11 m × 12.5 m) for slurry treatments and 87.5 m2 (7 m × 12.5 m) for CO and MN treatments. The experiment included 12 plots in total.
Fertilization treatments (Table 1) were defined according to European regulations and agronomic recommendations. The EU Nitrates Directive (91/676/EEC) [26] limits organic N inputs to 170 kg N ha−1 yr−1 in vulnerable zones, although in non-vulnerable zones under winter cereals a maximum of 210 kg N ha−1 yr−1 is allowed in Catalonia, a Spanish region [27].

2.3. Pig Slurry Characteristics

Slurry samples were always collected from storage tanks before field application and transported refrigerated to the laboratory and analyzed. Apart from N (NH4+–N and organic N) by Kjeldahl method [28] and OC (by loss-on-ignition at 550 °C) analyses (Table 1), the following properties were determined in the last cropping season (Table 2): pH by potentiometry (1:5; slurry:water), electrical conductivity (EC) at 25 °C by conductimetry (1:5; slurry:water). Total phosphorus (P) and potassium (K) were obtained after wet acid digestion [29] and quantified by inductively coupled mass spectrometry (ICP-MS) in a 7700× analyzer (Agilent Technologies, Santa Clara, CA, USA), following the UNE-EN 17053 standard [30].

2.4. Description of Sampling and Analytical Methodologies

2.4.1. Grain and Straw Biomass Yields

In each plot, just before mechanical harvest, two areas of 0.25 m2 each were manually harvested at ground level to measure grain and straw barley biomass and to calculate the ratio of grain yield to total above-ground biomass. Straw height was also recorded. Afterwards, a 3.0 m wide and 12 m long area was mechanically harvested in each plot. Yields were adjusted to dry biomass (0% humidity). Grain moisture content was determined from a 300 g sample collected from each plot using a GAC® II, DICKEY-john device, Auburn, IL, USA. Straw was oven-dried at 65 °C to determine the dry matter content.

2.4.2. Soil Sampling

Soil samples (0–0.15 m) were collected at crop physiological maturity (2.5 months after the fertilizer application) using a 7 cm-diameter stainless steel core. Three soil samples were randomly collected from each plot and pooled to form a composite sample. Samples were kept refrigerated until processing and then sieved (<2 mm) at field moisture content (~96 g kg–1) for soil microbial biomass carbon (MBC) analyses and incubation. The rest of the sample was air-dried and sieved (<2 mm) for further analysis.

2.4.3. Soil Organic Carbon Fractions

Five granulometric–densimetric fractions were obtained from each of the 12 composite samples. Three particle-size fractions were first separated (<0.05 mm, 0.05–0.20 mm, and 0.20–2.00 mm), and the latter two were subsequently subdivided into light and heavy density fractions according to the NF X31-516 procedure [31]. Soil organic carbon was determined by dichromate oxidation followed by titration with ferrous ammonium sulfate [25].
Soil microbial biomass carbon was determined using the fumigation-extraction method [32]. Carbon was extracted with K2SO4 and quantified by dichromate oxidation under acidic conditions [33]. MBC was calculated as the difference between extractable C in fumigated and non-fumigated soil samples. An extraction efficiency factor (KEC) of 0.38 was applied [34]. All analyses were performed in triplicate for each of the 12 composite samples.

2.4.4. Soil Carbon Inputs and Relative Carbon Stock Evolution

Carbon inputs included the carbon contained in the stubble yield obtained in all treatments, along with the carbon supplied through slurry applications in the SS and FS treatments. Carbon from stubble was assumed to represent 48% of stubble dry biomass, based on the composition of barley straw [35]. Carbon from roots was also estimated by assuming that root biomass corresponds to 31.2% of grain yield and that carbon accounts for 39.4% of its composition [36,37].
The evolution of C stock (kg C ha–1) for each treatment (T) and 0–0.15 m depth (CSERT) was calculated in relative terms, adopting the mineral treatment (MN) as a reference and expressed in relation to the overall carbon input within the crop cycle (Equation (1)):
CSERT = (Cstock in soilT − Cstock in MN)/Ctotal inputT
For slurry treatments, the ratio was calculated again for SS and FS, adopting only the C from the slurry as input (excluding stubble and root biomass).

2.4.5. Soil Respiration and Carbon Mineralization Kinetics

Soil respiration was determined following the method described by [38], by measuring CO2 evolved during the incubation period. In 2 L airtight glass jars, 140 g of soil were placed. Soil moisture was adjusted to 65% of the water-holding capacity and maintained throughout the incubation period (52 days). A vial containing 25 mL of 0.1 M NaOH was placed inside the incubation jars to trap the released CO2. The incubation was conducted at 28 ± 2 °C in the dark, within the temperature range commonly used for laboratory soil respiration assays [39]. Furthermore, the mean air temperature during the warmest month at the study site is approximately 25 °C (Figure 2), while the average maximum temperature during the summer period reaches 31 °C. Summer surface soil temperature in Mediterranean semi-arid environments commonly exceeds air temperature. Recent studies have reported average summer soil–air temperature differences of up to approximately 2.8 °C [40]. Moisture losses were monitored by periodic weighing and corrected by spraying deionized water. Measurements were taken after 2, 9, 16, 23, 30, 37, and 52 days of incubation, and the vials were replaced at each sampling day. On each measurement day, 5 mL of 0.5 M BaCl2 and phenolphthalein indicator were added to the NaOH solution. The remaining alkali was then titrated with standardized HCl (0.1 M and subsequently 0.05 M) to quantify the amount of CO2 released. Cumulative CO2-C emissions were calculated.
Carbon mineralization kinetics were described using a sigmoidal model: the Gompertz model (Equation (2)).
C(t) = C · exp(−exp(−b·(t − t_m)))
where C(t) is cumulative mineralized C (mg kg−1) at time t (days), C is the potentially mineralizable C pool (mg kg−1), t_m (days) is the point at which the rate of mineralization is at its highest (the inflection point of the curve), and b (days) controls the ‘sharpness’ of the transition around t_m.

2.4.6. Soil Mineral Nitrogen and Nitrogen Net Mineralization Kinetics

A fresh soil subsample (<2 mm apparent diameter) was analyzed immediately after sampling (day 0) to determine ammonium (NH4+–N) and nitrate (NO3–N ) concentrations in each plot. Another subsample was the one used for the incubation experiment (see Section 2.4.5). Concentrations of NH4+–N and NO3–N were also determined at 2, 9, 16, 23, 30, 37, and 52 days of incubation. Total mineral N was calculated as the sum of both N forms. Mineral N (Nmin) was extracted with 1 M KCl using a 1:10 soil-to-extractant ratio and shaken for 1 h, following UNE-ISO/TS 14256-1 EX standard [41]. Potential ammonia and nitrous oxide losses during incubation were considered negligible based on previous studies from similar incubation experiments with slurry-amended soils [42,43].
Nitrogen mineralization kinetics were described using the first-order model of Stanford and Smith [44] (Equation (3)):
N(t) = A · (1 − ekt)
where N(t) is cumulative mineralized N (mg kg−1) at time t (days), A is the potentially mineralizable N pool (mg kg−1), and k is the mineralization rate constant (days−1).

2.5. Statistical Analysis

Fertilization effects on yields and SOC fractions were evaluated by analysis of variance using the SAS statistical package, version 9.4 [45], and significant results were further examined with the Duncan Multiple Range test (DMRT) (p = 0.05) for means separation.
The R statistical package version 4.3.3 [46] was used to fit experimental data on N and C mineralization dynamics to different decomposition models.
All analyses and parameter estimations for N mineralization kinetics were conducted using a nonlinear mixed-effects (NLME) modeling framework [47,48,49], fitting all 84 observations simultaneously. Since measurements were taken repeatedly on the same experimental units over time, the autocorrelation function of model residuals was examined. A compound symmetry correlation structure (Rho = 0.25) was incorporated, which improved model fit significantly over the base model (likelihood ratio test (LRT): χ2 = 5.07, df = 1, p = 0.024). An autoregressive AR(1) structure was evaluated but was not significant (p = 0.701). Block was included as a random effect on A to account for spatial heterogeneity among experimental units. To formally test whether treatments differed in their mineralization kinetics, three nested models were compared: (i) a full model with treatment-specific A and k; (ii) a reduced model with treatment-specific A and a common k; and (iii) a null model with common A and k for all treatments. Likelihood ratio tests were used to compare nested models with different fixed-effects structures (i.e., full vs. reduced vs. null models for A and k) following [47]. Model selection was guided by the Akaike Information Criterion and LRT p-values. Pairwise comparisons of the treatment-specific estimates of A for the selected model were performed using approximate t-tests on the fixed-effects coefficients (Wald-type tests), based on the model’s residual degrees of freedom. Residual diagnostics were carried out using normalized residuals (that is, residuals scaled according to the estimated within-group correlation structure) to account for the assumed compound-symmetry correlation pattern. These diagnostics included the Shapiro–Wilk test to assess normality and Bartlett’s test to evaluate homogeneity of variances.
Carbon mineralization kinetics were modeled independently for each treatment using NLME, including block as a random effect on the C parameter. When the assumption of normality was met, a 95% confidence interval was obtained for model parameters [50].

3. Results

3.1. Grain and Straw Biomass Yields

The unfertilized N plot produced an average grain and straw biomass yield of 2931 (± 249) kg ha−1 and 917 (± 78) kg ha−1, respectively, across the eight cropping seasons. These averages were consistent with values obtained in the last cropping season (Table 3).
Grain and straw yields increased with N addition, except for straw biomass in the final cropping season under the MN treatment. Overall, for the parameters studied, the MN treatment consistently produced lower yields than the slurry treatments. No significant differences were observed between the slurry treatments (Table 3 and Table A1). In the final season, slurry applications doubled grain yield compared with the control and increased grain and straw biomass by approximately 25% relative to the MN treatment (Table 3).

3.2. Soil Organic Carbon Fractions

The finest granulometric–densimetric fraction (<0.05 mm) accounted for approximately 60% of total SOC. Within this fraction (<0.05 mm), slurry-based N fertilization increased SOC by 26% and 36% in the SS and FS treatments, respectively, compared with the control. No differences were observed among treatments in the remaining SOC fractions. The increase in cereal biomass and its partial incorporation into the soil under the MN treatment (Table 3) did not clearly differentiate it from CO but resulted in similar outcomes to SS. Microbial biomass carbon represented approximately 1.2% of total SOC and was not affected by fertilization treatments (Table 4 and Table A2).

3.3. Soil Carbon Inputs and Relative Carbon Stock Evolution

Average C stock (±standard deviation) for a 0–0.15 m depth (Table 4) was 36.7 (±1.3), 41.6 (±1.5), 44.8 (±4.3) and 51.6 (±3.9) Mg ha–1 for CO, MN, SS and FS, respectively.
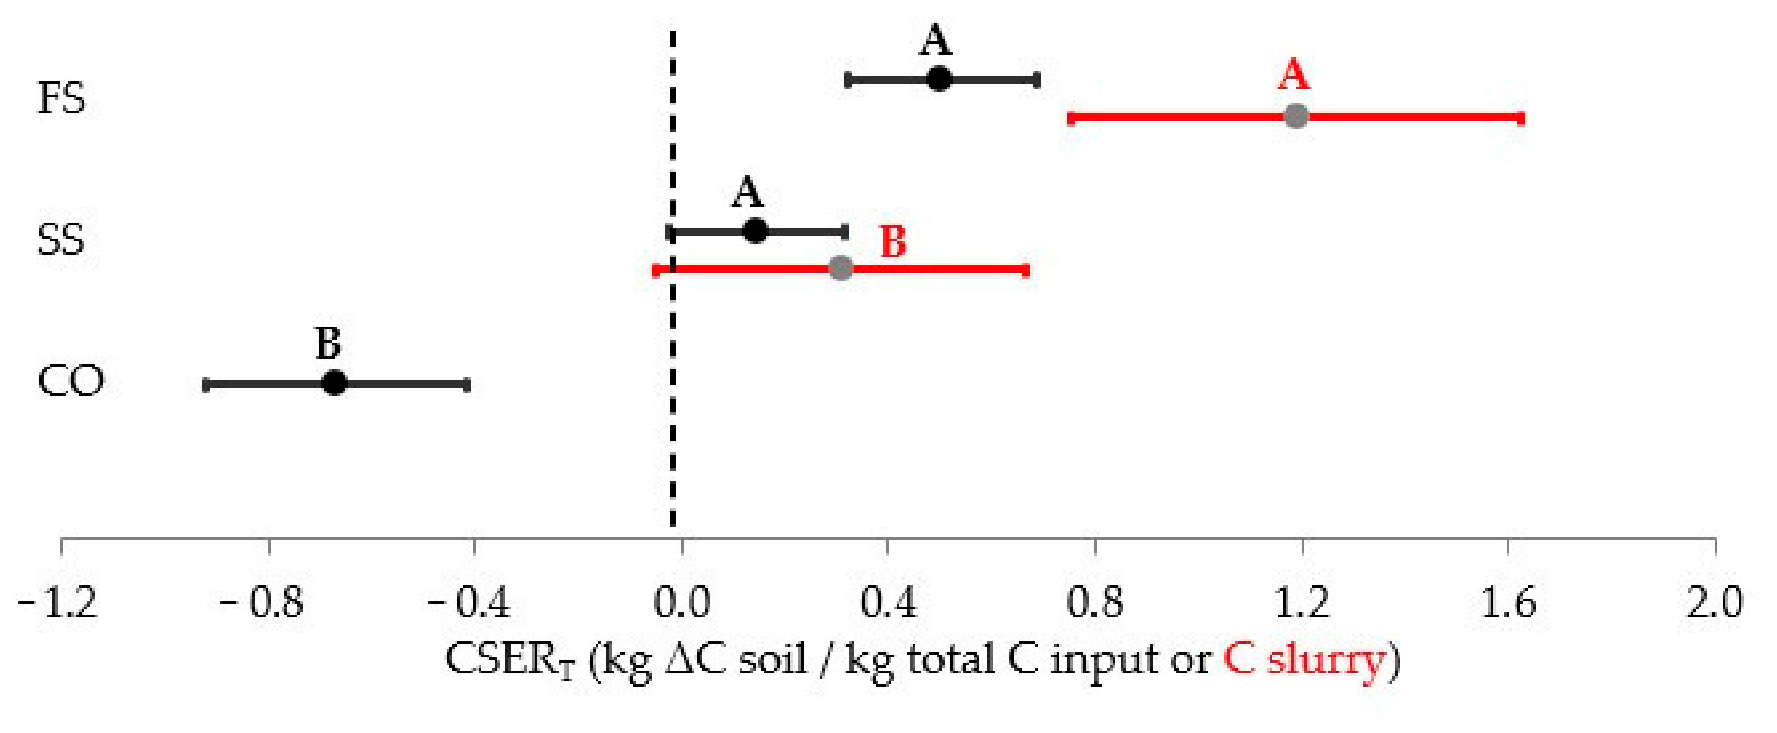
Over the study period, average total C inputs were 7.3, 9.9, 19.2 and 21.5 Mg ha–1 for CO, MN, SS and FS, respectively. Adopting MN as a reference treatment (Equation (1), Figure 3), the CSERT ratio was negative in CO (−0.67 ± 0.25) and positive in SS (0.14 ± 0.17) and FS (0.50 ± 0.18). Slurries differed significantly from CO (Table A4, Figure 3). When only slurry-derived C was considered as input, the ratio increased to 0.31 and 1.19 (kg C increase ha–1 per kg C slurry input ha–1) for SS and FS, respectively (Figure 3), and was significantly higher in FS.
The CSER calculated with total C inputs (Equation 1, Figure 3, black lines) reflects the overall capacity of each treatment system to accumulate C relative to total inputs and is presented for descriptive context. The CSER calculated with slurry-derived C inputs only (Figure 3, red lines) isolates the contribution of slurry carbon to soil C stock, correcting for the confounding effect of differences in total C input between treatments, and is the version used to compare C retention efficiency between the two slurry types.

3.4. Soil Respiration and Carbon Mineralization Kinetics

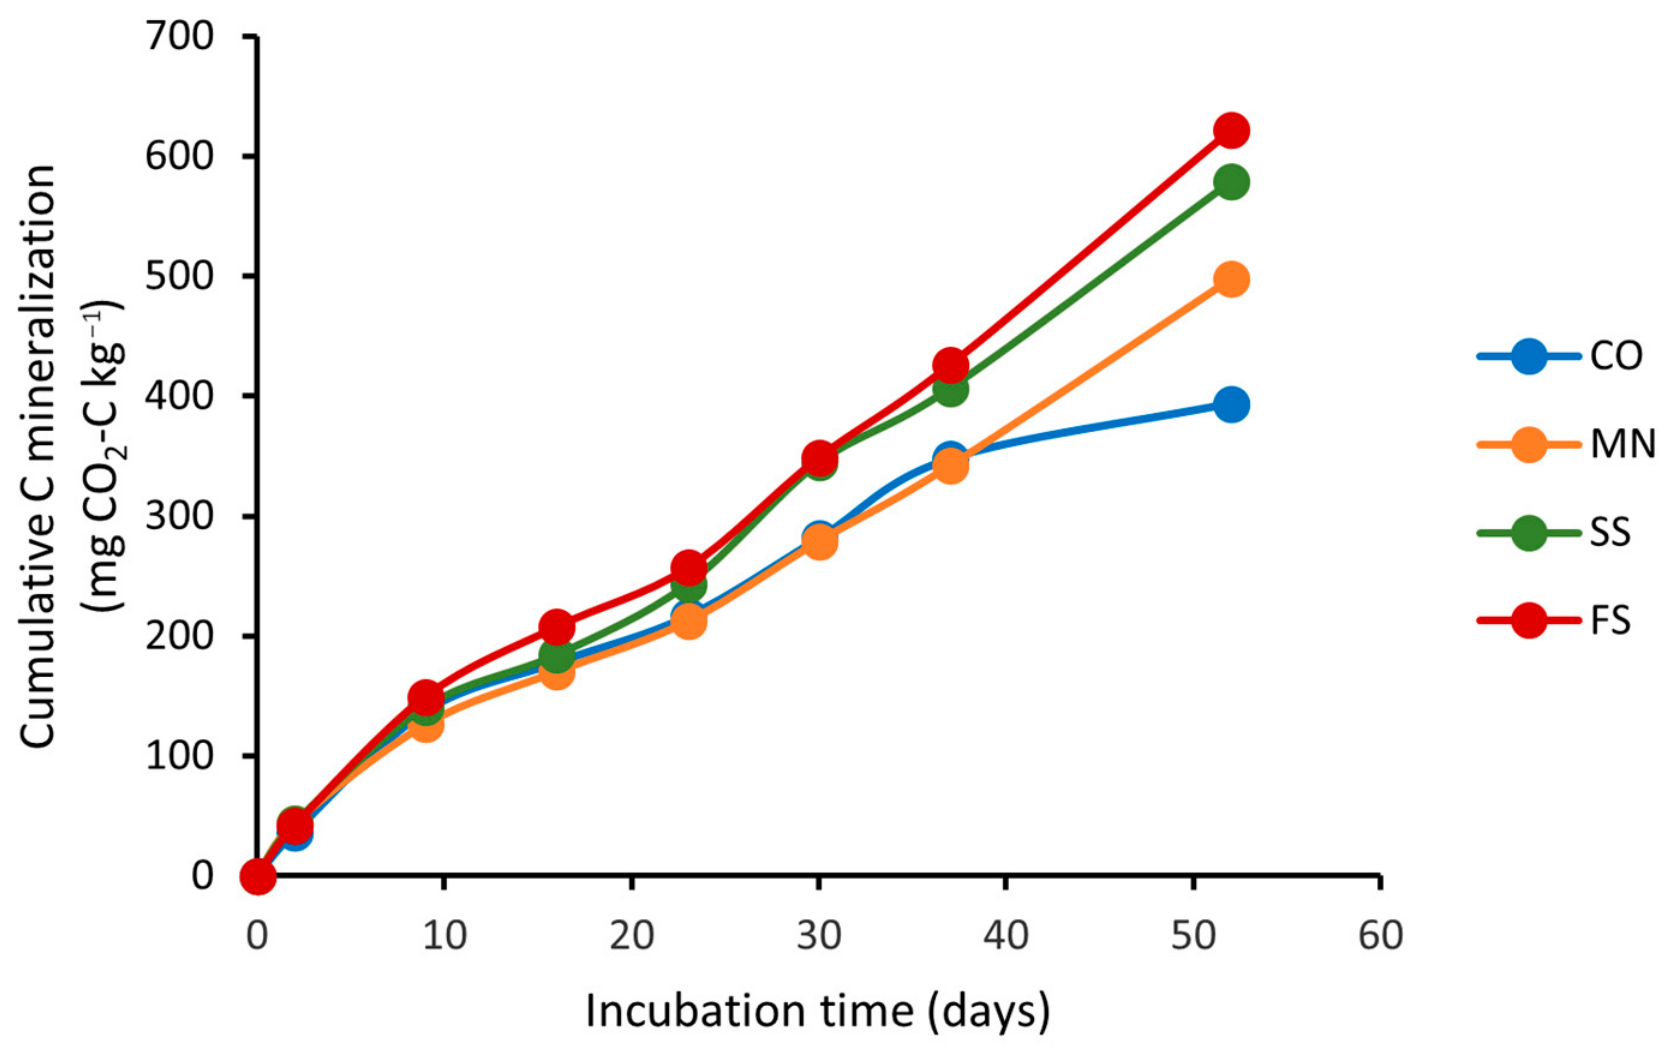
Carbon release through mineralization increased throughout the incubation period in all treatments, although mineralization rate declined after the first two days (Figure 4). After 52 days of incubation, cumulative carbon mineralization in slurry-amended soils was approximately 47–58% higher than in the control (Figure 4), suggesting increased microbial activity in these treatments (Table 5).
The absence of overlap between the 95% confidence intervals is indicative of potential differences among treatments. Accordingly, the CO treatment, compared with the N-fertilized treatments, showed a smaller potential pool of mineralizable C (C), a faster transition from the acceleration to the deceleration phase, a pronounced sigmoidal shape (b), and an earlier inflection point (t_m) (Figure 4). In the N-amended treatments, confidence intervals overlapped widely for all three parameters (Table 5), and therefore this approach provided no descriptive evidence of clear differences among them.

3.5. Soil Mineral Nitrogen and Nitrogen Net Mineralization Kinetics

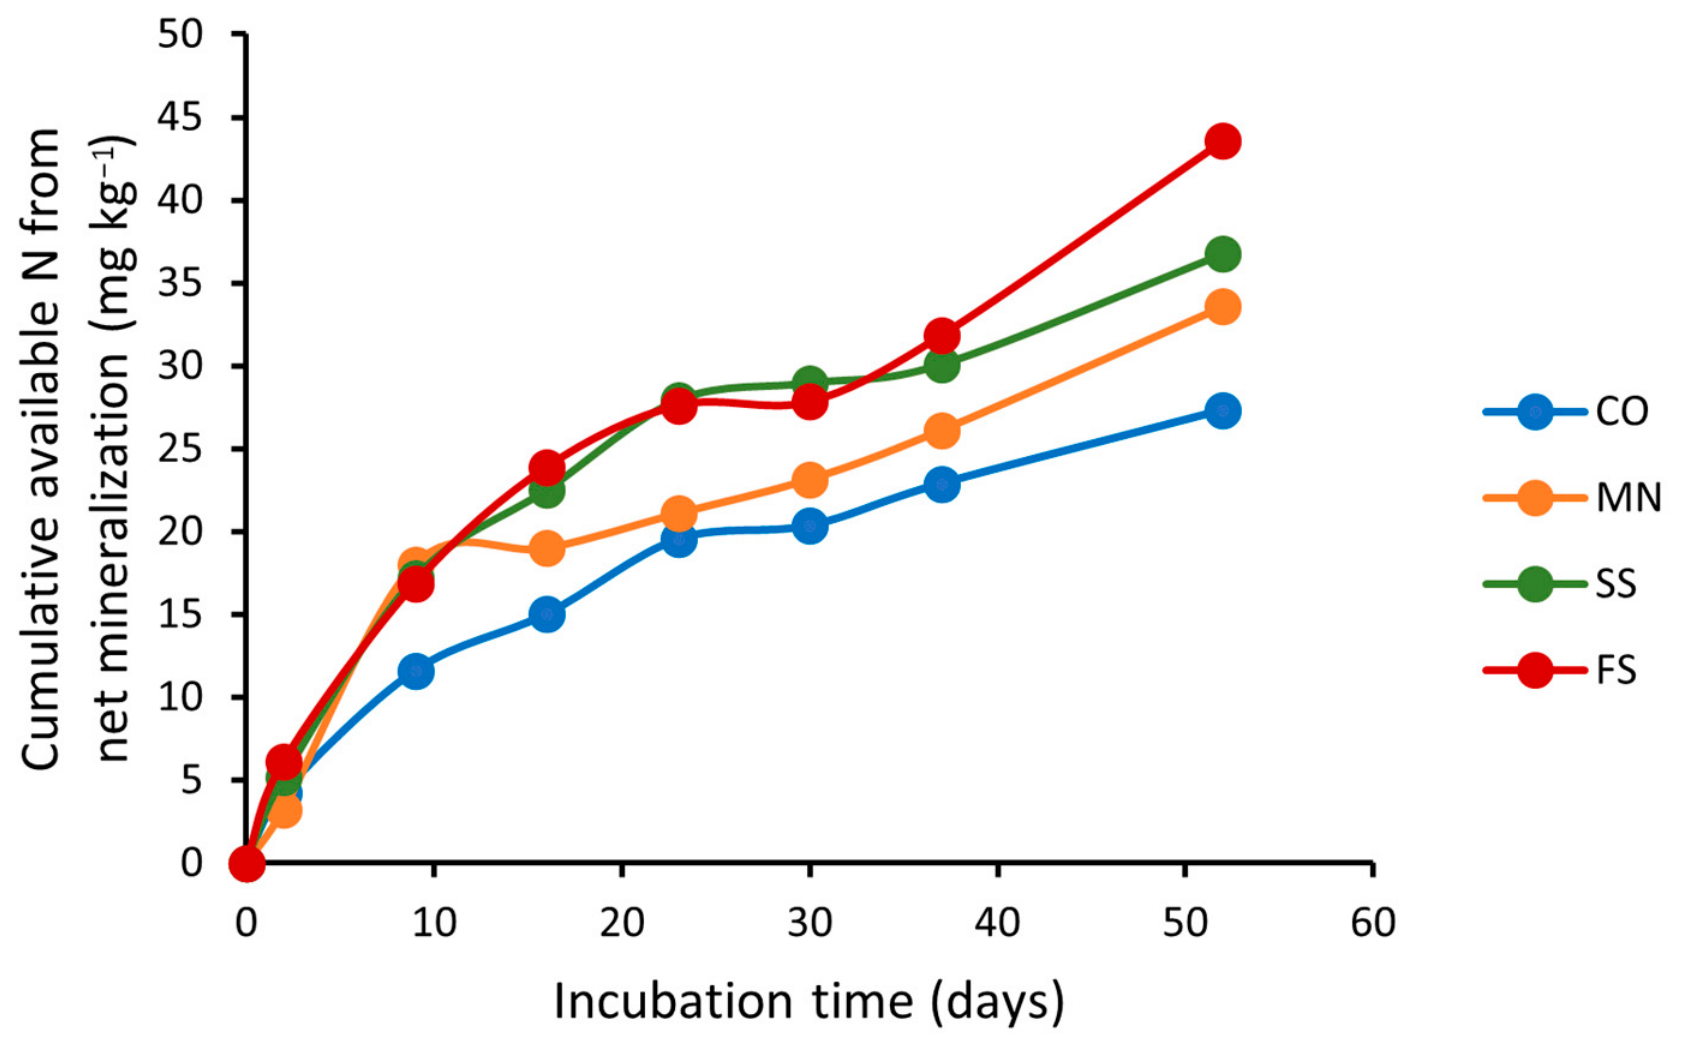
At crop maturity, Nmin content was similar for all treatments (2–4 mg N kg–1), except for the MN, which tripled to approximately 10 mg N kg–1 and was significantly higher than the other treatments (Table A3). For the 0–0.15 m soil layer, this corresponds to values of 6 (CO), 8 (SS), 10 (FS) and 26 (MN) kg Nmin ha–1. At the end of incubation period, available Nmin increased (Figure 5), and the final values (initial plus mineralized N) reached 68 ± 4 (CO), 90 ± 19 (SS), 108 ± 6 (FS), and 83 ± 19 (MN) kg N ha–1 in the 0–0.15 m depth interval, with no significant differences among N-fertilized treatments (Figure 5, Table A3).
A simple exponential model (Stanford–Smith model) was fitted to all treatments (Equation (3), Table 6). The mineralization rate constant k did not differ significantly among treatments (LRT: χ2 = 2.16, df = 3, p = 0.540), indicating a common mineralization rate across treatments (k = 0.044 days−1). In contrast, the potentially mineralizable N pool (A) differed significantly among treatments (LRT comparing the null and reduced models: χ2 = 50.38, df = 3, p < 0.0001). Pairwise comparisons relative to the control showed that MN (p = 0.008), SS (p < 0.0001), and FS (p < 0.0001) all increased A compared with the control. The reduced model, including treatment-specific A values, a common k, and a compound symmetry correlation structure, was therefore selected as the most parsimonious model (AIC = 482.3 vs. 486.2 for the full model). Estimated A values increased from the control (CO: 27.3 mg kg−1) through the mineral fertilizer treatment (MN: 32.6 mg kg−1) to the sow slurry treatments (SS: 38.7; FS: 41.3 mg kg−1). The initial mineralization rate (A·k) followed the same pattern: CO (1.20) < MN (1.43) < SS (1.70) < FS (1.81) mg kg−1 day−1. Model residuals were normally distributed and exhibited homogeneity of variances among treatments (Table A5).
At the end of the incubation period, the ratio between cumulative C-CO2 and N mineralized was 14.5, 14.7, 14.3 and 15.9 for CO, MN, FS and SS, respectively, without significant differences between them (one-way ANOVA, p = 0.941).

4. Discussion

In this study, pig slurry was evaluated as an N source enriched with organic compounds in a long-term experiment which included repeated applications, and its effects were compared with MN fertilization and a treatment without N fertilization.
Yields and straw biomass (Table 3) aligned with historical data from similarly managed Mediterranean rainfed agricultural systems [51]. This indicates that the average N extraction (grain and straw) was approximately 72 kg N ha—1 when no N was applied [52]. It also indicates that MN, SS and FS treatments were not N-limiting (Table 3).
The management system maintained a relatively high SOC content (Table 4), comparable with organically managed systems with similar yields under higher rainfall conditions [53]. Nevertheless, SOC concentration and its evolution over time differed significantly among treatments with contrasting C inputs (Table 4, Figure 3). Mineral fertilization did not differ from CO, which is consistent with other studies indicating that inorganic N fertilizers do not, alone, increase SOC, and may even promote its mineralization by stimulating microbial activity without supplying exogenous carbon [54]. The organic carbon supplied by the slurry, together with stubble directly added with SS, increased SOC in the SS treatment compared with CO, although no significant improvement was observed relative to MN. The FS treatment showed the highest SOC values (Table 4), with SOC increasing by up to 23.8% compared with MN at the end of the experimental period. This increase was considerably greater than the 6.5% increase (slurry vs. mineral) after a nine-year experimental period described by [55]. The effects of slurry on SOC reported in the literature are inconsistent and largely depend on slurry composition and management practices. For example, in a cold, humid region of Quebec (Canada), Ref. [56] found no significant increase in soil C content after 19 consecutive years of pig slurry application at rates of 60 and 120 m3 ha−1 yr−1 on a loamy soil. In contrast, Ref. [57] reported an increase in soil C content with increasing pig slurry application rates (from 30 to 120 m3 ha−1 yr−1; total organic carbon: 29 kg m−3) after 14 years on silty loam soil.
In the present study, considering only aboveground stubble inputs (Table 3), the annual SOC increase (0–0.15 m) in the MN treatment relative to control averaged 2.3 g C kg−1 per additional Mg ha−1 of incorporated stubble. Despite this positive response in the rate of SOC accumulation, no significant differences in final SOC concentration were observed between MN and CO (Table 4). Assuming that the contribution of stubble-derived carbon to SOC accumulation was similar across fertilization treatments, the additional SOC increase observed in SS and FS treatments can be attributed to organic carbon supplied by the slurry (excluding root biomass). Based on this approach, SOC increased by 0.28 and 0.68 g C kg−1 soil (0–0.15 m) per additional ton of organic carbon (Mg ha−1) applied in the SS and FS treatments, respectively. These results suggest that the organic carbon supplied by FS was retained more efficiently in the soil than that supplied by SS. This difference may reflect compositional differences between the two slurries, with SS potentially containing a higher proportion of readily decomposable organic compounds. Because root biomass was not quantified, these estimates should be considered an approximation of the relative contribution of slurry-derived organic carbon to SOC accumulation.
Regarding the distribution of organic carbon among particle size fractions, significant treatment effects were only observed in the <0.05 mm fraction. Both slurry treatments (SS and FS) showed significantly higher organic carbon concentrations in this fraction compared with the control (Table 4). The <0.05 mm fraction is commonly used as a proxy for mineral-associated organic matter (MAOM), which represents the most stable and well-protected SOC pool [58] because organic compounds are adsorbed onto the surfaces of mineral particles. Although plant-derived carbon can also contribute to MAOM formation following microbial processing and transformation, the increase observed under slurry application suggested that slurry-derived carbon was preferentially stabilized in mineral-associated pools. However, pig slurry contains a significant amount of organic matter in the fine fraction (<0.05 mm), c. 50%, with a lower C/N ratio than the bulk slurry [59], which may indicate a high potential for degradability by microorganisms. Furthermore, the higher potential C mineralization observed in the SS and FS treatments (Figure 4, Table 5) suggests that the fraction <0.05 mm contributed to short-term SOC mineralization despite its theoretical relative stability [60]. This pattern occurred without detectable changes in microbial biomass or the short-term mineralization rate constant, indicating that slurry amendments did not enhance overall microbial biomass nor accelerate overall SOC turnover. In addition, it should be noted that the composition of the fine fraction of pig slurry cannot be identical to that of the corresponding soil fraction. Consequently, further analyses specifically targeting organo-mineral interactions would be required to determine the extent to which the accumulated carbon was stabilized through organo-mineral associations.
The light and heavy fractions within the 2–0.2 mm and 0.2–0.05 mm particle-size classes mainly correspond to particulate organic matter (POM), which is generally considered the most labile and dynamic fraction of soil organic matter and is highly responsive to agricultural management practices [58,61]. Despite this, no significant treatment effects were detected in any of the POM fractions, possibly reflecting the high spatial and temporal variability of these pools in agricultural soils. These findings suggest that, under the edaphoclimatic conditions of the present study, fresh carbon inputs from pig slurry are rapidly processed by the soil microbial community and did not accumulate as POM. Instead, they were either mineralized or transformed into more stable SOC pools. This interpretation is consistent with the soil carbon formation framework proposed by [62], which predicts that organic materials with high solubility and a low C/N ratio, such as pig slurry, preferentially promote the formation of mineral-associated organic matter rather than the accumulation of POM.
Microbial biomass is recognized as an important component of the active or labile soil carbon pool due to its rapid turnover. Pig slurry applications can increase MBC, likely driven by its soluble carbon content, and the input of microorganisms contained in the applied manure [63,64]. However, this response is typically short-lived, lasting only days after application [56], which can explain the lack of significant differences in MBC in our study (Table 4), as sampling was conducted several months after slurry application.
The potential maximum cumulative soil CO2-C emission was substantially higher in all N-fertilized treatments than in the control, indicating enhanced carbon mineralization (Figure 4, Table 5). Overall, the results suggest that N addition, regardless of its source, increased carbon turnover during the incubation period, likely through changes in microbial activity and substrate utilization. Given that MBC did not differ significantly among treatments (Table 4), the higher cumulative respiration observed in the N-fertilized treatments cannot be attributed to an increase in microbial biomass. Instead, the results suggest that these treatments primarily stimulated microbial metabolic activity and more efficient substrate use. Microorganisms may have processed a greater amount of carbon without a corresponding increase in biomass.
Carbon mineralization followed a sigmoidal pattern, consistent with substrate-induced microbial growth and agreement with other authors [65]. The kinetic parameters provide further insight into the temporal dynamics of carbon mineralization (Table 5). The control treatment exhibited the highest rate parameter (b = 0.05 day−1) and the earliest time of maximum respiration rate (t_m = 15.36 days), indicating a rapid utilization of the limited pool of readily available substrates. In contrast, the N-fertilized treatments showed lower b values (approx. 0.03 day−1) and delayed t_m estimates (30–36 days), suggesting a more prolonged respiratory response. This pattern may reflect sustained microbial activity supported by improved nutrient availability and, in the slurry treatments, the progressive decomposition of organic substrates with varying degrees of biodegradability. The overlap among confidence intervals for C, b, t_m suggests that neither pig slurry type produced a substantially different mineralization pattern compared with mineral N fertilization. Considering that MN did not provide an external organic carbon source beyond the stubble incorporated at sowing, this result may indicate that N availability potentially stimulated the mineralization of native soil organic matter.
As described in the Section 2, a joint NLME model including treatment as a modifier of all three Gompertz parameters (Equation (2)) was fitted and converged numerically; however, the resulting estimates were not biologically interpretable due to severe overparameterization (standard errors exceeding the magnitude of several estimates; inter-parameter correlations r > 0.95). For this reason, treatment-specific models were retained. Consequently, differences among treatments should be interpreted as trends derived from separate model fits rather than as formally tested differences in model parameters.
Carbon and N mineralization were closely coupled during incubation (Figure 4 and Figure 5), but their temporal dynamics were best described by distinct kinetic models (Table 5 and Table 6), highlighting fundamental differences in the processes governing C versus N turnover.
Nitrogen mineralization was adequately described by a first-order kinetic model (Equation (3)), which assumes that the rate of mineralization is highest at the beginning and decreases continuously [4]. The divergence in model structure suggests that C mineralization was still in an active, growth-dependent phase during the incubation period, and that the full transition to a deceleration phase may not have been completely captured within the experimental timeframe. At the end of the incubation period, the ratio of cumulative C-CO2 to mineral-N did not differ substantially among treatments (14.3–15.9), suggesting that the stoichiometry of C and N mineralization was governed by the common substrate (soil organic matter and cereal straw), with a limited influence from fertilizer type.
The estimated value of k (0.04382 d–1) in the N first-order kinetics mineralization dynamics is close to the average k value of 0.050 d–1 (mean standard error = 0.005) reported for Italian soils [44]. This model fit, together with the absence of differences among treatments, suggests that potentially mineralizable soil N was assessed under near-equilibrium conditions [44]. In the absence of fertilization, the asymptote approaches 28.01 mg N kg−1, corresponding to a final available Nmin pool of approximately 69 kg N ha–1 (assuming no N losses), which would support a potential maximum yield of 3.6 Mg ha–1 [66]. In soils amended with slurry, the asymptote (mineralization potential) increased to 38.69 and 41.33 mg N kg−1 for SS and FS, respectively. This difference was not statistically significant (p = 0.156) and should therefore be interpreted with caution. However, the numerical differences between slurries suggest a higher proportion of more slowly decomposable organic compounds in FS, which may be related to differences in feed composition and/or the higher apparent total tract digestibility of crude protein and gross energy in sows compared with growing pigs [67], with consequent effects on fecal and urine composition.
At the end of the nutrient extraction period (crop maturity), Nmin values indicated that potential N availability was similar among the N-based treatments, regardless of whether the fertilizer source was mineral or pig slurry. This finding is consistent with previous reports showing residual N effects following slurry application [68]. The main difference among fertilizer types lies in the temporal alignment between N availability and crop demand during the subsequent growing season. Whereas approximately 23% of the potential Nmin in the MN treatment was already available at harvest, only about 8% was available in the SS and FS treatments. This pattern may reduce the risk of N losses through leaching during the erratic summer rainfall events characteristic of Mediterranean environments. In this regard, pig slurries appear to combine the short-term behavior of mineral fertilizers with the longer-term benefits of slow-release fertilizers. This supports their application at cereal tillering rather than at sowing, improving synchronization between N availability and crop demand while reducing management costs. In particular, FS appears to be a promising option, as it provided a final N availability comparable to that of MN while releasing a greater proportion of N more gradually.
The results should be interpreted within the framework of the proposed hypothesis, so that the findings can contribute to improving N-fertilization planning. This interpretation must also consider the leaching constraint, given that drainage losses are minimal (<20 mm) and typically occur during the autumn-winter period [69]. Consequently, soil samples were collected from the 0–0.15 m layer, corresponding to the soil depth most directly affected by soil water replenishment from rainfall (Figure 2), slurry application and stubble incorporation. The observed changes in C and N dynamics primarily reflect processes occurring within the cultivated topsoil, where the effects of these management practices are expected to be most pronounced. Furthermore, C and N mineralization were assessed under controlled laboratory incubation conditions, facilitating comparisons among fertilization treatments. However, these conditions do not fully reproduce the complex interactions among rainfall variability and other field factors that regulate C and N turnover under field conditions. Therefore, results provide valuable insights for scheduling fertilization sufficiently in advance and improving its efficiency.

5. Conclusions

In the context of a Mediterranean rainfed cereal system, the results of this 10-year field experiment indicate that pig slurry applied at authorized fertilization rates significantly increased winter cereal yields compared with mineral fertilization.
Soil organic carbon levels increased following the application of slurry from fattening pigs, mainly within the finest organic matter fraction (<0.05 mm), which also appeared to be an important source of short-term SOC mineralization. For all treatments, the Gompertz model adequately described the dynamics of SOC mineralization during the incubation period, highlighting a pattern consistent with C mining in the control treatment.
Short-term aerobic incubation proved to be a useful tool for assessing N mineralization from pig slurries. Incorporating the simple exponential model fitted in this study into fertilization management plans could improve the selection of slurry application rates and timing, thereby enhancing the synchronization between N availability and crop demand.
From a broader sustainability perspective, our findings demonstrate that the agricultural reuse of pig slurry supports circular nutrient management, reduces dependence on mineral fertilizers, and contributes to climate change mitigation by increasing soil carbon stocks. Therefore, when appropriately managed, pig slurry can play a key role in the development of more sustainable, resilient, and resource-efficient cropping systems in Mediterranean rainfed regions.

Author Contributions

Conceptualization, C.L., À.D.B.-S., and M.R.Y.; formal analysis, C.L. and M.G.M.; data curation, B.S.; writing—original draft preparation, C.L. and M.R.Y.; writing—review and editing, C.L. and À.D.B.-S.; funding acquisition, À.D.B.-S. All authors have read and agreed to the published version of the manuscript.

Funding

The research was supported by the Spanish National Institute for Agricultural Research and Experimentation (INIA) through the projects RTA2013-57-C5-05 and RTA2017-88-C3-3. The experimental site maintenance was funded by the Department of Agriculture, Livestock, Fisheries and Food, Catalonia, Spain.

Institutional Review Board Statement

Not applicable.

Informed Consent Statement

Not applicable.

Data Availability Statement

Data are available from the corresponding author upon reasonable request.

Acknowledgments

The authors thank M. Antúnez and S. Porras for their laboratory support.

Conflicts of Interest

The authors declare no conflicts of interest.

Abbreviations

The following abbreviations are used in this manuscript:
COControl, no N applied
CSERTCarbon stock evolution ratio
FSSlurry from fattening pigs
MAOMMineral-associated organic matter
MNMineral N applied as ammonium nitrate
NminMineral N (NH4+–N + NO3–N)
POMParticulate organic matter
SOCSoil organic carbon
SSSlurry from sows

Appendix A

Table A1. Analysis of variance 1 performed on grain yield and straw biomass (0% moisture content) across fertilization treatments over the previous eight growing seasons of winter cereals, together with barley yield in the final cropping season (9th cropping season, 10th year).
Grain Yield (kg ha−1)Straw Biomass (kg ha−1)
Eight SeasonsLast SeasonEight SeasonsLast Season
SourcedfMSEpMSEpMSEpMSEp
Block2311,5580.03174,5090.92130,6390.03126,8110.146
Treatment31.31× 106<0.0015.19× 1060.033128,718<0.001435,968<0.001
Residual647,308 890,361 4648 9938
1 df: degrees of freedom; MSE: mean square error; p: probability.
Table A2. Analysis of variance 1 performed on total soil organic carbon (SOC), its granulometric–densimetric fractions 2 (g C kg−1 soil), and microbial biomass carbon (MBC, mg C kg−1 soil) across fertilization treatments in the final cropping season (9th cropping season, 10th year).
SOCLF
(2–0.2 mm)
HF
(2–0.2 mm)
LF
(0.2–0.05 mm)
HF
(0.2–0.05 mm)
(<0.05 mm)MBC
SourcedfMSEpMSEpMSEpMSEpMSEpMSEpMSEp
Block22.940.1430.170.240.020.601.970.011.570.183.690.8121687.740.47
Treatment318.780.0020.410.060.130.100.150.561.900.235.870.0282317.430.39
Residual61.07 0.09 0.04 0.19 0.94 1958.68
1 df: degrees of freedom; MSE: mean square error; p: probability. 2 Densiometric fractions: light fraction (LF) and heavy fraction (HF). Particle size fractions: 2–0.2 mm, 0.2–0.05 mm, <0.05 mm.
Table A3. Analysis of variance 1 performed on NO3–N, NH4+–N, and total mineral N (Nmin) 2 (mg kg−1 soil) at the start of incubation (Time 0) and on total Nmin accumulated after 52 days (Time 52).
Time 0Time 52
NO3–NNH4+–NNminNO3–NNH4+NNmin
SourcedfMSEpMSEpMSEpMSEpMSEpMSEp
Block22.750.5060.050.2302.480.54554.270.1110.230.02555.540.105
Treatment341.990.0060.0070.84040.980.007180.100.0080.090.127177.220.008
Residual63.61 0.03 3.69 16.78 0.032 16.53
1 df: degrees of freedom; MSE: mean square error; p: probability. 2 Nmin was calculated as the sum of NO3–N and NH4+–N.
Table A4. Analysis of variance 1 performed on carbon stock evolution ratio (CSERT). The evolution of soil carbon stock for each treatment was quantified relative to the MN carbon stock and expressed in relation to either total C inputs or slurry-derived C inputs.
CSERT (Total C Inputs)CSERT (C Slurry Inputs)
SourcedfMSEpdfMSEp
Block20.0180.74520.3080.024
Treatment21.0920.00911.1530.007
Residual40.056 20.008
1 df: degrees of freedom; MSE: mean square error; p: probability.
Table A5. Verification of model assumptions for the nonlinear mixed-effects model 1 with a compound symmetry covariance correlation structure (NLME-CS) applied to cumulative available N from net mineralization during the incubation period under different fertilization treatments.
AssumptionsTestStatisticp
Residual normalityShapiro–WilkW = 0.9830.315
HomoscedasticityBartlettK2 = 2.0340.565
Correlation structureLikelihood Ratio Test (CS vs. base model)X2 = 5.0680.024
1p: probability.

References

  1. European Parliament. Regulation (EU) 2021/2115 of the European Parliament and of the Council of 2 December 2021 Establishing Rules on Support for Strategic Plans to be Drawn up by Member States Under the Common Agricultural Policy (CAP Strategic Plans) and Financed by the European Agricultural Guarantee Fund (EAGF) and by the European Agricultural Fund for Rural Development (EAFRD) and repealing Regulations (EU) No 1305/2013 and (EU) No 1307/2013. Available online: https://eur-lex.europa.eu/legal-content/EN/TXT/?uri=CELEX:32021R2115 (accessed on 26 June 2026).
  2. Gerke, J. The central role of soil organic matter in soil fertility and carbon storage. Soil Syst. 2022, 6, 33. [Google Scholar] [CrossRef] [Scilit]
  3. Lavallee, J.M.; Soong, J.L.; Cotrufo, M.F. Conceptualizing soil organic matter into particulate and mineral-associated forms to address global change in the 21st century. Glob. Change Biol. 2020, 26, 261–273. [Google Scholar] [CrossRef] [Scilit] [PubMed]
  4. Alvarez, R.; Alvarez, C.R. Soil organic matter pools and their associations with carbon mineralization kinetics. Soil Sci. Soc. Am. J. 2000, 64, 184–189. [Google Scholar] [CrossRef] [Scilit]
  5. Von Lützow, M.; Kögel-Knabner, I.; Ludwig, B.; Matzner, E.; Flessa, H.; Ekschmitt, K.; Guggenberger, G.; Marschner, B.; Kalbitz, K. Stabilization mechanisms of organic matter in four temperate soils: Development and application of a conceptual model. J. Plant Nutr. Soil Sci. 2008, 171, 111–124. [Google Scholar] [CrossRef] [Scilit]
  6. Saenger, A.; Cécillon, L.; Poulenard, J.; Bureau, F.; De Daniéli, S.; Gonzalez, J.M.; Brun, J.J. Surveying the carbon pools of mountain soils: A comparison of physical fractionation and Rock-Eval pyrolysis. Geoderma 2015, 241–242, 279–288. [Google Scholar] [CrossRef] [Scilit]
  7. Christensen, B.T. Decomposability of organic matter in particle size fractions from field soils with straw incorporation. Soil Biol. Biochem. 1987, 19, 429–435. [Google Scholar] [CrossRef] [Scilit]
  8. Gregorich, E.G.; Drury, C.F.; Baldock, J.A. Changes in soil carbon under long-term maize in monoculture and legume-based rotation. Can. J. Soil Sci. 2001, 81, 21−31. [Google Scholar] [CrossRef] [Scilit]
  9. Bhogal, A.; Nicholson, F.A.; Rollett, A.; Taylor, M.; Litterick, A.; Whittingham, M.J.; Williams, J.R. Improvements in the quality of agricultural soils following organic material additions depend on both the quantity and quality of the materials applied. Front. Sustain. Food Syst. 2018, 2, 9. [Google Scholar] [CrossRef] [Scilit]
  10. FAO. Standard Operating Procedure for Soil Respiration Rate; FAO: Rome, Italy, 2023; Available online: https://openknowledge.fao.org/server/api/core/bitstreams/e9f3525e-d101-4fee-9330-ba166eafa90d/content (accessed on 22 June 2026).
  11. Liptzin, D.; Norris, C.E.; Cappellazzi, S.B.; Mac Bean, G.; Cope, M.; Greub, K.L.; Rieke, E.L.; Tracy, P.W.; Aberle, E.; Ashworth, A.; et al. An evaluation of carbon indicators of soil health in long-term agricultural experiments. Soil Biol. Biochem. 2022, 172, 108708. [Google Scholar] [CrossRef] [Scilit]
  12. Semenov, M.V.; Zhelezova, A.D.; Ksenofontova, N.A.; Ivanova, E.A.; Nikitin, D.A.; Semenov, V.M. Microbiological indicators for assessing the effects of agricultural practices on soil health: A review. Agronomy 2025, 15, 335. [Google Scholar] [CrossRef] [Scilit]
  13. Maillard, É.; Angers, D.A. Animal manure application and soil organic carbon stocks: A meta-analysis. Glob. Change Biol. 2014, 20, 666–679. [Google Scholar] [CrossRef] [Scilit]
  14. Eurostat Database. Available online: https://ec.europa.eu/eurostat/data/database (accessed on 26 June 2026).
  15. Yagüe, M.R.; Bosch-Serra, À.D.; Boixadera, J. Measurement and estimation of the fertiliser value of pig slurry by physicochemical models: Usefulness and constraints. Biosyst. Eng. 2012, 111, 206–216. [Google Scholar] [CrossRef] [Scilit]
  16. Nannipieri, P.; Grego, S.; Ceccanti, B. Ecological significance of the biological activity in soil. In Soil Biochemistry; Bollag, J.M., Stotzky, G., Eds.; Marcel Dekker: New York, NY, USA, 1990; Volume 6, pp. 293–355. [Google Scholar]
  17. Gonzalez-Quiñones, V.; Stockdale, E.A.; Banning, N.C.; Hoyle, F.C.; Sawada, Y.; Wherrett, A.D.; Jones, D.L.; Murphy, D.V. Soil microbial biomass—Interpretation and consideration for soil monitoring. Soil Res. 2011, 49, 287−304. [Google Scholar] [CrossRef] [Scilit]
  18. Meng, Q.; Sun, Y.; Zhao, J.; Zhou, L.; Ma, X.; Zhou, M.; Gao, W.; Wang, G. Distribution of carbon and nitrogen in water-stable aggregates and soil stability under long-term manure application in solonetzic soils of the Songnen plain northeast China. J. Soils Sediments 2014, 14, 1041–1049. [Google Scholar] [CrossRef] [Scilit]
  19. Müller, L.J.; Alicke, M.; Romdhane, S.; Pold, G.; Jones, C.M.; Saghaï, A.; Hallin, S. Resistance and resilience of co-occurring nitrifying microbial guilds to drying-rewetting stress in soil. Soil Biol. Biochem. 2025, 208, 703–707. [Google Scholar] [CrossRef] [Scilit]
  20. Anuario de Estadística 2024. Available online: https://www.mapa.gob.es/es/estadistica/temas/publicaciones/anuario-de-estadistica (accessed on 26 June 2026).
  21. Russell, G. Barley Knowledge Base; Office for Official Publications of the European Communities: Luxembourg, 1990; p. 45. [Google Scholar]
  22. Lu, W.; Hao, Z.; Ma, X.; Gao, J.; Fan, X.; Guo, J.; Li, J.; Lin, M.; Zhou, Y. Effects of different proportions of organic fertilizer replacing chemical fertilizer on soil nutrients and fertilizer utilization in Gray desert soil. Agronomy 2024, 14, 228. [Google Scholar] [CrossRef] [Scilit]
  23. Allen, R.G.; Pereira, L.S.; Raes, D.; Smith, M. Crop Evapotranspiration. Guidelines for Computing Crop Water Requirements; FAO: Rome, Italy, 1998; pp. 65–75. [Google Scholar]
  24. Soil Survey Staff. Keys to Soil Taxonomy, 12th ed.; USDA-Natural Resources Conservation Service: Washington, DC, USA, 2014.
  25. Yeomans, J.C.; Bremner, J.M. A rapid and precise method for routine determination of organic carbon in soil. Commun. Soil Sci. Plant Anal. 1988, 19, 1467−1476. [Google Scholar] [CrossRef] [Scilit]
  26. European Union. Council Directive of 12 December 1991 Concerning the Protection of Waters against Pollution Caused by Nitrates from Agricultural Sources (91/676/EEC). Available online: http://data.europa.eu/eli/dir/1991/676/2008-12-11 (accessed on 4 June 2026).
  27. Generalitat de Catalunya. Decret 153/2019, de 3 de juliol, de Gestió de la Fertilització del Sòl i de les Dejeccions Ramaderes i d’Aprovació del Programa d’Actuació a les Zones Vulnerables en Relació amb la Contaminació per Nitrats que Procedeixen de Fonts Agràries. Available online: https://dogc.gencat.cat/ca/document-del-dogc/?documentId=853461 (accessed on 26 June 2026).
  28. APHA. Nitrogen (ammonia): 4500-NH3 B, preliminary distillation step and 4500-NH3 C, titrimetric method. In Standard Methods for the Examination of Water and Wastewater, 22nd ed.; Rice, E.W., Bridgewater, L., Eds.; American Public Health Association; American Water Works Association; Water Environment Federation: Washington, DC, USA, 2012; p. 4-110-111. [Google Scholar]
  29. UNE-EN 16174; Sludge, Treated Biowaste and Soil—Digestion of Aqua Regia Soluble Fractions of Elements. Asociación Española de Normalización y Certificación: Madrid, Spain, 2012.
  30. UNE-EN 17053; Alimentos para Animales. Métodos de Muestreo y Análisis. Determinación de Elementos Traza. Metales Pesados y Otros Elementos en los Alimentos para Animales por ICP-MS (multimétodo). Asociación Española de Normalización y Certificación: Madrid, Spain, 2018.
  31. NF X 31-516; Qualité du sol. Fractionnement Granulo-Densimétrique des Matières Organiques Particulaires du Sol dans l´Eau. Association Française de Normalisation: La Plaine Saint-Denis, France, 2007; pp. 1–7.
  32. UNE-EN ISO 14240-2; Calidad del Suelo. Determinación de la Biomasa Microbiana del Suelo. Parte 2: Método por Fumigación-Extracción (ISO 14240-2:1997). Asociación Española de Normalización y Certificación: Madrid, Spain, 2011.
  33. Yakovchenko, V.P.; Sikora, L.J. Modified dichromate method for determining low concentrations of extractable organic carbon in soil. Commun. Soil Sci. Plant Anal. 1998, 29, 421–433. [Google Scholar] [CrossRef] [Scilit]
  34. Vance, E.D.; Brookes, P.C.; Jenkinson, D.S. Extraction method for measuring soil microbial biomass C. Soil Biol. Biochem. 1987, 19, 703–707. [Google Scholar] [CrossRef] [Scilit]
  35. Gil, A.; Pallarés, J.; Arauzo, I.; Cortés, C. Pyrolysis and CO2 gasification of barley straw: Effect of particle size distribution and chemical composition. Powder Technol. 2023, 424, 118539. [Google Scholar] [CrossRef] [Scilit]
  36. Plaza-Bonilla, D.; Álvaro-Fuentes, J.; Hansen, N.C.; Lampurlanés, J.; Cantero-Martínez, C. Winter cereal root growth and aboveground–belowground biomass ratios as affected by site and tillage system in dryland Mediterranean conditions. Plant Soil 2014, 374, 925–939. [Google Scholar] [CrossRef] [Scilit]
  37. Redin, M.; Recous, S.; Aita, C.; Chaves, B.; Pfeifer, I.C.; Bastos, L.M.; Pilecco, G.E.; Giacomini, S.J. Root and shoot contribution to carbon and nitrogen inputs in the topsoil layer in no-tillage crop systems under subtropical conditions. Rev. Bras. Cienc. Solo 2018, 42, e0170355. [Google Scholar] [CrossRef] [Scilit]
  38. Alef, K. Estimation of Soil Respiration. In Methods in Applied Soil Microbiology and Biochemistry; Alef, K., Nannipieri, P., Eds.; Academic Press: London, UK, 1995; pp. 464–467. [Google Scholar]
  39. Bradford, M.A.; McCulley, R.L.; Crowther, T.W.; Oldfield, E.E.; Wood, S.A.; Fierer, N. Cross-biome patterns in soil microbial respiration predictable from evolutionary theory on thermal adaptation. Nat. Ecol. Evol. 2019, 3, 223–231. [Google Scholar] [CrossRef] [Scilit] [PubMed]
  40. Zhang, H.; Liu, B.; Zhou, D.; Wu, Z.; Wang, T. Asymmetric soil warming under global climate change. Int. J. Environ. Res. Public Health 2019, 16, 1504. [Google Scholar] [CrossRef] [Scilit] [PubMed]
  41. UNE-ISO/TS 14256-1 EX; Calidad del Suelo. Determinación de Nitrato, Nitrito y Amonio en Suelos Húmedos Naturales Mediante Extracción y con una Solución de Cloruro Potásico (ISO/TS 14256-1:2003). Asociación Española de Normalización y Certificación: Madrid, Spain, 2007.
  42. Bernal, M.P.; Roig, A. Nitrogen transformations in calcareous soils amended with pig slurry under aerobic incubation. J. Agric. Sci. 1993, 120, 89–97. [Google Scholar] [CrossRef] [Scilit]
  43. Dendooven, L.; Bonhomme, E.; Merckx, R.; Vlassak, K. Injection of pig slurry and its effects on dynamics of nitrogen and carbon in a loamy soil under laboratory conditions. Biol. Fertil. Soils 1998, 27, 5–8. [Google Scholar] [CrossRef] [Scilit]
  44. Benedetti, A.; Sebastiani, G. Determination of potentially mineralizable nitrogen in agricultural soil. Biol. Fertil. Soils 1996, 21, 114–120. [Google Scholar] [CrossRef] [Scilit]
  45. SAS Institute. Statistical Analysis System, SAS/TAT Software, V 9.4; SAS Institute Inc.: Cary, NC, USA, 2014.
  46. The R Project for Statistical Computing. Available online: https://www.r-project.org/ (accessed on 22 June 2026).
  47. Pinheiro, J.C.; Bates, D.M. Mixed-Effects Models in S and S-PLUS; Springer: New York, NY, USA, 2000. [Google Scholar]
  48. Archontoulis, S.V.; Miguez, F.E. Nonlinear regression models and applications in agricultural research. Agron. J. 2015, 107, 786–798. [Google Scholar] [CrossRef] [Scilit]
  49. Pinheiro, J.; Bates, D. nlme: Linear and Nonlinear Mixed Effects Models. R Package Version 3.1-169. R. Core Team 2026. Available online: https://svn.r-project.org/R-packages/trunk/nlme/ (accessed on 14 June 2026).
  50. Draper, N.R.; Smith, H. Applied Regression Analysis, 3rd ed.; John Wiley and Sons, Inc.: New York, NY, USA, 2014; pp. 135–148. [Google Scholar]
  51. Cantero-Martínez, C.; Angás, P.; Lampurlanés, J. Long-term yield and water use efficiency under various tillage systems in Mediterranean rainfed conditions. Ann. Appl. Biol. 2007, 150, 293–305. [Google Scholar] [CrossRef] [Scilit]
  52. Bosch-Serra, A.D.; Ortiz, C.; Yagüe, M.R.; Boixadera, J. Strategies to optimize nitrogen efficiency when fertilizing with pig slurries in dryland agricultural systems. Eur. J. Agron. 2015, 67, 27–36. [Google Scholar] [CrossRef] [Scilit]
  53. Harasim, E.; Kwiatkowski, C.A. Effect of farming system and irrigation on physicochemical and biological properties of soil under spring wheat crops. Sustainability 2025, 17, 6473. [Google Scholar] [CrossRef] [Scilit]
  54. Khan, S.A.; Mulvaney, R.L.; Ellsworth, T.R.; Boast, C.W. The myth of nitrogen fertilization for soil carbon sequestration. J. Environ. Qual. 2007, 36, 1821–1832. [Google Scholar] [CrossRef] [Scilit] [PubMed]
  55. Dambreville, C.; Hénault, C.; Bizouard, F.; Morvan, T.; Chaussod, R.; Germon, J.C. Compared effects of long-term pig slurry applications and mineral fertilization on soil denitrification and its end products (N2O, N2). Biol. Fertil. Soils 2006, 42, 490–500. [Google Scholar] [CrossRef] [Scilit]
  56. Rochette, P.; van Bochove, E.; Prévost, D.; Angers, D.A.; Côté, D.; Bertrand, N. Soil carbon and nitrogen dynamics following application of pig slurry for the 19th consecutive year II. Nitrous oxide fluxes and mineral nitrogen. Soil Sci. Soc. Am. J. 2000, 64, 1396–1403. [Google Scholar] [CrossRef] [Scilit]
  57. Hountin, J.A.; Couillard, D.; Karam, A. Soil carbon, nitrogen and phosphorous contents in maize plots after 14 years of pig slurry applications. J. Agric. Sci. 1997, 129, 187–191. [Google Scholar] [CrossRef] [Scilit]
  58. Heckman, K.; Hicks Pries, C.E.; Lawrence, C.R.; Rasmussen, C.; Crow, S.E.; Hoyt, A.M.; von Fromm, S.F.; Shi, Z.; Stoner, S.; McGrath, C.; et al. Beyond bulk: Density fractions explain heterogeneity in global soil carbon abundance and persistence. Glob. Change Biol. 2021, 28, 1178–1196. [Google Scholar] [CrossRef] [Scilit] [PubMed]
  59. Aust, M.O.; Thiele-Bruhn, S.; Eckhardt, K.U.; Leinweber, P. Composition of organic matter in particle size fractionated pig slurry. Bioresour. Technol. 2009, 100, 5736–5743. [Google Scholar] [CrossRef] [Scilit] [PubMed]
  60. Yu, W.; Huang, W.; Weintraub-Leff, S.R.; Hall, S.J. Where and why do particulate organic matter (POM) and mineral-associated organic matter (MAOM) differ among diverse soils? Soil Biol. Biochem. 2022, 172, 108756. [Google Scholar] [CrossRef] [Scilit]
  61. Poeplau, C.; Don, A. Sensitivity of soil organic carbon stocks and fractions to different land-use changes across Europe. Geoderma 2013, 192, 189–201. [Google Scholar] [CrossRef] [Scilit]
  62. Cotrufo, M.F.; Lavallee, J.M. Soil organic matter formation, persistence, and functioning: A synthesis of current understanding to inform its conservation and regeneration. Adv. Agron. 2022, 172, 1–66. [Google Scholar] [CrossRef] [Scilit]
  63. Guerrero, C.; Moral, R.; Gomez, I.; Zornoza, R.; Arcenegui, V. Microbial biomass and activity of an agricultural soil amended with the solid phase of pig slurries. Bioresour. Technol. 2007, 98, 3259–3264. [Google Scholar] [CrossRef] [Scilit] [PubMed]
  64. Plaza, C.; Hernández, D.; Garcia-Gil, J.C.; Polo, A. Microbial activity in pig slurry-amended soils under semiarid conditions. Soil Biol. Biochem. 2004, 36, 1577–1585. [Google Scholar] [CrossRef] [Scilit]
  65. Silva, E.M.; Frühauf, A.C.; Menezes da Silva, E.; Muniz, J.A.; Fernandes, T.J. Sigmoid models in the description of CO2 evolved from legumes in the soil. Rev. Agrogeoambiental 2023, 15, e20231776. [Google Scholar] [CrossRef] [Scilit]
  66. Albrizio, R.; Todorovic, M.; Matic, T.; Stellaci, A.M. Comparing the interactive effects of water and nitrogen on durum wheat and barley grown in a Mediterranean environment. Field Crop. Res. 2010, 155, 179–190. [Google Scholar] [CrossRef] [Scilit]
  67. Lowell, J.E.; Liu, Y.; Stein, H.H. Comparative digestibility of energy and nutrients in diets fed to sows and growing pigs. Arch. Anim. Nutr. 2015, 69, 79–97. [Google Scholar] [CrossRef] [Scilit] [PubMed]
  68. Ortiz, C.; Boixadera, J.; Bosch-Serra, À.D. Residual effects of pig slurry fertilization in a Mediterranean rainfed cereal system. Agronomy 2024, 14, 2552. [Google Scholar] [CrossRef] [Scilit]
  69. Jiménez-de-Santiago, D.E.; Lidón, A.; Bosch-Serra, À.D. Soil water dynamics in a rainfed mediterranean agricultural system. Water 2019, 11, 799. [Google Scholar] [CrossRef] [Scilit]
Figure 1. Geographical location of the experimental site in Oliola (Lleida, Catalonia, Spain), derived from Google Earth imagery. The experimental area is marked by an arrow in the right image.
Sustainability 18 07725 g001
Figure 2. Average monthly distribution (10-year period) of rainfall, reference evapotranspiration (ETo, FAO Penman–Monteith equation [23]) and air temperature.
Sustainability 18 07725 g002
Figure 3. Carbon stock evolution ratio (CSERT) for three treatments (CO, control, no N applied; SS, sow slurry; FS, fattening−pig slurry), compared with mineral-N (MN, reference value = 0.0). Values are expressed relative to total C inputs (black lines) or slurry-derived C inputs (red lines) for one hectare (0–0.15 m depth). Mean values represented by solid circles (black or grey) and labeled with different uppercase letters (A, B) differ significantly according to DMRT (p = 0.05). Standard deviations are shown as horizontal bars.
Sustainability 18 07725 g003
Figure 4. Cumulative carbon mineralization (mg CO2-C kg−1 soil) during a 52-day aerobic incubation of soils under different fertilization treatments (CO: control, no N applied; MN: mineral N fertilization; SS: sow slurry; FS: fattening-pig slurry.
Sustainability 18 07725 g004
Figure 5. Cumulative available N from net mineralization during the incubation period under different treatments (CO: control, no N applied; MN: mineral N fertilization; SS: sow slurry; FS: fattening-pig slurry).
Sustainability 18 07725 g005
Table 1. Fertilization treatments 1 and the associated average annual inputs (±standard deviation, SD) of total nitrogen (TN; organic plus mineral) 2, ammonium-N (NH4+–N), and organic carbon (OC) applied to the experimental field, together with the corresponding inputs for the last cropping season (9th cropping season, 10th year) 3.
TreatmentAverage of Fertilization Applied in
Eight Cropping Seasons
Fertilization Applied in
the Last Cropping Season
TNNH4+–NOCTNNH4+–NOC
(kg ha−1 yr−1 ± SD) 4(kg ha−1)
CO000000
MN1200012000
SS179 (±95)108 (±54)1135 (±855)2021401241
FS210 (±48)139 (±31)891 (±499)2161461227
1 CO: control, no N applied; MN: mineral N applied as ammonium nitrate; FS: fattening−pig slurry; SS: sow slurry. 2 The difference between the TN and the NH4+–N equals the organic N applied. 3 In the 6th cropping season, the field was left fallow. 4 Numbers in brackets are standard deviation values (SD).
Table 2. Additional chemical characteristics of slurries applied in the last cropping season.
Slurry TreatmentpH
(1:5, s:w) 1
EC (1:5, s:w) 1
(dS m−1)
Dry Matter
(g kg−1)
Total P
(g kg−1) 2
Total K
(g kg−1) 2
Slurry from sows (SS)8.72.1352425
Slurry from fattening pigs (FS)8.76.3972244
1 EC: electrical conductivity; ratio of slurry (s) to distilled water (w). 2 Expressed on a dry matter basis.
Table 3. Fertilization treatments 1 and the associated average (±standard deviation) 2 of annual grain and straw biomass yields (0% humidity) for the previous period of eight seasons of winter cereals, together with barley yields in the last cropping season (9th cropping season, 10th year) 3.
Eight Cropping SeasonsLast Cropping Season
TreatmentGrain Yield
(kg ha−1)
Straw Biomass
(kg ha−1)
Grain Yield
(kg ha−1)
Straw Biomass
(kg ha−1)
CO2931 ± 249 c917 ± 78 c2258 ± 543 c707 ± 169 b
MN3684 ± 140 b1153 ± 44 b3887 ± 316 b1217 ± 99 b
SS4159 ± 433 a1302 ± 136 a4821 ± 116 a1509 ± 36 a
FS4445 ± 429 a1391 ± 134 a4862 ± 411 a1522 ± 129 a
1 CO: control, no N applied; MN: mineral N fertilization; SS: sow slurry; FS: fattening−pig slurry. 2 Means with different lower-case letters are significantly different according to DMRT (p = 0.05). 3 In the 6th cropping season, the field was left fallow.
Table 4. Fertilization treatments 1 and the associated average (±standard deviation) 2 of soil organic carbon (SOC), its granulometric–densimetric fractions, 3 and microbial biomass carbon (MBC).
TreatmentSOCLF
(2–0.2 mm)
HF
(2–0.2 mm)
LF
(0.2–0.05 mm)
HF
(0.2–0.05 mm)
(<0.05 mm)MBC
(g kg−1)(mg kg−1)
CO14.9 ± 0.5 c1.1 ± 0.40.3 ± 0.12.4 ± 0.91.8 ± 0.39.2 ± 0.6 b181 ± 21
MN16.8 ± 0.6 bc1.2 ± 0.30.3 ± 0.32.2 ± 0.82.2 ± 0.710.9 ± 1.2 ab199 ± 5
SS18.1 ± 1.7 b1.9 ± 0.40.5 ± 0.22.2 ± 0.91.9 ± 1.011.6 ± 1.2 a208 ± 40
FS20.8 ± 1.6 a1.7 ± 0.30.7 ± 0.22.7 ± 0.53.2 ± 1.512.5 ± 1.8 a247 ± 74
1 CO: control, no N applied; MN: mineral N fertilization; SS: sow slurry; FS: fattening-pig slurry. 2 Means with different lower-case letters are significantly different according to DMRT (p = 0.05). 3 Densiometric fractions: light fraction (LF) and heavy fraction (HF). Particle size fractions: 2—0.2 mm, 0.2—0.05 mm, <0.05 mm.
Table 5. Estimated parameters of the Gompertz model C(t) = C · exp (−exp(−b · (t − t_m))) for the different fertilization treatments 1 over the incubation period (t = days). Confidence intervals (CI) 2 and standard errors (SE) are provided.
TreatmentC (mg kg−1)
[CI 95%]
b (day−1)
[CI 95%]
t_m (Days)
[CI 95%]
Average of SE (%)
CO453.80
[387.39; 520.21]
0.0543
[0.0391; 0.0695]
15.36
[11.94; 18.78]
10.2
MN938.06
[611.00; 1265.12]
0.0282
[0.0196; 0.0368]
36.47
[23.62; 49.32]
15.8
SS910.29
[532.79; 128779]
0.0354
[0.0238; 0.0470]
29.89
[20.25; 39.53]
16.7
FS1054.23
[564.26; 1544.20]
0.0323
[0.0181; 0.0465]
32.88
[17.68; 48.09]
21.5
1 CO: control, no N applied; MN: mineral N fertilization; SS: sow slurry; FS: fattening−pig slurry. 2 Confidence intervals were calculated as Parameter estimation ± t (0.975, 16 df) × standard error (critical t ≈ 2.12).
Table 6. Estimated parameters from NLME-CS 1 model following the equation (N(t) = A × (1 − exp (−k t)) for the different N fertilization treatments 2 over the incubation period (t = days).
Treatment 2A (mg N kg−1)k (days−1)
CO27.310.04382
MN32.570.04382
SS38.690.04382
FS41.330.04382
1 Nonlinear mixed-effects model with a compound symmetry correlation structure (NLME-CS). 2 CO: control, no N applied; MN: mineral N fertilization; SS: sow slurry; FS: fattening−pig slurry.
Disclaimer/Publisher’s Note: The statements, opinions and data contained in all publications are solely those of the individual author(s) and contributor(s) and not of MDPI and/or the editor(s). MDPI and/or the editor(s) disclaim responsibility for any injury to people or property resulting from any ideas, methods, instructions or products referred to in the content.