1. Introduction
Sustainable urban mobility is a central requirement for rapidly growing cities. Public transportation plays a central role in smart cities by improving urban mobility, reducing road congestion, lowering environmental impact, and enhancing quality of life [
1,
2]. As cities continue to grow, transit systems are increasingly expected to provide not only high-capacity mobility but also intelligent, responsive, and passenger-centered services.
This need is particularly relevant in Riyadh, where rapid urban growth and upcoming international events, including Expo 2030 and the FIFA World Cup 2034, will place mounting pressure on the city’s mobility network [
3,
4,
5]. The Riyadh Metro, developed under the King Abdulaziz Project for Riyadh Public Transport, represents a major step toward meeting these demands through a six-line network of 85 stations and 176 km of rail, with a planned capacity of up to 3.6 million passengers per day [
6]. The system has been adopted rapidly, carrying more than 100 million passengers within roughly its first nine months of operation [
7]. Yet ridership is highly concentrated: central interchanges such as Al-Olaya and Qasr Al-Hokm account for a large share of demand, and the Blue Line alone carried nearly 10 million passengers in its first two months [
8].
Despite the scale and importance of the Riyadh Metro, metro systems often face operational challenges related to peak-hour congestion, uneven passenger distribution, and limited real-time awareness. A secondary but persistent operational burden is lost-property management; Transport for London’s Lost Property Office, for comparison, handles hundreds of thousands of items each year, only a fraction of which are reclaimed [
9], illustrating how manual processes scale poorly with ridership.
Existing passenger applications commonly provide useful services such as trip planning and station information [
10], but they are generally reactive rather than predictive. Such applications do not directly support passengers and staff with real-time crowd monitoring, short-term congestion forecasting, or proactive guidance. Service-related processes, such as Lost and Found management, often remain manual or semi-manual, increasing staff workload and making it difficult for passengers to report, track, and recover lost items efficiently.
Internationally, even mature systems remain largely descriptive or reactive: they report current conditions rather than anticipating them. At the same time, digital-twin (DT) technology, a continuously synchronized virtual representation of a physical asset or process, has matured into a practical tool for simulating passenger flows, forecasting congestion, and testing operational decisions before they are enacted [
11,
12]. Although Saudi Arabia has accelerated DT adoption across smart-city, healthcare, and digital-government initiatives under Vision 2030 [
13,
14], and its public transport sector is overseen by the Transport General Authority [
15], the application of DT and predictive passenger-flow management to metro operations remains comparatively limited and under-explored, as the review in
Section 2 details. This gap, between advanced DT and machine-learning (ML) capabilities on one side and the everyday needs of passengers and operators on the other, motivates the present work.
This paper presents Masar, an AI-powered digital twin prototype for Riyadh Metro. Masar integrates four complementary capabilities: real-time crowd monitoring, 30 min congestion prediction, Arabic conversational support for passengers, and a smart lost-and-found workflow supported by AI-assisted matching. The system was implemented as a passenger mobile application and staff dashboard, connected to a backend simulation and data layer. Since real Riyadh Metro operational datasets were not available during development, the prototype uses synthetic data generation to simulate passenger flows, station activity, and event-based demand. Synthetic data are common in early-stage system prototyping when access to sensitive operational records is restricted, provided their assumptions and limitations are transparently documented [
16]. Because live bidirectional synchronisation with the physical metro infrastructure has not yet been established, Masar is best described as an early-stage Digital Twin prototype that demonstrates the core architectural components—real-time simulation, predictive analytics, and operational visualization—rather than a fully operational Digital Twin; field deployment and validation against real AFC data remain the primary next step.
The specific contributions of this work are as follows:
An integrated digital-twin architecture for urban rail that combines real-time simulation, short-term congestion forecasting, passenger-facing conversational assistance, and AI-assisted lost-property matching within a single lightweight platform serving both passengers and metro operators.
A reproducible synthetic mobility-data pipeline that uses a dual-Gaussian demand model, contextual demand multipliers, trip and stop-time generation, and carriage-level occupancy simulation, with documented validation checks, to enable system development and evaluation when access to real operational metro data is restricted.
A predictive crowd-management approach that applies machine-learning models to forecast station congestion 30 min in advance, supporting proactive passenger guidance and operational decision-making in high-demand metro environments.
An evaluation framework that combines machine-learning performance metrics with functional testing of the chatbot and Lost & Found components, while clearly identifying real-world deployment and validation as the primary next step.
The remainder of the paper is organized as follows.
Section 2 reviews related work on digital twins, passenger-flow forecasting, and smart passenger-support services.
Section 3 presents the materials and methods, including the research design, system architecture, synthetic data generation pipeline, feature engineering, forecasting models, and system implementation.
Section 4 presents the experimental results.
Section 5 discusses the findings, sustainability implications, and limitations.
Section 6 concludes the paper and outlines directions for future work.
2. Related Work
2.1. Digital Twins in Transportation
Digital Twin systems have emerged as a significant research direction in rail and metro transportation, providing virtual representations that integrate operational data, simulation models, and visualization tools to support monitoring, decision-making, and passenger management. The maturity of a Digital Twin is primarily determined by the level of integration and bidirectional data exchange between physical and digital entities, rather than by the sophistication of its 3D visualization [
11]. Accordingly, systems that do not yet achieve full bidirectional synchronization are more accurately classified as Digital Shadows [
12].
Early metro Digital Twin work focused on simulation-based operational analysis. Pokusaev et al. [
17] developed a discrete-event modeling framework for metro systems, demonstrated on lines of the Moscow subway, that simulates passenger boarding and alighting and route selection to support train scheduling and bottleneck analysis. Such models provide a foundation for operational Digital Twins and allow operating protocols to be adjusted under different demand scenarios, but they emphasize technical scheduling and control rather than passenger-facing services or predictive functionality.
A comparable simulation-driven approach was adopted in the Milan Metro project, where the AnyLogic platform was used to model passenger arrivals, train capacities, and boarding and alighting processes [
18]. This system enabled operators to test different scheduling and staffing strategies under varying demand conditions and represented an early attempt to combine Digital Twin technology with basic predictive analytics. Although the predictive component remained limited and the overall approach was predominantly simulation-driven, the study demonstrated the potential of Digital Twin systems for improving crowd control and resource allocation during peak hours.
More recently, Ou et al. [
19] proposed a multi-layer Digital Twin platform for the Sydney rail network that integrates deep learning-based passenger flow prediction with real-time train movement data, traffic simulation, and interactive visualization. Unlike earlier projects, this system explicitly evaluated disruption scenarios, including delays and network incidents, to assess their operational impact. The integration of mobile data improved prediction accuracy relative to systems relying solely on Automated Fare Collection (AFC) records. However, the platform’s reliance on large-scale heterogeneous data integration and computationally intensive deep learning architectures limits its adaptability in resource-constrained deployment contexts. Collectively, these studies demonstrate the evolution of metro Digital Twin applications from purely simulation-based systems toward predictive integration, while also revealing persistent gaps in passenger-facing service provision and the coupling of forecasting with operational decision support.
2.2. Machine Learning for Passenger Flow Forecasting
Short-term passenger flow prediction has attracted substantial research attention as a means of enabling proactive metro operations. Forecasting methods have evolved from conventional univariate time-series models toward machine learning and deep learning approaches better suited to capturing the complex spatiotemporal patterns governing metro demand [
20].
Qian [
21] applied the XGBoost algorithm to forecast subway passenger flows, incorporating external contextual factors such as weather and temperature alongside ridership data, and showed that gradient-boosted models are well suited to short-term operational planning. The study noted, however, that the forecasting component was developed as a standalone tool without integration into real-time operational systems or broader Digital Twin platforms.
Hybrid modeling approaches have also been explored to address the nonlinear and nonstationary nature of metro passenger flow data. Li et al. [
22] proposed a framework combining adaptive time-series decomposition with a multi-model ensemble to improve short-term subway passenger flow prediction, demonstrating that preprocessing complex demand signals before model training can yield accuracy gains over conventional machine learning methods. Han et al. [
20] addressed the specific challenge of newly operated urban rail stations with limited historical data by proposing a Meta-LSTM model based on meta-learning principles, achieving strong short-term prediction performance under data-scarce conditions. More recent spatiotemporal approaches, such as the SADARGRU model incorporating graph-based residual learning and spatial attention mechanisms, have further extended deep learning-based forecasting to capture inter-station dependencies in metro networks [
23].
Despite these advances, existing passenger flow prediction studies predominantly focus on maximizing regression accuracy as an isolated objective. The integration of predictive outputs into Digital Twin environments, operational dashboards, or passenger-facing interfaces remains limited, leaving a gap between forecasting capability and system-level operational deployment.
2.3. Assistive Technologies and Operations Dashboards
Beyond prediction, assistive technologies, including conversational agents and accessible interfaces, provide always-on information and reduce staff workload, and improve inclusivity for passengers regardless of language, time, or ability. Conversational agents have been proposed as intelligent transit-information systems capable of answering natural-language passenger queries and supporting route guidance, schedule information, ticketing inquiries, service updates, and feedback collection [
24]. In their study of AI-powered chatbot adoption for public-transport services in a smart-city setting, Kuberkar and Singhal [
24] found that performance expectancy, effort expectancy, social influence, and trust are dominant determinants of passengers’ intention to use such systems. These acceptance factors motivate the design of simple, reliable, and trustworthy interfaces. In the Riyadh Metro context, Arabic-language support and dialect tolerance are especially important for broadening practical accessibility among local passengers. Comparable acceptance dynamics have been reported for conversational service in adjacent transport domains [
25]. In practice, conversational APIs allow an assistant to retrieve live schedule and station data, while location services, such as the Google Maps Platform, add geolocation, routing, and station-level mapping capabilities. When combined with a chatbot, these services can support step-by-step guidance and on-map congestion awareness [
26].
Automated Lost and Found systems represent a parallel strand of passenger-service automation. These systems are commonly framed as matching problems over item attributes such as type, color, brand, free-text description, location, time, and image similarity [
27]. Recent work shows that lightweight deep learning models combined with perceptual hashing can match photographs of lost and recovered items robustly and in real time. LostNet, for example, combines a MobileNetV2 backbone, an attention module, and perceptual hashing to achieve high image-matching accuracy on commodity hardware [
28].
On the operations side, dashboards aggregate real-time and historical data into maps, indicators, charts, and alerts that provide staff with situational awareness for anomaly detection, incident management, and resource allocation [
29,
30]. In metro environments, dashboards are particularly valuable when they combine current system status with predictive indicators, allowing operators to anticipate congestion before it escalates.
Across these strands, however, AI-powered passenger-assistance capabilities, including conversational agents and intelligent Lost and Found systems, are typically developed and evaluated as standalone services. They are often decoupled from real-time monitoring, passenger-flow prediction, and digital twin operational frameworks. Conversely, operator dashboards may surface current system status without integrating prediction, passenger-service requests, and AI-assisted workflows within a single interface. Masar addresses this fragmentation by combining an Arabic conversational assistant and an AI-assisted Lost and Found service with a staff operations dashboard, so that the same digital twin state informs both passengers and operators.
2.4. Comparable Products and Positioning
In addition to academic research, several operational metro applications and digital platforms provide relevant context for positioning the Masar system. The Darb application, the official journey-planning tool for the Riyadh Metro, provides trip planning, digital ticketing, and station information [
10]. While Darb offers broad coverage of passenger information needs, it does not provide real-time crowd monitoring, short-term congestion prediction, or AI-assisted passenger services. Transport for London’s TfL Go application provides real-time station crowding levels and live arrival information for the London Underground [
31], but it similarly lacks predictive congestion forecasting capabilities. The Bentley iTwin Platform offers enterprise-grade Digital Twin functionality by integrating Building Information Modelling (BIM), Geographic Information Systems (GIS), and IoT data streams for infrastructure operators [
32]. However, it is oriented toward technical operations rather than passenger-facing services and requires extensive IoT sensor infrastructure. Tokyo Metro my! provides personalized route planning together with real-time and predicted per-car congestion, but it relies on dedicated onboard and station instrumentation, is confined to its own network, and offers no conversational or lost-property services [
33].
Table 1 contrasts Masar with representative solutions.
The preceding review reveals three persistent gaps in existing research and practice. First, metro Digital Twin deployments predominantly emphasize simulation-based monitoring and disruption analysis, with limited integration of short-term passenger flow forecasting into reproducible predictive pipelines [
17,
19]. Second, machine learning-based passenger flow prediction studies focus primarily on forecasting accuracy, without coupling predictive outputs to Digital Twin visualization environments or operational decision-support interfaces [
20,
21,
22]. Third, AI-powered passenger-assistance services, including Arabic conversational agents and intelligent Lost and Found systems, are commonly developed as standalone applications rather than being embedded within integrated metro operational platforms [
24,
25,
27,
28].
Masar addresses these gaps by proposing a unified predictive digital twin prototype that integrates station-level real-time crowd monitoring, 30 min-ahead congestion forecasting, an AI-powered Arabic chatbot, and an automated Lost and Found matching engine within a single platform serving both Riyadh Metro passengers and operational staff. The system is specifically designed to bridge the separation between predictive analytics, Digital Twin visualization, and passenger-facing service delivery that characterizes the current state of the art.
3. Materials and Methods
3.1. Research Design
The study follows a design-science approach in which a technology artifact is designed, implemented, and evaluated to address an identified practical problem. The design process comprised requirement analysis, prototype development, synthetic data generation, predictive modeling, and validation. Requirements were elicited in part through informal consultation with Riyadh Metro operational staff, whose input on peak-period demand, passenger distribution, and day-to-day operations informed the design of the synthetic data pipeline and the system’s crowd-management features.
The development process followed an agile Scrum model. This was suitable because the project combined multiple interdependent components: a passenger mobile application, a staff dashboard, backend APIs, Firebase services, synthetic data simulation, machine-learning models, an Arabic chatbot, and an AI-assisted lost-and-found service. The iterative process allowed the prototype to evolve from basic crowd monitoring and prediction into a more comprehensive smart metro-support platform.
3.2. Scope and Study Setting
To keep the prototype tractable while remaining representative, the study covers six Riyadh Metro stations selected to span distinct usage contexts and the network’s main lines: King ؤAbdullah Financial District (KAFD), STC/Olaya, Qasr Al-Hokm, National Museum, Airport Terminals 1–2, and First Industrial City. The prediction horizon is fixed at 30 min, a window shown in prior work to balance forecasting accuracy against actionable lead time. The prototype focuses on two-dimensional analytical visualization rather than high-fidelity 3D rendering, consistent with the early-stage Digital Twin prototype classification described in
Section 2.1.
Masar targets two main user groups. The first group is metro passengers who need real-time station information, crowd-level indicators, route guidance, congestion alerts, chatbot support, and lost-item reporting. The second group is metro staff who need an operational dashboard to monitor station conditions, review crowd indicators, inspect predictions, manage lost-and-found reports, verify item collection, and interpret AI-assisted matching results.
The prototype currently supports Arabic interfaces and Android mobile deployment, with iOS and multilingual support reserved for future work.
3.3. System Overview and Architecture
The system integrates two primary interfaces: a passenger mobile application built using Flutter [
34] and a web-based staff dashboard. The passenger application enables users to monitor real-time and forecasted crowd levels at stations and train carriages, receive proactive congestion alerts, browse trip schedules, and interact with an Arabic AI-powered chatbot. The staff dashboard provides metro employees with live crowd monitoring, KPI analytics, historical data visualization, and a smart Lost and Found management interface.
The chatbot is powered by the GPT API [
35], offering natural language interaction in Arabic. It handles general metro inquiries, trip planning, route suggestions, and end-to-end Lost and Found workflows including report submission, status tracking, AI-assisted staff matching, and OTP-based secure item collection. This conversational model distinguishes Masar from existing static menu-driven applications and aligns with Saudi Vision 2030 objectives for inclusive smart cities [
14].
The system’s backend is built on Firebase [
36], handling authentication, real-time data synchronization, and cloud-based ML inference.
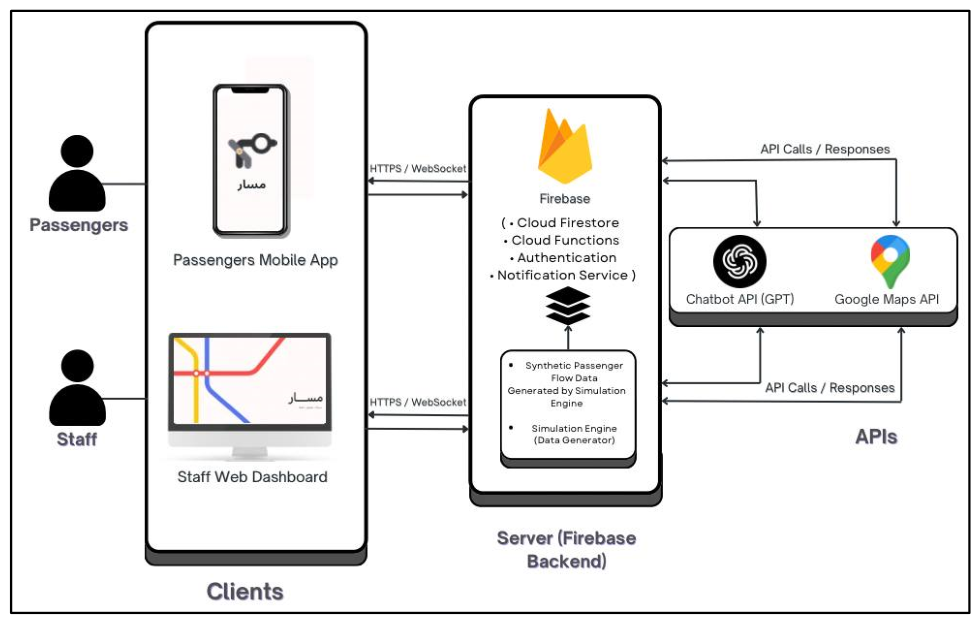
Masar follows a three-layer client–server architecture comprising a Client Layer, a Backend Layer, and an External Services Layer, as illustrated in
Figure 1. The system serves two primary user groups: metro passengers, who access real-time crowd monitoring, trip planning, and AI-assisted services through the mobile application; and metro staff, who manage operational monitoring, Lost and Found workflows, and congestion analytics through the web dashboard.
The Client Layer includes the Flutter-based passenger mobile application [
34] and the React web-based staff dashboard, both communicating with the backend via HTTPS and WebSocket connections. The Backend Layer is built on Firebase [
36], handling secure user authentication, real-time data synchronization via Cloud Firestore, cloud-based ML inference through Cloud Functions, and notification services. The External Services Layer integrates the Google Maps API [
26] for geolocation and route computation, and the GPT API [
35] for natural language processing, chatbot responses, and AI-assisted Lost and Found item matching.
Data flows through the system across three operational pipelines. The Congestion Prediction Pipeline generates synthetic crowd snapshots via the simulation engine, stores them in Firestore, and serves 30 min-ahead forecasts to both client interfaces. The Chatbot Interaction Pipeline processes passenger messages through the GPT API via Firebase Cloud Functions, persisting session state to support multi-step conversational flows. The Lost and Found Matching Pipeline cross-references passenger lost-item reports with staff-registered found items using the AI matching engine, automatically notifying matched passengers and triggering OTP-based collection verification upon staff confirmation.
3.4. Synthetic Data Generation and Preparation Pipeline
Because granular Riyadh Metro operational and ticketing-gate data are not publicly available, Masar relies on a calibrated, reproducible synthetic data generation pipeline rather than ad hoc sample records. This is a deliberate, transparently stated design decision: synthetic generation is an established practice for validating transit concepts before instrumentation, and it avoids handling personal travel data during prototyping [
16]. The objective was not to claim exact real ridership values, but to create a controlled and realistic experimental environment for testing digital-twin visualization, 30 min congestion forecasting, station-level crowd indicators, and carriage-level occupancy displays. The pipeline is fully configuration-driven and reproducible: service hours, headways, peak windows, and event and day-type multipliers are declared in a single configuration file, while companion route and station definitions specify line topology, ordered stops, dwell times, and segment travel times, allowing the dataset for a different month to be regenerated by changing only one parameter.
At the core of the generator is a demand model grounded in a well-documented regularity of urban-rail travel: ridership follows a bimodal daily profile with distinct morning and evening commuting peaks. This pattern is widely used in transit demand modeling and was further informed by input from Riyadh Metro operational staff during requirements gathering, who confirmed that passenger demand rises during the morning commute and again in the early evening [
37]. Each peak is represented by a Gaussian component, so the baseline time-of-day demand at hour
t is modeled as a dual-Gaussian (bi-modal Gaussian) function:
where μ
1 and μ
2 center the morning (≈08:00) and evening (≈18:00) peaks, A
1 and A
2 set their amplitudes, and σ
1 and σ
2 (≈1.5 h) control how sharply demand rises and falls. The normalized profile D(t), bounded to the interval [0, 1], is then scaled to a minute-level, station-specific occupancy as:
where Capacity(s) is the maximum passenger capacity of station s, and M_event and M_day-type scale demand for special events (national holidays, festivals, and sports events) and for day type (weekday or weekend), respectively. The key operational parameters underlying the simulation are summarized in
Table 2.
A trip and stop-time generator builds realistic timetables in which headways shorten during peak hours and lengthen during off-peak periods, applying the 45 s dwell time at each intermediate stop. A passenger-flow model then distributes each train’s load across its four carriages—heavier in the middle cars and lighter in the front, rear, and VIP cars—within capacity limits, producing coherent station- and carriage-level occupancy. Each simulation run produced a monthly CSV dataset (e.g., /data/generated/occupancy_YYYY-MM.csv), subsequently uploaded to Firebase Firestore under the hierarchy stations/{station_id}/days/{YYYYMMDD}/minutes/{YYYYMMDDHHmm} to support real-time querying and synchronization with the mobile application and staff dashboard. A rolling 120 min window of minute-level snapshots is retained, supplying the recent history consumed by the forecasting model.
Predicted and observed occupancy are mapped to four operationally meaningful crowd levels using the occupancy ratio r (passengers divided by capacity), as defined in
Table 3. This mapping turns continuous forecasts into user-facing, color-coded indicators applied consistently across the mobile application, the dashboard, and the conversational assistant.
Before use, the September 2025 dataset (194,580 min-level records) was checked with automated scripts for statistical consistency, logical coherence, and structural integrity, summarized in
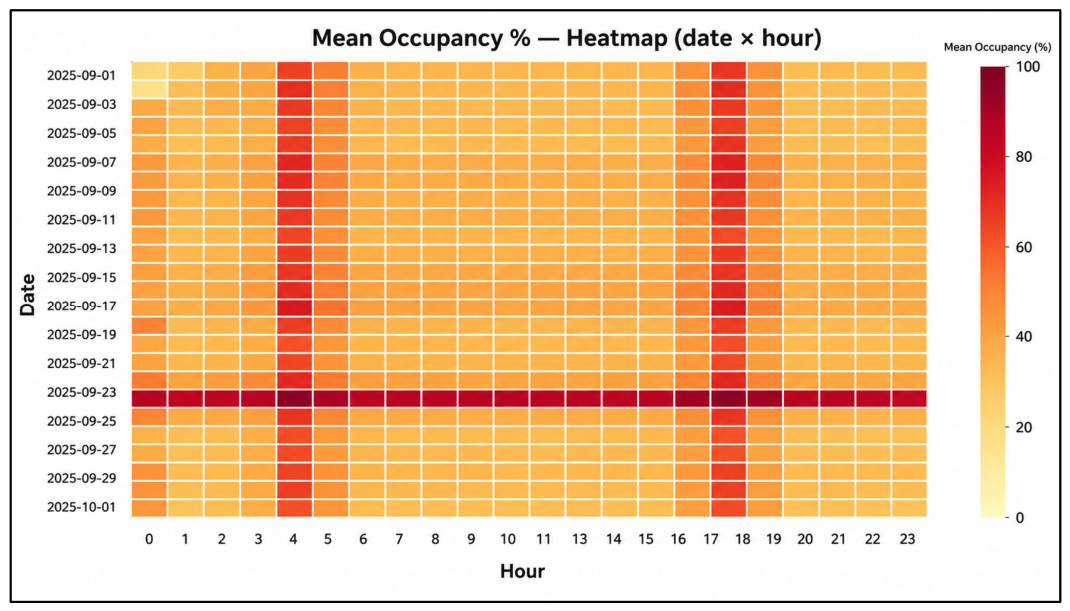
Table 4. Every train headway fell within the 3–20 min operational range, no station exceeded 110% of its rated capacity, and the event flag was perfectly consistent with the labeled event type; by composition, the records comprised 182,689 normal-operation minutes, 6486 national-holiday, 3243 festival, and 2162 sports-event minutes. An occupancy heatmap over date and hour (
Figure 2) reproduced the expected morning (07:00–09:00) and evening (17:00–19:00) peaks together with a pronounced demand surge on the simulated Saudi National Day, confirming that the generator responds correctly to both temporal and contextual drivers. These checks do not substitute for real operational data, but they establish that the synthetic data are internally consistent and operationally plausible—a prerequisite for a meaningful model comparison.
The synthetic data generation process was designed to reproduce operationally plausible demand patterns using a combination of stakeholder input and explicit modeling assumptions. Consultation with Riyadh Metro staff informed key operational parameters, including train and carriage capacities and the approximate timing of daily demand peaks. Where measured data were unavailable, parameters such as station capacities, peak spread, event and day-type effects, and carriage-level passenger distribution were estimated according to station characteristics, plausible passenger behavior, and the anticipated impact of nearby events. Although these assumptions produced internally consistent and operationally plausible simulation patterns, they also influence the structure and variability of the generated data. Consequently, the reported forecasting results should be interpreted within the context of the specified simulation settings rather than as direct estimates of real-world predictive accuracy.
3.5. Feature Engineering
The congestion forecasting task was formulated as a supervised regression problem: given a two-hour window of station-level demand history, predict the congestion score 30 min ahead. This prediction horizon is widely adopted in metro passenger-flow studies and provides sufficient lead time for operational response [
21,
22]. Five feature groups are used, summarized in
Table 5: temporal calendar features, autoregressive lag features at 5, 15, 30, 60, and 120 min, rolling statistics over short and medium windows, contextual flags for events and headway, and static station metadata. This representation lets a single model generalize across stations and times of day while remaining inexpensive to compute online.
3.6. Forecasting Models and Training
The simulation engine generated 194,580 min-level records spanning one month (September 2025) across the six study stations. The dataset was partitioned chronologically into 70% training, 15% validation, and 15% testing to preserve temporal integrity and prevent information leakage. Four regression models were evaluated: XGBoost (proposed), Random Forest (ensemble baseline), SARIMA (statistical baseline), and LSTM (deep learning baseline). XGBoost was selected as the primary model due to its robustness on structured tabular data, ability to capture nonlinear demand relationships through gradient-boosted decision trees with regularization, and low-latency inference suitable for real-time digital twin deployment [
21].
To improve transparency and facilitate assessment of the model comparison, the principal configurations and selection procedures for the XGBoost and SARIMA models are summarized in
Table 6.
The XGBoost hyperparameters were selected through Optuna Bayesian optimization over 40 trials. The statistical baseline, reported as SARIMA in the model comparison, was implemented as ARIMA(1, 1, 1). It was fitted separately for each station using the most recent 200 observations in a rolling one-step forecasting procedure. The order was selected for computational tractability, and predictions were evaluated at 30 min intervals.
Model performance was assessed using regression metrics (MAE, RMSE, R2) and congestion-state classification metrics (accuracy, balanced accuracy, weighted F1, Macro F1, Cohen’s Kappa, Severe Congestion Detection Rate, and Catastrophic Error Rate), providing a holistic view of predictive quality under peak demand conditions.
A systematic sensitivity analysis was not conducted in the present study and is recommended as future work to evaluate how variations in station-capacity estimates, peak-demand parameters, event multipliers, and carriage-distribution assumptions affect forecasting errors, congestion-classification performance, and the relative ranking of the evaluated models.
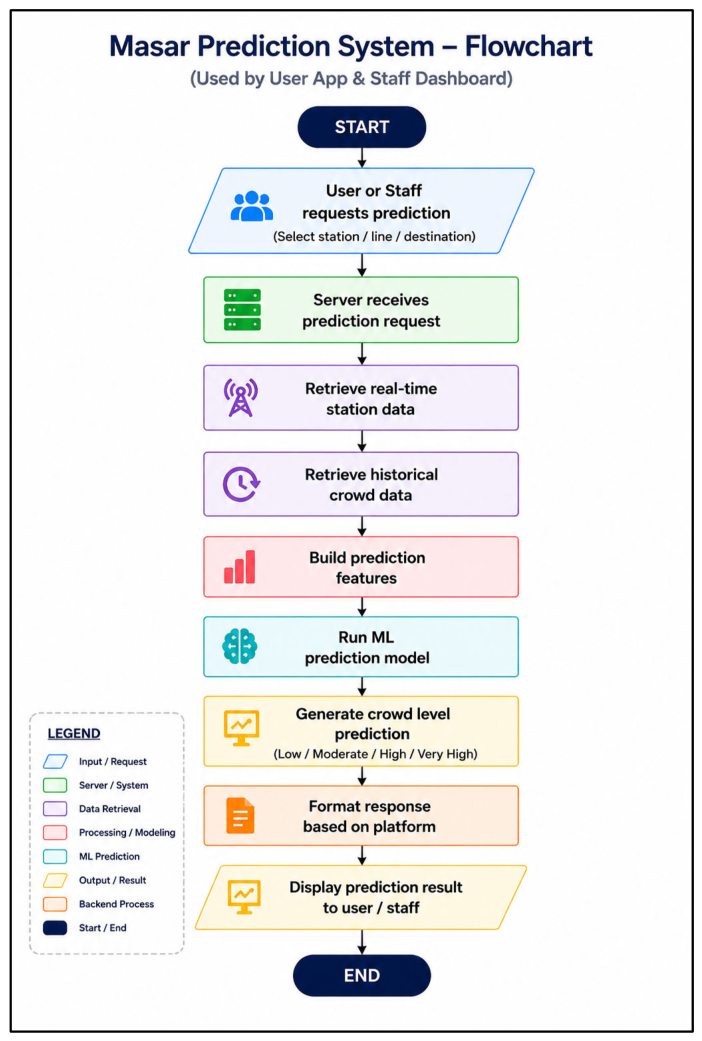
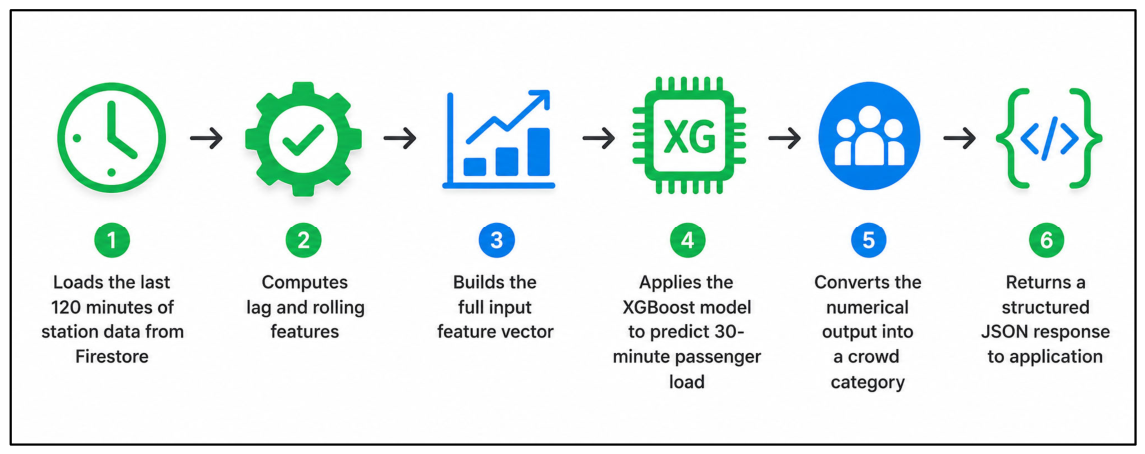
At inference time, the trained model is served through a real-time prediction pipeline accessible by both the passenger mobile application and the staff dashboard.
Figure 3 summarizes this end-to-end workflow, from the initial prediction request through real-time and historical data retrieval, feature construction, model inference, and crowd-level classification, to the final display of results.
3.7. System Implementation
3.7.1. Technology Stack
The passenger mobile application was developed using Flutter (v3.35.5) for cross-platform Android deployment. The staff web dashboard was implemented in React with TypeScript (v7.0.2), styled using Tailwind CSS (v3.x). The backend REST API was built with FastAPI (v0.116.1, Python 3.12.4) and deployed on Render. Firebase Firestore served as the real-time NoSQL database; Firebase Authentication(v 6.1.1) managed access control for both user groups; and Firebase Storage (v13.0.3) handled uploaded media. The Google Maps Platform (google_maps_flutter v2.13.1 for mobile and Maps JavaScript API v3 for web) supported interactive metro network visualization, geolocation, and route computation. Machine learning models were trained using scikit-learn (v1.5.2) and XGBoost (v2.1.2) in Python, and the final XGBoost model was serialized as a .pkl file for low-latency inference within the FastAPI backend.
3.7.2. Backend Services
The backend was implemented using FastAPI as a scalable service-oriented architecture that provides low-latency communication between the passenger mobile application and the staff dashboard. It comprises two complementary services: a real-time crowd estimation service and a short-term congestion forecasting service. The real-time estimation service continuously computes station crowd conditions based on station capacity, temporal demand patterns, and contextual event modifiers. The forecasting service analyses recent station observations, derives the required predictive features, and applies the trained XGBoost model to generate 30 min-ahead congestion predictions, as illustrated in
Figure 4.
To maintain continuous real-time data availability, the system periodically updates station crowd information while retaining a rolling history window to support short-term forecasting. This architecture separates continuous background data synchronization from user-requested prediction services, improving system scalability while ensuring that sufficient historical context is retained for accurate short-term congestion forecasting.
3.7.3. Passenger Mobile Application
The mobile application provides passengers with the following capabilities:
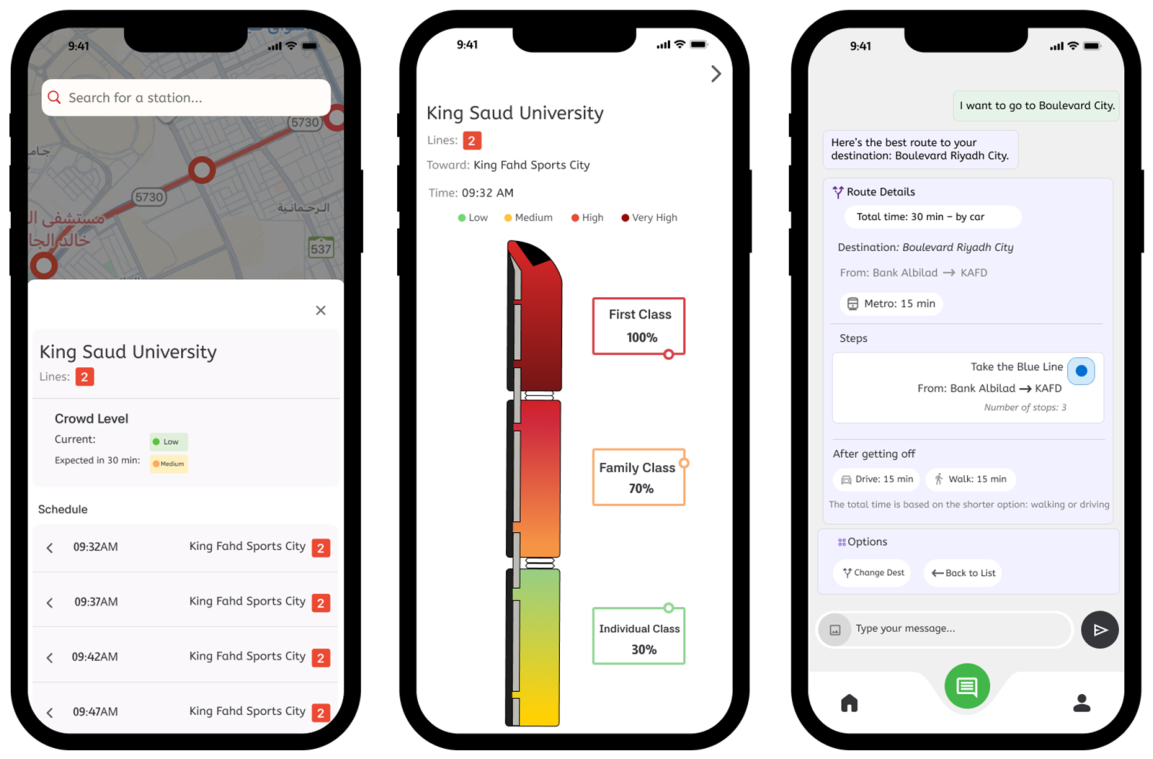
Real-time and 30 min-ahead crowd monitoring: Passengers select a station from an interactive metro map to access current and predicted crowd levels, displayed as color-coded indicators corresponding to the four congestion categories.
Train carriage visualization: Passengers can view real-time occupancy levels for each carriage of upcoming trains, enabling more informed boarding decisions and supporting better passenger distribution.
Trip schedule: The application provides upcoming departures within a 30 min window, including line color, destination, and estimated arrival time.
Figure 5 shows the key passenger-facing screens of the Masar application, including the interactive metro map, train carriage congestion visualization, and the Arabic chatbot interface.
3.7.4. AI-Powered Arabic Chatbot
The chatbot serves as the primary passenger service layer, implemented as a state-based conversational system that maintains the conversational context and collected user inputs throughout multi-step interactions. Four service flows are supported.
- (1)
General metro inquiries: The chatbot performs semantic FAQ matching against a structured knowledge base, handling Arabic dialect variation, spelling irregularities, and informal phrasing to return the most relevant answer or a structured fallback response.
- (2)
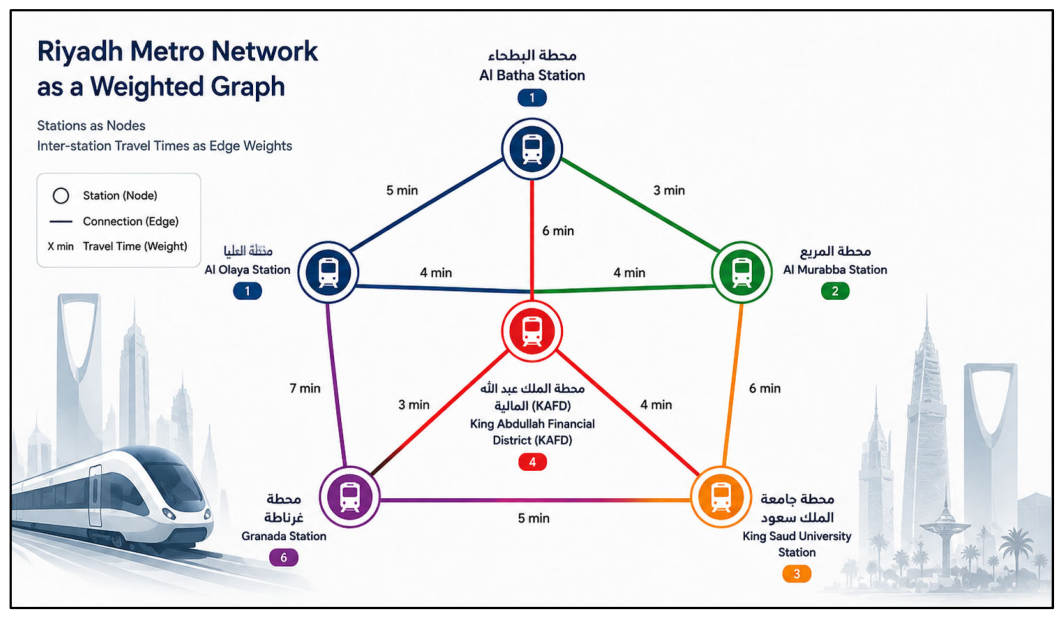
Route planning: The user specifies a destination in natural language, and the system normalizes the input before resolving it through external mapping services. The Riyadh Metro network is modelled as a weighted directed graph, where stations are represented as nodes and inter-station travel times as edge weights, as illustrated in
Figure 6. Dijkstra’s algorithm is applied to compute the shortest path between the passenger’s nearest station and the destination [
38]. Walking and driving access times are incorporated into the total journey estimate, and the resulting route is presented as step-by-step instructions including transfers, departure stations, and estimated travel time.
- (3)
Trip schedule retrieval: The system resolves user-specified station names through alias-based normalization and retrieves upcoming departures within a 30 min window, returning line color, destination, and estimated arrival time.
- (4)
Lost and Found reporting and tracking: The chatbot guides passengers through a structured multi-step reporting workflow, collecting item type, color, description, loss location, date and time, contact details, and an optional image. Upon submission, a unique report identifier is generated, and passengers can track the report through the stages of Registered, Match Found, Awaiting Collection, and Collected.
3.7.5. Staff Web Dashboard
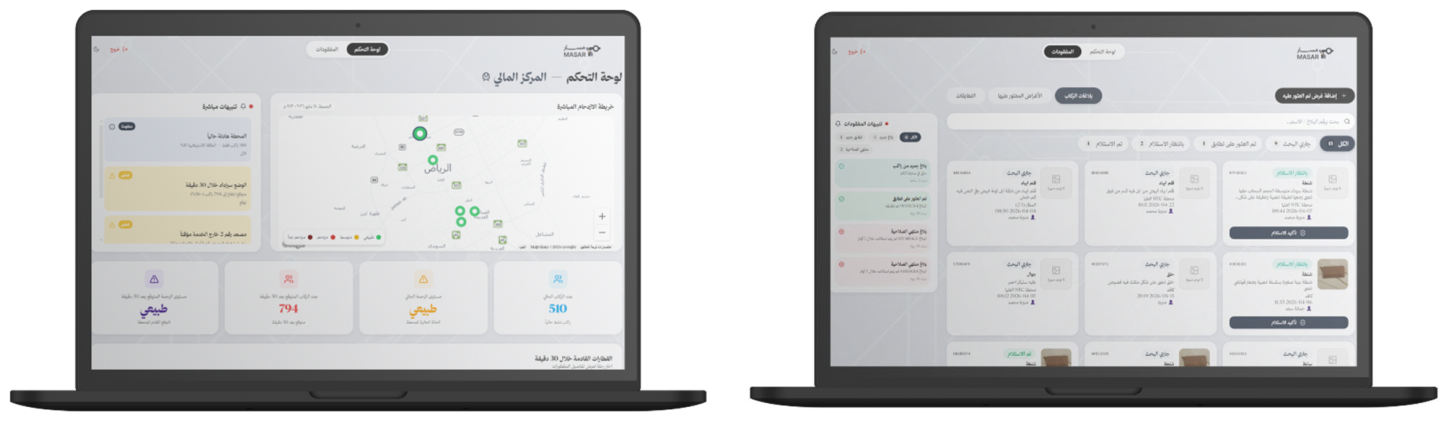
The web dashboard provides
real-time crowd monitoring, historical congestion analytics, and
Lost and Found management to support operational decision-making. Staff can register found items with image uploads, review passenger-submitted lost-item reports, and process AI-assisted matching results. An
OTP-based verification mechanism secures the item handover process by confirming the recipient’s identity before collection.
Figure 7 illustrates the two primary views of the staff web dashboard, including the Lost and Found management interface and the real-time crowd monitoring view.
3.7.6. AI-Based Lost and Found Matching Engine
The matching engine computes a weighted confidence score for each lost–found item pair using five factors: textual description similarity, image similarity, item type, brand, and location-time proximity. To accommodate incomplete reports, factor weights are dynamically redistributed when information is missing, as summarized in
Table 7. Natural language processing is used to perform semantic text comparison, enabling the system to handle Arabic dialects and mixed Arabic–English terminology, while vision-based AI techniques support image similarity comparison. Candidate pairs below a minimum similarity threshold are automatically excluded to reduce false positives.
3.7.7. Privacy, Ethics, and Data Governance
Since the current study relies on synthetic passenger-flow data, no real Riyadh Metro operational records or personally identifiable passenger data were used during model development or evaluation. For application users, only the information necessary to provide the requested services—such as account credentials and Lost & Found reports—is collected, and user consent is obtained during account registration and service use. Access to operational functions is protected through role-based authentication, ensuring that passenger and staff privileges remain separated. Data transmitted between system components are secured using authenticated communication mechanisms, while uploaded media and service records are stored only for the period required to support application functionality and would be managed according to the metro operator’s data retention policies in a production deployment.
The conversational assistant and AI-assisted Lost & Found functions rely on external AI services for natural language understanding and image analysis. Although the current prototype processes only synthetic or user-submitted information within a controlled research environment, operational deployment should adopt data minimization principles, avoid transmitting unnecessary personal information to external AI providers where possible, and incorporate human review for AI-assisted decisions before operational actions are finalized. These measures support responsible AI use while strengthening privacy, security, and governance in future real-world deployments.
3.8. Evaluation Methodology
Masar was evaluated with a protocol combining three complementary strands. First, the synthetic data pipeline was validated through statistical, logical, and structural checks, including headway-range validation, capacity checks, event-flag consistency, and visual heatmap inspection. Second, model performance was evaluated using standard regression metrics. Third, the AI-assisted lost-and-found engine and chatbot were evaluated through predefined scenarios.
5. Discussion
5.1. Interpretation of Findings
The evaluation findings collectively demonstrate the technical feasibility and operational potential of the Masar predictive digital twin prototype framework. Several key observations merit discussion.
A central finding of this study is that integrating short-term congestion forecasting within a digital twin environment provides substantially greater operational value than deploying predictive models in isolation. Rather than presenting congestion predictions as standalone numerical outputs, Masar incorporates forecasts into interactive station-level visualizations, carriage occupancy indicators, and real-time operator dashboards. This integration enables proactive crowd management by providing both passengers and staff with actionable, forward-looking awareness of station conditions—a capability absent from current Riyadh Metro management systems, which rely on real-time monitoring without predictive functionality. These findings are consistent with prior digital twin research demonstrating the operational benefits of coupling predictive analytics with virtual system representations for intelligent transportation management [
11,
12,
19].
The forecasting evaluation further confirmed that tree-based ensemble models are well-suited for short-term metro passenger-flow prediction on structured tabular datasets. While Random Forest achieved marginally higher general classification accuracy, XGBoost’s superior performance on safety-critical operational metrics makes it the more appropriate choice for a proactive crowd management system. This finding aligns with prior work demonstrating the effectiveness of gradient-boosted models for metro demand forecasting under complex demand patterns [
21].
Beyond congestion forecasting, the intelligent service components extend the platform into practical passenger assistance and operational support. The AI-based Lost and Found module demonstrated reliable multi-factor matching across diverse reporting conditions, while the Arabic chatbot simplified passenger access to core metro services including route planning—powered by Dijkstra’s algorithm on the metro network graph—timetable enquiries, and item reporting [
38]. Together, these components transform Masar from a monitoring tool into an integrated smart metro service platform.
5.2. Sustainability and Resilience Implications
Masar contributes to sustainability in several ways. First, predictive congestion information can improve the attractiveness and reliability of public transportation by helping passengers avoid crowded stations or select better travel times. Increased confidence in public transport can support modal shift away from private vehicles, which is aligned with sustainable mobility objectives. Second, operational dashboards can help metro staff detect crowding patterns earlier and respond more efficiently, improving service resilience during peak periods or major urban events. Third, the Arabic chatbot supports inclusiveness by offering localized passenger assistance in the language most relevant to the deployment context. The prototype also supports sustainability through digital transformation. Instead of treating passenger support, lost-and-found, and operational monitoring as separate workflows, Masar integrates them into a single data-driven service environment. This integration is consistent with the aims of AI- and data-driven urban operations, where multiple services are connected to improve city performance, responsiveness, and user experience. The system therefore aligns closely with research on sustainable and resilient smart cities, especially in the domain of data-driven public transportation. In addition, these contributions are particularly relevant given Riyadh’s projected population growth to 15–20 million by 2030 [
3] and the additional demand pressure expected from Expo 2030 and the 2034 FIFA World Cup [
4].
From an operational sustainability perspective, the proposed Masar framework has the potential to reduce platform crowding through earlier congestion detection and proactive passenger guidance, supporting a more balanced distribution of passengers across stations and carriages during peak periods. Earlier and more targeted alerts may also enable faster operational responses to emerging congestion, thereby facilitating earlier operational intervention. The AI-assisted Lost and Found workflow may additionally reduce staff workload and decrease the number of unresolved lost-property cases by streamlining the matching process. Although these indicators were not quantitatively measured in the current prototype, they represent meaningful operational sustainability metrics for future field evaluation.
5.3. Limitations
The main limitation of this study is the use of synthetic rather than real Riyadh Metro operational data. Although the simulation pipeline was strengthened through a dual-Gaussian demand formulation, documented assumptions, trip and carriage-level logic, and validation checks, it cannot fully capture unobserved real-world behaviors such as transfer flows, disruptions, station-specific entrance patterns, passenger heterogeneity, or unexpected incidents. Therefore, the reported forecasting performance should be interpreted as evidence of technical feasibility under a controlled synthetic-data environment, not as final operational accuracy for deployment. A second limitation is the scope of the prototype. Masar currently covers a limited set of metro stations rather than the full Riyadh Metro network. It supports Android and Arabic interfaces only, which limits accessibility for iOS users and non-Arabic-speaking passengers. Finally, the chatbot and lost-and-found matching workflows require larger and more diverse test datasets to evaluate robustness under open-ended real-world reports. Despite these limitations, the architecture is deliberately modular and cloud-based, and its layered design separates data generation from modeling, services, and presentation. This makes the approach transferable: another transit authority could replace the synthetic generator with an operational data feed, retrain the same feature pipeline and models, and reuse the service and presentation layers with localized content. The prototype thus offers a reusable template for predictive, passenger-centered crowd management in other rapidly growing networks, particularly those preparing for large events or rapid ridership growth.
6. Conclusions and Future Work
This paper presented Masar, an AI-powered digital twin prototype designed to enhance Riyadh Metro services through predictive congestion monitoring, real-time visualization, Arabic passenger assistance, and AI-supported lost-and-found workflows. A major methodological contribution is the reproducible synthetic data generation and preparation pipeline, which uses a dual-Gaussian demand model, contextual multipliers, trip and stop-time generation, carriage-level passenger-flow simulation, and validation checks to support early-stage digital-twin evaluation when real operational data are unavailable.
The results confirm the technical feasibility of the proposed architecture within a synthetic evaluation environment. XGBoost achieved the strongest overall forecasting performance in the simulated evaluation, with RMSE = 363.42 and R2 = 0.9229; because training and testing were conducted on simulator-generated data, these figures reflect internal consistency rather than predictive accuracy on real passenger flows. The synthetic data validation further confirmed that generated passenger-flow patterns preserved expected morning and evening peaks, capacity constraints, and event-driven demand variation. Together, these results provide proof-of-concept evidence for coupling early-stage Digital Twin prototype concepts with interpretable machine learning to support proactive crowd management—an approach that warrants validation against real Riyadh Metro operational data before deployment.
Future work will prioritize integration with real Riyadh Metro operational data to enable continuous model validation and improve prediction accuracy under real-world operating conditions. As a minimum requirement before operational deployment, field validation should include Automated Fare Collection (AFC) records, platform passenger counters, CCTV-based or manually collected passenger counts, train occupancy sensor data, and operational incident logs. Together, these complementary data sources will enable comprehensive validation of the forecasting models, chatbot workflows, and the AI-assisted Lost & Found system under genuine operating conditions. Successful validation across these independent datasets will provide the evidence required before the system can be considered ready for real-world deployment. Expanding the platform to cover the full six-line metro network, incorporating spatiotemporal deep learning architectures such as Graph Neural Networks, extending the mobile application to iOS, and improving dashboard responsiveness represent the primary directions for future development. These enhancements will strengthen the scalability and deployment readiness of the Masar framework, supporting the long-term adoption of digital twin technology for intelligent and sustainable metro management.