Article

Regional Development Assessment at Grid Scale: A Multisource Remote Sensing Approach in Chongqing, China

1
School of Remote Sensing and Geomatics Engineering, Nanjing University of Information Science and Technology, Nanjing 210044, China
2
Technology Innovation Center for Integration Applications in Remote Sensing and Navigation, Ministry of Natural Resources, Nanjing 210044, China
3
Jiangsu Engineering Center for Collaborative Navigation/Positioning and Smart Applications, Nanjing 210044, China
*
Author to whom correspondence should be addressed.
Sustainability 2026, 18(15), 7671; https://doi.org/10.3390/su18157671
Submission received: 11 July 2026 / Revised: 25 July 2026 / Accepted: 27 July 2026 / Published: 28 July 2026
(This article belongs to the Section Development Goals towards Sustainability)

Abstract

Regional development disparities remain a persistent global challenge, yet existing assessment approaches often face a trade-off between spatial detail and temporal coverage. Conventional socioeconomic statistics provide relatively reliable information but are typically limited by coarse spatial representation and low update frequency, whereas high-resolution remote sensing-based studies often focus on individual time points, making it difficult to capture the temporal evolution of regional development. Remote sensing observations provide valuable opportunities for regional development assessment by offering extensive spatial coverage and repeated observations over time. To address this gap, this study proposes a multisource remote sensing framework for characterizing the spatiotemporal dynamics of regional development in Chongqing Municipality across four temporal nodes (2014, 2016, 2018, and 2020). We first construct a county-level Development Intensity Index (DII) using socioeconomic indicators derived from statistical data. Subsequently, we integrate nighttime light, DEM, NDVI, and POI data to generate a 500 m gridded Comprehensive Spatial Development Index (CSDI), which captures spatial heterogeneity at a fine spatial scale. The CSDI exhibits strong correspondence with the DII, and its spatial validity is further corroborated through visual interpretation of Google Earth imagery. Results indicate that areas with higher development levels are predominantly concentrated in Chongqing’s central urban core, while less-developed counties are concentrated in the northeastern and southeastern peripheries. Although a general upward trend in development is observed across the study period, notable spatial disparities persist. Overall, the proposed CSDI-based framework offers an effective and replicable approach for gridded regional development assessment, with implications for targeted regional planning and differentiated policy design.

1. Introduction

To end poverty in all its forms everywhere is Goal 1 of the United Nations Sustainable Development Goals (SDGs) [1]. As the world’s largest developing country, China has achieved remarkable economic growth over the past several decades [2]. The Report to the National Congress of the Communist Party of China identifies reducing relative poverty as a national development priority [3]. Since persistent poverty is closely associated with uneven regional development, achieving this goal requires not only economic growth but also balanced regional development, as persistent spatial disparities in infrastructure, public services, and development opportunities remain major barriers to inclusive and sustainable development. Therefore, scientifically identifying and accurately assessing regional development are essential for formulating more targeted and effective policies for reducing relative poverty.
Conventional assessments of regional development have typically relied on single socioeconomic indicators, such as gross domestic product (GDP) and household income, to evaluate regional development [4]. For decades, conventional regional development evaluation has primarily depended on statistical yearbooks and household survey data to obtain socioeconomic information [5]. Although these data can accurately reflect socioeconomic conditions, they generally suffer from high acquisition costs, long update cycles, and limited spatial continuity, making them inadequate for the increasingly demanding requirements of fine-scale and dynamic monitoring. In recent years, advances in remote sensing technology have provided new opportunities for assessing regional development. Compared with conventional statistical survey methods, remote sensing data offer several advantages, including extensive spatial coverage, high update frequency, and low acquisition cost [6]. Among these data sources, NTL data have been widely used for regional development assessment, economic estimation, and regional development studies because they effectively reflect the intensity of human activity and the level of economic development.
In China, Yong et al. employed NTL to investigate multidimensional relative poverty in impoverished areas of southwestern China and found a strong relationship between nighttime light intensity and the rural development index [7]. Li et al. integrated high-resolution NTL data with spatial big data to develop socioeconomic indicators for impoverished regions, enabling the spatial identification and assessment of relative poverty [8]. Internationally, Shao et al. estimated poverty levels in Mozambique using nighttime light imagery and revealed substantial disparities across the country [9]. Similarly, Dorji et al. reported that VIIRS nighttime light data are strongly correlated with poverty rates and income inequality indicators, demonstrating their potential for poverty monitoring and identification in developing countries [10]. Collectively, these studies demonstrate that NTL data provide an effective proxy for socioeconomic conditions and offer considerable potential for regional development assessment [11].
However, relying solely on NTL data is insufficient to comprehensively characterize the multidimensional nature of regional development [12]. With the continuous evolution of development concepts, traditional income-based poverty assessment is no longer adequate for supporting sustainable development. Consequently, research has increasingly shifted from measuring poverty alone to comprehensively assessing regional development, incorporating multiple dimensions such as economic conditions, education, healthcare, ecological environment, and social welfare [13]. Effectively integrating multisource remote sensing data and geospatial information to achieve a comprehensive characterization and spatial representation of regional development remains a key challenge in current research.
Recent studies have begun to explore the use of multidimensional datasets to characterize regional development. Zhang et al. employed a counting-based approach, using 15 poverty-alleviation indicators, to assess poverty-reduction performance across 10 cities in Shaanxi Province [14]. Wang et al. investigated methods for characterizing localized regional development in counties across China using multisource remote sensing data [15]. Hu et al. integrated high-resolution imagery, POI data, OpenStreetMap data, and digital surface model data to evaluate village-level regional development in Yunyang County, Hubei Province [16]. Li et al. developed a regional development index by integrating multisource geospatial data, enabling the assessment of development status and relative poverty in the Wuling Mountain area at a spatial resolution of 10 m [17].
Although recent studies have improved the multidimensional characterization of regional development, they remain largely static. Regional development is inherently a long-term and dynamic process, with its overall development level continuously evolving in response to policy interventions, economic restructuring, and environmental changes. However, existing studies based on NTL data have largely been limited to spatial analyses at a single time point, lacking a systematic investigation of the spatiotemporal evolution of regional development. Time-series analysis can effectively reveal the dynamic trajectories and stage-specific characteristics of regional development, identify the changing trends of development hotspots and lagging areas, and provide irreplaceable support for evaluating the effectiveness of poverty alleviation policies and optimizing resource allocation strategies. Therefore, conducting a comprehensive characterization of regional development across multiple time periods is crucial.
To address this gap, this study poses three research questions:
RQ1: How can multisource remote sensing data (NTL, NDVI, POI, DEM, etc.) be integrated to construct a comprehensive index (CSDI) that characterizes regional development across multiple dimensions, and can this index effectively substitute or supplement traditional statistical indicators?
RQ2: What is the spatiotemporal evolution pattern of spatial differentiation in regional development across Chongqing from 2014 to 2020? Do development hotspots and lagging areas experience significant shifts?
RQ3: Does the regional development dynamics identified by the CSDI align with the DII derived from statistical yearbooks? Can the CSDI provide reliable and more spatially detailed information for regional development monitoring?
Accordingly, we developed a CSDI for Chongqing Municipality by integrating NTL, NDVI, POI data, DEM, and other multisource remote sensing data and geospatial datasets at four time points (2014, 2016, 2018, and 2020). Meanwhile, a DII was constructed using statistical yearbook data from the corresponding years to validate the reliability and effectiveness of the CSDI. Based on these indices, the spatial differentiation of regional development in Chongqing Municipality and its spatiotemporal evolution from 2014 to 2020 were further analyzed to provide a scientific basis and data support for evaluating the effectiveness of poverty alleviation strategies, facilitating targeted policy interventions, and promoting sustainable regional development.

2. Study Area and Data

2.1. Study Area

Chongqing Municipality is the only municipality directly administered by the central government in central and western China and serves as a strategic hub for China’s Western Development Strategy [18]. The municipality covers a total area of approximately 82,400 km2. By the end of 2022, it had a permanent resident population of 32.1334 million, with an urbanization rate of 70.92%, making it one of the most populous municipalities directly administered by the central government in China.
Chongqing Municipality was selected as a representative case to investigate the feasibility of assessing China’s regional transformation of regional development, based on the following considerations. Since 2000, Chongqing has maintained rapid economic growth, with its gross domestic product (GDP) showing a sustained upward trend. By 2014, the municipality’s GDP had reached CNY 1426.54 billion. Despite continuous improvements in overall development, substantial regional disparities persisted. During the study period, Chongqing still contained 14 nationally designated poverty-stricken counties, primarily located in the northeastern and southeastern regions, highlighting the coexistence of rapid economic growth and uneven regional development.
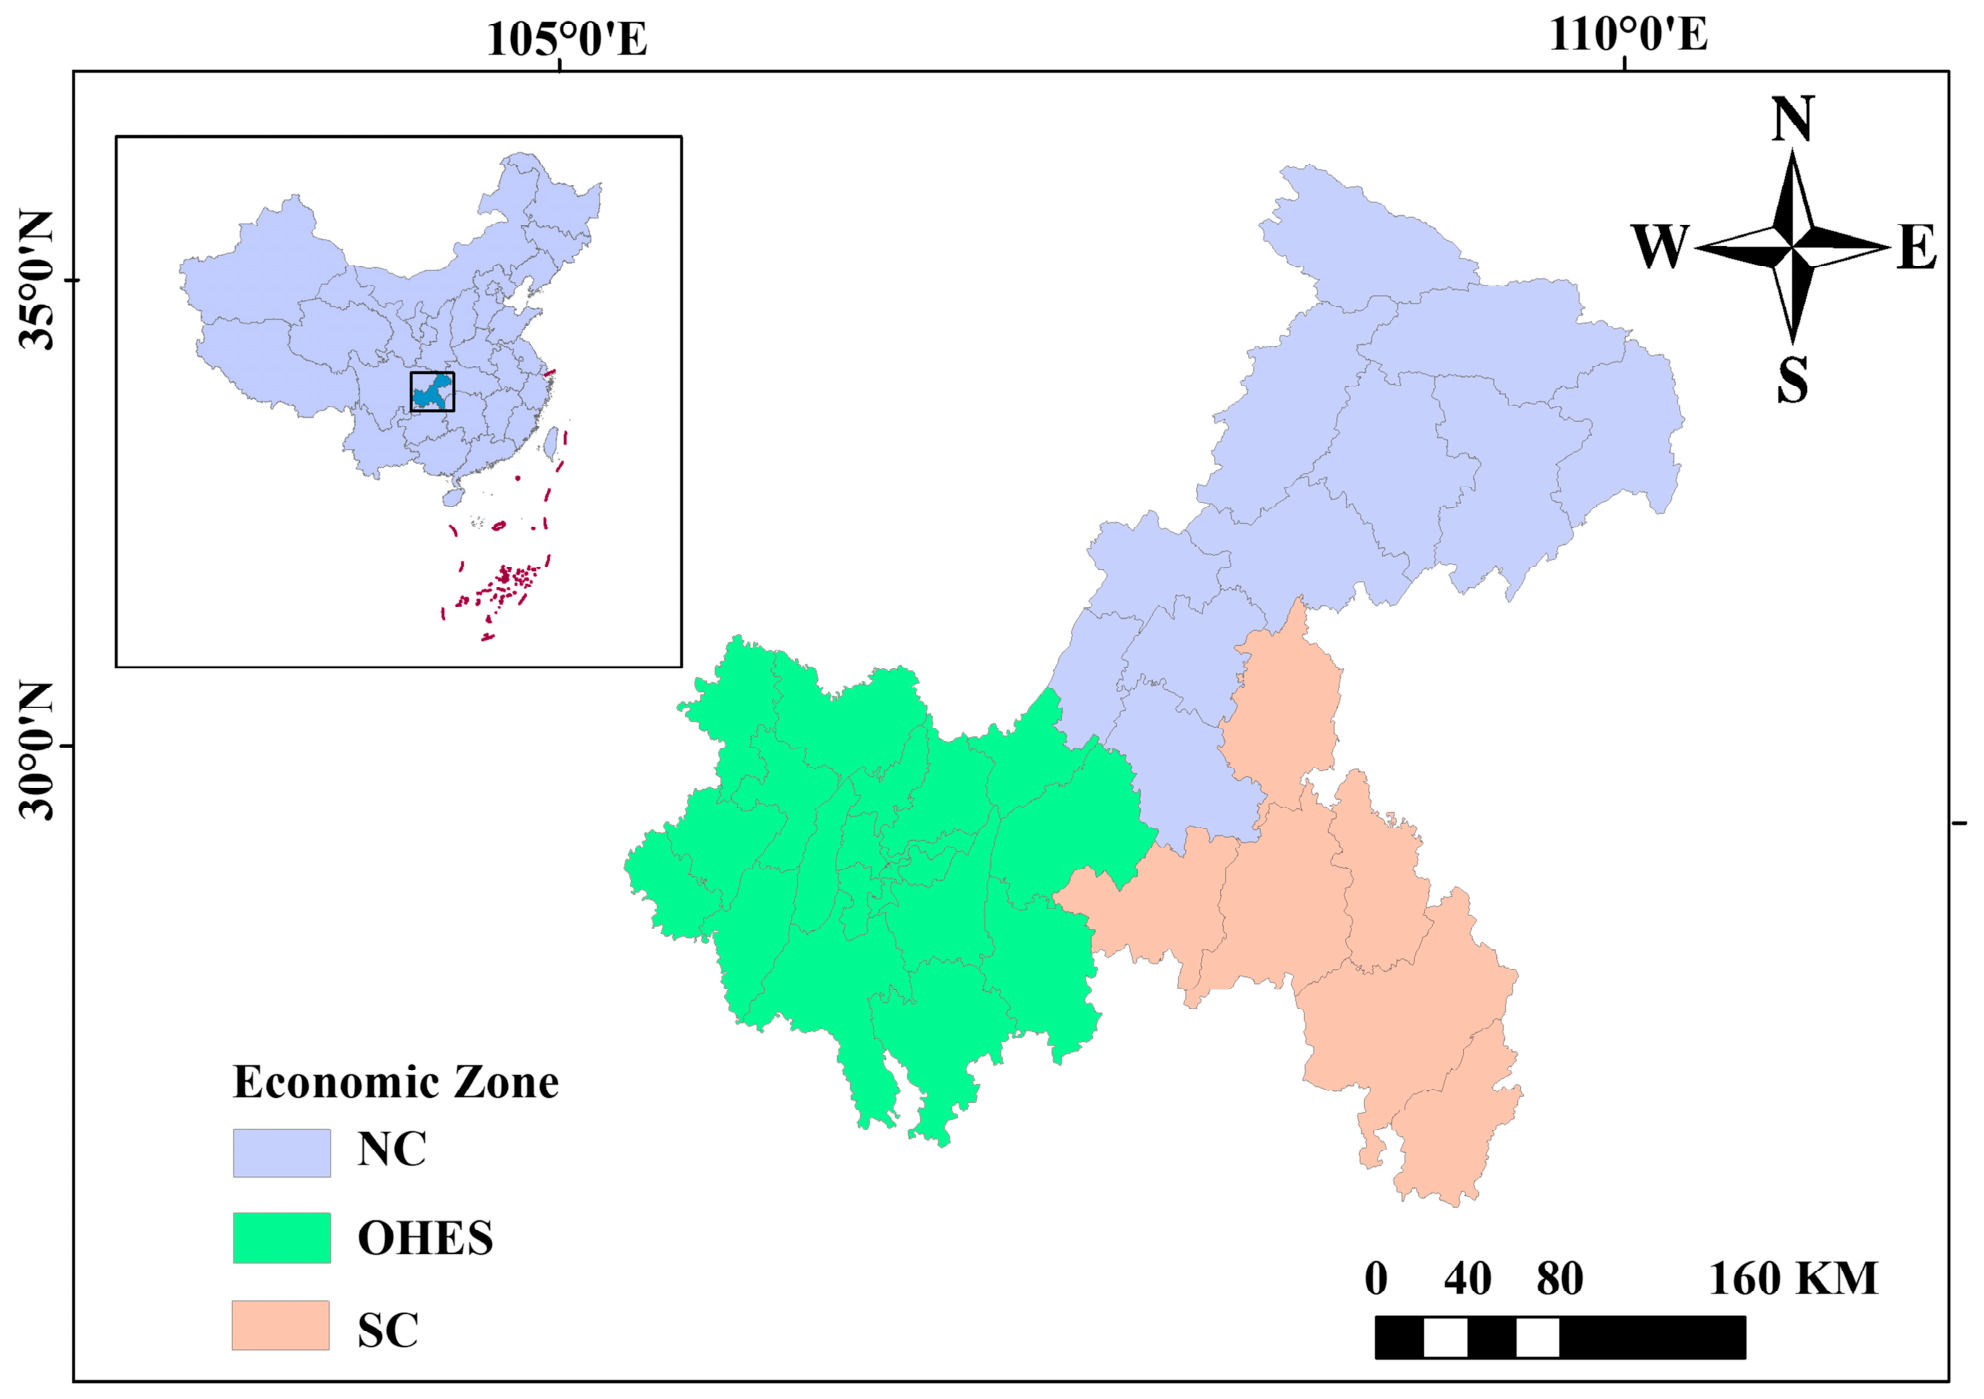
Based on economic development status and spatial structural characteristics, Chongqing Municipality was divided into three representative economic regions, as shown in Figure 1: (1) the One Hour Economic Sphere of Chongqing (OHES), located in the southwestern region, which is characterized by a relatively high development level, a strong economic foundation, and abundant human resources; (2) Southeast of Chongqing (SC), a relatively less-developed region whose economic growth is largely driven by the spillover effects of the urban core; and (3) Northeast of Chongqing (NC), a heavy industrial region located farther from the urban core, with a comparatively lower development status [19]. In summary, Chongqing Municipality exhibits pronounced spatial differentiation in regional development, a pattern that is also representative of many other regions in China [20].
Therefore, from the perspective of the regional development structure, the development trajectory of Chongqing Municipality broadly represents that of many comparable regions in China, making it a valuable case for characterizing China’s multidimensional regional development disparities. According to official announcements from the Chinese government, Chongqing Municipality eliminated absolute poverty in 2020, becoming the first municipality directly administered by the central government in China to complete the national poverty alleviation campaign [21]. Since then, the strategic focus has shifted toward promoting regional development. However, comprehensive development is not a short-term objective but a long-term and continuous process. Fine-scale and multi-temporal monitoring of regional development is essential.

2.2. Data Description

As presented in Table 1, the datasets used in this study include the following. Unless otherwise specified, all datasets were projected to the Albers geographic coordinate system and resampled to a common spatial resolution of 500 m to ensure spatial consistency.
(1) NPP-VIIRS nighttime light data: NTL imagery reflects the intensity of nighttime surface activities and population distribution, serving as an effective proxy for human activity and regional economic prosperity. We employed the annual composite NPP-VIIRS nighttime light data (Version 2 VNL) jointly developed by the National Aeronautics and Space Administration (NASA) and the National Oceanic and Atmospheric Administration (NOAA). The Version 2 annual composites were generated by averaging monthly cloud-free radiance observations over each year. Compared with most existing NTL datasets, Version 2 VNL provides higher spatial resolution, broader coverage, and greater sensitivity [22]. (2) POI data: They contain abundant information on human activities, including restaurants, tourist attractions, public facilities, entertainment venues, commercial areas, and residential communities. The POI data were primarily obtained from online mapping service providers, including Amap and Baidu Maps [23]. For POI data, Amap and Baidu Maps POI datasets were collected for the corresponding study years (2014, 2016, 2018, and 2020). The datasets were matched with their respective reference years to maintain temporal consistency. Since POI data from different platforms may contain duplicate records, duplicate removal was conducted before data integration. Specifically, POIs with identical names and geographic coordinates were considered duplicate records, and only one record was retained. For records with minor spatial deviations, spatial proximity and attribute consistency were considered to identify potential duplicates. The POI dataset covers multiple functional categories. For the POI density indicator, we did not differentiate these categories; instead, all valid POI records were integrated into a unified point dataset to characterize the overall intensity of human activities. The same processing procedure was applied consistently across all study years to ensure interannual comparability. (3) Statistical yearbook data: This includes socioeconomic indicators related to the economy, healthcare, education, and social security. (4) DEM data: They provide high-precision and high-resolution topographic elevation information for characterizing surface morphology and supporting the analysis of geographical phenomena. The DEM data were obtained from the SRTM Data website [24]. (5) NDVI data, calculated from the near-infrared and visible spectral bands, were used to quantify vegetation cover and monitor vegetation growth over large areas. The NDVI data were derived from the MOD13A1 product of the MODIS dataset and downloaded from NASA Earthdata Search [25]. The original temporal resolution of this product is 16 days. To facilitate vegetation dynamic analysis at a monthly scale, this study employed the Maximum Value Composite (MVC) method to aggregate the 16-day data within each month into monthly values, i.e., taking the maximum value among all available pixel values for that month as the monthly NDVI. This approach effectively reduces interference from cloud cover, atmospheric scattering, and viewing angle variations, and has been widely applied in long-term vegetation remote sensing monitoring. (6) Administrative boundary vector data were obtained from the Alibaba Cloud DataV platform. (7) Landcover and road network data were derived from the MODIS MCD12Q1 V6.1 product, providing annual global land cover maps at 500 m resolution. We used the IGBP classification scheme for 2014, 2016, 2018, and 2020, obtained from the NASA LP DAAC [26]. Road network data were downloaded from OpenStreetMap for the corresponding years [27].
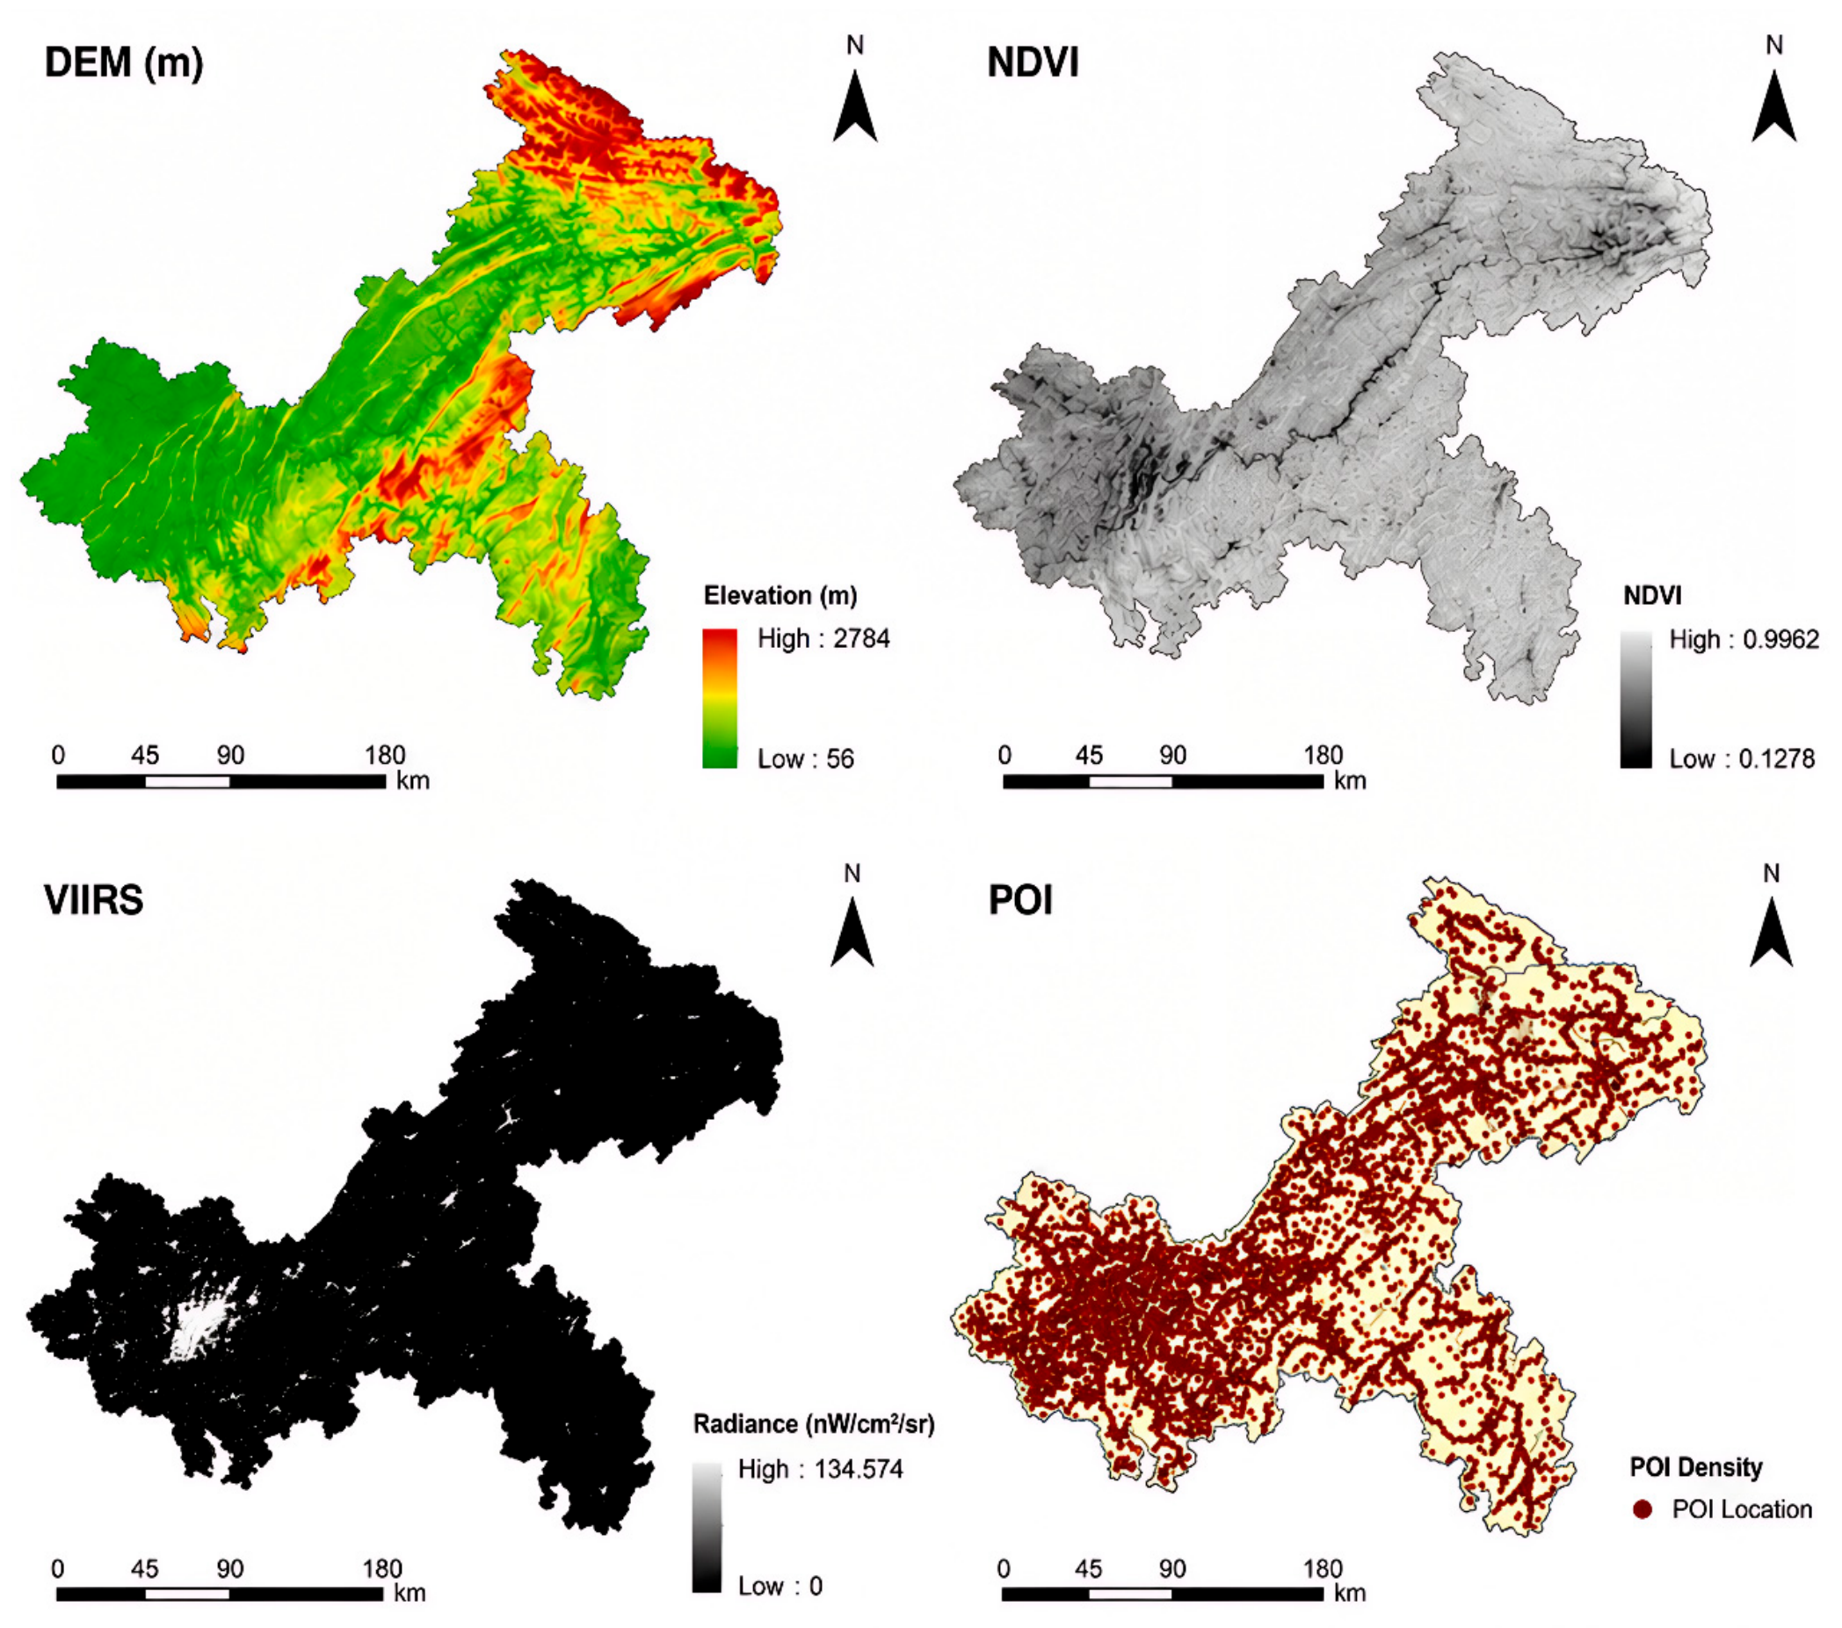
As shown in Figure 2, the four types of data sources exhibit consistent spatial distribution patterns. In particular, the OHES exhibits the highest densities of NTL and POI data. At the same time, NDVI and DEM values are relatively low, indicating a high level of urbanization in this region.

3. Methodology

3.1. Construction of the DII

We developed a DII to comprehensively evaluate regional development by integrating indicators across the economy, society, environment, and culture, providing an important reference for regional development assessment. Building on previous studies and adhering to principles of research relevance, scientific indicator selection, and data comparability, we selected 11 indicators covering economic development, education, healthcare, and environmental conditions to construct the DII. We then used the entropy weight method to determine the weight of each indicator. This method first normalizes the data and then calculates the information entropy of each indicator. By fully exploiting information differences among indicators, it minimizes subjectivity and arbitrariness while ensuring objective, scientifically robust weighting results.
The entropy weight method is a multi-criteria decision-making approach that determines objective indicator weights by considering the relationships among indicators and the degree of variation in their values. Lower information entropy indicates greater variability in an indicator, implying that it provides more information and, consequently, should be assigned a higher weight [28].
First, the raw data were normalized to eliminate differences in units and magnitudes across indicators. Positive and negative indicators were normalized using Equations (1) and (2), respectively:
X i j k = X i j k X i j k ( M I N ) X i j k M A X X i j k ( M I N )
X i j k = X i j k ( M A X ) X i j k X i j k ( M A X ) X i j k ( M I N )
(i = 1, ……, 4; j = 1, ……, m; k = 1, ……, n)
where X i j k represents the original value of the k-th indicator for the j-th county in the i-th year, and X i j k denotes the corresponding normalized value.
Subsequently, the information entropy of each indicator was calculated based on its proportion, and the indicator difference coefficient was then used to determine each indicator’s weight. Based on the derived indicator weights and normalized values, the DII was established. The calculation formula is as follows:
P i j k = X i j k i = 1 4 j = 1 m X i j k
E k = i = 1 4 j = 1 m P i j k L N ( P i j k ) L N ( 4 m )
W k = 1 E k n k = 1 n E k
DII = K = 1 n W k X i j k
where P i j k represents the proportion of the j-th county under the k-th indicator in the i-th year; E k denotes the information entropy of the k-th indicator; and W k represents the weight of the k-th indicator.
In addition, we compared county-level DII rankings with the corresponding GDP rankings for each year. This comparison was conducted because GDP is one of the most commonly used indicators for evaluating economic conditions and development trends at national and regional scales. Specifically, the difference between the GDP ranking and the corresponding DII ranking was calculated as a positive or negative value for comparative analysis. As an important indicator of regional economic development, GDP can partially reflect the overall status of regional development. Comparing the ranking differences between DII and GDP provides a preliminary assessment of the capability of DII in characterizing the development level of regions.

3.2. Construction of the CSDI

Previous studies have shown that regional development is a complex, multidimensional concept. Given the unique natural and geographic conditions of Chongqing Municipality, we constructed a 500 m spatial-resolution CSDI raster map using slope, Human Settlement Index (HSI), POI density, and POI cost distance to assess the region’s development status.

3.2.1. Data Preprocessing

Before generating the above datasets, a series of preprocessing procedures should be performed. First, slope represents the inclination degree of the Earth’s surface relative to the horizontal plane and plays an important role in influencing human activities and economic development. Given the complex terrain and extensive mountainous areas of Chongqing Municipality, slope can be an important factor in evaluating regional development. We derived slope data from a 30 m DEM dataset. Second, POI density refers to the ratio between the number of POI locations and the area within the study region. In contrast, POI cost distance rises with travel distance, reflecting transportation and fuel costs. Together, POI density and cost distance offer valuable proxies for regional accessibility and economic conditions. Generally, high POI density and low cost distance correspond to higher levels of human development. Therefore, based on POI data, we applied density and cost distance analyses to generate POI density and cost distance datasets, respectively. For POI density estimation, kernel density estimation (KDE) was applied to the integrated POI point dataset. A bandwidth of 1000 m was selected to represent the neighborhood-scale influence range of surrounding facilities and human activities. The resulting density surface was converted into a raster dataset with a spatial resolution of 500 m. For POI cost-distance analysis, we did not use all POIs as origins. Instead, we leveraged the hierarchical category system to extract only three well-being-related POI categories—markets, schools, and hospitals—which served as the origin points to measure accessibility to essential public services. The cost distance was calculated as the travel cost from each pixel to the nearest POI among these three categories. Crucially, the resistance surface was not uniform. We constructed a time-cost map by integrating the land cover map and road network data, where different land cover types and road classes were assigned differentiated movement costs. The resulting accessibility distance surface was finally converted into a 500 m raster dataset.
Third, the HSI can be used to measure the intensity of human activities in urban and urbanized areas and is closely associated with regional development. NTL data and NDVI data were integrated to generate the HSI, which was used to evaluate the quality and sustainability of human settlement environments [23]. The calculation formula is as follows:
HSI = 1 N D V I M A X + N P P N O R 1 N P P N O R + N D V I M A X + ( N P P N O R N D V I M A X )
where NPPNOR represents the normalized NTL data, and NDVIMAX denotes the maximum monthly NDVI value calculated within each year.

3.2.2. Geometric Mean Method

In summary, the DII requires consideration of multiple dimensions. The CSDI was constructed using the HSI, slope, POI density, and POI cost distance, enabling accurate identification of development conditions across counties in Chongqing Municipality. However, because these four factors represent different dimensions, effectively integrating them to enhance the reliability of development intensity evaluation remains a key challenge. To avoid the uncertainty of modeled results affected by weight setting, we employed the geometric mean method to integrate the datasets and generate the CSDI raster map. Before applying the geometric mean, all four normalized factor layers (HSI, slope, POI density, and POI cost distance) were checked for zero values. Any value equal to 0 was replaced with the smallest non-zero value observed in that factor’s dataset (i.e., a non-parametric replacement method). This ensures that the geometric mean can be computed without losing information from other factors while preserving the relative ranking of extremely low values. The calculation formula is as follows:
CSDI = i = 1 4 X i 4
The specific value of CSDI reflects the overall level of regional development. A higher CSDI value indicates a more prosperous development condition and better economic status within the study area. Since the four development factors have different dimensions, they must be normalized before applying the geometric mean method. Therefore, X i   in the equation represents the normalized value of the i-th factor.
HSI and POI density are positive factors, meaning that higher values indicate stronger regional development capacity; they were normalized according to Equation (1). In contrast, slope and POI cost distance are negative factors, meaning that higher values indicate constraints on regional development; thus, they were normalized according to Equation (2).

3.2.3. Reliability Validation of CSDI

To validate the reliability of CSDI, we first used county-level DII as a reference indicator and conducted correlation analyses between CSDI and DII for each study year. Subsequently, we incorporated high-resolution Google Earth Pro 7.3.3.7721 imagery for comparative analysis to examine the actual satellite-based characteristics of areas with high and low CSDI values.
Specifically, the zonal statistics method was first used to aggregate the CSDI raster map to the county scale. Then, R2 was calculated to quantify the relationship between CSDI and DII.
R 2 = 1 i = 1 n y i y i ^ 2 i = 1 n y i y ¯ 2
where y i represents the DII of the i-th county, y i ^ denotes the corresponding CSDI value of the i-th county, Y ¯ represents the arithmetic mean of DII values across all counties, and n indicates the total number of counties in Chongqing Municipality.
To investigate the contributions of environmental and socioeconomic factors to CSDI and to further evaluate its reliability, we constructed a simple linear regression model. Specifically, CSDI was used as the dependent variable, and the five independent variables were individually incorporated into the regression models for fitting.
CSDI = β 0 + β i x i + ε i
where x i represents different features, β 0 is the constant term, β i denotes the regression coefficient, and ε i represents the random error term. The R2 was used to evaluate the strength of the linear relationship between each independent variable and CSDI.

4. Results and Analysis

4.1. Reliability Assessment of DII in Different Counties of Chongqing Municipality

To evaluate the accuracy of DII, we compared county DII rankings across years with their corresponding GDP rankings, as GDP is one of the most widely used indicators for assessing economic conditions and development trends at national and regional scales. As shown in Table 2, county-level DII and GDP rankings generally show a degree of consistency, indicating that DII is effective in assessing regional development to some extent. However, due to differences in evaluation criteria, substantial discrepancies exist between DII values and GDP rankings for most counties.
These discrepancies may be partly attributed to variations in county administrative area sizes. For example, some districts (e.g., Dadukou District) have relatively small administrative areas, resulting in comparatively lower GDP values. Nevertheless, their higher socioeconomic conditions and improved public services contribute to relatively higher DII values. In contrast, some counties with larger administrative areas may achieve higher GDP values but fail to provide equivalent social development conditions, leading to relatively lower DII values.
This finding further demonstrates that assessing development intensity is a complex, multidimensional issue involving economic development, healthcare, the ecological environment, and education. Regional development cannot be comprehensively evaluated solely by GDP, an overall economic indicator, and requires integration across multiple dimensions. Compared with traditional GDP-based assessments, DII provides a more comprehensive representation of residents’ actual living conditions and offers a more reasonable approach for monitoring comprehensive development at the regional scale.

4.2. Spatiotemporal Evolution of DII in Different Counties of Chongqing Municipality from 2014 to 2020

First, the weights of each indicator were calculated using the entropy weight method, as shown in Table 3. The results indicate the relative contributions of the indicators to the DII. Among all indicators, the per capita RMB deposit balance of financial institutions had the strongest positive influence, with a weight of 0.47848. In contrast, the proportion of areas with slopes greater than 15° had the strongest negative influence, with a weight of 0.12161.
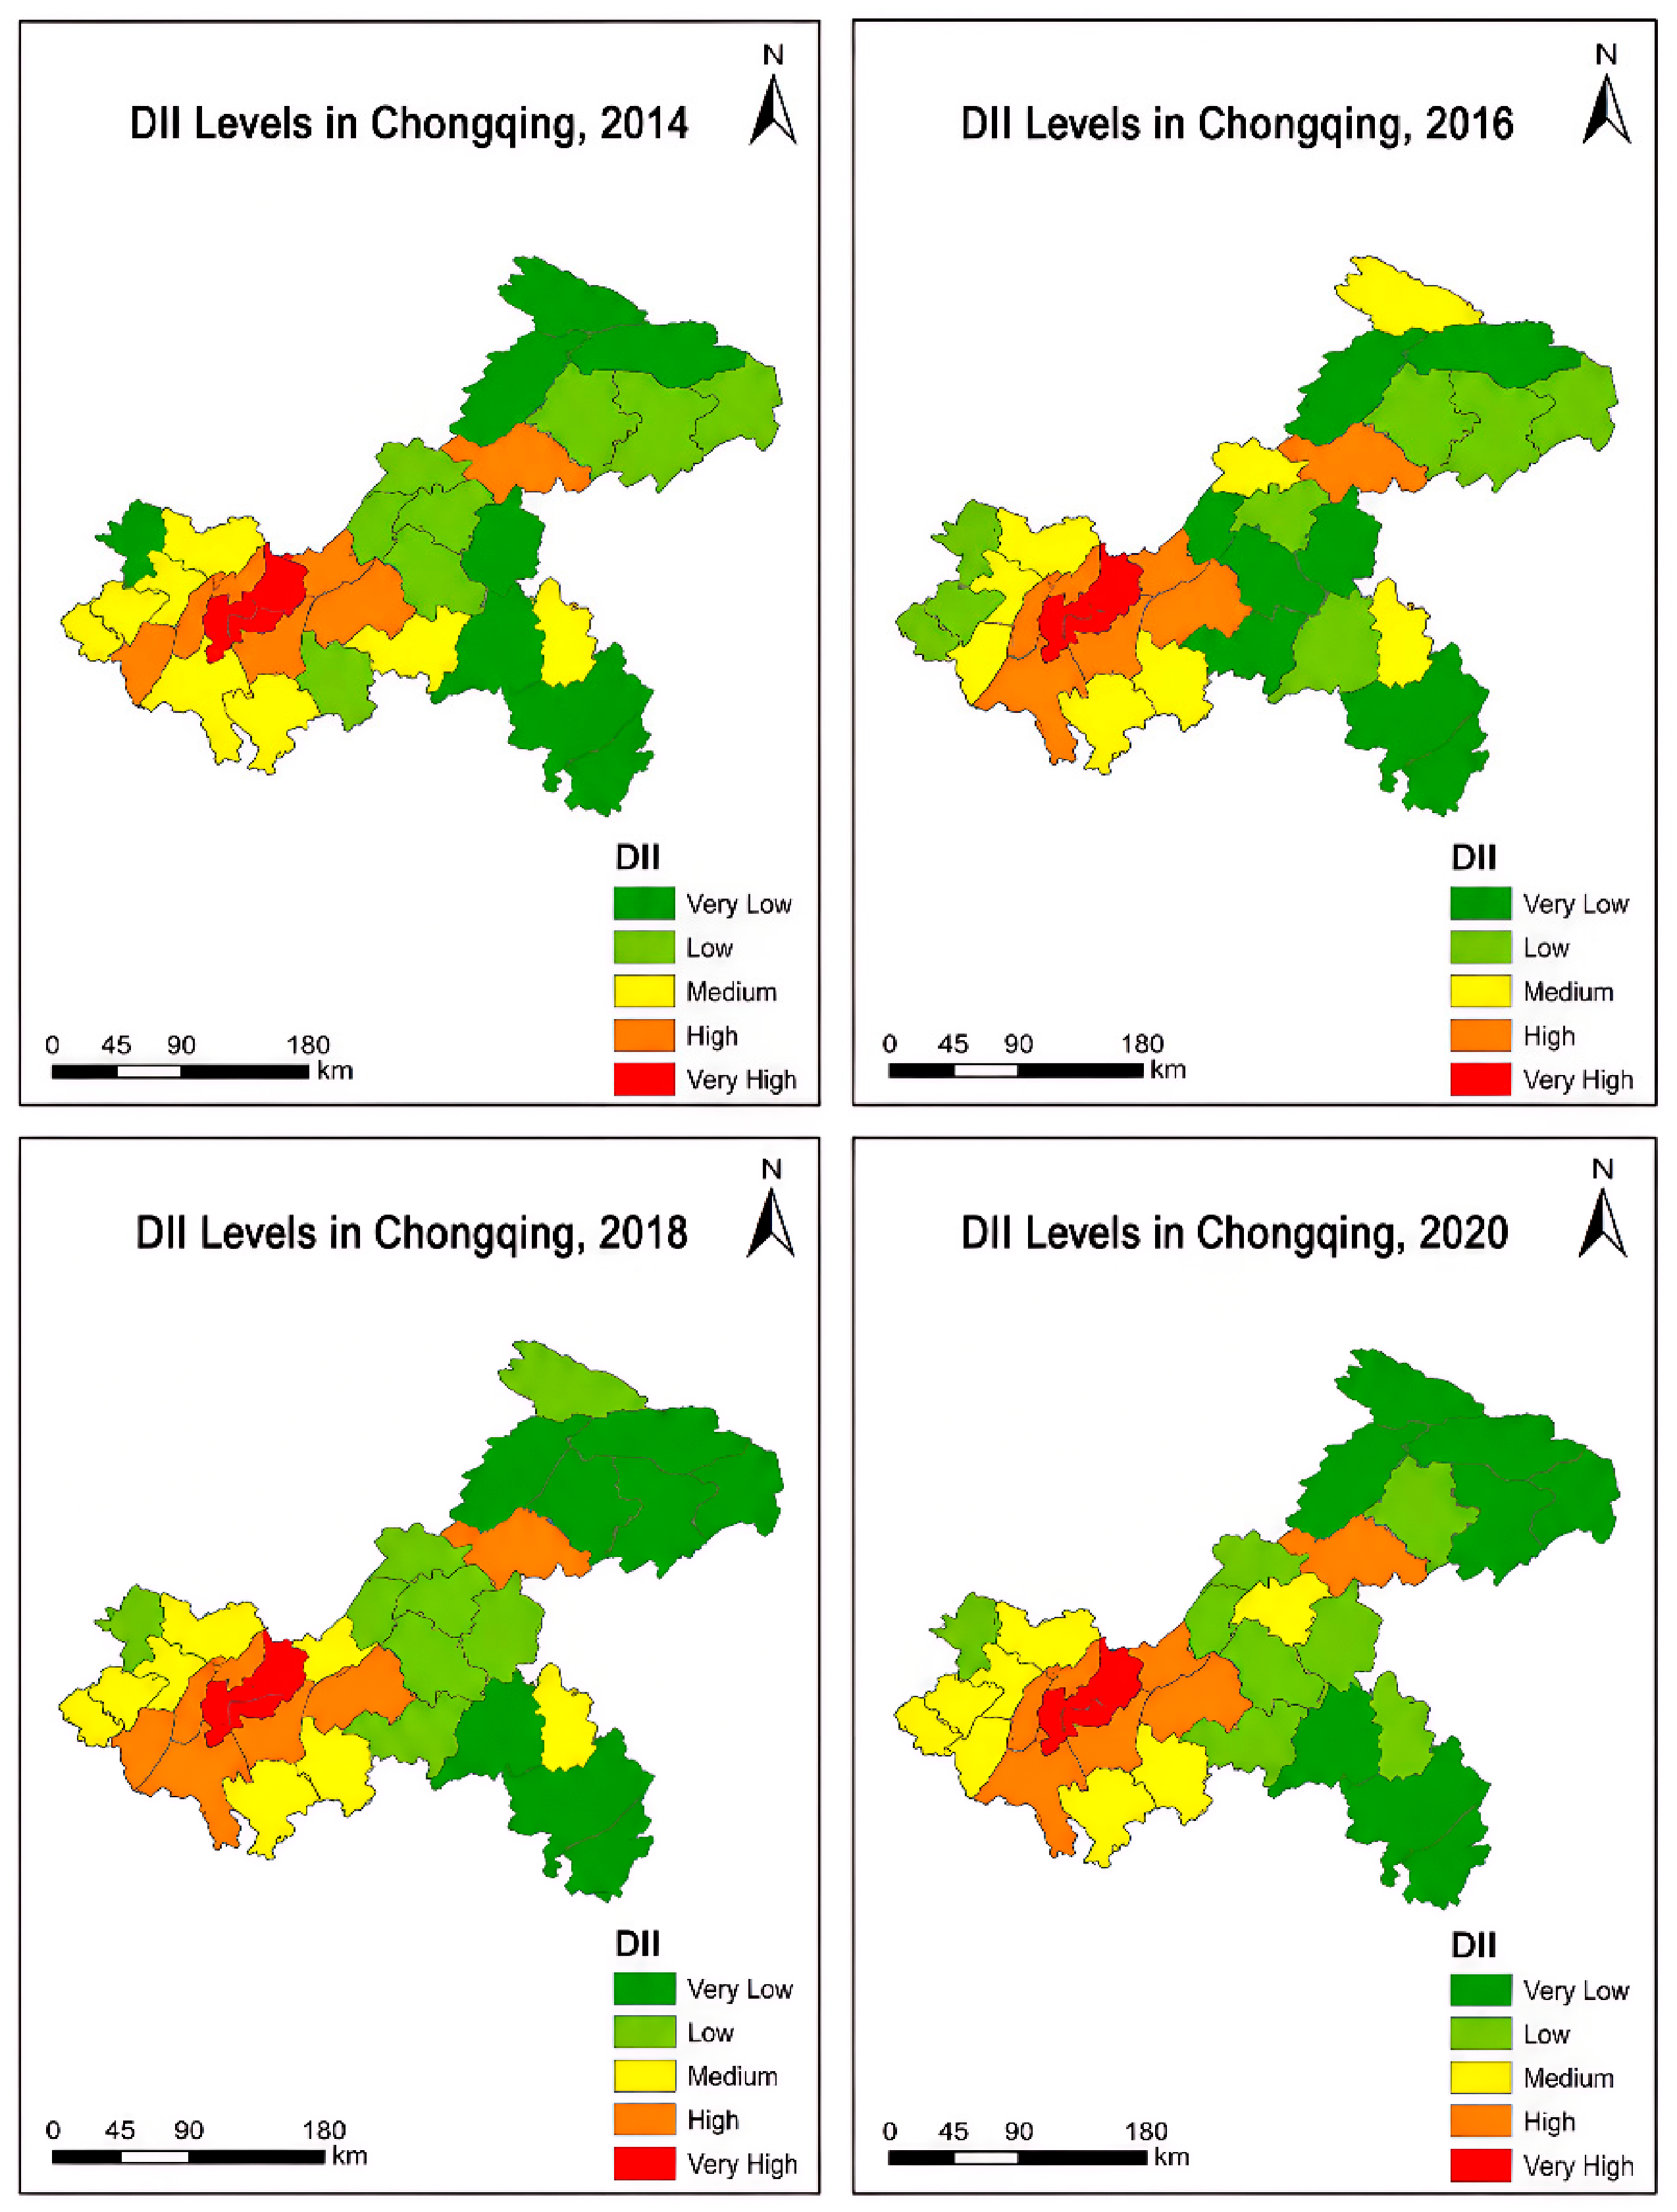
The DII was calculated based on selected indicators from county-level statistical yearbooks and serves as a comprehensive indicator for characterizing the overall development status of each county. After determining the weights of different indicators, the DII values were calculated. According to the calculation principle, higher DII values indicate higher levels of regional development, whereas lower values represent relatively lower development levels and greater development disadvantages. The DII values of different counties for each study year are presented in Table 4.
To illustrate the differences in DII among counties in Chongqing Municipality, the DII values for each year were classified into five levels: extremely low, low, medium, high, and extremely high. However, because overall regional development rates varied across areas and over time, a fixed classification scheme could not be applied to define DII levels across years. The DII values for the four years were classified separately using the quantile method.
As shown in Figure 3, the spatial distribution of DII in Chongqing Municipality from 2014 to 2020 exhibited a significant center-to-periphery gradient, while the temporal evolution trajectories of different counties showed distinct regional differentiation. High-DII areas were consistently concentrated in the urban core, including Yuzhong District, Yubei District, Jiangbei District, Shapingba District, and Jiulongpo District. As the cultural and economic centers of the municipality [29], these areas possess advanced industrial structures, well-established industrial chains, comprehensive public service facilities, and convenient transportation networks. Meanwhile, they also attract abundant employment opportunities and cultural entertainment resources [30], resulting in significantly higher DII values than other counties throughout the study period.
Notably, Yuzhong District achieved a DII value of 0.4277 as early as 2014, which subsequently peaked at 0.5005 in 2016. Although its DII declined after 2016, it remained the highest development level among all districts in Chongqing Municipality throughout the study period. Jiangbei District exhibited a continuously rapid growth trend, with its DII increasing from 0.2022 in 2014 to 0.4737 in 2020, representing more than a twofold increase. Strong development momentum during its regional development process.
Further analysis indicates that counties with medium or higher DII levels were primarily located within the OHES. In contrast, counties with lower DII values were primarily distributed in SC and NC, including Youyang County, Wushan County, and Wuxi County. These counties are located in remote mountainous areas of Chongqing Municipality, where significant geographical disadvantages exist. Infrastructure development and economic growth are constrained by natural conditions and limited transportation accessibility [31,32], resulting in consistently low DII values throughout the study period.
From a spatiotemporal perspective, the DII of Youyang County increased gradually from 0.0152 in 2014 to 0.0205 in 2020, while Wushan County increased from 0.0214 to 0.0232, and Wuxi County increased from 0.0168 to 0.0257. These increases were relatively limited, and the development gap between these counties and the urban core not only failed to narrow but continued to expand over the eight years. This indicates that development processes in remote mountainous areas have lagged behind, with regional development imbalances tending to intensify.
Taken together, the development level of northeastern and southeastern Chongqing Municipality remained relatively low, whereas the southwestern region exhibited a higher and more stable growth trajectory. This spatial distribution pattern is highly consistent with the topographical characteristics of Chongqing. High-DII areas were mainly located in regions with relatively flat terrain and convenient transportation, while low-DII areas were concentrated in mountainous and hilly regions. Although these low-DII areas experienced certain improvements between 2014 and 2020, their growth rates were significantly lower than those of flatter regions, indirectly demonstrating the importance of slope as a key factor in evaluating the Development Intensity Index of Chongqing Municipality.
The average DII of Chongqing Municipality increased from approximately 0.048 in 2014 to approximately 0.060 in 2020. However, the benefits of development were concentrated primarily in the urban core and surrounding areas affected by spillover effects, while remote mountainous regions received relatively limited benefits. This finding highlights the pronounced spatial differentiation and imbalance in regional development within Chongqing Municipality.

4.3. Reliability Assessment of CSDI in Different Counties of Chongqing Municipality

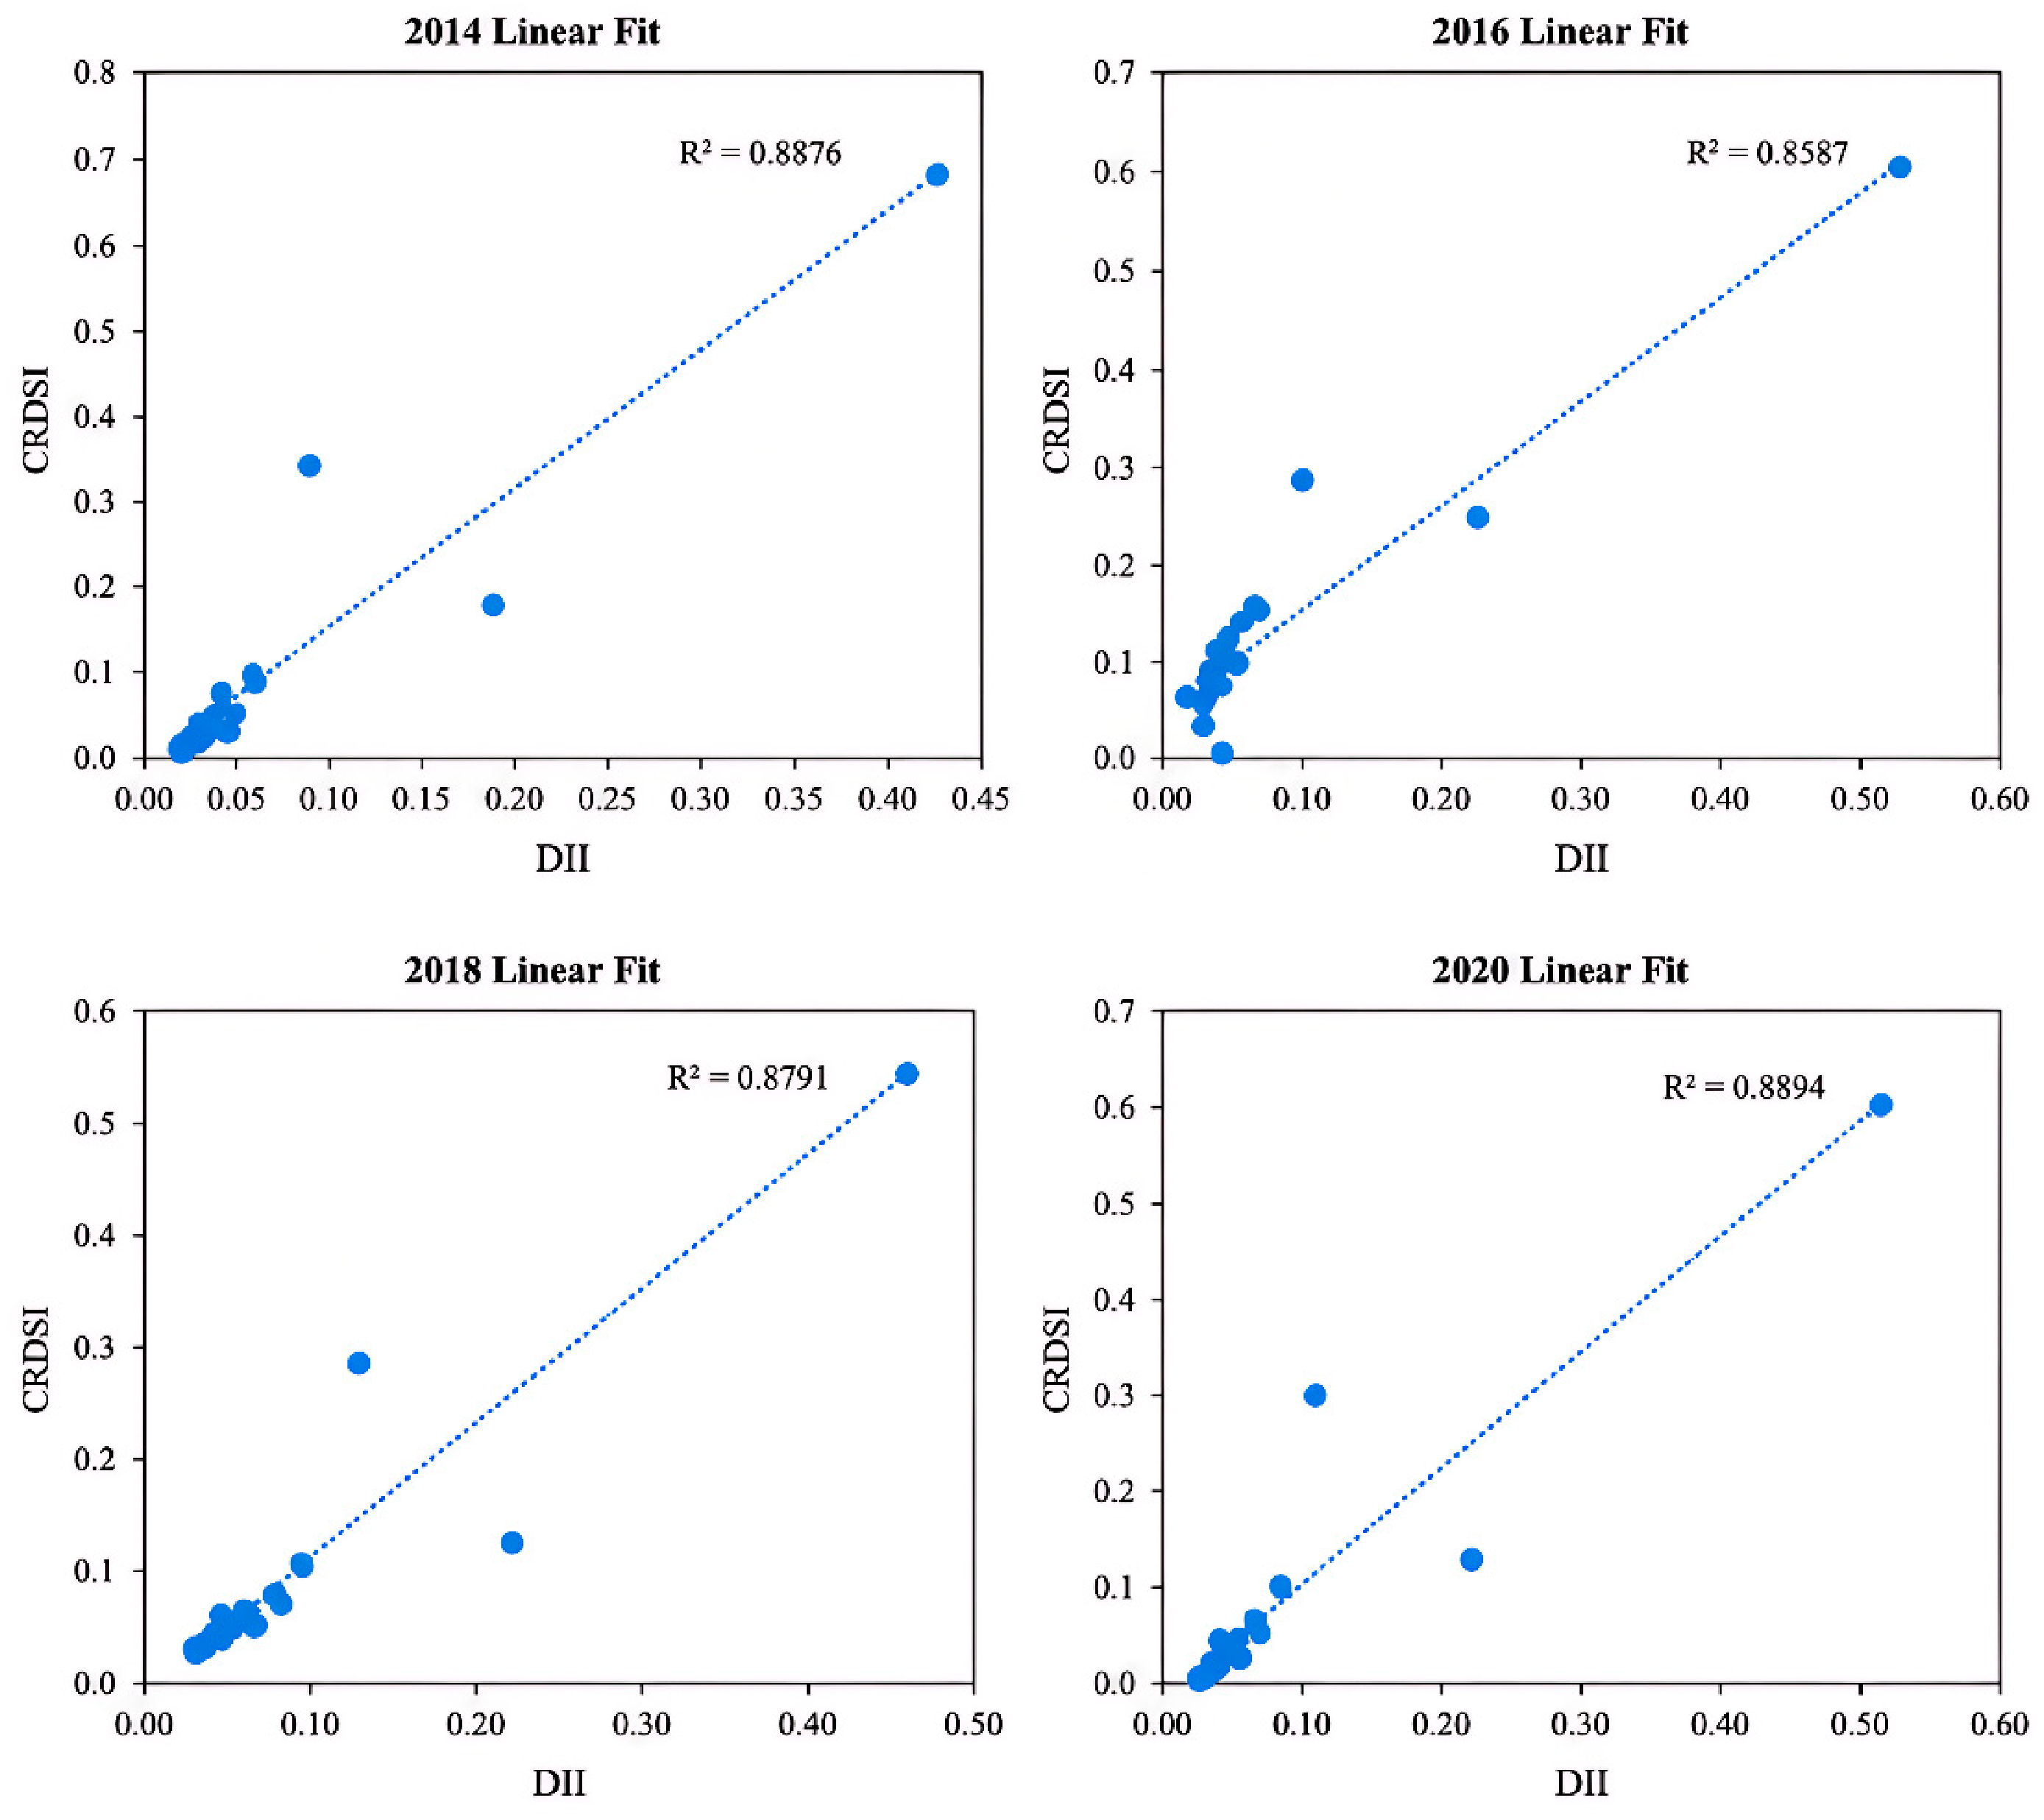
To explore the relationship between CSDI and DII and evaluate the reliability of CSDI, the CSDI raster map was first aggregated to the county scale using the zonal statistics method. Subsequently, the correlation between CSDI and DII was analyzed. As shown in Figure 4, the regression results yielded R2 values of 0.8876, 0.8587, 0.8791, and 0.8894 for the four study years, respectively. These results indicate a strong correlation between DII and CSDI values. The high consistency between CSDI and DII demonstrates that CSDI can effectively assess the current regional development status of Chongqing Municipality.
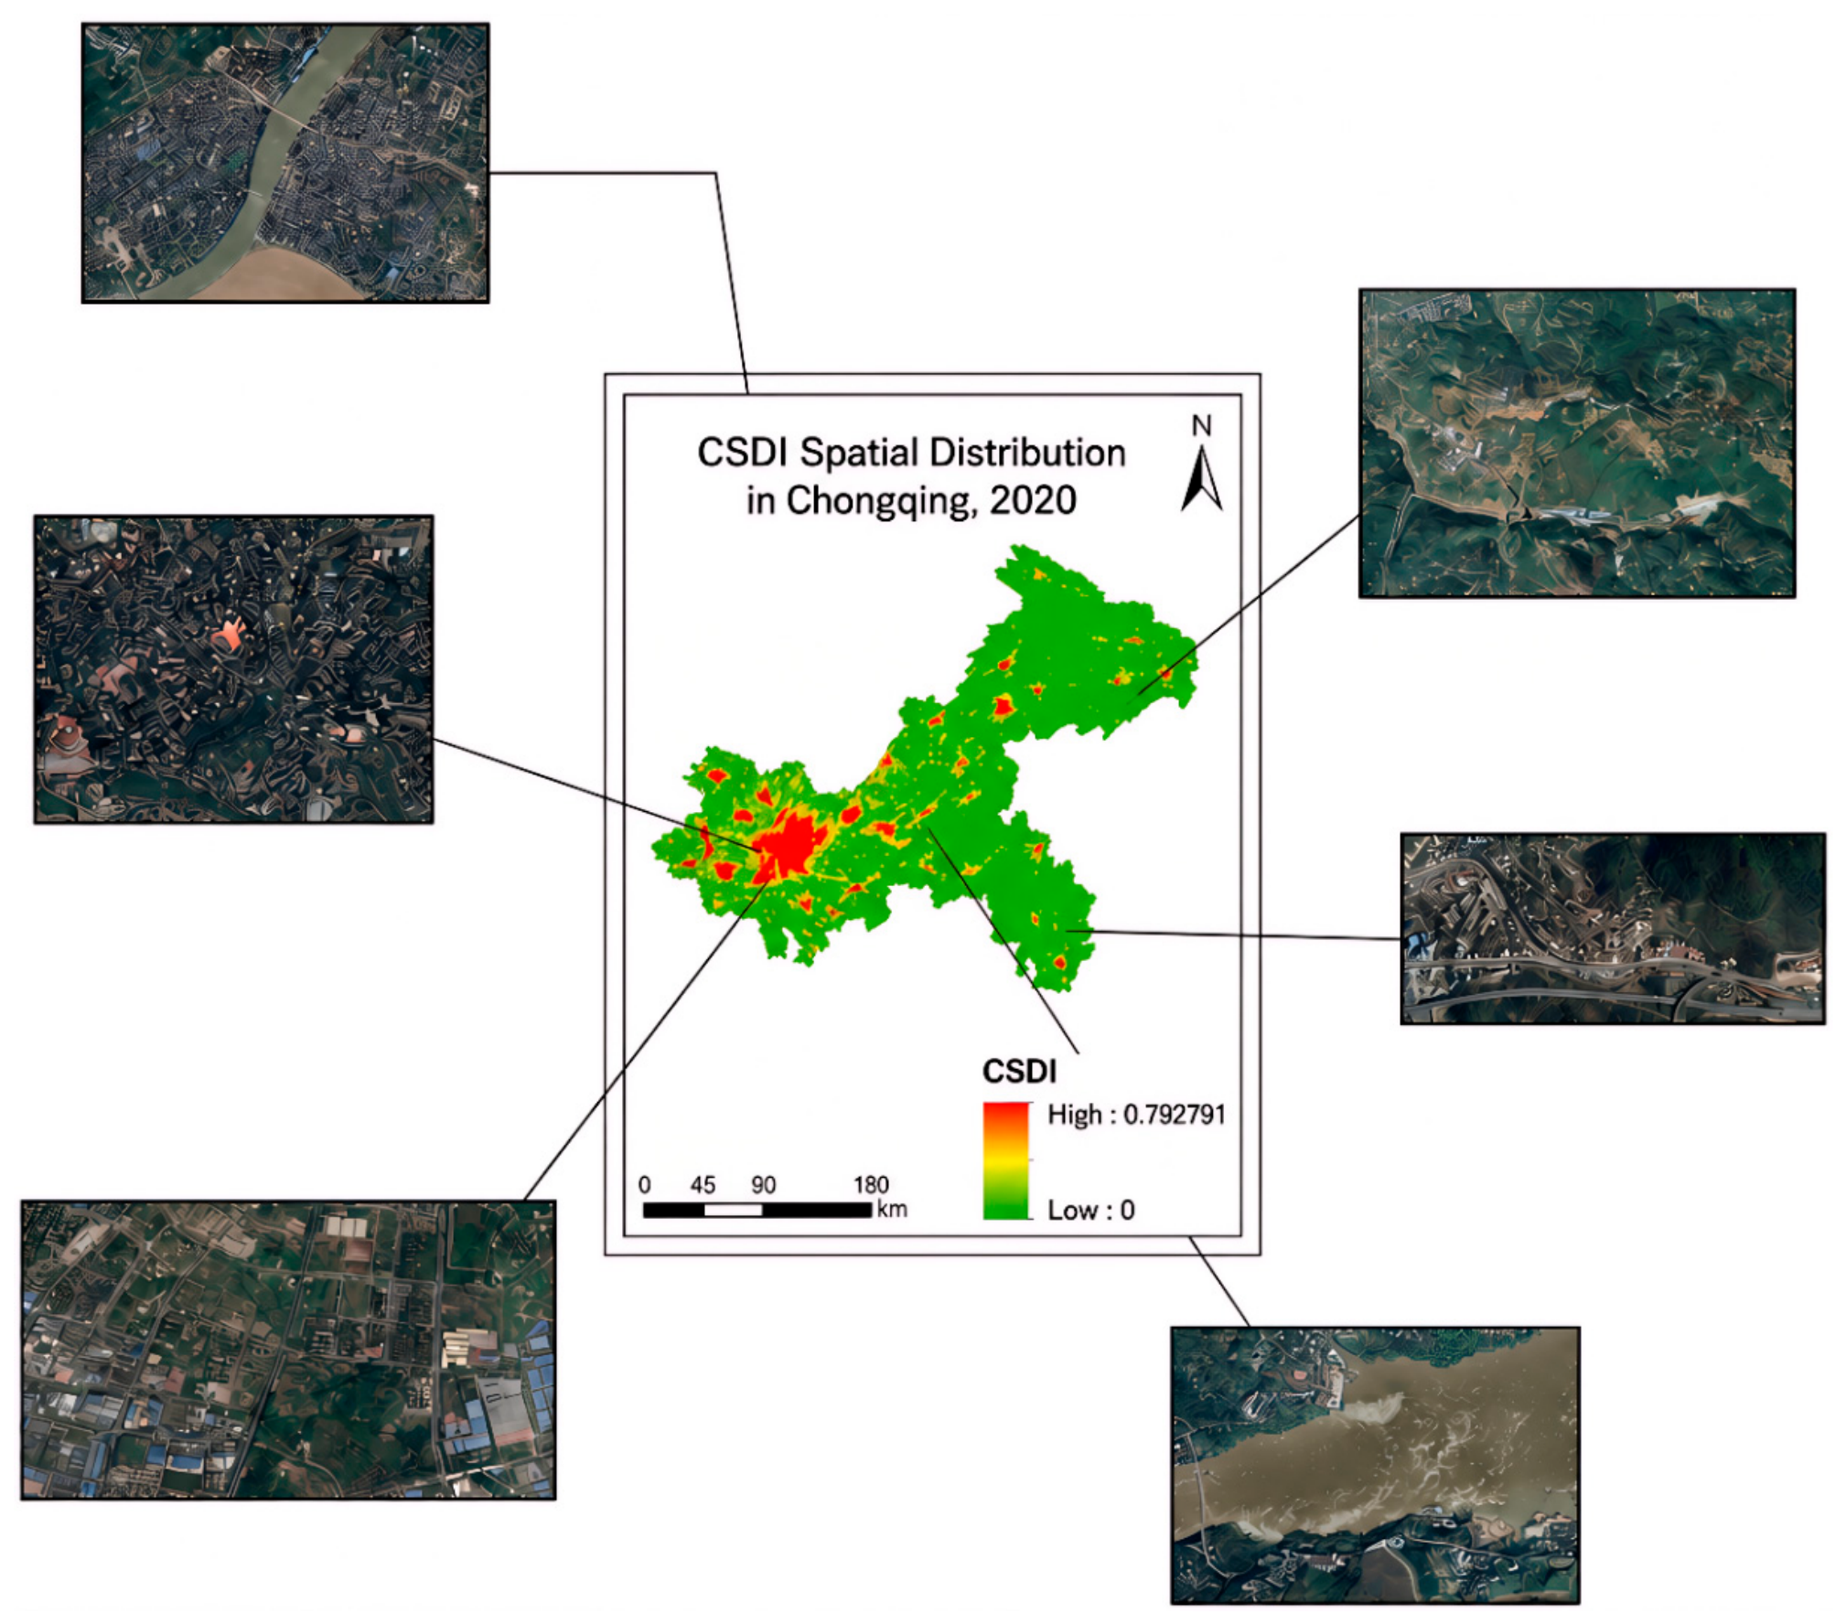
To further intuitively illustrate the differences in regional development intensity, we compared the spatial distribution of CSDI in 2020 with high-resolution imagery from Google Earth, as shown in Figure 5. Visual comparisons indicate that areas with high CSDI values are generally located in regions with relatively flat terrain, dense building distributions, and convenient transportation accessibility, whereas areas with low CSDI values are often characterized by poor transportation conditions and sparse built-up environments.
Comparing the spatial distribution of CSDI with the list of poverty-stricken counties in Chongqing Municipality, based on Google Earth imagery, revealed that most poverty-stricken counties were located in low-CSDI areas. This result further demonstrates the effectiveness of CSDI in evaluating comprehensive development intensity.
From a spatiotemporal perspective, comparisons among the four CSDI raster maps and county-level CSDI values derived via zonal statistics reveal that highly developed areas, including Yuzhong District, Dadukou District, Nan’an District, and Jiangbei District, consistently maintained high CSDI levels. In particular, Yuzhong District exhibited CSDI values exceeding 0.55 across all four study years. In contrast, less-developed areas, represented by Chengkou County, Wuxi County, and Youyang County, generally recorded CSDI values below 0.01.
The temporal comparison of CSDI values provides a clearer representation of the pronounced imbalance in regional development within Chongqing Municipality. Meanwhile, the consistent performance of CSDI across years also demonstrates its applicability and sustainability for long-term development-level monitoring.
Previous studies have demonstrated that a single indicator is insufficient to comprehensively evaluate regional development levels, whereas integrating multisource data may provide a more effective representation of overall development conditions. We constructed the CSDI using multisource remote sensing data and POI data to assess the spatial pattern of regional development in Chongqing Municipality. To further clarify the contribution of different variables to CSDI, regression analyses were conducted between CSDI and five explanatory variables, including NTL, DEM, NDVI, POI cost distance, and POI density, to investigate their relationships with CSDI.
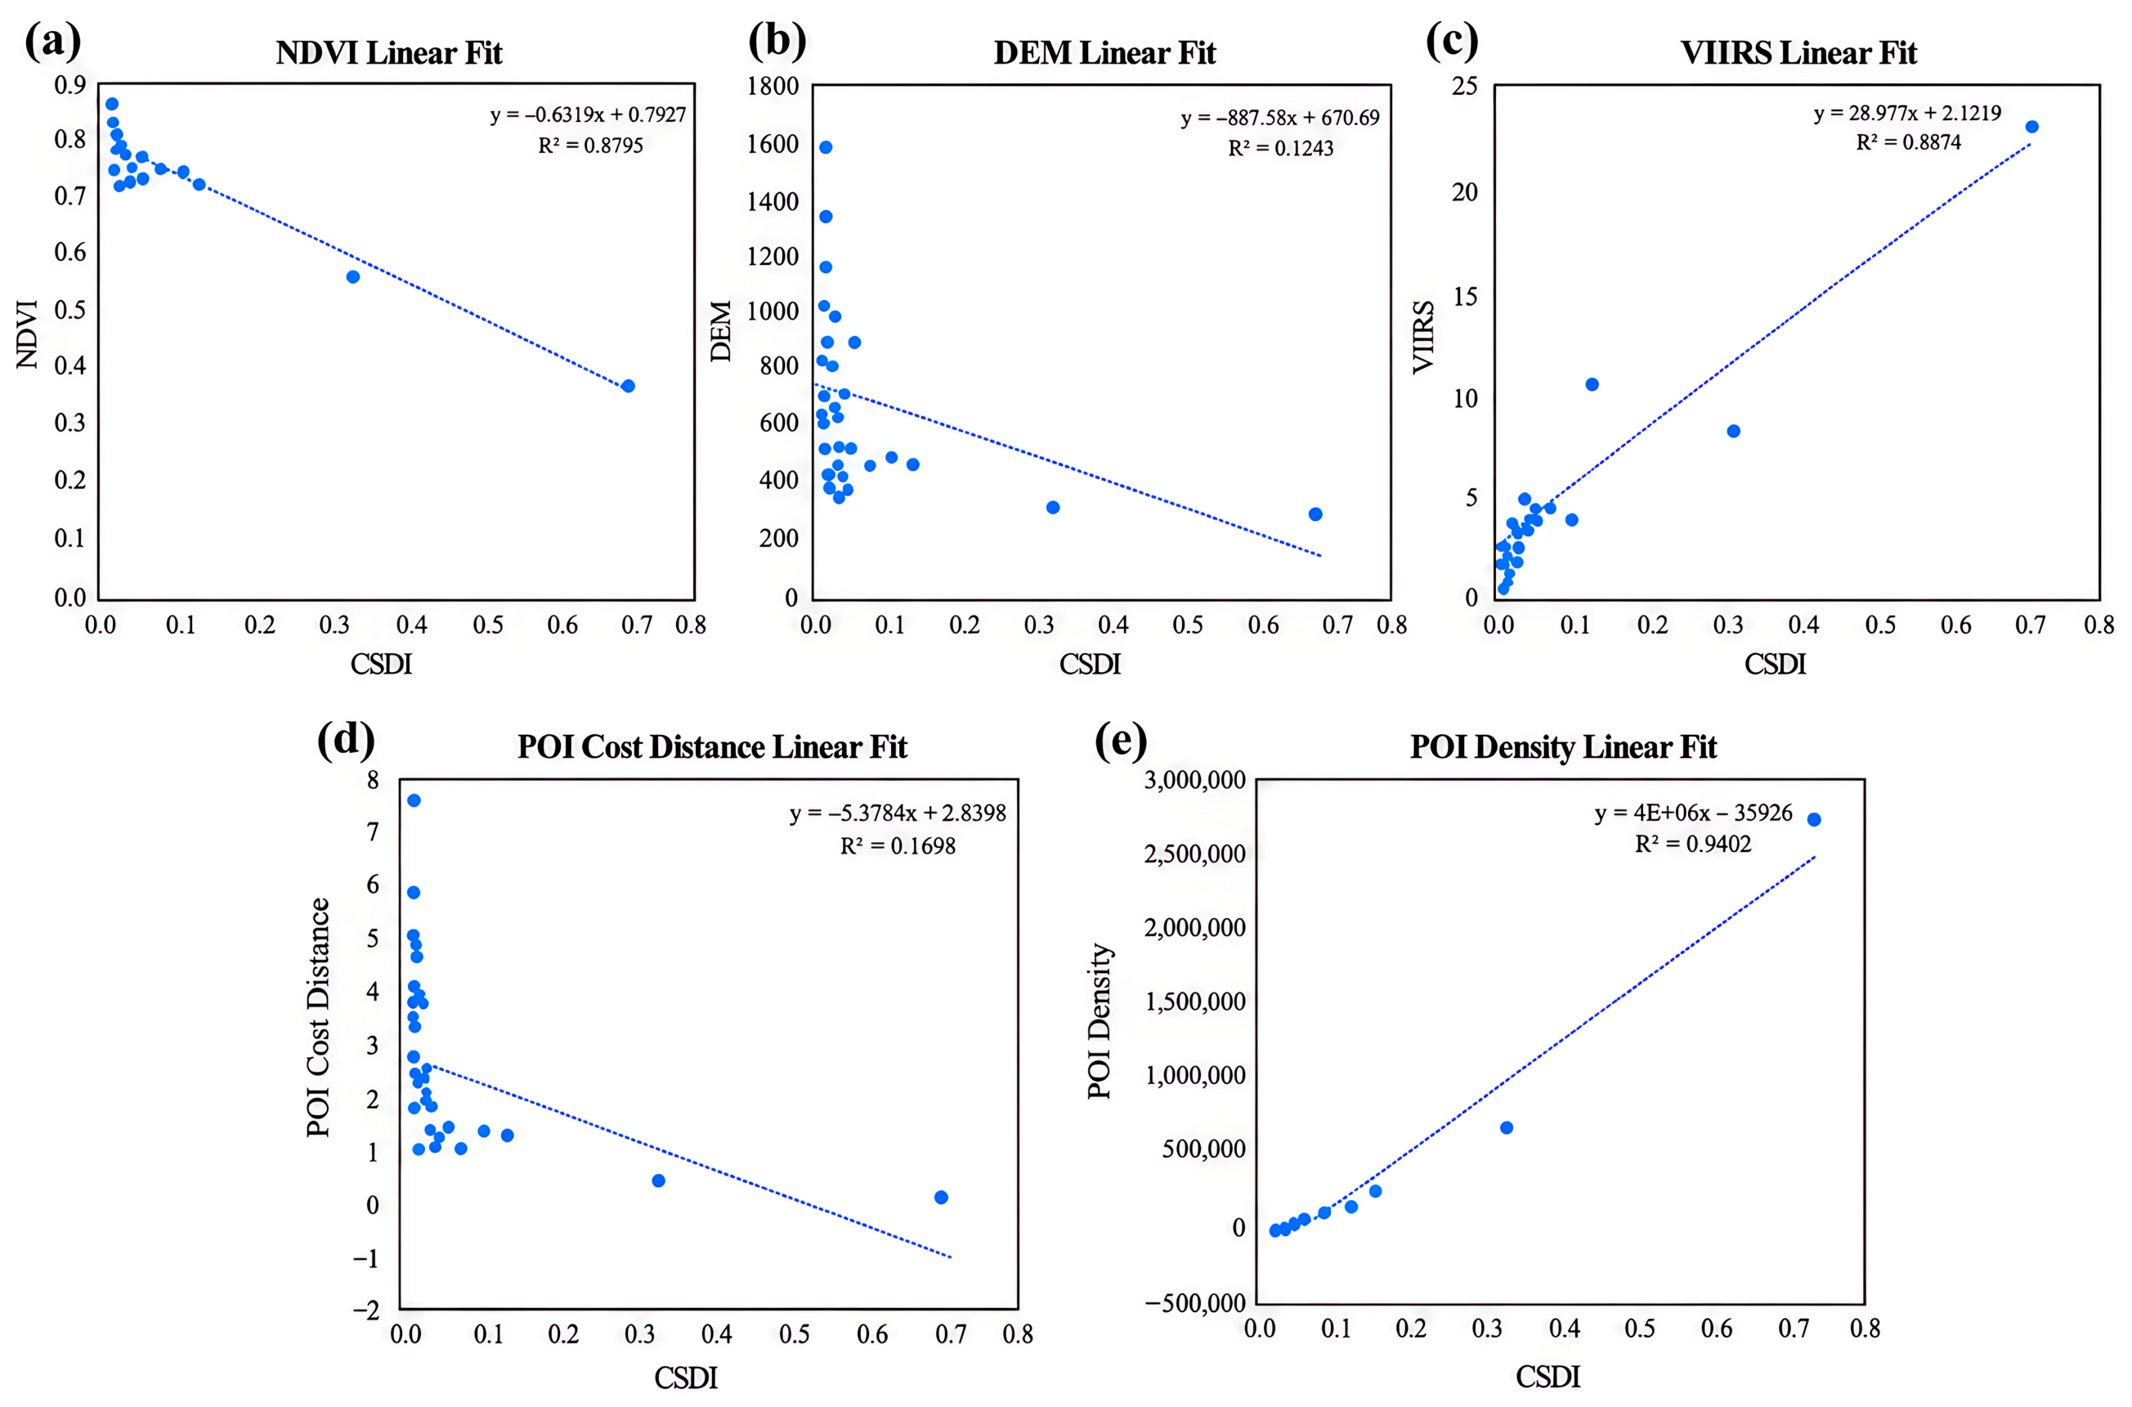
As shown in Figure 6, using 2014 as an example, NDVI was negatively correlated with CSDI. This is because NDVI reflects both vegetation cover and terrain conditions. Areas with high vegetation cover are generally associated with lower urbanization levels, and rugged terrain also restricts regional development, consistent with the constraints imposed by natural conditions. In contrast, the correlation coefficients between DEM, POI cost distance, and CSDI were below 0.2, indicating weak correlations and limited evidence of effective associations. Meanwhile, NDVI exhibited a strong relationship with CSDI, with an R2 of 0.8795.
NTL and POI density showed positive correlations with CSDI. The former represents nighttime illumination intensity, with higher values generally indicating greater urbanization and industrialization. The latter reflects population aggregation and commercial activity, with higher values indicating more intensive economic activity and richer social resources. The corresponding R2 values for NTL and POI density with CSDI were 0.8874 and 0.9402, respectively, indicating strong correlations. Among the five factors, POI density exhibited the highest R2 value, indicating that it had the strongest explanatory power for CSDI and was the most important factor in identifying and assessing the development level of Chongqing Municipality.
Each scatter plot in Figure 6 includes at least two outliers, corresponding to Yuzhong District and Dadukou District. These two districts are located in the core urban area of Chongqing Municipality, where land resources are limited, and the degree of urbanization is extremely high. Meanwhile, local governments have emphasized improving the development environment and promoting social coordination throughout urban construction. Consequently, their CSDI values are significantly higher than those of other regions. In summary, multisource remote sensing data and POI data provide practical implications for constructing CSDI and offer strong support for assessing DII and regional development levels.

4.4. Spatiotemporal Evolution of CSDI in Different Counties of Chongqing Municipality from 2014 to 2020

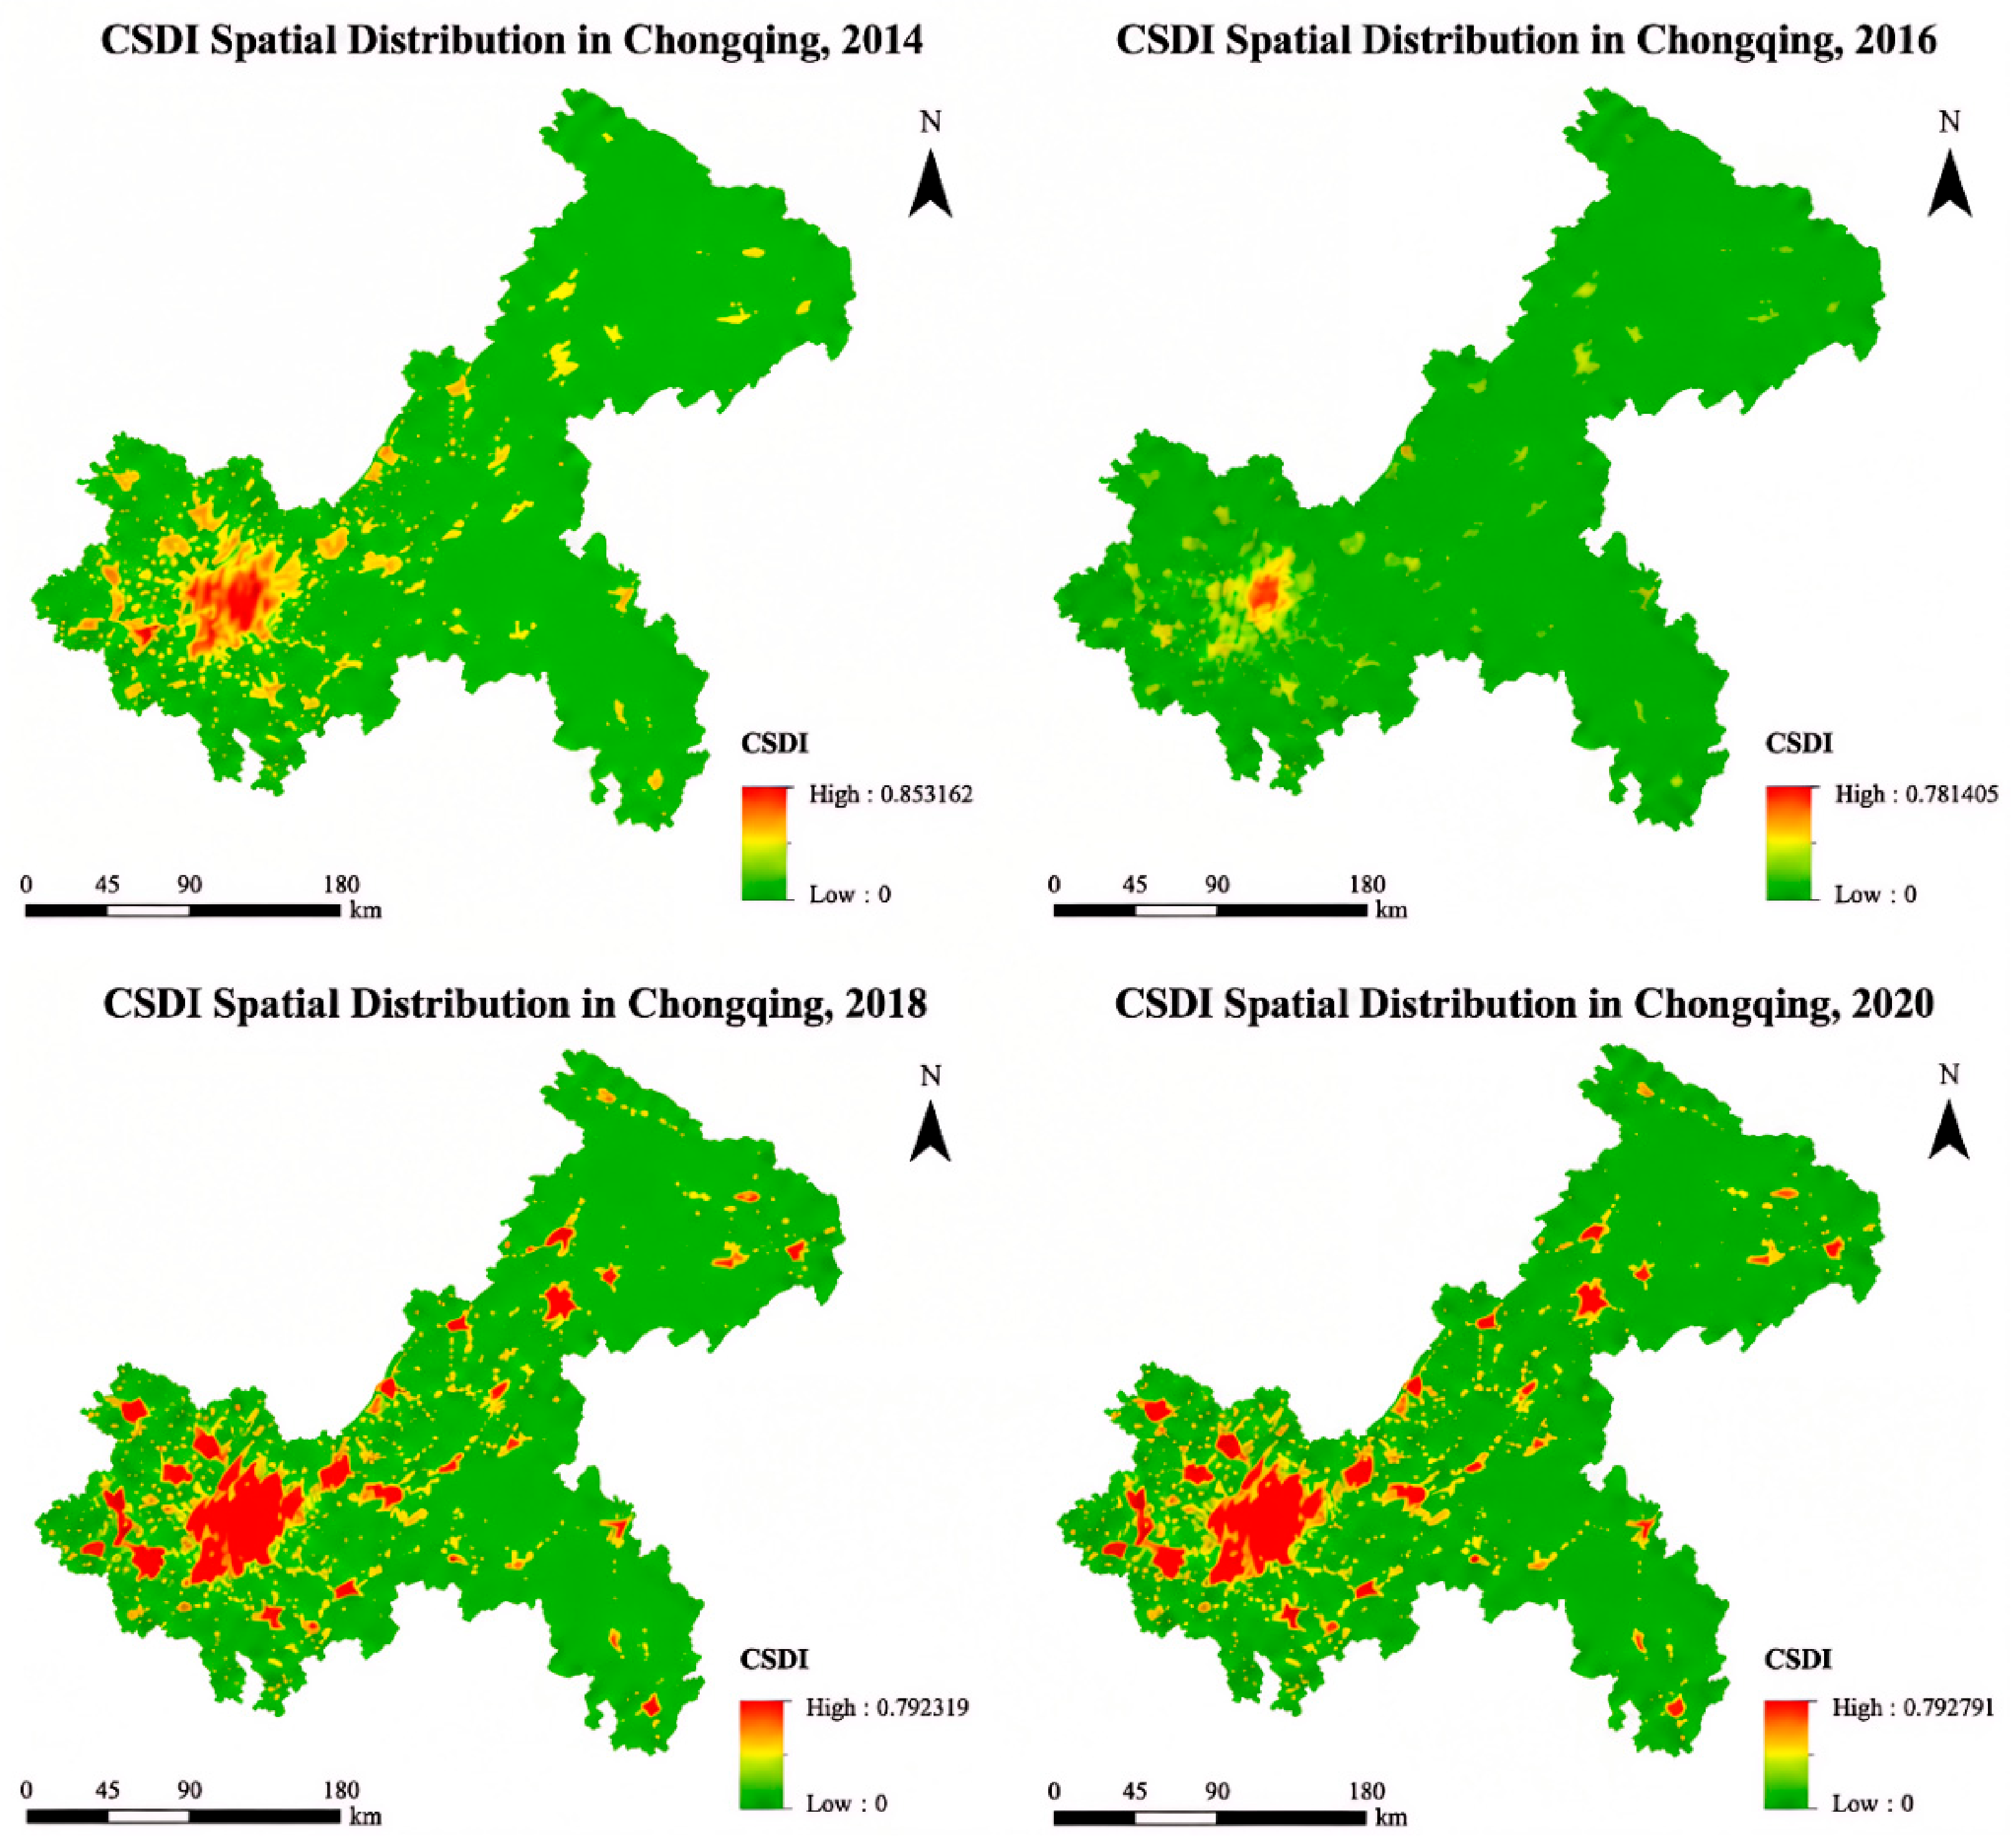
Regarding CSDI values, the maximum value across Chongqing Municipality declined from 0.853 in 2014 to 0.781 in 2016, followed by slight increases in 2018 (0.792) and 2020 (0.793). Taken together, the variation range was limited, indicating that the spatial distribution characteristics of CSDI remained relatively stable during the study period. This stability suggests that regional development patterns in Chongqing exhibited strong temporal persistence.
As shown in Figure 7, significant spatial differentiation of CSDI was observed throughout the study period. High-CSDI areas were mainly concentrated within the One-Hour Economic Sphere of Chongqing (OHES), whereas low-CSDI areas were predominantly distributed in the northeastern Chongqing (NC) and southeastern Chongqing (SC) regions. The spatial pattern remained highly consistent from 2014 to 2020, with the core–periphery structure becoming increasingly evident.
During the study period, high-CSDI patches within the OHES exhibited a continuous expansion trend. High-value areas gradually extended from the urban core toward surrounding counties, indicating an outward diffusion of regional development intensity. Compared with 2014, the spatial coverage of high-CSDI areas increased substantially in peripheral counties surrounding the central urban districts.
In contrast, low-CSDI areas in NC and SC showed only limited reductions. Although some low-value patches experienced slight shrinkage between 2014 and 2020, the overall contiguous distribution pattern remained largely unchanged. These regions continued to maintain relatively low CSDI values throughout the study period.
Further comparison between high- and low-CSDI regions revealed that the spatial gap between different development zones remained relatively stable. No obvious convergence trend was observed during the study period. Overall, the evolution of CSDI in Chongqing demonstrated three major characteristics: (1) continuous expansion of high-development-intensity areas, (2) limited improvement of low-development-intensity regions, and (3) persistent spatial differentiation between core and peripheral areas.

5. Discussions

5.1. Policy Implications

Accurate assessment of regional development intensity is a fundamental prerequisite for understanding spatial disparities, identifying development disadvantages, and supporting sustainable regional planning. In recent decades, China has experienced remarkable economic growth and substantial improvements in living standards. However, uneven regional development, resource pressures, and ecological challenges have emerged during this rapid development process. Therefore, promoting balanced and sustainable regional development has become an important national priority, particularly in regions where development disadvantages and relative poverty remain.
Taking Chongqing Municipality as the study area, we developed the DII using an adaptive modeling approach and compared it with GDP data to validate its reliability and applicability in characterizing the comprehensive development level. Furthermore, NTL, DEM, POI data, and NDVI data were integrated to construct the CSDI, enabling multidimensional characterization and spatial representation of regional development conditions. Based on the analysis results derived from the above index system, the following policy implications are proposed.
First, from the perspective of regional development monitoring, multisource geographic data integration provides an effective approach for dynamic assessment of development disparities. Traditional statistical indicators are often limited by spatial aggregation effects and insufficient representation of intra-regional differences. In contrast, CSDI integrates socioeconomic activity, infrastructure accessibility, environmental conditions, and topographic constraints, enabling more detailed identification of development differences at fine spatial scales. Governments should promote the integration of multisource remote sensing and geographic data into regional monitoring systems to improve the accuracy and timeliness of development assessment.
Second, differentiated regional development strategies should be implemented to address the persistent spatial imbalance identified in this study. The continuous expansion of high-CSDI areas within OHES indicates that development advantages have gradually extended from central urban districts toward surrounding areas. This pattern is closely associated with urbanization processes, infrastructure improvement, industrial linkage, and the diffusion effects generated by metropolitan development [33,34]. However, excessive concentration of economic and policy resources may also strengthen the polarization effect between core and peripheral regions. Future policies should not only support the growth of central urban areas but also enhance the spillover capacity of OHES by improving connectivity, strengthening functional linkages, and promoting coordinated development between urban cores and surrounding counties.
Third, greater attention should be paid to the long-term development constraints in NC and SC. The persistent low-CSDI pattern in NC reflects the influence of industrial structure and resource dependence. As a region historically associated with energy-related industries, NC faces challenges related to industrial transformation, environmental constraints, and limited economic diversification [35]. Policies should focus on promoting industrial restructuring, developing alternative industries, and strengthening ecological compensation mechanisms to transform resource-based development pathways.
Meanwhile, the continued low development intensity in SC is closely related to unfavorable geographical conditions and complex mountainous terrain. These constraints reduce transportation accessibility, weaken market connections, and limit population and investment attraction [36]. Accordingly, policy interventions should prioritize transportation infrastructure improvement, enhancement of public service accessibility, and exploration of ecological and cultural resource-based industries to stimulate endogenous development capacity.
Finally, the persistent spatial differentiation between high- and low-CSDI regions highlights that regional development imbalance cannot be eliminated through short-term economic growth alone. Instead, it requires long-term institutional coordination and differentiated governance strategies. The CSDI developed in this study can serve as a dynamic monitoring framework for identifying disadvantaged regions, evaluating policy effectiveness, and supporting targeted allocation of development resources. Future regional planning should combine quantitative assessment with place-based policies to gradually reduce spatial inequalities and achieve more balanced and sustainable development [37].

5.2. Limitations and Future Work

However, there are still several limitations in this research.
(1) The construction of a multidimensional indicator system and the determination of indicator weights are critical factors affecting the reliability of development assessment results. In this study, the indicators selected to construct the DII remain relatively limited and cannot fully capture the multidimensional nature of comprehensive development. This limitation mainly stems from the limited coverage of statistical yearbook data in some regions, where relevant variables are insufficiently available, thereby affecting the completeness of the indicator system to some extent. Future studies should incorporate a broader range of dimensions and datasets to improve the assessment of development intensity.
(2) Regional development involves complex interactions among economic, social, and ecological factors, which are difficult to comprehensively characterize using a limited number of variables. In constructing CSDI, we mainly incorporated several representative multisource remote sensing data and geographic datasets. However, the limited range of variables may result in insufficient information representation, potentially affecting the accuracy and stability of assessment results. Future research should further expand data sources and integrate information from additional dimensions to enhance the comprehensiveness and reliability of the comprehensive development assessment.
(3) This study also has certain limitations in terms of temporal coverage. Due to data availability constraints, only selected years between 2014 and 2020 were analyzed, which may not fully capture the long-term evolution process of comprehensive development in Chongqing Municipality. Future studies should construct longer time-series datasets to enable continuous tracking and dynamic monitoring of development processes, thereby providing a more comprehensive understanding of their spatiotemporal evolution patterns.
(4) The use of multisource remote sensing data introduces uncertainties that warrant discussion. NTL and NDVI products are subject to sensor calibration, atmospheric interference, and cloud contamination, while DEM data contain vertical errors that propagate into terrain-related calculations. Additionally, temporal inconsistencies among data sources—annual NTL composites, monthly NDVI observations, and static DEM—may introduce biases without explicit harmonization. Nevertheless, the consistent agreement between CSDI and the independently derived DII across multiple time points (R2 > 0.85) suggests that our main findings are robust. Future work should incorporate systematic sensitivity analyses to quantify the contribution of each uncertainty source and develop harmonized frameworks to better align heterogeneous temporal resolutions.

6. Conclusions

We focused on Chongqing Municipality and developed a comprehensive, multidimensional assessment framework to achieve fine-scale identification of regional development levels and to analyze their spatiotemporal evolutionary characteristics. Two complementary indices were established from statistical data and multisource remote sensing data, namely the DII and the CSDI. These indices enabled the characterization and comparative analysis of regional development conditions at both county and 500 m spatial resolution scales.
The results indicate that DII can effectively represent the overall level of regional development. Although DII exhibited a high degree of consistency with the traditional GDP indicator in overall trends, it better captured local differences stemming from multidimensional factors, including education, healthcare, social security, and the ecological environment, thereby overcoming the limitations of relying solely on economic indicators. Furthermore, CSDI constructed by integrating NTL, NDVI, DEM, and POI data demonstrated enhanced spatial representation capability and maintained strong correlations with DII across multiple years (R2 consistently above 0.85), confirming its reliability and applicability for regional development assessment.
Regarding spatiotemporal evolution characteristics, the overall development status of Chongqing Municipality showed a steady upward trend during the study period, while significant spatial differentiation remained. The urban core consistently exhibited high-value aggregation, with gradual expansion toward surrounding areas. In contrast, mountainous regions such as NC and SC maintained relatively low levels of development over time, with limited growth and no substantial convergence in regional disparities. These findings indicate that terrain conditions, industrial foundations, and factor agglomeration capacity remain important factors influencing uneven regional development.
Overall, the dual-index framework based on DII and CSDI provides a feasible approach for characterizing regional development across multiple scales and dimensions, while improving the integration between traditional statistical assessments and spatial remote sensing analyses. The findings not only provide quantitative support for development policy formulation in Chongqing Municipality and similar mountainous cities but also offer a reference framework for dynamic development monitoring and differentiated governance.
In conclusion, promoting coordinated regional development requires not only strengthening the driving role of central cities but also increasing support for infrastructure improvements, industrial transformation, and the provision of public services in peripheral mountainous areas. Such efforts are essential for gradually narrowing regional development gaps and achieving a more balanced and sustainable development pattern.


Author Contributions

Conceptualization, T.H.; Methodology, T.H. and P.Y.; Validation, S.J.; Formal analysis, J.G.; Resources, P.Y.; Data curation, P.Y. and J.G.; Writing—original draft, T.H. and P.Y.; Writing—review & editing, T.H. and P.Y.; Visualization, S.J. and J.G.; Supervision, T.H. All authors have read and agreed to the published version of the manuscript.

Funding

This work was funded by the Ministry of education of Humanities and Social Science project (22YJCZH056).

Institutional Review Board Statement

Not applicable.

Informed Consent Statement

Not applicable.

Data Availability Statement

The data presented in this study are available on request from the corresponding author.

Acknowledgments

We sincerely thank the anonymous reviewers for their time, expertise, and constructive comments.

Conflicts of Interest

The authors declare no conflict of interest.

References

  1. Ruja, I.N.; Sumarmi; Idris. Programs, Opportunities, and Challenges in Poverty Reduction: A Systematic Review. Sage Open 2024, 14, 21582440241256242. [Google Scholar] [CrossRef]
  2. Chen, L.; Huo, C. The Measurement and Influencing Factors of High-Quality Economic Development in China. Sustainability 2022, 14, 9293. [Google Scholar] [CrossRef]
  3. Han, J. Prioritizing agricultural, rural development and implementing the rural revitalization strategy. China Agric. Econ. Rev. 2019, 12, 14–19. [Google Scholar] [CrossRef]
  4. Wang, W.; Cheng, H.; Zhang, L. Poverty assessment using DMSP/OLS night-time light satellite imagery at a provincial scale in China. Adv. Space Res. 2012, 49, 1253–1264. [Google Scholar] [CrossRef]
  5. Ma, L.; Che, X.; Zhang, J.; Fang, F.; Chen, M. Rural Poverty Identification and Comprehensive Poverty Assessment Based on Quality-of-Life: The Case of Gansu Province (China). Sustainability 2019, 11, 4547. [Google Scholar] [CrossRef]
  6. Sherman, L.; Proctor, J.; Druckenmiller, H.; Tapia, H.; Hsiang, S. Global high-resolution estimates of the UN Human Development Index using satellite imagery and machine learning. Nat. Commun. 2026, 17, 1315. [Google Scholar] [CrossRef] [PubMed]
  7. Yong, Z.; Li, K.; Xiong, J.; Cheng, W.; Wang, Z.; Sun, H.; Ye, C. Integrating DMSP-OLS and NPP-VIIRS Nighttime Light Data to Evaluate Poverty in Southwestern China. Remote Sens. 2022, 14, 600. [Google Scholar] [CrossRef]
  8. Li, M.; Lin, J.; Ji, Z.; Chen, K.; Liu, J. Grid-Scale Poverty Assessment by Integrating High-Resolution Nighttime Light and Spatial Big Data—A Case Study in the Pearl River Delta. Remote Sens. 2023, 15, 4618. [Google Scholar] [CrossRef]
  9. Shao, Z.; Li, X. Multi-scale estimation of poverty rate using night-time light imagery. Int. J. Appl. Earth Obs. Geoinf. 2023, 121, 103375. [Google Scholar] [CrossRef]
  10. Dorji, U.; Siripanpornchana, C.; Surasvadi, N.; Plangprasopchok, A.; Thajchayapong, S. Exploring Night Light as Proxy for Poverty and Income Inequality Approximation in Thailand. In Conference Exploring Night Light as Proxy for Poverty and Income Inequality Approximation in Thailand; IEEE: New York, NY, USA, 2019; pp. 1082–1087. [Google Scholar]
  11. Andries, A.; Morse, S.; Murphy, R.J.; Sadhukhan, J.; Martinez-Hernandez, E.; Amezcua-Allieri, M.A.; Aburto, J. Potential of Using Night-Time Light to Proxy Social Indicators for Sustainable Development. Remote Sens. 2023, 15, 1209. [Google Scholar] [CrossRef]
  12. Liu, T.; Yu, L.; Chen, X.; Li, X.; Du, Z.; Yan, Y.; Peng, D.; Gong, P. Utilizing nighttime light datasets to uncover the spatial patterns of county-level relative poverty-returning risk in China and its alleviating factors. J. Clean. Prod. 2024, 448, 141682. [Google Scholar] [CrossRef]
  13. Gu, Z.; Zhao, X.; Huang, P.; Pu, J.; Shi, X.; Li, Y. Identification of Multi-Dimensional Relative Poverty and Governance Path at the Village Scale in an Alpine-Gorge Region: A Case Study in Nujiang, China. Int. J. Environ. Res. Public Health 2023, 20, 1286. [Google Scholar] [CrossRef] [PubMed]
  14. Zhang, J.; Shi, J.; Li, Y.; Li, Z.; Baloch, M.A. Performance-Evaluation Index for Precision Poverty Alleviation in China’s Shaanxi Province. Sage Open 2023, 13, 21582440231194219. [Google Scholar] [CrossRef]
  15. Wang, M.; Wang, Y.; Teng, F.; Li, S.; Lin, Y.; Cai, H. China’s poverty assessment and analysis under the framework of the UN SDGs based on multisource remote sensing data. Geo-Spat. Inf. Sci. 2024, 27, 111–131. [Google Scholar]
  16. Hu, S.; Ge, Y.; Liu, M.; Ren, Z.; Zhang, X. Village-level poverty identification using machine learning, high-resolution images, and geospatial data. Int. J. Appl. Earth Obs. Geoinf. 2022, 107, 102694. [Google Scholar] [CrossRef]
  17. Li, L.; Hu, T.; Yang, G.; He, W.; Zhang, H. High-resolution comprehensive regional development mapping using multisource geographic data. Sustain. Cities Soc. 2024, 113, 105670. [Google Scholar] [CrossRef]
  18. Ma, D.; Chang, R.; Tan, J.; Zhang, F.; Yan, Y.; Guo, Z.; An, B.; Zhang, J. How high-quality development varies in China—A case study of Chongqing based on the EIORES-DEA model. Humanit. Soc. Sci. Commun. 2026, 13, 189. [Google Scholar] [CrossRef]
  19. Wang, Z.; Zhou, H.; Zheng, X.; Yang, X. Unveiling the spatial patterns and drivers of urban land use in a mountainous urban agglomeration: Evidence from the Chengdu-Chongqing economic zone (CCEZ), China. City Environ. Interact. 2026, 29, 100317. [Google Scholar] [CrossRef]
  20. Yang, S.; Yang, Z.; Yang, R.; Cai, X. Analysis of the Spatio-Temporal Evolution, Influencing Factors, and Spillover Effects of the Urban–Rural Income Gap in Chongqing Municipality, China. Agriculture 2023, 13, 907. [Google Scholar] [CrossRef]
  21. Zhang, Q.; Li, T.; Tan, X.; Yan, J. Protecting Poor Rural Households from Health Shocks: Poverty Alleviation Practices in Chongqing, China. Land 2023, 12, 969. [Google Scholar] [CrossRef]
  22. Zheng, X.; Zhang, W.; Deng, H.; Zhang, H. County-Level Poverty Evaluation Using Machine Learning, Nighttime Light, and Geospatial Data. Remote Sens. 2024, 16, 962. [Google Scholar] [CrossRef]
  23. Shi, K.; Chang, Z.; Chen, Z.; Wu, J.; Yu, B. Identifying and evaluating poverty using multisource remote sensing and point of interest (POI) data: A case study of Chongqing, China. J. Clean. Prod. 2020, 255, 120245. [Google Scholar] [CrossRef]
  24. JPL N. NASA SRTM Image Mosaic Global 1 arc second V001. NASA EOSDIS Land Processes Distributed Active Archive Center (DAAC) data set. 2020:NASADEM_SIM. 001. Available online: https://www.earthdata.nasa.gov/data/catalog/lpcloud-nasadem-sim-001 (accessed on 10 May 2026).
  25. Didan, K. MODIS/Terra Vegetation Indices 16-Day L3 Global 500m SIN Grid V061; NASA Land Processes Distributed Active Archive Center: Sioux Falls, SD, USA, 2021. [Google Scholar]
  26. Friedl, M.; Sulla-Menashe, D. Modis/Terra+ Aqua Land Cover Type Yearly l3 Global 500m Sin Grid V061; NASA EOSDIS Land Processes Distributed Active Archive Center: Sioux Falls, SD, USA, 2022; p. 61. [Google Scholar]
  27. OpenStreetMap. OpenStreetMap; OpenStreetMap Foundation: Cambridge, UK, 2024.
  28. Zare Banadkouki, M.R. Selection of strategies to improve energy efficiency in industry: A hybrid approach using entropy weight method and fuzzy TOPSIS. Energy 2023, 279, 128070. [Google Scholar] [CrossRef]
  29. Liu, H.; Lu, G.; Luo, K.; Zong, H. Measurement and Spatio–Temporal Pattern Evolution of Urban–Rural Integration Development in the Chengdu-Chongqing Economic Circle. Land 2024, 13, 942. [Google Scholar] [CrossRef]
  30. Chen, X.; Wang, H. Spatial–Temporal Evolution and Driving Factors of Industrial Land Marketization in Chengdu–Chongqing Economic Circle. Land 2024, 13, 972. [Google Scholar] [CrossRef]
  31. Wen, H.; Huang, J.; Qian, L.; Li, Z.; Zhang, Y.; Zhang, J. The spatial-temporal evolution patterns of landslide-oriented resilience in mountainous city: A case study of Chongqing, China. J. Environ. Manag. 2024, 370, 122963. [Google Scholar] [CrossRef]
  32. Liu, Y.; Zhou, T.; Yu, W. Analysis of Changes in Ecological Environment Quality and Influencing Factors in Chongqing Based on a Remote-Sensing Ecological Index Mode. Land 2024, 13, 227. [Google Scholar] [CrossRef]
  33. Wang, Y.; Hu, W.; Liu, X. Production of space in rural China: Village revitalization and cultural landscape transformation in Chongqing, China. J. Asian Archit. Build. Eng. 2026, 25, 1912–1927. [Google Scholar]
  34. Shen, Y.; Sargani, G.R.; Wang, R.; Jing, Y. Unveiling the Spatio-Temporal Dynamics and Driving Mechanism of Rural Industrial Integration Development: A Case of Chengdu–Chongqing Economic Circle, China. Agriculture 2024, 14, 884. [Google Scholar] [CrossRef]
  35. An, M.; Xu, W.; Wang, X.; He, W.; Fang, X.; Song, M.; Wang, B. Synergetic evolution of energy-economy-environment-society system: A case study of Chengdu-Chongqing urban agglomeration, China. Energy Strategy Rev. 2025, 59, 101755. [Google Scholar]
  36. Wan, J.; Ma, C.; Jiang, T.; Phillips, A.; Wu, X.; Wang, Y.; Wang, Z.; Cao, Y. A spatial econometric investigation into road traffic accessibility and economic growth: Insights from the Chengdu-Chongqing twin-city economic circle. Humanit. Soc. Sci. Commun. 2024, 11, 183. [Google Scholar] [CrossRef]
  37. Ye, X.; Ma, L.; Ye, K.; Chen, J.; Xie, Q. Analysis of Regional Inequality from Sectoral Structure, Spatial Policy and Economic Development: A Case Study of Chongqing, China. Sustainability 2017, 9, 633. [Google Scholar] [CrossRef]
Figure 1. Three economic zones of Chongqing Municipality.
Sustainability 18 07671 g001
Figure 2. Spatial distribution of different data sources in Chongqing Municipality in 2016.
Sustainability 18 07671 g002
Figure 3. DII classification maps of counties in Chongqing Municipality for different study years.
Sustainability 18 07671 g003
Figure 4. Correlation analysis between DII and CSDI for different study years.
Sustainability 18 07671 g004
Figure 5. Spatial validation of CSDI in 2020 using Google Earth imagery.
Sustainability 18 07671 g005
Figure 6. Regression analysis between CSDI and different factors in 2014.
Sustainability 18 07671 g006
Figure 7. Spatial distribution maps of CSDI for different study years.
Sustainability 18 07671 g007
Table 1. Description of datasets used in this study.
DataTemporal ResolutionSpatial ResolutionDescription
NTLAnnual15 arc-secNighttime Light
POIAnnualVector pointsPoints of interest
DEM250 mDigital Elevation Model
NDVI16-Day500 mNormalized Difference Vegetation Index
BoundaryVector polygonsAdministrative boundary vector data
Statistical dataAnnualCountySocioeconomic indicators
LandcoverAnnual500 mLand cover classification
Road networkAnnualVector linesRoad network data
Table 2. Differences between DII-based rankings and GDP-based rankings for counties from 2014 to 2020.
County2014201620182020
Yuzhong District+2+2+4+3
Jiangbei District+6+5+1+1
Yubei District−2−2−2−2
Jiulongpo District−2−2−2−2
Nan’an District+2+1+2+2
Shapingba District−2+2+23+23
Dadukou District+21+21+4+5
Beibei District+6+5+7+11
Banan District+2+2+1+2
Fuling District−4+5+6+3
Wanzhou District−6−6−7−6
Bishan District+4−8−4−6
Changshou District0−4−7−3
Yongchuan District−40−5−6
Jiangjin District−6−5−2−1
Tongliang District+3+21+3+2
Qianjiang District+7+2−3−2
Qijiang District−3−2−6−9
Hechuan District−7+6−1−3
Rongchang District−2−8+5+5
Dazu District−4+2+6+11
Wulong County+9+5+9+10
Yunyang County+4−5−6−6
Liangping County−2−3−3−4
Zhong County−2−8−2−1
Nanchuan District0+3−6−5
Dianjiang County−6−5+5+8
Wushan County+7+40−2
Fengdu County0−9−7−6
Fengjie County−5−4+7+7
Tongnan District−11−1−5−9
Chengkou County+5−8−2−4
Xiushan County−3+2−9−6
Shizhu County−20+10
Pengshui County−1−2−1−2
Wuxi County0000
Youyang County−4−6−4−6
Table 3. Development Intensity Index system and weight allocation.
IndicatorIndicatorWeight
Per capita GDPPositive0.07721
Per capita fixed asset investment of the whole societyPositive0.08338
Per capita RMB deposit balance of financial institutionsPositive0.47848
Recipients of minimum living allowances per 10,000 populationNegative0.00001
Per capita disposable income of all residentsPositive0.03655
Per capita living consumption expenditure of all residentsPositive0.03565
Teachers per 10,000 populationPositive0.03317
Hospital beds per 10,000 populationPositive0.08152
Average annual wage of employees in urban non-private unitsPositive0.01284
Students per 10,000 populationPositive0.03958
Proportion of areas with slope > 15°Negative0.12161
Table 4. DII values of counties in Chongqing Municipality from 2014 to 2020.
County2014201620182020
Wanzhou District0.03780.04410.04650.0486
Qianjiang District0.02760.03280.03440.0299
Fuling District0.03990.04620.05040.0519
Yuzhong District0.42770.50050.44730.4905
Dadukou District0.07700.08890.09990.0991
Jiangbei District0.20220.31930.48360.4737
Shapingba District0.08690.10210.10580.1047
Jiulongpo District0.09750.10570.11250.106
Nan’an District0.09130.09770.09800.0994
Beibei District0.05290.05990.06800.0738
Yubei District0.14310.17080.17390.1834
Banan District0.04250.05500.06030.0646
Changshou District0.03290.03900.04330.0513
Jiangjin District0.03080.03940.04680.0507
Hechuan District0.02570.03280.03750.0443
Yongchuan District0.03230.03870.04570.0471
Nanchuan District0.02190.03130.03530.038
Qijiang District0.02740.03420.03910.0359
Dazu District0.02420.02940.03330.0376
Bishan District0.03600.04730.05730.0596
Tongliang District0.02820.03490.04230.0484
Tongnan District0.01990.02560.03070.0317
Rongchang District0.02430.02990.03640.0403
Liangping District0.02300.02970.03200.0349
Chengkou County0.01870.03560.02790.0288
Fengdu County0.02130.02820.02950.0294
Dianjiang County0.02180.02630.02950.0309
Wulong County0.02350.01050.03340.032
Zhong County0.02300.03240.03200.0385
Yunyang County0.02310.02290.02670.0298
Fengjie County0.02130.02180.02570.0224
Wushan County0.02140.02160.02430.0232
Wuxi County0.01680.01990.02320.0257
Shizhu County0.01740.02580.03000.0315
Xiushan County0.01850.02220.02640.0228
Youyang County0.01520.02060.02340.0205
Pengshui County0.01700.02090.02270.0218
Disclaimer/Publisher’s Note: The statements, opinions and data contained in all publications are solely those of the individual author(s) and contributor(s) and not of MDPI and/or the editor(s). MDPI and/or the editor(s) disclaim responsibility for any injury to people or property resulting from any ideas, methods, instructions or products referred to in the content.