Article

Discourse Patterns in Sustainable Development Partnerships: An Unsupervised Machine Learning Analysis of the GENESIS Multistakeholder Partnership Database

1
Department of Electronics and Automation, Balıkesir Vocational School, Balıkesir University, Balıkesir 10145, Türkiye
2
Quality Coordination Office, Bursa Technical University, Bursa 16310, Türkiye
*
Author to whom correspondence should be addressed.
Sustainability 2026, 18(15), 7638; https://doi.org/10.3390/su18157638
Submission received: 15 June 2026 / Revised: 22 July 2026 / Accepted: 24 July 2026 / Published: 27 July 2026

Abstract

Multistakeholder partnerships (MSPs) are central to the 2030 Agenda for Sustainable Development, yet the UN Partnership Platform suffers from an extreme validation asymmetry: fewer than 5% of registered projects undergo independent verification. This study examines whether discourse patterns distinguish validated from non-validated MSPs. Applying BERTopic neural topic modeling to 3807 project descriptions in the GENESIS WP4 Database, we identify three substantive thematic clusters, spanning climate, sanitation, and health; marine and fisheries; and sustainable textiles, alongside a combined language–artifact cluster excluded from thematic interpretation. The target topic count was fixed to ensure reproducibility after an initial automatic-selection step proved unstable across runs; a multi-seed check confirms stable topic counts with moderate assignment-level agreement (mean Adjusted Rand Index = 0.63). We introduce the Validated-Discourse Similarity Index (VDSI), a leave-one-out cosine similarity measure comparing each project’s textual embedding to a centroid of validated MSPs shown to be more homogeneous than random samples of non-validated projects (p = 0.002). VDSI analysis indicates that 3538 of the 3807 projects (92.9%) exhibit Inconsistent Non-Validated language resembling validated MSPs despite lacking independent verification, though raw semantic similarity alone only modestly discriminates validation status (AUC = 0.686), indicating a real but partial signal rather than a proxy for validation. Partner count is the strongest structural discriminator of validated MSPs (r = −0.389, p < 0.001), remaining significant after adjusting for SDG scope, description length, duration, topic, and language (adjusted OR = 1.38 per SD, p < 0.001), and consistent across six SDG-level subgroups. These findings extend SDG-washing scholarship to the UN multilateral voluntary commitment ecosystem and offer a provisional, discourse-informed basis for partnership evaluation.

1. Introduction

The 2030 Agenda for Sustainable Development, adopted by the United Nations General Assembly in September 2015, positioned multistakeholder partnerships as essential governance instruments to bridge implementation gaps left by state-led multilateralism. SDG 17, specifically Target 17.16, calls upon governments, international organizations, civil society, and the private sector to forge collaborative arrangements that mobilize and share knowledge, expertise, technology, and financial resources in pursuit of the global goals [1]. In the decade that followed, the UN Partnership Platform registered thousands of voluntary commitments. However, scholars have noted that the platform suffers from significant data inconsistencies and a lack of effective monitoring, with many registered initiatives failing to meet minimum partnership criteria [2]. Indeed, an analysis of the platform reveals an extreme validation asymmetry: fewer than five percent of registered projects have achieved independent validation, designated as Checked-In status.
Throughout this study, we use validated to refer to projects assigned Checked-In status on the UN Partnership Platform, meaning an independent reviewer has completed the platform’s administrative verification process, and non-validated for projects with Checked-Out status, which remain registered but have not undergone this independent confirmation. Checked-Out status does not imply that a partnership is inactive, illegitimate, or fraudulent; it indicates only the absence of independent verification, which may reflect resource constraints in the review process as much as any property of the partnership itself. This validation asymmetry raises a fundamental governance question: to what extent does the language of partnership commitments reflect the platform’s own criteria for multistakeholder collaboration? The concept of SDG washing, whereby organizations project ambitions aligned with the SDGs without undertaking substantive action, has received growing scholarly attention. Heras-Saizarbitoria, et al. [3] documented cherry-picking among 1370 organizations across 97 countries, finding superficial SDG engagement characteristic of symbolic reporting. van Zanten and van Tulder [4] argued that many corporate strategies treat individual SDGs as isolated silos rather than as components of a systemic sustainability commitment. Costa, et al. [5] extended this line of inquiry to a cross-sectoral analysis, distinguishing between SDG walking and SDG washing through discrepancy indices applied to Global Reporting Initiative data. However, these studies focus almost exclusively on corporate sustainability reporting. The analogous phenomenon within the UN partnership ecosystem, in which voluntary commitments may employ partnership language that diverges from independently verified partnership status, has not been examined computationally at scale.
The present study addresses this gap through an unsupervised machine learning analysis of the GENESIS database. Matsui, et al. [6] demonstrated that BERT-based classifiers can accurately map organizational practices and challenges onto SDG goals, and applications of BERTopic have charted thematic landscapes in sustainable finance literature [7]. Nevertheless, no prior study has deployed neural topic modeling on the UN Partnership Platform corpus to examine whether discourse patterns distinguish validated from non-validated MSPs.
We make three principal contributions. First, we apply BERTopic, integrating Sentence-BERT embeddings [8], UMAP dimensionality reduction [9], and HDBSCAN density-based clustering [10,11], to characterize the thematic architecture of UN SDG partnership commitments. Second, we introduce the Validated-Discourse Similarity Index (VDSI). This is a leave-one-out cosine similarity measure that operationalizes the similarity between a project’s textual embedding and the centroid of validated partnerships. Third, we conduct systematic SDG-level subgroup analyses with false discovery rate correction [12], yielding actionable insights for partnership evaluation practice. The topic-modeling component of this analysis required fixing the target topic count to ensure reproducibility, since automatic topic-count selection proved unstable across runs; even under this fixed target, document-to-topic assignment retains moderate sensitivity to random initialization. The VDSI findings that anchor our central contribution, by contrast, do not depend on the specific topic partition and are stable under resampling. This distinction shapes how the findings should be read: as evidence of a real and policy-relevant pattern, not as a claim that the platform’s textual landscape has been definitively mapped. The remainder of this article is structured as follows. Section 2 reviews the relevant literature. Section 3 describes the data and methods. Section 4 presents the results. Section 5 discusses the findings. Section 6 concludes.

2. Literature Review

Multistakeholder partnerships for sustainable development emerged as a mainstream governance instrument through two decades of iterative institutionalization. At the 2002 World Summit on Sustainable Development in Johannesburg, voluntary Type II partnerships were recognized as a complement to intergovernmental outcomes [13]. Glass, Newig, and Ruf [2] conducted a systematic survey of 192 MSPs registered on the platform, analyzing governance architecture, partner composition, and SDG coverage, and found that partnerships vary considerably in their institutional depth and functional contribution. While partnerships involving actors from multiple societal sectors are potentially more effective than those involving a single sector, MSPs still have untapped potential to leverage shared resources and capabilities to address complex interactions among the SDGs, particularly those prone to negative spillovers [2].
The theoretical underpinnings of MSP scholarship draw on at least three intellectual traditions. In global governance theory, partnerships are analyzed as mechanisms that address real or perceived deficits created by traditional multilateral processes. Andonova [14] demonstrated empirically that international organizations act as governance entrepreneurs, selectively catalyzing public–private partnerships in domains where structural conditions permit coalition formation. Pattberg and Widerberg [15] identified nine conditions for MSP success, including a clear division of responsibilities, adequate funding, and robust monitoring mechanisms, noting that the evidence base for positive partnership performance remains thin compared with the aspirational discourse surrounding these instruments. Biermann, et al. [16] outlined the urgent institutional reforms required for effective earth system governance to navigate planetary boundaries, with MSPs playing an increasingly critical role in implementation. In contrast, the earlier analysis by Biermann, et al. [17] of fragmentation in global governance architectures provides the context within which partnership proliferation generates coordination challenges.
From an institutional theory perspective, partnerships are examined through the lens of organizational sociology, with scholars distinguishing between substantive engagement and symbolic conformity, in which the formal adoption of SDG language serves legitimating purposes without altering organizational behavior. Bäckstrand [18] argued that the legitimacy, accountability, and effectiveness of multistakeholder partnerships must be assessed through independent criteria rather than self-referential declarations of intent. Westerman, et al. [19] showed that when employees perceive a gap between espoused sustainability values and enacted practices, cynicism escalates, suggesting that aspiration–realization gaps have consequences that extend beyond external reputational management. In political economy, the voluntary, non-binding nature of UN partnership commitments has been critiqued as a source of accountability deficits, allowing powerful actors to shape global sustainability agendas without democratic oversight [20]. Widerberg and Pattberg [21] further argued that overcoming the accountability challenges inherent in transnational governance regimes requires structuring evaluation mechanisms around verifiable performance criteria rather than self-reported commitments.
The phenomenon of SDG washing has attracted increasing theoretical and empirical scrutiny. van Zanten and van Tulder [4] proposed the nexus approach as a corrective, compelling companies to assess interactions across the full SDG system rather than selectively engaging with goals aligned with existing operations. Heras-Saizarbitoria, Urbieta, and Boiral [3] documented SDG cherry-picking in 1370 sustainability reports, showing that organizations disproportionately reference SDGs already addressed in their core business activities. Costa, Tiburzi, Morales-Alonso, Calabrese, and Rosati [5] operationalized this distinction through two complementary indices, demonstrating systematic discrepancies indicative of symbolic reporting in a cross-sectoral sample. None of these studies examined the UN Partnership Platform ecosystem, where the institutional context, comprising voluntary registration, minimal entry requirements, and inconsistent monitoring, may amplify aspiration–realization gaps.
Text mining and natural language processing have emerged as powerful tools for analyzing sustainability discourse at scale. The workhorse of classical topic modeling, Latent Dirichlet Allocation (LDA), introduced by Blei, et al. [22], models documents as mixtures of latent topics, each characterized by a word-probability distribution. While LDA has been widely applied in sustainability research and SDG-related topic mapping, it treats words as exchangeable bags and cannot capture semantic similarity. The introduction of BERT (Bidirectional Encoder Representations from Transformers) [23] and Sentence-BERT [8] overcame this limitation by representing text as dense vectors encoding contextual meaning. BERTopic leverages these embeddings through a modular pipeline that applies UMAP for dimensionality reduction [9] and HDBSCAN for density-based clustering [10], extracting topic representations using a class-based term frequency–inverse document frequency procedure. Egger and Yu [24] benchmarked BERTopic against LDA, non-negative matrix factorization, and Top2Vec on Twitter data, finding that BERTopic offers the greatest potential among embedding-based models for generating novel insights and achieving high interpretability in short-text social science contexts.
Applications of BERTopic to sustainability and governance topics have expanded rapidly. Raman, Ray, Das, and Nedungadi [7] employed BERTopic to map the landscape of sustainable and green finance literature onto SDG clusters. Matsui, Suzuki, Ando, Kitai, Haga, Masuhara, and Kawakubo [6] demonstrated that BERT-based semantic mapping can classify organizational sustainability practices to SDG goals with high accuracy. Lee, et al. [25] applied BERTopic to compare academic and media framings of environmental, social, and governance themes. These studies establish the methodological viability of neural topic modeling for sustainability governance analysis but have not been directed at the UN Partnership Platform corpus.
The SDG-level heterogeneity of partnership engagement has received attention. van Zanten and van Tulder [4] documented asymmetric corporate engagement across the SDGs, noting that companies tend to prioritize economic growth and industrialization while systematically under-representing goals focused on the biosphere. Similarly, Glass, Newig, and Ruf [2] showed that climate action, quality education, and gender equality attract disproportionate MSP attention. Furthermore, Andonova, et al. [26] demonstrated at the national policy level that transnational governance arrangements and domestic policies function as complements rather than substitutes, underscoring that structural institutional investment amplifies rather than replaces formal commitment. This pattern of symbolic alignment without corresponding substantive change echoes a broader family of ‘decoupling’ phenomena documented across organizational and environmental governance research: greenwashing, bluewashing (symbolic UN Global Compact membership without behavioral change), and more generally the gap between adopted policy and implemented practice that institutional theorists have long identified as a feature of organizations operating under external legitimacy pressure. What distinguishes the present setting is that the UN Partnership Platform is not a corporate disclosure regime but a multilateral governance infrastructure: the “audience” being addressed through partnership language is not shareholders or consumers but the intergovernmental process itself, and the accountability mechanism (independent validation) is built into the platform rather than externally imposed. This positions VDSI as a measure of the discourse-level dimension of decoupling within a governance-accountability system that already possesses, but underutilizes, a verification mechanism, rather than as a call for external regulation of a previously unaccountable domain. These threads point to a common construct: what Bäckstrand [18] terms accountability through independent criteria, Widerberg and Pattberg [21] frame as evaluation grounded in verifiable performance rather than self-reported commitments, and Westerman, Acikgoz, Nafees, and Westerman [19] link to the erosion of legitimacy when espoused values diverge from enacted practice. Read together, these strands define governance accountability as the requirement that legitimacy claims be anchored in externally verifiable performance rather than self-description, a requirement the UN Partnership Platform formally provides through its validation mechanism but, as our findings show, substantially underutilizes. Our analysis extends these observations to the full GENESIS corpus, examining whether the structural advantage of validated MSPs varies systematically across SDGs.
While the preceding discussion situates governance accountability within multistakeholder partnership scholarship, this construct has been most extensively theorized in the corporate sustainability reporting literature, from which the UN Partnership Platform’s validation mechanism can usefully be read as a structural analogue. Cho, et al. [27] argue that firms facing conflicting stakeholder and institutional pressures are structurally compelled toward organized hypocrisy, in which sustainability talk and organizational façades substitute for substantive practice change without this necessarily reflecting deliberate deception. This concept parallels the interpretive caution this study adopts toward the Inconsistent Non-Validated finding: symbolic alignment can arise as a structural response to institutional pressure rather than as evidence of intentional washing. Mandatory disclosure regimes were developed partly to counter this tendency; Christensen, et al. [28] review the economic evidence on mandated sustainability disclosure, noting that frameworks such as the EU’s Non-Financial Reporting Directive shift firms from voluntary, self-selected disclosure toward standardized, externally structured reporting, though they characterize the causal evidence on whether such mandates improve substantive outcomes as still scarce. Mezzanotte [29] shows that even under the EU’s subsequent Corporate Sustainability Reporting Directive and its double-materiality framework, the assessment of which impacts are material remains substantially discretionary, creating legal and interpretive uncertainty analogous to the ambiguity this study identifies in the UN Partnership Platform’s undocumented Checked-In criteria. Complementary reporting mechanisms have shown mixed capacity to close this gap: de Villiers, et al. [30], synthesizing research from an AAAJ special issue on integrated reporting, note that its adoption has in some documented cases been driven as much by ongoing legitimacy struggles as by the substantive integration of financial and non-financial performance narratives it was designed to achieve. Most directly relevant to the present findings, Roszkowska-Menkes, et al. [31] show empirically that neither adherence to Global Reporting Initiative guidelines nor third-party assurance meaningfully reduces selective disclosure of negative sustainability events, indicating that even codified, externally verifiable transparency mechanisms do not reliably convert a validation infrastructure into an assurance of substantive accountability. This body of work suggests that the UN Partnership Platform’s own validation mechanism, though similar in design to these corporate transparency instruments, is likely to be similarly limited in its capacity to ensure that discourse patterns reliably track independently verified partnership status.

3. Materials and Methods

3.1. Data Source and Pre-Processing

The primary data source is the GENESIS WP4 Database on Multistakeholder Partnerships [32]. After filtering for records with insufficient textual content, defined as a combined project title and description length of 100 characters or fewer, the analytical corpus comprised 3807 documents, excluding 170 records (4.3%) that contained only placeholder or administrative entries such as single-character fields or boilerplate phrases. Validation status is the binary outcome of primary substantive interest: projects classified as Checked-In (n = 153; 4.0%) have completed the platform’s independent verification process. The Checked-Out group (n = 3654; 96.0%) is registered but not yet validated. Stibbe and Prescott [33] provide the normative framework against which validation criteria are benchmarked. The authors adopt this framework as a conceptual reference point; the platform’s internal review procedure itself is not publicly documented. To prevent data leakage, validation status and all variables derived from it were constructed post hoc and never used as inputs to the unsupervised modeling pipeline. The 170 excluded records did not differ significantly from the retained corpus in validation rate (4.12% vs. 4.02%; Fisher’s exact p = 0.843) or SDG scope (p = 0.105), though they had significantly fewer partners on average (3.25 vs. 4.99; rank-biserial r = 0.156, p < 0.001), indicating the length-based filter modestly under-represents larger partnerships rather than being compositionally neutral. A chi-square test of Type of Partnership and Type of project, the two structured categorical fields available in the raw dataset in the absence of a country/region variable, likewise showed no significant compositional difference between excluded and retained records (both p > 0.09), supporting the exclusion’s neutrality with respect to partnership type, if not partner count.
The GENESIS database does not include a structured country, region, or economic-sector field, and free-text geographic mentions within Partners/Description were not extracted via named-entity recognition; consequently, geographic and sectoral representativeness could not be directly tested (see Section 5.5 for the implications of this constraint).

3.2. Sentence Embedding

Project descriptions were encoded as 384-dimensional dense vectors using the all-MiniLM-L6-v2 model from the Sentence Transformers library (version 5.6.0) [8,34]. This model offers a favorable balance between semantic expressiveness and computational efficiency and has been widely adopted for textual embedding in recent BERTopic applications [7].

3.3. Dimensionality Reduction via UMAP

High-dimensional embeddings (384 dimensions) were reduced to five dimensions using UMAP (Uniform Manifold Approximation and Projection; version 0.5.12; n_neighbors = 15, n_components = 5, metric = cosine, min_dist = 0.0) [9]. Five output dimensions were retained to preserve sufficient structural information for accurate cluster identification. A separate two-dimensional UMAP projection was computed solely for visualization purposes. Both runs used random_state = 42 for reproducibility, and single-threaded nearest-neighbor search (n_jobs = 1) to eliminate run-to-run non-determinism arising from parallel floating-point summation order, which was observed to affect downstream topic-count stability.

3.4. BERTopic Clustering and Topic Modeling

Topic modeling was performed using BERTopic (version 0.16.4) with HDBSCAN (Hierarchical Density-Based Spatial Clustering of Applications with Noise) (version 0.8.44) as the clustering backend [10,11]. HDBSCAN was configured with cluster_selection_method = eom (Excess of Mass), metric = euclidean, and min_samples = max(3, min_topic_size // 3), and core_dist_n_jobs = 1 (single-threaded core-distance computation, to eliminate a further source of run-to-run non-determinism). Topic representations were extracted using class-based TF-IDF applied to a bigram CountVectorizer(ngram_range = (1,2), min_df = 3, max_df = 0.90, stop_words = english), falling back to min_df = 1 in the rare case that the reduced topic count made the default threshold infeasible. The key hyperparameter min_topic_size was selected through a grid search over {10, 15, 20, 30, 40}. Topic coherence was evaluated using the C_V coherence metric [35]. The number of topics was fixed at four (nr_topics = 4) rather than left to BERTopic’s automatic topic-merging procedure, after the latter was found to be a source of topic-count instability across otherwise-identical runs.

3.5. Validated-Discourse Similarity Index (VDSI)

The VDSI quantifies the extent to which a project’s textual embedding aligns with the semantic centroid of validated partnerships. A leave-one-out (LOO) centroid estimator prevents information leakage: for each validated partnership i, the reference centroid is the mean embedding of all other validated partnerships (nvalidated − 1). Representing validated partnerships by a single centroid presupposes that they form a reasonably coherent semantic group; we tested this assumption directly by comparing the mean within-group pairwise cosine similarity of validated projects against the same statistic computed over 500 random equal-size subsamples of non-validated projects. Raw cosine similarity scores were normalized to [0, 1] using a MinMaxScaler (scikit-learn, version 1.6.1) fitted exclusively on the non-validated distribution, so that the non-validated similarity range serves as the reference scale. This design choice was made deliberately: fitting the scaler to the non-validated distribution positions all non-validated projects within the [0, 1] interval, allowing their relative density within that interval to be interpreted directly. A StandardScaler approach was considered but rejected because it would not preserve the [0, 1] interpretability required for VDSI category thresholds; quantile normalization was similarly rejected as it would distort the distributional shape of the similarity scores.
Formally, VDSI is defined as:
VDSIi = sim_normi − yi
where sim_normi ∈ [0, 1] is the normalized cosine similarity of project i to the LOO centroid, and yi ∈ {0, 1} is the binary validation indicator. For non-validated projects (y = 0), VDSI equals sim_norm directly, measuring how closely a project’s language resembles validated-partnership discourse relative to the non-validated reference distribution. For validated projects (y = 1), subtracting unity shifts the scale so that negative values indicate a semantic shortfall relative to the validated reference standard. This asymmetric formulation encodes the expectation that validated partnerships should exhibit higher semantic proximity to the validated centroid than non-validated projects; the magnitude of VDSI quantifies the degree to which this expectation is met or violated. By construction, non-validated projects receive non-negative VDSI values and validated projects receive non-positive values; Section 4.4 reports a permutation test and ROC/AUC analysis on the raw, pre-normalization similarity scores to establish that this separation reflects a genuine, if partial, semantic signal rather than an artifact of the normalization convention.
Projects were classified into five VDSI categories using thresholds of ±0.30 (approximately one standard deviation of the non-validated similarity distribution): Inconsistent Non-Validated (non-validated, VDSI > 0.30), Inconsistent Validated (validated, VDSI < −0.30), Consistent Non-Validated (non-validated, VDSI ≤ 0.10), Consistent Validated (validated, VDSI ≥ −0.10), and Ambiguous (all others). Sensitivity of category assignments was examined over the range of ±0.20 to ±0.50.

3.6. Statistical Comparisons

Structural differences between validated and non-validated projects were assessed using Mann–Whitney U tests (scipy, version 1.16.3). Given the strong right-skew of partner count and SDG scope distributions, rank-biserial correlation (r) was used as the effect size measure, as it is the natural nonparametric counterpart to the Mann–Whitney U statistic and does not assume normality. Effect sizes were interpreted as large (|r| ≥ 0.50), medium (|r| ≥ 0.30), small (|r| ≥ 0.10), and negligible (|r| < 0.10). Multiple comparisons were corrected using the Benjamini–Hochberg false discovery rate procedure at alpha = 0.05 [12]. SDG-level subgroup analyses were conducted for SDGs 2, 3, 4, 6, 13, and 17, selected as the six goals with the largest representation in the corpus (each with n ≥ 1261 projects) and spanning the core thematic domains of the identified topic clusters; the same testing and correction framework was applied independently within each subgroup.
Because partner count, SDG scope, description length, and project duration are all right-skewed; median and interquartile range (IQR) are reported alongside means as more robust distributional summaries. To assess whether the univariate partner-count effect persists after adjusting for potential confounders, a multivariable logistic regression (statsmodels, version 0.14.6) predicted validation status from partner count, SDG scope, description length, project duration, topic assignment, and language-artifact status, with continuous predictors standardized (z-scored) prior to fitting; a class-weighted sensitivity model addressed the potential for bias under the corpus’s 4.0% validation base rate.
To assess the stability of the BERTopic solution, the model was refit across five random seeds and, separately, across alternative UMAP/HDBSCAN hyperparameters and an alternative sentence-embedding model, with agreement to the reference solution quantified via the Adjusted Rand Index (ARI).

4. Results

4.1. Corpus Descriptive Statistics

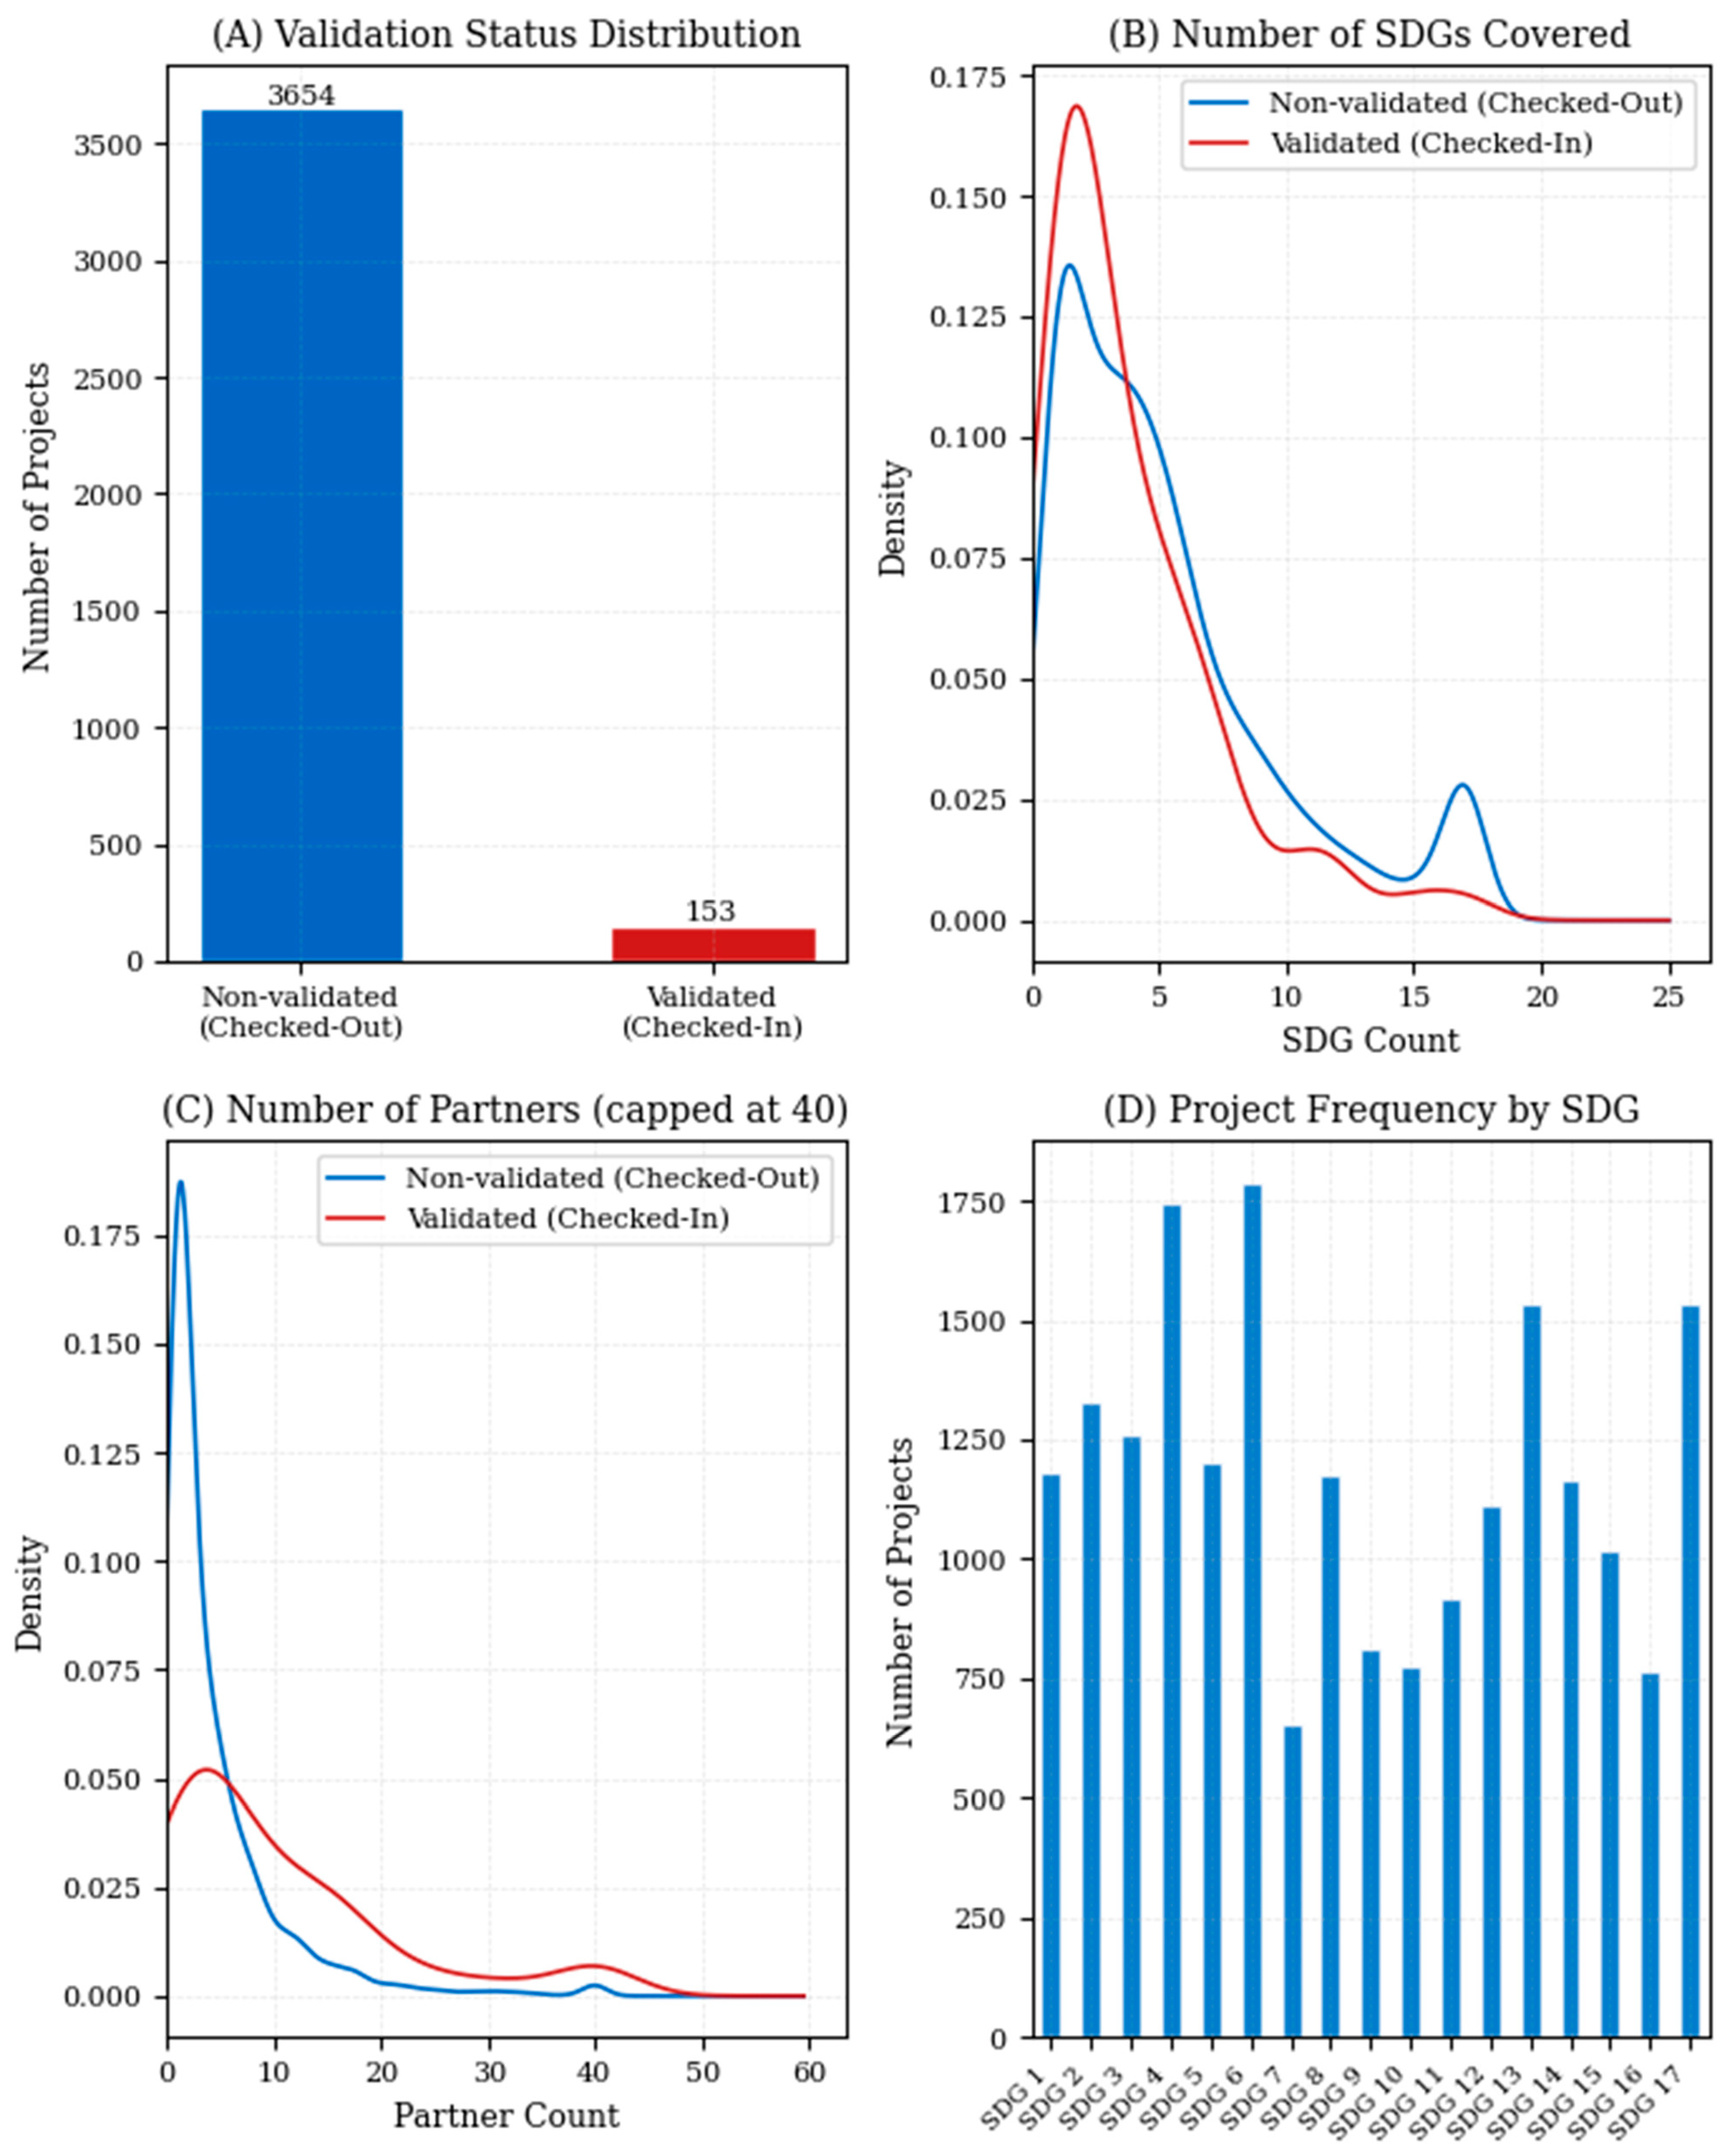
As shown in Figure 1, the analytical corpus of 3807 projects exhibits a highly unequal validation distribution: 3654 projects (96.0%) are non-validated, and 153 (4.0%) are independently validated. SDG coverage is heterogeneous, with SDGs 5 and 6 referenced most frequently. Partner count distributions are strongly right-skewed in both validation groups, with the upper tail substantially longer for validated partnerships. A chi-square comparison of Type of Partnership and Type of project, the two structured categorical fields available as proxies for sectoral composition in the absence of a country/region variable, showed a significant compositional difference between the language-artifact subset and the English-language corpus for both fields, suggesting the language-based exclusion is not fully neutral with respect to partnership type.

4.2. BERTopic Hyperparameter Selection and Topic Structure

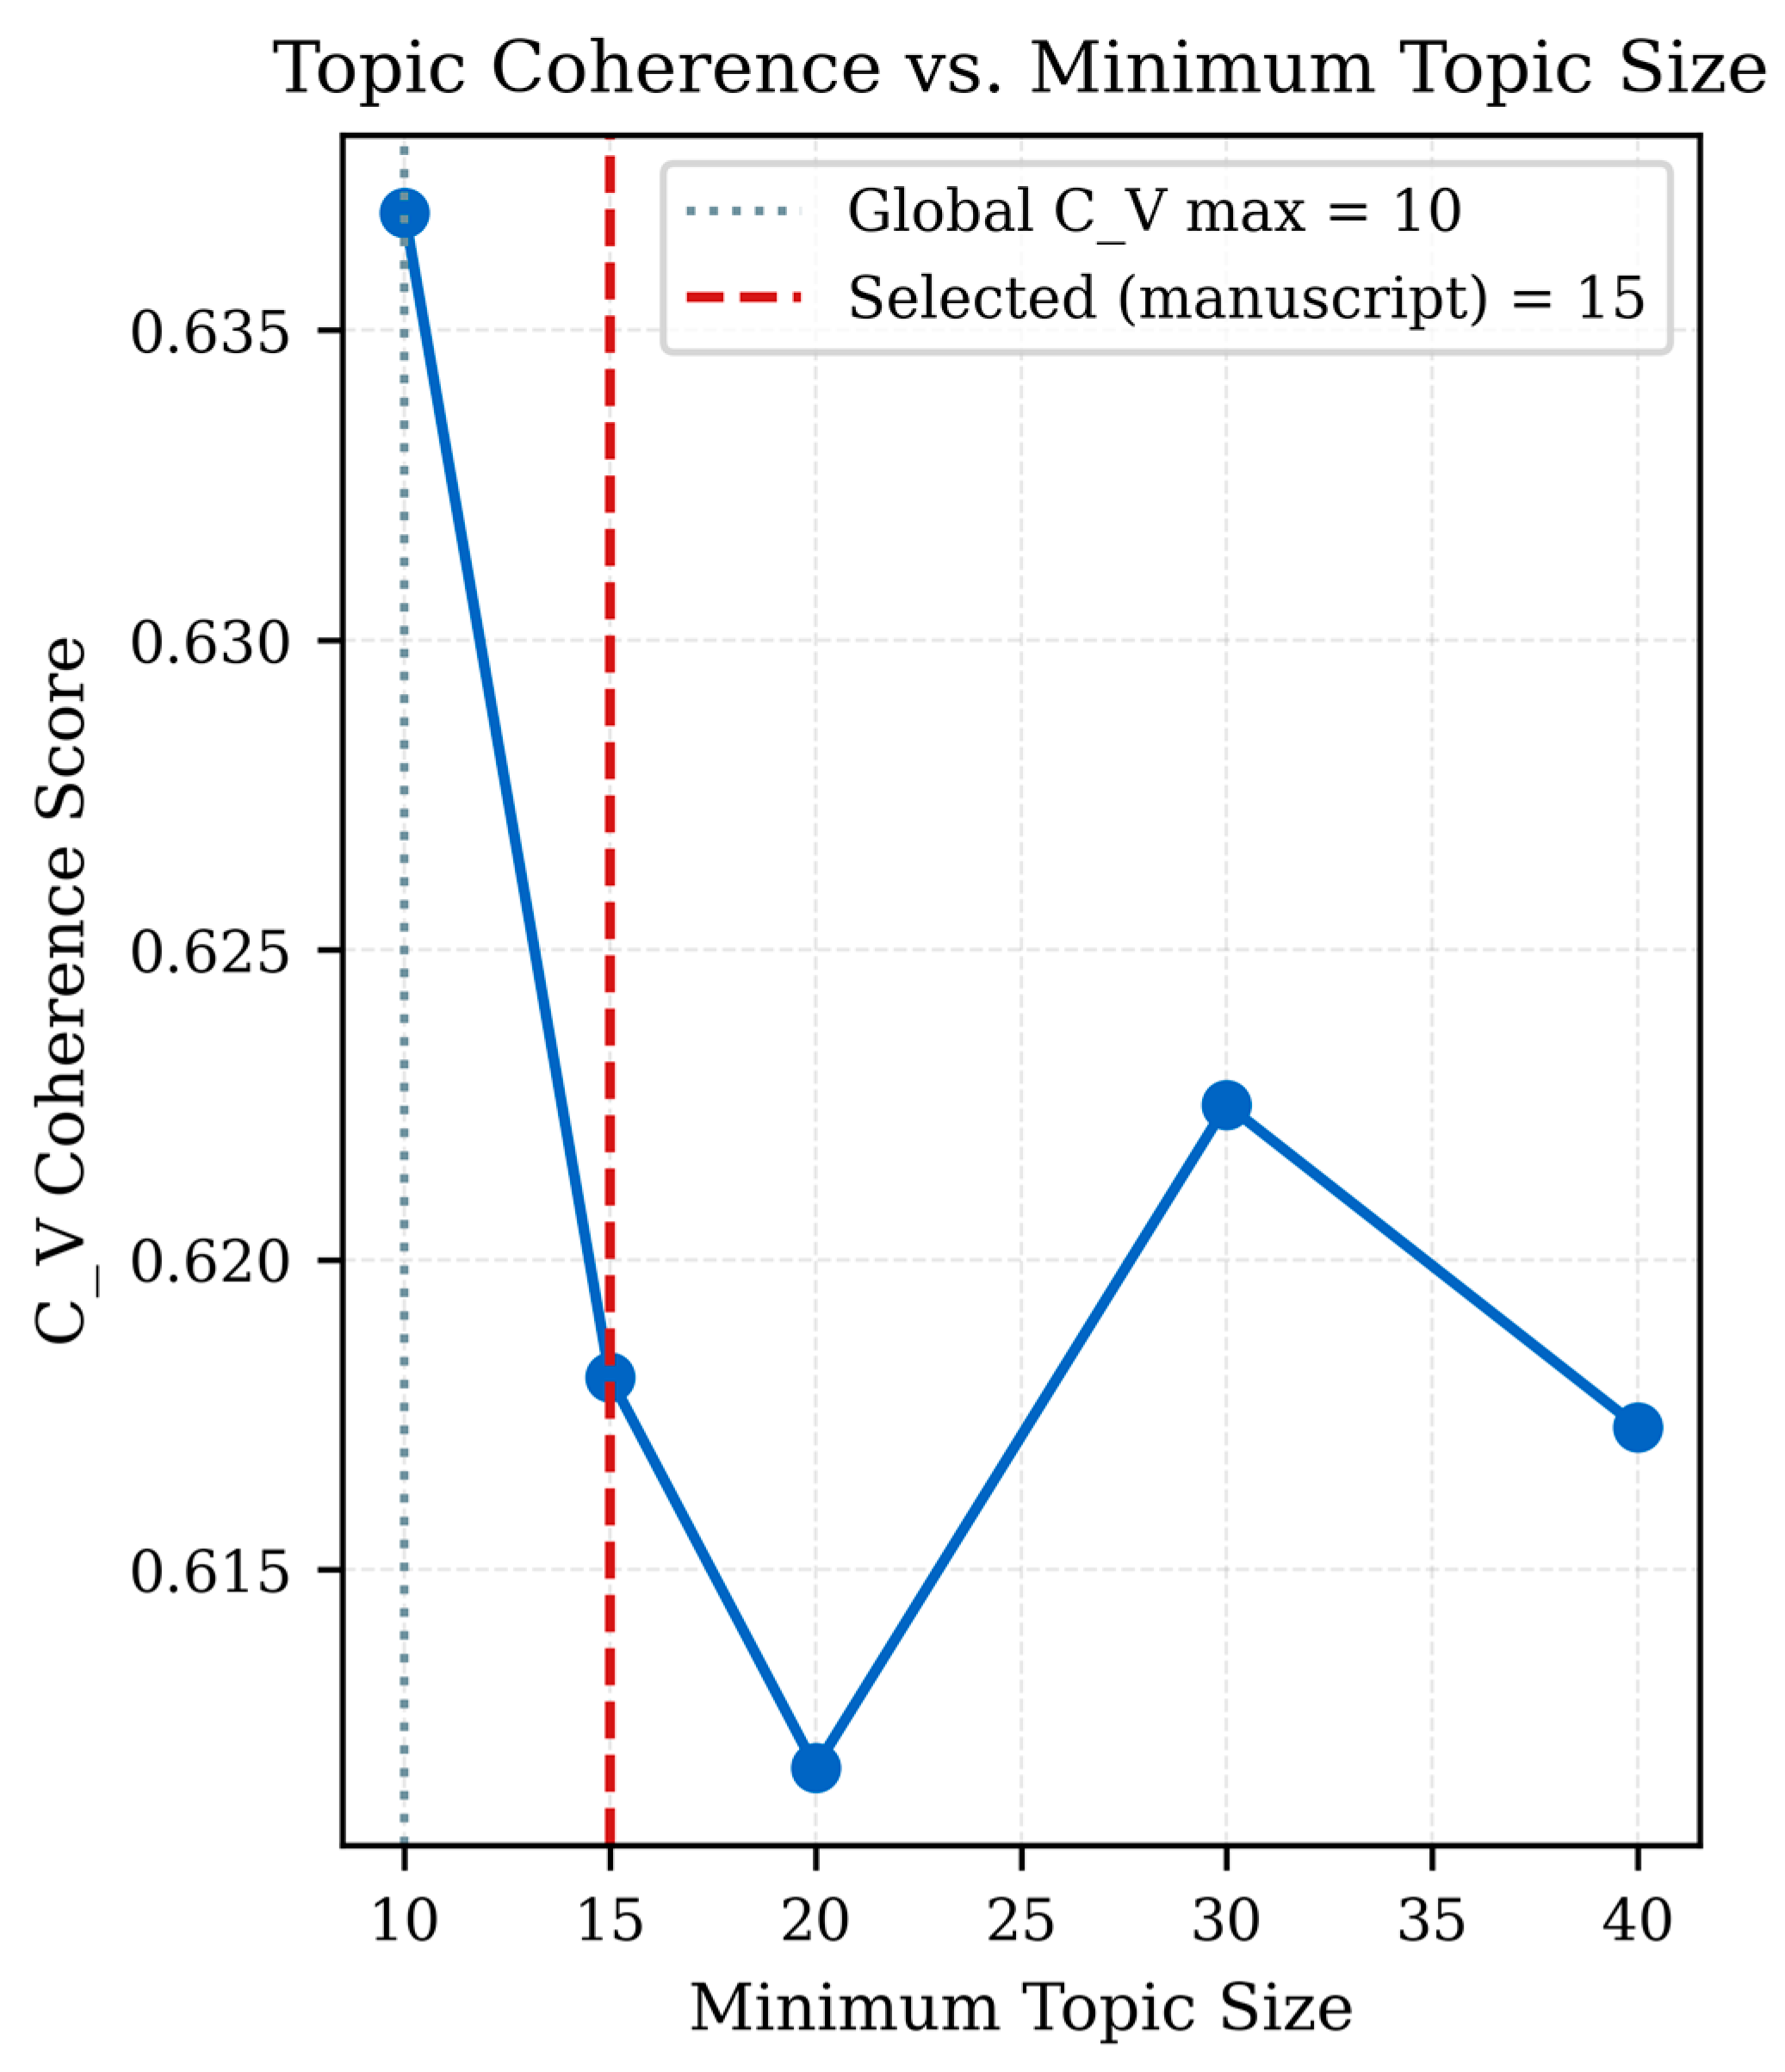
The coherence search consistently identified four topics across all tested values of min_topic_size (10, 15, 20, 30, 40), with C_V ranging from 0.612 (min_topic_size = 20) to 0.637 (the global maximum, at min_topic_size = 10; Figure 2). Because the topic count was stable across this range, min_topic_size = 15 was selected to preserve finer-grained cluster resolution rather than to maximize coherence per se. An earlier iteration of this pipeline found that BERTopic’s automatic topic-merging procedure was itself a source of run-to-run instability, independent of and in addition to HDBSCAN’s own documented sensitivity to small numerical perturbations in its parallel core-distance computation: near-threshold merge decisions in the hierarchical topic-reduction step could flip with microscopic floating-point differences propagated from upstream, yielding topic counts ranging from three to eight across otherwise-identical runs at min_topic_size = 15. To eliminate this instability, the target topic count was fixed explicitly (nr_topics = 4) rather than left to automatic merging. A formal multi-seed and multi-parameter stability analysis conducted under this fixed target confirms that topic count is now fully reproducible, while document-to-topic assignment retains moderate residual sensitivity to random initialization (mean Adjusted Rand Index = 0.63). The specific topic boundaries reported below should therefore be read as a stable, reproducible configuration at the assignment level of a single, fixed topic count, rather than as evidence that BERTopic’s default automatic topic-count selection would converge on the same solution.
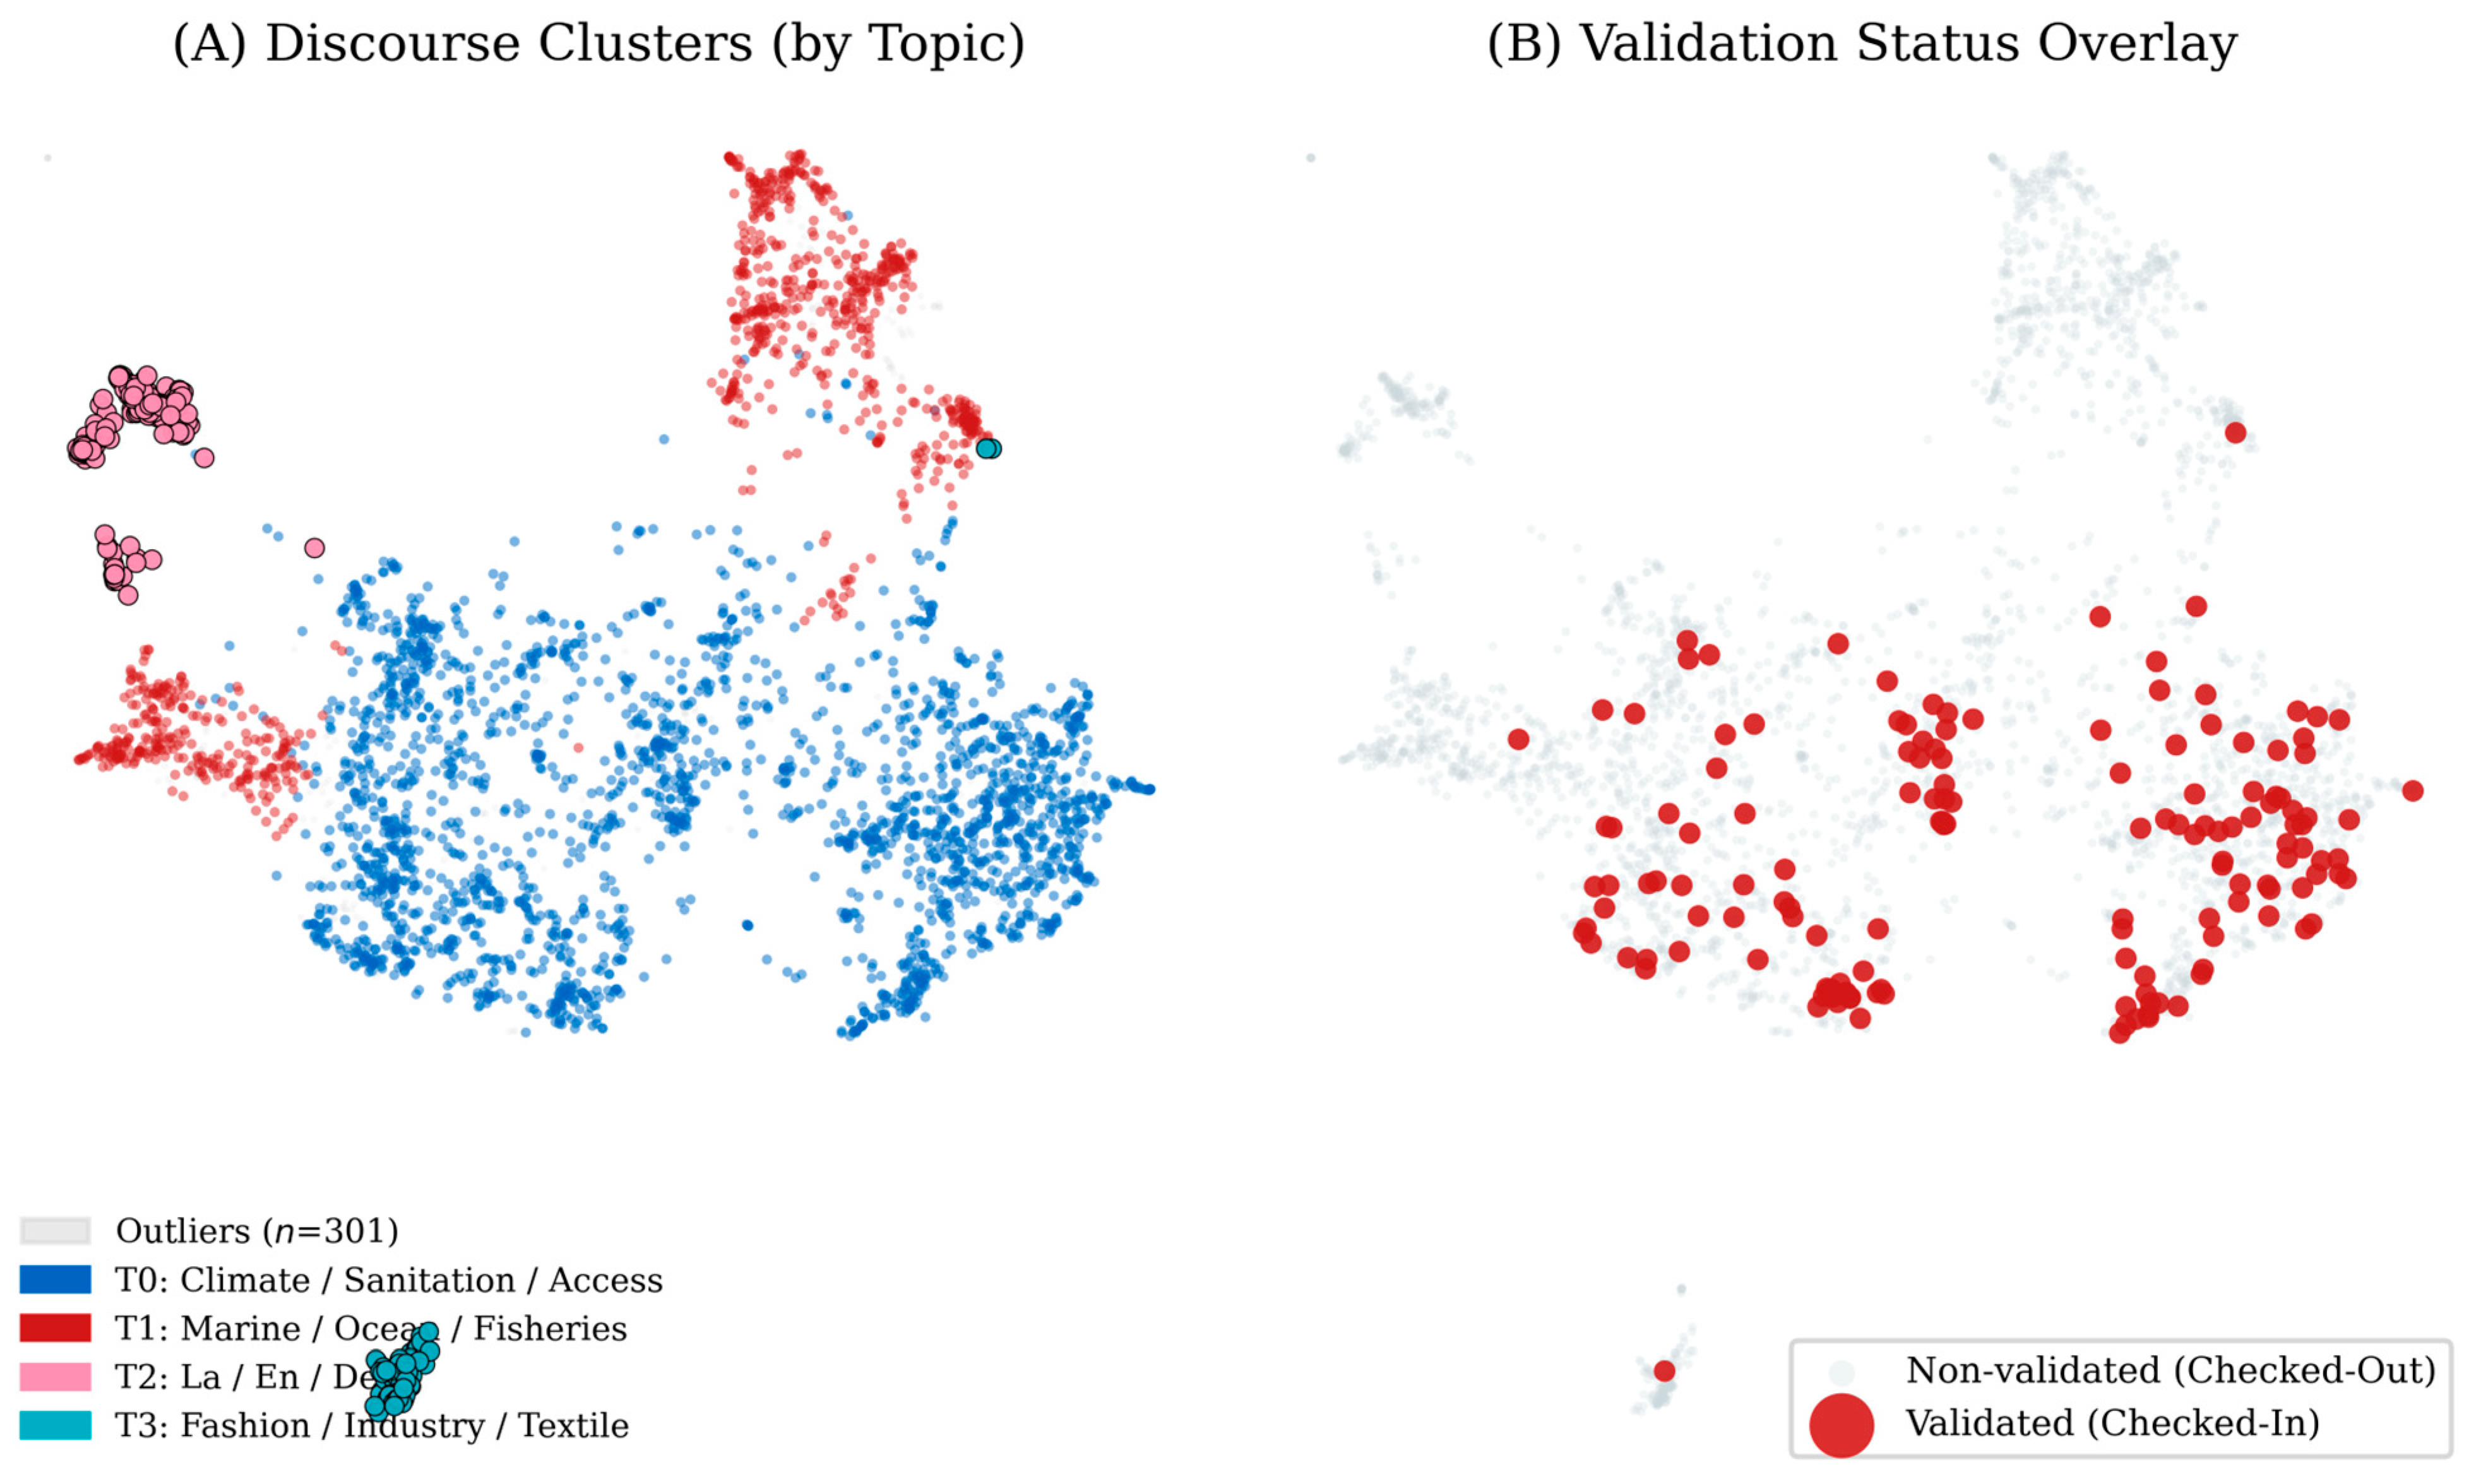
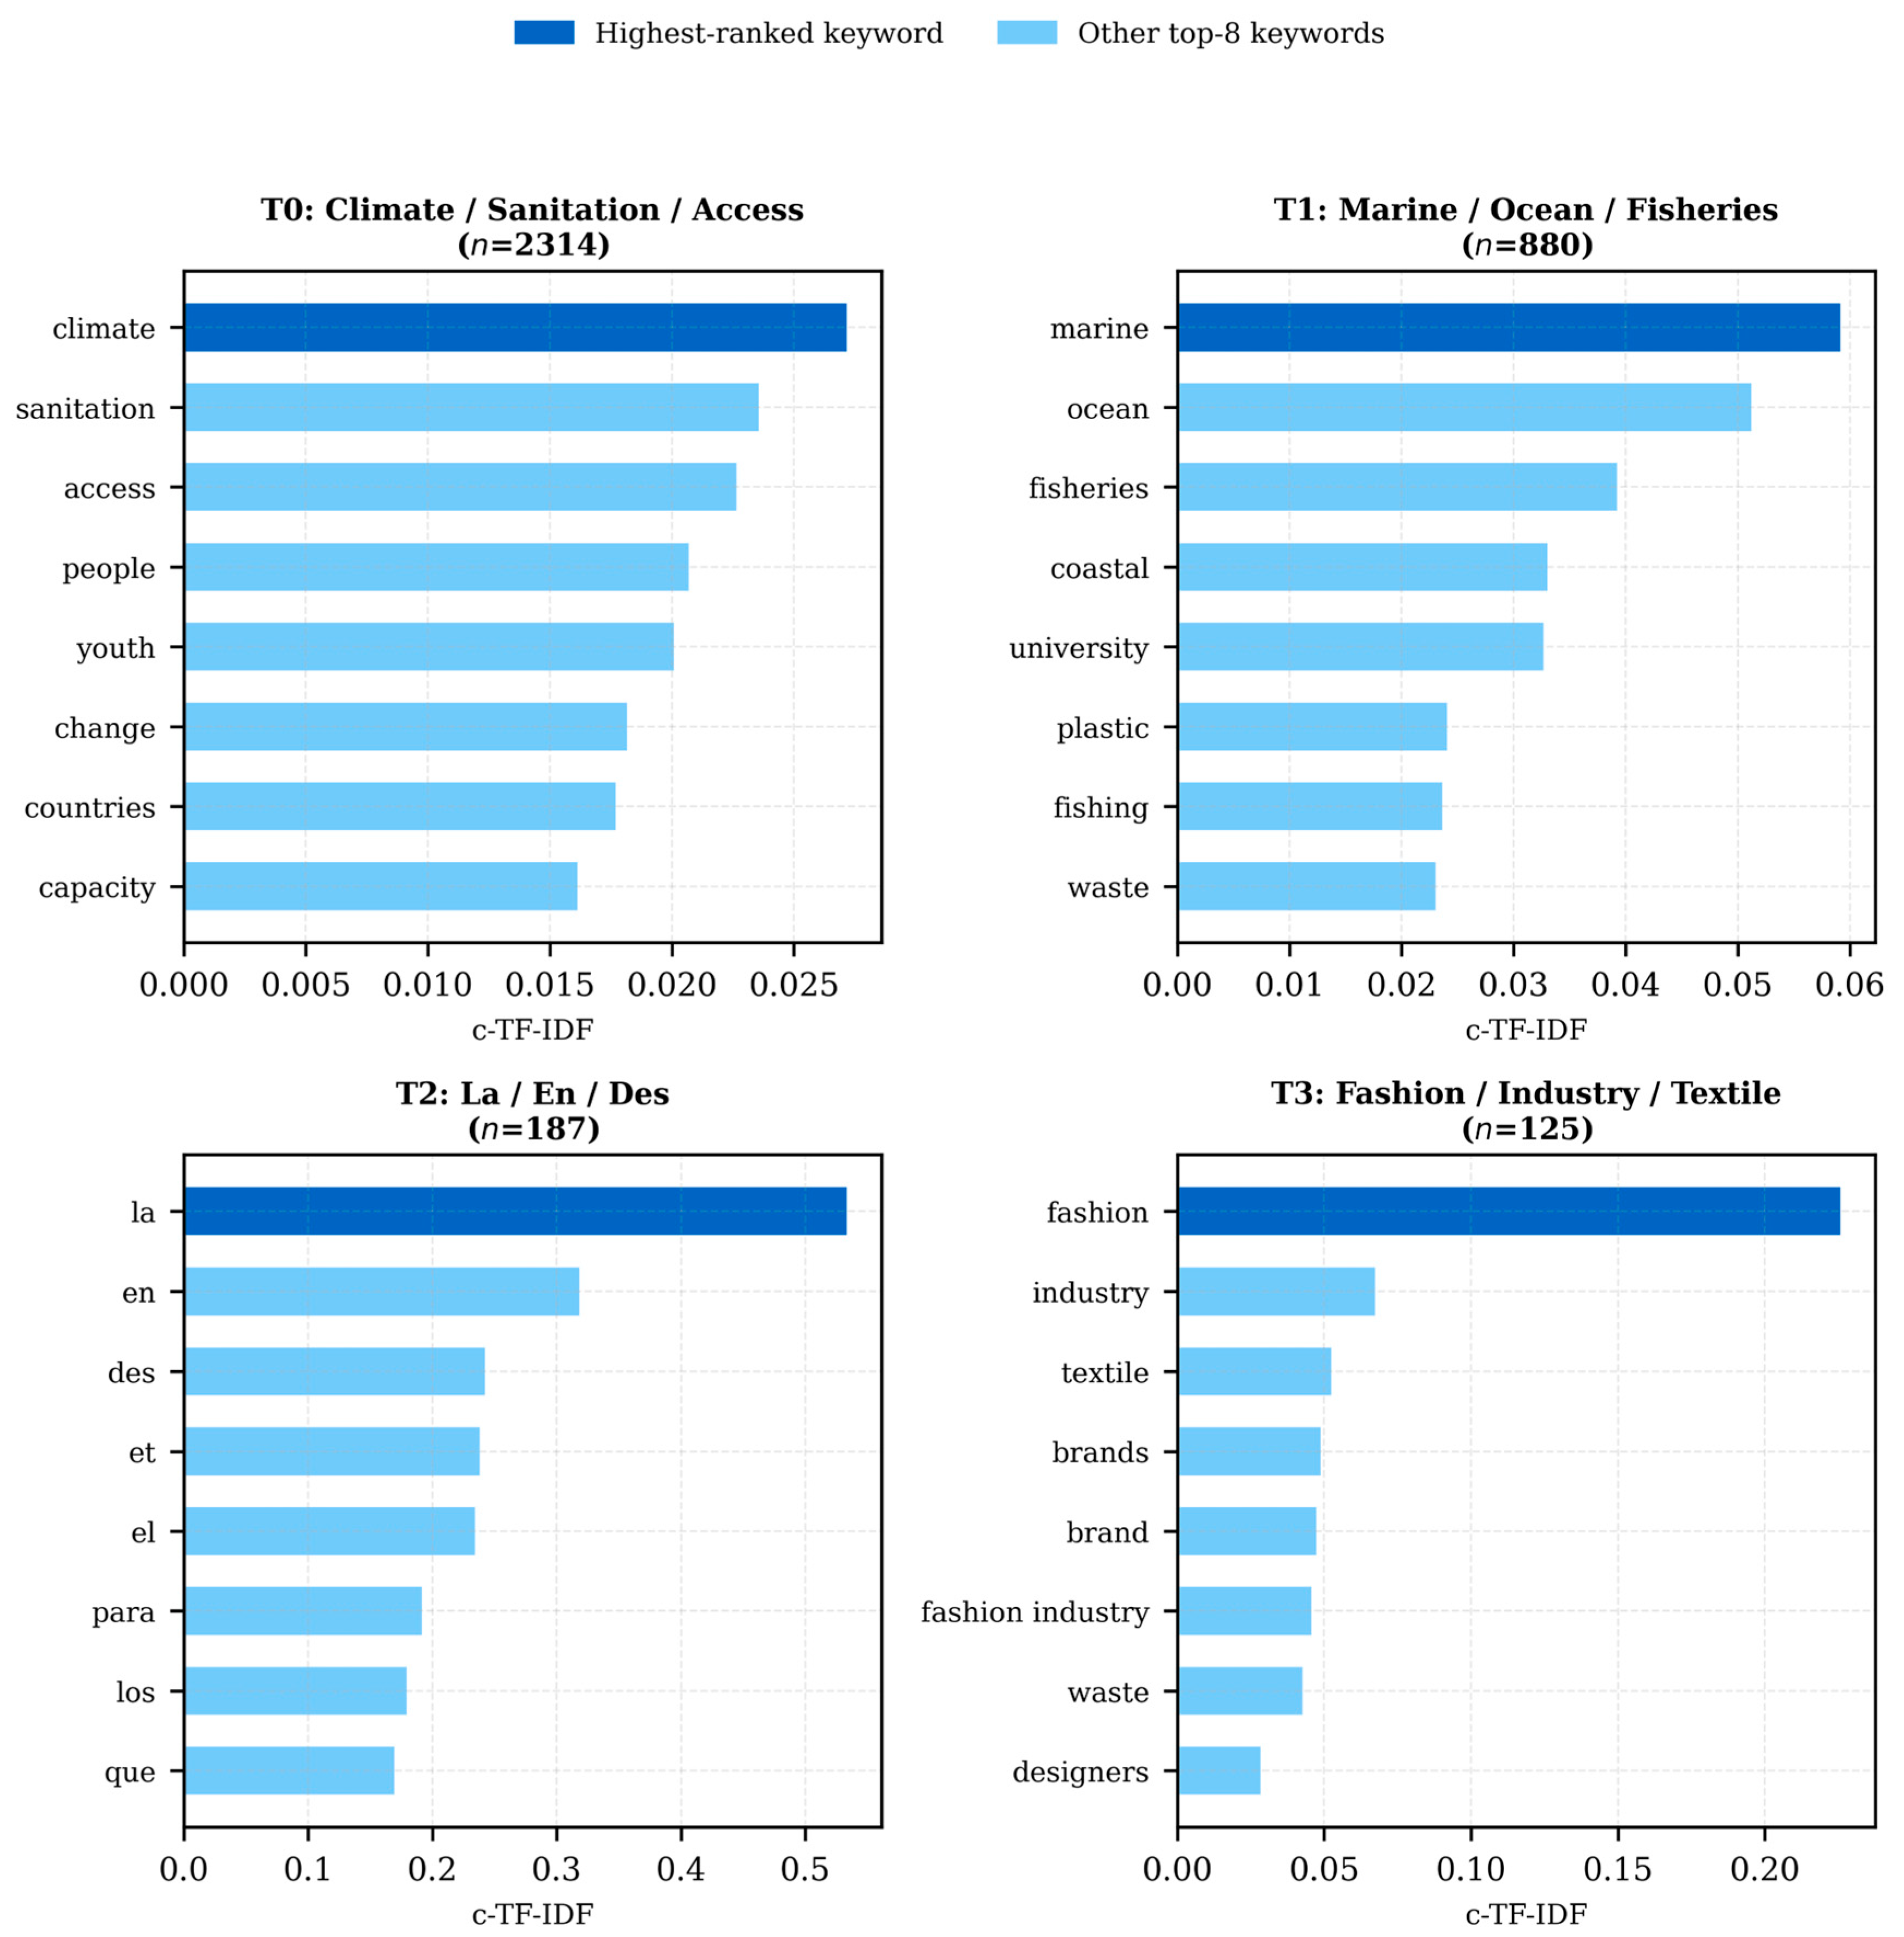
The reference model identified three substantive topics and 301 outlier documents (7.9%): Topic 0 (Climate, Sanitation, and Access; n = 2314; 60.8%), Topic 1 (Marine, Ocean, and Fisheries; n = 880; 23.1%), and Topic 3 (Fashion, Industry, and Textile; n = 125; 3.3%). The combined non-English-language artifact cluster (Topic 2; n = 187; 4.9%) was excluded from all thematic and VDSI comparisons. The overall thematic architecture, a dominant climate/sanitation/access domain, a secondary marine/coastal domain, and a smaller sustainable-fashion domain, is consistent across runs under the fixed topic-count target, resolving the granularity instability observed prior to fixing nr_topics.
The UMAP projection shown in Figure 3 reveals a large continuous manifold corresponding to Topic 0, with the marine-themed topic (Topic 1) forming a spatially distinct lobe. Validated partnerships are distributed across multiple topic regions without forming a distinct spatial cluster, indicating that thematic alignment alone does not differentiate validated from non-validated partnerships.
As shown in Figure 4, Topic 0 is anchored by climate, sanitation, access, youth, and change, most strongly associated with SDGs 6 and 3. Topic 1 is dominated by marine, ocean, fisheries, coastal, and plastic, closely mapping to SDG 14, encompassing both marine-governance and marine-plastics-pollution discourse that were separated into distinct clusters in earlier, less stable iterations of this pipeline. Topic 3 is characterized by fashion, industry, textile, brands, and waste, reflecting a coherent cluster of sustainable fashion and circular-economy initiatives, most strongly associated with SDG 12.

4.3. Structural Comparison: Validated vs. Non-Validated Projects

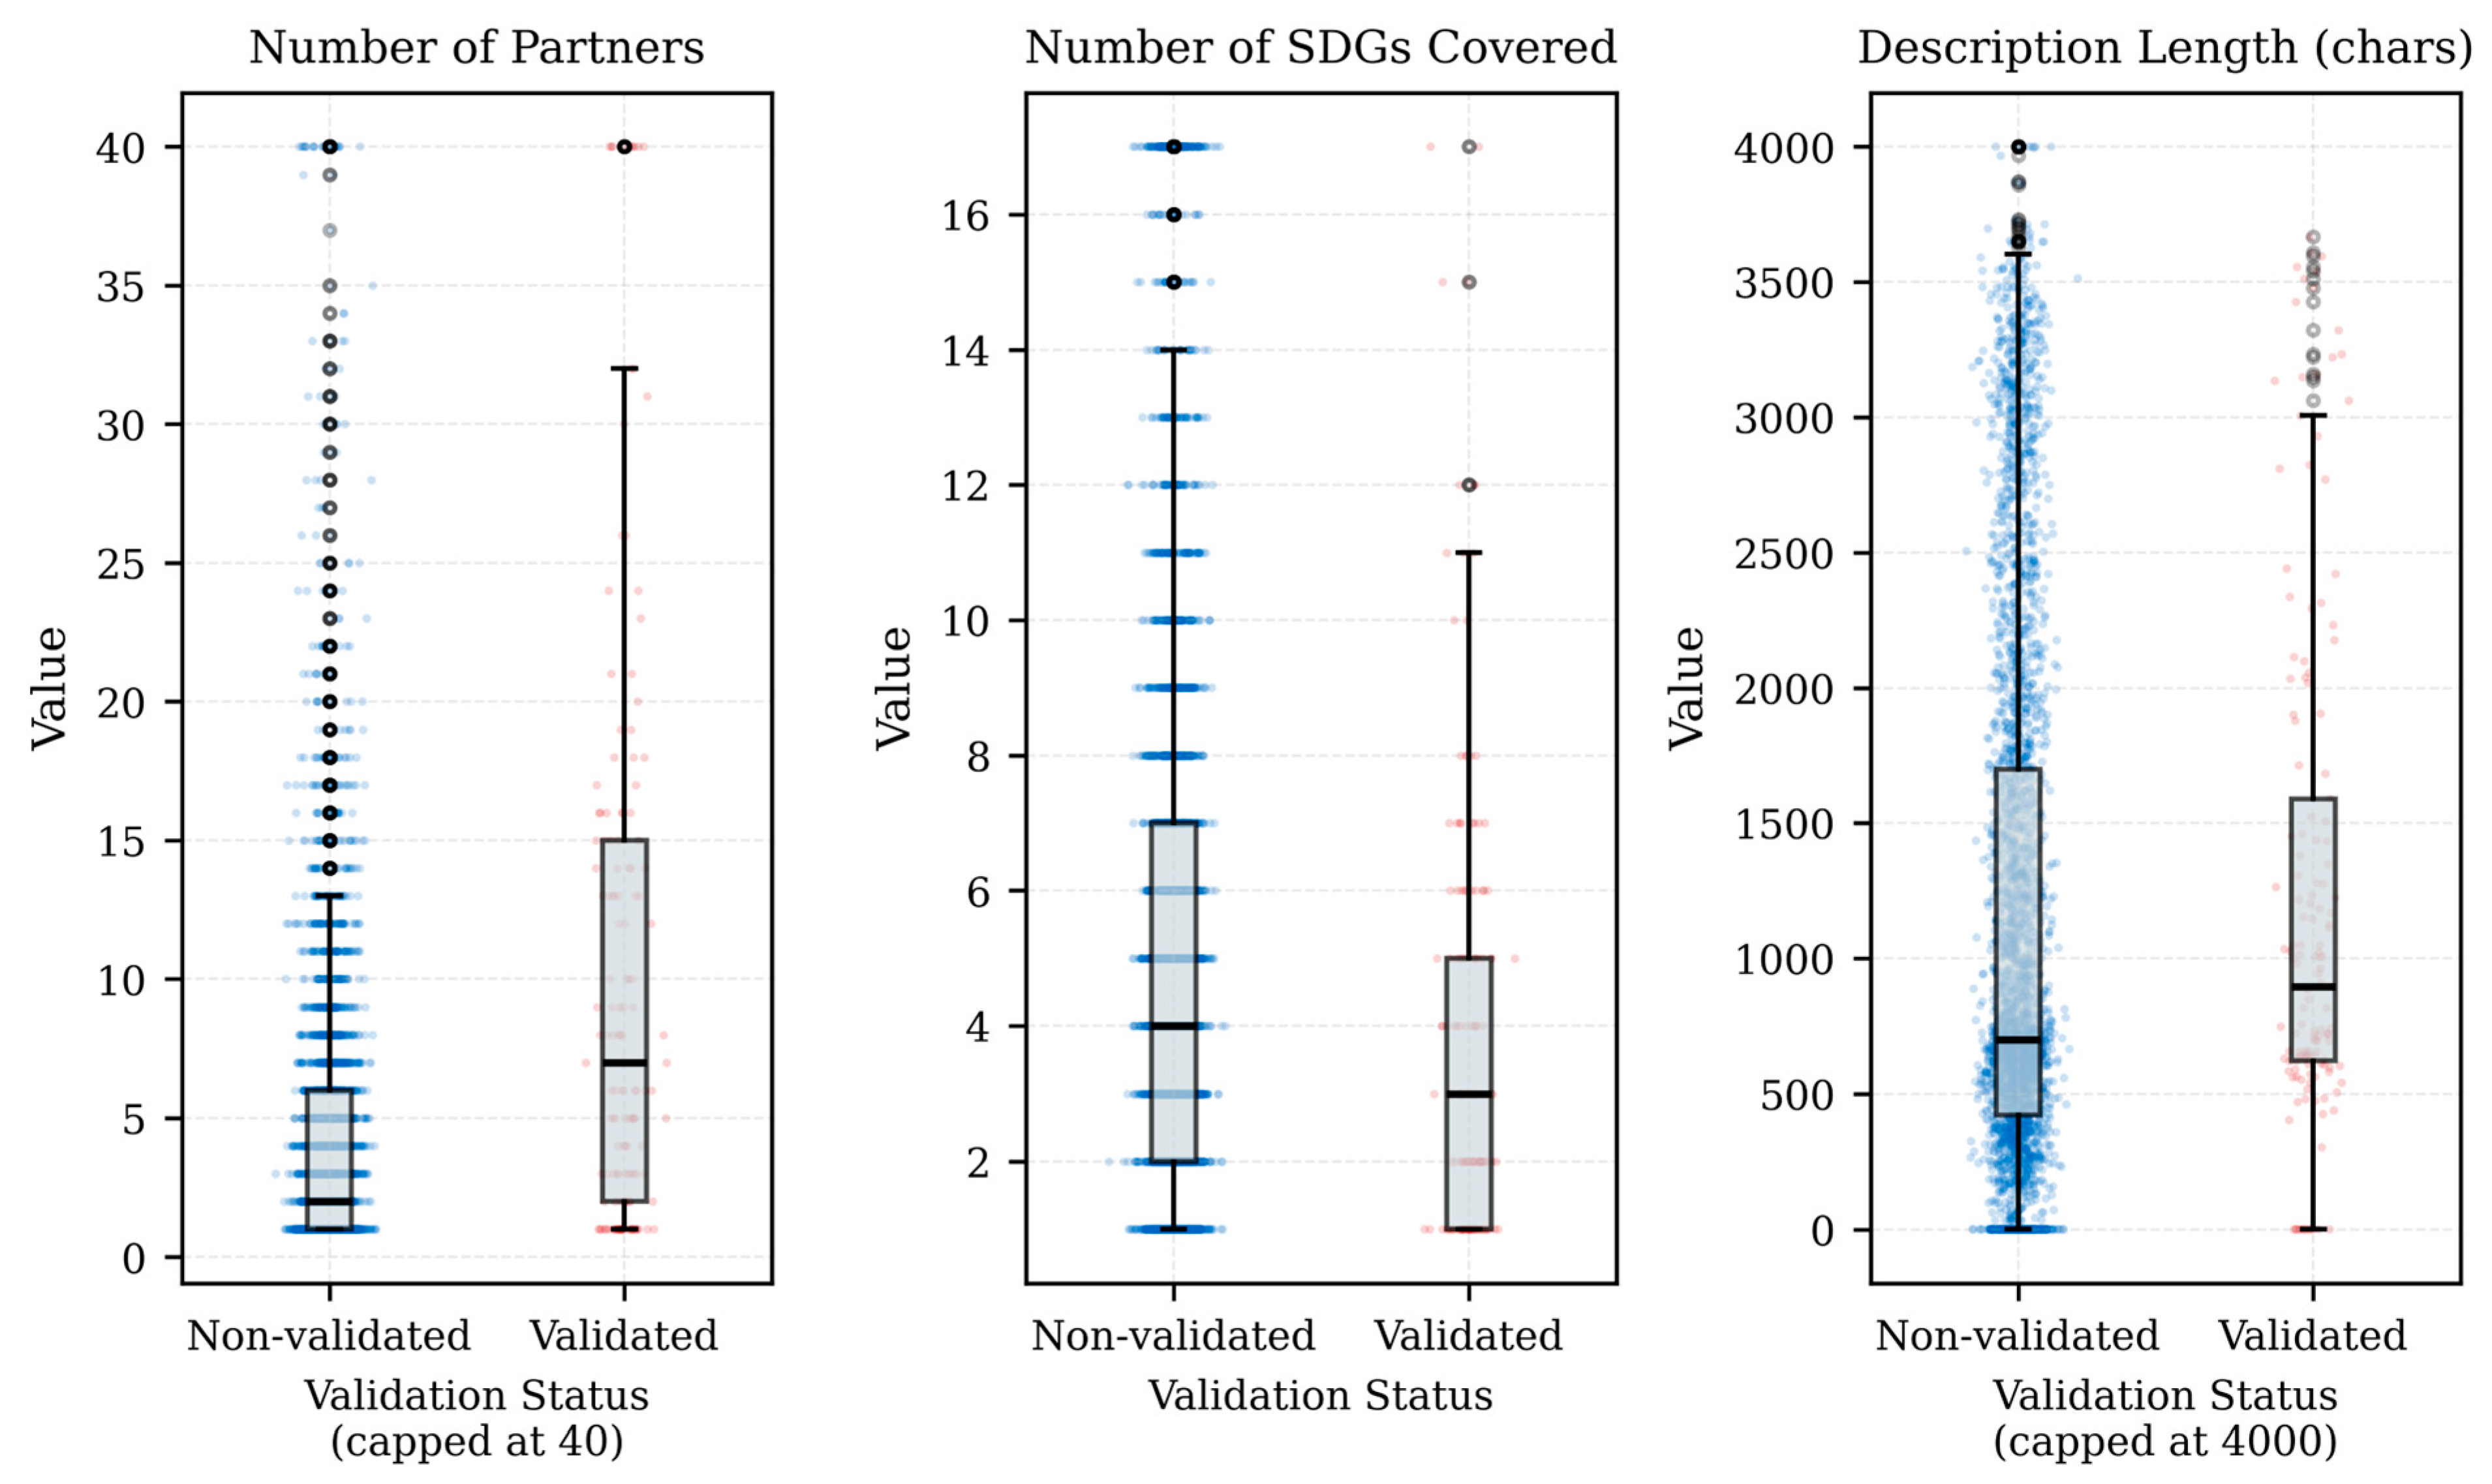
Table 1 presents the results of Mann–Whitney U tests comparing five structural features (Figure 5). The most substantial difference concerns partner count: validated projects engage an average of 13.30 partners compared to 4.64 for non-validated projects (r = −0.389; p_FDR < 0.001), a medium effect. SDG scope is significantly narrower for validated projects (mean = 3.82 vs. 5.31; r = 0.210; p_FDR < 0.001). Topic coherence probability does not differ significantly between groups (r = −0.004; p_FDR = 0.926). Because these variables are right-skewed, Table 2 reports medians and interquartile ranges alongside the means in Table 1. The median partner count is 7 (IQR: 2–15) for validated projects versus 2 (IQR: 1–6) for non-validated projects, a starker separation than the means alone suggest, while median SDG scope is slightly lower for validated projects (3, IQR: 1–5) than non-validated projects (4, IQR: 2–7), consistent with the mean-based comparison.

4.4. Validated-Discourse Similarity Analysis

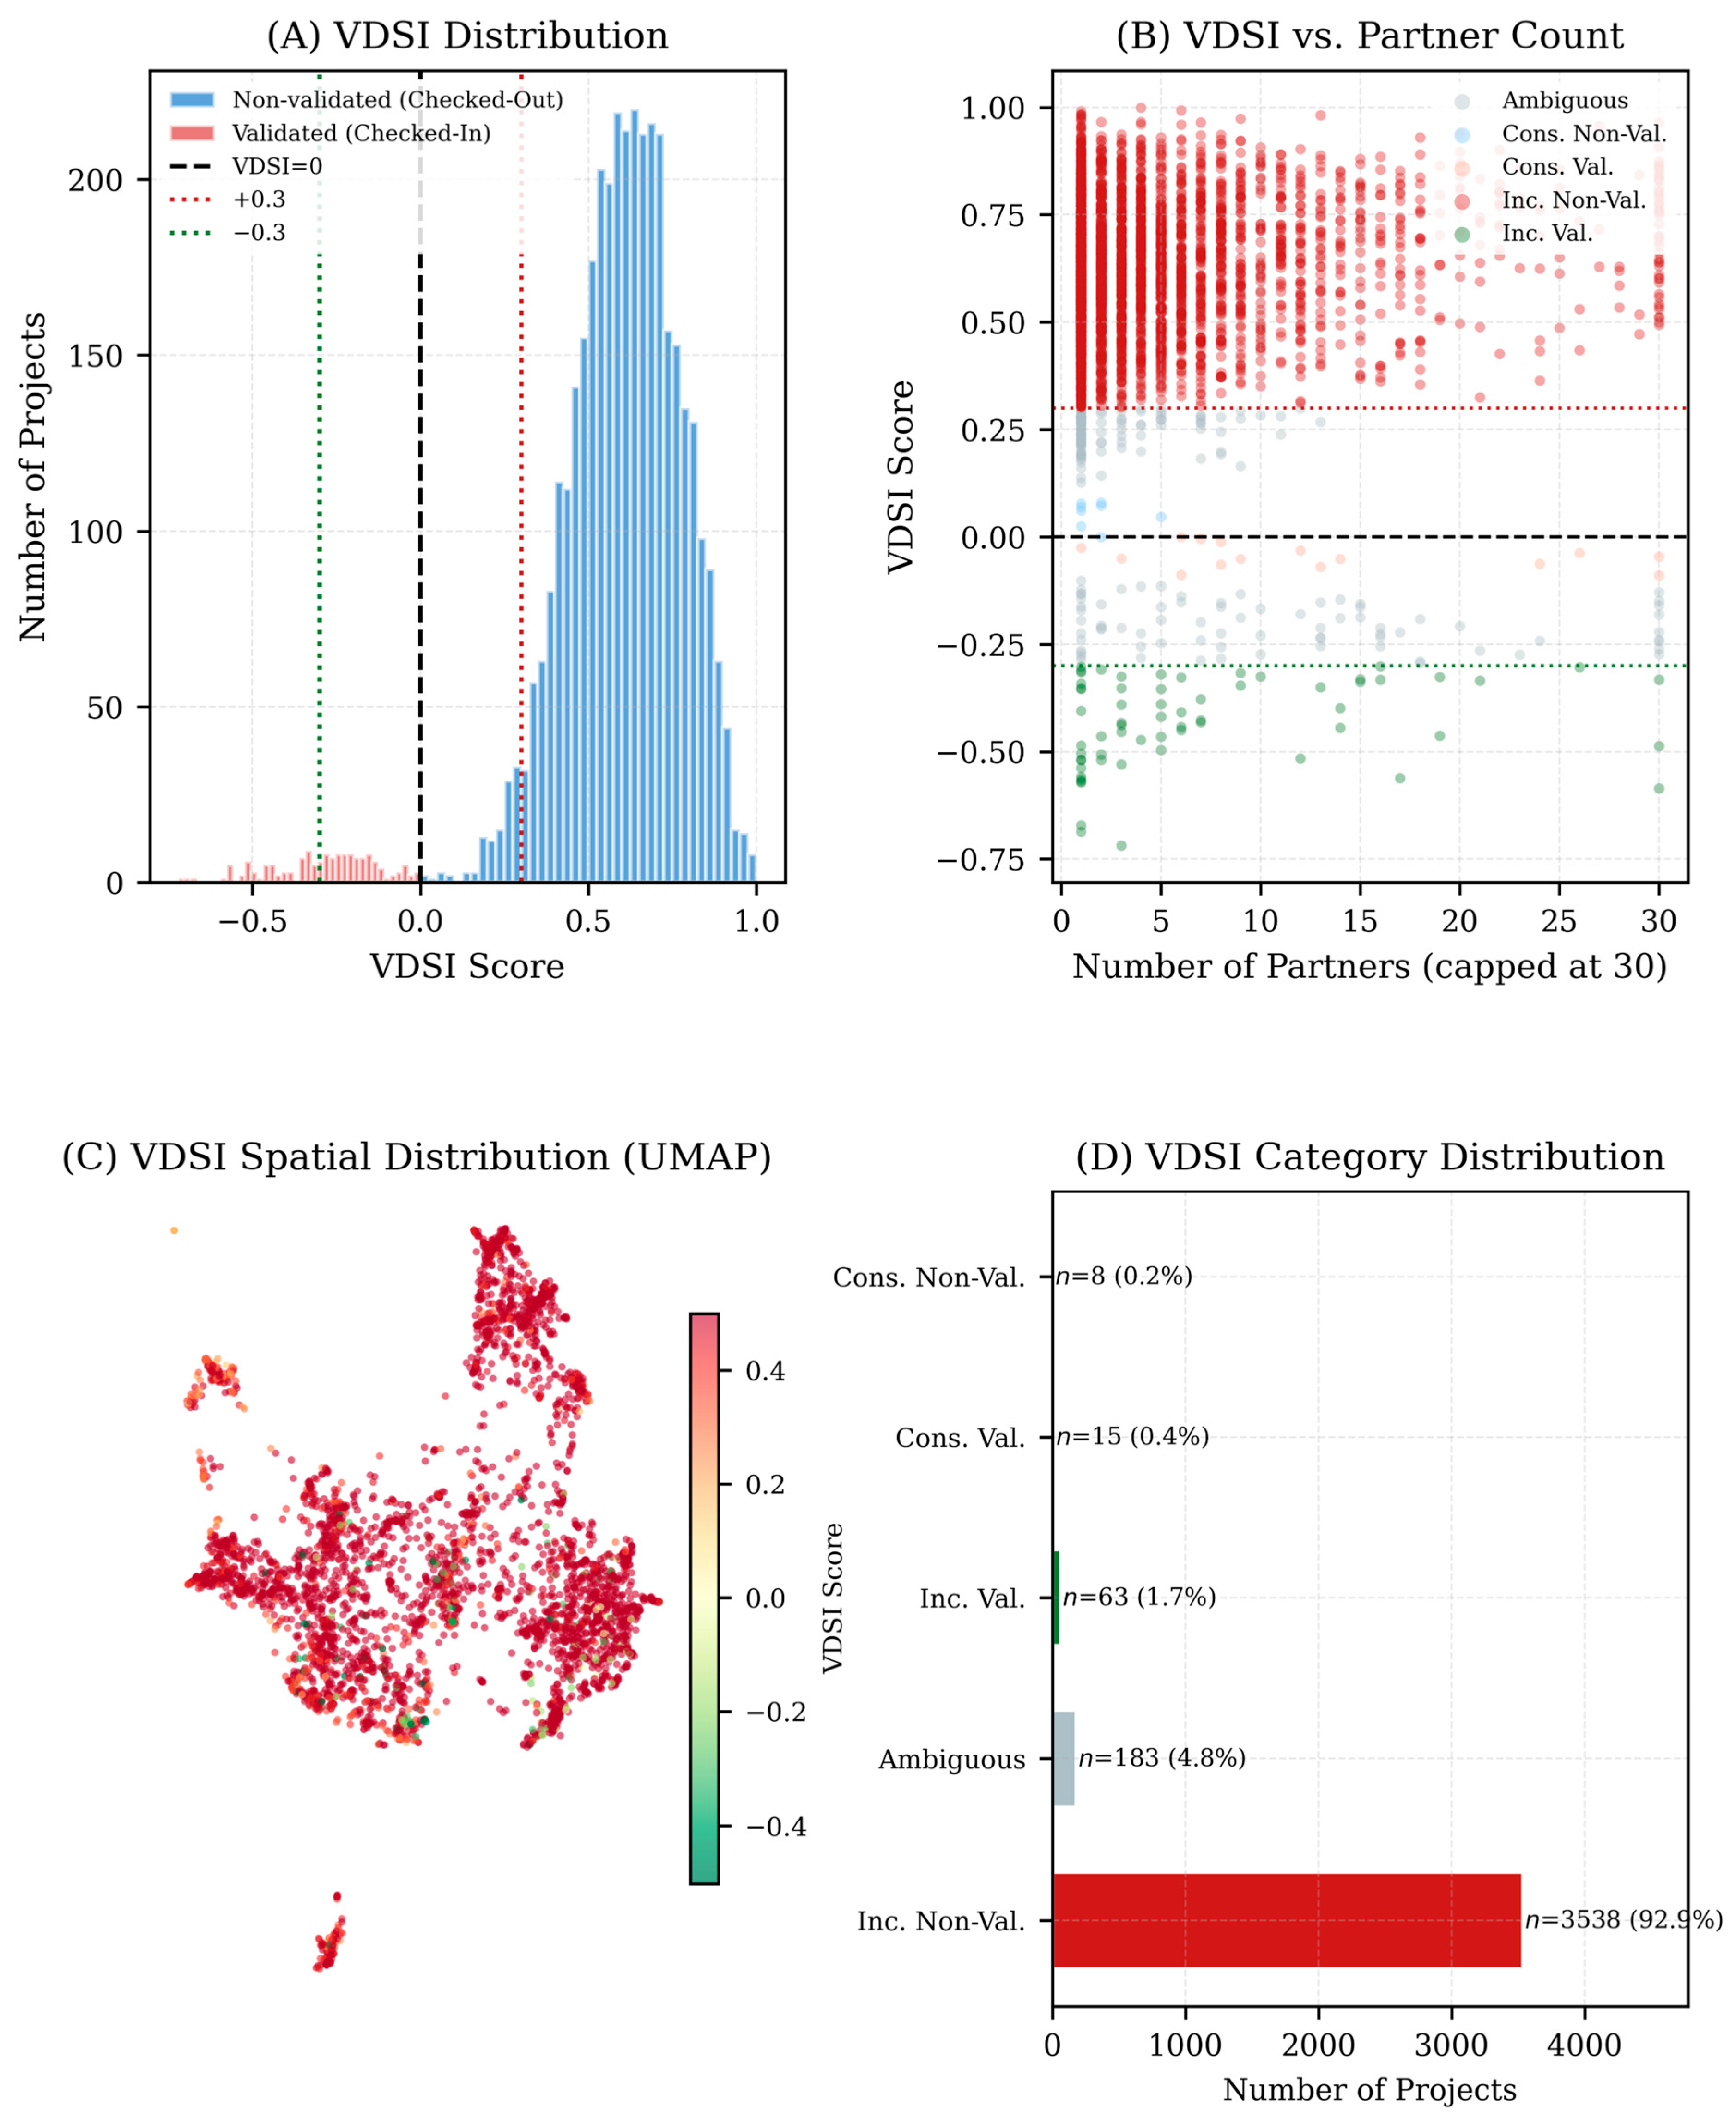
VDSI analysis classifies 3538 of the 3807 pre-processed projects (92.9%) as exhibiting Inconsistent Non-Validated. This denominator encompasses the full pre-processed corpus, including the 187 non-English-language artifact documents, which are counted here but excluded from thematic interpretation. Restricting the calculation to the English-language analytical subset (N = 3633) yields a slightly higher Inconsistent Non-Validated prevalence of 93.4% (3394/3633), indicating that the finding is not sensitive to this choice of denominator. A further 183 projects (4.8%) fall into the Ambiguous category, 63 validated projects (1.7%) exhibit Inconsistent Validated, 15 validated projects (0.4%) are Consistent Validated, and 8 non-validated projects (0.2%) qualify as Consistent Non-Validated. Illustrative examples of projects falling into each category are provided in Supplementary Table S2. The mean VDSI across the full corpus is 0.576 ± 0.237. As introduced in Section 3.5, the validated group’s mean within-group pairwise cosine similarity (0.302) significantly exceeds that of same-size random non-validated subsamples (mean = 0.235; 95% range: 0.218–0.253; one-sided resampling p = 0.002), supporting the single-centroid representation underlying this analysis.
As shown, Figure 6A reveals that the VDSI distribution for non-validated projects is substantially shifted to the right relative to that of validated projects. Figure 6B demonstrates a weak negative relationship between VDSI scores and partner count for non-validated projects. Panel C shows no spatial clustering of VDSI scores in the UMAP projection, confirming that the validated-discourse similarity pattern is not thematically localized. Panel D summarizes the category distribution.
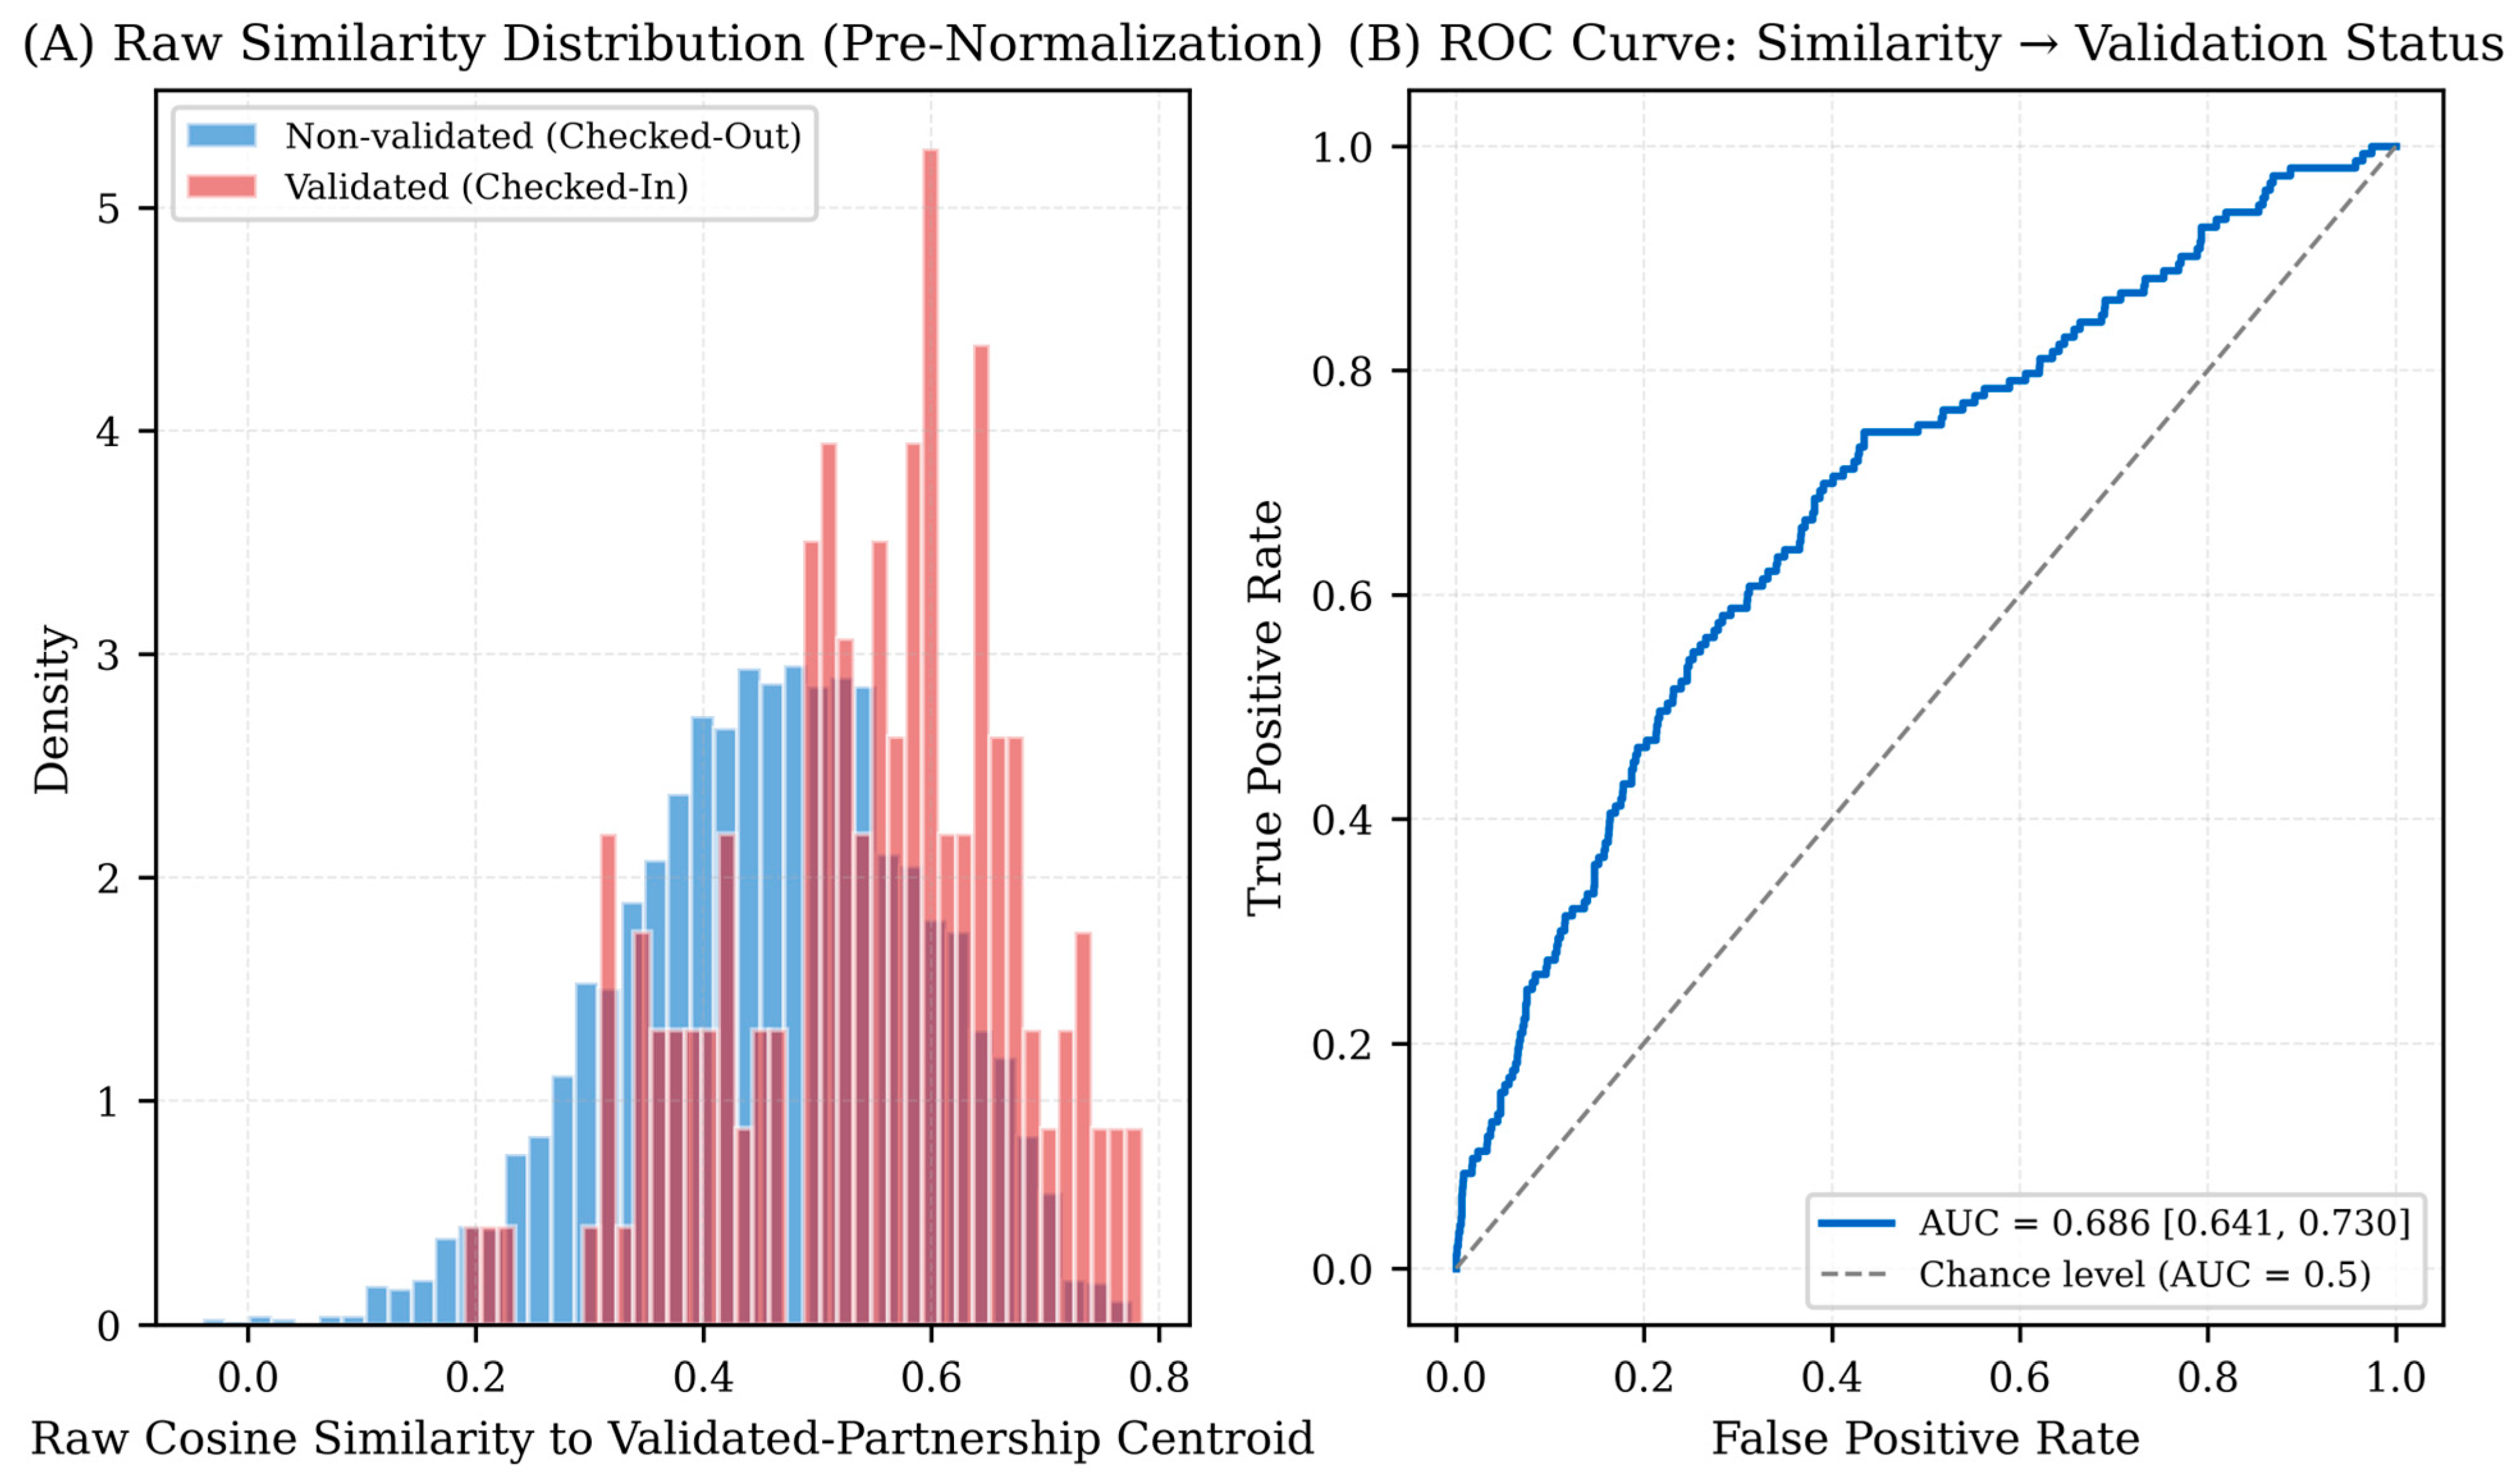
Because the VDSI formula’s asymmetric construction guarantees that non-validated projects receive non-negative values and validated projects receive non-positive values by definition, we separately tested whether the underlying raw (pre-normalization) cosine similarity itself discriminates validation status. Raw similarity to the leave-one-out centroid averaged 0.460 (SD = 0.130) for non-validated projects versus 0.546 (SD = 0.125) for validated projects, a difference of 0.086 that a permutation test (10,000 label-shuffles) confirms is statistically significant (p < 0.001) and therefore not an artifact of the normalization convention (Figure 7A). This corresponds to a medium standardized effect (Cohen’s d = 0.663), with the raw mean difference itself bounded by a 95% bootstrap confidence interval of [0.066, 0.106]. Using raw similarity alone as a continuous classifier of validation status yields an area under the ROC (Receiver Operating Characteristic) curve of 0.686 (95% bootstrap CI: 0.640–0.728; Figure 7B), indicating that semantic similarity is a genuine but only weak-to-moderate discriminator of validation status on its own. This finding tempers the interpretation of Inconsistent Non-Validated: the 92.9% prevalence figure does not imply that textual discourse mechanically predicts validation, but rather that a meaningful, partial semantic signal coexists with substantial overlap between the two groups, consistent with the view that structural features such as partner count carry complementary and largely independent information.
Table 3 reports the sensitivity of VDSI category assignments to variations in thresholds. Inconsistent Non-Validated prevalence ranges from 73.0% at ±0.50 to 95.3% at ±0.20, confirming robustness across the full range.

4.5. SDG-Level Subgroup Analysis

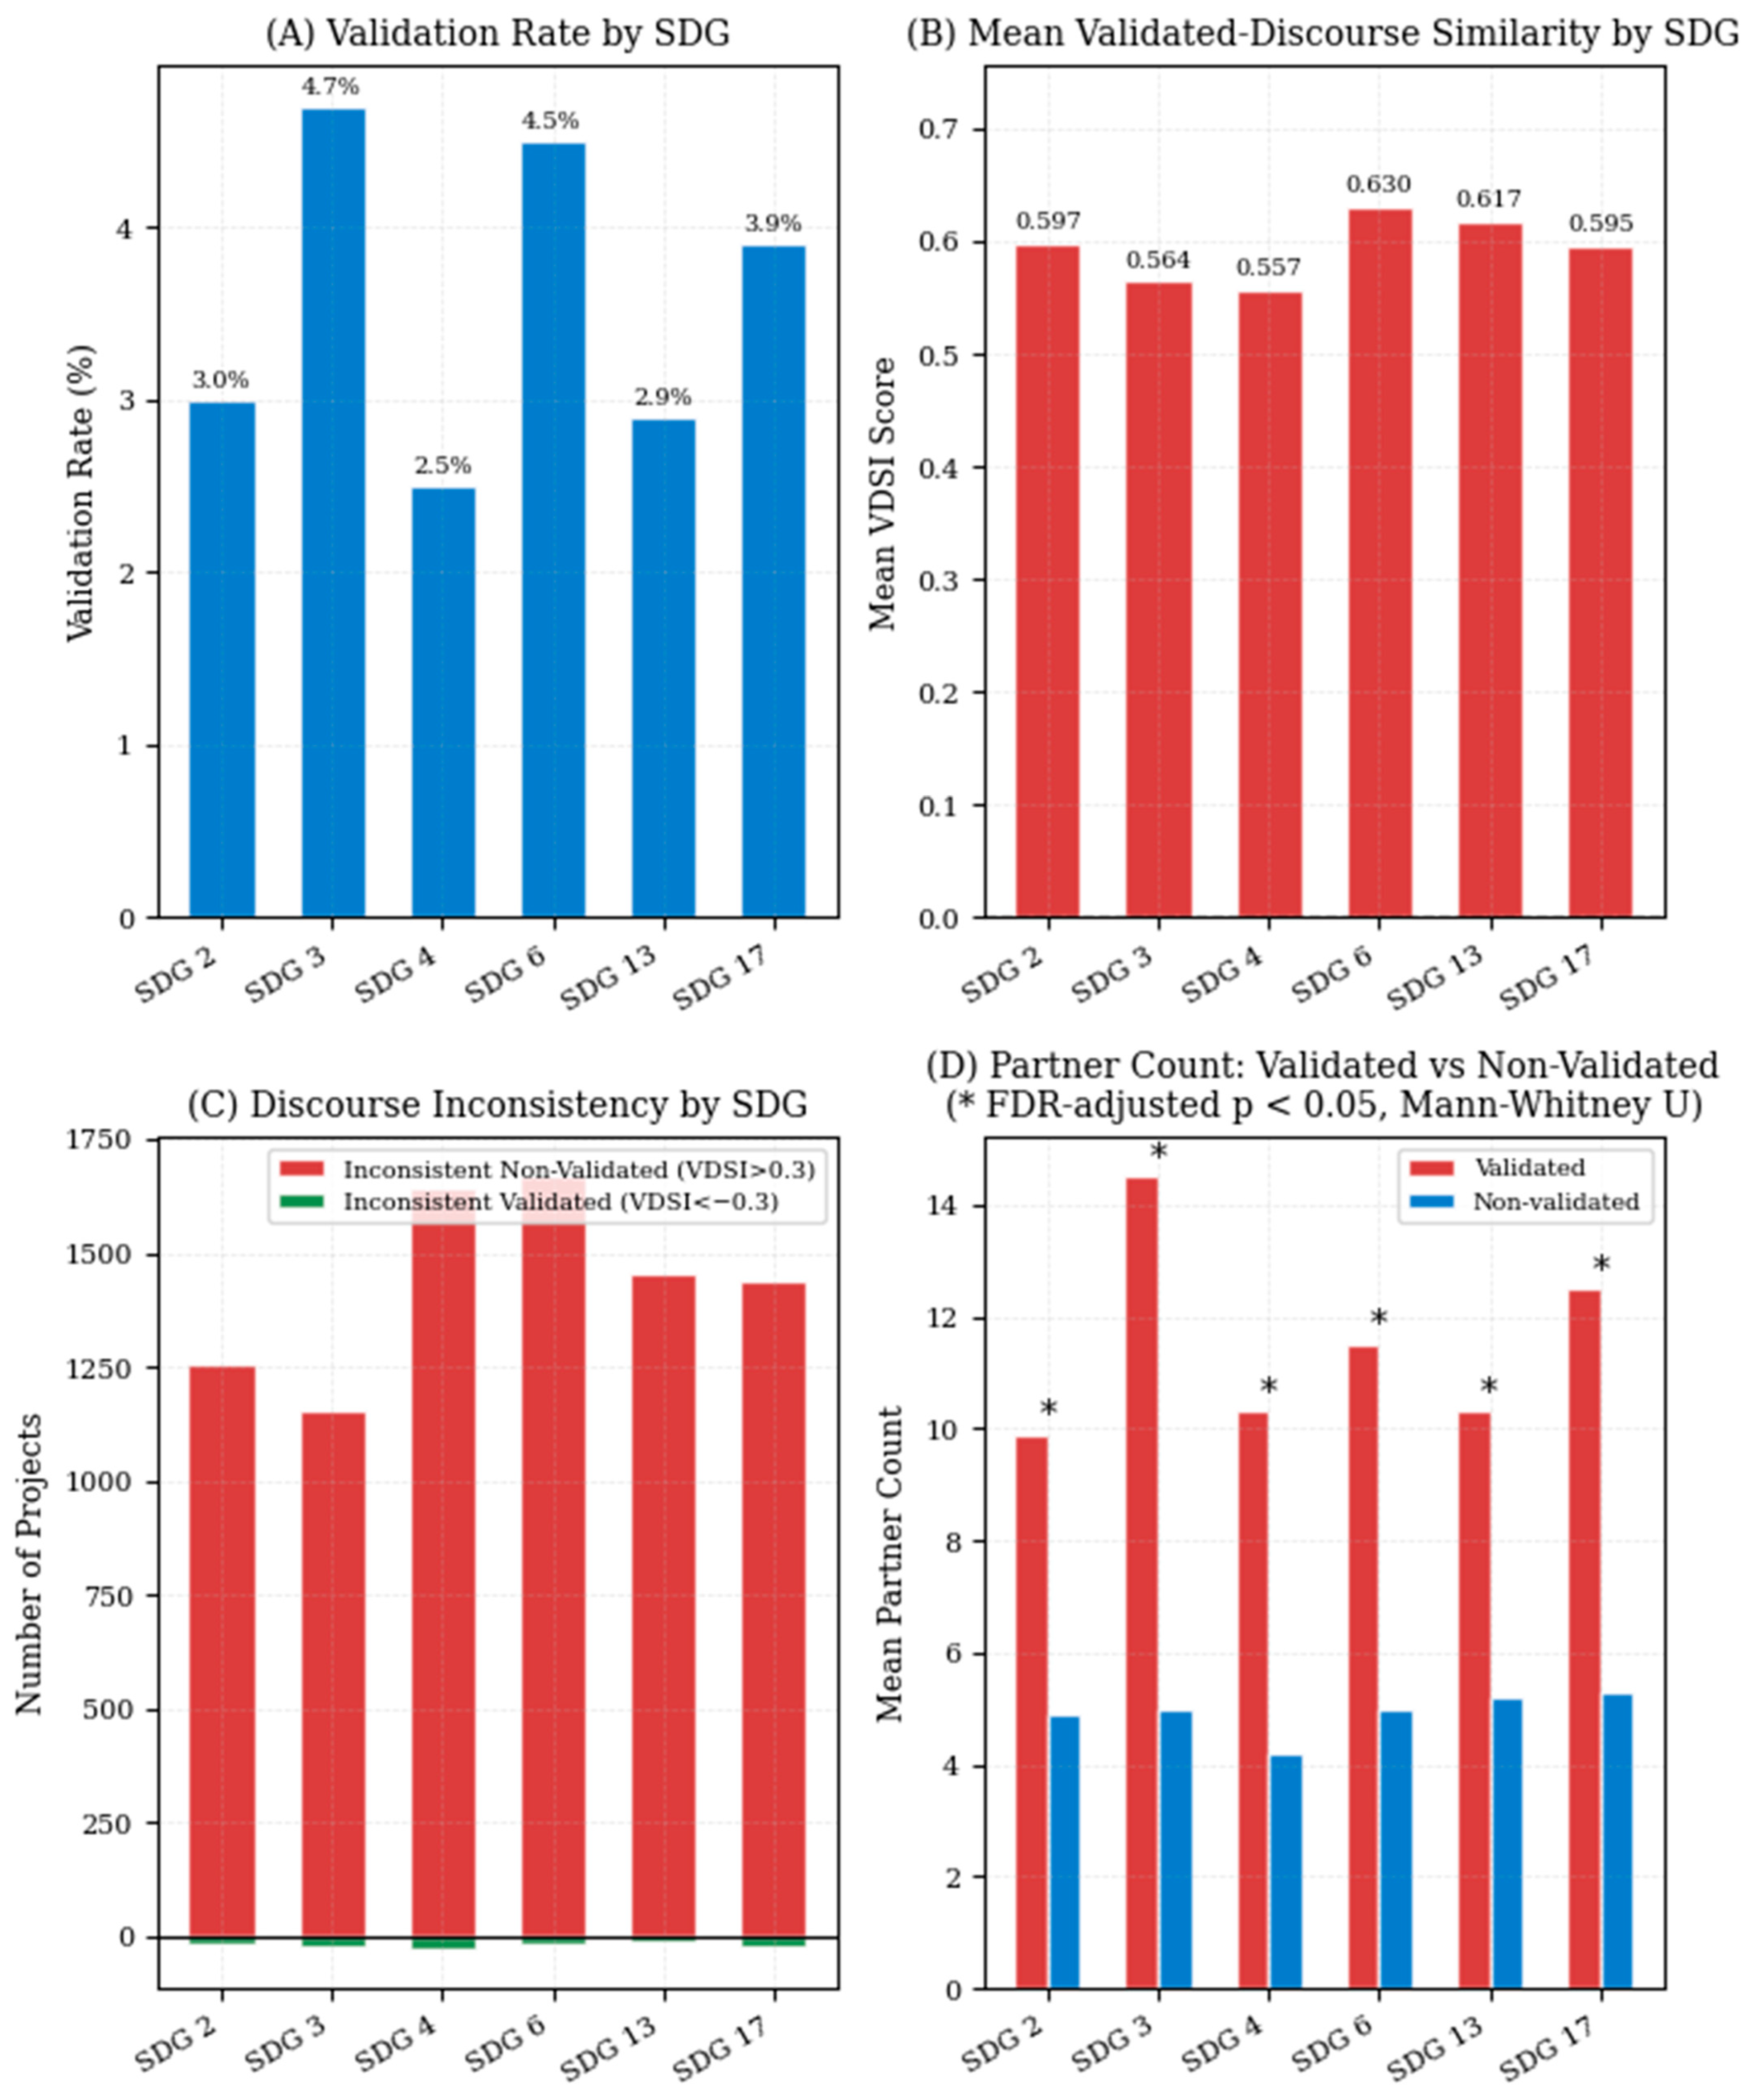
Figure 8 presents the SDG-level subgroup analysis across six focal SDGs. Table 4 reports the underlying statistics.
As shown in Table 4, the partner-count advantage of validated projects persists across all six SDG subgroups, with FDR-adjusted significance. The effect size is largest under SDG 3 (Good Health and Well-being; r = −0.394). SDG 3 exhibits the highest validation prevalence (4.7%), while SDG 4 shows the lowest (2.5%). Mean VDSI scores are uniformly high across all SDGs (ranging from 0.557 to 0.630).
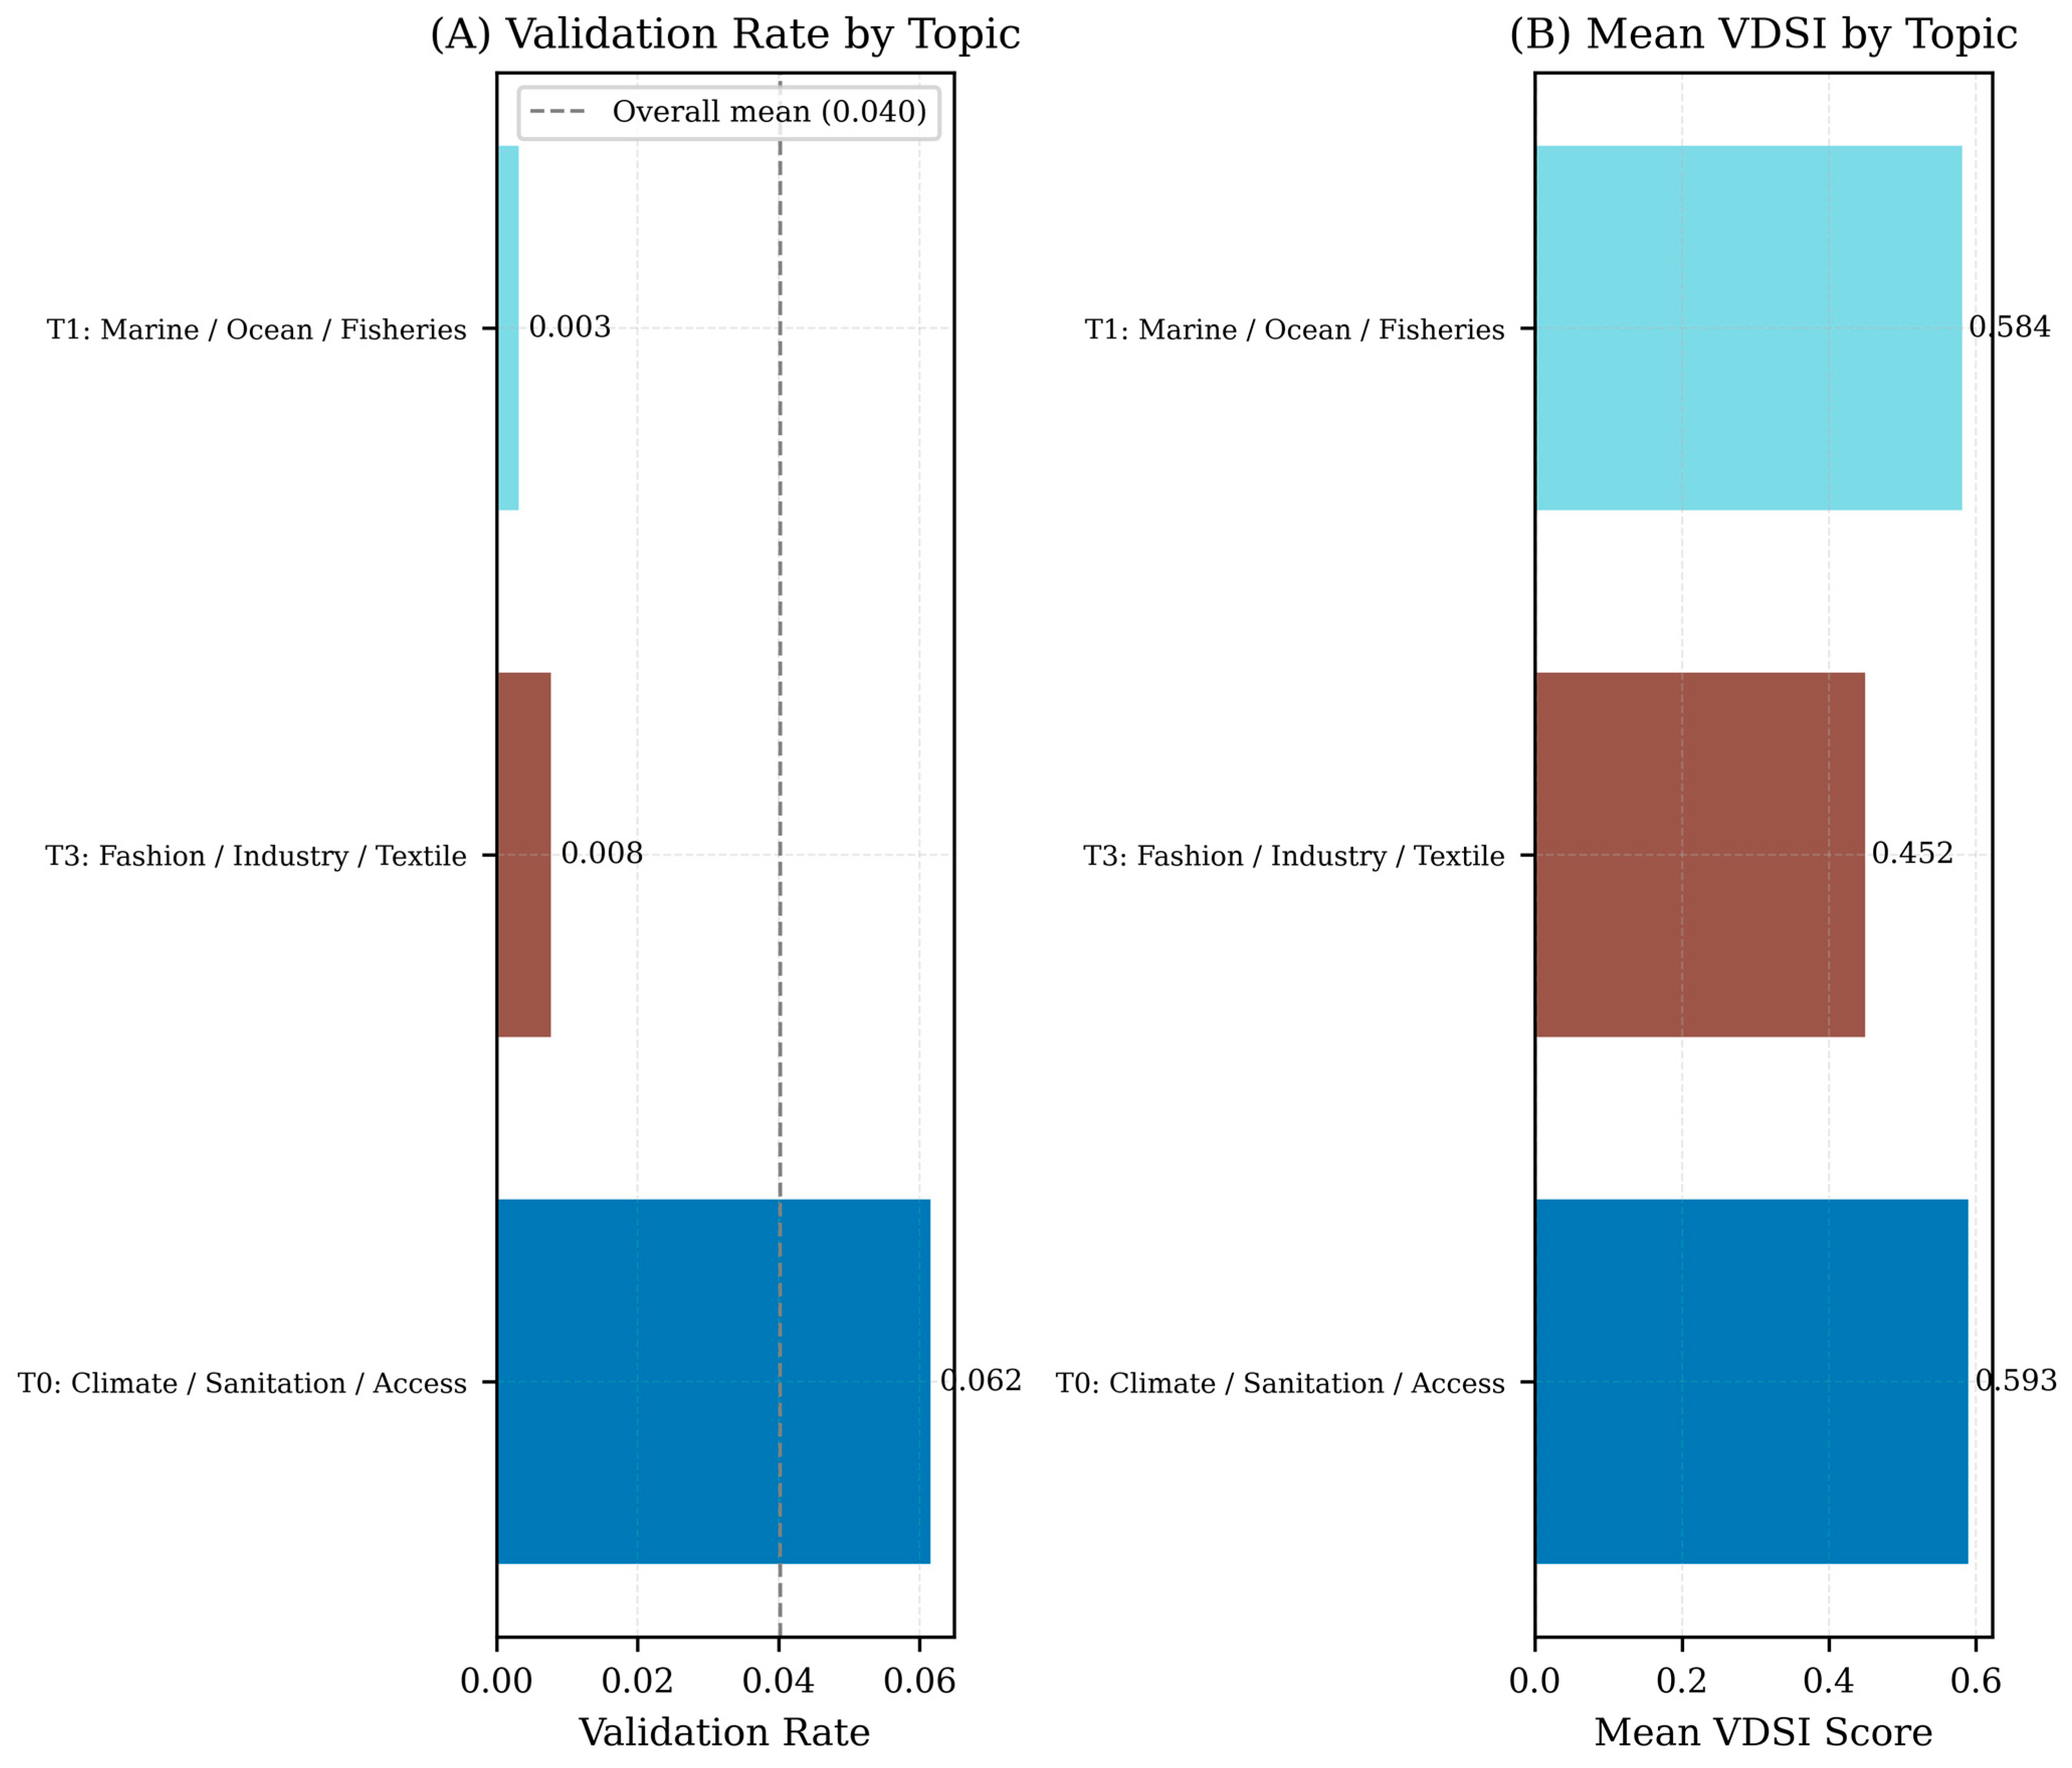
As shown in Figure 9, Topic 0 (Climate, Sanitation, and Access) contains the highest proportion of validated projects (6.2%), while Topic 1 (Marine, Ocean, and Fisheries) contains only 3 of the corpus’s 153 validated projects (0.3%) despite being the second-largest substantive topic. Topic 3 (Fashion, Industry, and Textile) shows a similarly low validation rate (0.8%). All three substantive topics exhibit comparably high mean VDSI scores (0.45–0.59), confirming that Inconsistent Non-Validated is prevalent regardless of thematic affiliation and is not concentrated in any single topic.

4.6. Sample Representativeness Checks

Because the analytical corpus is constructed through several sequential exclusion steps (short-text filtering, language-artifact detection, HDBSCAN outlier assignment), we tested whether each excluded or flagged subset differs systematically from the retained corpus.
The 170 records excluded for insufficient text length did not differ significantly from the retained corpus in validation rate (4.12% vs. 4.02%; Fisher’s exact p = 0.843) or SDG scope (p = 0.105) but had significantly fewer partners on average (3.25 vs. 4.99; r = 0.156, p < 0.001; Table 5, Panel A).
The 174 language-artifact documents had a validation rate of 0% compared to 4.21% in the English-language subset (Fisher’s exact p = 0.001) and significantly fewer partners (3.71 vs. 5.05; r = 0.150, p_FDR = 0.002), though neither description length nor SDG scope differed significantly (Table 5, Panel B).
The 301 outlier documents (7.9% of the corpus; topic = −1) did not differ significantly from clustered documents in validation rate (1.99% vs. 4.19%; Fisher’s exact p = 0.066), SDG scope (4.57 vs. 5.30; p = 0.061), partner count, or description length (Table 5, Panel C).
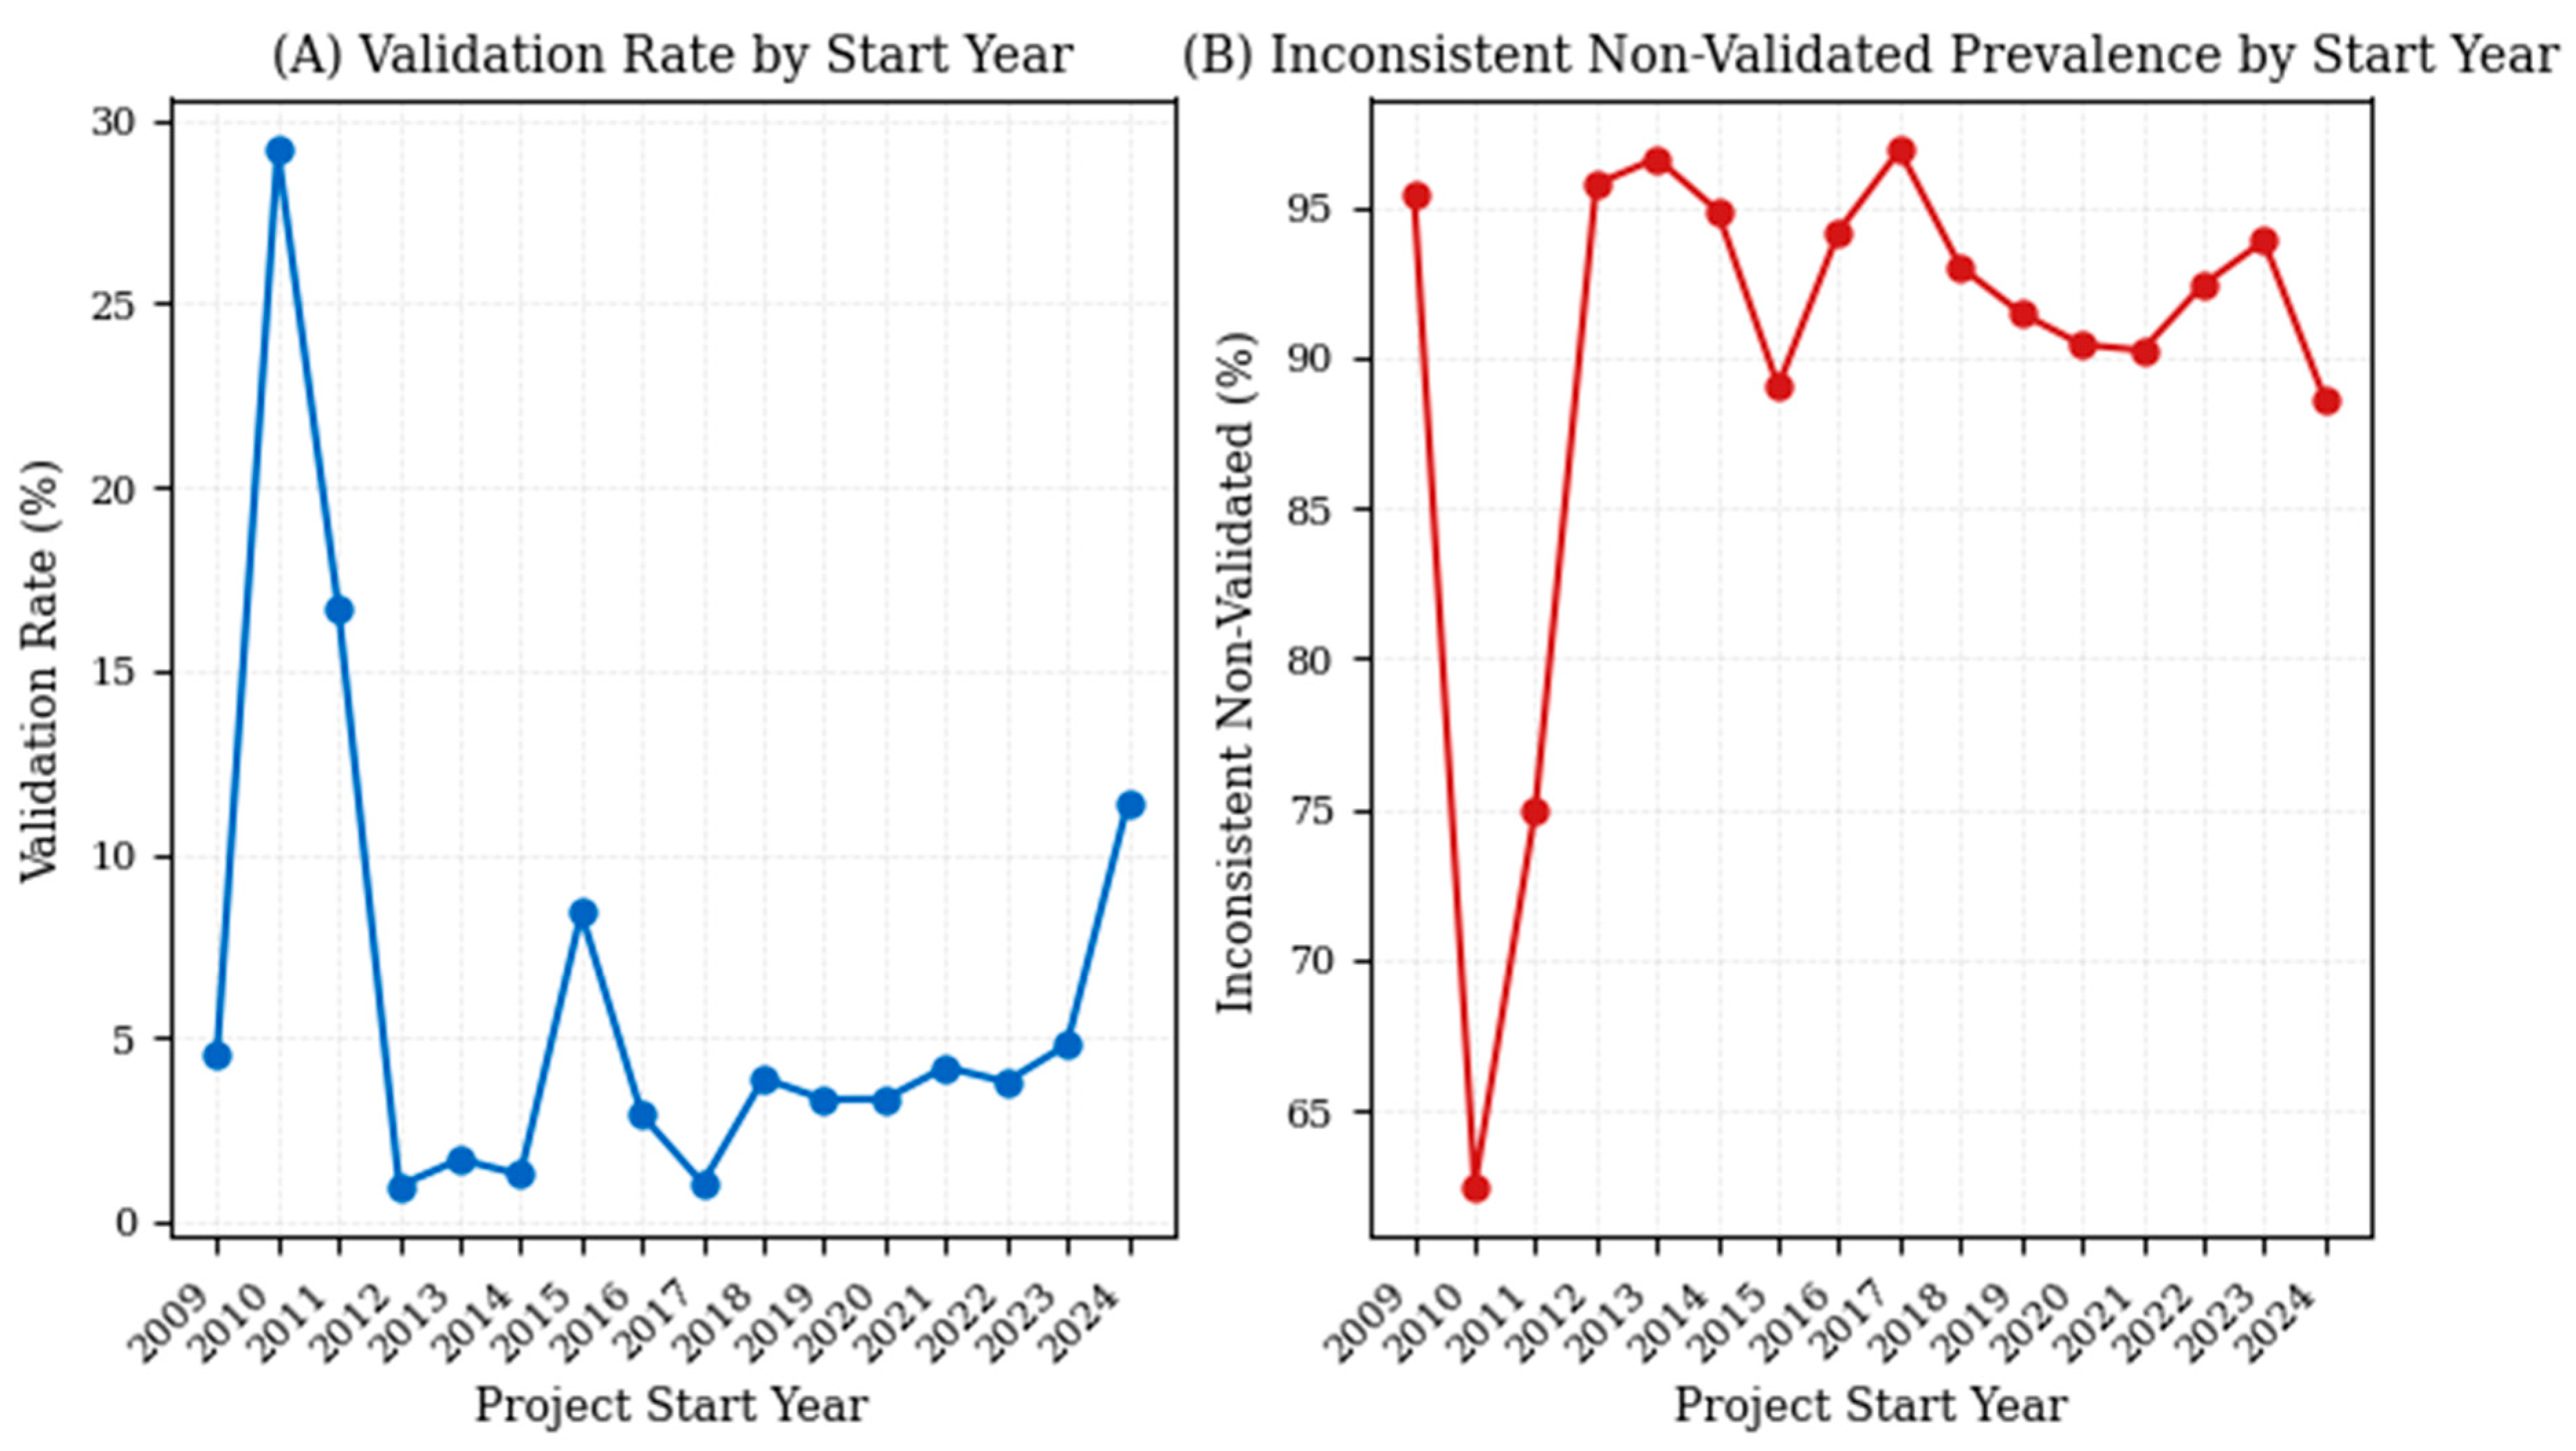
A temporal analysis across the 16 years with at least 20 registered projects (2009–2024; 435 records dated 1970 were excluded as a source-data placeholder rather than a genuine start date, see Supplementary Table S1) found no significant monotonic trend in validation rate (Spearman ρ = 0.026, p = 0.923) or Inconsistent Non-Validated prevalence (ρ = −0.171, p = 0.528), but a significant increasing trend in mean VDSI (ρ = 0.648, p = 0.007) over time (Figure 10; full year-by-year statistics in Supplementary Table S1). This indicates that while the share of projects flagged as Inconsistent Non-Validated has remained stable, their typical discourse similarity to validated-partnership language has increased somewhat over the observed period.
Finally, using Type of Partnership and Type of project, the two structured categorical fields available as compositional proxies in the absence of a country/region variable, the excluded-record subset did not differ significantly in composition from the retained corpus (both χ2 tests p > 0.09), but the language-artifact subset did differ significantly from the English-language subset on both fields (Type of Partnership: χ2 = 13.27, df = 6, p = 0.039; Type of project: χ2 = 8.47, df = 3, p = 0.037; Table 6).

4.7. Multivariable Analysis of Validation Status

To test whether the univariate partner-count effect persists after adjusting for potential confounders, a multivariable logistic regression predicted validation status from partner count, SDG scope, description length, project duration, topic assignment, and language-artifact status. The standard maximum-likelihood fit showed evidence of quasi-complete separation driven by language-artifact status (0% validation rate among artifact documents), so the model was refit via L2-regularized logistic regression. Partner count remained a strong and significant predictor after adjustment (adjusted OR = 1.38 per standard-deviation increase, 95% CI: 1.24–1.54, p < 0.001), corroborating rather than merely repeating the univariate finding. SDG scope remained significantly negatively associated with validation (adjusted OR = 0.70 per SD, p = 0.001), while description length was not significantly associated with validation (adjusted OR = 1.12 per SD, p = 0.186); project duration was not significant (p = 0.809). Membership in the dominant Climate/Sanitation/Access topic was associated with substantially higher odds of validation (OR = 4.07, p < 0.001) relative to the reference topic grouping, while membership in the smaller Marine/Ocean/Fisheries topic was not significantly associated with validation (OR = 0.37, p = 0.116). A third substantive topic (Fashion/Industry/Textile) was excluded from the model entirely: with only 1 of its 125 member projects validated, its coefficient could not be estimated with any finite precision regardless of fitting method, so it was absorbed into the reference category. Coefficients for language-artifact status showed a wide confidence interval consistent with quasi-complete separation, an expected consequence of the 0% validation rate observed among language-artifact documents, and should be interpreted with corresponding caution. A class-weighted sensitivity model, addressing the corpus’s 4.0% validation base rate, produced a partner-count coefficient consistent in sign and magnitude with the primary model, indicating the adjusted effect is not an artifact of class imbalance (Table 7).

4.8. BERTopic Robustness

Given that BERTopic’s automatic topic-merging procedure was found to be a source of run-to-run instability, the target topic count was fixed at four, and we formally re-quantified the stability of the BERTopic solution under this fixed target. Refitting the model at min_topic_size = 15 across five random seeds consistently produced four topics in every case, with Adjusted Rand Index (ARI) against the reference solution ranging from 0.51 to 0.70 (mean = 0.64 across all five seeds; Table 8, Panel A). Varying the UMAP neighborhood parameter and the HDBSCAN cluster-selection method likewise produced four topics in every case, with ARI ranging from 0.32 to 0.81. Substituting an alternative sentence-embedding model (all-mpnet-base-v2) also converged to four topics, at lower agreement (ARI = 0.24), reflecting the expected effect of a genuinely different embedding space rather than a degenerate fit (Table 8, Panel B). Collectively, these results indicate that the topic count reported in Section 4.2 is now a stable, reproducible feature of the fixed pipeline configuration, while document-to-topic assignment retains moderate residual sensitivity to random initialization; the core structural and discourse-based findings, which do not depend on topic assignment, are unaffected either way.

5. Discussion

5.1. Thematic Architecture of UN SDG Partnership Discourse

The BERTopic analysis reveals a highly concentrated thematic architecture: approximately 61% of the corpus clusters within a single broad domain encompassing climate, sanitation, and access-related themes. This concentration reflects both the actual distribution of UN-registered partnerships, with clean water and sanitation (SDG 6) and health (SDG 3) consistently ranking among the most populated on the platform, and a genuine semantic convergence in partnership language. The marine and coastal domain forms a single, stable cluster under the fixed topic-count target (Marine, Ocean and Fisheries; n = 880; 23.1%) anchored by SDG 14 concerns, encompassing both marine-governance and marine-plastics-pollution discourse that an earlier, pre-fix iteration of this pipeline occasionally split into several smaller components, illustrating the instability that motivated fixing nr_topics rather than a substantive change in the platform’s underlying thematic composition. A further substantive cluster, Fashion, Industry, and Textile (n = 125; 3.3%), stable in both size and content across pipeline runs under the fixed topic-count target, emerged as a coherent thematic grouping anchored in sustainable materials, the circular economy, and brand accountability discourse. This cluster maps primarily onto SDG 12 (Responsible Consumption and Production), suggesting that voluntary UN platform registrations extend beyond traditional environmental and health domains to include emerging private-sector sustainability commitments linked to sustainable supply chains and circular economy initiatives.
The isolation of non-English clusters as language-processing artifacts reflects the platform’s overwhelmingly English-language composition. Multilingual analysis would require language-specific models or cross-lingual representations [36]. A total of 174 non-English documents (4.57% of the full pre-processed corpus of 3807 projects) were excluded from thematic interpretation, leaving an English-language analytical subset of N = 3633; VDSI comparisons were nonetheless computed over the full corpus, with both denominators reported in Section 4.4 to avoid ambiguity. As Section 4.6 shows, these language-artifact documents also differ from the English-language subset in validation rate, partner count, and partnership-type composition, indicating the exclusion is not fully compositionally neutral and should be read as a scope limitation rather than a purely technical filtering step.

5.2. Validated-Discourse Similarity and SDG Washing

The central empirical finding that 92.9% of registered projects exhibit Inconsistent Non-Validated resonates with, but requires a more measured connection to, the existing SDG washing literature than a purely descriptive reading of this percentage would suggest. As Section 4.4 reports, raw semantic similarity to the validated-partnership centroid discriminates validation status only modestly (AUC = 0.686), and the two groups’ similarity distributions overlap substantially (Figure 7A). We therefore read the 92.9% figure not as evidence that non-validated projects are indistinguishable from validated ones, but as evidence that a large share of non-validated projects deploy language that is, on this one dimension, closer to validated-partnership discourse than the platform’s minimal registration requirements alone would predict. Prior empirical work by Heras-Saizarbitoria, Urbieta, and Boiral [3] and Costa, Tiburzi, Morales-Alonso, Calabrese, and Rosati [5] documented symbolic SDG engagement in corporate sustainability reporting; our findings suggest an analogous, if more modest, pattern within the voluntary commitment architecture of the UN Partnership Platform itself, where registration barriers are minimal and validation is the exception rather than the rule.
It is important to acknowledge a structural feature of the VDSI formulation: by construction, non-validated projects receive non-negative VDSI values and validated projects receive non-positive values, since the validation indicator is subtracted directly from the normalized similarity score and because the normalizing scaler is itself fitted on the non-validated distribution. This directional separation therefore follows mathematically from the index construction rather than from any property of the data. As reported in Section 4.4, the substantive empirical finding does not rest on this directional separation per se, but on the raw (pre-normalization) similarity scores themselves, which differ significantly between groups (permutation p < 0.001) while discriminating validation status only modestly (AUC = 0.686), together indicating that the observed proximity of non-validated projects to validated-partnership language is a genuine, if partial, empirical property rather than a normalization artifact.
The concentration of non-validated projects at high sim_norm values, as reflected in a corpus-wide mean VDSI of 0.576 ± 0.237, indicates that unvalidated projects employ language semantically proximate to validated projects at the embedding level.
van Zanten and van Tulder [4] proposed the nexus approach as a corrective, compelling companies to assess interactions across the full SDG system. The sensitivity analysis confirms that the Inconsistent Non-Validated finding is robust: even at the most conservative threshold, 73% of projects remain classified as Inconsistent Non-Validated, consistent with the risks highlighted by Chan, et al. [37] regarding voluntary sustainability governance, where nonstate mobilization campaigns often emphasize promises rather than actual progress against targets. Stafford-Smith, et al. [38] underscored that integration across SDG domains is the key to achieving the 2030 Agenda; our findings are consistent with discursive integration in partnership language having outpaced structural integration, though this study measures only the discursive dimension and does not directly assess structural integration.

5.3. Partner Count as a Structural Signal of Authentic Partnership

The medium-to-large effect size for partner count (r = −0.389) is the study’s most striking structural finding. Validated projects engage an average of 13.30 partner organizations, nearly three times the mean for non-validated projects (4.64); the disparity is even more pronounced at the median (7 vs. 2 partners; Section 4.3), reflecting the right-skewed distribution of this variable. This pattern persists across all six SDG subgroups examined, with the largest effect in the SDG 3 subgroup (r = −0.394), and survives adjustment for SDG scope, description length, project duration, topic, and language in a multivariable model (adjusted OR = 1.38 per standard-deviation increase in partner count, p < 0.001; Section 4.7). The consistency of this finding across both univariate and adjusted specifications suggests that partner count may partially constitute what platform verifiers assess: the existence of a genuinely diverse, multi-sector coalition [14,15].
This interpretation is consistent with Andonova [14]‘s analysis, which shows that governance entrepreneurs mobilize diverse coalitions to enhance the legitimacy of partnerships. Andonova, Hale, and Roger [26] further demonstrated that transnational governance arrangements and domestic policies function as complements rather than substitutes, underscoring that structural institutional investment amplifies rather than replaces formal commitment. Hahn and Pinkse [39] showed that the effectiveness of cross-sector partnerships in addressing environmental issues depends on whether competitive forces at the firm level align with the partnership’s collective benefits, a dynamic directly relevant to the validation process. The counterintuitive finding regarding the scope of the SDGs (r = 0.210, indicating that validated projects cover significantly fewer SDGs than non-validated projects) warrants attention and, as Section 4.7 shows, remains significant after adjusting for partner count, description length, duration, topic, and language (adjusted OR = 0.70 per standard-deviation increase, p = 0.001): organizations seeking symbolic alignment may reference many SDGs broadly to maximize perceived impact, while partnerships pursuing substantive implementation may invest more deeply in a smaller set of goals [5].

5.4. SDG-Level Heterogeneity and Priority Implications

SDG 6 (Clean Water and Sanitation) exhibits the highest mean VDSI (0.630), reflecting the long institutional history of water governance partnerships. SDG 3 shows both the highest validation prevalence (4.7%) and the largest partner count effect size (r = −0.394), consistent with the prominence of large-scale health consortia. SDG 4 has the lowest validation rate (2.5%), suggesting that validation mechanisms may be less accessible in the education domain.
Newig and Fritsch [40] showed that participatory and multi-level environmental governance arrangements produce more effective outcomes when they operate through highly polycentric structures and direct stakeholder interaction. A differentiated approach to validation outreach, prioritizing SDGs with high Inconsistent Non-Validated but low validation rates, could improve the platform’s accuracy as a governance accountability instrument. Van Tulder, et al. [41] similarly argued that transformative strategies and complex partnership portfolios are necessary to address the unequal distribution of SDG attention across sectors, driven by organizational cherry-picking. Furthermore, Widerberg and Pattberg [21] highlighted that accountability mechanisms in transnational governance regimes are most effective when structured around verifiable performance criteria.

5.5. Methodological Contributions and Limitations

The VDSI represents a methodological contribution beyond the specific substantive findings. By grounding the reference standard in independently validated partnerships and applying a leave-one-out centroid estimator to prevent information leakage, VDSI provides an interpretable similarity measure without assuming any particular structural form for the validated-partnership-text relationship. Boiral, et al. [42] demonstrated, through audit-based evidence, that sustainability reporting quality frequently falls short of verifiable standards, underscoring the need for accountability mechanisms to move beyond self-reported declarations.
A further methodological contribution concerns transparency about model stability. An earlier iteration of this pipeline found that BERTopic’s automatic topic-count selection was itself unstable across random seeds (ranging from 3 to 8 topics) and across minor variations in UMAP/HDBSCAN configuration, with one seed and one alternative embedding model producing degenerate clusterings that failed outright. Rather than treating this as an unavoidable property of BERTopic to be disclosed and worked around, we traced it to the automatic topic-merging step specifically and fixed the target topic count accordingly (Section 3.4). Section 4.8 confirms that, under this fixed target, topic count is now fully reproducible across seeds and configurations (mean ARI = 0.64), with only moderate residual sensitivity in document-to-topic assignment. We report both the original instability and the fix explicitly, together with the reference solution it affects, rather than presenting a single topic partition as a stable ground truth without explaining how that stability was achieved, a transparency practice we consider a necessary complement to any future application of BERTopic-based discourse analysis to governance-accountability questions, where the specific thematic boundaries drawn may otherwise be mistaken for a fixed property of the underlying corpus rather than a configuration choice made explicitly to ensure reproducibility.
Several limitations should be acknowledged. First, the corpus is predominantly English-language; 174 non-English documents (4.57% of the full corpus) were excluded from thematic interpretation. Unlike in earlier stages of this analysis, we were able to directly test whether these submissions differ systematically from English-language entries: Section 4.6 shows they have a significantly lower validation rate (0% vs. 4.21%), fewer partners, and a different partnership-type composition, confirming that this exclusion is not compositionally neutral and constitutes a genuine, quantified scope limitation rather than a purely technical filtering step. Second, the GENESIS database represents a cross-section, though a temporal analysis across 16 years of registration history (Section 4.6) found no significant trend in validation rate or Inconsistent Non-Validated prevalence, though mean VDSI showed a significant increasing trend over time, indicating the cross-sectional snapshot should not be treated as fully time-invariant. Third, VDSI operationalizes proximity to validated-partnership language but does not directly measure partnership effectiveness or impact, and the platform provides no independent effectiveness criterion against which to validate VDSI psychometrically; this remains an open direction for future work involving external outcome data. Fourth, the binary validation variable is an imperfect proxy for partnership quality. Fifth, the GENESIS database lacks a structured country, region, or economic-sector field; geographic representativeness could not be tested, and the structured proxies we could construct (Type of Partnership, Type of project; Section 4.6) are imperfect substitutes. Sixth, an earlier iteration of this pipeline found that BERTopic’s automatic topic-count selection (rather than HDBSCAN’s clustering itself) was a source of run-to-run instability: topic count ranged from 3 to 8 across random seeds and configurations, and one seed and one alternative embedding model produced degenerate clusterings. We traced this to the automatic topic-merging step and fixed the target topic count accordingly (Section 3.4); Section 4.8 confirms that topic count is now fully reproducible across seeds and configurations (mean ARI = 0.64), with only moderate residual sensitivity in document-to-topic assignment. We report this methodological history transparently because it illustrates a broader limitation of BERTopic-based discourse analysis for governance-accountability research: without an explicit, fixed target topic count, the specific thematic boundaries drawn can vary across nominally identical runs. The VDSI findings that anchor this study’s central contribution do not depend on this partition and were confirmed stable under resampling (Section 3.5 and Section 4.4).

6. Conclusions

The analysis is situated within a broader accountability frame articulated by Pogge and Sengupta [43], who argued that SDG implementation must be assessed not merely against aspirational commitments but against the structural conditions that enable rights-consistent delivery. This study applied BERTopic neural topic modeling to 3807 project descriptions in the GENESIS WP4 Multistakeholder Partnerships Database [32], introduced the Validated-Discourse Similarity Index as a novel measure of semantic alignment with validated-partnership discourse, and conducted systematic statistical comparisons between validated and non-validated partnerships.
Four principal conclusions emerge. First, the thematic architecture of UN SDG partnership discourse is highly concentrated, with approximately 61% of the corpus clustering within a Climate, Sanitation, and Access domain, alongside secondary marine/coastal and sustainable-textile domains. Second, a pervasive Inconsistent Non-Validated phenomenon characterizes the partnership ecosystem: 92.9% of registered projects employ language resembling that of independently validated partnerships, though raw semantic similarity discriminates validation status only modestly (AUC = 0.686), indicating a genuine but partial signal rather than indistinguishability between groups, a finding nonetheless robust across sensitivity analyses spanning a wide range of thresholds. This constitutes among the first corpus-scale empirical documentation of discourse-similarity patterns relative to validation status in the UN Partnership Platform and extends SDG-washing scholarship beyond corporate reporting into the arena of multilateral voluntary commitments. Third, partner count is the most consistent structural discriminator of validated partnerships (r = −0.389, medium effect; adjusted OR = 1.38 per standard-deviation increase after controlling for SDG scope, description length, duration, topic, and language), persisting across all six SDG subgroups examined. Fourth, an initial multi-seed and multi-parameter check revealed that BERTopic’s automatic topic-count selection was itself unstable (topic count ranging from 3 to 8 under nominally identical hyperparameters); tracing this to the automatic topic-merging step and fixing the target topic count resolved it, and a follow-up robustness check confirmed stable topic counts with moderate assignment-level agreement (mean ARI = 0.64), a methodological refinement we report transparently, together with the instability that motivated it, rather than treating automatic topic-count selection as reliable by default.
Platform administrators and accountability bodies may find partner count a useful preliminary signal to explore in validation outreach strategies, though the present analysis does not establish an operational cutoff: the observed mean partner count for non-validated projects is 4.64, while validated projects average 13.30, but sensitivity, specificity, and predictive value for any specific threshold remain unassessed. Whether partnerships reporting fewer than five partners warrant additional scrutiny is therefore best treated as a preliminary hypothesis requiring prospective, out-of-sample validation before any operational use, rather than as a ready-to-deploy screening rule. Any future algorithmic triage system built on such a threshold should be designed as an advisory tool rather than an automatic gate, with clear appeal mechanisms and human oversight, and with attention to the risk that genuine small-coalition partnerships, particularly those from under-resourced contexts in the Global South, may be disadvantaged. The VDSI is most appropriately deployed as a retrospective audit instrument or as a formative feedback tool provided to applicants at the point of registration rather than as an opaque filter, so that organizations can identify areas of low semantic alignment with validated-partnership discourse and strengthen their partnership architecture before seeking validation. In practice, VDSI is best understood as an early screening signal rather than a substitute for substantive assessment: projects whose discourse closely resembles that of already validated partnerships could be assigned lower review priority, allowing UN Partnership Platform administrators to concentrate limited verification capacity on projects whose language diverges most from the validated reference group. This positions VDSI within the broader responsible digital innovation agenda: transparency of the scoring logic, auditability of the model, and equitable access to feedback are essential governance requirements for any NLP-based platform accountability system. Future research should develop multilingual VDSI models [36] to include non-English partnership documentation, an extension made more pressing by our finding that language-artifact documents differ systematically from the English-language corpus in validation rate and partnership-type composition (Section 4.6), extract geographic and sectoral metadata via named-entity recognition to enable representativeness checks that the current dataset’s structure precludes, and apply dynamic topic modeling to track the temporal evolution of partnership discourse as the 2030 deadline approaches, extending the static year-level analysis reported here (Section 4.6). Future applications of BERTopic to governance-accountability questions should fix the target topic count explicitly rather than relying on automatic topic-count selection and report multi-seed stability diagnostics under that fixed target, given the instability specifically traced to automatic selection in Section 4.8. As the international community confronts a significant shortfall against SDG targets, the capacity to distinguish partnerships that mobilize genuine multi-sector coalitions from those that appropriate partnership language for legitimization has become a governance imperative [5,44]. Stibbe and Prescott [33] offer a normative framework for building high-impact partnerships; our findings provide the empirical evidence base for evaluating departures from that standard at corpus scale.


Supplementary Materials

The following supporting information can be downloaded at: https://www.mdpi.com/article/10.3390/su18157638/s1, Table S1: Year-by-year validation rate, mean VDSI, and Inconsistent Non-Validated prevalence (years with n ≥ 20 registered projects, 2009–2024); Table S2: Illustrative examples from each VDSI category (project titles as registered in the public GENESIS database; descriptions truncated).

Author Contributions

Conceptualization, E.Ö. and Ü.Y.; methodology, Ü.Y.; software, Ü.Y.; validation, E.Ö. and Ü.Y.; formal analysis, Ü.Y.; investigation, E.Ö. and Ü.Y.; resources, E.Ö.; data curation, Ü.Y.; writing—original draft preparation, E.Ö. and Ü.Y.; writing—review and editing, E.Ö. and Ü.Y.; visualization, Ü.Y.; supervision, E.Ö.; project administration, E.Ö. All authors have read and agreed to the published version of the manuscript.

Funding

This research received no external funding.

Institutional Review Board Statement

Not applicable.

Informed Consent Statement

Not applicable.

Data Availability Statement

The dataset is publicly available at https://doi.org/10.5281/zenodo.17940564. The analysis notebook, including all preprocessing, modeling, and robustness-check code, model parameters, and random seeds, is publicly available at https://github.com/umityilmax-gif/genesis-vdsi-analysis/ (accessed on 19 July 2026).

Conflicts of Interest

The authors declare no conflicts of interest.

References

  1. United Nations. Transforming Our World: The 2030 Agenda for Sustainable Development; United Nations: New York, NY, USA, 2015; p. 35. [Google Scholar]
  2. Glass, L.-M.; Newig, J.; Ruf, S. MSPs for the SDGs—Assessing the collaborative governance architecture of multi-stakeholder partnerships for implementing the Sustainable Development Goals. Earth Syst. Gov. 2023, 17, 100182. [Google Scholar] [CrossRef] [Scilit]
  3. Heras-Saizarbitoria, I.; Urbieta, L.; Boiral, O. Organizations’ engagement with sustainable development goals: From cherry-picking to SDG-washing? Corp. Soc. Responsib. Environ. Manag. 2022, 29, 316–328. [Google Scholar] [CrossRef] [Scilit]
  4. van Zanten, J.A.; van Tulder, R. Improving companies’ impacts on sustainable development: A nexus approach to the SDGS. Bus. Strategy Environ. 2021, 30, 3703–3720. [Google Scholar] [CrossRef] [Scilit]
  5. Costa, R.; Tiburzi, L.; Morales-Alonso, G.; Calabrese, A.; Rosati, F. SDG walking or washing? A cross-sectoral analysis of business contribution to the SDGs. Bus. Strategy Environ. 2025, 34, 3561–3576. [Google Scholar] [CrossRef] [Scilit]
  6. Matsui, T.; Suzuki, K.; Ando, K.; Kitai, Y.; Haga, C.; Masuhara, N.; Kawakubo, S. A natural language processing model for supporting sustainable development goals: Translating semantics, visualizing nexus, and connecting stakeholders. Sustain. Sci. 2022, 17, 969–985. [Google Scholar] [CrossRef] [Scilit] [PubMed]
  7. Raman, R.; Ray, S.; Das, D.; Nedungadi, P. Innovations and barriers in sustainable and green finance for advancing sustainable development goals. Front. Environ. Sci. 2025, 12, 1513204. [Google Scholar] [CrossRef] [Scilit]
  8. Reimers, N.; Gurevych, I. Sentence-BERT: Sentence Embeddings using Siamese BERT-Networks. In Proceedings of the 2019 Conference on Empirical Methods in Natural Language Processing and the 9th International Joint Conference on Natural Language Processing (EMNLP-IJCNLP), Hong Kong, China, 3–7 November, 2019; pp. 3982–3992. [Google Scholar]
  9. McInnes, L.; Healy, J.; Saul, N.; Großberger, L. UMAP: Uniform Manifold Approximation and Projection. J. Open Source Softw. 2018, 3, 861. [Google Scholar] [CrossRef] [Scilit]
  10. Campello, R.J.G.B.; Moulavi, D.; Sander, J. Density-Based Clustering Based on Hierarchical Density Estimates. In Advances in Knowledge Discovery and Data Mining; Springer: Berlin/Heidelberg, Germany, 2013; pp. 160–172. [Google Scholar]
  11. McInnes, L.; Healy, J.; Astels, S. hdbscan: Hierarchical density based clustering. J. Open Source Softw. 2017, 2, 205. [Google Scholar] [CrossRef] [Scilit]
  12. Benjamini, Y.; Hochberg, Y. Controlling the False Discovery Rate: A Practical and Powerful Approach to Multiple Testing. J. R. Stat. Soc. Ser. B Methodol. 1995, 57, 289–300. [Google Scholar] [CrossRef] [Scilit]
  13. Widerberg, O.; Fast, C.; Rosas, M.K.; Pattberg, P. Multi-stakeholder partnerships for the SDGs: Is the “next generation” fit for purpose? Int. Environ. Agreem. Politics Law Econ. 2023, 23, 165–171. [Google Scholar] [CrossRef] [Scilit]
  14. Andonova, L.B. Public-Private Partnerships for the Earth: Politics and Patterns of Hybrid Authority in the Multilateral System. Glob. Environ. Politics 2010, 10, 25–53. [Google Scholar] [CrossRef] [Scilit]
  15. Pattberg, P.; Widerberg, O. Transnational multistakeholder partnerships for sustainable development: Conditions for success. Ambio 2016, 45, 42–51. [Google Scholar] [CrossRef] [Scilit] [PubMed]
  16. Biermann, F.; Abbott, K.; Andresen, S.; Bäckstrand, K.; Bernstein, S.; Betsill, M.M.; Bulkeley, H.; Cashore, B.; Clapp, J.; Folke, C.; et al. Navigating the Anthropocene: Improving Earth System Governance. Science 2012, 335, 1306–1307. [Google Scholar] [CrossRef] [Scilit] [PubMed]
  17. Biermann, F.; Pattberg, P.; van Asselt, H.; Zelli, F. The Fragmentation of Global Governance Architectures: A Framework for Analysis. Glob. Environ. Politics 2009, 9, 14–40. [Google Scholar] [CrossRef] [Scilit]
  18. Bäckstrand, K. Multi-stakeholder partnerships for sustainable development: Rethinking legitimacy, accountability and effectiveness. Eur. Environ. 2006, 16, 290–306. [Google Scholar] [CrossRef] [Scilit]
  19. Westerman, J.W.; Acikgoz, Y.; Nafees, L.; Westerman, J. When sustainability managers’ greenwash: SDG fit and effects on job performance and attitudes. Bus. Soc. Rev. 2022, 127, 371–393. [Google Scholar] [CrossRef] [Scilit]
  20. Erdem Türkelli, G. Transnational Multistakeholder Partnerships as Vessels to Finance Development: Navigating the Accountability Waters. Glob. Policy 2021, 12, 177–189. [Google Scholar] [CrossRef] [Scilit]
  21. Widerberg, O.; Pattberg, P. Accountability Challenges in the Transnational Regime Complex for Climate Change. Rev. Policy Res. 2017, 34, 68–87. [Google Scholar] [CrossRef] [Scilit]
  22. Blei, D.M.; Ng, A.Y.; Jordan, M.I. Latent dirichlet allocation. J. Mach. Learn. Res. 2003, 3, 993–1022. [Google Scholar]
  23. Devlin, J.; Chang, M.-W.; Lee, K.; Toutanova, K. BERT: Pre-Training of Deep Bidirectional Transformers for Language Understanding. In Proceedings of the 2019 Conference of the North American Chapter of the Association for Computational Linguistics (NAACL), Minneapolis, MN, USA, 2–7 June 2019; pp. 4171–4186. [Google Scholar]
  24. Egger, R.; Yu, J. A Topic Modeling Comparison Between LDA, NMF, Top2Vec, and BERTopic to Demystify Twitter Posts. Front. Sociol. 2022, 7, 886498. [Google Scholar] [CrossRef] [Scilit] [PubMed]
  25. Lee, H.; Lee, S.-H.; Lee, K.-R.; Kim, J.-H. ESG Discourse Analysis Through BERTopic: Comparing News Articles and Academic Papers. Comput. Mater. Contin. 2023, 75, 6023–6037. [Google Scholar] [CrossRef] [Scilit]
  26. Andonova, L.B.; Hale, T.N.; Roger, C.B. National Policy and Transnational Governance of Climate Change: Substitutes or Complements? Int. Stud. Q. 2017, 61, 253–268. [Google Scholar] [CrossRef] [Scilit]
  27. Cho, C.H.; Laine, M.; Roberts, R.W.; Rodrigue, M. Organized hypocrisy, organizational façades, and sustainability reporting. Account. Organ. Soc. 2015, 40, 78–94. [Google Scholar] [CrossRef] [Scilit]
  28. Christensen, H.B.; Hail, L.; Leuz, C. Mandatory CSR and sustainability reporting: Economic analysis and literature review. Rev. Account. Stud. 2021, 26, 1176–1248. [Google Scholar] [CrossRef] [Scilit]
  29. Mezzanotte, F.E. Corporate sustainability reporting: Double materiality, impacts, and legal risk. J. Corp. Law Stud. 2023, 23, 633–663. [Google Scholar] [CrossRef] [Scilit]
  30. de Villiers, C.; Rinaldi, L.; Unerman, J. Integrated Reporting: Insights, gaps and an agenda for future research. Account. Audit. Account. J. 2014, 27, 1042–1067. [Google Scholar] [CrossRef] [Scilit]
  31. Roszkowska-Menkes, M.; Aluchna, M.; Kamiński, B. True transparency or mere decoupling? The study of selective disclosure in sustainability reporting. Crit. Perspect. Account. 2024, 98, 102700. [Google Scholar] [CrossRef] [Scilit]
  32. Bermúdez Bretón, M.A. GENESIS Database on Multistakeholder Partnerships for Sustainable Development, version 1; Zenodo: Geneva, Switzerland, 2025. [Google Scholar] [CrossRef]
  33. Stibbe, D.; Prescott, D. THE SDG PARTNERSHIP GUIDEBOOK: A Practical Guide to Building Highimpact Multi-Stakeholder Partnerships for the Sustainable Development Goals; The Partnering Initiative and UNDESA 2020; United Nations: New York, NY, USA, 2022. [Google Scholar]
  34. Wang, W.; Wei, F.; Dong, L.; Bao, H.; Yang, N.; Zhou, M. MINILM: Deep self-attention distillation for task-agnostic compression of pre-trained transformers. In Proceedings of the 34th International Conference on Neural Information Processing Systems, Vancouver, BC, Canada, 6–12 December 2020; p. 485. [Google Scholar]
  35. Röder, M.; Both, A.; Hinneburg, A. Exploring the Space of Topic Coherence Measures. In Proceedings of the Eighth ACM International Conference on Web Search and Data Mining, Shanghai, China, 31 January–6 February 2015; pp. 399–408. [Google Scholar]
  36. Conneau, A.; Khandelwal, K.; Goyal, N.; Chaudhary, V.; Wenzek, G.; Guzmán, F.; Grave, E.; Ott, M.; Zettlemoyer, L.; Stoyanov, V. Unsupervised Cross-lingual Representation Learning at Scale. In Proceedings of the ACL 2020, Online, 5–10 July 2020; pp. 8440–8451. [Google Scholar]
  37. Chan, S.; Boran, I.; van Asselt, H.; Iacobuta, G.; Niles, N.; Rietig, K.; Scobie, M.; Bansard, J.S.; Delgado Pugley, D.; Delina, L.L.; et al. Promises and risks of nonstate action in climate and sustainability governance. WIREs Clim. Change 2019, 10, e572. [Google Scholar] [CrossRef] [Scilit]
  38. Stafford-Smith, M.; Griggs, D.; Gaffney, O.; Ullah, F.; Reyers, B.; Kanie, N.; Stigson, B.; Shrivastava, P.; Leach, M.; O’Connell, D. Integration: The key to implementing the Sustainable Development Goals. Sustain. Sci. 2017, 12, 911–919. [Google Scholar] [CrossRef] [Scilit] [PubMed]
  39. Hahn, T.; Pinkse, J. Private Environmental Governance Through Cross-Sector Partnerships:Tensions Between Competition and Effectiveness. Organ. Environ. 2014, 27, 140–160. [Google Scholar] [CrossRef] [Scilit]
  40. Newig, J.; Fritsch, O. Environmental governance: Participatory, multi-level—And effective? Environ. Policy Gov. 2009, 19, 197–214. [Google Scholar] [CrossRef] [Scilit]
  41. Van Tulder, R.; Rodrigues, S.B.; Mirza, H.; Sexsmith, K. The UN’s Sustainable Development Goals: Can multinational enterprises lead the Decade of Action? J. Int. Bus. Policy 2021, 4, 1–21. [Google Scholar] [CrossRef] [Scilit]
  42. Boiral, O.; Heras-Saizarbitoria, I.; Brotherton, M.-C. Assessing and Improving the Quality of Sustainability Reports: The Auditors’ Perspective. J. Bus. Ethics 2019, 155, 703–721. [Google Scholar] [CrossRef] [Scilit]
  43. Pogge, T.; Sengupta, M. Assessing the sustainable development goals from a human rights perspective. J. Int. Comp. Soc. Policy 2016, 32, 83–97. [Google Scholar] [CrossRef] [Scilit]
  44. Sachs, J.D.; Schmidt-Traub, G.; Mazzucato, M.; Messner, D.; Nakicenovic, N.; Rockström, J. Six Transformations to Achieve the Sustainable Development Goals. Nat. Sustain. 2019, 2, 805–814. [Google Scholar] [CrossRef] [Scilit]
Figure 1. Exploratory data analysis—GENESIS MSP database (N = 3807): (A) validation status distribution (non-validated vs. validated project counts); (B) kernel density of the number of SDGs covered per project, by validation status; (C) kernel density of partner count per project (capped at 40), by validation status; (D) project frequency by SDG (SDG 1–17).
Sustainability 18 07638 g001
Figure 2. BERTopic hyperparameter selection via C_V coherence.
Sustainability 18 07638 g002
Figure 3. UMAP projection of project embeddings. Panel (A) shows discourse clusters by topic; Panel (B) overlays validation status. Full topic labels: T0 = Climate, Sanitation, and Access; T1 = Marine, Ocean, and Fisheries; T2 = combined non-English-language artifact cluster; T3 = Fashion, Industry, and Textile.
Sustainability 18 07638 g003
Figure 4. Topic Keyword Profiles: Top-8 c-TF-IDF Terms per Topic (N = 4 Topics).
Sustainability 18 07638 g004
Figure 5. Structural feature comparison: Validated vs. non-validated projects.
Sustainability 18 07638 g005
Figure 6. Validated-Discourse Similarity (VDSI) Analysis: (A) distribution of VDSI scores by validation status (blue = non-validated, red = validated), with reference lines at VDSI = 0, +0.3, and −0.3; (B) VDSI score versus partner count (capped at 30), colored by VDSI category (Ambiguous, Consistent Non-Validated, Consistent Validated, Inconsistent Non-Validated, Inconsistent Validated); (C) spatial distribution of VDSI scores across the UMAP projection; (D) number of projects in each VDSI category, with counts and percentages of the full corpus.
Sustainability 18 07638 g006
Figure 7. Raw semantic similarity: Distribution and discriminative power: (A) distribution of raw (pre-normalization) cosine similarity to the validated-partnership centroid, by validation status; (B) ROC curve showing raw similarity as a continuous classifier of validation status.
Sustainability 18 07638 g007
Figure 8. SDG-level subgroup analysis: (A) validation rate by SDG; (B) mean VDSI by SDG; (C) discourse inconsistency (Inconsistent Non-Validated and Inconsistent Validated project counts) by SDG; (D) partner count comparison (validated vs. non-validated) by SDG, with asterisks indicating FDR-adjusted significance (Mann–Whitney U, p < 0.05).
Sustainability 18 07638 g008
Figure 9. Topic–validation alignment across: Top 3 topics by validation rate: (A) validation rate by topic; (B) mean VDSI score by topic.
Sustainability 18 07638 g009
Figure 10. Temporal trend in (A) validation rate and (B) Inconsistent Non-Validated prevalence by project start year (2009–2024; years with n ≥ 20 projects).
Sustainability 18 07638 g010
Table 1. Mann–Whitney U test results: structural feature comparison (N = 3807; rank-biserial correlation as effect size; Benjamini–Hochberg FDR correction applied). r_rb is computed with non-validated as group 1 and validated as group 2; a negative value indicates validated projects rank higher on the feature.
FeatureValidated MeanNon-Validated Meanp (FDR-adj.)Sig.r_rbEffect
Number of Partners13.304.64<0.001Yes−0.389Medium
SDG Scope (count)3.825.31<0.001Yes0.210Small
Description Length (chars)1230.851123.420.013Yes−0.122Small
Project Duration (days)1290.781419.160.004Yes−0.180Small
Topic Coherence (prob.)0.780.760.926No−0.004Negligible
Table 2. Distributional summary (median/IQR), reported alongside Table 1’s means given the right-skewed distributions of these variables.
VariableValidated MedianValidated IQRNon-Val. MedianNon-Val. IQR
Number of Partners7.0[2.0, 15.0]2.0[1.0, 6.0]
SDG Scope (count)3.0[1.0, 5.0]4.0[2.0, 7.0]
Description Length (chars)897.0[622.0, 1589.0]700.0[423.0, 1699.0]
Project Duration (days)1825.5[730.8, 3575.8]1096.0[334.0, 2468.5]
Table 3. VDSI threshold sensitivity analysis. Percentages are computed on the full pre-processed corpus (N = 3807).
ThresholdInconsistent Non-Validated (n)Inconsistent Non-Validated (%)Inconsistent Validated (n)
±0.20362795.3104
±0.25360094.681
±0.30 *353892.963
±0.35344990.643
±0.40330386.835
±0.45307780.825
±0.50278173.017
* Primary threshold (approx. 1 SD of non-validated similarity distribution).
Table 4. SDG-level subgroup statistics (Mann–Whitney U; rank-biserial r as effect size; BH FDR correction applied within each subgroup).
SDGnn_ValidatedValidated %Mean VDSIp_Partner (FDR)Sig.r_rb (Partner)
SDG 2 (Zero Hunger)1330403.0%0.597<0.001Yes−0.363
SDG 3 (Good Health)1261594.7%0.564<0.001Yes−0.394
SDG 4 (Quality Education)1744432.5%0.5570.012Yes−0.213
SDG 6 (Clean Water)1786814.5%0.630<0.001Yes−0.357
SDG 13 (Climate Action)1537452.9%0.6170.011Yes−0.219
SDG 17 (Partnerships)1537603.9%0.595<0.001Yes−0.293
Table 5. Sample representativeness checks: structural and validation-rate comparisons across three exclusion/flagging boundaries. Effect sizes (r_rb) use rank-biserial correlation; validation-rate comparisons use Fisher’s exact test. Panel A. Excluded (short-text, n = 170) vs. Included (n = 3637); Panel B. Language-Artifact (n = 174) vs. English (n = 3633); Panel C. Outlier (topic = −1, n = 301) vs. Clustered (n = 3506).
Panel A
VariableExcludedIncludedpr_rb
Number of Partners3.254.99<0.0010.156
SDG Scope (count)6.235.250.105−0.073
Validation rate4.12%4.02%0.843 (Fisher)
Panel B
VariableArtifactEnglishp (FDR)r_rb
Number of Partners3.715.050.0020.150
SDG Scope (count)6.095.210.108−0.080
Description Length (chars)1212.871123.660.160−0.063
Validation rate0.00%4.21%<0.001 (Fisher)
Panel C
VariableOutlierClusteredpr_rb
Number of Partners5.014.990.1090.053
SDG Scope (count)4.575.300.0610.065
Description Length (chars)1081.171131.730.5250.022
Validation rate1.99%4.19%0.066 (Fisher)
Table 6. Sectoral/partnership-type representativeness (chi-square tests): Type of partnership and Type of project composition across the same two comparisons as Table 5 Panels A and B.
Comparisonχ2dfp
Type of Partnership (Excluded vs. Included)10.9260.091
Type of Project (Excluded vs. Included)1.3730.713
Type of Partnership (Artifact vs. English)13.2760.039
Type of Project (Artifact vs. English)8.4730.037
Table 7. Multivariable logistic regression predicting validation status. Continuous predictors are z-scored (odds ratios are per 1-SD increase).
VariableORCI (Low)CI (High)p
Partner count (z)1.3811.2431.536<0.001
SDG scope (z)0.7030.5680.8710.001
Description length (z)1.1200.9471.3240.186
Duration, imputed (z)0.9770.8071.1820.809
Has end date0.3420.2340.500<0.001
Language-artifact status0.3940.0513.0600.373
Topic 0 (Climate)4.0671.8548.925<0.001
Topic 1 (Marine)0.3670.1051.2800.116
Topic 3 (Fashion/Industry/Textile) was excluded from the topic-dummy set: with only 1 of 125 projects validated, its coefficient could not be estimated with any finite precision regardless of fitting method, and it is absorbed into the reference category along with outliers and the language-artifact cluster. Confidence intervals for language-artifact status reflect an L2-regularized fit due to quasi-complete separation (0% validation rate among artifact documents; Table 5, Panel B) and should be treated as approximate.
Table 8. BERTopic robustness: agreement with the reference solution (seed = 42, min_topic_size = 15) across random seeds and across alternative hyperparameters/embedding model, quantified via Adjusted Rand Index (ARI). Panel A. Random-seed variation (min_topic_size = 15, fixed); Panel B. Alternative hyperparameters and embedding model.
Panel A
Seedn_topicsARI vs. Ref.C_V CoherenceStatus
140.6970.642Ok
740.6350.612Ok
12340.6780.631Ok
202440.6580.621Ok
99940.5110.607Ok
Panel B
Variantn_topicsARI vs. Ref.Status
UMAP n_neighbors = 1040.486Ok
UMAP n_neighbors = 3040.324Ok
HDBSCAN cluster_selection = ‘leaf’40.812Ok
Embedding model: all-mpnet-base-v240.239Ok
Disclaimer/Publisher’s Note: The statements, opinions and data contained in all publications are solely those of the individual author(s) and contributor(s) and not of MDPI and/or the editor(s). MDPI and/or the editor(s) disclaim responsibility for any injury to people or property resulting from any ideas, methods, instructions or products referred to in the content.