Article

Evaluating Post-Investment Performance of Innovative SMEs in European Widening Countries: A Decision Tree Approach


by
Ana Đorđević
1,*,
Lidia Petrova Galabova
2,
Milena Rajić
1,
Ivana Janković
1 and
Milica Mladenović
1
1
Faculty of Mechanical Engineering Niš, University of Niš, 18000 Niš, Serbia
2
Faculty of Management, Technical University of Sofia, 1000 Sofia, Bulgaria
*
Author to whom correspondence should be addressed.
Sustainability 2026, 18(15), 7573; https://doi.org/10.3390/su18157573
Submission received: 29 May 2026 / Revised: 20 July 2026 / Accepted: 21 July 2026 / Published: 24 July 2026
(This article belongs to the Special Issue Sustainable Leadership and Strategic Management in SMEs)

Abstract

Innovative small and medium-sized enterprises (SMEs) in European Widening Countries face persistent financing gaps, yet empirical evidence on how modern financing instruments shape post-investment performance trajectories remains scarce. This study applies a decision tree classification approach to examine post-investment revenue growth of 57 innovative SMEs across twelve European Widening Countries that received alternative financing grants, venture capital, business angel investment, or crowdfunding—between 2020 and 2022. Two research questions are addressed: which pre-investment firm characteristics predict revenue growth following modern financing, and how does the initial revenue level shape post-investment performance trajectories over a three-year observation window. Variable importance analysis indicates that pre-investment revenue level accounts for 83.9% of the predictive importance in the CART model, with development stage as the only secondary predictor (16.1%). Financing type was not identified as a discriminative predictor within the present sample. Low-revenue firms benefit most consistently from alternative financing, advancing an average of 1.51 revenue categories over three years, with 82.9% of firms exhibiting a growth trajectory. Medium-revenue firms exhibit a delayed growth pattern; and higher-revenue firms show persistent stagnation, suggesting a possible ceiling effect in post-investment revenue growth. The RQ1 model achieved cross-validated accuracy of 65.0%; the RQ2 model achieved 38.3%, reflecting the complexity of predicting four trajectory categories from a limited sample. These findings suggest that pre-investment firm characteristics may warrant greater attention alongside financing type when interpreting post-investment SME performance in Widening Country ecosystems. Complementary Logistic Regression and Random Forest analyses yielded broadly consistent results, providing additional support for the robustness of the reported findings.

1. Introduction

Small and medium-sized enterprises (SMEs) are the backbone of national economies, as they represent the most common type of business and are strongly connected with economic growth and development [1]. The European economy follows a similar pattern: with approximately 24.3 million SMEs representing 99.8% of all non-financial enterprises and nearly 85 million workers in 2022 [2], they produce roughly two-thirds of all private sector value added and are widely regarded as indispensable drivers of economic dynamism, regional cohesion, and inclusive growth [3,4]. Among these, innovative SMEs occupy a particularly strategic role: they are more agile, more knowledge-intensive, and more capable of generating the technological change required for long-run economic efficiency [5,6].
Despite their strategic importance, innovative SMEs face a chronic and structurally entrenched financing problem. The high level of risk, absence of tangible assets, and the difficulty investors face in assessing future performance create what the OECD has long termed the financing gap- a chasm between the capital needed to commercialize research-based innovations and what traditional financial intermediaries are willing to provide [7,8]. Modern financing instruments, including venture capital, business angel investment, grants, and crowdfunding, have emerged as the principal institutional response to this gap, and their diffusion has been especially important in European Widening Countries, where capital markets are thinner and innovation ecosystems less developed than in Western Europe [9,10].
While a substantial body of literature has examined which firm-level characteristics predict access to modern financing, considerably less attention has been directed at what happens after the investment is made. Existing research typically reports average treatment effects of financing on growth or productivity, without examining how the firm’s initial conditions, and particularly its pre-investment revenue level, shape the post-investment trajectory [8,11]. This represents an insufficiently explored research gap, particularly in the context of the widening countries, where heterogeneous institutional environments may produce structurally different outcomes across firms. Therefore, the research gap addressed in this study lies in the lack of evidence of success and scaling factors of innovative SMEs in widening countries, and how modern financing models influence the performance of these enterprises [12]. The term “Widening countries” in this study refers to countries facing insufficient investment in research and development, as well as a lack of centers of excellence capable of supporting innovation-driven development. Although these ecosystems differ, countries within this group share a similar level of investment in innovation R&D.
In order to investigate the addressed research gap, this paper applies a decision tree classification approach to a sample of 57 innovative SMEs across twelve European Widening Countries. Those companies received alternative forms of financing, including business angels investment, crowdfunding, venture capital, and grants between 2020 and 2022. Decision tree models are particularly suited for this analysis, since they can capture non-linear threshold effects and interaction patterns that conventional regression models cannot detect. In addition, their interpretability allows results to be translated to actionable insights for policymakers and investment agencies [13,14]. In order to support the above, this study addressed two research questions:
  • RQ1: What are the key pre-investment determinants of revenue growth in innovative SMEs following modern financing?
  • RQ2: How does the initial revenue level influence post-investment performance trajectories?
This study makes three key contributions to the literature. First, it provides one of the few empirical studies of post-investment revenue trajectories in innovative SMEs across European Widening Countries, addressing a gap in the existing literature that has predominantly focused on pre-investment determinants of financing access rather than post-investment outcomes. The term Widening Countries used in this study follows the official classification of the European Commission under the Horizon Europe—Widening Participation and Spreading Excellence programme. These countries are characterised by lower research and innovation performance, comparatively lower R&D investment, and less developed innovation ecosystems than most Western European countries.
Second, it advances the application of decision tree methodology in entrepreneurial finance research by demonstrating that machine learning classification models can effectively identify non-linear threshold effects and heterogeneous performance patterns that conventional regression approaches cannot capture. Third, by focusing specifically on Widening Countries (economies characterised by thinner capital markets, smaller innovation ecosystems, and limited internationalisation support), the study provides context-specific insights that extend the relevance of existing SME financing findings beyond well-developed Western European markets.
The study also offers several theoretical contributions. Within the analysed sample, pre-investment revenue level received greater importance in the fitted models than financing type, development stage, and firm size. This pattern suggests that firm conditions at the point of investment may warrant greater attention alongside the financing instrument, while the role of financing type should be examined further using larger and more balanced samples. Furthermore, the identification of three distinct trajectory profiles: consistent growth among low-revenue firms, a U-shaped recovery among medium-revenue firms, and persistent stagnation among high-revenue firms, contributes to a more granular understanding of how initial conditions shape post-financing development paths in resource-constrained innovation ecosystems.
The long-term economic sustainability of innovative SMEs is contingent not only on access to financing, but on the conditions under which that financing translates into sustained revenue growth and operational resilience. In resource-constrained innovation ecosystems such as those found in European Widening Countries, understanding the post-investment determinants of firm performance is therefore central to fostering economically sustainable SME development [15].

2. Theoretical Background

Innovation is a key driver of technological development and progress, and SMEs represent the primary organisational form through which innovation is born and commercialised. This innovation process typically represents the core value proposition that differentiates SMEs from other types of enterprises [16]. SMEs rely on R&D activities, which may be outsourced but are generally less financially intensive when conducted in-house. However not all of them are innovative, and the R&D process can also be complemented by alternative forms of innovation management, including effective human resource practices and collaborative teamwork, all of which are central to achieving and sustaining innovation success [17].
Firms typically grow by introducing new products or services, entering new markets, and adopting technology within their business processes. Research further indicates that larger firms generally achieve higher growth rates and stronger overall performance than smaller ones, underscoring that SME growth is shaped by a range of factors that can either enable or constrain business development [1].
However, despite recognized importance and innovation factor, SMEs frequently face difficulties in securing financial resources for further research and long-term development. Capital, both financial and non-financial, is among the primary determinants of SME growth [18]. Key challenges include limited access to markets, which directly affects their ability to grow and generate revenue, and difficulties attracting investment, as their activities are typically perceived as high risk [19]. One of the main reasons for start-up and SME failure is insufficient long-term financial support, a shortage of qualified and motivated employees, and inadequate protection of innovative business models [16]. To support these firms, many countries have developed dedicated support measures to maintain success of these types of enterprises [20].
Apart from investment, a critical underlying issue is the firm’s pre-investment capability to sustain the weight of ongoing operations. This challenge is particularly notable in developing economies, where accessing financial resources is both more important and more difficult, and where the quality of pre-investment support plays a decisive role in firm outcomes [21]. Firm growth can also be adversely affected by a range of external factors, including demographic instability, climate change, global health crises, and resource constraints [1]. Understanding market demand and aligning investment strategies accordingly represent essential pre-investment considerations [18]. Transparency and managerial competence are highlighted as key elements that enhance the attractiveness of SMEs to investors and facilitate growth [1]. Non-capital measures such as institutional capacity-building, including technical training and managerial advisory services, can significantly alleviate the growth obstacles faced by innovative enterprises [22]. Firms that invest in intangible assets, including design, software, training, organisational capability, and branding, tend to generate stronger innovative outputs and better sales performance than firms that rely on capital alone [23].
This suggests that the key determinants of revenue growth are often embedded in the firm’s knowledge base and capability structure before external financing arrives. Evidence on SME finance likewise emphasises that growth-oriented finance is most productive when firms possess the absorptive capacity to deploy it effectively, particularly in intangible and data-driven business models [24].

2.1. Contemporary Financing Models for Innovative SMEs

Innovative SMEs typically do not rely on conventional financing instruments such as bank loans or retained earnings, as these generate debt and increase the financial risk borne by early-stage firms [25,26]. Instead, equity-based instruments, including grants, venture capital (VC), business angel investment, and crowdfunding, have become the primary vehicles for financing innovative growth, as they reduce downside risk while providing non-financial value-adding support [27,28].
Venture capitalists not only invest in risk but provide managerial training, strategic guidance, and network linkages that young technology-oriented firms can leverage in difficult market conditions [9,11]. Empirical evidence from the European high-tech sector confirms that VC-backed companies achieve significantly higher productivity gains in the one to three years following investment relative to non-backed peers, and that this divergence reflects genuine value creation rather than ex-ante selection of superior firms [11]. The presence of one form of modern capital, such as a grant, can also serve as a signal that attracts subsequent private investment, meaning that grant financing and VC are often complementary rather than substitutable [29,30].
In contexts where private VC activity is insufficient, government-funded programmes have been established across Europe to fill the gap [9,31]. The EU SME Instrument and the recently established European Innovation Council (EIC) Accelerator were subsequently introduced to provide blended finance to high-ambition innovative SMEs across member states, directly targeting research and innovation gaps at early and high-risk stages of technological activity [10]. Business angels play a complementary role: beyond capital, they provide mentoring, networks, and strategic guidance that contribute to ecosystem development [32]. During the COVID-19 pandemic, crowdfunding platforms further demonstrated their importance as a resilient financing channel when other sources contracted [33].
Although bank loans and tax incentives are recognised as financing instruments [26,34], the present study treats only grants, VC, business angel investment, and crowdfunding as modern financing, consistent with the equity-based framing of the financing gap literature. SMEs in developing and transition economies face particularly significant obstacles in accessing appropriate financing [35], and the development of innovative SMEs in these contexts remains insufficiently linked to financing modality in the existing literature [21].

2.2. Pre-Investment Signals and Post-Investment Performance

A considerable body of literature has examined which firm-level characteristics predict access to external finance. Human capital of founders, patents, prior revenue trends, sectoral affiliation, and innovative potential have all been identified as strong pre-investment signals that inform investor screening decisions [8,36,37]. A large-scale survey of private equity investors confirms that revenue growth is the single most important investment consideration, while value-addition capacity and management track record are comparatively less decisive [38]. Evidence from the German context further establishes that VC-backed firms already exhibit superior innovative performance before investment, confirming that investor screening, rather than post-investment support, is a fundamental driver of the perceived innovation advantage of VC-backed firms [39].
Whereas pre-investment determinants of financing access have received extensive coverage, considerably less attention has been directed at the post-investment trajectory of innovative SMEs. Existing literature typically reports average treatment effects of financing through growth or productivity measures, without examining how initial conditions, such as the firm’s revenue level at the time of investment, shape the trajectory that follows [8]. Both the regression-to-the-mean effect and the varying absorptive capacity of firms at different stages of development suggest that externally financed firms will display heterogeneous growth effects relative to their baseline revenue levels [3,11]. Research on EU innovation policy similarly shows that the effect of public grants on firm-level outcomes is sensitive to recipient characteristics: smaller, financially constrained, and less commercially mature firms respond differently from large, well-established companies [10].
Recognised indicators of post-investment business improvement include revenue growth [40,41,42,43], number of employees [42,44], and firm size [45]. The present study additionally examines changes in the development stage of the enterprise as a performance indicator [45,46].
A recognised need exists for a better understanding of the post-investment management process and the identification of activities that support efficient development of innovative firms [47,48]. Innovative business models can significantly contribute to firm performance; research indicates that companies applying such models may achieve up to four times higher return on investment [49].
However, the success of business performance trajectories among SMEs following modern financing is not always immediate or linear. The literature suggests that many modern financing instruments, particularly in the first year following investment, encourage companies to prioritise product development, business process reorganisation, and business model adaptation rather than the direct generation of market results. Financial resources at this stage function as a foundation for strategic stabilisation rather than as a direct driver of short-term growth. A similar transitional effect has been documented in the literature, which indicates that grant financing and business angel investment in early stages frequently direct firms toward business consolidation before intensive market growth [50,51]. For early-stage firms, modern financing functions as a critical enabler for overcoming the so-called “valley of death”, the transitional period between product development and market-oriented operations, a trajectory that becomes measurable only over a multi-year observation window [52].
Research further suggests that firms operating above a certain revenue threshold may encounter structural growth constraints, whereby the absolute capital required to advance to the next performance tier exceeds what standard financing instruments can provide [10,53].
To date, no study has directly modelled how a firm’s pre-investment revenue level conditions the shape and pace of its post-investment growth trajectory, particularly within European Widening Country contexts. These gaps in the literature directly motivate the two research questions addressed in this study: what drives revenue growth in innovative SMEs following modern financing, and how does the firm’s initial revenue level shape its post-investment performance trajectory.

2.3. Decision Trees in the Analysis of Business Performance

Recent developments in applied machine learning and entrepreneurial finance have further established decision tree techniques for analysing diverse SME outcomes. In contrast to classical linear econometric models, decision trees capture intricate non-linear dependencies, threshold phenomena, and higher-level interaction effects between firm-level variables without relying on strong parametric assumptions about the data-generating process.
This property is of particular importance for innovative SMEs, whose economic growth paths are frequently characterised by volatility, asymmetry, and path dependency. Recent research confirms that tree-based methods outperform classical statistical approaches in predicting SME bankruptcy risk, innovation success, and post-investment firm behaviour, especially when datasets combine financial and non-financial features [13,14,54].
Moreover, decision tree models offer high interpretability, providing researchers and policymakers with opportunities to define clear decision thresholds and classification policies for different performance paths. Such interpretability is especially valuable in policy-oriented research in Widening Countries, where institutional diversity and non-uniform innovation ecosystems may generate structurally different post-investment outcomes across firms [10,55]. Recent empirical studies further suggest that explainable machine learning frameworks facilitate practical SME policy evaluation, enabling transparent specification of the factors driving growth and innovation performance [5,10]. Although ensemble tree-based methods, such as Random Forest and Gradient Boosting, often achieve higher predictive accuracy, they generally operate as “black-box” models with substantially lower interpretability. In the context of this study, the primary objective is not to maximise predictive performance but to identify transparent decision rules that can support policymakers, innovation agencies, and practitioners in understanding the factors associated with post-investment SME performance. Given the relatively small sample size and the policy-oriented nature of the research, the CART algorithm represents an appropriate methodological choice, offering an explicit trade-off between predictive accuracy and model interpretability.
Decision trees are inherently susceptible to overfitting, particularly when applied to relatively small datasets. To mitigate this limitation, the present study employed a pruned CART model evaluated using stratified five-fold cross-validation. This approach is consistent with methodological studies highlighting the importance of tree pruning and cross-validation for improving model generalizability and reducing optimistic bias [56]. Furthermore, complementary robustness analyses using Logistic Regression, Random Forest, bootstrap resampling, and sensitivity analyses were conducted to assess the stability of the findings across alternative modelling approaches.

2.4. Widening Countries and the Innovation Ecosystem

European Widening Countries are characterised by thinner capital markets, smaller innovation ecosystems, and larger financing gaps compared to Western European economies. Despite nominal similarities in institutional structure, the national financial instruments and policy frameworks of these countries affect firm performance in distinct ways [21,55]. Structural market constraints, including limited domestic market depth and weak internationalisation support, are characteristic features of Widening Country ecosystems that may impede the translation of financing into firm-level growth [55].
The EU’s innovation scorecard consistently classifies these economies as modest or emerging innovators, and targeted policy instruments such as the EIC Accelerator and Horizon Widening measures have been introduced specifically to address persistent innovation and financing gaps in these regions [10,57]. Understanding the conditions under which innovative SMEs in these contexts successfully convert alternative financing into revenue growth is therefore of direct strategic relevance for both investors and policymakers.

3. Methodology

3.1. Sample and Data Collection

The target population comprises innovative SMEs that received at least one form of alternative financing, including grants, venture capital, business angel investment, or crowdfunding, between 2020 and 2022. Innovative SMEs are defined as firms that introduced a new or significantly improved product, service, or business process within the preceding three years, consistent with the classification frameworks [58]. The full sample included firms from twelve countries: Serbia, Greece, Bulgaria, Romania, Croatia, Latvia, Cyprus, Turkey, Montenegro, Poland, Slovenia, and North Macedonia. These countries fall within the geographical scope of the European Widening framework considered in this study [57].
Data were collected via a structured online questionnaire developed in Google Forms, consisting of 81 responses, predominantly multiple-choice, with select open-ended questions to capture qualitative insights. Of the 81 valid responses received, 57 firms confirmed receipt of at least one form of alternative financing between 2020 and 2022 and constitute the analytical sample for the decision tree models. The remaining 24 firms reported no modern financing during this period and were retained in the descriptive analysis only. The instrument was distributed between May and June 2025 to 1500 company contacts sourced from national innovation agency databases, incubators, and startup directories, yielding a final valid sample of 81 firms (response rate: 5.4%). Respondents were primarily owners or senior managers. In Romania, Greece, Serbia, and Bulgaria, additional data were gathered through direct interviews to improve response quality and reduce item non-response.
The questionnaire examined firm-level indicators both before and after the receipt of financing, including product development stage, employment size, revenue changes, customer dynamics, and business model modifications. Product development stage was assessed across six sequential phases: ideation, conception, commitment, validation, scaling, and establishing, reflecting the well-established notion of progressive firm development from idea generation to market entry [59]. Revenue was measured using ordered categorical ranges, from pre-revenue to more than EUR 1,000,000. For analytical purposes, these categories were encoded using ordinal values (0–6), preserving their natural ordering while enabling threshold-based partitioning within the CART algorithm. This encoding does not imply equal economic intervals between adjacent revenue categories, and the results should therefore be interpreted with this limitation in mind. Future research based on continuous revenue data or alternative encoding approaches may further assess the robustness of the identified decision rules, while employment was measured in grouped categories from 1–5 to more than 50 employees [7]. Descriptive and correlation analyses were applied to examine relationships between input and output variables.
To capture post-investment performance trajectories, each firm-level indicator, including revenue level, development stage, number of employees, and customer base, was measured at four time points: immediately before the receipt of financing, and at the end of Year 1, Year 2, and Year 3 following the investment. This longitudinal measurement design enabled the construction of individual firm trajectories and the identification of growth patterns over the three-year observation window.

3.2. Variables

The study incorporates both pre-investment and post-investment indicators. The dependent variable is revenue growth over the three-year post-investment window, operationalised as a binary variable coded as 1 if the highest revenue category achieved during the three-year post-investment observation period exceeded the corresponding pre-investment revenue category, and 0 otherwise. This operationalisation captures whether firms achieved any measurable revenue improvement during the observation period, regardless of the specific year in which the highest revenue level was reached. As a sensitivity check, the binary outcome was reconstructed using only the third-year revenue category relative to the pre-investment baseline, which produced an identical classification of the analytical sample (Appendix F Table A20). Revenue was measured using ordinal categories ranging from pre-revenue (0) to more than EUR 1,000,000 (6), enabling comparison across pre-investment and post-investment periods.

3.3. Decision Tree Method

A Decision Tree (DT) is a widely applied tool for decision support across diverse industries and analytical domains. Operating through a tree-structured modelling approach, DT algorithms traverse a sequence of interconnected choices to map possible outcomes. A decision tree uses an inverted tree structure to perform classification and regression tasks in data mining, where the root node at the top represents the input data and the leaf nodes at the bottom represent the final outcomes or decisions [60].
The decision trees produced by CART are strictly binary, containing exactly two branches for each decision node. CART recursively partitions the records in the training dataset into subsets with similar values for the target attribute by conducting an exhaustive search of all available variables and possible splitting values at each decision node [61]. A key structural advantage of decision trees is their capacity to accommodate both numerical and categorical input data, making them particularly suitable for heterogeneous datasets [62].
The primary objective of this study was not only prediction but also the identification of transparent and easily interpretable decision rules describing the relationship between pre-investment firm characteristics and post-investment revenue growth. For this reason, CART was selected as the primary analytical approach. Complementary Logistic Regression and Random Forest analyses were subsequently performed as robustness checks and yielded broadly consistent findings, providing additional support for the reported results.

4. Results

4.1. Descriptive Statistics

Table 1 presents the descriptive characteristics of the full sample (N = 81) and the analytical subsample of firms that received modern financing (N = 57). Variables are reported across dimensions: geographic distribution, industry sector, financing status and type, development stage, pre-investment revenue level, employment size, customer base, and post-investment revenue trajectory.
The sample spans twelve European Widening Countries, with Serbia (16.0%), Greece (14.8%), and Bulgaria (13.6%) accounting for the largest shares. Technology-intensive sectors dominate, with hardware and machinery (22.2%) and SaaS (21.0%) together comprising over 43% of the sample, consistent with the sectoral profile of innovative SMEs in European startup ecosystems [63]. Grant financing was the dominant primary source (58.9%), followed by business angels (23.2%) and venture capital (16.1%), reflecting the grant-heavy financing landscape characteristic of Widening Country ecosystems. At the time of financing, over 61% of firms had pre-investment revenues below €50,000, and 75.4% employed between 1 and 5 people, confirming the early-stage, micro-enterprise profile of the analytical sample.

4.2. RQ1: Key Pre-Investment Determinants of Revenue Growth

To address RQ1, a decision tree classification model was applied to the sample of 57 innovative SMEs. The dependent variable was operationalized as a binary indicator of revenue growth, coded as 1 if the highest revenue category achieved during the three-year post-investment observation period exceeded the corresponding pre-investment revenue category, and 0 otherwise. Of the 57 firms, 39 (68.4%) recorded revenue growth while 18 (31.6%) reported no improvement.
The model achieved a training accuracy of 78.9% and a five-fold cross-validated accuracy of 65.0%. The relatively modest cross-validated accuracy reflects the limited sample size and is acknowledged as a constraint on model generalisation. Precision for the growth class was 0.78 with a recall of 0.97, while precision for the no-growth class was 0.88 with a recall of 0.39.
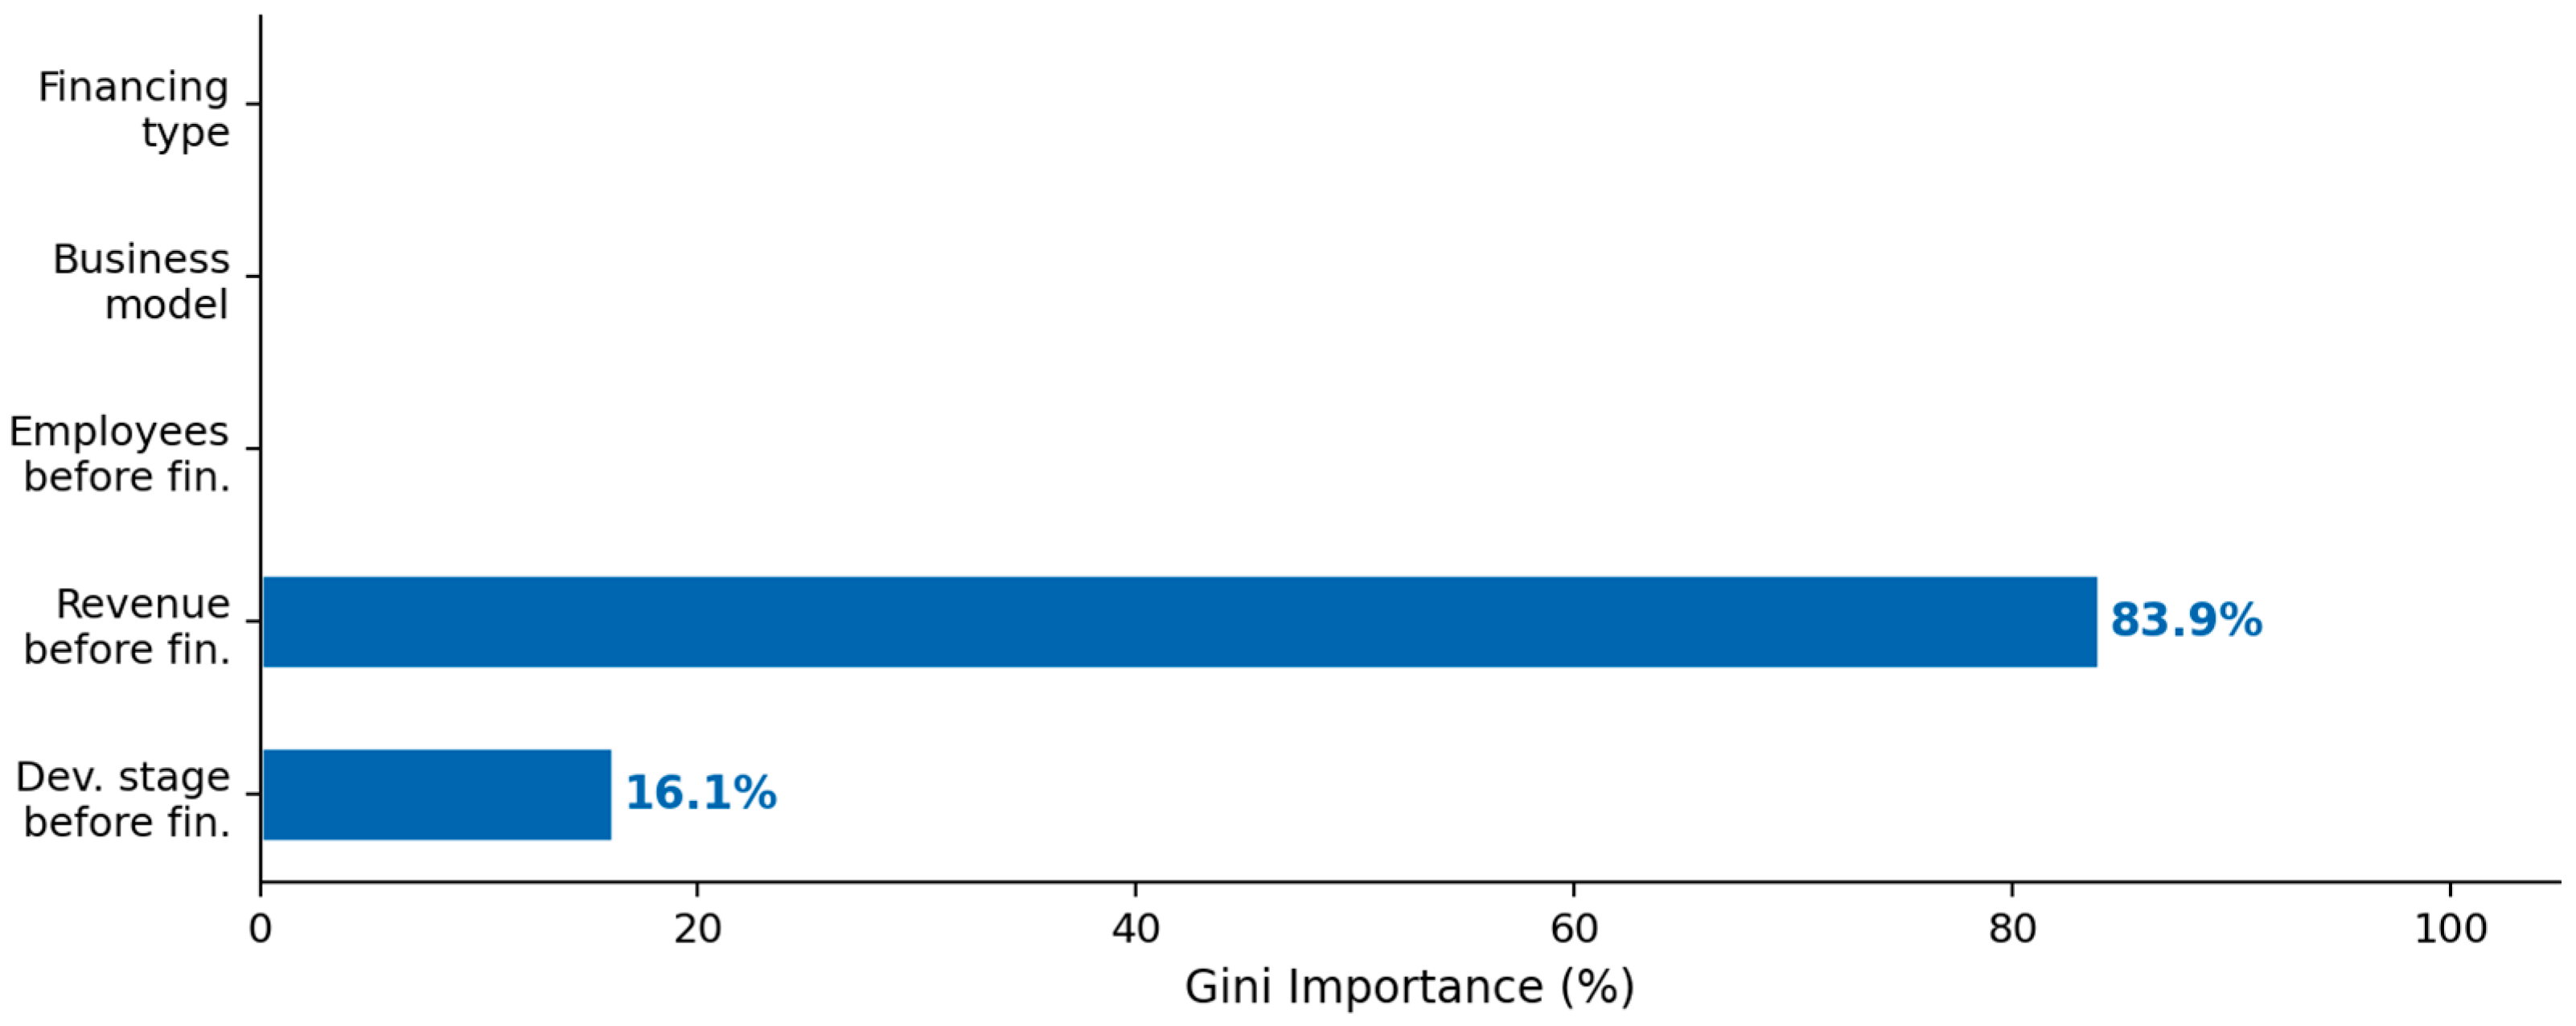
Variable importance analysis (Figure 1) reveals that pre-investment revenue level is by far the dominant predictor of post-investment revenue growth, accounting for 83.9% of total Gini importance. Pre-investment development stage is the only other variable contributing predictive power (16.1%).
Variable importance analysis revealed that, of the five firm-level characteristics included in the model, only pre-investment revenue level and development stage contributed to the predictive performance of the CART model. Within the present sample, the number of employees, existence of a defined business model, and type of financing received were not identified as discriminative predictors. These findings suggest that pre-investment revenue position and product maturity were the dominant predictors in the analysed dataset; however, they should be interpreted with caution given the limited sample size and the highly unbalanced distribution of financing instruments.
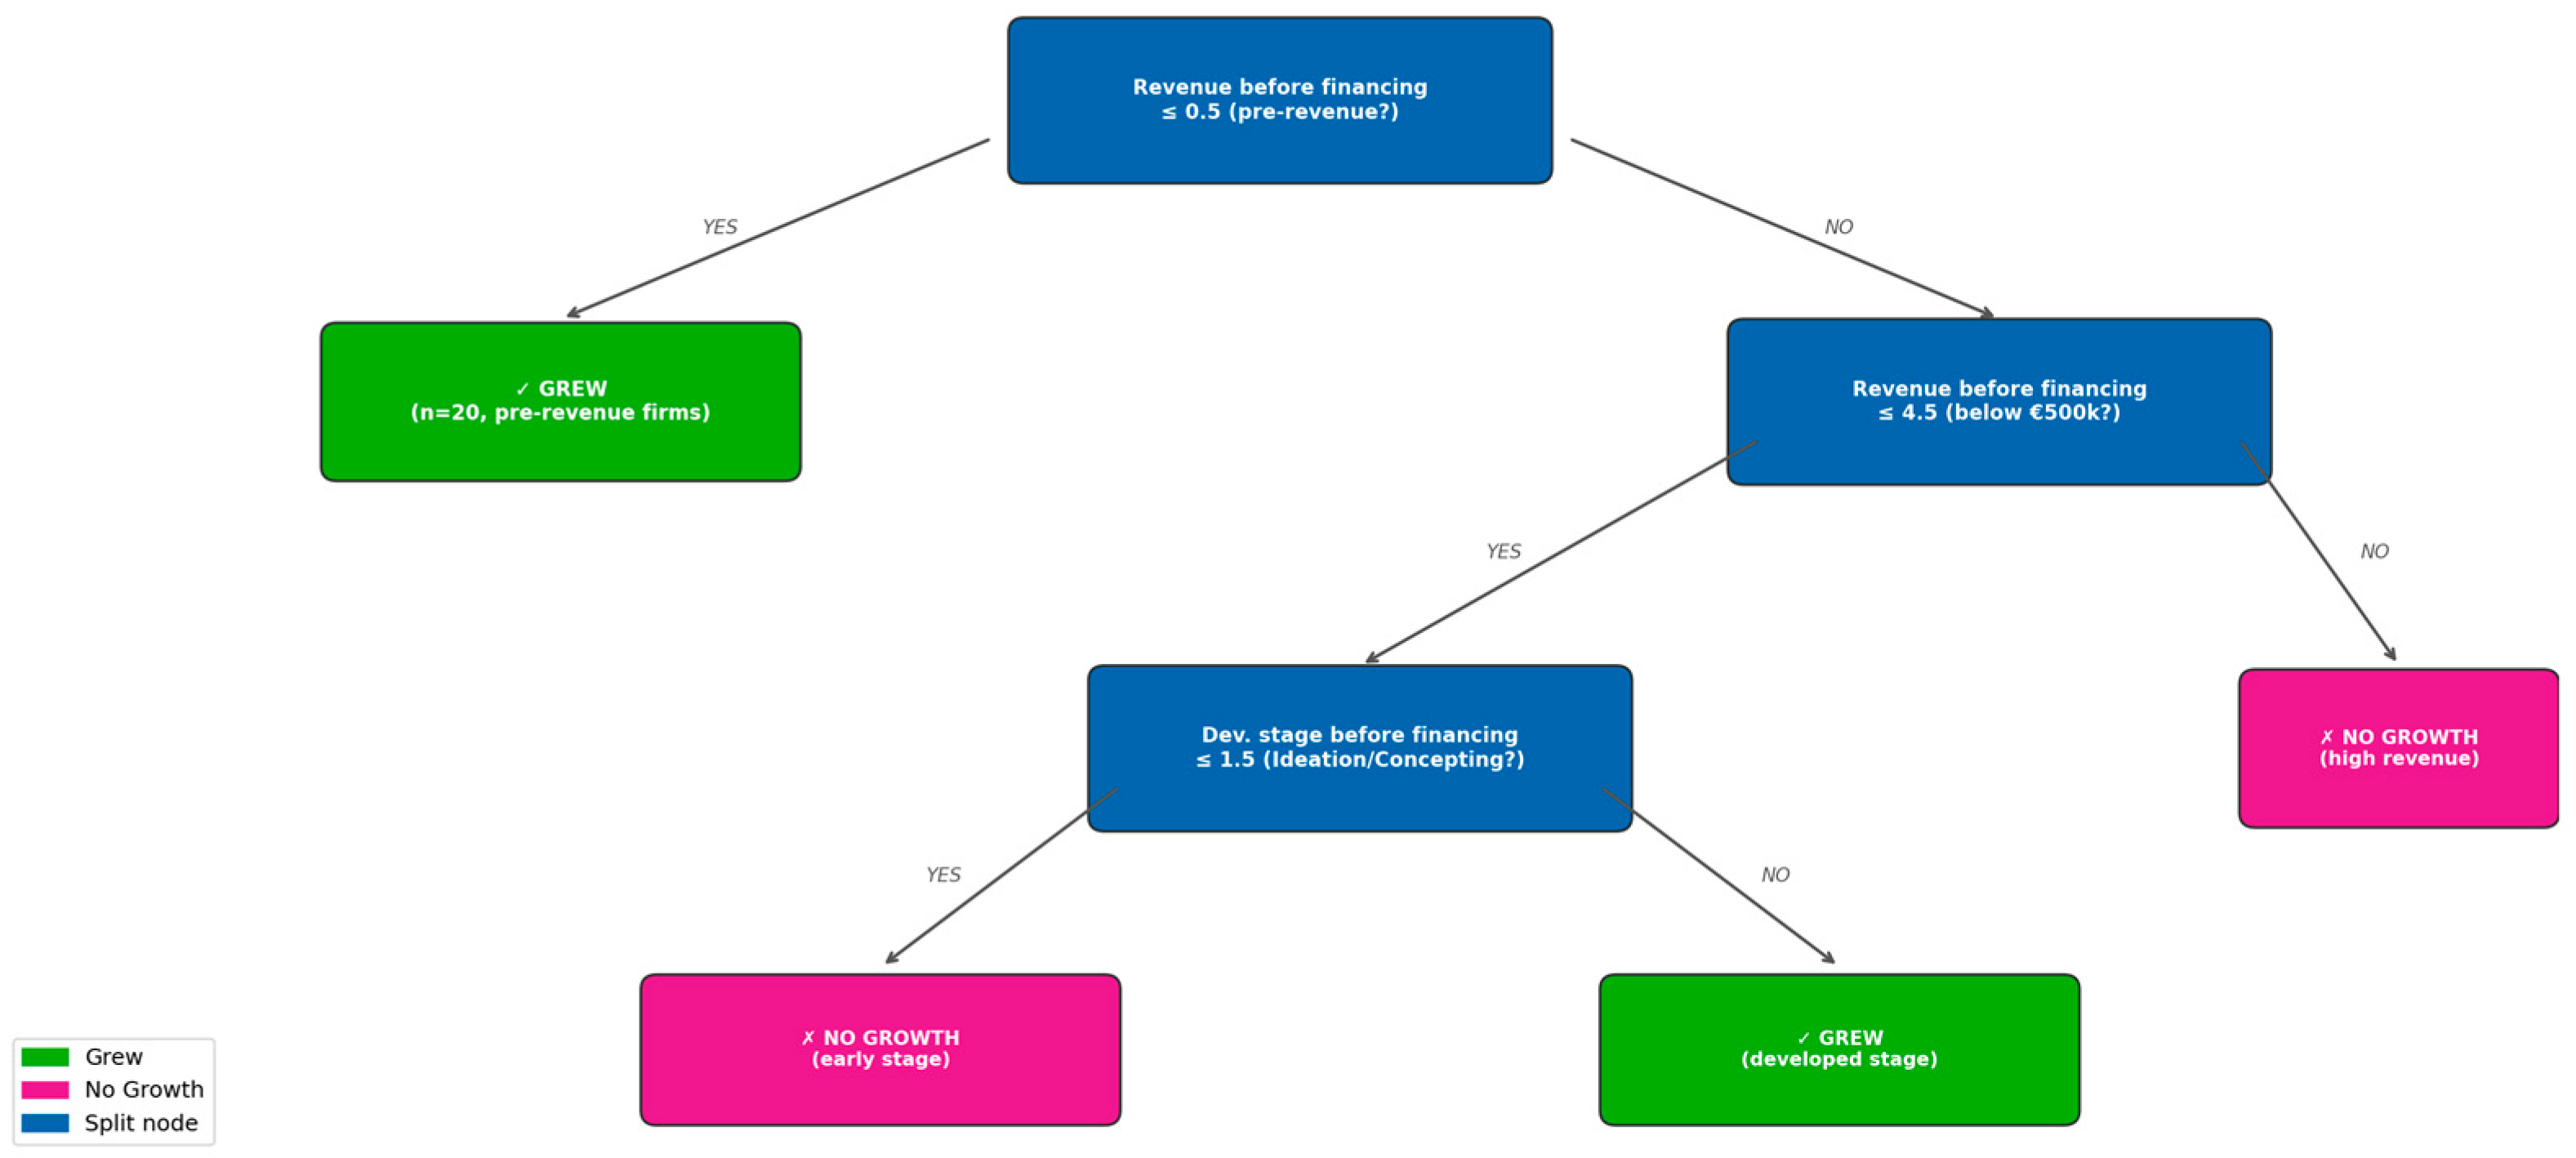
Decision tree structure (Figure 2) yields four interpretable classification rules:
Figure 2 shows the decision tree, whose structure yields four interpretable classification rules. First, firms that reported no revenue prior to financing are classified as likely to achieve revenue growth, reflecting the mechanical effect of starting from zero: any revenue generation constitutes growth by definition. Second, firms reporting pre-investment revenues between less than €50,000 and €250,000, combined with a development stage at or above Commitment (stage ≥ 2), are predicted to achieve revenue growth, capturing firms that have passed early ideation and begun translating their product into market activity. Third, firms in the same revenue range but at the Ideation or Concepting stage (stage ≤ 1) are classified as unlikely to achieve revenue growth, suggesting that financing alone is insufficient when the product has not yet reached minimum market readiness. Fourth, firms reporting revenues above €500,000 before financing are predicted not to record revenue category growth.
These results suggest that the key pre-investment determinants of revenue growth are starting revenue position and product development maturity, rather than the source or type of financing. Firms at an intermediate development stage (Commitment through Validation) with modest but non-zero pre-investment revenues appear best positioned to convert financing into measurable revenue growth.
For RQ1, a naïve majority-class classifier predicting ‘Growth’ for every firm would achieve an accuracy of 68.4%, slightly exceeding the CART model’s cross-validated accuracy of 65.0%. This indicates that, on a pure accuracy metric, the model does not outperform a trivial baseline. However, unlike the majority-class rule, the CART model produces transparent, interpretable decision rules that identify which firm characteristics are associated with growth—information a baseline classifier cannot provide. We therefore interpret the model’s contribution as explanatory rather than predictive, consistent with the study’s stated objective of prioritising interpretability over classification accuracy.

4.3. RQ2: Influence of Initial Revenue Level on Post-Investment Performance Trajectories

To address RQ2, firm-level performance trajectories were constructed by tracking revenue category movement across three post-investment years. Each firm was assigned to one of four trajectory types: Strong growth (revenue category increased by two or more levels), Steady growth (one level increase), Stagnant (no change), or Decline (decrease). Of the 57 firms, 16 (28.1%) achieved strong growth, 23 (40.4%) steady growth, 13 (22.8%) stagnation, and 5 (8.8%) decline.
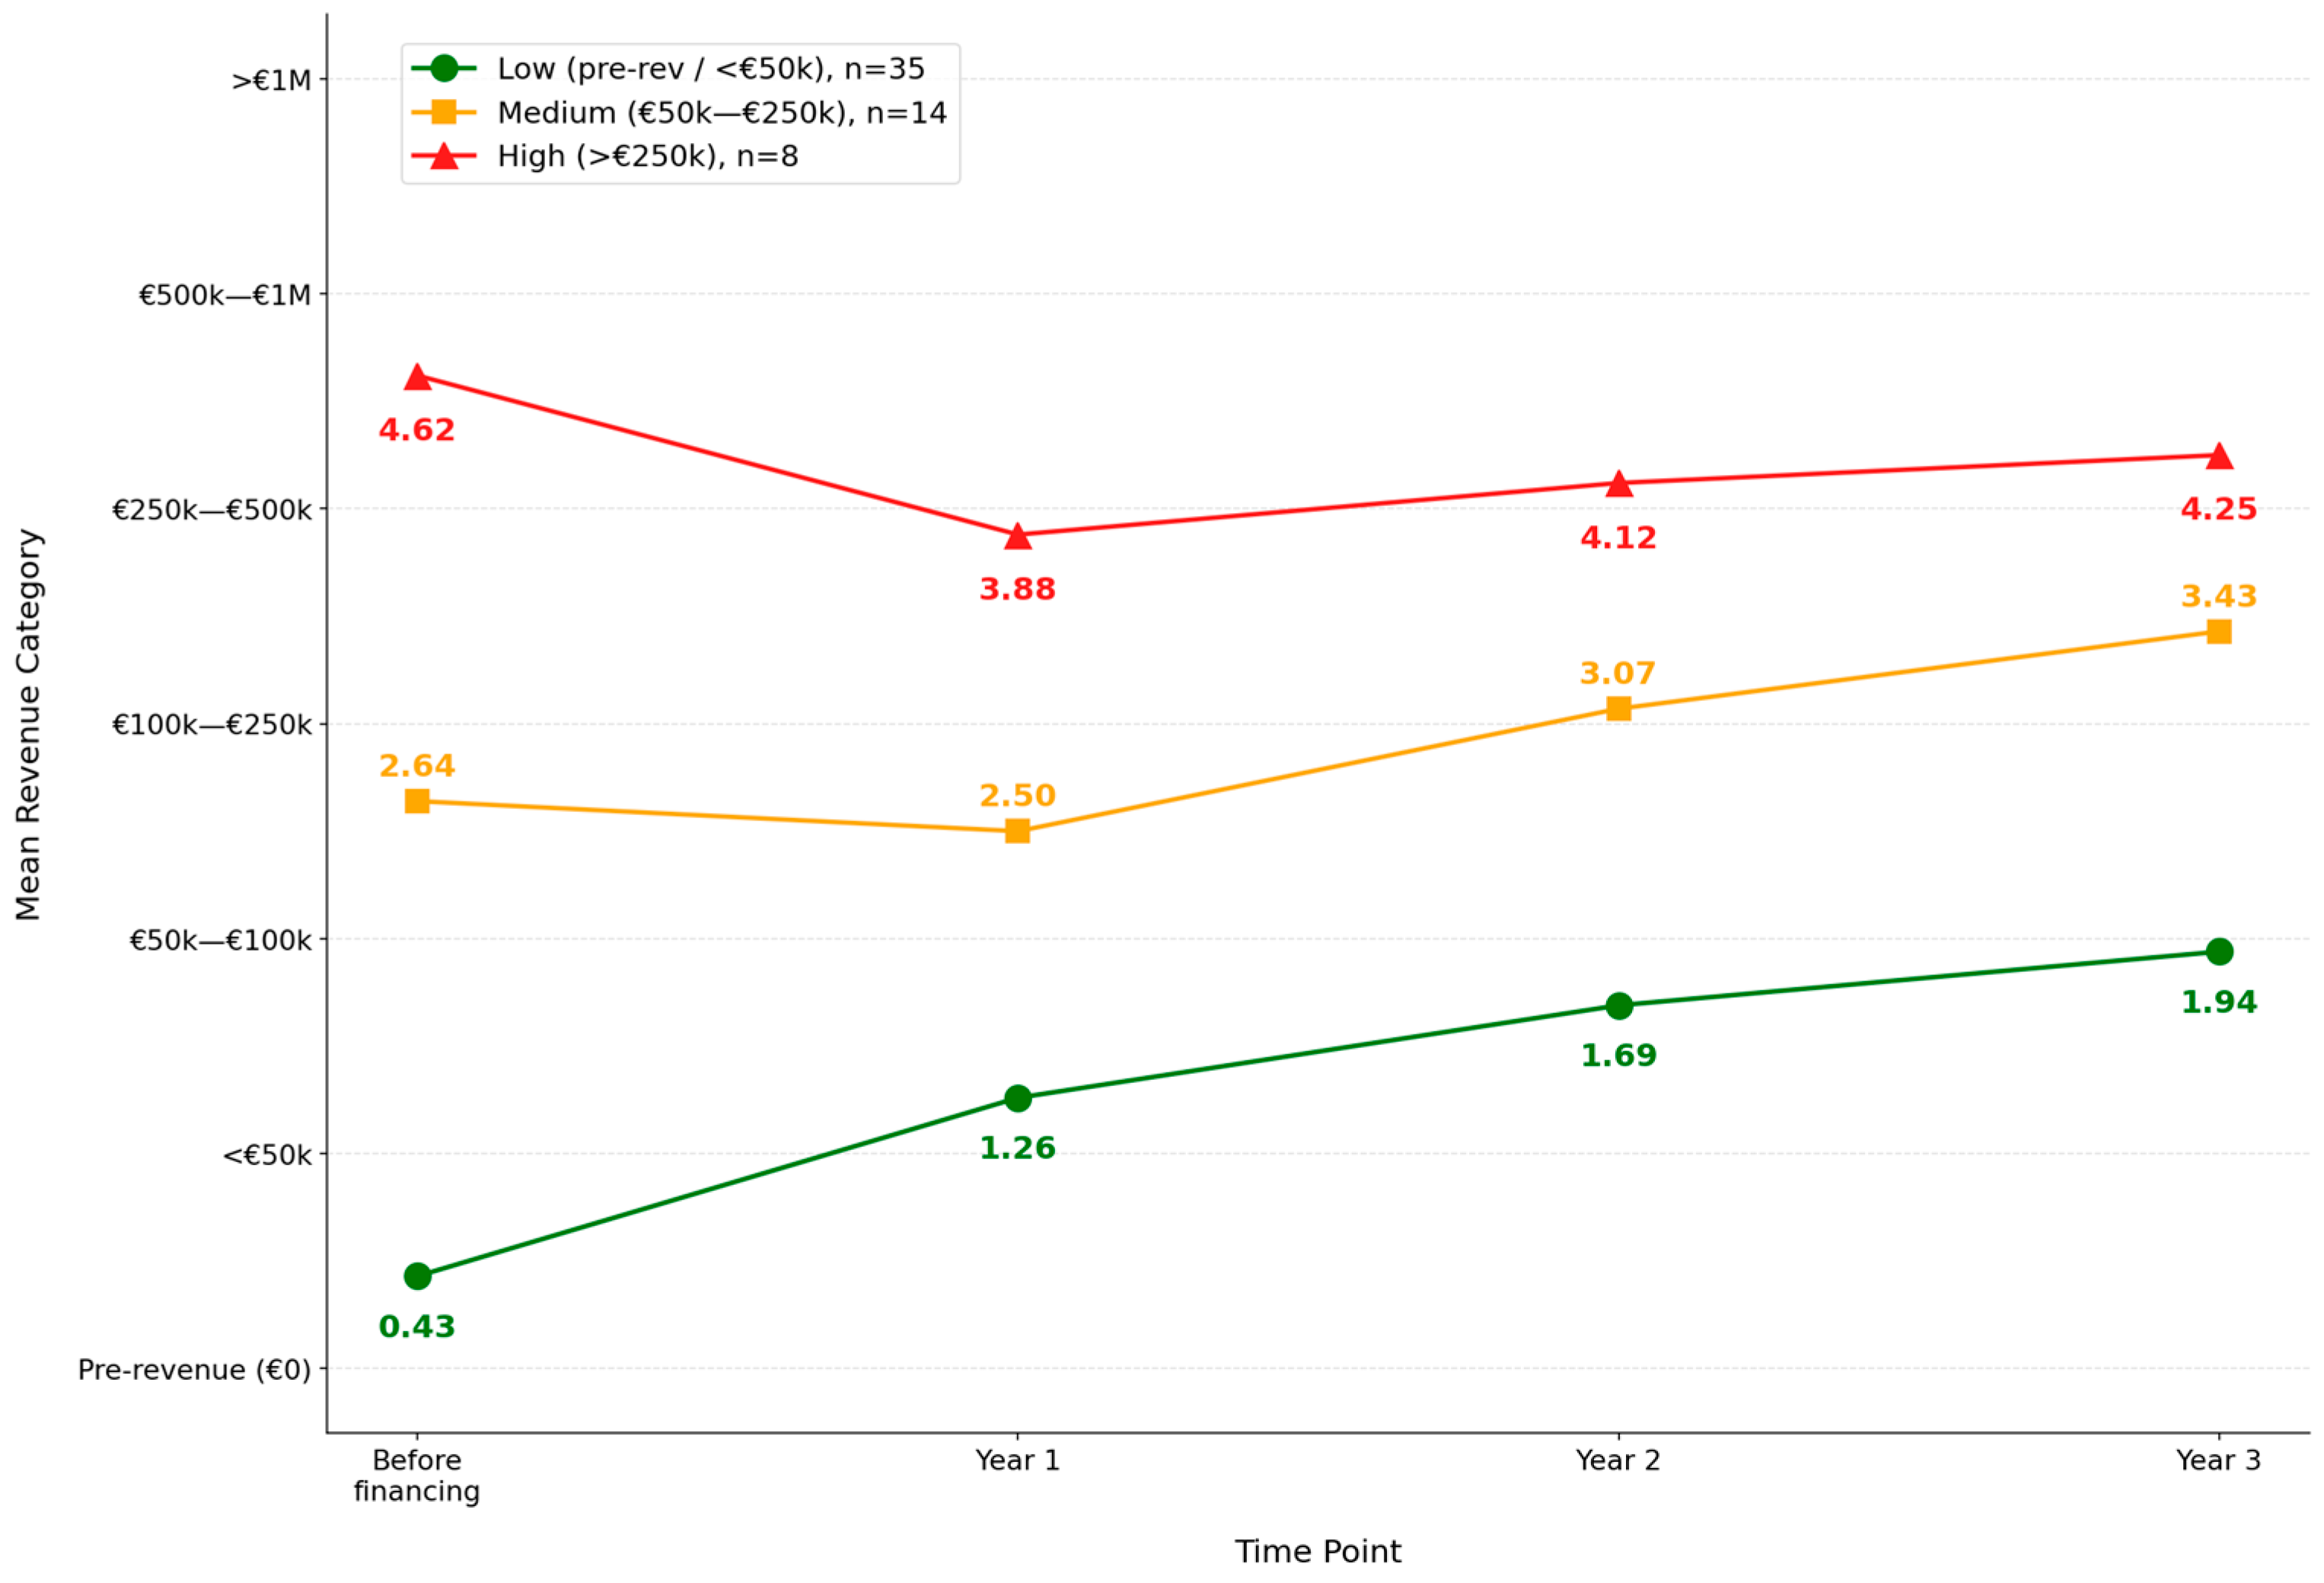
Firms were grouped into three starting revenue tiers: Low (pre-revenue or below €50,000; n = 35), Medium (€50,000–€250,000; n = 14), and High (above €250,000; n = 8). Low-revenue firms demonstrated the steepest upward trajectory, rising from a mean pre-investment score of 0.43 to 1.94 by Year 3, with an average gain of 1.51 categories over three years, with 29 of 35 firms (82.9%) following a growth trajectory, as shown in Figure 3. Medium-revenue firms exhibited a transitional pattern consistent with a delayed growth effect: mean revenue declined slightly in Year 1 (2.50 vs. 2.64 pre-investment) before recovering to 3.43 by Year 3, suggesting that firms in this group prioritised business model consolidation and operational stabilisation in the initial post-investment period before resuming market-oriented growth [50,51]. High-revenue firms showed consistent decline or stagnation, with mean revenue falling from 4.62 to 4.25 by Year 3, and only 2 of 8 firms recorded any growth.
All strong growth cases are concentrated in the Low and Medium revenue groups. The High revenue group is characterised predominantly by stagnation (n = 3) and decline (n = 3), with only 2 firms recording marginal growth. This pattern is consistent with evidence that firm size is negatively associated with growth rates among higher-performing SMEs, suggesting that growth constraints become increasingly structural as firms expand beyond a certain revenue threshold [53]. Within the small high-revenue subgroup (n = 8), this pattern may tentatively suggest a possible ceiling effect in progression to a higher revenue category. However, it should be regarded as a descriptive observation that requires validation in a larger sample.
The decision tree model for RQ2 achieved a training accuracy of 56.1% and a cross-validated accuracy of 38.3%, with initial revenue level accounting for 84.7% of variable importance and financing type contributing 11.2%. The relatively low model accuracy reflects the increased complexity of predicting four trajectory categories from a sample of 57 firms, and is acknowledged as a limitation of the present analysis. Nonetheless, the variable importance results consistently confirm the dominance of pre-investment revenue level as the primary structural determinant of post-investment trajectory.
The limited predictive performance of the RQ2 model suggests that post-investment revenue trajectories cannot be adequately explained by pre-investment firm characteristics alone. Instead, they appear to be influenced by a broader set of firm-specific, institutional, and macroeconomic factors that were beyond the scope of the present study.
To evaluate the robustness of the primary findings, complementary analyses using Logistic Regression and Random Forest were conducted on the same analytical sample (Table 2). Although predictive performance varied slightly across algorithms, the additional models produced results comparable to those obtained with CART. Importantly, both complementary models identified the same key predictors as the primary CART model, with pre-investment revenue level consistently emerging as the dominant predictor across modelling approaches. For RQ1, Logistic Regression achieved the highest cross-validated accuracy (0.737), while Random Forest produced similar discrimination (ROC−AUC = 0.742). For RQ2, predictive performance remained modest across all methods, reflecting the difficulty of predicting four trajectory categories from a relatively small sample. These complementary analyses support the robustness of the principal findings while reinforcing the exploratory nature of the study. Cross-validated confusion matrices for all classification models are provided in Appendix F.

5. Discussion

The results of this study offer several insights that extend existing understanding of post-investment SME performance in Widening Countries. The most striking finding is the near-total dominance of initial revenue level as a predictor of post-investment outcomes, accounting for 83.9% of variable importance in RQ1 and 84.7% in RQ2. This stands in contrast to a substantial body of literature that emphasises the role of financing type, particularly venture capital, in driving firm growth [64,65]. In the present sample, financing type was not identified as a discriminative predictor in the RQ1 CART model. Given the limited sample size and the highly unbalanced distribution of financing instruments, this result should be interpreted as sample-specific and should not be taken as evidence that financing type is generally unimportant for SME growth. Rather, within this dataset, pre-investment revenue level and development stage appeared more informative to the fitted model than financing type.
The observed pattern among the eight higher-revenue firms may tentatively suggest a possible ceiling effect in progression to a higher revenue category. However, given the small subgroup size, this descriptive observation should be interpreted with caution and requires validation in a larger sample before broader policy implications can be drawn. Firms entering financing with revenues above €500,000 consistently failed to advance to a higher revenue category, regardless of development stage or financing type, with mean revenue declining from 4.62 to 4.25 by Year 3, and only 2 of 8 high-revenue firms recording any growth. One possible explanation is that current financing amounts may be insufficient for firms requiring larger growth capital to scale. Other explanations related to market conditions and ecosystem characteristics warrant further investigation. This is consistent with evidence that SMEs grow less after reaching a minimum scale of efficiency, suggesting that growth constraints become increasingly structural as firms mature and expand [53]. This tentative observation is also consistent with the financial growth cycle model, which suggests that the relationship between firm size and financing outcomes is non-linear and that financing effects vary systematically with recipient firm characteristics [10].
The transitional performance pattern observed among medium-revenue firms (Figure 3) warrants further investigation. The initial revenue decline in Year 1 (2.50 vs. 2.64 pre-investment) followed by recovery to 3.43 by Year 3, reflects a delayed growth effect, whereby firms in the initial post-investment period prioritise business model consolidation and operational stabilisation over immediate market expansion [50,51]. This pattern is conceptually consistent with evidence of non-linear relationships between firm-level financial indicators and growth, whereby firms may experience a transitional period of reduced performance before resuming positive trajectories [53]. This pattern suggests that evaluation frameworks should assess performance over a minimum of three years rather than relying on Year 1 outcomes alone.
Beyond financing type, the RQ1 model did not identify the number of employees or the existence of a defined business model as discriminative predictors within the analysed sample. In the RQ2 model, financing type accounted for 11.2% of variable importance, while the remaining characteristics were not selected as discriminative predictors. Given the small and imbalanced sample, these findings should be interpreted cautiously and as specific to the fitted models. Overall, pre-investment revenue level and development stage appeared more informative within the present dataset than the other included characteristics. The complementary Logistic Regression and Random Forest analyses yielded broadly consistent findings, increasing confidence that the identified relationships are not specific to a single modelling approach.
These findings also have broader implications for economic sustainability in European Widening Countries. As SMEs play a central role in employment, innovation, and economic development, a better understanding of the factors associated with their post-investment growth may support more informed discussions on the design of alternative financing policies. In this context, the study contributes to the broader sustainability agenda, particularly with respect to Sustainable Development Goal 8 (Decent Work and Economic Growth) and Sustainable Development Goal 9 (Industry, Innovation and Infrastructure).

6. Conclusions

This study applied decision tree analysis to examine the post-investment performance of 57 innovative SMEs in European Widening Countries over a three-year period following the receipt of alternative financing. The central finding is that pre-investment revenue level is the dominant determinant of post-investment performance both in terms of whether revenue growth occurs (RQ1) and in terms of the shape and pace of performance trajectories over time (RQ2). Development stage at the time of financing was identified as a secondary predictor, while financing type was not identified as a discriminative predictor in the RQ1 model within the present sample. The RQ1 decision tree model achieved a training accuracy of 78.9% and a cross-validated accuracy of 65.0%, while the RQ2 model achieved a training accuracy of 56.1% and a cross-validated accuracy of 38.3%, with the lower performance of the latter reflecting the increased complexity of predicting four trajectory categories from a limited sample. Accordingly, the findings related to RQ2 should be interpreted as exploratory and hypothesis-generating rather than definitive.
Three distinct trajectory profiles emerge from the analysis. Low-revenue and pre-revenue firms benefit most consistently from alternative financing, advancing an average of 1.51 revenue categories over three years with 82.9% of firms following a growth trajectory. Medium-revenue firms follow a transitional growth pattern, experiencing an initial period of performance decline before recovering and growing by Year 3, consistent with a delayed growth effect documented in the literature [50,51]. Within the present sample, high-revenue firms showed persistent stagnation or decline, which may suggest that current financing instruments are less effective for firms already operating at higher revenue levels. Taken together, these findings demonstrate that the same financing instrument produces fundamentally different outcomes depending on the firm’s starting revenue position.
These findings give rise to three contributions to the literature. First, this study provides the novel empirical examination of post-investment revenue trajectories in innovative SMEs across European Widening Countries, directly addressing a gap in the literature that has predominantly focused on pre-investment determinants of financing access. Second, by applying decision tree methodology, the study demonstrates that machine learning classification models can effectively identify non-linear threshold effects and heterogeneous performance patterns that conventional regression approaches cannot capture. Third, the focus on Widening Countries provides context-specific insights that extend the relevance of existing SME financing findings beyond well-developed Western European markets. The comparatively high importance assigned to pre-investment revenue level within the fitted models suggests that firm conditions at the point of investment may warrant greater attention alongside financing type. However, given the highly unbalanced distribution of financing instruments, this sample-specific pattern should not be interpreted as evidence that financing type is generally unimportant.

6.1. Policy Implications

Although these findings should be interpreted as exploratory and hypothesis-generating, they may provide preliminary insights for investment agencies and policymakers in Widening Countries. The results suggest that future financing programmes may benefit from considering firms’ development stage and revenue baseline alongside financing amount, although these observations require validation in larger and more representative samples. The findings also suggest that monitoring frameworks may benefit from extending the evaluation period to at least three years to capture the full trajectory, particularly for medium-revenue firms. Dedicated instruments beyond standard alternative financing may be needed to serve higher-revenue innovative SMEs seeking to scale. The financial fragility of innovative SMEs in Widening Countries has direct implications for sustainable development: financially resilient SMEs are better positioned to invest in innovation and responsible business practices aligned with SDG goals 8 and 9 [15].

6.2. Limitations and Future Research

The present study is subject to several limitations. The analytical sample of 57 firms limits generalisability and precludes formal statistical testing of the proposed hypotheses. The low survey response rate (5.4%) may introduce selection bias, and the use of self-reported categorical revenue ranges introduces potential measurement imprecision. Consequently, the findings should be interpreted as exploratory rather than confirmatory and only within the context of the analysed sample of innovative SMEs from European Widening Countries. They are intended to identify potentially meaningful patterns and generate hypotheses for future research rather than establish causal relationships or broadly generalisable conclusions. Future studies based on larger and more representative samples are needed to further examine the robustness and external validity of the identified patterns. The three-year observation window may not capture the full post-investment trajectory for all firm types. Another limitation stems from the heterogeneous composition of the analytical sample, which included firms from multiple European Widening Countries operating in different institutional and economic environments. The study did not explicitly control for country-specific factors, industry characteristics, local innovation policies, or macroeconomic conditions, which may have influenced firm performance. Consequently, the observed relationships should be interpreted as reflecting the combined characteristics of the analysed sample rather than the effects of any individual country, industry, or institutional context. Furthermore, the relatively modest cross-validated accuracy of both models reflects the constraints imposed by the sample size and the categorical nature of the outcome variables and should be interpreted accordingly. An additional limitation relates to the use of categorical rather than continuous revenue data. Although categorical revenue ranges facilitated consistent reporting across firms and reduced non-response, they may mask substantial within-category variation. Consequently, firms experiencing considerable revenue growth within the same category would not be recorded as having advanced to a higher revenue level, potentially leading to an underestimation of post-investment performance.
Future research should expand the sample across a broader range of Widening Countries, incorporate additional performance dimensions such as employment growth and customer acquisition, and apply ensemble methods, including random forests and gradient boosting, to validate and enrich the classification rules identified here. Longitudinal panel designs would strengthen causal inference, and qualitative case studies could illuminate the mechanisms underlying the transitional growth pattern observed among medium-revenue firms.
Additionally, the reported cross-validation accuracy should be interpreted in relation to the majority-class baseline. Given that 68.4% of firms recorded revenue growth, a naïve majority-class classifier would achieve approximately the same level of accuracy. Accordingly, the primary contribution of the CART model lies not in improving predictive performance over this baseline but in identifying transparent and easily interpretable decision rules describing the relationship between pre-investment firm characteristics and post-investment revenue growth.

Author Contributions

Conceptualization, A.Đ., M.R., L.P.G. and I.J.; methodology, A.Đ.; software, M.M.; validation, I.J., M.M. and M.R.; formal analysis, A.Đ.; investigation, A.Đ.; resources, A.Đ.; data curation, A.Đ.; writing—original draft preparation, A.Đ., M.M. and I.J.; writing—review and editing, A.Đ.; visualization, M.R.; supervision, M.R.; project administration, A.Đ.; funding acquisition, L.P.G. All authors have read and agreed to the published version of the manuscript.

Funding

This research received no external funding.

Institutional Review Board Statement

This study was waived from ethical review because it constituted a low-risk, non-interventional organizational survey involving adult professional respondents and non-sensitive organizational data, as confirmed by the Faculty of Mechanical Engineering, University of Niš.

Informed Consent Statement

Informed consent for participation was obtained from all subjects involved in the study. Participation was voluntary, and completion and submission of the questionnaire constituted implied informed consent.

Data Availability Statement

The data presented in this study are available on request from the corresponding author. The data are not publicly available due to privacy restrictions, as the dataset contains information about innovative companies and their founders, for which public access consent was not obtained prior to data collection.

Acknowledgments

During the preparation of this manuscript, the authors used Claude 4 Sonet (Anthropic) for the purposes of text editing and language improvement. The authors have reviewed and edited the output and take full responsibility for the content of this publication.

Conflicts of Interest

The authors declare no conflicts of interest.

Abbreviations

The following abbreviations are used in this manuscript:
SMESmall and Medium-sized Enterprise
CARTClassification and Regression Tree
DTDecision Tree
VCVenture Capital
CVCross-Validation

Appendix A. Model Configuration and Parameters

This appendix provides full technical documentation of the decision tree models applied in this study, including model configuration parameters, variable encoding schemes, classification performance reports, cross-validation results, and the survey items used as model inputs. All models were implemented in Python 3.12 using scikit-learn and are fully reproducible using the parameters reported below.
Given the analytical sample of 57 firms, each fold in the five-fold cross-validation procedure contained approximately 11–12 observations. Consequently, individual fold accuracy estimates are subject to relatively high variance, and the reported mean cross-validation accuracy should therefore be interpreted as an approximate indicator of model generalisability rather than a stable estimate of predictive performance. This limitation is inherent to small-sample machine learning applications and is acknowledged in the interpretation of the results.
Missing values were encoded using a sentinel value (−1), allowing the decision tree algorithm to treat missingness as a separate category without discarding observations. Given the relatively small sample size, multiple imputation was considered likely to introduce additional uncertainty and potentially unstable imputations. The chosen approach prioritised preservation of the full analytical sample, although it represents a methodological simplification and should be regarded as a limitation.
Both decision tree models (RQ1 and RQ2) were estimated using identical hyperparameter settings. The parameters are reported in Table A1.
Table A1. Decision tree model configuration parameters.
ParameterValue
AlgorithmCART (Classification and Regression Trees)
Maximum tree depth (max_depth)3
Minimum samples per leaf (min_samples_leaf)3
Splitting criterionGini impurity
Random state (random_state)42 (fixed for reproducibility)
Cross-validation strategy5-fold stratified cross-validation
Implementationscikit-learn v1.x, Python 3.12
Missing value handlingReplaced with −1 (out-of-range sentinel)

Appendix B

All categorical survey responses were converted to ordinal numeric values prior to model estimation. The encoding schemes applied to each variable are reported below.

Appendix B.1. Revenue Category Encoding

Table A2. Ordinal encoding of revenue categories.
Survey Response CategoryNumeric Value
Pre-revenue (no revenue yet)0
Less than €50,0001
€50,000–€100,0002
€100,000–€250,0003
€250,000–€500,0004
€500,000–€1,000,0005
More than €1,000,0006
Applied to: Revenue before financing, Revenue Year 1, Revenue Year 2, Revenue Year 3.

Appendix B.2. Development Stage Encoding

Table A3. Ordinal encoding of development stage.
Development StageNumeric Value
Ideation0
Concepting1
Commitment2
Validation3
Establishing4
Scaling5
Applied to: Development stage before financing.

Appendix B.3. Other Variable Encoding

Table A4. Encoding of remaining categorical variables.
VariableSurvey ResponseNumeric Value
Business model definedYes1
No0
Number of employees1–51
6–102
11–203
More than 504
Financing typeBusiness angel0
Crowdfunding1
Grant2
Venture Capital3
Missing values across all variables were replaced with a sentinel value of –1, placing them outside the valid range of any encoded variable and allowing the decision tree algorithm to treat them as a distinct category.

Appendix C. Full Classification Report: RQ1

Table A5 reports the full precision, recall, and F1-score metrics for the RQ1 decision tree model, which predicts binary revenue growth (Grew vs. No Growth) over the three-year post-investment window.
Table A5. Classification report—RQ1 model (training set, n = 57).
ClassPrecisionRecallF1-ScoreSupport
Grew0.780.970.8639
No Growth0.880.390.5418
Macro avg0.830.680.7057
Weighted avg0.810.790.7657
Overall accuracy0.79 57
Table A6. Five-fold cross-validation accuracy scores—RQ1 model.
MetricFold 1Fold 2Fold 3Fold 4Fold 5
Accuracy0.6670.5830.5450.7270.727
Mean: 0.650|Std: 0.074

Appendix D. Full Classification Report: RQ2

Table A7 reports the full classification metrics for the RQ2 decision tree model, which predicts firm trajectory across four categories: Strong growth, Steady growth, Stagnant, and Decline.
Table A7. Classification report—RQ2 model (training set, n = 57).
ClassPrecisionRecallF1-ScoreSupport
Strong growth0.670.120.2116
Steady growth0.820.610.7023
Stagnant0.411.000.5813
Decline0.600.600.605
Macro avg0.620.580.5257
Weighted avg0.660.560.5357
Overall accuracy0.56 57
Table A8. Five-fold cross-validation accuracy scores—RQ2 model.
MetricFold 1Fold 2Fold 3Fold 4Fold 5
Accuracy0.4170.5000.3640.3640.273
Mean: 0.383|Std: 0.074
The relatively low cross-validated accuracy of the RQ2 model reflects the inherent difficulty of predicting four trajectory categories from a sample of 57 firms. This is acknowledged as a limitation of the present analysis; the variable importance results are nonetheless interpretable and consistent across both models.

Appendix E. Survey Items Used as Model Inputs

Table A9 lists the survey questions from the original questionnaire that were used as independent variables in the decision tree models, along with the variable name used in the analysis and the abbreviated question text.
Table A9. Survey items used as model inputs.
Variable in ModelSurvey Q No.Full Question Text (Abbreviated)
Financing typeQ7Which of the received financing types was the most significant in terms of amount received?
Dev. stage beforeQ9In which stage of development was your startup before receiving your most significant financing?
Revenue beforeQ10In which range did your company’s business revenue fall before receiving your most significant financing?
Employees beforeQ11Number of employees before receiving your most significant financing.
Business modelQ12Did your startup have a defined business model before receiving your most significant financing?
Revenue Year 1Q16aIn which range does your company’s business revenue fall after financing? [First year after financing]
Revenue Year 2Q16bIn which range does your company’s business revenue fall after financing? [Second year after financing]
Revenue Year 3Q16cIn which range does your company’s business revenue fall after financing? [Third year after financing]
The dependent variable for RQ1 (binary revenue growth) was derived by comparing the maximum revenue category recorded across Years 1–3 with the pre-investment revenue category. The dependent variable for RQ2 (trajectory type) was derived by computing the difference between the Year 3 revenue category and the pre-investment revenue category and assigning firms to one of four trajectory groups as described in Section 3.2.

Appendix F. Robustness and Sensitivity Analyses

To further evaluate the robustness of the primary CART results and address the reviewers’ methodological comments, additional robustness and sensitivity analyses were conducted. These include cross-validated confusion matrices, hyperparameter sensitivity analysis, alternative cross-validation strategies, bootstrap performance assessment, bootstrap-based feature importance stability, and sensitivity analysis of the outcome definition. Together, these analyses complement the reported accuracy, ROC–AUC, and F1-score metrics and provide additional evidence regarding the stability and robustness of the reported findings.
Table A10. Cross-validated confusion matrix—CART model (RQ1).
Actual/PredictedNo GrowthGrowth
No Growth414
Growth534
Table A11. Cross-validated confusion matrix—Logistic Regression (RQ1).
Actual/PredictedNo GrowthGrowth
No Growth99
Growth633
Table A12. Cross-validated confusion matrix—Random Forest (RQ1).
Actual/PredictedNo GrowthGrowth
No Growth612
Growth633
Table A13. Cross-validated confusion matrix—CART model (RQ2).
Actual/PredictedStrong GrowthSteady GrowthStagnantDecline
Strong growth3562
Steady growth41540
Stagnant7141
Decline2030
Table A14. Cross-validated confusion matrix—Multinomial Logistic Regression (RQ2).
Actual/PredictedStrong GrowthSteady GrowthStagnantDecline
Strong growth5821
Steady growth51440
Stagnant5422
Decline1031
Table A15. Cross-validated confusion matrix—Random Forest (RQ2).
Actual PredictedStrong GrowthSteady GrowthStagnantDecline
Strong growth7612
Steady growth61430
Stagnant6421
Decline2111
All confusion matrices are based on five-fold stratified cross-validation and are provided as supplementary model diagnostics. They are intended to complement the reported accuracy, ROC–AUC, and F1-score metrics and to facilitate comparison between the primary CART model and the complementary robustness analyses.
To assess the robustness of the primary CART results, additional sensitivity and stability analyses were performed using the same analytical sample (N = 57), predictor set, and preprocessing procedure as in the main analysis. The following tables summarise the results of the hyperparameter sensitivity analysis, repeated cross-validation, bootstrap performance assessment, and bootstrap-based feature importance stability.
Table A16. Summary of CART hyperparameter sensitivity.
OutcomeManuscript SettingCurrent Rerun CV AccuracyAccuracy Range Across SettingsBalanced Accuracy RangeROC–AUC Range
RQ1Gini; max_depth = 3; min_leaf = 30.6500.609–0.7330.494–0.7050.631–0.799
RQ2Gini; max_depth = 3; min_leaf = 30.3830.365–0.4920.274–0.436Not applicable
Alternative specifications varied the splitting criterion (Gini/entropy), maximum depth (2, 3, 4, or unrestricted), and minimum samples per leaf (1, 3, or 5). The range shows that predictive performance varies across settings, particularly for RQ2. The manuscript setting remained within the observed performance range.
Table A17. Sensitivity to alternative cross-validation strategies.
OutcomeCross-Validation StrategyMean AccuracySDMean Balanced AccuracyEvaluations
RQ1Stratified 5-fold, no shuffle0.6500.0740.5525
RQ1Stratified 5-fold, shuffle (RS = 42)0.7000.0870.5885
RQ1Repeated stratified 5-fold × 10 (RS = 42)0.6720.1140.57650
RQ2Stratified 5-fold, no shuffle0.3830.0830.2825
RQ2Stratified 5-fold, shuffle (RS = 42)0.3030.1560.2185
RQ2Repeated stratified 5-fold × 10 (RS = 42)0.3480.1220.26450
Table A18. Out-of-bag bootstrap performance of the CART models (1000 resamples).
OutcomeMetricMeanSD95% CI Lower95% CI UpperValid Samples
RQ1Accuracy0.6480.0940.4550.8181000
RQ1Balanced accuracy0.5840.0970.3930.7921000
RQ1Macro F10.5540.1010.3570.7381000
RQ1ROC-AUC0.7100.1070.4640.8751000
RQ2Accuracy0.3770.0990.1820.5711000
RQ2Balanced accuracy0.3280.0960.1620.5421000
RQ2Macro F10.2650.0830.1210.4371000
RQ2ROC-AUC (OVR weighted)0.6150.0770.4630.761885
Bootstrap results confirm that performance estimates are variable in this small sample. RQ1 shows moderate discrimination, whereas RQ2 remains weak and should be interpreted as exploratory.
Table A19. Bootstrap stability of CART feature importance (1000 resamples).
OutcomeFeatureMean ImportanceSD95% CI Lower95% CI UpperShare Non-Zero
RQ1Revenue before0.7080.1590.3700.9771.000
RQ1Development stage before0.1680.1580.0000.5260.720
RQ1Financing type0.0670.1090.0000.3660.391
RQ1Employees before0.0420.0820.0000.2750.293
RQ1Business model defined0.0140.0510.0000.2130.089
RQ2Revenue before0.5790.1730.2680.9370.999
RQ2Development stage before0.1970.1590.0000.5060.860
RQ2Financing type0.0790.1030.0000.3390.543
RQ2Employees before0.0770.1060.0000.3200.429
RQ2Business model defined0.0680.1150.0000.4060.496
Pre-investment revenue was the highest-ranked predictor in both models and received non-zero importance in virtually all bootstrap samples. However, the broad confidence intervals for several predictors show that feature-importance estimates remain uncertain and should not be interpreted as formal evidence of statistical significance or causal importance.
Table A20. Sensitivity analysis of the binary outcome definition (RQ1).
Outcome DefinitionGrowthNo Growth
Highest revenue category during Years 1–3 (main analysis)3918
Third-year revenue category only3918
Using only the third-year revenue category instead of the highest revenue category observed during the three-year period resulted in an identical classification of the analytical sample (39 Growth, 18 No Growth), with no firms changing outcome category. This indicates that the adopted operationalisation did not affect the classification results in the present dataset.

References

  1. Garcia-Martinez, L.J.; Kraus, S.; Breier, M.; Kallmuenzer, A. Untangling the relationship between small and medium-sized enterprises and growth: A review of extant literature. Int. Entrep. Manag. J. 2023, 19, 455–479. [Google Scholar] [CrossRef]
  2. European Commission. Annual Report on European SMEs 2023; Publications Office of the European Union: Luxembourg, 2023.
  3. Audretsch, D.B.; Belitski, M. Knowledge complexity and firm performance: Evidence from the European SMEs. J. Knowl. Manag. 2021, 25, 693–713. [Google Scholar] [CrossRef]
  4. Južnik Rotar, L.; Kontošić Pamić, R.; Bojnec, Š. Contributions of small and medium enterprises to employment in the European Union countries. Econ. Res.-Ekon. Istraž. 2019, 32, 3302–3314. [Google Scholar] [CrossRef]
  5. Audretsch, D.B.; Belitski, M.; Caiazza, R.; Phan, P. Collaboration strategies and SME innovation performance. J. Bus. Res. 2023, 164, 114018. [Google Scholar] [CrossRef]
  6. Colombelli, A.; Krafft, J.; Vivarelli, M. To be born is not enough: The key role of innovative start-ups. Small Bus. Econ. 2016, 47, 277–291. [Google Scholar] [CrossRef]
  7. OECD. OECD Annual Report 2006; OECD Publishing: Paris, France, 2026. [Google Scholar] [CrossRef]
  8. Bertoni, F.; Colombo, M.G.; Grilli, L. Venture capital financing and the growth of high-tech start-ups: Disentangling treatment from selection effects. Res. Policy 2011, 40, 1028–1043. [Google Scholar] [CrossRef]
  9. Grilli, L.; Murtinu, S. Government, venture capital and the growth of European high-tech entrepreneurial firms. Res. Policy 2014, 43, 1523–1543. [Google Scholar] [CrossRef]
  10. Bellucci, A.; Gucciardi, G.; Nepelski, D. Public grants beneficiaries and venture capital-backed firms: A tale of two funding strategies. J. Technol. Transf. 2025, 50, 2262–2305. [Google Scholar] [CrossRef]
  11. Croce, A.; Martí, J.; Murtinu, S. The impact of venture capital on the productivity growth of European entrepreneurial firms: ‘Screening’ or ‘value added’ effect? J. Bus. Ventur. 2013, 28, 489–510. [Google Scholar] [CrossRef]
  12. Filippetti, A.; Gkotsis, P.; Vezzani, A.; Zinilli, A. Are innovative regions more resilient? Evidence from Europe in 2008–2016. Econ. Politica 2020, 37, 807–832. [Google Scholar] [CrossRef]
  13. Yoo, H.S.; Jung, Y.L.; Jun, S.-P. Prediction of SMEs’ R&D performances by machine learning for project selection. Sci. Rep. 2023, 13, 7598. [Google Scholar] [CrossRef] [PubMed]
  14. Kou, G.; Xu, Y.; Peng, Y.; Shen, F.; Chen, Y.; Chang, K.; Kou, S. Bankruptcy prediction for SMEs using transactional data and two-stage multiobjective feature selection. Decis. Support Syst. 2021, 140, 113429. [Google Scholar] [CrossRef]
  15. Babic, T.; Katnic, M.; Katnic, I.; Kavaric, V.; Drakic-Grgur, M. Innovation for Sustainable SMEs: How Financial Health Drives Resilience and Long-Term Performance in a Transition Economy. Sustainability 2026, 18, 1145. [Google Scholar] [CrossRef]
  16. Civelek, M.; Ključnikov, A.; Fialova, V.; Folvarčná, A.; Stoch, M. Major obstacles in innovative activities of family-owned SMEs: Evidence from Czechia. Econ. Sociol. 2021, 14, 137–149. [Google Scholar] [CrossRef]
  17. Rammer, C.; Czarnitzki, D.; Spielkamp, A. Innovation success of non-R&D-performers: Substituting technology by management in SMEs. Small Bus. Econ. 2009, 33, 35–58. [Google Scholar] [CrossRef]
  18. Zhou, L.; Rahat, B. How do environmental, social, and governance factors impact entrepreneurial finance? Evidence from the European small and medium enterprises. Int. J. Entrep. Behav. Res. 2025, 32, 911–926. [Google Scholar] [CrossRef]
  19. Romero Alvarez, Y.P.; Salas-Navarro, K.; Martínez, L.B.; Zamora-Musa, R. Financing innovation in SMEs: A systematic review of financing channels. Int. J. Innov. Sci. 2026, 18, 524–563. [Google Scholar] [CrossRef]
  20. Autio, E.; Kenney, M.; Mustar, P.; Siegel, D.; Wright, M. Entrepreneurial innovation: The importance of context. Res. Policy 2014, 43, 1097–1108. [Google Scholar] [CrossRef]
  21. Kitić, A.; Radisić, M.; Takači, A. Bridging entrepreneurial intention and action: How financing models shape the growth of innovative SMEs in Widening Countries. Adm. Sci. 2025, 15, 419. [Google Scholar] [CrossRef]
  22. Beck, T. Bank Financing for SMEs—Lessons from the Literature. Natl. Inst. Econ. Rev. 2013, 225, R23–R38. [Google Scholar] [CrossRef]
  23. Teece, D.J. Intangible Assets and a Theory of Heterogeneous Firms. In Intangibles, Market Failure and Innovation Performance; Bounfour, A., Miyagawa, T., Eds.; Springer International Publishing: Cham, Switzerland, 2015; pp. 217–239. [Google Scholar] [CrossRef]
  24. OECD Publishing. Financing SMEs and Entrepreneurs 2026: An OECD Scoreboard; OECD Publishing: Paris, France, 2026. [Google Scholar]
  25. Atanassov, J.; Nanda, V.; Seru, A. Finance and Innovation: The Case of Publicly Traded Firms; SSRN: Rochester, NY, USA, 2007. [Google Scholar]
  26. Åstebro, T.; Bernhardt, I. Start-up financing, owner characteristics, and survival. J. Econ. Bus. 2003, 55, 303–319. [Google Scholar] [CrossRef]
  27. Hall, B.H. The financing of innovative firms. Eur. Investig. Bank Pap. 2009, 14, 8–28. Available online: https://hdl.handle.net/10419/44902 (accessed on 20 May 2026). [CrossRef]
  28. Bessiere, V.; Stephany, E.; Wirtz, P. Crowdfunding, business angels, and venture capital: An exploratory study of the concept of the funding trajectory. Ventur. Cap. 2020, 22, 135–160. [Google Scholar] [CrossRef]
  29. Islam, M.; Fremeth, A.; Marcus, A. Signaling by early stage startups: US government research grants and venture capital funding. J. Bus. Ventur. 2018, 33, 35–51. [Google Scholar] [CrossRef]
  30. Shinkle, G.A.; Suchard, J.A. Innovation in newly public firms: The influence of government grants, venture capital, and private equity. Aust. J. Manag. 2019, 44, 248–281. [Google Scholar] [CrossRef]
  31. Bertoni, F.; Tykvová, T. Does governmental venture capital spur invention and innovation? Evidence from young European biotech companies. Res. Policy 2015, 44, 925–935. [Google Scholar] [CrossRef]
  32. Lange, J.; Rezepa, S.; Zatrochova, M. The role of business angels in the early-stage financing of startups: A systematic literature review. Adm. Sci. 2024, 14, 247. [Google Scholar] [CrossRef]
  33. Mora-Cruz, A.; Palos-Sanchez, P.R. Crowdfunding platforms: A systematic literature review and a bibliometric analysis. Int. Entrep. Manag. J. 2023, 19, 1257–1288. [Google Scholar] [CrossRef]
  34. Milutinović, R.; Benković, S.; Stošić, B. The review of external sources of innovation financing. In Proceedings of the IPMA World Congress; Springer: Berlin/Heidelberg, Germany, 2018; Available online: https://www.researchgate.net/publication/327471233 (accessed on 20 May 2026).
  35. Choudhury, M.; Goswami, C. MSME financing gaps–review of literature for the period 2005 to 2016. J. Small Bus. Entrep. Dev. 2019, 7, 50–60. [Google Scholar]
  36. Baum, J.A.C.; Silverman, B.S. Picking winners or building them? Alliance, intellectual, and human capital as selection criteria in venture financing and performance of biotechnology startups. J. Bus. Ventur. 2004, 19, 411–436. [Google Scholar] [CrossRef]
  37. Colombo, M.G.; Grilli, L. On growth drivers of high-tech start-ups: Exploring the role of founders’ human capital and venture capital. J. Bus. Ventur. 2010, 25, 610–626. [Google Scholar] [CrossRef]
  38. Gompers, P.; Kaplan, S.N.; Mukharlyamov, V. What do private equity firms say they do? J. Financ. Econ. 2016, 121, 449–476. [Google Scholar] [CrossRef]
  39. Engel, D.; Keilbach, M. Firm-level implications of early stage venture capital investment—An empirical investigation. J. Empir. Financ. 2007, 14, 150–167. [Google Scholar] [CrossRef]
  40. Wijaya Rosa, M.C.; Ganis Sukoharsono, E.; Saraswati, E. The role of venture capital on start-up business development in Indonesia. J. Account. Invest. 2019, 20, 55–74. [Google Scholar] [CrossRef]
  41. Gilbert, B.A.; McDougall, P.P.; Audretsch, D.B. New venture growth: A review and extension. J. Manag. 2006, 32, 926–950. [Google Scholar] [CrossRef]
  42. Immawan, T.; Pratiwi, A.I.; Cahyo, W.N. The proposed dashboard model for measuring performance of SMEs. Int. J. Integr. Eng. 2019, 11, 167–173. [Google Scholar] [CrossRef]
  43. Lestari, E.R.; Ardianti, F.L. The mediating role of customer value on innovation and firm performance: Evidence from Indonesian SMEs. In IOP Conference Series: Earth and Environmental Science; IOP Publishing: Bristol, UK, 2019; Volume 230. [Google Scholar] [CrossRef]
  44. Rose, R.C.; Kumar, N.; Lim, Y.L. The dynamics of entrepreneurs’ success factors in influencing venture growth. J. Asia Entrep. Sustain. 2006, 2, 133. [Google Scholar] [CrossRef]
  45. Vanacker, T.; Vismara, S.; Walthoff-Borm, X. What happens after a crowdfunding campaign? In Handbook of Research on Crowdfunding; Edward Elgar Publishing: Cheltenham, UK, 2019; pp. 227–248. [Google Scholar] [CrossRef]
  46. Szuper, K. Innovative company profile: Age, size and sources of financing. Sci. Pap. Silesian Univ. Technol. Organ. Manag. Ser. 2021, 2021, 486–494. [Google Scholar] [CrossRef]
  47. Drover, W.; Busenitz, L.; Matusik, S.; Townsend, D.; Anglin, A.; Dushnitsky, G. A review and road map of entrepreneurial equity financing research. J. Manag. 2017, 43, 1820–1853. [Google Scholar] [CrossRef]
  48. Tenca, F.; Croce, A.; Ughetto, E. Business angels research in entrepreneurial finance: A literature review and a research agenda. In Contemporary Topics in Finance; Wiley: Hoboken, NJ, USA, 2019; pp. 183–214. [Google Scholar] [CrossRef]
  49. Djuraeva, L. Importance of the innovative business models for the future success of the company. SHS Web Conf. 2021, 100, 01013. [Google Scholar] [CrossRef]
  50. Bradley, S.W.; Kim, P.H.; Klein, P.G.; McMullen, J.S.; Wennberg, K. Policy for innovative entrepreneurship: Institutions, interventions, and societal challenges. Strateg. Entrep. J. 2021, 15, 167–184. [Google Scholar] [CrossRef]
  51. Cavallo, A.; Ghezzi, A.; Dell’Era, C.; Pellizzoni, E. Fostering digital entrepreneurship from startup to scaleup: The role of venture capital funds and angel groups. Technol. Forecast. Soc. Change 2019, 145, 24–35. [Google Scholar] [CrossRef]
  52. OECD. OECD SME and Entrepreneurship Outlook 2021; OECD Publishing: Paris, France, 2021. [Google Scholar] [CrossRef]
  53. Serrasqueiro, Z.; Pinto, B.; Sardo, F. SMEs growth and profitability, productivity and debt relationships. J. Econ. Financ. Adm. Sci. 2023, 28, 404–419. [Google Scholar] [CrossRef]
  54. Barboza, F.; Kimura, H.; Altman, E. Machine learning models and bankruptcy prediction. Expert Syst. Appl. 2017, 83, 405–417. [Google Scholar] [CrossRef]
  55. Radosevic, S.; Yoruk, E. Technology upgrading of middle-income economies: A new approach and results. Technol. Forecast. Soc. Change 2018, 129, 56–75. [Google Scholar] [CrossRef]
  56. Esposito, F.; Malerba, D.; Semeraro, G.; Kay, J. A comparative analysis of methods for pruning decision trees. IEEE Trans. Pattern Anal. Mach. Intell. 1997, 19, 476–491. [Google Scholar] [CrossRef]
  57. European Commission; Hollanders, H. European Innovation Scoreboard 2023; Publications Office of the European Union: Luxembourg, 2023.
  58. OECD. Financing SMEs and Entrepreneurs 2018: An OECD Scoreboard; OECD Publishing: Paris, France, 2018. [Google Scholar] [CrossRef]
  59. Startup Commons. (n.d.). Available online: https://www.startupcommons.org/ (accessed on 20 March 2026).
  60. Panda, R.M.; Daya Sagar, B.S. Decision tree. In Encyclopedia of Mathematical Geosciences; Springer International Publishing: Cham, Switzerland, 2023; pp. 257–262. [Google Scholar]
  61. Larose, D.T.; Larose, C.D. Decision Trees. In Discovering Knowledge in Data: An Introduction to Data Mining, 2nd ed.; John Wiley & Sons: Hoboken, NJ, USA, 2014. [Google Scholar] [CrossRef]
  62. Blockeel, H.; Devos, L.; Frénay, B.; Nanfack, G.; Nijssen, S. Decision trees: From efficient prediction to responsible AI. Front. Artif. Intell. 2023, 6, 1124553. [Google Scholar] [CrossRef] [PubMed]
  63. Kollmann, T.; Stockmann, C.; Hensellek, S. German Startup Monitor; German Startups Association: Berlin, Germany, 2016. [Google Scholar]
  64. Howell, S.T. Financing innovation: Evidence from R&D grants. Am. Econ. Rev. 2017, 107, 1136–1164. [Google Scholar] [CrossRef]
  65. Radicic, D.; Pugh, G. Performance effects of external search strategies in European small and medium-sized enterprises. J. Small Bus. Manag. 2017, 55, 76–114. [Google Scholar] [CrossRef]
Figure 1. Variable Importance—Revenue Growth Predictors (RQ1).
Sustainability 18 07573 g001
Figure 2. Decision Tree—Pre-investment Determinants of Revenue Growth (n = 57 innovative SMEs in Widening Countries). The checkmark (✓) denotes predicted revenue growth, while the cross (×) denotes predicted no growth.
Sustainability 18 07573 g002
Figure 3. Mean Revenue Trajectory by Initial Revenue Group (RQ2).
Sustainability 18 07573 g003
Table 1. Descriptive statistic of the sample.
VariableCategoryn%
Geographic Distribution (N = 81)
CountrySerbia1619.8%
Greece1113.36%
Bulgaria1012.3%
Romania1012.3%
Croatia1012.3%
Latvia1012.3%
Cyprus47.4%
Turkey14.9%
Montenegro14.9%
Poland14.9%
Slovenia14.9%
North Macedonia14.9%
Industry Sector (N = 81)
SectorTechnology, hardware & machinery1822.2%
Software as a Service (SaaS)1721.0%
Education911.1%
Other911.1%
IT & software development89.9%
Green technology67.4%
Bio-, nano- & medtech44.9%
AgriTech/Media/Online/Consulting~2.5% each
Financing Status (N = 81)
Received modern financingYes (analytical sample)5770.4%
No2429.6%
Dominant Financing Type—Primary Source (N = 57)
Financing typeGrant3456.6.%
Business angel1322.8%
Venture capital915.8%
Crowdfunding11.2%
Development Stage at Time of Financing (N = 57)
Development stageIdeation58.8%
Concepting1119.3%
Commitment1221.1%
Validation1322.8%
Scaling1526.4%
Establishing11.8%
Pre-Investment Revenue Level (N = 57)
Revenue before financingPre-revenue (€0)2035.1%
<€50,0001526.3%
€50,000–€100,00058.8%
€100,000–€250,000915.8%
€250,000–€500,00058.8%
€500,000–€1,000,00011.8%
>€1,000,00023.5%
Number of Employees at Time of Financing (N = 57)
Employees1–54375.4%
6–10814.0%
11–2058.8%
>5011.8%
Customer Base Before Financing (N = 57)
Customers0814.0%
1–101526.3%
11–501221.1%
51–10011.8%
101–500814.0%
501–100023.5%
>10001119.3%
Business Model Definition Before Financing (N = 57)
Defined business modelYes4884.2%
No915.8%
Post-Investment Revenue Trajectory (N = 57)
Revenue trajectory (3 years)Strong growth (≥2 category increase)1628.1%
Steady growth (1 category increase)2340.4%
Stagnant (no change)1322.8%
Decline58.8%
Table 2. Comparison of predictive performance between the primary CART models and robustness-check models for RQ1 and RQ2.
OutcomeModelCross-Validated AccuracyROC–AUCPurpose
RQ1CART0.6500.717Primary interpretable model
Logistic Regression0.7370.748Robustness check
Random Forest0.6840.742Robustness check
RQ2CART0.3830.623Primary interpretable model
Multinomial Logistic Regression0.3860.639Robustness check
Random Forest0.4210.677Robustness check
Disclaimer/Publisher’s Note: The statements, opinions and data contained in all publications are solely those of the individual author(s) and contributor(s) and not of MDPI and/or the editor(s). MDPI and/or the editor(s) disclaim responsibility for any injury to people or property resulting from any ideas, methods, instructions or products referred to in the content.