Article

Digital Circulation and Sustainable Consumption: Evidence from China’s National E-Commerce Demonstration City Policy

School of Economics, Shanghai University, Shanghai 200444, China
*
Author to whom correspondence should be addressed.
Sustainability 2026, 18(14), 7477; https://doi.org/10.3390/su18147477
Submission received: 26 June 2026 / Revised: 15 July 2026 / Accepted: 16 July 2026 / Published: 22 July 2026

Abstract

Consumption is a basic driver of economic growth and a key part of the new development paradigm centered on the dual circulation of domestic and international markets. Treating the establishment of National E-Commerce Demonstration Cities as a quasi-natural experiment, this paper employs a multi-period difference-in-differences (DID) model and draws on panel data from Chinese prefecture-level cities spanning 2009 to 2023 to estimate the impact of the demonstration city policy on residents’ consumption levels and its transmission mechanisms. The findings are as follows: First, the National E-Commerce Demonstration City Policy significantly promotes residents’ consumption. Compared with the control group, consumption levels in demonstration cities increased by approximately 6.6%, and this result is robust to various specification checks. Second, mechanism analysis shows that the policy boosts consumption through three channels: stimulating urban entrepreneurship, upgrading smart logistics, and improving digital infrastructure. These channels together help build a more efficient consumption system. Third, heterogeneity analysis indicates that the policy effect is stronger in large cities, central and western regions, non-old industrial base cities, and cities with higher urbanization rates. These findings provide theoretical insights and practical implications for refining the e-commerce demonstration policy, tailoring it to local conditions, and unlocking consumption potential.

1. Introduction

Consumption is a basic driver of economic growth and a key part of the new development paradigm centered on the dual circulation of domestic and international markets. It also plays a critical role in addressing employment challenges and driving industrial upgrading [1]. At the same time, achieving sustainable development in residents’ consumption can help establish a dynamic balance across social, economic, and environmental dimensions while meeting people’s growing aspirations for a better life. The Party Central Committee has consistently emphasized the importance of consumption, the 20th National Congress called for strengthening consumption as a fundamental engine of economic development, and the Central Economic Work Conference in late 2023 further called for unlocking consumption potential and actively pursuing consumer market expansion. But Chinese residents have recently exhibited relatively low willingness to consume, with insufficient momentum for consumption upgrading and underutilized domestic demand potential. Therefore how to effectively stimulate residents’ consumption, consolidate the foundation of domestic demand, and steer it toward a sustainable consumption pathway has become a pressing issue on the path to high-quality economic development. Given this, e-commerce’s rapid growth has become an important force in activating consumption potential.
Traditional consumption models are typically characterized by high resource intensity and low operational efficiency. As a key link between production and consumption, e-commerce offers distinctive advantages in expanding consumption channels, lowering transaction costs, and enabling more precise supply–demand matching. E-commerce operates on both the supply and demand sides. It helps remove structural constraints on domestic demand and encourages a consumption pattern that is more efficient and more sustainable. To allow e-commerce to realize its full potential in stimulating consumption, China began piloting the National E-Commerce Demonstration City program in 2009, rolling out participating cities in successive batches. The program sought to strengthen regional e-commerce ecosystems, promote sustainable and healthy consumption patterns, and create digitally enabled integrated scenarios, using policy incentives and resource mobilization as its primary instruments. The results across demonstration cities have been considerable. Livestream commerce and on-demand retail have expanded rapidly, and rural and township logistics networks have been progressively refined. These developments helped improve circulation efficiency and cut resource waste. Residents in demonstration cities also enjoyed greater convenience and accessibility in their daily consumption, and inclusive consumption scenarios were further expanded. These effects are also driving consumption toward a greener, low-carbon, and more sustainable path. According to the National Bureau of Statistics, online retail sales in China grew by 8.6 percent in 2025 compared with the previous year, while physical goods sold online represented 26.1 percent of total consumer goods retail sales. Demonstration cities have been at the forefront of this trend, playing a leading role.
Policy efforts have stepped up further. In 2024, the Ministry of Commerce’s General Office issued the Notice on Implementing the Digital Consumption Enhancement Action, urging localities to leverage e-commerce industry clusters and develop new digital service consumption models. In 2025, the NDRC and eight other central ministries jointly issued the Guiding Opinions on Vigorously Developing Digital Consumption and Co-Creating a Better Life in the Digital Era. The document aims to boost digital consumption, accelerate the integration of online and offline retail, and unlock the potential of household spending. These measures have provided a solid institutional basis for the continued development of National E-Commerce Demonstration Cities. By mitigating information asymmetry and improving supply–demand matching, e-commerce offers a market-based way to steer consumption toward greater sustainability.
Three strands of literature are particularly relevant to this study. The first focuses on the effects of the National E-Commerce Demonstration City Policy, where studies have identified positive impacts across multiple dimensions. Regarding the economic effects, Tang Yuehuan et al. (2020) found that the policy helped raise rural incomes and narrow the urban–rural gap [2]. Gao Changchun and Zou Yao (2021) showed that it facilitated industrial upgrading through technological innovation and factor reallocation [3]. Xie Wendong (2023) and Li Zhen et al. (2023) showed, from urban and firm-level perspectives, respectively, that the policy effectively increased employment and alleviated structural imbalances [4,5]. Furthermore, Liu Yubin et al. (2024) and Chen Kaixuan and Zhang Shushan (2024) uncovered its micro-level effects in accelerating enterprise digital transformation and deepening the integration of digital and real economies [6,7]. On the sustainability front, related studies have confirmed that the policy significantly improved urban green total factor productivity [8]; reduced both the volume and intensity of carbon emissions [9]; and, at the firm level, incentivized green technological innovation [10].
The second area focuses on the determinants of residents’ consumption. Researchers have identified several factors that shape consumer behavior. Income level [11] and precautionary saving motives [12] stand out as basic determinants. At the same time, economic uncertainty tends to strengthen consumption habit persistence and weaken people’s willingness to spend [13]. As the digital economy has deepened, scholarly attention has increasingly turned to the mechanisms through which digital forces enable and expand household consumption. Regarding digital finance, Li et al. (2020) and Chen et al. (2024) both found that digital payment and online credit have clear positive effects on consumer spending [14,15]. Du Yufei (2025) further argued that digital inclusive finance not only improves financial literacy but also strengthens an individual’s ability to cope with economic risks, thereby fostering more stable and sustained consumption behavior [16]. More broadly, at the level of digital technology and the digital economy, Li Yusong and Hu Xueping (2025) and Zhang Yi (2025) drew on the perspectives of technological enablement and digital economic development, respectively, and demonstrated the positive contributions of both to advancing Chinese-style consumption modernization [17,18]. Infrastructure development also helps activate consumption. The opening of high-speed rail [19] and the expansion of shared bicycle services [20] have each been found to broaden consumption scenarios and unlock latent consumer potential by improving the external conditions shaping daily mobility and access. The “debut economy”—an emerging concept that refers to how first-release products and experiences drive consumer demand—also empowers consumption upgrading [21] and unlocks consumption potential [22].
The third area examines the relationship between e-commerce and residents’ consumption. Researchers have paid considerable attention to how e-commerce affects consumer behavior in the digital economy. Regarding the promoting side, the existing literature broadly found that e-commerce platforms can effectively convert latent demand into realized consumption [23]. Moreover, by raising household incomes, improving the consumption environment, and enriching the supply of goods [24,25], they encourage residents to move toward more advanced consumption patterns [26]. Han Shenchao et al. (2025) extended this line of research by treating the establishment of cross-border e-commerce comprehensive pilot zones as an exogenous shock and constructed a multi-period difference-in-differences model [27], providing policy-level evidence of a significant promotional effect on household service consumption. Regarding non-linear dynamics, Fang Fuqian and Xing Wei (2015) found a U-shaped relationship between e-commerce scale and consumption expenditure [28], while Sun Tianhao and Wang Yan (2022) noted that Chinese consumer demand has shifted from subsistence-oriented to development-oriented consumption [29]. They also observed that the digital economy helps reshape production modes while generating new forms of consumer demand. Scholars disagree about the urban–rural consumption gap. Wang Qi et al. (2021), using the pilot program for e-commerce in rural comprehensive demonstration counties as a quasi-natural experiment, found that emerging e-commerce formats help dismantle information barriers and narrow the urban–rural consumption divide [30]. Gao Jiacheng and Liu Yue (2022), however, found that, while e-commerce development raises overall rural consumption levels, it may widen the gap between urban and rural areas in the quality of development-oriented consumption due to disparities in digital skills and infrastructure access [31].
The existing literature has accumulated insights into the policy effects of the National E-Commerce Demonstration City program, the determinants of residents’ consumption, and the relationship between e-commerce and consumption. These studies provide a solid theoretical foundation and used a range of analytical approaches. This paper makes three main marginal contributions: First, this paper takes the National E-Commerce Demonstration City program as a quasi-natural experiment and applies a multi-period DID model to identify the causal effects of the policy. In contrast to many macro-level studies that focus on the average consumption effects of the digital economy and e-commerce, our approach better identifies the net policy effect and provides more reliable causal evidence linking e-commerce pilot policies to residents’ consumption. Second, for mechanism analysis, this paper suggests three channels through which the demonstration city policy could influence residents’ consumption: entrepreneurial vitality, smart logistics, and digital infrastructure. This suggests that the policy works by energizing market participants, boosting logistics efficiency, and upgrading digital infrastructure to stimulate consumption. Together, these mechanisms provide valuable empirical and theoretical support for understanding e-commerce policy effects on consumption. Third, this paper extends the literature on digital economy policy evaluation by discussing residents‘ consumption from a macro-sustainability perspective.

2. Policy Background and Research Hypotheses

2.1. Policy Background

E-commerce arguably constitutes the concentrated expression of the digital economy within the circulation sphere. It has profoundly transformed the way goods and services are produced, distributed, and consumed, and has become one of the primary means of unlocking residents’ consumption potential and stimulating domestic demand. To accelerate the digital commercial transformation of cities and strengthen regional e-commerce ecosystems, the Chinese government launched a nationwide initiative to build National E-Commerce Demonstration Cities beginning in 2009.
That year, the National Development and Reform Commission and the Ministry of Commerce approved Shenzhen as the country’s first National E-Commerce Demonstration City. This marked the beginning of a policy-driven effort to promote standardized and sustainable development in the e-commerce industry. Shenzhen has concentrated on the long-term development of the e-commerce ecosystem and on the sustainable innovation of consumption formats. By building e-commerce platforms, improving the business environment, and fostering new consumption patterns, the city has generated a range of practical experiences that can be replicated elsewhere. These experiences have in turn provided important references for the subsequent batches of demonstration cities. In 2011, 21 cities, including Shanghai, Beijing, and Qingdao, were approved as demonstration cities, marking a significant shift in the program’s geographical coverage, from a single pilot location to a coordinated multi-city network. Subsequently, the National Development and Reform Commission and the Ministry of Commerce announced the third and fourth batches of demonstration cities in 2014 and 2017, respectively, bringing the total number of nationally approved demonstration cities to 69. Together, they formed a tiered and coordinated development pattern that spanned the eastern, central, and western regions of China.
Issued jointly by the NDRC and four other central ministries, the Guiding Opinions on National E-Commerce Demonstration Cities articulate the policy’s primary goals. According to the document, the policy is expected to help optimize industrial structure, overcome the limits posed by geography and natural resources, promote a green economy, improve people’s livelihoods, and improve the efficiency of government governance. The construction of demonstration cities has relied primarily on improving the e-commerce ecosystem, fostering industrial agglomeration, expanding consumption applications, and optimizing the supporting system for low-carbon circulation. Policy guidance, infrastructure development, market cultivation, and factor support have all worked together to reinforce these efforts. The central government provides overall planning and stronger policy guidance while also working to improve the business environment. Local authorities have introduced supporting measures of their own, such as industrial support, platform development, logistics upgrades, and talent recruitment and training. Coordinated implementation of these measures serves to cut institutional transaction costs, boost market dynamism, and limit the resource wastage inherent in traditional distribution systems. These measures can also improve resource allocation and help build a consumption system that is more efficient, low-carbon, and sustainable. Central and local governments have directed demonstration incentives, project funding, and performance-based subsidies toward priority areas, including logistics model innovation, rural e-commerce, and public service platform construction. Since implementation, demonstration cities have helped e-commerce industrial chains agglomerate and extend. They have also refined urban–rural logistics networks and normalized integrated online–offline consumption. New business forms, such as livestreaming e-commerce and instant retail, have continued to emerge. Residents now enjoy noticeably better access to consumption opportunities and more sustainable options. These exploratory efforts have produced an experience that is both valuable and replicable, providing guidance for other regions aiming to coordinate e-commerce expansion with consumption growth.

2.2. Research Hypotheses

2.2.1. The Direct Effects of National E-Commerce Demonstration City Construction on Household Consumption

The construction of National E-Commerce Demonstration Cities has an effect on residents’ shopping patterns and consumption habits while also potentially raising their consumption levels. First, the construction of demonstration cities may help bring about new consumption formats. It may also expand the scale of resident consumption and promote progress toward more sustainable consumption. Demonstration cities often function as important hubs for the digital economy and innovation-driven industries. New formats such as livestream commerce, on-demand retail, and community group buying have created a consumption mode that extends across time and space, allowing consumption activities to break free from traditional commercial districts and spread into neighborhoods, nighttime street economies, and digital spaces [32]. Demonstration city policies are expected to encourage the large-scale development of e-commerce platforms and promote innovative marketing approaches, such as big data-driven precision marketing and livestream sales. As a result, these policies might expand the range of products and services available to consumers. This, in turn, would stimulate purchase intentions and consumption frequency, which may lead to a larger overall scale of consumption. Second, the construction of demonstration cities, by connecting different stages of commodity distribution, can improve residents’ consumption experience and consumption conditions to some extent, and facilitate the sustainable operation of the consumption chain. Meanwhile, by enhancing consumer search efficiency, e-commerce platforms may reduce the search costs arising from information asymmetry between producers and consumers, and increase consumption opportunities to improve transaction efficiency [33]. Demonstration city policies aim to deepen pilot work in areas such as “triple-network convergence” and “informatization–industrialization integration.” By continuously attracting brands and emerging enterprises with strong digital transformation credentials, they foster the agglomeration of high-technology industries and advance internet technology and scientific innovation. These efforts could potentially contribute to improving the overall environment for commodity circulation within the e-commerce economy. Such digital and intelligent logistics models help reduce resource losses and allocate resources more efficiently. In doing so, they could also facilitate the coordinated development of consumption and sustainability. Song Yuru (2026) similarly observed that new e-commerce formats rely on streamers’ real-time product demonstrations and interactive engagement [34]. This helps consumers quickly obtain comprehensive product information, significantly improving the efficiency of their consumption decisions and prompting deeper changes in residents’ consumption behavior and habits. On the basis of the foregoing analysis, this paper puts forward the following hypothesis:
H1. 
The construction of National E-Commerce Demonstration Cities could promote the improvement of household consumption levels.

2.2.2. Transmission Mechanisms Through Which National E-Commerce Demonstration City Construction Affects Household Consumption

The construction of National E-Commerce Demonstration Cities may influence residents’ consumption through a number of intermediate channels.
The Guiding Opinions on the Establishment of National E-Commerce Demonstration Cities, jointly issued by the Ministry of Commerce and other departments, outlines the principles and objectives for the construction. It emphasizes encouraging innovation and strengthening regulation while also aiming to create a favorable environment for e-commerce development and promote innovative applications of e-commerce in key regions and specialized sectors. This policy orientation may improve the supporting system of e-commerce and stimulate the vitality of market entities. Meanwhile, it may offer enabling conditions for e-commerce ventures, facilitate the linkage between entrepreneurial activity and consumption growth, and lay a solid groundwork for the sustainable improvement of consumption patterns. On the one hand, demonstration policies encourage entrepreneurship by lowering entry barriers and relaxing financing constraints, which in turn helps expand consumption. The development of the digital economy could also reduce the costs of information search and transaction verification, and it lowers barriers to market participation [35], which allows a wider range of prospective entrepreneurs to enter the market at a lower cost. E-commerce platforms can also help low-risk small- and medium-sized enterprises obtain bank financing, even when such firms would otherwise face credit rationing. They achieve this by collecting credit information, raising default costs, and co-establishing risk pools with banks and government agencies, which in turn activates latent entrepreneurial intent [36]. The sustained expansion of the entrepreneurial base enriches consumer goods supply in both variety and quantity. It may also generate more diverse consumption scenarios and experiences, which could jointly expand residents’ consumption from both the supply and demand sides, and simultaneously help establish market conditions conducive to the large-scale supply of green products and sustainable lifestyles. On the other hand, demonstration policies further reinforce entrepreneurial vitality by fostering talent and venture capital, thereby helping convert entrepreneurial activity into stronger consumption outcomes. Prior research also indicates that e-commerce policy timing stimulates urban entrepreneurial vitality [37], specifically by attracting talent, channeling venture capital, and spurring technological innovation [38]. Sustained entrepreneurial activity continuously generates new products, services, and consumption models, which enrich residents’ consumption choices and guide the upgrading of consumer demand. This could promote residents’ consumption growth and realize mutual empowerment between consumption growth and sustainable social economy development. Building on the preceding discussion, this paper proposes the following research hypothesis:
H2. 
National E-Commerce Demonstration City construction may promote residents’ consumption growth by stimulating urban entrepreneurial vitality.
The logistics industry lays the foundational conditions for expanding consumer markets by compressing spatial and temporal distances and reducing transaction costs. The degree of logistics infrastructure development is positively correlated with the scale of consumption [39]. Meanwhile, modern logistics systems also provide an essential foundation for sustainable household consumption. They help optimize resource allocation efficiency and facilitate the transformation of consumer markets toward higher quality and greater sustainability. Smart logistics integrates information technology with logistics operations, thereby enhancing its capacity to spur consumer demand. By combining the Internet of Things, artificial intelligence, and big data technologies, smart logistics lowers costs while improving operational efficiency [40], reduces resource losses, and expands the supply side coverage of consumer markets. The implementation of the National E-Commerce Demonstration City Policy provides institutional support for these developments. Demonstration city policies use policy guidance and resource concentration to strengthen the logistics infrastructure that supports e-commerce. By extending distribution networks to cover more areas, these policies could broaden the availability of consumer goods. This may reduce the demand suppression caused by inadequate logistics coverage and thus raise residents’ actual consumption levels. As smart logistics quality improves, logistics efficiency is expected to rise. This reduces the time and loss costs in commodity circulation and advances a greener, more sustainable transformation of consumption. In turn, lower end-consumer prices may boost residents’ willingness to consume. The integration of logistics and digital technologies also generates new consumption scenarios, such as online shopping and on-demand retail, and could encourage the upgrading of consumption patterns [41]. Based on the foregoing analysis, this paper proposes the following hypothesis:
H3. 
National E-Commerce Demonstration City construction may promote residents’ consumption growth by raising the level of smart logistics.
As a critical foundation of the digital economy and a central pillar of e-commerce demonstration city initiatives, digital infrastructure plays a vital role in shaping household consumption. Its advancement affects consumption scale, quality, and the overall sustainability of consumer behavior. Policies for demonstration cities speed up the deployment of new digital infrastructure, thereby potentially lowering the information costs and transaction impediments encountered by residents. This, in turn, expands consumption at scale. The rise of digital platform technologies has progressively transformed transaction models, moving them from conventional in-person dealings toward a hybrid online–offline mode. Digital exchange now extends along the entire circulation chain, reaching suppliers, e-commerce operators, logistics providers, and online payment systems alike. With the digital transformation of infrastructure and tools, big data technologies may give rise to a range of innovations—including novel business models, new employment opportunities, emerging consumption contexts, and fresh market entrants. These developments generate fresh sources of supply and demand, which could in turn contribute to a higher level dynamic equilibrium between the two [42]. Under the demonstration city program, there has been a notable increase in investment directed toward new digital infrastructure, particularly 5G networks, the industrial internet, and artificial intelligence. This helps build an efficient and coordinated network that links commercial, logistics, information, and capital flows. Consequently, resident consumption becomes more convenient, while a greater share of latent demand is translated into realized purchases. Unlike traditional consumption patterns, improvements in digital infrastructure might help facilitate the allocation of social resources in a more efficient manner. They also steer consumption toward a more efficient and sustainable path. Moreover, these demonstration policies leverage the scale and network effects of digital infrastructure to generate novel consumption scenarios. This may further unlock residents’ consumption potential. New digital infrastructure affects consumption patterns by optimizing consumption environments and guiding consumer behavior. As big data and AI become more pervasive in consumption, consumers can make faster, more informed choices. At the same time, advances in digital payment technology reduce transaction costs, which could in turn enhance the shopping experience and raise consumer satisfaction [43]. As digital infrastructure in demonstration cities advances and e-commerce platforms expand their service capabilities, new consumption formats such as livestream commerce and community e-commerce have emerged. Consumption scenarios have become considerably richer, and the breadth and depth of household consumption have expanded accordingly. This helps consumption move toward a more sustainable path in the long run. Building on the preceding discussion, this paper proposes the following research hypothesis:
H4. 
National E-Commerce Demonstration City construction could promote residents’ consumption growth by improving digital infrastructure.

3. Measurement Models, Variables, and Data

3.1. Model Specification

This study adopts a multi-period difference-in-differences (DID) framework. Cities that were designated as National E-Commerce Demonstration Cities form the treatment group, while those without such designation serve as the control group. The empirical analysis focuses on the policy effects of this initiative on household consumption, and the econometric model is specified below.
C o n i j = α + β D I D i j + γ Z i j + μ i + ϕ j + ε i j
where the subscript i denotes the city, and j denotes the year. The dependent variable C o n i j measures residents’ consumption in city i in year j. The core explanatory variable is the interaction term of t r e a t i and p o s t i j . Here, t r e a t i is the treatment group dummy that indicates whether city i has been designated as a National E-Commerce Demonstration City, taking a value of 1 if so and 0 otherwise; the policy implementation dummy p o s t i j takes a value of 1 if city i is designated in year j or any subsequent year and 0 otherwise. City-level control variables Z i j are also included. μ i and ϕ j represent city fixed effects and year fixed effects, respectively, and ε i j denotes the random error term.
According to the preceding theoretical hypothesis analysis, the National E-Commerce Demonstration City Policy may affect resident consumption through three channels: urban entrepreneurial vitality, smart logistics development, and digital infrastructure construction. To avoid the drawbacks of the stepwise mediation method, this paper employs the two-step method as recommended by Jiang (2022) [44]. This paper empirically tests the impact of the demonstration city policy on the above mechanism variables and further analyzes their effects on resident consumption in the theoretical section. The specific models are specified as follows:
M i j = α + β D I D i j + γ Z i j + μ i + ϕ j + ε i j
where M i j denotes the mechanism variable, and all other terms are as defined above.

3.2. Variable Definitions

3.2.1. Dependent Variable

This paper uses the natural logarithm of total retail sales of consumer goods to measure residents’ consumption level (Con) as the core dependent variable. This choice is motivated by two main considerations: First, the total retail sales of consumer goods is a comprehensive indicator reflecting commodity circulation and household consumption activity over a given period. It captures the actual scale of residents’ spending on goods and everyday consumption, and aligns well with the essential meaning of household consumption level. Second, this measure is practical in terms of data availability. Most existing measures of residents’ consumption are available only at the provincial or household micro-level, while data at the prefecture city level are largely missing. Given data constraints at the prefecture city level, existing studies often use the logarithm of the total retail sales of consumer goods to proxy for residents’ consumption [45], where a higher value corresponds to a larger consumption scale.

3.2.2. Explanatory Variable

This paper selects the National E-Commerce Demonstration City Policy (DID) as the core explanatory variable. This variable takes a value of 1 for the year in which a city is approved as a National E-Commerce Demonstration City and all subsequent years, and a value of 0 otherwise. In practice, this variable represents the interaction term between the demonstration city group dummy and the policy timing dummy.

3.2.3. Mechanism Variables

  • Urban Entrepreneurial Vitality (Ent)
Following He Yuke et al. (2024), this paper uses the annual number of newly registered industrial and commercial enterprises in each city as a proxy for urban entrepreneurial vitality [46].
2.
Smart Logistics Level (Log)
This variable is measured as the ratio of the volume of express delivery services in a city to its permanent resident population.
3.
Level of Digital Infrastructure Development (Dig)
Digital infrastructure is a complex system with multiple dimensions and layers, and a single indicator cannot fully measure its actual development status. Measuring regional digital infrastructure development requires paying attention not only to basic inputs such as hardware and human capital but also to its diffusion and output performance. Accordingly, evaluation from both the supply and demand sides can reasonably reflect the overall status. Given the data constraints at the prefecture city level, this paper follows Zhao Xing (2022) and constructs a digital infrastructure evaluation index system with six indicators divided into two dimensions, digital infrastructure inputs and digital infrastructure outputs [47]. The specific indicators are presented in Table 1. And this paper adopts the entropy weight method to assign weights to each indicator, thereby comprehensively measuring the development level of regional digital infrastructure.
4.
Control Variables
Drawing on the existing literature, the following control variables are included: Economic development level (Pgdp) is measured as the natural logarithm of per capita regional GDP. Human capital stock (Edu) is captured by the ratio of enrolled students in higher education institutions to the total regional population. Degree of openness to trade (Open) is measured as the share of total imports and exports in GDP. Infrastructure (Inf) is represented by the natural logarithm of the number of mobile phone subscribers at year-end. Industrial structure upgrading (Indus) is defined as the share of tertiary sector value added in regional GDP. Financial development level (Fin) is measured as the ratio of outstanding loans from financial institutions to regional GDP. Fiscal pressure (Gov) is measured as the gap between public budget revenues and expenditures expressed as a proportion of general public budget expenditures.

3.3. Data Sources and Sample Selection

A list of approved National E-Commerce Demonstration City pilots is drawn from the successive announcements published by the National Development and Reform Commission and the Ministry of Commerce; Appendix A Table A1 lists the approved pilot cities and timings. All other relevant data are sourced primarily from the China City Statistical Yearbook, the China Regional Statistical Yearbook, and the statistical yearbooks and statistical bulletins of individual prefecture-level cities.
In terms of sample processing, considering the implementation year of the National E-Commerce Demonstration City Policy and data availability, this paper adopts the panel data of prefecture-level cities in China from 2009 to 2023. Samples with substantial missing data are excluded, and the few missing values in each indicator are filled using the linear interpolation method. And all regression analyses are performed using Stata 17.0.

4. Benchmark Regression and Robustness Test

4.1. Benchmark Regression Analysis

Table 2 reports the estimated effects of the National E-Commerce Demonstration City Policy on household consumption. Column (1) includes only the core explanatory variable, without control variables or fixed effects. Columns (2) to (5) report results from specifications that sequentially add control variables, year fixed effects, city fixed effects, and two-way fixed effects. Column (6) applies cluster-robust standard errors at the city level to correct for potential within-group correlation.
The results show that the coefficient estimates for the National E-Commerce Demonstration City Policy retain a consistent sign and are significant at the 1% level in every case. The results in Column (6) indicate that the regression coefficient on the policy dummy is 0.0663, implying that, following the implementation of the policy, household consumption levels in demonstration cities were approximately 6.6 percent higher than those in the control group. It can be inferred that the construction of national e-commerce demonstration cities may boost total local resident consumption, improve household consumption, and optimize the efficiency of commodity circulation. These effects could occur through channels like enriching consumption scenarios and reducing transaction costs, which may carry considerable practical value. Thus, the results validate H1 proposed in this study.

4.2. Robustness Test

4.2.1. Pre-Trend Test

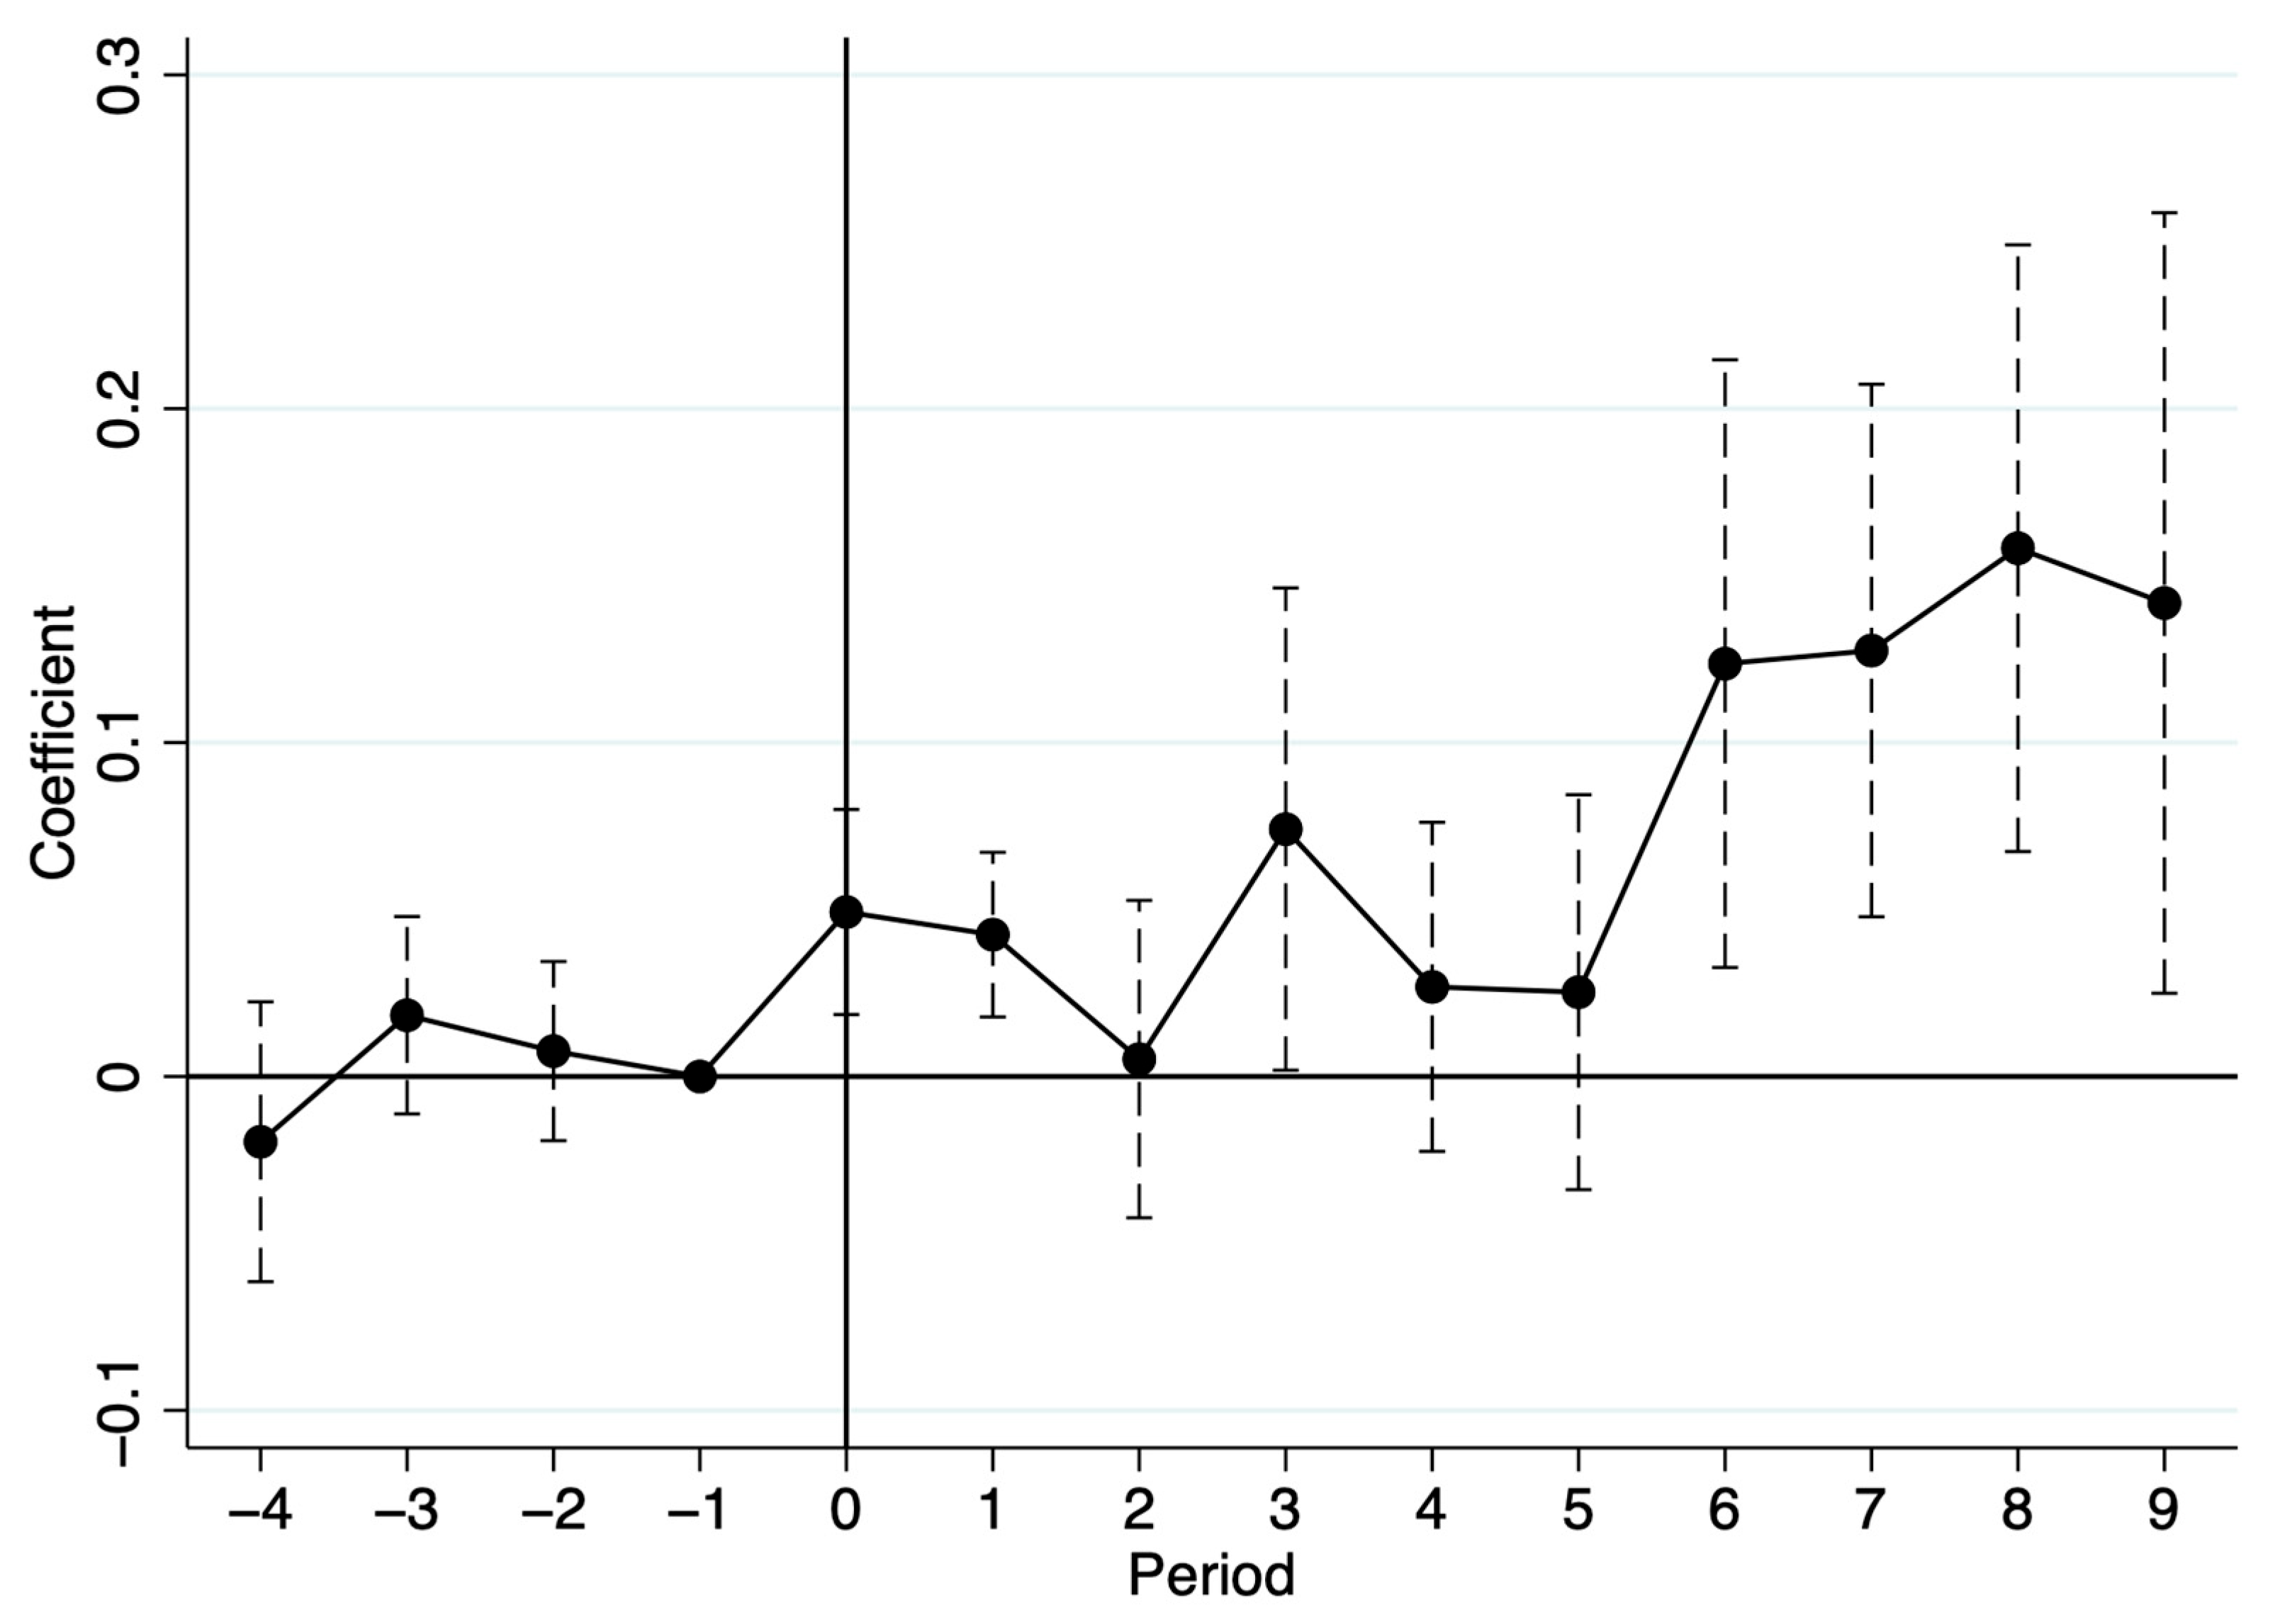
The validity of multi-period DID estimates hinges on whether the parallel trends assumption holds. This assumption requires that, prior to the policy shock, the treatment and control groups exhibit broadly similar trends in household consumption, with no statistically significant divergence between them. Following Beck et al. (2010) [48], this paper specifies the following regression model:
C o n i j = α + k , k 9 β k D I D i j k + γ Z i j + μ i + ϕ j + ε i j
DID is a dummy indicating the post-policy status of the demonstration cities. Let us denote τ i as the actual year in which city i was approved as a National E-Commerce Demonstration City and define k = j − τ i . When k = −4, −3, −2, …, 0, …, 7, 8, 9, DID takes a value of 1 and 0 otherwise. The year before the policy is implemented is used as the baseline period. The estimated coefficients β k show the policy’s effect on household consumption in each year relative to that baseline.
As shown in Figure 1, the coefficients for all pre-policy periods are close to zero and statistically insignificant, suggesting that there is no meaningful divergence in consumption trends between the treatment and control groups prior to policy intervention. The parallel trends assumption is therefore satisfied.
The early post-policy coefficients are positive but insignificant, implying a lagged consumption response. Over time, the estimated policy coefficients increase substantially and consistently pass significance tests, suggesting that the policy effect strengthens after the initial lag. Overall, these results provide a solid basis for the causal identification in the subsequent analysis.

4.2.2. Placebo Test

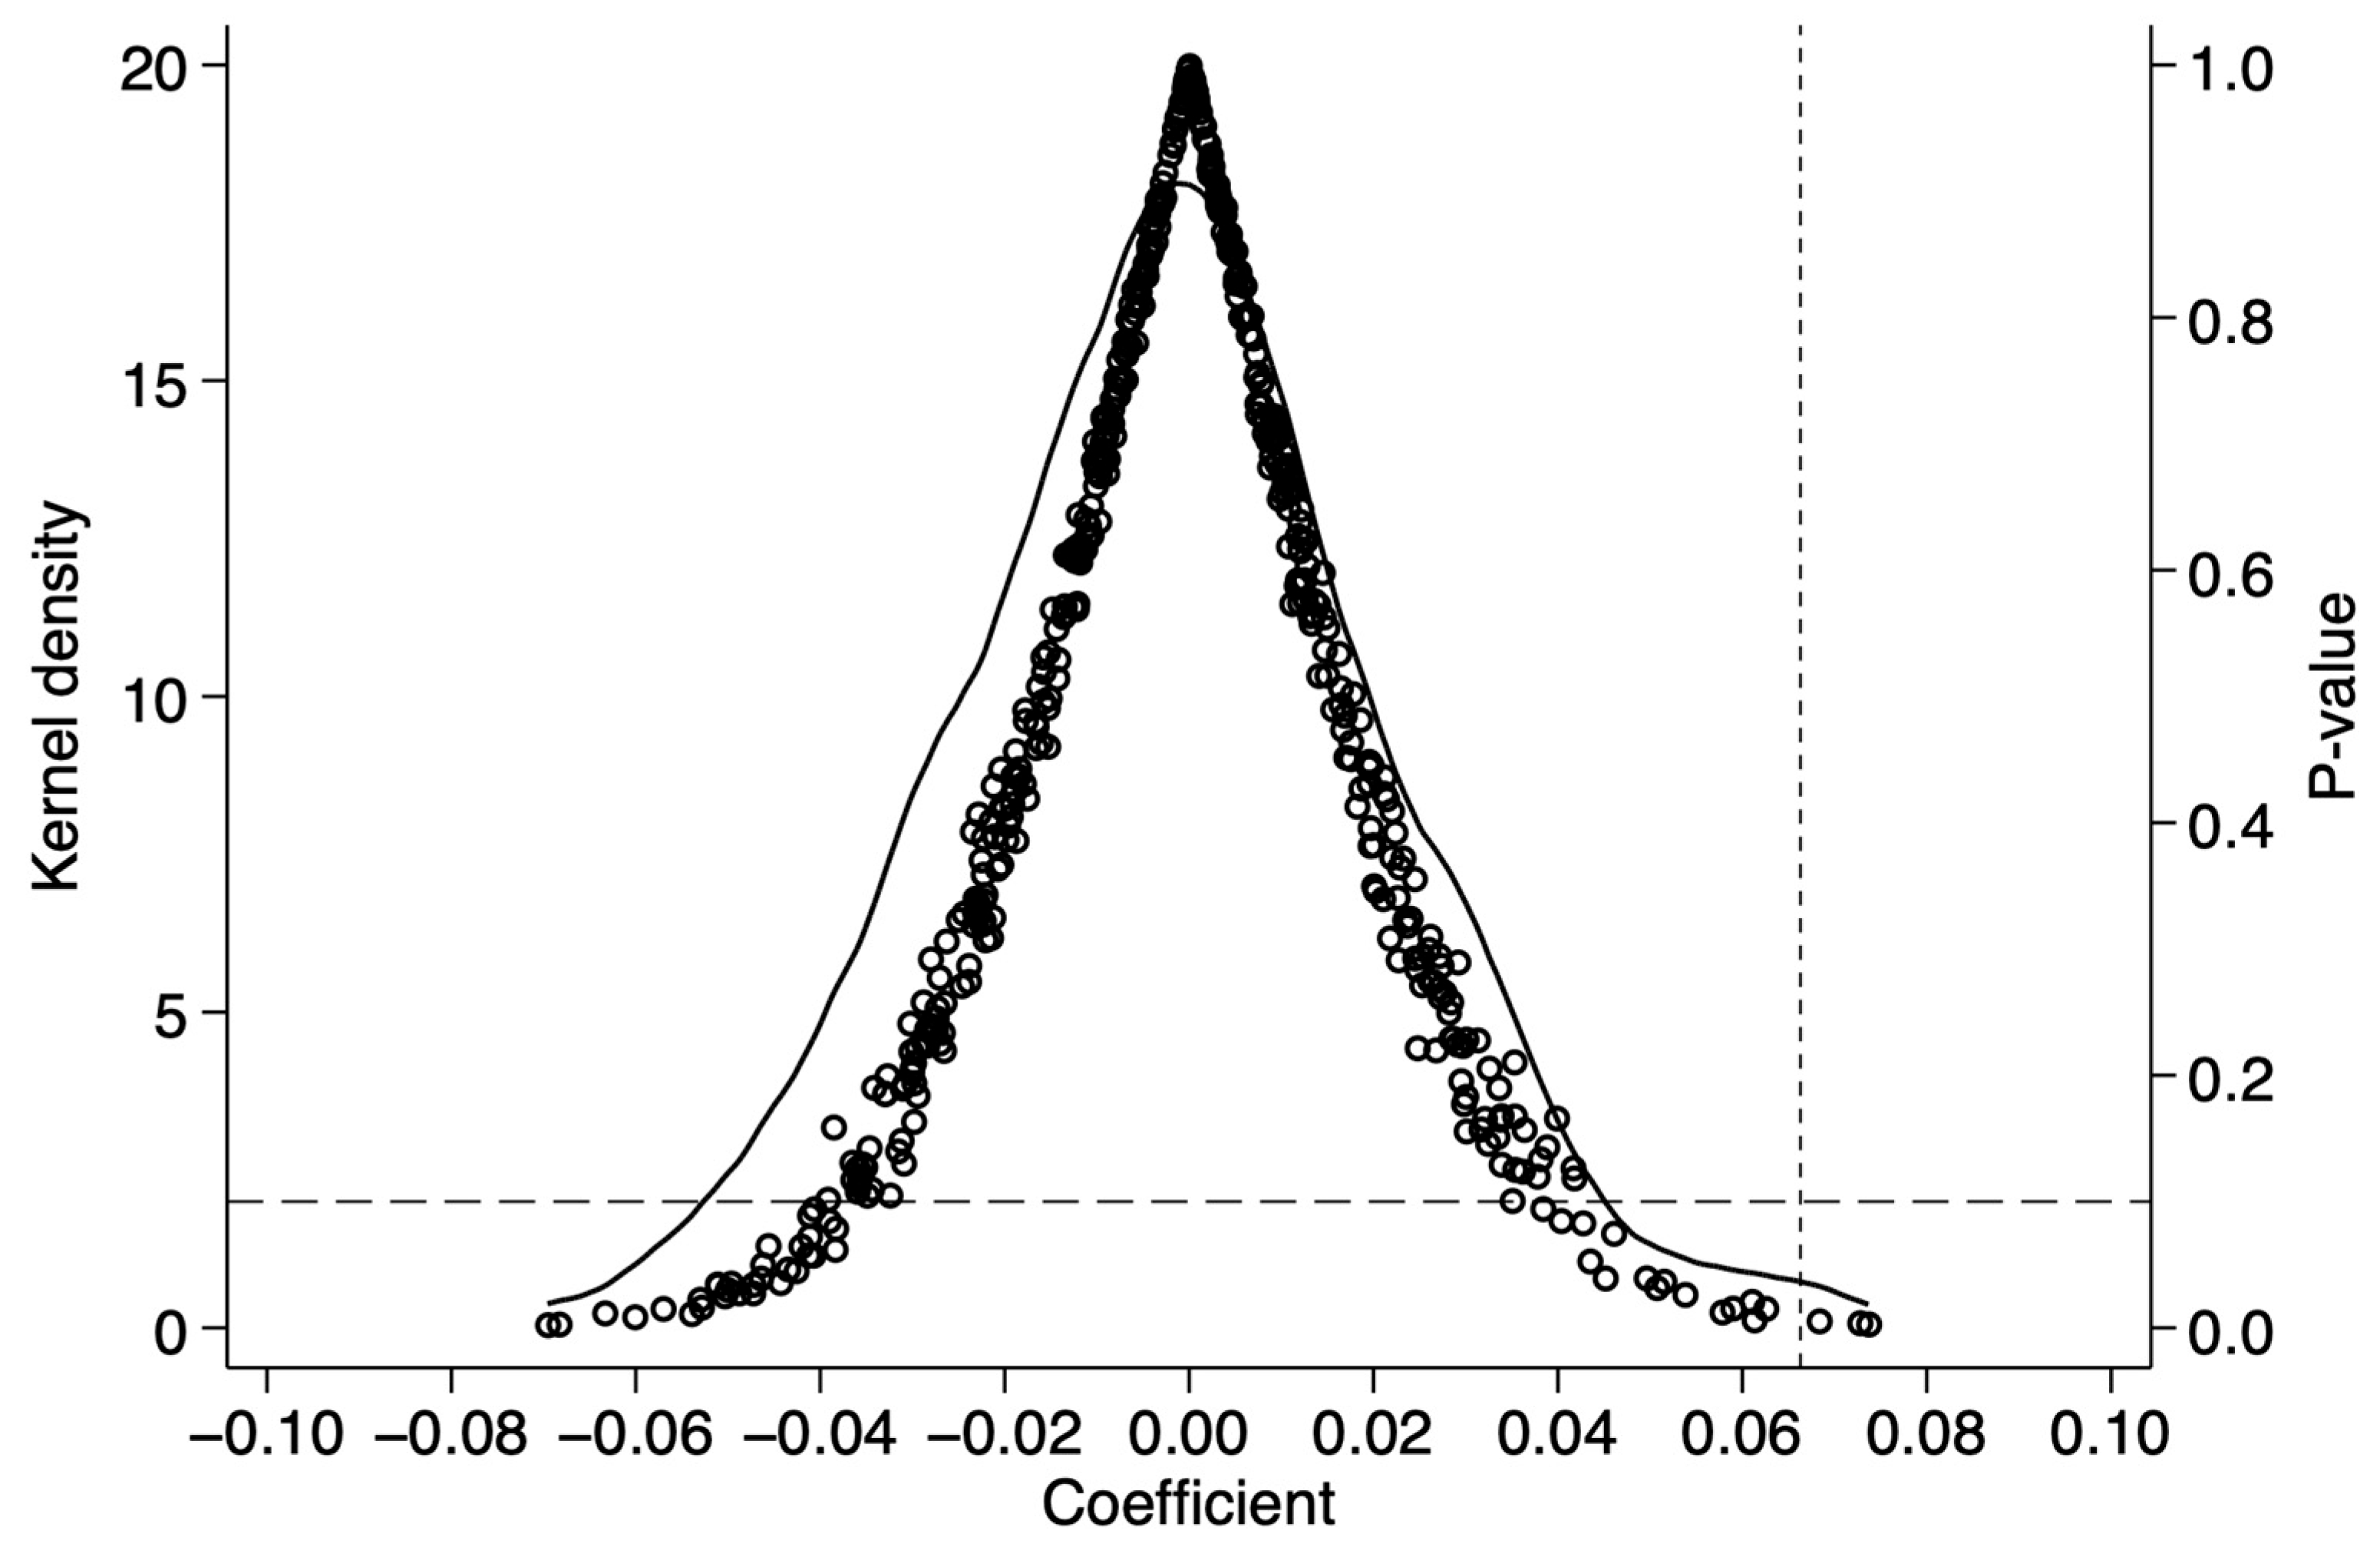
As a further check, this paper addresses potential confounding from omitted variables and random noise by conducting a permutation placebo test on the baseline estimates. Specifically, this paper randomly draws the same number of cities as in the actual treatment group to serve as a pseudo-treatment group, and repeats this process 500 times to construct fictitious policy variables. Since the assignment of pseudo-treatment cities is random, if the baseline results truly reflect the policy effect, the placebo coefficients should exhibit no clear pattern and should center around zero.
Figure 2 presents the distribution of the estimated coefficients from the placebo test. As Figure 2 shows, the placebo coefficients from the 500 random draws cluster around zero, and the kernel density is roughly symmetric with a peaked center. Furthermore, most placebo p-values are above 0.1, suggesting that the randomly assigned policy does not significantly affect household consumption. In addition, the true policy coefficient lies well outside the distribution of the placebo coefficients and is larger than almost all of them. This corroborates that the true policy effect cannot be attributed to chance or the influence of omitted variables. Overall, the placebo results confirm the robustness of our baseline findings: the policy’s positive effect on consumption is attributable to the policy itself.

4.2.3. Excluding Concurrent Policy Effects

Given that policies implemented during the same period as the National E-Commerce Demonstration City Policy may also influence household consumption and thereby introduce noise into the baseline regression results, this paper controls for two potential confounders, the Smart City Construction Policy and the Public Data Open Platform Policy. On the one hand, the Smart City Construction Policy and the E-Commerce Demonstration City Policy both focus on urban digital transformation. They overlap in their efforts to improve online consumption scenarios and raise residents’ digital living standards. The Smart City pilot promotes network infrastructure and mobile payment, which directly lower transaction costs for online consumption—a channel like that of the E-Commerce Demonstration City Policy. On the other hand, the Public Data Open Platform Policy promotes the open sharing of government data resources with society. This improves market information transparency and reduces information asymmetry in product markets, which lowers consumer search costs and decision-making uncertainty. This transmission mechanism closely parallels that of the E-Commerce Demonstration City Policy. Furthermore, the approval and implementation timelines of both policies overlap with those of the National E-Commerce Demonstration City Policy, and their covered cities partially coincide with the demonstration city sample. This paper therefore conducts separate regression estimates excluding the effects of the Smart City pilot and the Public Data Open Platform Policy to test the robustness of the baseline findings.
Columns (1) and (2) of Table 3 report the results of these robustness checks. As shown in the table, after excluding the influence of the Smart City Policy and the Public Data Open Platform Policy, the core explanatory variable remains positive and significant at the 5% level. By excluding these confounding effects, it is found that the pilot city policy increases consumption by an average of 6%. The two coefficients are both slightly smaller than the baseline estimate, suggesting that the concurrent policies do have some independent positive effect on residents’ consumption. Nevertheless, after controlling for these confounders, the policy’s positive effect on residents’ consumption remains strong and statistically significant. This confirms that the baseline results are not driven by other contemporaneous policies.

4.2.4. Controlling for City-Specific Characteristics

Beijing, Tianjin, Shanghai, and Chongqing, as municipalities directly under the central government, differ significantly from ordinary prefecture-level cities in administrative rank, economic size, infrastructure, and policy support. These differences may cause systematic deviations in both household consumption levels and policy response mechanisms. Retaining them in the sample could therefore introduce noise into the regression estimates. To address this, this paper re-estimates the model after excluding the four municipalities to see whether the baseline results hold after accounting for city-specific heterogeneity.
As Column (3) of Table 3 reveals, once the four directly administered municipalities are removed from the sample, the regression coefficient on the core explanatory variable retains its positive sign and clears the 1% significance threshold. These results indicate that the baseline effect is not an artefact of the distinctive status of the four municipalities. The policy’s positive effect on consumption persists after its exclusion, lending further confirmation to the robustness of the finding.

4.2.5. Excluding the External Negative Shock of the Public Health Emergency

The COVID-19 pandemic from 2020 to 2022 caused major disruptions, as mobility restrictions reduced consumption opportunities, while e-commerce platforms and logistics networks were affected unevenly. These disturbances risk introducing bias into the identification of policy effects. To eliminate this exogenous interference, this paper excludes the sample data for 2020 to 2022 and re-estimates the model; the results are reported in Column (4) of Table 3. The regression coefficient on the core explanatory variable is significantly positive. This shows that, after excluding the pandemic effect, the National E-Commerce Demonstration City Policy still raises residents’ consumption by about 3.77%. This result aligns with the baseline regression in sign and supports the robustness of our findings.

5. Further Analysis

5.1. Mechanism Analysis

5.1.1. Entrepreneurial Vitality

National E-Commerce Demonstration City initiatives may raise residents’ consumption by stimulating urban entrepreneurial vitality, which serves as a plausible transmission mechanism. This unlocks policy dividends and leverages the agglomeration effects of the platform economy. In turn, this helps lower market entry barriers and entrepreneurial transaction costs. This attracts numerous market entities into e-commerce-related sectors and fosters the rapid development of emerging business models, such as livestream commerce, on-demand retail, and community group buying [49]. On the one hand, the rise in entrepreneurial vitality increases employment and increases residents’ labor income, thereby strengthens residents’ actual purchasing power from the income side [50]. On the other hand, more entrepreneurial entities intensify market competition to some degree. This may drive the supply of goods and services toward greater diversification and personalization. This tends to broaden consumption in both breadth and depth, upgrades the consumption structure from the supply side, and ultimately leads to an overall rise in residents’ consumption levels.
As shown in Column (1) of Table 4, the results reveal the effect of the National E-Commerce Demonstration City construction on urban entrepreneurial vitality. The coefficient on the key explanatory variable is positive and statistically significant at the 5% level. This implies that designation as a National E-Commerce Demonstration City is associated with an average 9.19% increase in local entrepreneurial vitality relative to other cities. The resulting industrial agglomeration and institutional optimization may help improve the regional entrepreneurial environment. This could also sustain higher levels of entrepreneurial activity.

5.1.2. Smart Logistics Level

The National E-Commerce Demonstration City Policy may indirectly affect residents’ consumption by advancing the development of smart logistics. The demonstration city initiative promotes deep e-commerce–logistics integration, which essentially means digitally reshaping traditional supply chains using data as a key driver. Smart logistics, employing IoT and big data, helps reduce information asymmetry in logistics systems. As a result, delivery performance and energy efficiency improve.
Column (2) of Table 4 reports the estimated effect of the National E-Commerce Demonstration City Policy on smart logistics. The coefficient of the explanatory variable is significantly positive, as this paper expected from the earlier theoretical discussion. This preliminary result suggests that the pilot policy promotes smart logistics development in demonstration cities. Such a potential channel may facilitate residents’ consumption growth.
Logistics infrastructure is a vital part of the consumption environment and serves as a central bridge between production and consumption. Robust transport and logistics infrastructure may improve goods accessibility and lower distribution costs, which could potentially stimulate residents’ consumption [51]. At the same time, reducing energy losses in goods transport helps balance consumption growth with carbon reduction in the distribution sector. More advanced smart logistics reduces time and cost pressures in goods distribution. Improved logistics accessibility shortens delivery times and lowers the costs consumers face when receiving goods, which enhances the overall convenience of consumption. Existing research indicates that time constraints shape residents’ consumption behavior and that relaxing such constraints can substantially broaden the range of residents’ spending [52,53]. The National E-Commerce Demonstration City initiative may optimize logistics networks and shorten delivery lead times, thereby reducing residents’ time costs. These changes could expand the overall consumption scale and facilitate the upgrading of the consumption structure. In summary, smart logistics development may act as a transmission channel through which the policy influences residents’ consumption.

5.1.3. Digital Infrastructure Level

Column (3) reports the estimates when the mediating variable is digital infrastructure. The policy is associated with an average increase of 0.4% in the digital infrastructure level of pilot cities relative to the control group. Therefore, digital infrastructure appears to be a plausible channel through which the policy may affect residents’ consumption.
One potential channel is that improved digital infrastructure lowers information frictions and search costs, which in turn may shape household spending decisions. Digital infrastructure may help reduce information asymmetries across the supply chain by expanding network coverage and data processing capacity, which in turn could improve the efficiency of market information generation, transmission, and matching. Specifically, improved digital infrastructure may raise broadband speeds and expand information access while also reducing internet access fees. These changes could mitigate information asymmetries and lower transaction, time, and search costs for residents [54], potentially enhancing shopping convenience and encouraging resident spending. Another potential channel operates through the supply side; improvements in digital infrastructure may further enhance the efficiency with which supply meets demand, potentially by reducing mismatches in product variety, timing, and location. By facilitating low-cost communication among diverse groups, improved digital infrastructure may enable consumers to find suitable products more efficiently. This reduction in search frictions could, in turn, mitigate information asymmetry and potentially boost spending willingness. Better digital infrastructure not only improves existing e-commerce services but also enables new forms of consumption, including livestream shopping, on-demand delivery, and cross-border purchases. More consumption channels may create new demand and improve the quality of household spending. In sum, these findings suggest that digital infrastructure improvements may expand both the accessibility and variety of consumption goods while also unlocking demand-side potential. The evidence is thus consistent with digital infrastructure serving as one plausible conduit through which the demonstration city policy could affect household consumption growth.

5.2. Heterogeneity Analysis

5.2.1. City Size Heterogeneity

The selection of e-commerce demonstration cities involves considerable urban heterogeneity, and population size is a primary determinant of economic agglomeration, while city scale shapes the efficiency of commercial circulation, the supply capacity of infrastructure, and the potential for fostering sustainable consumption. Following the State Council’s 2014 city size classification, this paper groups the sample cities into five tiers: small cities (population below 500,000), medium-sized cities (500,000 to 1,000,000), large cities (1,000,000 to 5,000,000), mega-cities (5,000,000 to 10,000,000), and super-mega-cities (above 10,000,000). This classification is used to examine whether the policy effect varies with city size. Since neither the small city nor the medium-sized city subsamples contain any e-commerce demonstration cities, the grouped regressions are ultimately only conducted for large cities, mega-cities, and super-mega-cities [55]. Table 5 reports the results.
The results reveal a degree of differentiation in the policy’s effect on household consumption across city size tiers. The coefficients vary by city size. For super-mega cities, the estimate in Column (1) is negative; for mega-cities, the coefficient in Column (2) is positive but not significant; and for large cities, the estimate in Column (3) is 0.1313 and significant at the 1% level. This indicates that the e-commerce demonstration city policy increases residents’ consumption in large cities by around 13.13%, reflecting a substantial positive economic impact. Overall, the consumption-promoting effect of the policy is most pronounced among large cities.
One possible explanation is that super-mega-cities adopted e-commerce early, they have reached a high degree of market saturation, and their infrastructure is already quite advanced. This limits the policy’s marginal gains in sustainable development and leaves little room for additional consumption stimulus, although the small sample size for this group may also reduce statistical power. For mega-cities with well-established e-commerce infrastructure, the policy’s empowering effect appears partially diluted by the relatively mature market environment. As a result, the consumption gain from the policy shock is modest, which could be why the coefficient is not statistically significant. By contrast, large cities have a weaker e-commerce foundation. Their consumer markets are still growing, but their infrastructure lags, and consumption upgrading potential remains large. Large cities may be more responsive to the e-commerce pilot policies than super-mega-cities and mega-cities with mature markets, and they may also have a stronger ability to absorb policy dividends. The demonstration city policy could unlock potential consumer demand through multiple channels, such as addressing infrastructure gaps and promoting new online consumption models. Compared with other city types, these cities have the greatest potential to absorb policy dividends, and this may produce a strong consumption-boosting effect.

5.2.2. City Location Heterogeneity

To further probe the regional heterogeneity in the consumption effects of the National E-Commerce Demonstration City Policy, this section divides the sample cities into eastern and central–western sub-groups. As shown in Column (4), the policy increases residents’ consumption in eastern cities by roughly 6.32%, while Column (5) reveals a 7.1% consumption growth effect in central and western cities.
These results suggest that the consumption-promoting effect of the National E-Commerce Demonstration City Policy is comparatively more pronounced in the central and western regions than in the east. In eastern cities, the e-commerce industry developed earlier, and marketization levels are high. Over time, they have built a solid digital infrastructure system. Their e-commerce markets are mature, and residents have developed well-established online shopping habits. The e-commerce consumer market in eastern cities appears nearly saturated at this stage. This may weaken the incremental effect of the pilot policy, making it harder to achieve substantial consumption growth. This could explain why the policy’s consumption-boosting effect in eastern cities is almost modest. Central and western cities have long faced high logistics costs and underdeveloped digital infrastructure. This suggests that these regions may hold substantial potential for consumption upgrading. After the National E-Commerce Demonstration City Policy was introduced, targeted resources and measures were deployed to address regional development bottlenecks. These efforts appear to have alleviated some key constraints in central and western cities. Compared with the east, central and western regions have lower market factor mobility and greater industrial support deficits. The demonstration city’s policy packages, including tax breaks, industrial initiatives, and resource pooling, likely generate a more pronounced incentive effect there. This could help attract e-commerce operators and expand residents’ consumption channels. In turn, it may generate a more pronounced consumption-promoting effect.

5.2.3. Industrial Heritage Heterogeneity

To examine heterogeneity by industrial heritage, we follow the 2013–2022 plan’s official list to divide cities into old industrial bases and others. We then estimate each sub-sample separately and report the results in Table 6.
Column (1) reports the outcomes for old industrial base cities, while Column (2) does so for non-old industrial cities. Both coefficients carry a positive sign, pointing to a positive effect on residents’ consumption in each group. However, only the coefficient for non-old industrial base cities is significant at the 5% level. This indicates that the policy significantly increases residents’ consumption in non-old industrial base cities by approximately 6.84%.
This divergence is rooted in the accumulated constraints that old industrial base cities face with respect to industrial structure, household income levels, and the maturity of their digital consumption ecosystems. Historically, old industrial base cities developed pronounced path dependencies around heavy and chemical industries during the planned economy era. Factor resources remained persistently concentrated in the production sector, leaving the service industry underdeveloped and consumer markets relatively shallow. This production-heavy, consumption-light economic pattern has to some extent constrained the consumption space that e-commerce policies can activate. Moreover, the heavy industry base raises the baseline of local circulation carbon emissions, which makes it harder to popularize consumption patterns. Regarding the income side, the structural decline in dominant industries and legacies from state-owned enterprise reform have jointly constrained the growth of residents’ disposable income. This makes it difficult to ease consumption capacity bottlenecks in the short term, and, therefore, the policy’s capacity to expand aggregate consumption faces considerable demand-side constraints. Old industrial base cities also lag in internet infrastructure and express logistics networks. This raises the effective threshold for e-commerce consumption and reduces the efficiency of policy translation into actual consumption behavior. In addition, an insufficient supply of sustainable circulation facilities further restrains the demand for low-carbon consumption. In contrast, non-old industrial base cities are generally characterized by greater industrial diversification, a higher household income, and a more robust digital consumption infrastructure. This makes them structurally better suited to e-commerce demonstration policies, and diversified service formats also help foster consumption scenarios, allowing these cities to achieve both consumption expansion and sustainable development, and to more fully capture the policy dividends. These results indicate that the policy’s consumption-promoting effect is more pronounced in non-old industrial base cities. This finding provides empirical grounds for tailoring e-commerce policies to local conditions and strengthening consumption-oriented support for old industrial base cities.

5.2.4. Urbanization Level Heterogeneity

To examine whether the policy effects of the e-commerce demonstration city program vary with the level of urbanization, this paper follows the method of Qian Haizhang et al. (2020) by using the median urbanization rate across sample cities during the sample period as a threshold to divide the sample into a low-urbanization group and a high-urbanization group, and it conducts separate regression estimates for each [56]. The results are reported in Columns (3) and (4) of Table 6.
The regression results show that the DID coefficient is positive for both the high-urbanization group and the low-urbanization group, and the estimate for the latter is not statistically significant. This suggests that the policy has promoted consumption in both settings, with a stronger effect in cities with higher urbanization rates.
High-urbanization cities tend to have better digital infrastructure and higher internet penetration than less urbanized cities. These conditions may provide a stronger technical base for online consumption formats. Meanwhile, such cities tend to have a high population density, vibrant consumer markets, and relatively mature supporting systems. These factors together form a sound e-commerce consumption ecosystem. Therefore, the National E-Commerce Demonstration City Policy may better align with market demand. It could also further unlock residents’ potential for online consumption. In contrast, low-urbanization cities tend to have insufficient population agglomeration and a limited market size. These factors may reduce the transmission efficiency and implementation effect of the e-commerce policy. Resource inputs under the demonstration city policy may not translate quickly into consumption growth. As a result, the policy’s consumption-boosting effect could be relatively slow to materialize. Finally, the insignificant policy effect observed in low-urbanization cities should not be interpreted as evidence of policy ineffectiveness. Instead, it may reflect the limited supporting conditions currently available in these cities. These cities may not yet have fully realized their digital consumption potential, suggesting that the policy effect could be constrained by existing development conditions. Future research may further examine whether improvements in urbanization and infrastructure strengthen the policy effect over time.

6. Research Conclusions and Policy Implications

6.1. Research Conclusions

This paper employs a multi-period difference-in-differences model, based on panel data from Chinese prefecture-level cities (2009–2023), to evaluate the consumption impact of the National E-Commerce Demonstration City Policy, treating its implementation as a quasi-natural experiment. This paper also examines its transmission mechanisms and heterogeneous characteristics. The main findings are as follows:
First, the policy promotes residents’ consumption. After designation, residents’ consumption levels rose noticeably in demonstration cities compared with the control group. In addition to expanding household consumption, this policy may indirectly steer consumption toward more sustainable online options. These findings hold across a range of robustness checks, confirming their reliability.
Second, the policy influences household consumption through three principal channels: stimulating urban entrepreneurial vitality, upgrading smart logistics capabilities, and improving digital infrastructure. Demonstration city policies lower entry barriers and concentrate platform resources. This stimulates local entrepreneurship and enriches the supply of sustainable goods, which in turn drives household consumption. Smart logistics models reduce distribution costs, shorten delivery times, and cut waste. This eases the constraint that inefficient logistics imposes on consumer spending, thereby boosting consumption and supporting sustainability. Accelerating development of regional digital infrastructure gives residents more channels for online consumption. It also provides technological support for new consumption formats and, in multiple ways, helps drive household consumption growth.
Third, the policy effects exhibit pronounced differentiation. By city size, the policy’s consumption-boosting effect is strongest in large cities, moderate in mega-cities, and relatively weak in super-mega-cities, where market saturation is high. In terms of geographic location, the policy effect is somewhat stronger in central and western cities than in eastern cities, primarily because the policy has greater incremental room to operate in regions where e-commerce development is comparatively lagging. Regarding industrial heritage, the policy effect is statistically significant in non-old industrial base cities, while the effect in old industrial base cities, though consistent in direction, does not pass significance tests. In terms of urbanization level, the policy effect is markedly stronger in high-urbanization cities than in low-urbanization cities, corroborating the positive role that urbanization plays in facilitating the transmission of e-commerce policies.

6.2. Policy Implications

First, the construction of National E-Commerce Demonstration Cities should continue to be deepened. This paper suggests that the National E-commerce Demonstration City Policy promotes residents’ consumption growth and facilitates high-quality consumption expansion. This will help expand and upgrade residents’ consumption and steer it toward more sustainable patterns. The National E-Commerce Demonstration City Policy has demonstrated a clear capacity to increase consumption. Building on this progress, the government could update the selection criteria and refine the supporting policy framework in due course. It should also strengthen the demonstration role of these cities and sustain the policy’s positive impact on residents’ consumption.
Second, demonstration cities should be arranged according to local conditions, with special attention to unlocking consumption potential in the central–western regions and in large cities. The findings of this study show that the e-commerce demonstration policy has a stronger effect on consumption in central–western cities and large cities, which implies that these areas still have considerable room for further policy-driven e-commerce gains. To this end, targeted policy support can be strengthened for e-commerce demonstration cities in central and western regions, including more robust fiscal and tax incentives and greater support for the introduction of platform resources. Large cities should be recognized as the key drivers of e-commerce consumption growth. They can use the demonstration city platform to foster premium consumption formats and integrate online and offline commerce. This will help continuously stimulate residents’ demand for higher-quality and more diverse goods while also advancing both consumption upgrading and sustainable transformation in a coordinated way.
Third, it should strengthen complementary support for old industrial base cities to help remove the structural bottlenecks that hinder the transmission of e-commerce policies. Our findings suggest that the policy’s ability to stimulate residents’ consumption in old industrial base cities is somewhat weakened by constraints related to industrial structure, residents’ income, and the digital consumption ecosystem. The government should further increase support for old industrial base cities in expanding express logistics networks and broadband infrastructure while simultaneously arranging the layout of sustainable circulation facilities. These measures will help lower the threshold for e-commerce consumption, improve the conditions for policy transmission, and enable the policy to translate more effectively into residents’ consumption growth.
Fourth, the digital infrastructure gap in low-urbanization areas should be narrowed more quickly to unlock the e-commerce consumption potential of rural residents. The heterogeneity analysis in this paper indicates that the consumption-stimulating effect of the policy has not been fully realized in low-urbanization cities due to constraints in infrastructure and digital capacity. To address this, the coverage of 5G networks and smart logistics systems should be extended to low-urbanization areas more rapidly, clearing the “last-mile” bottleneck in rural e-commerce consumption. E-commerce platforms should be encouraged to leverage the brand recognition of demonstration cities as they expand into rural markets. This would help build a two-way circulation system that enables agricultural products to move upward and industrial goods to flow downward while also supporting the development of local sustainable business formats. At the same time, digital consumption skills training for rural residents should be strengthened to improve their ability and willingness to engage in online shopping. It is also important to promote low-carbon, economical, and circular consumption concepts to build sustainable consumption habits among rural residents. These efforts can help translate latent demand into tangible policy gains, narrow the urban–rural consumption gap, and promote more balanced regional consumption development.

6.3. Research Limitations and Future Research Prospects

This study still has several limitations that warrant further investigation in future research.
First, there are certain limitations regarding the measurement of the core dependent variable. Given the lack of standardized, officially released long-term green consumption indicators at the prefecture city level across China, this paper adopts the total retail sales of consumer goods as a proxy for resident consumption. This indicator cannot accurately measure the policy’s impact on sustainable consumption, and, therefore, this study discusses its potential implications for sustainable consumption only from a macro-perspective. Future research may adopt more direct and disaggregated indicators of sustainable consumption to better identify the policy’s impact on residents’ sustainable consumption behavior.
Second, although this study employs a multi-period DID model and conducts a series of robustness tests, it cannot completely eliminate the possibility of omitted variable bias or other sources of endogeneity. Future studies may employ instrumental variable or synthetic control methods to address these concerns and obtain a cleaner estimate of the net policy effect.
Third, due to limited data availability, the digital infrastructure indicator system that this paper constructs may be incomplete and subject to measurement error. Future studies may incorporate more disaggregated micro-data and richer digital infrastructure indicators to improve measurement accuracy.
Fourth, the findings of this study are derived from the institutional context of China’s National E-Commerce Demonstration City Policy. Although the underlying mechanisms may provide useful insights for other emerging economies, the external validity of the conclusions should be interpreted with caution. Future comparative studies across countries or regions could further examine whether similar policy effects exist under different institutional settings.


Author Contributions

Conceptualization, T.T. and C.T.; methodology, H.Z.; software, T.T.; validation, T.T.; formal analysis, T.T. and C.T.; investigation, T.T.; resources, C.T. and H.Z.; data curation, T.T.; writing—original draft preparation, T.T.; writing—review and editing, C.T. and H.Z.; visualization, T.T.; supervision, C.T.; project administration, H.Z.; funding acquisition, H.Z. and T.T. All authors have read and agreed to the published version of the manuscript.

Funding

This research received no external funding.

Institutional Review Board Statement

Not applicable.

Informed Consent Statement

Not applicable.

Data Availability Statement

The original data presented in the study are openly available in China City Statistical Yearbook at https://www.cnki.net (https://data.cnki.net/yearBook/single?id=N2026030270&pinyinCode=YZGCA, accessed on 6 July 2026); in China Statistical Yearbook for Regional Economy at https://data.cnki.net/yearBook/single?id=N2015070200&pinyinCode=YZXDR, accessed on 6 July 2026; in provincial and municipal statistical yearbooks prefecture-level city statistical bulletins at https://www.stats.gov.cn; in China Research Data Service Platform at https://www.cnrds.com/; in National Development and Reform Commission Official Bulletin Website at https://www.ndrc.gov.cn.

Conflicts of Interest

The authors declare no conflicts of interest.

Appendix A

Table A1. National E-Commerce Demonstration Cities and timings. Data source: official announcements by the National Development and Reform Commission (NDRC) (official website: https://www.ndrc.gov.cn).
Pilot BatchApproval YearCity
1st Batch (1 city)2009Shenzhen
1st Batch (22 cities)2011Beijing, Tianjin, Shanghai, Chongqing, Qingdao, Ningbo, Xiamen, Harbin, Wuhan, Guangzhou, Chengdu, Nanjing, Changchun, Hangzhou, Fuzhou, Zhengzhou, Kunming, Yinchuan, Nanning, Jilin, Suzhou, Shantou
2nd Batch (30 cities)2014Dongguan, Yiwu, Quanzhou, Putian, Xuzhou, Changsha, Zhuzhou, Wenzhou, Guiyang, Yichang, Ganzhou, Changzhou, Jinan, Taizhou, Weifang, Hohhot, Xi’an, Jieyang, Yantai, Wuhu, Wuxi, Shijiazhuang, Nanchang, Shenyang, Luoyang, Lanzhou, Hefei, Guilin, Xiangyang, Taiyuan
3rd Batch (17 cities)2017Dalian, Baotou, Haikou, Xining, Urumqi, Handan, Huludao, Daqing, Jining, Chenzhou, Mianyang, Tongren, Yuxi, Baoji, Longnan, Wuzhong, Wujiaqu
The 1st batch was approved in two rounds: 1 city in 2009 and 22 cities in 2011.

References

  1. Wu, X.Y.; Wang, M.; Li, L.X. Did High Housing Price Discourage Enterpreneurship in China? Econ. Res. J. 2014, 49, 121–134. [Google Scholar]
  2. Tang, Y.H.; Li, J.L.; Yang, Q.J. E-commerce and Cross-regional Transactions: From the Perspectiveof Transaction Cost Economics. Econ. Res. J. 2025, 60, 74–90. [Google Scholar]
  3. Gao, C.C.; Zou, Y. Has E-commerce Promoted Transformation of Industrial Structure? Enterp. Econ. 2021, 40, 132–142. [Google Scholar]
  4. Xie, W.D. Can the Development of Urban E-commerce Achieve Employment Stability? J. Financ. Econ. 2023, 49, 139–153. [Google Scholar]
  5. Li, Z.; Zhao, C.M.; Liu, S.S. E-commerce Transformation of Cities, Market Subject Vitality and Stable Employment. Econ. Surv. 2023, 40, 13–23. [Google Scholar]
  6. Liu, Y.B.; Neng, L.G.; Su, C.; Sun, Z. The digital effects of e-commerce policy: Mechanisms and dual spillovers. Ind. Econ. Res. 2024, 85–98. [Google Scholar] [CrossRef]
  7. Chen, K.X.; Zhang, S.S. Can E-commerce Platform Construction Drive Digital-reality Integration?—Experiential Evidence from National E-commerce Demonstration Cities. Contemp. Econ. Manag. 2024, 46, 35–46. [Google Scholar]
  8. Ding, M.Q.; Gao, Q.J. The Impact of E-Commerce Transformation of Cities on Green Total Factor Productivity. Sustainability 2023, 15, 16734. [Google Scholar] [CrossRef] [Scilit]
  9. Hu, J.R.; Yan, Y.C.; Xu, X.P. How Does E-Commerce Development Affect Urban Low-Carbon Transition: New Insights from China’s E-Commerce Demonstration Pilot Zones. Sustainability 2026, 18, 6098. [Google Scholar] [CrossRef] [Scilit]
  10. Jin, H.; Yu, L.H.; Wei, J.L. The Influence and Mechanism of the National E-commerce Demonstration City on Green Technological Innovation of Enterprises. Sci. Technol. Prog. Policy 2022, 39, 81–90. [Google Scholar]
  11. Caballero, R.J. Consumption puzzles and precautionary savings. J. Monet. Econ. 1990, 25, 113–136. [Google Scholar] [CrossRef] [Scilit]
  12. Yuan, R.C. Consumption Upgrading of Rural Residents: Characteristics and Determinants Based on Interprovincial Panel Data in Central China. J. Commer. Econ. 2019, 40–43. [Google Scholar]
  13. Huang, Y.N.; Zong, Q.Q. Habit Formation in Chinese Urban Household Consumption. Econ. Res. J. 2014, 49, 17–28. [Google Scholar]
  14. Li, J.; Wu, Y.; Xiao, J.J. The impact of digital finance on household consumption: Evidence from China. Econ. Model. 2020, 86, 317–326. [Google Scholar] [CrossRef] [Scilit]
  15. Chen, Z.; Li, X.J.; Zhang, J.Z.; Xia, X.L. Does digital finance alleviate household consumption inequality? Evidence from China. Financ. Res. Lett. 2024, 60, 104844. [Google Scholar] [CrossRef] [Scilit]
  16. Du, Y.F. The Mechanism and Optimization Path of Digital Inclusive Finance in Supporting Rural Revitalization: A Literature-Based Study. Financ. Theory Pract. 2025, 67–73. [Google Scholar]
  17. Li, Y.S.; Hu, X.P. Research on the Internal Mechanism and Spatial Effect of Digital Technology Enabling Chinese Consumption Modernization. Economist 2025, 65–75. [Google Scholar]
  18. Zhang, Y. The Impact of Digital Economic Development on Chinese Consumption Modernization. J. Tech. Econ. Manag. 2025, 39–45. [Google Scholar]
  19. Xie, K.; Qin, Z.L.; Zhang, R.J.; Gao, Y.L. Improved Transportation Infrastructure and Household Tourism Consumption: Empirical Evidence from Counties with High-speed Railway. J. Quant. Technol. Econ. 2023, 40, 90–110. [Google Scholar]
  20. Chen, Y.L.; Zhu, X.; Li, J.; Bai, Y.G. Do Shared Bicycles Promote Residents’ Consumption? China Econ. Q. 2024, 24, 1139–1155. [Google Scholar]
  21. Ding, R.Z. Empowering Consumption through the Debut Economy: Theoretical Framework and Mechanistic Analysis. Soc. Sci. Guangdong 2025, 5–16+284. [Google Scholar]
  22. Li, X. A Study on the Release of Consumption Potential Driven by First Launch Economy. Theor. Explor. 2025, 4, 103–110. [Google Scholar]
  23. Liu, T.T.; Wen, X.; Pan, M.Q. Digital Economy Improves Rural Households’ Consumption Ability: Theoretical Mechanism and Empirical Test. Econ. Probl. 2022, 95–101. [Google Scholar]
  24. Luo, J.P.; Liu, J. Analysis of the Impact of E-commerce on Rural Residents’ Consumption. Price Theor. Pract. 2018, 131–134. [Google Scholar] [CrossRef]
  25. Tang, X.P.; Yu, L.H.; Wang, Y.X.; Yao, X. Cross-border E-commerce and Household Welfare in China. J. Quant. Technol. Econ. 2023, 40, 137–157. [Google Scholar]
  26. Liu, G.R. Analysis on the Impact Mechanism of E-commerce on Rural Residents’ Consumption. China Bus. Mark. 2017, 31, 96–104. [Google Scholar]
  27. Han, S.C.; Wei, P.; Zhu, Q. How does Cross-Border E-Commerce Empower Household Consumption of Services? Consum. Econ. 2025, 41, 15–29. [Google Scholar]
  28. Fang, F.Q.; Xing, W. The U-shaped Relationship Between Household Consumption and E-commerce Market Scale. Financ. Trade Econ. 2015, 131–147. [Google Scholar] [CrossRef]
  29. Sun, T.H.; Wang, Y. Industrial Structure Optimization from the Perspective of Digital Economy—Empirical Analysis Based on the Supply-Demand Equilibrium Model. J. Stat. 2023, 4, 1–16. [Google Scholar] [CrossRef] [Scilit]
  30. Wang, Q.; Niu, G.; Zhao, G.C. E-Commerce Development and Rural Revitalization: Evidence from China. J. World Econ. 2021, 44, 55–75. [Google Scholar]
  31. Gao, J.C.; Liu, Y. Internet Usage and Urban-Rural Household Consumption—Evidence from CGSS Data. J. Stat. 2022, 3, 61–69. [Google Scholar]
  32. Liu, H. The Endogenous Drivers and Implementation Pathways of the “Three New Forms of Consumption”. J. Hohai Univ. (Philos. Soc. Sci.) 2026, 28, 129–138. [Google Scholar]
  33. Sun, P.Y.; Sun, J.J.; Jiang, X.Y. E-Commerce, Searching Cost and Consumer Price Change: Evidence from the Micro Retailing Market. Econ. Res. J. 2017, 52, 139–154. [Google Scholar]
  34. Song, Y.R. The Impact of Live-Streaming E-commerce on Household Consumption: Icing on the Cake” or “Timely Help”. Financ. Trade Econ. 2026, 47, 105–123. [Google Scholar]
  35. Goldfarb, A.; Tucker, C. Digital Economics. J. Econ. Lit. 2019, 57, 3–43. [Google Scholar] [CrossRef] [Scilit]
  36. Zhao, Y.; Tan, Z.B. E-commerce, Bank Loans and Financing of Small and Medium Enterprises (SMEs). Econ. Res. J. 2012, 47, 99–112. [Google Scholar]
  37. Yuan, Q.G.; Ji, Y.S.; Zhang, W.; Lei, T. Cross-Border E-Commerce and Urban Entrepreneurial Vitality—A Quasi-Natural Experiment Evidence from China. Sustainability 2024, 16, 1802. [Google Scholar] [CrossRef] [Scilit]
  38. Dong, X.B.; He, C.L. Can E-commerce Development Boost Urban Entrepreneurial Vitality?—Based on the Entrepreneurial Ecosystem Theory. J. Cap. Univ. Econ. Bus. 2025, 27, 67–84. [Google Scholar]
  39. Zhang, H.; Wu, S.L. Influence of Co-agglomeration of Logistics Industry and Manufacturing Industry on Resident Consumption Expansion: An Empirical Analysis Based on the Dubin Model of Dynamic Space. Consum. Econ. 2022, 38, 41–56. [Google Scholar]
  40. Ma, M. Rural Smart Logistics Construction Under the Rural Revitalization Strategy. Agric. Econ. 2022, 133–135. [Google Scholar]
  41. Dong, F. Development of Smart Logistics under the New Development Pattern: New Characteristics, Key Problems and Countermeasure Suggestions. Econ. Rev. J. 2021, 77–84. [Google Scholar]
  42. Jin, J.; Dong, J.W. Empowering Consumption Upgrading with the Digital Economy: Micro Mechanisms and Correlation Effects. J. Tech. Econ. Manag. 2024, 56–63. [Google Scholar]
  43. Yu, Z.P.; Chen, L. How Does New Digital Infrastructure Affect Residents’ Green Consumption. J. Tech. Econ. Manag. 2026, 59–66. [Google Scholar]
  44. Jiang, T. Mediating Effects and Moderating Effects in Causal Inference. China Ind. Econ. 2022, 100–120. [Google Scholar]
  45. Han, J.; Li, J.Y. Research on the Influence Mechanism of Digital Economic Development on Industrial Structure Upgrading. J. Stat. Inf. 2022, 37, 13–25. [Google Scholar]
  46. He, Y.K.; Niu, G.; Lu, J.; Zhao, G.C. Digital Governance and Urban Entrepreneurial Vitality: Evidence from the “National Pilot Policy of Information Benefiting the People” in China. J. Quant. Tech. Econ. 2024, 41, 47–66. [Google Scholar]
  47. Zhao, X. Research on the Technology Innovation Effect of New Digital Infrastructure. Stat. Res. 2022, 39, 80–92. [Google Scholar]
  48. Beck, T.; Levine, R.; Levkov, A. Big Bad Banks? The Winners and Losers from Bank Deregulation in the United States. J. Financ. 2010, 65, 1637–1667. [Google Scholar] [CrossRef] [Scilit]
  49. Dai, R.C.; Zhang, X.B. E-commerce expands the bandwidth of entrepreneurship. J. Law Econ. Organ. 2026, ewaf018. [Google Scholar] [CrossRef] [Scilit]
  50. Zhang, Q.; Yuan, Y.F. A study on the impact of household head’s employment modes on the living standards of rural migrant workers’ families. PLoS ONE 2024, 19, e0312518. [Google Scholar] [CrossRef] [Scilit] [PubMed]
  51. Long, S.B.; Li, J.Y.; Zuo, Y.L. The Construction and Measurement of Chinese Residents’ Consumption Environment Evaluation Index System. Reform 2023, 81–98. [Google Scholar]
  52. Jia, N.; Liao, P.X. Trading Time for Space: The Adaptability of Family Consumption Behavior to Overtime Work. Consum. Econ. 2025, 41, 1–18. [Google Scholar]
  53. Liu, M.X. Digital Economy’s Development and the Change of Consumer Welfare: Based on the Theory of Time Allocation. S. China J. Econ. 2023, 66–79+118. [Google Scholar]
  54. Wang, G.Q.; Peng, X.L. New Infrastructure, Spatiotemporal Cost and Balanced Development of Urban-Rural Commercial Circulation: Evidence of Mediating Effect. J. Commer. Econ. 2025, 44–47. [Google Scholar]
  55. Yu, B.B. The Economic Growth Effects of Industrial Restructuring and Productivity Improvement: A Dynamic Spatial Panel Analysis of Chinese Cities. China Ind. Econ. 2015, 83–98. [Google Scholar]
  56. Qian, H.Z.; Tao, Y.Q.; Cao, S.W.; Cao, Y.Y. Theoretical and Empirical Analysis on the Development of Digital Finance and Economic Growth in China. Quant. Econ. Technol. Econ. Res. 2020, 37, 26–46. [Google Scholar]
Figure 1. Results of the pre-trend test.
Sustainability 18 07477 g001
Figure 2. Results of the placebo test.
Sustainability 18 07477 g002
Table 1. Digital infrastructure measurement index system.
Sub-SystemIndicatorCalculation MethodDirection
Digital Infrastructure InputsOptical fiber densityLength of long-distance optical fiber lines/administrative area+
Per capita internet broadband access portsInternet broadband access ports/total population+
Relevant employed personnelShare of urban unit employees in information transmission, computer services, and software industries+
Digital Infrastructure OutputsTelecommunications revenueTotal telecommunications revenue/total population+
Mobile phone penetration rateNumber of mobile phone subscribers/total population+
Internet penetration rateNumber of internet broadband access subscribers/total population+
Table 2. Benchmark regression results.
(1)(2)(3)(4)(5)(6)
DID1.6014 ***
(0.0383)
0.0815 ***
(0.0166)
0.0752 ***
(0.0165)
0.1022 ***
(0.0144)
0.0663 ***
(0.0137)
0.0663 ***
(0.0249)
Control VariablesNOYESYESYESYESYES
_cons6.1199 ***
(0.0153)
−4.7021 ***
(0.0997)
−4.5842 ***
(0.1195)
−4.1654 ***
(0.1279)
−3.6804 ***
(0.2480)
−3.6804 ***
(0.6517)
City Fixed EffectsNONONOYESYESYES
Year Fixed EffectsNONOYESNOYESYES
City-Level ClusteringNONONONONOYES
N382338233823382338233823
R20.31390.92340.92560.97000.97420.9742
***, **, and * indicate statistical significance at the 1%, 5%, and 10% levels, respectively; t-values are reported in parentheses.
Table 3. Robustness test results.
(1)(2)(3)(4)
DID0.0635 **
(0.0252)
0.0615 **
(0.0249)
0.0718 ***
(0.0257)
0.0377 **
(0.0144)
Control VariablesYESYESYESYES
_cons−3.6566 ***
(0.6533)
−3.4835 ***
(0.6333)
−3.5633 ***
(0.1195)
−1.5270 ***
(0.5234)
City Fixed EffectsYESYESYESYES
City-Level ClusteringYESYESYESYES
N3823382337643009
R20.97420.97450.97250.9823
***, **, and * indicate statistical significance at the 1%, 5%, and 10% levels, respectively; t-values are reported in parentheses.
Table 4. Mechanism analysis results.
(1)(2)(3)
DID0.0919 **
(0.0252)
15.1119 **
(7.5775)
0.0040 ***
(0.0011)
Control VariablesYESYESYES
_cons5.2827 ***
(0.7017)
422.8856 ***
(137.5875)
0.0386 **
(0.1195)
City Fixed EffectsYESYESYES
City-Level ClusteringYESYESYES
N382326433823
R20.92880.72800.8799
***, **, and * indicate statistical significance at the 1%, 5%, and 10% levels, respectively; t-values are reported in parentheses.
Table 5. Results of first heterogeneity analysis.
(1)(2)(3)(4)(5)
DID−0.0175
(0.0536)
0.0390
(0.0302)
0.1313 ***
(0.0459)
0.0632 *
(0.0373)
0.0710 **
(0.0309)
Control VariablesYESYESYESYESYES
_cons−3.6570
(4.5925)
−2.1394 *
(0.6333)
−3.4840 ***
(0.0280)
−1.5264
(1.4715)
−4.1385 ***
(0.8032)
City Fixed EffectsYESYESYESYESYES
City-Level ClusteringYESYESYESYESYES
N1661038202213652457
R20.98540.98050.94990.96700.9712
***, **, and * indicate statistical significance at the 1%, 5%, and 10% levels, respectively; t-values are reported in parentheses.
Table 6. Results of second heterogeneity analysis.
(1)(2)(3)(4)
DID0.0302
(0.0423)
0.0684 **
(0.0299)
0.0638
(0.0424)
0.0674 *
(0.0357)
Control VariablesYESYESYESYES
_cons−5.7034 ***
(1.0982)
−2.2464 ***
(0.7796)
−3.9456 ***
(1.0261)
−3.2753 ***
(1.1573)
City Fixed EffectsYESYESYESYES
City-Level ClusteringYESYESYESYES
N1284253919011898
R20.95500.98080.96970.9799
***, **, and * indicate statistical significance at the 1%, 5%, and 10% levels, respectively; t-values are reported in parentheses.
Disclaimer/Publisher’s Note: The statements, opinions and data contained in all publications are solely those of the individual author(s) and contributor(s) and not of MDPI and/or the editor(s). MDPI and/or the editor(s) disclaim responsibility for any injury to people or property resulting from any ideas, methods, instructions or products referred to in the content.