Article

Synergistic Governance of Digitalization and Low-Carbon Development: How Does Green Data Center Policy Drive Corporate Sustainability?


1
School of Economics and Finance, Xi’an Jiaotong University, Xian Ning West Road No. 28, P.O. Box 1787, Xi’an 710049, China
2
School of Economics, Xi’an University of Finance and Economics, Xi’an 710100, China
*
Author to whom correspondence should be addressed.
Sustainability 2026, 18(14), 7464; https://doi.org/10.3390/su18147464
Submission received: 22 June 2026 / Revised: 8 July 2026 / Accepted: 14 July 2026 / Published: 22 July 2026
(This article belongs to the Section Economic and Business Aspects of Sustainability)

Abstract

This study asks whether, and through which firm-level channels, the green data center (GDC) pilot improves corporate sustainability, and it aims to quantify the policy effect and identify its transmission pathways. Under the dual shift in digital transformation and low-carbon transition, the energy demand and emissions generated by data centers have become important constraints on the sustainability performance of firms. This study regards the 2015 “National Green Data Center Pilot Work Plan” as a quasi-experimental policy shock. In terms of methods, using panel observations of Chinese A-share companies listed in Shanghai or Shenzhen during 2010–2024, a difference-in-differences (DID) strategy is employed to estimate the effect of GDC policy and to identify its transmission pathways for corporate sustainability. In terms of results, the empirical estimates indicate that the GDC pilot improves corporate sustainability, and the effect is robust to fixed-effects specifications, an instrumental-variable strategy, propensity-score matching, and a placebo test. Mechanism tests show that the pilot works through three channels: greater green innovation output and technical value, reduced financing frictions, and enhanced green governance capacity. Heterogeneity tests further show that the effect is stronger among firms with a higher level of digital transformation, a larger share of skilled technical personnel, stronger internal control, and greater executive green awareness, and that it is clearer where regional environmental regulation is stricter and market competition is more intense. In terms of conclusions, by integrating institutional pressure theory with the resource-based view, this study explains how the GDC pilot is translated into a firm-level sustainability advantage, and it offers evidence for refining GDC policy design and advancing the coordinated digital and green transformation of enterprises. The novelty of the study lies in providing firm-level causal evidence within a unified “pressure-to-capability” framework, in opening the three transmission channels, and in specifying the technological, organizational, and environmental conditions under which the effect is stronger.

1. Introduction

Climate risks, resource depletion, and biodiversity decline have sharpened the tension between economic growth and environmental carrying capacity. Against this background, environmental governance has moved beyond a purely regulatory or technical matter, but also a strategic factor shaping firms’ long-term competitiveness and survival [1]. However, China continues to face persistent challenges in environmental governance: on the one hand, pollution accumulated under the long-term extensive growth model has not yet been fully addressed; on the other hand, uneven enforcement across regions and local protectionism continue to weaken governance effectiveness [2]. These conditions imply that firms can no longer treat environmental compliance only as an external cost, but need to integrate it into strategic decision-making. At present, the Chinese government has attached increasing importance to corporate sustainability. In 2024, China Securities Regulatory Commission (CSRC) formally implemented the “Guidelines for Sustainable Development Reports of Listed Companies,” requiring companies included in major stock indexes to disclose sustainability information mandatorily; in the same year, the Ministry of Finance and eight other departments jointly released the “Enterprise Sustainable Disclosure Standard, Basic Standard (Trial),” marking that China’s enterprise sustainable disclosure has moved into a more standardized and compliance-oriented stage. In theory, the relation between corporate sustainability and environmental governance is not a simple one-way causal relation, but shows a bidirectional coupling pattern. A well-structured environmental governance system can provide both external incentives and resource backing for corporate sustainability by reducing compliance costs, reducing environmental litigation risk, and stimulating green technological innovation. Meanwhile, when enterprises incorporate sustainability goals into their strategies and operational routines, they can improve their capacity for proactive environmental governance, improve the quality of environmental information disclosure, and develop routines for continuous environmental performance improvement [3,4].
Although China has gradually improved its institutional framework for corporate sustainability, a new contradiction has emerged during the joint process of digitalization and low-carbon transition: the energy consumption and carbon emissions of information and communication infrastructure, especially data centers, are expanding rapidly, thereby creating a bottleneck for firms’ overall environmental performance [5]. To respond to this challenge, on March 18, 2015, the Chinese government, through the Ministry of Industry and Information Technology, General Administration of Government Affairs, and National Energy Administration, jointly issued the “National Green Data Center Pilot Work Plan” (MIIT Joint Energy Saving [2015] No. 82). This special plan first clarified the specific goals and implementation pathways for green data center construction. The plan set out six major tasks, including promoting technological innovation, optimizing energy-saving management, building an energy efficiency monitoring system, formulating standards, building a public service platform, and carrying out international cooperation. It aims to form replicable and scalable models for green data center construction through pilot demonstrations. The policy seeks to guide data centers toward reduced energy use and carbon emissions, push digital infrastructure toward green and low-carbon development, and thereby indirectly affect the energy consumption structure and environmental compliance costs faced by upstream and downstream firms. In December 2015, MIIT and three other departments further published the list of 84 national green data center pilot units, indicating that the pilot work entered the substantive implementation stage.
Prior studies have offered initial evidence on the association between GDC policy and corporate sustainability. Early work mainly examined green information technology technical architecture and energy-saving paths [6]; later research analyzed the impact of green IT/IS adoption and IT-business strategy matching on enterprise environmental performance [7]; recent empirical studies have focused on the role of GDC policy in improving carbon intensity and energy efficiency [8,9]. Although this literature has made progress in evaluating the technical energy-saving effect and policy effect of GDC policy, several gaps remain: First, many studies still focus on single policy responses or technical benefits, without fully decomposing the policy mechanism, and does not fully explain how GDC policy turns into a sustainability advantage through intermediate channels such as green innovation output and technical value, financing constraint mitigation, and corporate green governance. Second, existing literature gives limited attention to heterogeneity in policy effects, and rarely examines differentiated effects across multiple dimensions such as technological capability, organizational capacity, and the external environment. Third, for China’s GDC pilot policy, empirical evidence is still limited, especially evidence remains insufficient on the overall effect of the pilot policy and its internal transmission mechanisms. Therefore, this study responds to these gaps and provides empirical evidence and policy implications for improving GDC policy design and promoting enterprise digital-green coordinated transformation.
This study addresses three research questions. First, does the GDC pilot causally raise corporate sustainability? Second, through which firm-level channels does the policy operate? Third, under which technological, organizational, and environmental conditions is the effect stronger or weaker? The research goal is to provide credible causal evidence on the GDC pilot and to open the “black box” of its transmission so that the findings can inform policy design. To this end, the study pursues four objectives: to estimate the average effect of the pilot within a staggered DID design; to test three transmission channels; to characterize the boundary conditions of the effect through the technology–organization–environment lens; and to translate the evidence into implementable policy recommendations.
The contribution of this study is threefold. In terms of research questions, it moves beyond documenting a technical energy-saving effect and provides firm-level causal evidence on how a digital-infrastructure greening policy is converted into a broad sustainability advantage. In terms of theory, it integrates institutional pressure theory with the resource-based view into a single “pressure-to-capability” framework, and it derives three transmission channels and three sets of boundary conditions from this framework rather than treating them as post hoc correlations. In terms of methods and evidence, it combines a staggered DID design with an instrumental-variable strategy based on historical communication infrastructure, propensity-score matching, a placebo test, and a decomposition of the two-way fixed-effects estimator, so that the causal interpretation rests on convergent evidence rather than on a single specification.

2. Literature Review

2.1. Corporate Sustainable Development

Corporate sustainability refers to a strategic orientation in which firms create economic value while managing environmental and social impacts to meet stakeholder needs over time [10]. Although the concept derives from the triple bottom line framework, subsequent studies have further extended its scope. Hahn et al. [11] identify the tensions among economic, environmental, and social objectives, and emphasize that sustainability requires a dynamic balance among multiple goals. From the perspective of political corporate social responsibility, Scherer et al. [12] point out that, in the context of globalization, enterprises assume governance responsibilities that go beyond legal compliance. Cantele et al. [13] empirically verify the four-dimensional structure of corporate sustainability, and formally include the governance dimension in the traditional triple bottom line framework. Existing measurement approaches for corporate sustainability can be classified into three types: integrated indicators based on the triple bottom line [10,11], ESG ratings provided by institutions such as MSCI, Refinitiv and Sustainalytics [14], and content analysis based on sustainability reports, annual reports or corporate social responsibility reports [15].
Enterprise sustainability performance is jointly shaped by internal governance and capabilities, external stakeholder pressure, and policy regulation. Internally, board gender diversity and sustainability committees have been found to improve environmental performance and disclosure quality [16,17]. However, short-term performance pressure may lead managers to reduce environmental investment or adopt symbolic greenwashing behavior, especially when executive compensation is not linked to environmental performance, or independent directors cater too much to external expectations [18]. Meanwhile, R&D input and green technology innovation are important drivers of environmental performance improvement [19], but small and medium enterprises often are limited by financing difficulties and human-capital shortages, which limit the implementation of systematic green strategies [15]. Externally, institutional investors, consumers’ environmental preferences and market competition all may affect enterprise ESG performance and green innovation, but under information asymmetry and agency conflicts, their effects may be somewhat different [20,21,22,23]. At the regulatory level, well-designed environmental regulation can stimulate green innovation and improve green total factor productivity, while unstable or weak regulatory enforcement may cause passive compliance or pollution transfer [24,25,26]. Therefore, corporate sustainability results from the interaction among internal capabilities, outside pressure and the institutional environment. A related strand emphasizes the communicative dimension of these external relationships: how transparently and ethically firms communicate with stakeholders conditions the reputational returns to sustainability behavior [27].

2.2. Green Data Center Policy

China’s GDC policy has evolved over the past decade, and has gradually formed a multi-level governance system centered on energy efficiency standards and supported by pilot demonstrations and market incentives. In 2013, the Ministry of Industry and Information Technology and other departments issued the “Guiding Opinion on Data Center Construction Layout”, which offered early macro-level guidance for data center layout and energy conservation. In March 2015, the three departments jointly issued the “National Green Data Center Pilot Work Plan”, requiring the creation of about 100 pilot units in key fields by the end of 2017, with pilot data centers achieving an average energy efficiency improvement of more than 8%, formulating four national standards, and promoting 40 advanced technologies. In 2019, the “Guiding Opinion on Strengthening Green Data Center Construction” further proposed that, by 2022, the power use efficiency (PUE) of newly built large and super large data centers should be lower than 1.4 [28]. As Table 1 shows, since 2015, many main cities in China have carried out green data center selection in batches. The continuous upgrading of policy instruments provides a quasi-natural setting for identifying economic effects.
Regarding the economic effects of GDC policy for corporate sustainability, existing studies mainly discuss three channels: labor productivity, green innovation, and firm value. In terms of labor productivity, Wang et al. [9] find that the GDC pilot policy raises enterprise labor productivity; specifically, these policies improve productivity by suppressing low-quality overtime work, while data asset information disclosure and integration into global innovation networks strengthen the policy transmission effect. For green innovation, Yin and Wang [8], based on Chinese listed firms, find that data center green transformation promotes corporate carbon emission reduction. Based on the resource-based view, Lin et al. [29] systematically review the green perception management technology system of sustainable data centers from a technological perspective, revealing the internal link between energy efficiency optimization and green innovation. Regarding ESG performance and firm value, Meng et al. [30] take the GDC pilot policy as a quasi-natural experiment, and propose that this policy improves overall corporate ESG performance through reduced compliance risk and stronger green reputation. In addition, under China’s “East Data West Computing” initiative framework, researchers estimate that this project can cumulatively reduce 2.125 billion tons of carbon dioxide emissions from 2020 to 2050. If combined with PUE improvement, green electricity share increase and other supporting measures, the total carbon emission reduction can reach 9.5 billion tons, which strongly supports the long-term environmental value of data center green policy [31]. Overall, existing evidence suggests: GDC policy can generate economic benefits through technological innovation, resource allocation optimization, and green-reputation building. However, the design of policy tool combinations and their degree of matching with enterprise governance capabilities are still important conditions affecting policy effectiveness. Because the pilot also reshapes the cost structure and cross-border operating environment of firms, its effect further interacts with how firms manage strategic and cultural risk in international business [32].

2.3. Literature Summary

In summary, existing literature has examined corporate sustainability and GDC policy. In the field of corporate sustainability, scholars have examined how internal governance, external pressure, and regulatory policy influence corporate sustainability performance, thereby revealing the tensions and balance mechanisms among economic, environmental, and social objectives. Regarding GDC policy, existing studies mainly evaluate its energy-saving and emission-reduction effects at the technological level, the role of policy in promoting enterprise labor productivity and green innovation, and the positive influence of pilot policy on ESG performance. However, the existing literature still has several limitations: First, most studies still stay at the level of single policy response or technological benefit, lacking systematic analysis based on the institutional-pressure transmission mechanism, and cannot fully explain how GDC policy turns into sustainable corporate advantage through intermediate paths. Second, existing literature gives limited attention to heterogeneity in policy effects, and less often examines the moderating role of contextual factors such as enterprise ownership structure, technological capability, organizational governance, and the external context on policy results. Third, empirical evidence on China’s GDC policy is still limited. In particular, the overall influence of the pilot policy on corporate sustainability and its internal mechanisms require further examination. Based on this, this paper clarifies the transmission paths through which GDC policy influences firm sustainability from the perspectives of green innovation, financing constraints, and corporate green governance. Meanwhile, it analyzes heterogeneity from the dimensions of technology, organization, and environment, thus providing an empirical basis for improving GDC policy design.

3. Theoretical Framework and Hypotheses

3.1. Theoretical Foundation

The analysis rests on two complementary theories that together form a single “pressure-to-capability” framework. Institutional theory explains how external regulation moves firms toward legitimacy-seeking behavior, and the natural-resource-based view (NRBV) explains how legitimacy-driven incentives are converted into sustainable competitive advantages through the reconfiguration of internal capabilities. The first theory identifies the external force that sets the process in motion; the second identifies the internal mechanism through which that force becomes a durable advantage. Combining them yields a framework in which a coercive policy shock is first internalized as compliance pressure and then, conditional on firm capabilities and context, translated into green innovation, financing, and governance outcomes that raise corporate sustainability.
From an institutional-theory perspective, GDC policy constitutes a coercive institutional pressure. This theory [33] holds that organizational behavior is shaped by the institutional environment, and that regulatory factors define behavioral boundaries through coercive mechanisms. GDC policy changes the institutional field in which firms operate by setting energy efficiency standards, carbon emission constraints, mandatory green power ratios, and related requirements. To gain legitimacy and avoid compliance risk, firms embed green development principles into strategic decision-making; this becomes the initial institutional impetus for sustainable corporate behavior. In addition, top-down environmental regulation can encourage compliance-driven green innovation [34], which makes institutional pressure a starting point for the shift toward sustainability. Consistent with this logic, Berrone et al. [35] show that institutional pressure is a first-order driver of environmental innovation, and Delmas and Toffel [36] document that firms translate external environmental demands into internal management practices in systematically different ways.
The policy effect is not confined to the acquisition of legitimacy at the compliance level; it also empowers the core green capabilities of firms. The NRBV [3] extends the traditional resource-based view. It holds that, as resource limitations and environmental pressure become more salient, competitive advantages can arise from active interaction with the natural environment. Specifically, firms can develop unique green capabilities through three interrelated strategies: pollution prevention, product stewardship, and sustainable development. GDC policy provides institutional support and resource guarantees for the “sustainable development” strategic path. It guides firms to integrate energy conservation, renewable-energy use, and carbon management into daily operating systems, and pushes them from passive compliance to active innovation, so that environmental and economic benefits are integrated internally. Evidence that corporate sustainability behavior can raise financial performance [37] indicates that this capability path is economically, not only symbolically, meaningful. Regulatory pressure is therefore not only a precondition for the adoption of environmental practices, but also a driver of green innovation, environmental capability development, and sustainable competitive advantage.

3.2. GDC Policy and Corporate Sustainability

The logic through which the GDC pilot improves corporate sustainability follows three steps. First, the policy sets the compliance framework and legitimacy basis for sustainable development through regulatory pressure. Second, through the path revealed by the NRBV framework, the policy enables firms to turn external environmental regulation into endogenous green capabilities and competitive advantages. Third, through the joint effect of institutional shaping and capability reshaping, the policy helps firms shift from short-term compliance responses to long-term sustainable value creation.
H1. 
The GDC pilot improves corporate sustainability.

3.3. Transmission Mechanisms

Building on H1, this study specifies the transmission of the policy effect. The “pressure-to-capability” framework implies three channels: green innovation output and quality, the alleviation of financing constraints, and corporate green governance. Each channel is developed as a separate hypothesis below.
On green innovation, GDC policy first raises output through resource supply and risk-sharing mechanisms. By requiring green technologies such as high-efficiency cooling and renewable-energy power, and by providing subsidies and green credit, the policy lowers R&D thresholds and failure risk in fields such as energy-saving computing and waste-heat recovery, which encourages rapid growth in green innovation output. Directed-technical-change theory implies that raising the relative cost of polluting technologies redirects innovation toward cleaner alternatives [38], and the improvement of innovation quality depends on standards and knowledge integration [39]. PUE caps and carbon-efficiency ratings push firms beyond marginal improvements and encourage cross-organizational R&D and data-driven technical breakthroughs. Under the NRBV, green innovation capability is a core source of sustainability advantage [3]. This view further suggests that, under multiple institutional pressures, a decoupling may arise between innovation quantity and quality; only their coordinated improvement can promote corporate sustainability [40]. Output expansion provides basic support through economies of scale, while quality breakthroughs provide continuous competitive capability, and together they support long-term green transformation.
H2a. 
The GDC pilot improves corporate sustainability by increasing green innovation output and quality.
On financing constraints, GDC policy broadens external financing channels by lowering information asymmetry. Green data center construction requires the disclosure of PUE, carbon emissions, and other quantifiable green performance indicators. Such standardized disclosure transmits credible signals of environmental compliance and technological reliability to financial institutions, which lowers information asymmetry and reduces the cost of green credit. This mechanism is consistent with the evidence of Cheng et al. [41] that stronger corporate social and environmental performance improves access to finance by reducing agency costs and information asymmetry. The policy also lowers perceived project risk through national strategic signals and institutional safeguards. Financing constraints originate from information asymmetry and agency problems, which make external financing more expensive than internal funds and suppress long-term value-creating investment. Their alleviation allows firms to allocate more internal cash flow to long-term sustainability projects, to adjust capital structures, and to increase resilience to economic fluctuations and policy adjustments.
H2b. 
The GDC pilot improves corporate sustainability by easing financing constraints.
On corporate green governance, GDC policy strengthens governance through internal and external channels. Internally, mandatory energy efficiency standards, PUE limits, and carbon emission monitoring encourage firms to establish board-level green governance committees and to include environmental indicators in executive appraisal, so that environmental management moves from peripheral departments to the decision-making center. Externally, the policy requires continuous disclosure of green operating performance, greenhouse gas emissions, and renewable-energy use, which increases pressure from capital markets, regulators, and stakeholders. GDC policy therefore embeds environmental management into core governance structures through data disclosure and related information channels [30]. Because organizational responses to the same external demand differ with internal structure [36], this embedding is what converts external pressure into durable governance capacity. The institutionalization of sustainability governance and the improvement of disclosure quality jointly enhance corporate green governance [42].
H2c. 
The GDC pilot improves corporate sustainability by strengthening corporate green governance.

3.4. Boundary Conditions: A Technology–Organization–Environment Perspective

The “pressure-to-capability” framework implies that the same institutional pressure is converted into a sustainability advantage to different degrees, depending on the technological, organizational, and environmental conditions of the firm. We derive three moderating hypotheses along the technology–organization–environment (TOE) dimensions before testing them.
On the technology dimension, the conversion of policy pressure into green capability depends on the firm’s capacity to sense policy signals and reconfigure processes. A higher level of digital transformation and a larger share of skilled technical personnel raise this absorptive capacity, so that the policy effect is stronger where technological capability is higher [43,44].
H3. 
The effect of the GDC pilot on corporate sustainability is stronger in firms with higher technological capability.
On the organization dimension, institutional incentives become governance outcomes only when internal management aligns with them. Effective internal control curbs managerial myopia and agency conflict, and higher executive green awareness places environmental issues within strategic decision-making [45]; both determine whether external demands are translated into internal practice [36].
H4. 
The effect of the GDC pilot on corporate sustainability is stronger in firms with higher organizational capability.
On the environment dimension, the intensity of coercive pressure depends on regional enforcement and market discipline. Stricter environmental regulation raises the cost of non-compliance and strengthens the innovation-offset mechanism of the Porter hypothesis [46], and more intense market competition sharpens the reputation and cost returns to green differentiation.
H5. 
The effect of the GDC pilot on corporate sustainability is stronger where environmental regulation is stricter and market competition is more intense.

4. Research Design

4.1. Model Specification

4.1.1. Baseline Regression Model

To assess the effect of GDC policy on corporate sustainability, this paper specifies the following regression specification:
C S i t = α 0 + α 1 i n t e r i t + α 2 C o n t r o l i t   +   δ i + ρ t + ε i t
In this specification, i   denotes firms and t   denotes years. C S i t denotes corporate sustainability, whereas i n t e r i t captures the GDC policy treatment. C o n t r o l i t denotes the set of control variables; firm-level and year-level fixed effects are included, and the disturbance term captures random shocks.

4.1.2. Mediation Effect Model

To examine how GDC policy influences firm sustainability, this study performs mechanism regressions. Given that traditional stepwise mediation tests may be affected by endogeneity-related estimation bias, this paper uses each mediator as the dependent variable and examines the effect of the core explanatory variable on the mediating variable, thereby examining whether the proposed channels are valid. The mediation-effect model is specified as follows:
M i t = 0 + 1 i n t e r i t + 2 C o n t r o l i t + δ i + ρ t + ε i t
C S i t = β 0 + β 1 i n t e r i t + β 2 M + β 3 C o n t r o l i t + δ i + ρ t + ε i t
The mechanism variables include the number of green innovations ( N G I i t ), green innovation quality ( G I Q i t ), financing constraints ( W W i t ), and corporate green governance ( C G G i t ). The other variables follow Equation (1).

4.2. Variable Selection

4.2.1. Dependent Variable

Enterprise sustainability (CS): The CS indicator is constructed according to the triple bottom line principle. Referring to Thienemann et al. [47], this study constructs a multidimensional indicator system covering three dimensions: economic performance, environmental performance, and social performance. Because these dimensions capture both internal and external attributes, this study combines internal financial data with external ESG ratings to carry out a comprehensive evaluation of corporate sustainability performance. More specifically, economic performance is measured by return on assets (ROA) as a proxy indicator, so as to reflect the profitability of enterprises and the level of shareholder value creation; environmental performance is measured by the environmental dimension score in the Huazheng ESG scoring system, which evaluates enterprises’ performance in energy saving and emission reduction, green technology, and environmental management; social performance is measured by the social dimension score in the Huazheng ESG rating, covering employee rights, community relations, product responsibility and other social issues. After the three dimension-level indicators are obtained, the entropy-weighting approach is used to assign data-driven weights. The weight of each indicator is determined through a series of steps, including data standardization, feature proportion calculation, entropy value calculation, coefficient of variation calculation, and entropy weight calculation. This measurement strategy is both objective and comprehensive, providing a reliable variable for corporate sustainability performance in empirical research.

4.2.2. Core Explanatory Variable

GDC policy (inter): inter is defined as Treat × Post. Among them, firms headquartered in cities covered by the GDC pilot are coded 1 and constitute the treated sample; firms in non-pilot cities are coded 0 and serve as the comparison sample. For the timing variable Post, the policy year and subsequent years take the value 1, whereas years before implementation take the value 0.

4.2.3. Mediating Variables

Green innovation output (NGI): green innovation refers to technological innovation aimed at saving resources and reducing pollution, including environmental protection equipment and clean production technologies at the hardware level, and green management processes and operation strategies at the software level. Referring to Zhang and Chen [48], this study employs the number of green patent applications submitted by enterprises to measure green innovation scale. This indicator reflects enterprises’ activity in green-technology R&D and innovation output capacity. More specifically, more green patent applications imply greater inputs of R&D capital, personnel, and time in the field of green innovation. This suggests that the R&D team continues to address technical bottlenecks, and can translate R&D activities into patentable technical outcomes, showing the continuity and effectiveness of the R&D process.
Green innovation quality (GIQ): Green innovation aims to reduce environmental externalities while creating economic value. Following Zhang and Chen [48], this study uses green patent citations as the indicator of innovation quality. A higher citation count indicates stronger technological influence within the industry, and usually reflects higher technical advancement and market value.
Financing constraints (WW): financing constraints are proxied by the WW index. The WW index, proposed by Whited and Wu [49], is a composite indicator of financing constraints. It is derived from structural estimation of firm investment behavior and incorporates multiple dimensions, such as cash flow, dividend payment, long-term leverage, firm size, industry sales growth, and firm-specific sales growth. A higher WW value indicates more severe financing constraints for the firm.
Enterprise green governance (CGG): Referring to Ji et al. [50], this study constructs an executive environmental-awareness index using text analysis. More specifically, the frequency ratio of environmental terms in listed firms’ annual reports is used to proxy executive environmental awareness. These words include “environmental protection”, “environmental strategy”, “energy saving and emission reduction”, “environmental idea”, “environmental management agency”, “environmental education”, “environmental training”, “environmental technology development”, “environmental audit”, and so on. Also, this study further uses three indicators from the CSMAR Environmental Database, whether an environmental management system has been established, whether environmental education and training have been carried out, and whether special environmental protection activities have been carried out, as proxy variables for corporate green governance.

4.2.4. Control Variables

Following the existing literature, this paper includes the following control variables that may influence corporate sustainability: Firm Size (SIZE): measured as the logarithm of year-end total assets; Debt-to-Asset Ratio (LEV): measured as year-end total liabilities divided by year-end total assets; Inventory Ratio (INV): net inventory/total assets; Revenue Growth Rate (Growth): current-year operating revenue/previous-year operating revenue—1; Loss Status (Loss): 1 if the previous year’s net profit is less than 0, otherwise 0; Largest Shareholder’s Ownership Ratio (TOP): number of shares held by the largest shareholder/total number of shares; Regional Gross Domestic Product (GDP): measured using the logarithm of regional GDP; and Regional Industrial Structure Upgrading (ISU): measured by the added value of the tertiary industry divided by the added value of the secondary industry in the region. These control variables are selected because each is a first-order determinant of corporate sustainability identified in the prior literature: firm size proxies slack resources and public scrutiny [15]; leverage constrains discretionary long-term environmental investment; the inventory ratio captures asset composition; revenue growth captures the growth stage; loss status captures financial distress; the largest shareholder ownership captures governance incentives; and regional GDP and industrial structure upgrading control for the regional economic and industrial environment. More idiosyncratic, time-invariant firm attributes are absorbed by the firm fixed effects. To improve readability, the variable previously abbreviated ISU is renamed ISU (Industrial Structure Upgrading); LEV denotes leverage (the debt-to-asset ratio) and TOP denotes the ownership share of the largest shareholder.

4.3. Data Sources and Treatment

The empirical sample consists of A-share listed firms covering 2010 to 2024. Observations missing the core explanatory or dependent variables are removed, and continuous variables are winsorized at the 1% level. Consequently, 36,786 observations were retained, covering a total of 4634 listed firms, including 1112 firms in the control group and 3522 firms in the treatment group. The core explanatory variable is based on the list of green data center pilot projects jointly issued by the National Development and Reform Commission and the Ministry of Industry and Information Technology. Firm-level variables are collected from the WIND and CSMAR databases, while city-level data were collected from the China City Statistical Yearbook. Data cleaning and model estimation were completed in Stata 18.0. Table 2 presents the descriptive statistics for all variables.

4.4. Data Validity, Multicollinearity, and Normality

Before turning to the regression results, this section reports three sets of diagnostics on the validity of the data. First, Table 3 presents the pairwise Pearson correlation matrix for the core variables together with the variance inflation factors (VIFs). Most correlations are small in absolute value; the larger correlations arise among the regional variables (GDP and ISU) and the treatment, which is expected because the pilot is administered at the city level. The mean VIF is 1.50 and the largest single VIF is 2.55, both far below the conventional threshold of 10, so multicollinearity is not a concern.
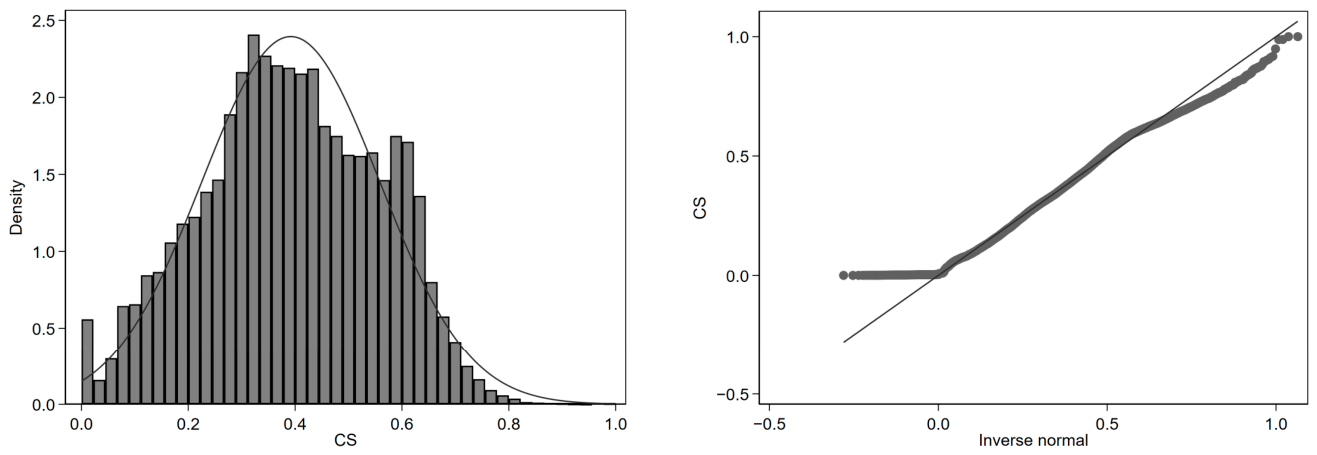
Second, we assess the distributional properties of the variables. As reported in Table 2, several variables depart from normality: the Skewness–Kurtosis (D’Agostino) test rejects the null of normality for every variable at the 1% level, which is typical for firm-level financial and innovation data. Figure 1 illustrates this for the dependent variable. Non-normality of this kind does not threaten the validity of the estimates: with 36,786 observations, the central limit theorem justifies asymptotically normal inference regardless of the marginal distributions; all continuous variables are winsorized at the 1% level, which limits the influence of extreme observations; and inference is based on heteroskedasticity-robust standard errors clustered at the province level. The data are therefore well behaved for the fixed-effects estimation that follows.

5. Empirical Results

5.1. Baseline Regression Estimates

Table 4 presents the benchmark estimates for the relationship between GDC policy and corporate sustainability. Column (1) gives the specification without covariates, whereas Columns (2)–(5) present specifications without fixed effects, with only year effects, with only firm effects, and with both effects. The estimates remain positive and statistically significant across all five specifications. In Column (5), the coefficient on inter, the core policy variable, equals 0.0217 and reaches the 1% level. This finding supports a positive effect of GDC policy on corporate sustainability. Hypothesis H1 is therefore supported.

5.2. Parallel-Trends Test

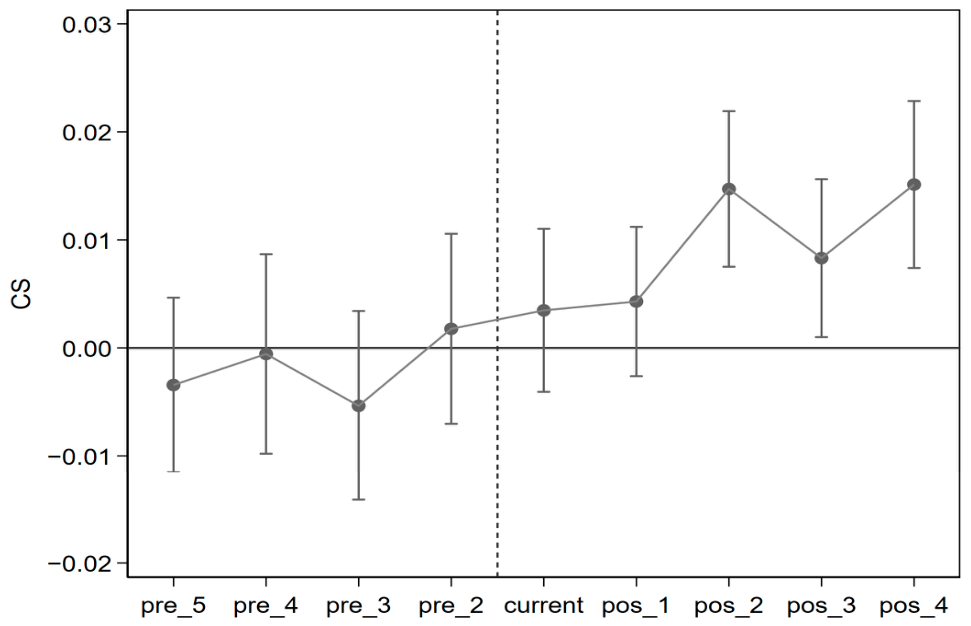
The DID design requires treated and control firms to follow comparable pre-policy trends; otherwise, the estimated treatment effect may be biased. To keep the event-study specification simple, the pre- and post-treatment periods are grouped. Because observations five or more years before implementation are limited, these earlier observations are pooled into the fifth pre-policy year, with the combined sample period defined as n ∈ [−5, 4]. To avoid multicollinearity and present the dynamic pattern in green data centers before and after the treatment, the year right before treatment is selected (−1 period) as the base period. As Figure 2 shows, at each observation point prior to policy shock (from 5 to 2 years before implementation), the CS coefficients for both the experimental and control groups move around zero, and their confidence intervals include zero. This suggests that there was no significant difference in the trends of corporate sustainability between the two groups, supporting the parallel-trends assumption. After the policy takes effect, the CS coefficient rises clearly, implying a positive policy impact on corporate sustainability.

5.3. Placebo Test

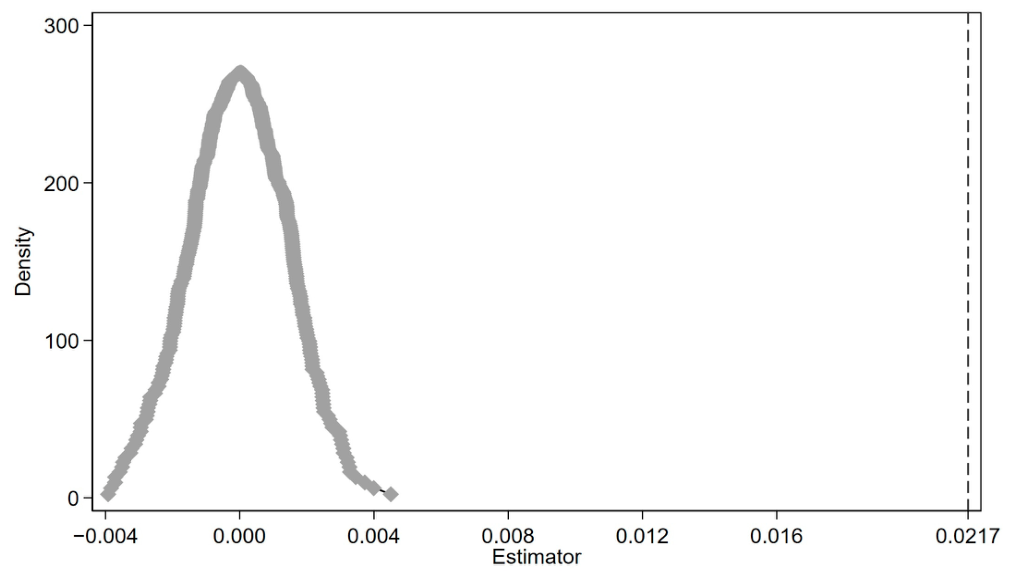
To exclude interference from unobserved factors on the results of this study’s policy implementation evaluation, this paper follows existing research and conducts a placebo test to assess whether the estimated effect on corporate sustainability is driven by other unobserved factors. The test is implemented within the DID framework by randomly drawing a pseudo-treatment group equal in size to the actual treated sample. Additionally, a random dummy variable for the pseudo-treatment group (Rd_Treat) and a random dummy variable for the pseudo-policy shock (Rd_Post) are generated simultaneously to randomize both firm assignment and policy timing. More specifically, this paper generates 500 randomized shocks of the pseudo-GDC policy across the entire sample, with the treatment group and policy shock timing randomly generated each time, resulting in 500 random sets of pseudo-treatment groups Rd_Treat × Rd_Post. The results are shown in Figure 3. The randomized interaction coefficients are centered near zero, and the coefficients are mostly lower than the true coefficient of 0.0217. This suggests that after double randomization, the policy effect is significantly weakened in terms of both significance and magnitude, indirectly supporting the robustness of the findings in this paper.

5.4. Endogeneity Test

Although the baseline model includes firm and year fixed effects, the relation between GDC policy and corporate sustainability may still be affected by endogeneity arising from omitted time-varying factors or reverse causality. To address this concern, this study adopts an instrumental-variable strategy and estimates a two-stage least squares (2SLS) model within the two-way fixed-effects framework. The instrument is constructed in the spirit of a shift-share (Bartik) design: the historical density of communication infrastructure of a city (denoted DistFiber) is interacted with the time dimension, so that the instrument varies within firms over time and is not absorbed by the firm fixed effects. The relevance condition holds because cities with a denser historical communication base are better positioned to host and upgrade data-center facilities as national digital-infrastructure policy advances. The exclusion restriction is plausible because historical communication infrastructure, interacted with a common national time trend, is unlikely to affect current corporate sustainability through channels other than contemporary digital-infrastructure development, once firm and year fixed effects and the full control set are included. As Table 5 reports, the first stage is strong (the instrument is significant at the 1% level, and the Kleibergen-Paap rk Wald F-statistic is 35.89, above the Stock-Yogo 10% critical value of 16.38), and the Kleibergen-Paap rk LM statistic rejects under-identification at the 1% level. In the second stage, the coefficient on the instrumented inter is 0.0676 and is significant at the 1% level, which preserves the sign of the baseline estimate. An over-identification check that adds a city climate-risk index yields a Hansen J statistic that does not reject the joint exogeneity of the instruments (p = 0.455). The instrumental-variable estimates are therefore consistent with the baseline conclusion.

5.5. PSM and Robustness Test Results

5.5.1. Propensity-Score Matching (PSM)

To address potential selection bias in the benchmark estimates, this study applies PSM as a robustness test to examine whether the estimated GDC effect is stable. More specifically, this study constructs a matched sample based on firms’ basic firm characteristics, and uses the 1:3 nearest-neighbor matching method to pair pilot-area firms with comparable non-pilot firms and then re-estimates the model using the matched observations. Table 6 presents the post-matching regression results. Columns (1) and (2) show that the estimated inter coefficients for corporate sustainability are 0.0196 and 0.0193, and both are significant at the 1% level. In sum, this shows that even after observable selection differences is controlled, GDC policy retains a positive and statistically significant effect on corporate sustainability, thus further verifying the robustness of the baseline regression estimates and the reliability of the policy effect.

5.5.2. Replacing the Dependent Variable

As an additional robustness exercise, this study re-estimates the main effect with an alternative dependent variable. As reported in Column (1) of Table 7, the regression coefficient for the core explanatory variable `inter` is 0.0101 and is significant at the 1% level. The result remains consistent with the baseline estimate, supporting the robustness of the findings.

5.5.3. Accounting for Other Policy Effects

As another robustness exercise, this study examines the main effect after controlling for the National Big Data Comprehensive Pilot Zones and the Green Finance Innovation and Development Pilot Zones. As shown in the regression results in columns (2), (3), the regression coefficients for the core explanatory variable inter are 0.0189 and 0.0210, respectively, both of which reach the 1% level. The results remain aligned with the benchmark findings after these overlapping policy effects are controlled.

5.5.4. Excluding the Pandemic Shock

To further check the stability of the baseline regression estimates, this study considers the COVID-19 pandemic as an exogenous shock that may affect corporate sustainability and the effectiveness of policy implementation. Therefore, observations from 2020 onward are excluded to reduce interference from the pandemic shock. The regression results in Column (4) of Table 7 show that the coefficient on the core explanatory variable is 0.0323 and significant at the 1% level, indicating that the promotional effect of green data centers on corporate sustainability persists even after excluding the pandemic and later years.

5.5.5. Dropping First-Tier Cities

To further assess robustness, the model is re-estimated after excluding first-tier cities. As shown in the regression results in Column (5) of Table 7, the regression coefficient of the core explanatory variable inter is 0.0104 and is significant at the 5% level. The consistency with the benchmark model further supports the stability of the results.

5.5.6. Goodman-Bacon Decomposition

Goodman-Bacon [51] found that due to the presence of treatment effects that are heterogeneous across time and group dimensions, estimates of treatment effects remain biased even when both conventional parallel trends and dynamic-effect tests hold. This is a key factor contributing to bias in two-way fixed-effects models. To examine this issue, this paper decomposes the difference-in-differences estimator using the method proposed by Goodman-Bacon [51] to explore the sources and extent of bias in the TWFE multi-period difference-in-differences estimates. As reported in Table 8, the Bacon decomposition indicates that the estimates from the baseline regression in this study primarily stem from comparisons between the treatment group and the group that never received treatment, accounting for 54.3% of the total. The proportion of “good control groups” reached 92.5%. Meanwhile, the weight of “bad control groups”, which contribute to heterogeneous treatment effect bias, was very small, suggesting that the two-way fixed-effects bias in this study is not severe.

5.6. Mechanism Analysis

5.6.1. Green-Innovation Channel

Columns (2) and (4) of Table 9 indicate that the estimated coefficients of GDC policy on green innovation quantity and quality are 0.0471 and 0.0549, respectively, and are significant at the 5% and 1% levels, respectively. This suggests that green data centers can raise both green innovation quantity and quality. More specifically, GDC policies lower R&D barriers and increase the quantity of innovation through resource provision and risk sharing mechanisms. Meanwhile, technical standards drive cross-organizational collaboration and in-depth research, thereby enhancing the quality of innovation. The accumulation of innovation in quantity provides a foundational support for enterprises, while breakthroughs in innovation quality endow enterprises with sustained competitiveness; together, these two factors synergistically drive corporate sustainability. Therefore, green innovation output and quality serve as important transmission channels between policy and corporate sustainability, confirming the existence of a mediating effect. The quantity channel is significant at the 5% level and the quality channel at the 10% level, so Hypothesis H2a is supported.

5.6.2. Financing-Constraint Channel

Column (2) of Table 10 reports a coefficient of −0.0336 for the effect of the GDC pilot on financing constraints, significant at the 5% level. This result indicates that the GDC pilot alleviates financing constraints. More specifically, GDC policies reduce information asymmetry by mandating the disclosure of green performance indicators, thereby broadening financing channels. Policy signals also reduce perceived project risk, thereby lowering financing premiums. The alleviation of financing constraints enables firms to allocate more funds to long-term sustainable projects and enhances their risk-resilience, creating a positive cycle of “improved financing, sustainable investment, enhanced performance.” Therefore, financing frictions serve as an important channel linking the policy to corporate sustainability, supporting the mediating effect. Hypothesis H2b is therefore supported.

5.6.3. Green-Governance Channel

Column (2) of Table 11 reports a GDC coefficient of 0.0553 for corporate green governance, significant at the 5% level. This result shows that the GDC pilot strengthens corporate green governance. More specifically, GDC policies incorporate environmental management into the core governance structure through internal and external governance to elevate the level of green governance. In turn, the improvement in green governance, through institutional development and enhanced quality of information disclosure, enables enterprises to balance ecological and social responsibilities, thereby achieving sustainable development. Consequently, corporate green governance works as a key channel from policy to corporate sustainability, which supports the mediating-effect interpretation. Hypothesis H2c is therefore supported.

6. Heterogeneity Analysis

Drawing on the technology–organization–environment (TOE) framework, this section examines how technological, organizational, and environmental factors condition the effect of GDC policy on firm sustainability.

6.1. Technological Capability

Technological capability denotes the capacity of managers and employees to allocate technical resources. Under the TOE framework, the technology dimension focuses on the firm’s internal technological capability.
Digital transformation level and the share of high-skill technical personnel form the core capability base through which firms absorb green-policy benefits. Digital transformation reflects how firms use big data, artificial intelligence, and related technologies to reconfigure processes and optimize resource allocation. A higher digital level helps firms perceive policy signals, capture opportunities, and adjust operating models. Therefore, under the incentive of GDC policy, firms can realize the joint improvement of green innovation and sustainable development, and when environmental policy is more strict, this effect is especially obvious [43]. The latter reflects the quality of firm human capital. High-skill personnel, as a strategic resource, can speed up policy response, push green R&D and environmental system integration, and at the same time raise the emission-reduction effect of digital technology [44]. These factors together empower firms to fully use institutional incentives and promote sustainable development. Therefore, this paper predicts that the higher the digital transformation level and the higher the share of high-skill personnel, the stronger the sustainability-enhancing effect of the GDC pilot.
First, this paper counts the appearance frequency of 76 digitalization-related terms disclosed in firm annual reports across five dimensions of artificial intelligence, big data, cloud computing, blockchain and digital technology, and takes their natural log to measure firm digitalization level. A larger value indicates a higher degree of digital transformation. As shown in column (2) of Table 12, this specification captures heterogeneity by digital transformation. The coefficient of policy on firm sustainability is 0.0220, significant at the 1% level. The coefficient of DCG_inter is 0.0068, significant at the 5% level, showing that higher firm digitalization strengthens the sustainability-enhancing effect of the GDC pilot. Second, this paper defines the human capital upgrade variable as the proportion of technical personnel in total employees. Regarding the heterogeneity of technical personnel share, as the result of column (3) in Table 12 shows, the coefficient of policy on firm sustainability is 0.0258, significant at the 1% level. The coefficient of GJSRY_inter is 0.0407, significant at the 1% level. This suggests that the GDC pilot has a stronger sustainability-enhancing effect in firms with a higher share of technical personnel. Hypothesis H3 is therefore supported.

6.2. Organizational Capability

Organizational capability refers to firms’ ability to combine resources and align internal and external collaboration through organizational design, process optimization, and institutional safeguards to realize strategic objectives. Under the TOE framework, the organizational dimension focuses on enterprises’ endogenous organizational management effectiveness.
Internal control and executives’ green awareness are important enablers that convert GDC policy benefits into sustainability advantages. Internal control can effectively deal with managerial short-sightedness and principal-agent conflicts; without effective internal control, policy incentives may not become governance incentives [45]. High-quality internal control, through optimizing the institutional environment, standardizing environmental information disclosure and strengthening risk early-warning mechanisms, makes energy saving, emission reduction and carbon reduction goals embedded into daily operation, thus turning policy signals into green governance and innovation actions. Executive green awareness determines whether environmental issues are placed in strategic decision-making. Higher awareness levels will push executives to regard environmental problems as core assets, actively internalize policy goals, overcome transformation resistance, and push policy requirements and long-term strategies to deeply integrate. This study predicts that stronger internal control and higher executive green awareness, the stronger the GDC policy promotion effect on corporate sustainability.
First, internal-control quality is measured by the Dibo internal control index. The construction and validation of this comprehensive quantitative index are documented by Chen et al. [52], and it quantitatively evaluates enterprise internal control systems across five key goals: strategy, operation, report, compliance and asset safety. Because its effectiveness has already been verified in debt financing studies, it is a leading internal control evaluation index in China. As shown in Table 13, column (2), the effect coefficient of GDC policy on corporate sustainability is 0.0215, significant at the 1% significance level. The effect coefficient of NK_inter is 0.0051, also significant at the 1% significance level. This indicates that stronger internal control is associated with, the stronger the promotion effect of GDC policy on corporate sustainability.
Secondly, this study defines executive green awareness as executives’ understanding of basic environmental problems, the cognitive framework and knowledge structure formed from this understanding, and their psychological experience when undertaking responsibilities for resource conservation and environmental protection. This mainly includes green competitive advantage awareness, social responsibility awareness, and outside pressure perception. To measure executive green awareness, this study mainly refers to the practice of Osborne et al. [53] and Duriau et al. [54], and builds a system composed of 19 indicators based on the above three dimensions. The collected word frequency values obtained by the text analysis method are summed and then logarithmically transformed, and the resulting value serves as the proxy for executive green awareness. As shown in column (3) of Table 13, the GDC policy coefficient for corporate sustainability is 0.0275 and significant at the 1% level. The influence coefficient of LSRZ_inter is 0.9934, also significant at the 1% level. This indicates that stronger executive green awareness is associated with a stronger promotional effect of GDC policy on corporate sustainability. The large point estimate for executive green awareness reflects the small numerical scale of that index, so its economic magnitude is comparable to the other moderators; Hypothesis H4 is supported.

6.3. External Context

In the environmental dimension, the external context captures the intensity of policy pressure and guidance, which shapes the strength and direction of transformation.
Regional environmental regulation and market competition are important external factors that shape the transmission of external policy incentives under GDC policy. Regional environmental regulation reflects the strictness of local environmental enforcement; stricter regulation will impose stricter emission standards, higher non-compliance costs and stronger law enforcement supervision, thus forming institutional pressure, forcing enterprises to seriously treat policy compliance requirements, and turning external incentives into sustainable operating improvements. Industry competition determines the form of market pressure. In highly competitive industries, enterprises face obvious differentiation pressure; policy requirements such as energy efficiency improvement and renewable energy consumption are more likely to be regarded as strategic innovation rather than pure cost expenditure. Therefore, enterprises have stronger motivation to turn compliance into competitive advantage, thus strengthening the role of policy in promoting sustainable development. This study predicts that stricter regional environmental regulation and more intense market competition, the stronger the promotion effect of GDC policy on corporate sustainability.
First, environmental regulation promotes technological upgrading through policy standards. This study uses the proportion of environmental protection-related words in local government work reports, such as “environment protection”, “pollution” and “emission reduction”, to measure regional environmental regulation strength. More specifically, this indicator is calculated as the ratio of the total number of characters in sentences containing these words to the total number of characters in the government work report. As shown in Table 14, column (2), the impact coefficient of GDC policy on corporate sustainability is 0.0259, while the coefficient of HJGZ_inter is 0.0347; both reach the 1% level. This indicates that in regions with stricter environmental regulation, GDC policy has a stronger driving effect on corporate sustainability.
The HHI index is widely used, and has become a standard tool in academic research and market regulation for evaluating industry concentration and competition. In essence, HHI is calculated by summing squared market-share values based on industry revenue or assets. As shown in column (3) of Table 14, the GDC policy coefficient for corporate sustainability is 0.0219 and significant at the 1% level. The HHI_inter coefficient is −0.0555 and significant at the 1% level. This indicates that in more competitive industries, GDC policy has a stronger driving effect on corporate sustainability. Hypothesis H5 is therefore supported.

7. Discussion

7.1. Comparison with Prior Research

The findings of this study are consistent with, and extend, the emerging evidence on green data center policy. Meng et al. [30] find that the pilot improves ESG performance through reduced compliance risk and a stronger green reputation; our results are consistent with that finding and show that the improvement extends to a broader triple-bottom-line sustainability measure and operates through green innovation, financing, and governance channels. Yin and Wang [8] document carbon-emission reductions from the green transformation of data centers, and Wang et al. [9] document productivity gains; our evidence complements theirs by identifying the firm-level capability and governance conditions under which such gains are realized. The green-innovation channel is also consistent with the broader quasi-experimental literature on environmental policy and green innovation, including evidence that carbon-trading schemes stimulate corporate green innovation in China [55] and that raising the cost of polluting technologies redirects innovation toward cleaner alternatives [38]. The financing channel is consistent with international evidence that stronger environmental and social performance improves access to finance [41], and the positive overall effect is consistent with evidence that corporate sustainability behavior can raise financial performance [37]. Relative to this literature, the contribution of the present study lies in providing convergent causal evidence, opening the transmission mechanism, and specifying the boundary conditions of the effect within a single “pressure-to-capability” framework.

7.2. Addressing Estimation Bias

Because policy adoption is not random, several sources of bias could threaten a causal interpretation, and the design addresses each in turn. Time-invariant firm heterogeneity and common macro shocks are absorbed by firm and year fixed effects. Selection on observable characteristics is addressed by 1:3 nearest-neighbor propensity-score matching, which leaves the estimate essentially unchanged. Endogeneity from omitted time-varying factors and reverse causality is addressed by the shift-share instrumental-variable strategy, whose first stage is strong and whose over-identification test does not reject instrument exogeneity. The influence of unobserved shocks is assessed by a placebo test based on 500 randomized pseudo-treatments, and heterogeneous-timing bias in the staggered design is assessed by the Goodman-Bacon decomposition, which shows that the estimate is driven overwhelmingly by clean comparisons with never-treated firms. Finally, the influence of outliers and measurement error is limited by winsorizing all continuous variables at the 1% level. The convergence of these methods, rather than any single specification, supports the causal reading of the results.

7.3. Theoretical Implications

This study offers three theoretical implications. First, it extends institutional theory by showing that a coercive policy shock does not stop at legitimacy-seeking compliance but is converted into a measurable, firm-level sustainability advantage, and it identifies the intermediate steps of that conversion. Second, it operationalizes the natural-resource-based view by specifying and testing the concrete capability paths, green innovation, financing, and governance, through which external environmental pressure becomes an internal competitive resource. Third, by embedding the technology–organization–environment framework as the set of boundary conditions, it moves the analysis from an average treatment effect to a contingent one, and clarifies that the effectiveness of environmental policy depends on the fit between the internal capabilities of the firm and its external institutional environment.

7.4. Practical Implications

This study shows that the GDC pilot improves corporate sustainability. Its transmission mechanism works by increasing green innovation output and technical value, easing financing frictions, and strengthening corporate green governance. Meanwhile, the policy effect shows significant heterogeneity in technological capability, organizational capability and external context. Given slowing economic growth and the dual pressures of digital and low-carbon transition, the optimization of GDC policy design and policy governance efficiency leads to the following policy suggestions.
First, GDC pilot scope should be steadily expanded, and a dynamic “evaluation-feedback-optimization” governance mechanism should be established. Given the positive effect of the policy on corporate sustainability, pilot scope can be extended from key cities to central-western regions and areas with concentrated high-energy-consuming industries. Meanwhile, an annual dynamic evaluation system can be established with power usage effectiveness, carbon-emission intensity, and renewable-energy utilization as core indicators. For enterprises that meet the standards, tax reductions and electricity price incentives could be offered, while for backward enterprises, warning and rectification requirements should be imposed, thus forming a closed-loop governance mechanism. In addition, policy effects should be regularly evaluated using quantitative methods, and energy efficiency standards should be updated as technological progress and industrial transformation advances, so as to ensure the realization and continuous optimization of policy goals.
Second, a green-innovation incentive system covering both “quantity and quality” should be established. Given that the policy plays a role through the dual mediation effect of green innovation output and technical value, special GDC technology funds should be established, to support R&D and industrialization of key technologies such as high-efficiency cooling, waste heat recovery, and smart operation and maintenance. Evaluation standards that overemphasize patent counts should be adjusted, and quality indicators such as patent citation frequency, technology commercialization rate, and participation in industry standard formulation should be incorporated into high-tech enterprise certification and R&D expense super-deduction assessments. This can guide firms from quantity-focused innovation toward coordinated improvement in quantity and quality. Meanwhile, an fast examination channel for green patents should be established to shorten the grant cycle of high-quality green technologies.
Third, green finance and GDC policy should be further coordinated. To fully leverage the effect of this policy in easing financing frictions, financial regulatory departments and ecological and environmental authorities could jointly establish a “GDC project library”. For eligible enterprises, their PUE, carbon emission, green-electricity use ratio and other key performance indicators could be linked to fast-track green-credit and green bond approval channels. Financial institutions could be encouraged to develop sustainable-development-linked loan products based on energy efficiency performance, and interest-rate preferences could be offered to firms that continuously meet the required standards. Meanwhile, a national GDC industry guidance fund can be established to support small and medium-sized enterprises with strong technological potential but financing difficulties through equity investment, thereby forming a positive cycle of “policy guidance, financial support, enterprise transformation”.
Fourth, green governance requirements should be more deeply embedded into corporate governance structure. Because the policy promotes sustainability through green governance, the China Securities Regulatory Commission and stock exchanges could require major data-center operators and enterprises in high-energy-consuming industries to establish board-level green governance committees. Environmental performance indicators should also enter executive compensation assessment. Meanwhile, environmental information disclosure templates should be unified, and quantitative data such as data center energy consumption, carbon emission and renewable energy consumption should be disclosed mandatorily. Independent third-party verification should also be introduced to enhance information comparability and credibility, thereby improving coordination between external supervision and internal control.
Fifth, region-specific and industry-specific implementation strategies should be adopted to improve adaptability to the external environment. Given that the policy effect is stronger under stricter environmental regulation and more intense market competition, when central-level policies are implemented locally, local governments could be allowed to appropriately tighten energy efficiency standards according to regional environmental capacity and industrial structure, and increase environmental law enforcement frequency. For sectors with higher concentration and weaker competition, competitive pressure can be introduced through the energy-efficiency “leader” system, disclosure of industry comparison results, and green procurement lists, thereby strengthening firms’ internal motivation for green transformation. In addition, graded and classified support plans should be designed according to firm-level heterogeneity, including digital-transformation level, technical staff proportion, and internal-control quality, to improve policy accuracy.

8. Conclusions

8.1. Main Findings

Using Shanghai and Shenzhen A-share listed firms during 2010–2024, this study treats the 2015 “National Green Data Center Pilot Work Plan” as a quasi-natural experiment, applies a DID model, and investigates how GDC policy affects corporate sustainability through different channels. The main conclusions are as follows.
First, the GDC pilot improves corporate sustainability. After firm and year fixed effects are controlled, the policy variable remains positive and significant for the composite sustainability index at the 1% level, and the effect is robust to the instrumental-variable, propensity-score-matching, placebo, and decomposition checks. This suggests that policy design oriented toward energy efficiency and green transformation can be converted into sustainable firm advantages.
Second, the GDC pilot influences corporate sustainability through three channels: it raises both the output and the quality of green innovation, reduces financing constraints through the disclosure of energy-use and carbon-emission indicators and national strategic signals, and embeds environmental management into board responsibilities and executive appraisal, which strengthens green-governance capabilities.
Third, the policy effect differs across the technological, organizational, and external-environment dimensions. The effect is more evident in firms with a higher level of digital transformation, a larger share of technical employees, stronger internal control, and greater executive green awareness, and in contexts with stricter regional environmental regulation and more intense market competition. The effectiveness of GDC policy therefore depends on the fit between the internal capabilities of the firm and its external institutional environment.
Overall, by combining institutional theory with the resource-based view, this study clarifies the underlying logic and boundary conditions of GDC policy in promoting corporate sustainability, and offers new evidence for understanding the coordinated governance of digitalization and low-carbon transition.

8.2. Limitations and Future Research

This study has several limitations that also point to directions for future research. First, the sample covers Chinese A-share listed firms, so the external validity of the findings to unlisted firms, small and medium-sized enterprises, and other institutional settings is limited; comparative cross-country evidence would help establish the scope conditions of the mechanism. Second, corporate sustainability is measured by a composite index that combines ROA with Huazheng ESG environmental and social scores; although this measure is comprehensive, it inherits the known divergence across ESG rating providers, and future work could test the robustness of the results to alternative sustainability measures. Third, the instrumental-variable strategy rests on a shift-share exclusion restriction that, like all such designs, cannot be tested directly; future research could exploit additional exogenous shocks or finer geographic variation. Fourth, the mechanism tests identify the average operation of the three channels but do not fully capture their dynamic interaction over the policy cycle; longitudinal and qualitative evidence could open these channels further.

Author Contributions

Conceptualization, J.Z. and R.Y.; methodology, J.Z.; software, J.Z.; validation, J.Z. and R.Y.; formal analysis, J.Z.; investigation, J.Z.; resources, J.Z.; data curation, J.Z.; writing—original draft preparation, J.Z. and R.Y.; writing—review and editing, J.Z. and R.Y.; visualization, R.Y.; supervision, J.Z.; project administration, J.Z.; funding acquisition, J.Z. All authors have read and agreed to the published version of the manuscript.

Funding

This research was funded by the National Social Science Fund of China (Grant No. 21XJY016).

Institutional Review Board Statement

Not applicable.

Informed Consent Statement

Not applicable.

Data Availability Statement

The original contributions presented in this study are included in the article. Further inquiries can be directed to the corresponding author.

Acknowledgments

We express our gratitude to the reviewers and editors for their invaluable recommendations in revising and enhancing the manuscript.

Conflicts of Interest

The authors declare no conflicts of interest.

Abbreviations

The following abbreviations are used in this manuscript:
GDCgreen data center
CSRCChina Securities Regulatory Commission
DIDdifference-in-differences
2SLStwo-stage least squares
PSMpropensity score matching
TOEtechnology–organization–environment

References

  1. Wang, Y.; Yao, G.; Zuo, Y.; Wu, Q. Implications of global carbon governance for corporate carbon emissions reduction. Front. Environ. Sci. 2023, 11, 1071658. [Google Scholar] [CrossRef] [Scilit]
  2. Guo, M.; Wang, H.; Kuai, Y. Environmental regulation and green innovation: Evidence from heavily polluting firms in China. Financ. Res. Lett. 2023, 53, 103624. [Google Scholar] [CrossRef] [Scilit]
  3. Hart, S.L. A natural-resource-based view of the firm. Acad. Manag. Rev. 1995, 20, 986–1014. [Google Scholar] [CrossRef] [Scilit]
  4. Al-Shaer, H.; Hussainey, K. Sustainability reporting beyond the business case and its impact on sustainability performance: UK evidence. J. Environ. Manag. 2022, 311, 114883. [Google Scholar] [CrossRef] [Scilit]
  5. Masanet, E.; Shehabi, A.; Lei, N.; Smith, S.; Koomey, J. Recalibrating global data center energy-use estimates. Science 2020, 367, 984–986. [Google Scholar] [CrossRef] [Scilit] [PubMed]
  6. Dastbaz, M.; Pattinson, C.; Akhgar, B. Green Information Technology: A Sustainable Approach; Morgan Kaufmann: Burlington, MA, USA, 2015. [Google Scholar]
  7. Lei, C.F.; Ngai, E.W.T.; Lo, C.W.H.; See-To, E.W.K. Green IT/IS adoption and environmental performance: The synergistic roles of IT–business strategic alignment and environmental motivation. Inf. Manag. 2023, 60, 103886. [Google Scholar] [CrossRef] [Scilit]
  8. Yin, Z.; Wang, H. The impact of green transformation in data centers on corporate carbon emission reduction: Empirical evidence from China. Environ. Dev. Sustain. 2026, 28, 9483–9505. [Google Scholar]
  9. Wang, C.; Zhao, Y.; Zhang, Y.; Li, D. Environmental sustainability and firm performance: Unpacking the productivity effects of green data center pilots. J. Environ. Manag. 2025, 395, 127764. [Google Scholar] [CrossRef] [Scilit]
  10. Schaltegger, S.; Lüdeke-Freund, F.; Hansen, E.G. Business models for sustainability: A co-evolutionary analysis of sustainable entrepreneurship, innovation, and transformation. Organ. Environ. 2016, 29, 264–289. [Google Scholar] [CrossRef] [Scilit]
  11. Hahn, T.; Pinkse, J.; Preuss, L.; Figge, F. Tensions in corporate sustainability: Towards an integrative framework. J. Bus. Ethics 2015, 127, 297–316. [Google Scholar]
  12. Scherer, A.G.; Rasche, A.; Palazzo, G.; Spicer, A. Managing for political corporate social responsibility: New challenges and directions for PCSR 2.0. J. Manag. Stud. 2016, 53, 273–298. [Google Scholar] [CrossRef] [Scilit]
  13. Cantele, S.; Landi, S.; Vernizzi, S. Measuring corporate sustainability in its multidimensionality: A formative approach to integrate ESG and triple bottom line approaches. Bus. Strategy Environ. 2024, 33, 7383–7408. [Google Scholar] [CrossRef] [Scilit]
  14. Berg, F.; Kölbel, J.F.; Rigobon, R. Aggregate confusion: The divergence of ESG ratings. Rev. Financ. 2022, 26, 1315–1344. [Google Scholar] [CrossRef] [Scilit]
  15. Drempetic, S.; Klein, C.; Zwergel, B. The Influence of Firm Size on the ESG Score: Corporate Sustainability Ratings Under Review: S. Drempetic. J. Bus. Ethics 2020, 167, 333–360. [Google Scholar]
  16. Kyaw, K.; Treepongkaruna, S.; Jiraporn, P. Board gender diversity and environmental emissions. Bus. Strategy Environ. 2022, 31, 2871–2881. [Google Scholar] [CrossRef] [Scilit]
  17. Nuber, C.; Velte, P. Board gender diversity and carbon emissions: European evidence on curvilinear relationships and critical mass. Bus. Strategy Environ. 2021, 30, 1958–1992. [Google Scholar] [CrossRef] [Scilit]
  18. Yu, E.P.; Van Luu, B.; Chen, C.H. Greenwashing in environmental, social and governance disclosures. Res. Int. Bus. Financ. 2020, 52, 101192. [Google Scholar] [CrossRef] [Scilit]
  19. Garad, A.; Khalifa, M. Green innovation and firm performance: The role of environmental management practices. Int. J. Green. Manag. Bus. Stud. 2024, 4, 1–10. [Google Scholar] [CrossRef] [Scilit]
  20. Liu, J.; Xiong, X.; Gao, Y.; Zhang, J. The impact of institutional investors on ESG: Evidence from China. Account. Financ. 2023, 63, 2801–2826. [Google Scholar]
  21. Wang, Y.; Fu, C.; Zou, J.; Chang, W. The Dark Side of Site Visits: How Institutional Investors Unintentionally Foster ESG Greenwashing. Econ. Anal. Policy 2026, 91, 355–371. [Google Scholar] [CrossRef] [Scilit]
  22. Long, S.; Liao, Z. Would consumers pay for environmental innovation? The moderating role of corporate environmental violations. Environ. Sci. Pollut. Res. 2021, 28, 29075–29084. [Google Scholar] [CrossRef] [Scilit]
  23. Gu, H.; Rasiah, R.; Ge, H. Corporate sustainable development performance, green marketing, and consumer preferences. Financ. Res. Lett. 2025, 86, 108368. [Google Scholar] [CrossRef] [Scilit]
  24. Zhang, D. Green credit regulation, induced R&D and green productivity: Revisiting the Porter Hypothesis. Int. Rev. Financ. Anal. 2021, 75, 101723. [Google Scholar] [CrossRef] [Scilit]
  25. Dechezleprêtre, A.; Nachtigall, D.; Venmans, F. The joint impact of the European Union emissions trading system on carbon emissions and economic performance. J. Environ. Econ. Manag. 2023, 118, 102758. [Google Scholar] [CrossRef] [Scilit]
  26. Ren, X.; Ma, Q.; Sun, S.; Ren, X.; Yan, G. Can China’s carbon trading policy improve the profitability of polluting firms: A retest of Porter’s hypothesis. Environ. Sci. Pollut. Res. 2023, 30, 32894–32912. [Google Scholar] [CrossRef] [Scilit]
  27. Dospinescu, N. A Study on Ethical Communication in Business. In Proceedings of the 3rd International Scientific Conference ITEMA 2019, Association of Economists and Managers of the Balkans, Belgrade, Slovakia, 24 October 2019; pp. 165–172. [Google Scholar]
  28. Li, G.; Sun, Z.; Wang, Q.; Wang, S.; Huang, K.; Zhao, N.; Di, Y.; Zhao, X.; Zhu, Z. China’s green data center development: Policies and carbon reduction technology path. Environ. Res. 2023, 231, 116248. [Google Scholar] [CrossRef] [Scilit] [PubMed]
  29. Lin, W.; Lin, J.; Peng, Z.; Huang, H.; Lin, W.; Li, K. A systematic review of green-aware management techniques for sustainable data center. Sustain. Comput. Inform. Syst. 2024, 42, 100989. [Google Scholar] [CrossRef] [Scilit]
  30. Meng, Y.; Li, J.; Chen, W. Embedding environmental management in high-polluting firms: The role of green digital policy and collaborative innovation. J. Environ. Manag. 2025, 394, 127201. [Google Scholar] [CrossRef] [Scilit]
  31. Xie, X.; Han, Y.; Tan, H. Greening China’s digital economy: Exploring the contribution of the East–West Computing Resources Transmission Project to CO2 reduction. Humanit. Social. Sci. Commun. 2024, 11, 466. [Google Scholar] [CrossRef] [Scilit]
  32. Firsova, N. The Strategic Role of Cultural Risk Management in International Business. Businesses 2025, 6, 30. [Google Scholar] [CrossRef] [Scilit]
  33. DiMaggio, P.J.; Powell, W.W. The iron cage revisited: Institutional isomorphism and collective rationality in organizational fields. Am. Sociol. Rev. 1983, 48, 147–160. [Google Scholar] [CrossRef] [Scilit]
  34. Xiao, Y.; Zhang, B.; Wang, H. Research on the impact of environmental regulations on green technological innovation in China from the perspective of digital transformation: A threshold model approach. Environ. Res. Commun. 2024, 6, 035001. [Google Scholar] [CrossRef] [Scilit]
  35. Berrone, P.; Fosfuri, A.; Gelabert, L.; Gomez-Mejia, L.R. Necessity as the mother of “green” inventions: Institutional pressures and environmental innovations. Strateg. Manag. J. 2013, 34, 891–909. [Google Scholar] [CrossRef] [Scilit]
  36. Delmas, M.A.; Toffel, M.W. Organizational responses to environmental demands: Opening the black box. Strateg. Manag. J. 2008, 29, 1027–1055. [Google Scholar] [CrossRef] [Scilit]
  37. Flammer, C. Does corporate social responsibility lead to superior financial performance? A regression discontinuity approach. Manag. Sci. 2015, 61, 2549–2568. [Google Scholar] [CrossRef] [Scilit]
  38. Aghion, P.; Dechezlepretre, A.; Hemous, D.; Martin, R.; Van Reenen, J. Carbon taxes, path dependency, and directed technical change: Evidence from the auto industry. J. Political Econ. 2016, 124, 1–51. [Google Scholar] [CrossRef] [Scilit]
  39. Li, Z.; Lin, B. Quantity or quality? The impact assessment of environmental regulation on green innovation. Environ. Impact Assess. Rev. 2025, 110, 107726. [Google Scholar] [CrossRef] [Scilit]
  40. Pan, X.; Sinha, P.; Chen, X. Corporate social responsibility and eco-innovation: The triple bottom line perspective. Corp. Social. Responsib. Environ. Manag. 2021, 28, 214–228. [Google Scholar] [CrossRef] [Scilit]
  41. Cheng, B.; Ioannou, I.; Serafeim, G. Corporate social responsibility and access to finance. Strateg. Manag. J. 2014, 35, 1–23. [Google Scholar] [CrossRef] [Scilit]
  42. Soussi, J.C.; Aljaaidi, K.S.; Alwadani, N.F. Sustainable Environmental Governance and Corporate Environmental Performance: Empirical Evidence from Saudi Companies. J. Risk Financ. Manag. 2025, 18, 616. [Google Scholar] [CrossRef] [Scilit]
  43. Gan, Y.; Song, Q.; Lu, Z. Does digital transformation decrease firms’ natural dependence? Financ. Res. Lett. 2025, 86, 108490. [Google Scholar] [CrossRef] [Scilit]
  44. Javed, A.; Ashraf, J.; Yong, L. Synergistic effects of digital capability and human capital development on the twin green and digital transition: Evidence from carbon emissions and renewable energy adoption. J. Environ. Manag. 2026, 397, 128313. [Google Scholar] [CrossRef] [Scilit]
  45. Liu, X.; Pan, H.; Lin, W.; Wang, M.; Zhang, Q. Sustainable practices and performance of resource-based companies: The role of internal control. Sustainability 2024, 16, 1399. [Google Scholar] [CrossRef] [Scilit]
  46. Porter, M.E.; van der Linde, C. Toward a new conception of the environment-competitiveness relationship. J. Econ. Perspect. 1995, 9, 97–118. [Google Scholar] [CrossRef] [Scilit]
  47. Thienemann, A.K.; Bachmann, N.; Eisl, C.; Jodlbauer, H. Sustainable Value Added: Proposition of a Leading Performance Indicator and Its Drivers. Circ. Econ. Sustain. 2025, 5, 4349–4387. [Google Scholar] [CrossRef] [Scilit]
  48. Zhang, C.; Chen, D. Do environmental, social, and governance scores improve green innovation? Empirical evidence from Chinese-listed companies. PLoS ONE 2023, 18, e0279220. [Google Scholar] [CrossRef] [Scilit] [PubMed]
  49. Whited, T.M.; Wu, G. Financial constraints risk. Rev. Financ. Stud. 2006, 19, 531–559. [Google Scholar] [CrossRef] [Scilit]
  50. Ji, D.; Jing, L.; Kong, L. Executives’ environmental awareness and corporate green technology innovation: Evidence from textual analysis. Emerg. Mark. Financ. Trade 2026, 62, 1000–1022. [Google Scholar]
  51. Goodman-Bacon, A. Difference-in-differences with variation in treatment timing. J. Econom. 2021, 225, 254–277. [Google Scholar] [CrossRef] [Scilit]
  52. Chen, H.; Dong, W.; Han, H.; Zhou, N. A comprehensive and quantitative internal control index: Construction, validation, and impact. Rev. Quant. Financ. Account. 2017, 49, 337–377. [Google Scholar]
  53. Osborne, J.D.; Stubbart, C.I.; Ramaprasad, A. Strategic groups and competitive enactment: A study of dynamic relationships between mental models and performance. Strateg. Manag. J. 2001, 22, 435–454. [Google Scholar] [CrossRef] [Scilit]
  54. Duriau, V.J.; Reger, R.K.; Pfarrer, M.D. A content analysis of the content analysis literature in organization studies: Research themes, data sources, and methodological refinements. Organ. Res. Methods 2007, 10, 5–34. [Google Scholar] [CrossRef] [Scilit]
  55. Chen, Z.; Zhang, X.; Chen, F. Do carbon emission trading schemes stimulate green innovation in enterprises? Evidence from China. Technol. Forecast. Social. Change 2021, 168, 120744. [Google Scholar] [CrossRef] [Scilit]
Figure 1. Normality diagnostics for corporate sustainability. The (left) panel plots the histogram of CS against a fitted normal density; the (right) panel is the normal quantile–quantile plot. Note: N = 36,786. The solid curve in the (left) panel is the fitted normal density; the straight line in the (right) panel is the 45-degree reference line.
Sustainability 18 07464 g001
Figure 2. CS parallel-trends test. Note: The markers are point estimates and the vertical bars are 95% confidence intervals; the period immediately before treatment is the omitted base period.
Sustainability 18 07464 g002
Figure 3. CS placebo test. Note: The density is estimated from 500 random pseudo-treatment assignments; the vertical dashed line marks the true baseline estimate (0.0217).
Sustainability 18 07464 g003
Table 1. Pilot enterprise cities under GDC policies.
BatchPilot YearCities Covered by Pilot Enterprises
Pilot Batch2015Shanghai, Dongguan, Zhongwei, Linyi, Beijing, Nanjing, Nanning, Harbin, Daqing, Tianjin, Changzhou, Guangzhou, Langfang, Chengdu, Panzhihua, Wuxi, Liuzhou, Wuhan, Jinan, Shenzhen, Weifang, Yantai, Mudanjiang, Zhuhai, Liaocheng, Suzhou, Guiyang, Chongqing, Yinchuan, Ya’an, Qingdao
First Batch2018Foshan, Anshun
Second Batch2020Lishui, Ulanqab, Karamay, Hefei, Jilin, Hohhot, Ningbo, Suzhou (Anhui), Suqian, Zhangjiajie, Hangzhou, Shenyang, Huzhou, Fuzhou, Zhengzhou, Chenzhou, Ordos, Changsha
Third Batch2021Lanzhou, Nanchang, Nantong, Zhangjiakou, Huizhou, Yangzhou, Shaoxing, Xi’an, Jinchang, Yangquan
Fourth Batch2022Shanwei, Guiyang, Nanjing, Zhengzhou, Taiyuan, Wuhan, Shenzhen, Zhangjiakou, Zhongwei, Ulanqab, Guangzhou, Langfang, Datong, Shanghai, Tianjin, Hefei, Heyuan, Mianyang, Jingdezhen, Yingtan, Shangrao, Hangzhou, Zhoushan, Shaoxing, Beijing, Chengdu, Lanzhou, Ningbo, Changsha, Jiaxing
Fifth Batch2023Xining, Yangzhou, Nanjing, Lanzhou, Shaoxing, Guiyang, Jinhua, Ningbo, Nanning, Haidong, Chongqing, Shanwei, Qingdao, Dalian, Jiujiang, Changzhou, Beijing, Chengdu, Guangzhou, Langfang, Danjiangkou, Hangzhou, Datong, Ulanqab, Shanghai, Zhengzhou, Baoding, Yingtan, Shangrao, Nanchang, Jining, Yichun, Taiyuan, Xi’an, Fuzhou, Hefei, Jinan
Note: The table lists the cities of the pilot enterprises in each batch of the National Green Data Center program. Source: compiled by the authors from the pilot lists issued by the Ministry of Industry and Information Technology.
Table 2. Descriptive statistics.
VariableObs.MeanS.D.Min.MedianMax.Skew.Kurt.
CS36,7860.39190.16660.00030.38981.0000−0.0782.422
inter36,7860.40470.49080.00000.00001.00000.3881.151
Size36,78622.27741.31989.000022.084526.45230.4895.502
LEV36,7860.42810.20640.05930.42110.89270.1872.219
INV36,7860.13810.12780.00000.10900.77782.0678.397
Growth36,7860.14060.3835−0.65440.08723.80823.06020.798
Loss36,7860.17370.37880.00000.00001.00001.7233.968
Top36,7860.33510.14900.07400.31100.75840.5382.668
GDP36,78618.30951.161313.193618.469020.1057−0.4782.535
ISU36,7860.57480.12420.09760.56910.85270.1852.556
Note: Obs. denotes the number of observations and S.D. the standard deviation; Skew. and Kurt. denote skewness and kurtosis. All continuous variables are winsorized at the 1% level.
Table 3. Correlation matrix and variance inflation factors.
VariablesCSInterSizeLEVINVGrowthLossTopGDPISUVIF
CS1.00
inter0.1491.00 1.71
Size0.2690.0591.00 1.40
LEV0.087−0.0240.4611.00 1.48
INV0.031−0.0900.0890.2741.00 1.10
Growth−0.050−0.1040.0310.0350.0441.00 1.04
Loss−0.0470.097−0.0910.182−0.008−0.1641.00 1.15
Top0.040−0.0590.2030.0490.0390.017−0.1461.00 1.07
GDP0.0530.6290.058−0.045−0.025−0.0430.027−0.0021.00 2.55
ISU−0.0040.4630.106−0.015−0.049−0.0400.0540.0230.6951.001.97
Note: The mean VIF is 1.50. VIFs are computed from the baseline specification; CS is the dependent variable.
Table 4. Baseline regression estimates results.
Variables(1)(2)(3)(4)(5)
CSCSCSCSCS
inter0.0228 ***0.0638 ***0.0230 ***0.0265 ***0.0217 ***
(4.391)(29.156)(8.311)(10.453)(4.086)
Size 0.0363 ***0.0337 ***0.0282 ***0.0292 ***
(49.266)(45.736)(18.143)(5.862)
LEV −0.0344 ***−0.0212 ***−0.0575 ***−0.0710 ***
(−7.100)(−4.404)(−8.022)(−5.362)
INV 0.0393 ***0.0525 ***0.0381 ***0.0397 *
(5.827)(7.875)(3.200)(1.861)
Growth −0.0215 ***−0.0144 ***−0.0111 ***−0.0074 ***
(−9.841)(−6.588)(−5.888)(−3.050)
Loss −0.0149 ***−0.0231 ***−0.0038 *−0.0063 ***
(−6.433)(−10.019)(−1.713)(−2.842)
Top −0.00880.00480.0204 *0.0287
(−1.548)(0.856)(1.742)(1.659)
GDP −0.00020.0026 **0.0697 ***0.0243
(−0.163)(2.273)(16.546)(1.344)
ISU −0.1606 ***−0.1647 ***−0.0524 **−0.0323
(−17.321)(−17.791)(−2.348)(−0.861)
_cons0.3215 ***−0.3284 ***−0.3621 ***−1.4781 ***−0.6968 **
(81.953)(−14.082)(−15.552)(−22.591)(−2.043)
Firm fixed effectsYesNoNoYesYes
Year fixed effectsYesNoYesNoYes
N36,43836,78636,78636,43836,438
R20.50100.10670.13300.49730.5081
Adj. R20.43430.10650.13240.43020.4421
F326.02488.00245.11355.81464.95
Note: ***, **, and * indicate statistical significance at the 1%, 5%, and 10% levels, respectively.
Table 5. Endogeneity test: FE-2SLS with a Bartik instrument.
Variables(1)(2)
First Stage: InterSecond Stage: CS
DistFiber × Year−0.0003 ***
(−5.990)
inter 0.0676 ***
(3.730)
Size−0.00030.0291 ***
(−0.040)(6.013)
LEV0.0822 ***−0.0751 ***
(3.094)(−5.859)
INV−0.1068 *0.0444 **
(−1.959)(2.361)
Growth−0.0056−0.0074 ***
(−1.560)(−2.969)
Loss−0.0005−0.0070 ***
(−0.075)(−3.049)
Top−0.06000.0292 *
(−1.515)(1.708)
GDP0.4279 **−0.0063
(2.198)(−0.323)
ISU−0.2657−0.0184
(−0.590)(−0.458)
Kleibergen-Paap rk LM10.32 [0.001]
Kleibergen-Paap rk Wald F35.89
Firm FEYesYes
Year FEYesYes
N36,03136,031
Note: t-statistics are in parentheses; the p-value of the LM test is in brackets. The instrument is the historical communication-infrastructure density of the city interacted with the time dimension. ***, **, and * indicate significance at the 1%, 5%, and 10% levels, respectively.
Table 6. PSM-based estimates.
Variables(1)(2)
CSCS
inter0.0196 ***0.0193 ***
(4.319)(4.185)
Size 0.0200 ***
(9.083)
LEV −0.0371 ***
(−3.221)
INV 0.0213
(1.112)
Growth −0.0046
(−1.460)
Loss −0.0095 ***
(−2.661)
Top 0.0396 *
(1.942)
GDP −0.0014
(−0.069)
ISU −0.0103
(−0.188)
_cons0.3229 ***−0.0741
(46.764)(−0.198)
Firm fixed effectsYesYes
Year fixed effectsYesYes
N17,10317,103
R20.58080.5841
Adj. R20.45890.4628
F66.7548.35
Note: t-statistics are in parentheses. *** and * denote statistical significance at the 1% and 10% levels, respectively. The sample is the 1:3 nearest-neighbor matched sample.
Table 7. Robustness test results.
Variables(1)(2)(3)(4)(5)
CSWJCSCSCSCS
inter0.0101 ***0.0189 ***0.0210 ***0.0323 ***0.0104 **
(3.132)(3.557)(3.881)(6.350)(2.356)
Size0.0274 ***0.0293 ***0.0291 ***0.0260 ***0.0386 ***
(4.793)(5.798)(5.810)(6.879)(15.251)
LEV−0.0881 ***−0.0728 ***−0.0706 ***−0.0456 ***−0.1006 ***
(−9.279)(−5.533)(−5.271)(−2.834)(−9.741)
INV0.0417 ***0.0390 *0.0400 *0.0443 **0.0412 **
(4.595)(1.815)(1.874)(2.196)(2.259)
Growth−0.0150 ***−0.0074 ***−0.0074 ***−0.0068 ***−0.0030
(−10.823)(−3.040)(−3.050)(−2.992)(−1.084)
Loss−0.0190 ***−0.0062 ***−0.0064 ***0.00160.0005
(−11.801)(−2.805)(−2.847)(0.574)(0.159)
Top0.0306 ***0.0314 *0.02920.00690.0346 **
(3.170)(1.850)(1.680)(0.376)(2.108)
GDP−0.00330.02620.0252−0.00490.0237 **
(−0.280)(1.563)(1.393)(−0.267)(2.160)
ISU0.0049−0.0191−0.03350.0267−0.0062
(0.132)(−0.583)(−0.883)(0.559)(−0.167)
inter3 0.0102 *
(1.796)
inter4 0.0185
(1.277)
_cons−0.0097−0.7403 **−0.7101 **−0.1478−0.8543 ***
(−0.036)(−2.331)(−2.093)(−0.465)(−4.478)
Firm fixed effectsYesYesYesYesYes
Year fixed effectsYesYesYesYesYes
N36,13736,37436,43819,12916,680
R20.58240.50830.50820.63900.5047
Adj. R20.52590.44240.44220.57660.4382
F436.19629.14691.0178.7859.06
Note: t-statistics are in parentheses. ***, **, and * denote statistical significance at the 1%, 5%, and 10% levels, respectively. CSWJ is an alternative corporate-sustainability measure; inter3 and inter4 are the interaction terms for the National Big Data and Green Finance pilot policies. Control variables are included but not reported.
Table 8. Goodman-Bacon decomposition results.
DD ComparisonWeightAvg DD Est
Earlier T vs. Later C0.1160.035
Later T vs. Earlier C0.075−0.009
T vs. Never treated0.5430.029
T vs. Already treated0.266−0.002
Note: The two-way fixed-effects difference-in-differences estimator is decomposed following Goodman-Bacon [51]. T and C denote the treatment and control groups; the weights sum to one.
Table 9. Mediation test for green innovation.
Variables(1)(2)(3)(4)(5)
CSNGICSGIQCS
inter0.0217 ***0.0471 **0.0215 ***0.0549 ***0.0215 ***
(4.086)(2.408)(4.005)(4.399)(4.012)
Size0.0292 ***0.2108 ***0.0281 ***0.1267 ***0.0286 ***
(5.862)(4.243)(5.548)(4.139)(5.691)
LEV−0.0710 ***0.0008−0.0709 ***0.0145−0.0710 ***
(−5.362)(0.011)(−5.387)(0.276)(−5.354)
INV0.0397 *−0.02030.0399 *−0.04030.0399 *
(1.861)(−0.284)(1.864)(−0.664)(1.867)
Growth−0.0074 ***−0.0077−0.0074 ***−0.0283 ***−0.0073 ***
(−3.050)(−0.946)(−3.004)(−4.176)(−2.926)
Loss−0.0063 ***−0.0400 ***−0.0062 ***−0.0157−0.0063 ***
(−2.842)(−2.917)(−2.759)(−1.570)(−2.805)
Top0.0287−0.02590.02880.00070.0287
(1.659)(−0.250)(1.666)(0.009)(1.664)
GDP0.02430.15160.02350.10380.0238
(1.344)(1.472)(1.301)(1.577)(1.317)
ISU−0.03230.3016−0.03380.1211−0.0327
(−0.861)(0.775)(−0.909)(0.439)(−0.880)
NGI 0.0054 **
(2.533)
GIQ 0.0044 *
(1.942)
_cons−0.6968 **−7.2186 ***−0.6579 *−4.5986 ***−0.6767 *
(−2.043)(−3.770)(−1.917)(−4.020)(−1.975)
Firm fixed effectsYesYesYesYesYes
Year fixed effectsYesYesYesYesYes
N36,43836,43736,43736,43736,437
R20.50810.69340.50840.62530.5082
Adj. R20.44210.65230.44240.57510.4422
F464.95219.38426.37273.22443.05
Note: t-statistics are in parentheses. ***, **, and * denote statistical significance at the 1%, 5%, and 10% levels, respectively. NGI and GIQ denote green innovation quantity and quality, respectively. Control variables are included but not reported.
Table 10. Mediation test for financing constraints.
Variables(1)(2)(3)
CSWWCS
inter0.0217 ***−0.0336 **0.0214 ***
(4.086)(−2.374)(3.967)
Size0.0292 ***−0.0769 ***0.0284 ***
(5.862)(−6.379)(5.795)
LEV−0.0710 ***−0.2032 ***−0.0730 ***
(−5.362)(−8.384)(−5.362)
INV0.0397 *0.0996 ***0.0407 *
(1.861)(3.979)(1.899)
Growth−0.0074 ***−0.0493 ***−0.0079 ***
(−3.050)(−14.575)(−3.367)
Loss−0.0063 ***0.0280 ***−0.0061 **
(−2.842)(4.052)(−2.637)
Top0.0287−0.01430.0285
(1.659)(−0.567)(1.653)
GDP0.0243−0.00760.0242
(1.344)(−0.281)(1.340)
ISU−0.0323−0.1636 ***−0.0339
(−0.861)(−3.024)(−0.904)
WW −0.0101 **
(−2.644)
_cons−0.6968 **1.0356 *−0.6863 *
(−2.043)(1.952)(−2.019)
Firm fixed effectsYesYesYes
Year fixed effectsYesYesYes
N36,43836,43836,438
R20.50810.51880.5082
Adj. R20.44210.45430.4423
F464.951066.28559.41
Note: t-statistics are in parentheses. ***, **, and * denote statistical significance at the 1%, 5%, and 10% levels, respectively. WW denotes the Whited-Wu financing-constraint index; a higher value indicates tighter constraints. Control variables are included but not reported.
Table 11. Mediation test for corporate green governance.
Variables(1)(2)(3)
CSCGGCS
inter0.0217 ***0.0553 **0.0160 ***
(4.086)(2.542)(2.787)
Size0.0292 ***0.1928 ***0.0259 ***
(5.862)(3.656)(3.607)
LEV−0.0710 ***−0.1563 **−0.0961 ***
(−5.362)(−2.375)(−7.322)
INV0.0397 *0.2480 **0.0495 *
(1.861)(2.298)(1.904)
Growth−0.0074 ***−0.0489 ***−0.0051
(−3.050)(−4.735)(−1.663)
Loss−0.0063 ***−0.0569 ***−0.0037
(−2.842)(−3.662)(−1.354)
Top0.02870.6548 ***0.0098
(1.659)(5.838)(0.360)
GDP0.0243−0.02850.0078
(1.344)(−0.152)(0.245)
ISU−0.03230.0464−0.1002 *
(−0.861)(0.137)(−1.877)
CGG 0.0102 ***
(5.421)
_cons−0.6968 **−3.5086−0.2632
(−2.043)(−0.965)(−0.431)
Firm fixed effectsYesYesYes
Year fixed effectsYesYesYes
N36,43827,98127,981
R20.50810.61830.5178
Adj. R20.44210.55120.4330
F464.95335.73281.81
Note: t-statistics are in parentheses. ***, **, and * denote statistical significance at the 1%, 5%, and 10% levels, respectively. CGG denotes corporate green governance. Control variables are included but not reported.
Table 12. Heterogeneity by technological capability.
Variables(1)(2)(3)
CSCSCS
inter0.0217 ***0.0220 ***0.0258 ***
(4.086)(4.008)(4.795)
Size0.0292 ***0.0291 ***0.0284 ***
(5.862)(5.837)(5.432)
LEV−0.0710 ***−0.0701 ***−0.0690 ***
(−5.362)(−5.400)(−4.970)
INV0.0397 *0.03090.0370 *
(1.861)(1.494)(1.764)
Growth−0.0074 ***−0.0076 ***−0.0069 ***
(−3.050)(−3.154)(−2.844)
Loss−0.0063 ***−0.0064 ***−0.0066 ***
(−2.842)(−3.128)(−2.952)
Top0.02870.0294 *0.0219
(1.659)(1.743)(1.271)
GDP0.02430.02270.0265
(1.344)(1.259)(1.522)
ISU−0.0323−0.0324−0.0297
(−0.861)(−0.922)(−0.897)
DCG 0.0007
(0.514)
DCG_inter 0.0068 **
(2.382)
GJSRY −0.0130
(−1.326)
GJSRY_inter 0.0407 ***
(3.095)
_cons−0.6968 **−0.6710 *−0.7196 **
(−2.043)(−1.980)(−2.201)
Firm fixed effectsYesYesYes
Year fixed effectsYesYesYes
N36,43836,23235,527
R20.50810.50950.5103
Adj. R20.44210.44340.4435
F464.95587.15377.54
Note: t-statistics are in parentheses. ***, **, and * denote statistical significance at the 1%, 5%, and 10% levels, respectively. DCG denotes the level of digital transformation and GJSRY the share of technical personnel; DCG_inter and GJSRY_inter are their interactions with the policy. Control variables are included but not reported.
Table 13. Heterogeneity by organizational capability.
Variables(1)(2)(3)
CSCSCS
inter0.0217 ***0.0215 ***0.0275 ***
(4.086)(4.035)(5.528)
Size0.0292 ***0.0288 ***0.0337 ***
(5.862)(5.832)(9.881)
LEV−0.0710 ***−0.0694 ***−0.0749 ***
(−5.362)(−5.187)(−5.871)
INV0.0397 *0.0379 *0.0411 *
(1.861)(1.805)(1.973)
Growth−0.0074 ***−0.0077 ***−0.0077 ***
(−3.050)(−3.233)(−3.194)
Loss−0.0063 ***−0.0053 **−0.0043 *
(−2.842)(−2.251)(−2.001)
Top0.02870.02850.0313
(1.659)(1.658)(1.569)
GDP0.02430.02360.0201
(1.344)(1.301)(1.142)
ISU−0.0323−0.0332−0.0410
(−0.861)(−0.919)(−1.102)
NK 0.0024 ***
(3.046)
NK_inter 0.0051 ***
(2.844)
LSRZ 2.0468 ***
(7.833)
LSRZ_inter 0.9934 **
(2.376)
_cons−0.6968 **−0.6905 *−0.7286 **
(−2.043)(−2.022)(−2.286)
Firm fixed effectsYesYesYes
Year fixed effectsYesYesYes
N36,43836,32735,793
R20.50810.50860.5207
Adj. R20.44210.44270.4554
F464.95545.53558.47
Note: t-statistics are in parentheses. ***, **, and * denote statistical significance at the 1%, 5%, and 10% levels, respectively. NK denotes internal-control quality and LSRZ executive green awareness; NK_inter and LSRZ_inter are their interactions with the policy. Control variables are included but not reported.
Table 14. Heterogeneity by external context.
Variables(1)(2)(3)
CSCSCS
inter0.0217 ***0.0259 ***0.0219 ***
(4.086)(4.575)(4.034)
Size0.0292 ***0.0302 ***0.0294 ***
(5.862)(6.088)(5.890)
LEV−0.0710 ***−0.0716 ***−0.0719 ***
(−5.362)(−5.441)(−5.496)
INV0.0397 *0.0408 *0.0440 **
(1.861)(1.880)(2.202)
Growth−0.0074 ***−0.0077 ***−0.0070 ***
(−3.050)(−3.133)(−2.838)
Loss−0.0063 ***−0.0059 **−0.0072 ***
(−2.842)(−2.521)(−3.160)
Top0.02870.0301 *0.0271
(1.659)(1.759)(1.623)
GDP0.02430.02660.0234
(1.344)(1.556)(1.293)
ISU−0.0323−0.0229−0.0302
(−0.861)(−0.526)(−0.804)
HJGZ 0.0218 ***
(3.889)
HJGZ_inter 0.0347 ***
(2.814)
HHI −0.0874 **
(−2.471)
HHI_inter −0.0555 ***
(−2.788)
_cons−0.6968 **−0.7837 **−0.6763 *
(−2.043)(−2.402)(−1.968)
Firm fixed effectsYesYesYes
Year fixed effectsYesYesYes
N36,43835,77936,438
R20.50810.50840.5085
Adj. R20.44210.44180.4426
F464.951006.15715.25
Note: t-statistics are in parentheses. ***, **, and * denote statistical significance at the 1%, 5%, and 10% levels, respectively. HJGZ denotes environmental-regulation intensity and HHI the Herfindahl-Hirschman index of market concentration; HJGZ_inter and HHI_inter are their interactions with the policy. Control variables are included but not reported.
Disclaimer/Publisher’s Note: The statements, opinions and data contained in all publications are solely those of the individual author(s) and contributor(s) and not of MDPI and/or the editor(s). MDPI and/or the editor(s) disclaim responsibility for any injury to people or property resulting from any ideas, methods, instructions or products referred to in the content.