Article

How Does the Urban Functional Network Enhance Green Total-Factor Energy Efficiency? Empirical Evidence from Chinese Urban Agglomerations

1
School of Public Administration, Shandong Normal University, Jinan 250358, China
2
Institute for Carbon Neutrality, Shandong Normal University, Jinan 250014, China
*
Author to whom correspondence should be addressed.
Sustainability 2026, 18(14), 7426; https://doi.org/10.3390/su18147426
Submission received: 17 June 2026 / Revised: 15 July 2026 / Accepted: 16 July 2026 / Published: 20 July 2026

Abstract

Enhancing green total-factor energy efficiency (GTFEE) is a critical pathway for promoting the green transformation of economic and social development. However, the potential influence of the construction and development of urban functional networks (UFNs) on this process has received limited scholarly attention. Using panel data from 148 cities across nine major Chinese urban agglomerations from 2010 to 2023, this study finds the following: First, the development of UFNs at the urban agglomeration scale significantly enhances GTFEE. Second, UFNs improve GTFEE through two distinct mechanisms: “government action” and “market efficiency.” The “government action” mechanism primarily operates by promoting market integration, reducing land resource misallocation, and curbing urban sprawl. The “market efficiency” mechanism functions by enhancing factor mobility, optimizing the allocation of production factors, and accelerating the diffusion of green technological innovations. Third, the effect of UFNs on GTFEE varies according to local development conditions, infrastructure connectivity, and policy continuity and coordination. The enhancement effect is more pronounced in cities located near coastlines, those connected to other cities within the agglomeration by high-speed rail, and cities with longer-serving municipal Party secretaries. Fourth, urban agglomerations characterized by polycentric spatial structures and stronger agglomeration externalities are better able to leverage the functional node effects of their constituent cities, thereby further enhancing GTFEE.

1. Introduction

As the global energy transition and sustainable development agenda continue to advance, the traditional energy industry faces mounting challenges, including intensifying resource constraints and rising environmental costs. Consequently, continuously improving energy efficiency has become essential to balancing environmental protection with economic development [1]. Currently, China’s long-standing dependence on fossil fuels remains fundamentally unchanged, and the dual pressures of carbon emissions and energy intensity demand urgent resolution through an efficiency-oriented transformation. Against this background, improving GTFEE has become a critical pathway toward sustainable development [2].
At the same time, intensifying global competition has prompted cities to continuously restructure their functions and spatial organization. Driven by the networked expansion of infrastructure—such as information and communication technologies and rapid transportation systems—alongside the emergence of “spaces of flows,” urban regionalization has become an increasingly prominent trend [3]. In China, especially since the implementation of the New Urbanization Strategy, this trend toward networked spatial organization has become even more pronounced. UFNs, exemplified by urban agglomerations, have emerged as a pivotal spatial framework for supporting energy transition and economic development, playing a vital role in facilitating industrial upgrading, improving energy efficiency, and promoting economic growth—thereby serving as a key driving force in reshaping socio-economic development patterns [4,5].
As a result, improvements in China’s GTFEE are no longer dependent solely on the socio-economic development and policy decisions of individual cities; rather, they are increasingly shaped by both internal and external factors within UFNs, including factor mobility, resource allocation, policy coordination, and intercity interactions among cities within urban agglomerations. Given this, a thorough investigation into the impact of UFNs on GTFEE at the urban agglomeration scale carries substantial practical significance for easing energy and environmental constraints and advancing China’s “carbon peaking” and “carbon neutrality” goals. Furthermore, such research represents an important piece of the broader effort to promote the comprehensive green transformation of urban and regional socio-economic systems and to achieve high-quality economic development in China.

2. Literature Review

The relevant literature on this topic primarily falls into two strands. The first concerns the measurement methods and determinants of GTFEE. Current approaches to measuring energy efficiency fall into two broad categories: single-factor methods and total-factor energy-efficiency assessments. Single-factor measurements typically rely on energy intensity or energy productivity; although these methods are computationally straightforward, they often deviate from reality and fail to capture the interactions among multiple factors. By contrast, total-factor energy-efficiency assessments better capture the complex relationships between inputs and outputs across multiple factors, offering deeper insights into the interactions between resource-environmental and socio-economic systems [6]. Scholars frequently employ techniques including Data Envelopment Analysis (DEA), Stochastic Frontier Analysis (SFA), and the Super-SBM model in these assessments, and such studies have revealed significant spatiotemporal heterogeneity in total-factor energy efficiency across spatial and sectoral scales [7,8,9]. Research on the determinants of GTFEE, meanwhile, primarily focuses on enterprise-level and urban-level factors: at the enterprise level, studies examine the key drivers and constraints of corporate energy efficiency from the perspectives of industrial development, policy frameworks, and technological innovation [10,11], while at the urban level, studies emphasize market integration, environmental regulation, and industrial agglomeration and elucidate their impacts on energy efficiency [12,13,14]. In recent years, driven by the rapid global advancement of smart technologies and digitalization, scholars have increasingly explored the multidimensional effects of the digital economy, as well as the agglomeration and mobility of innovation factors, on GTFEE [15,16]. Yet these studies often overlook the significant influence of intercity interactions on energy-efficiency improvements, limiting both the scope of analysis and the explanatory power of their conclusions on GTFEE.
Second, existing research has extensively examined the spatial structural characteristics and impacts of functional networks at the urban–regional scale. Current studies primarily focus on conceptual frameworks related to the construction of polycentric spatial structures, borrowed size and network externalities, multilayered network positions, and embedding mechanisms. Building upon these frameworks, scholars have analyzed spatial structural characteristics from multiple dimensions, including the evolution of “core–periphery” relationships among cities and the hinterland patterns of urban networks [17,18]. In the last few years, the development of polycentric urban functional structures and the associated network externalities has attracted increasing scholarly attention. These studies place greater emphasis on the significance of urban nodes within polycentric systems and their multidimensional interconnections within functional networks. Meanwhile, flow data are widely used to reveal the interdependencies among urban entities across the functional network as a whole. Existing research has demonstrated the coexistence of borrowed-size effects within polycentric functional networks, the spatial manifestation of agglomeration shadow effects, and the heterogeneous impacts of network externalities [19,20]. However, these studies have largely overlooked the role of industrial specialization and collaboration—including inter-industry division of labor, intra-industry division of labor, and division of labor along industrial chains—in shaping urban–regional networks. Existing research on functional division of labor within urban agglomerations has also mostly followed a traditional economic analytical paradigm, such as measuring the degree of industrial-sector division of labor between central cities and peripheral cities within urban agglomerations. Nevertheless, this approach, which characterizes functional division of labor on the basis of differences in industrial functions, is limited in its ability to reveal the actual division-of-labor relationships formed through functional linkages [21,22]. Therefore, in recent years, an increasing number of studies have attempted to examine the economic and social impacts of functional networks within urban agglomerations by focusing on cross-regional industrial linkages and cooperative relationships established among firms, as well as the new “chain-like” production relationships formed between them [23]. As this line of research continues to evolve, some scholars have begun to explore the relationship between urban networks and energy efficiency [24]. However, current studies on urban functional networks and energy efficiency remain relatively fragmented, and few have systematically integrated the urban functional networks formed at the urban agglomeration scale with GTFEE within a unified analytical framework.
Compared with studies that use other countries and regions as spatial samples, the Chinese context differs significantly in terms of institutional dynamics, market structure, and spatial scale, thereby providing unique theoretical and empirical space for this study. Specifically, international research on urban networks and energy efficiency shows notable differences from the Chinese case in these three dimensions. In terms of institutional dynamics, metropolitan regions in most countries are primarily driven by spontaneous market forces, whereas Chinese urban agglomerations are deeply embedded in government-led regional integration strategies. As a result, the evolutionary trajectory of functional networks in China exhibits a stronger feature of institutional construction. In terms of market structure, factor markets in developed countries tend to be relatively mature, while the cross-city flow of factors in China still faces administrative barriers. Meanwhile, China’s industrial structure is undergoing dynamic spatial adjustments involving both agglomeration and diffusion, which may make the effect of functional networks on energy efficiency more sensitive to temporal and spatial conditions. In terms of spatial scale, most international studies focus on individual metropolitan areas, whereas research on Chinese urban agglomerations covers a complete hierarchical system ranging from central cities to peripheral hinterlands. This spatial hierarchy, together with multiple policy drivers such as China’s dual-carbon goals, provides rich institutional variation for testing the general applicability of network externality theory.
Based on the above two strands of research, three clear gaps remain in the exploration of the relationship between UFNs and GTFEE, which have not yet been fully aligned with the research concerns of this study. First, existing studies have mostly examined the relationship between the two at the city level, while insufficient attention has been paid to the urban–regional scale. In particular, the impact of functional linkages among cities within urban agglomerations on GTFEE has not been fully discussed. Second, existing explanations of the underlying mechanisms tend to rely on a single logic. Most studies either focus on market-driven factor flows and knowledge spillovers or emphasize the effects of a single policy instrument, such as environmental regulation, without sufficiently integrating the roles of the government and the market into a unified analytical framework. In particular, they have largely overlooked how local governments may enhance network effects through coordinated actions, such as promoting market integration and regulating the allocation of land resources. Third, existing research on the externalities of urban functional networks has rarely examined in depth how the three types of externalities—sharing, matching, and learning—affect GTFEE. In particular, there remains a lack of theoretical and empirical research on how these three types of externalities operate across different dimensions, such as government action and market effects.
This study’s contributions can be summarized in three aspects. First, from a research perspective, it extends the analytical focus beyond individual cities to the interactive relationships among cities and the UFNs in which they are embedded at the urban agglomeration scale, thereby proposing and empirically testing the impact of UFNs on GTFEE. Second, with regard to research content, this study employs a mechanism-based analytical framework incorporating both “government action” and “market efficiency” to elucidate the pathways through which UFNs influence GTFEE, thereby offering a novel perspective for related research. Third, from a theoretical standpoint, the study develops a comprehensive framework for analyzing the relationship between UFNs and GTFEE, thereby deepening our understanding of green socio-economic transformation at the urban–regional scale.

3. Theoretical Analysis and Research Hypotheses

3.1. The Underlying Logic: How Urban Functional Networks Influence Green Total-Factor Energy Efficiency at the Urban Agglomeration Scale

Agglomeration economics theory holds that agglomeration effects arise primarily from three forms of externalities—sharing, matching, and learning—which jointly determine their scope and intensity [25]. Given that urban agglomerations constitute a comprehensive spatial system composed of multiple urban units, their agglomeration effects inevitably transcend the administrative boundaries of individual cities, extending interactive relationships to the urban–regional scale. Moreover, as the division of labor and collaborative linkages among cities become increasingly integrated, agglomeration economies have gradually evolved toward networked forms, such that agglomeration externalities shift from geographically bounded regional externalities to network externalities—enabling cities within urban agglomerations, regardless of geographic proximity, to achieve “functional borrowing” through intercity functional connections [26].
Although agglomeration economics theory provides a micro-level foundation for understanding the sources of efficiency, the three types of externalities—sharing, matching, and learning—serve as the fundamental mechanisms through which cities generate scale returns and efficiency improvements. However, in the context of urban agglomerations, these mechanisms do not automatically transcend administrative boundaries. The formation of urban functional networks breaks this spatial constraint: it extends agglomeration externalities originally embedded within individual cities into network externalities that cross administrative boundaries, allowing cities to “borrow” the functional scale of other nodes in the network and obtain additional efficiency gains without expanding their own factor inputs [27]. However, relevant studies have shown that the efficiency boundary of network externalities is often constrained by the institutional environment. Therefore, institutional arrangements centered on cross-administrative collaboration, the definition of environmental rights and interests, and transaction rules become critical supports for smoothing network transmission and reducing institutional friction, ultimately determining the actual effectiveness with which network externalities can be released in an orderly manner [28,29].
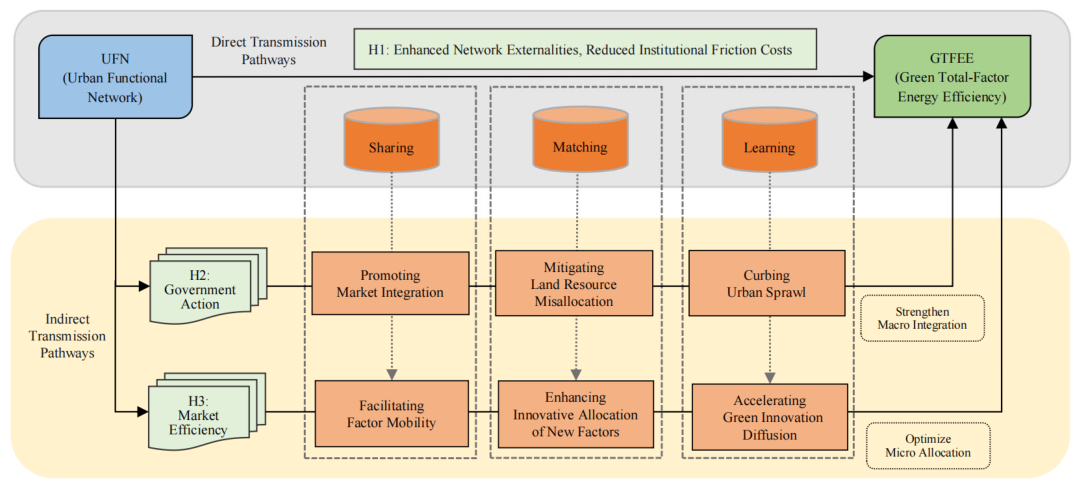
Based on this theoretical framework, cities embedded within functional networks at the urban agglomeration scale extend both the spatial scope and the effectiveness of agglomeration effects through three types of externalities—sharing, matching, and learning—which in turn promote the efficient flow and allocation of energy resources, contributing to improvements in GTFEE. First, from the “sharing” perspective, UFN establishment expands the scope of shared infrastructure and energy- and environment-related services from individual cities to the agglomeration as a whole. This reduces fixed energy consumption per unit of output and mitigates energy conversion and utilization losses stemming from redundant facility construction [30]. Moreover, UFN development reshapes industrial spatial organization, allowing byproducts or residual energy from one production stage to cross administrative boundaries and serve as substitute inputs elsewhere. Such mechanisms enable more efficient energy utilization across broader spatial scales, thereby enhancing GTFEE.
Second, from the “matching” perspective, UFNs foster a spatial environment conducive to efficient factor allocation by deepening intercity specialization and collaboration and establishing coordinated industrial-chain networks, thereby enhancing GTFEE. On one hand, the free flow of production factors—labor, capital, and technology—across cities reduces transaction costs in the matching process and minimizes unnecessary energy losses. On the other, the coordinated industrial-chain networks allow cities to sharpen factor matching, reducing energy waste and resource misallocation, and ultimately enhancing energy utilization efficiency [31]. Furthermore, UFN development provides a platform for cross-city transactions of scarce environmental resources, such as carbon emission permits and energy-use rights, facilitating the transfer of such rights from entities with lower marginal returns to those with higher returns—thereby achieving a more efficient spatial allocation of resources at lower economic and energy costs.
Finally, from the “learning” perspective, UFNs provide efficient channels for green and low-carbon technological innovation and knowledge diffusion by strengthening factor mobility and organizational interactions among cities. On one hand, process knowledge and managerial experience related to energy-efficiency improvements diffuse rapidly from innovation hubs to application areas through industrial division-of-labor networks and intercity personnel exchanges, narrowing the green technology gap among cities [32]. On the other, heterogeneous knowledge bases across network nodes may generate new technological combinations through frequent interaction, promoting the outward expansion of the green production frontier. This learning mechanism—spanning knowledge diffusion, recombination, and institutional imitation—constitutes a fundamental driving force behind the continuous improvement of GTFEE [33]. On this basis, the following hypothesis is proposed:
Hypothesis 1 (H1). 
At the urban agglomeration scale, the formation of UFNs is expected to significantly enhance GTFEE by reinforcing three types of agglomeration externalities among cities: sharing, matching and learning.

3.2. Mechanisms of Influence: Analysis Based on the Dimensions of “Government Action” and “Market Efficiency”

The relationship between government and the market, long a central issue in traditional economics, concerns their respective roles in resource allocation within a market economy. From a spatial-effects perspective, the interaction between government and the market determines both the level of resource agglomeration and the effectiveness of agglomeration externalities. In this context, it is necessary not only to fully leverage the market’s decisive role in resource allocation, but also to strengthen the government’s regulatory and coordinating functions, thereby promoting the integration of an effective market with an active government. Accordingly, UFN construction at the urban agglomeration scale can be understood as a process of institutional evolution driven by the dynamic interaction between “government action” and “market efficiency.” Meanwhile, profound transformations in the energy sector likewise demand coordinated efforts between government and market forces: while the market plays a pivotal role in resource allocation, the government must also fulfill its responsibilities in policy formulation, institutional coordination, and strategic support [34,35]. Building on this premise, this study develops a mechanism-based analytical framework grounded in the dual dimensions of “government action” and “market efficiency” to examine how UFNs influence GTFEE and elucidate the underlying mechanisms involved.

3.2.1. Mechanism Analysis Based on the “Government Action” Dimension

Market integration: Establishing a coordinated UFN can strengthen economic linkages among cities, gradually integrating markets previously fragmented by administrative boundaries. This process fosters unified market rules and the integration of both product and factor markets. By leveraging economies of scale and comparative advantages, UFNs can thus reduce redundant investment in clean energy infrastructure and lower transaction costs, allowing their synergistic effects to be more fully realized and thereby contributing to GTFEE improvements [36]. Beyond this, intergovernmental cooperation and coordination mechanisms embedded within UFNs enhance market information transparency, mitigating information barriers and asymmetries and reducing energy waste and resource misallocation—further advancing GTFEE [37].
Mitigating land-resource misallocation: China has long operated a dual land-supply system combining government regulation with market allocation. In practice, local governments, under dual pressures of inter-regional competition and performance evaluation, have often intensified administrative intervention in land-market supply, frequently driving land allocation away from the Pareto-optimal state and producing land-resource misallocation. Previous studies indicate that such misallocation exacerbates ecological encroachment and resource-environmental constraints, inhibiting GTFEE improvements [38,39]. At the urban agglomeration level, UFN construction can mitigate competition among local governments, thereby easing the ecological imbalances and resource-environmental constraints stemming from land-resource misallocation and supporting GTFEE enhancement. More specifically, multidimensional functional linkages among cities accelerate the aggregation and diffusion of factor resources, strengthen industrial division of labor and collaborative capabilities, and enhance the spatial allocation efficiency of land relative to other factors, facilitating increases in desired outputs and reductions in undesired outputs [5]. Importantly, cities can leverage the matching effects generated by UFNs to achieve precise alignment between land supply and demand, and that of other factors, reducing energy waste and resource misallocation and thus improving GTFEE.
Curbing urban sprawl: From an urban-economics perspective, the essence of functional networks at the urban agglomeration scale lies in achieving “decentralized centralization” through constructing a polycentric, specialized network-node system that leverages the agglomeration economies inherent in the network structure. Accordingly, UFN development helps curb low-density, disorderly urban sprawl while fostering a compact spatial structure within urban agglomerations [40,41]. On one hand, spatial proximity and high-density interactions foster conditions conducive to “learning by doing” in green knowledge and energy-saving technologies. On the other, frequent face-to-face interactions among enterprises, research and development institutions, and public-sector organizations arising from geographic agglomeration accelerate the spillover and diffusion of tacit green knowledge. Furthermore, this compact network structure facilitates demonstration, imitation, and policy learning of emission-reduction practices among neighboring cities, reducing the uncertainty of green transformation and sustaining continuous improvement in GTFEE [42].

3.2.2. Mechanism Analysis Based on the “Market Efficiency” Dimension

Facilitating the free flow of factors: By leveraging their multidimensional effects on factor flows, UFNs not only integrate and optimize interactive relationships among cities, but also facilitate the free cross-city movement of capital, labor, and energy through price signals. This factor circulation accelerates the networked diffusion of green technological knowledge and managerial experience, creating a knowledge-sharing pool that enables lagging cities within the urban agglomeration to adopt clean production solutions at lower costs [12,43]. Moreover, a unified market evaluation system directs factors toward areas of higher energy efficiency, achieving intensive energy-resource allocation through sharing. This mechanism enhances desired outputs while reducing undesired outputs, ultimately contributing to GTFEE improvements [44].
Enhancing the innovative allocation of new production factors: Driven by the integration of digital technologies with the real economy, the innovative allocation of new production factors constitutes a core driver of sustained productivity advancement. UFN development helps bridge digital divides among cities, facilitating precise cross-regional matching and deep digital–real economy integration, thereby establishing interconnected digital infrastructure and industrial internet platforms within urban agglomerations [45]. On this foundation, energy supply and demand information overcomes the limitations of traditional geographic fragmentation and becomes a data resource of higher market value. This reduces search costs and information asymmetry in energy transactions, enabling green energy and low-carbon intermediate goods to achieve precise supply–demand matching at a larger spatial scale [46]. Moreover, data-driven price signals direct capital toward high-energy-efficiency sectors, enabling enterprises to reallocate production factors—including land, energy, and technology—across the network according to comparative advantage. These mechanisms alleviate factor-misallocation inefficiencies, thereby promoting GTFEE improvements [14].
Accelerating green-innovation diffusion: Technological innovation and its subsequent diffusion are key drivers of continuous production-frontier advancement in cities. These processes enhance intercity learning capabilities by generating technological externalities and knowledge spillovers that transcend administrative boundaries. UFNs provide a spatial platform for cross-city dissemination of green innovation technologies through strengthened intercity industrial linkages and interactions among innovation actors [47]. Green technology patents and energy-saving emission-reduction processes held by leading enterprises achieve rapid cross-city diffusion and re-innovation through network connections—via mechanisms such as market transactions and technology licensing. In turn, lagging firms engage in imitation and “learning by doing,” undertaking adaptive redevelopment and secondary innovation of these green technologies. This enables firms to bypass lock-in to high-energy-consumption technologies and achieve leapfrog development in both technology and production at lower trial-and-error costs [48,49]. Consequently, these mechanisms increase desired outputs and reduce undesired outputs, thereby contributing to GTFEE improvements. On this basis, the following hypotheses are proposed:
Hypothesis 2 (H2). 
Within the “government action” dimension, UFNs enhance GTFEE through mechanisms such as facilitating market integration, reducing land resource misallocation, and curbing urban sprawl.
Hypothesis 3 (H3). 
Within the “market efficiency” dimension, UFNs promote GTFEE improvements by driving the free flow of production factors, enhancing the innovative allocation of new production factors, and accelerating the diffusion of green innovation technologies.
Figure 1 illustrates the theoretical mechanism of this study.

4. Research Design

4.1. Specification of the Econometric Model

To examine the impact of the urban functional network (UFN) on green total-factor energy efficiency (GTFEE), the following baseline regression model is specified:
GTFEE it = α 0 + α 1 UFN it + α 2 X it + ε it
where GTFEE it denotes the green total-factor energy efficiency of city i in year t ; UFN it denotes the functional network index of city i in year t ; X it denotes a set of control variables that may affect GTFEE it ; and ε denotes the random disturbance term.
To mitigate specification bias and address potential endogeneity concerns, this study further introduces the lagged dependent variable, GTFEE it , into Equation (1) as an explanatory variable, thereby constructing the following dynamic panel model:
GTFEE it = β 0 + β 1 GTFEE it 1 + β 2 UFN it + β 3 X it + ε it

4.2. Variable Selection

4.2.1. Dependent Variable: Green Total-Factor Energy Efficiency (GTFEE)

Traditional Data Envelopment Analysis (DEA) models generally adopt radial and oriented measurement approaches, which fail to capture the slackness of actual inputs and outputs, let alone evaluate efficiency under undesirable output constraints. To address these limitations, Tone proposed the non-radial, non-angular Slacks-Based Measure (SBM) model, which directly incorporates slack variables into the objective function. This approach not only resolves the slackness problem in input–output settings but also enables efficiency evaluation in the presence of undesirable outputs. Given these advantages, the SBM model has been widely applied in efficiency-evaluation studies [50]. Building on Tone’s approach, this study employs the super-efficiency SBM-DEA model to measure the GTFEE of 148 cities across nine major urban agglomerations in China from 2010 to 2023. The selected input indicators comprise labor, capital, and energy consumption. As labor quantity alone cannot adequately reflect regional differences in labor productivity, labor input is measured as the product of average years of education and total urban employment. The perpetual inventory method is employed, with 2000 as the base year, to estimate urban fixed capital stock, while total fixed-asset investment is used to measure capital accumulation. Given the absence of prefecture-level data on energy consumption, this study estimates energy use from three major energy sources—total urban electricity consumption, total natural gas supply, and total liquefied petroleum gas (LPG) supply—each converted into standard coal equivalents using corresponding conversion coefficients. Output indicators consist of both desirable and undesirable outputs. Real urban GDP is used as the desirable output, whereas the undesirable output is measured via a pollution emission index constructed through the entropy method, which incorporates indicators such as industrial sulfur dioxide emissions, industrial wastewater discharge, industrial particulate matter emissions, industrial nitrogen oxide emissions, and the annual average fine particulate matter concentration.

4.2.2. Core Explanatory Variable: Urban Functional Network Index (UFN)

Following Zhang et al.’s methodology, this study employs supply-chain relationship data from listed companies to construct functional division-of-labor linkages among cities [51]. Specifically, information on the top five customers and suppliers of manufacturing firms listed on the Shanghai and Shenzhen A-share markets was collected for each year across the 148 sample cities. Based on the registered office addresses of listed firms, customers, and suppliers, the corresponding cities and urban agglomerations were identified, thereby forming intercity relationship pairs. Building on these data, this study constructs a manufacturing supply-chain network in which cities serve as network nodes and intercity supply-chain relationships as network linkages. Social network analysis (SNA) methods are then applied to measure the network’s structural characteristics. Since the urban supply-chain network is a directed, weighted network, cities’ nodal characteristics within the functional network are analyzed using weighted out-degree and weighted in-degree centrality measures. Weighted centrality is then calculated to characterize each city’s functional network index within its urban agglomeration.
  UFN out ( i ) t = m = 1 n R out ( im ) t
where UFN out ( i ) t denotes the weighted out-degree of city i , reflecting its capacity to radiate supply linkages to downstream cities within the functional network, and R out ( im ) t denotes the sales amount from city i to city m within the functional network.
UFN in ( i ) t = m = 1 n R in ( im ) t
where UFN in ( i ) t denotes the weighted in-degree of city i, reflecting its capacity to receive supply linkages from upstream cities within the functional network, and R in ( im ) denotes the value of goods procured by city i from city m within the functional network.
UFN ( i ) t = UFN out ( i ) t + UFN in ( i ) t
where UFN ( i ) t is the sum of the weighted out-degree and weighted in-degree, representing city’s i comprehensive position within the supply-chain network—that is, its degree of functional integration within the urban agglomeration.

4.2.3. Mechanism Variables

The institutional variables in this study encompass two dimensions. Under the “active government” dimension, three variables are considered: market integration (ln MAR), land resource misallocation (LRM), and urban sprawl (SPR). Under the “effective market” dimension, three variables are included: labor factor mobility (LFM), the innovative allocation of new production factors (DRI), and the diffusion of innovative technologies (ln EPC). Market integration is calculated using the Price Method, which computes the square root of the reciprocal of market segmentation between cities within the urban agglomeration and other cities, yielding a market integration index. Land resource misallocation (LRM) is measured as the ratio of the average price of commercial and service land to that of industrial land. The urban sprawl variable is operationalized through a population–land nexus perspective, whereby the observed growth of urban construction land is decomposed into essential growth that accommodates the basic needs of the incremental population and excessive growth that surpasses reasonable demand. With 2010 as the base year, urban sprawl is then measured as the share of excessive urban construction land growth in total growth.
The factor mobility variable under the “Effective Market” dimension applies the gravity model to analyze the spatial associations of factor flows between cities, quantifying the strength of spatial linkages generated by labor mobility through a corresponding spatial association matrix. As a key vehicle for technological innovation, patent citation networks can effectively reflect the flow paths and allocation efficiency of innovative production factors in the integration of the digital and real economies.
Accordingly, the innovative allocation variable for new production factors is primarily constructed from patent citation data, capturing the flow of digital-industry knowledge into the technological innovation of the real economy. This approach measures the degree of technological integration between the digital and real economies among listed companies and aggregates these measures to characterize each city’s technological innovation capacity. The diffusion of innovative technologies is proxied by the number of citations received by green invention patents held by listed companies within a city, excluding self-citations.

4.2.4. Control Variables

This study establishes a set of control variables based on the existing literature. Specifically, the level of urbanization (UR) is measured as the proportion of the urban permanent resident population in the total population. The level of economic development (PGDP) is measured based on per capita GDP. The capital stock (KC) is estimated using 2006 as the base year. Fiscal expenditure (GOV) is measured as the ratio of municipal public fiscal expenditure to GDP. Foreign direct investment (ln FDI) is measured as the actual foreign capital utilized by each city. Attention to green development (AGD) is proxied by the frequency of environment-related terms in municipal government work reports.

4.2.5. Sample Selection and Data Sources

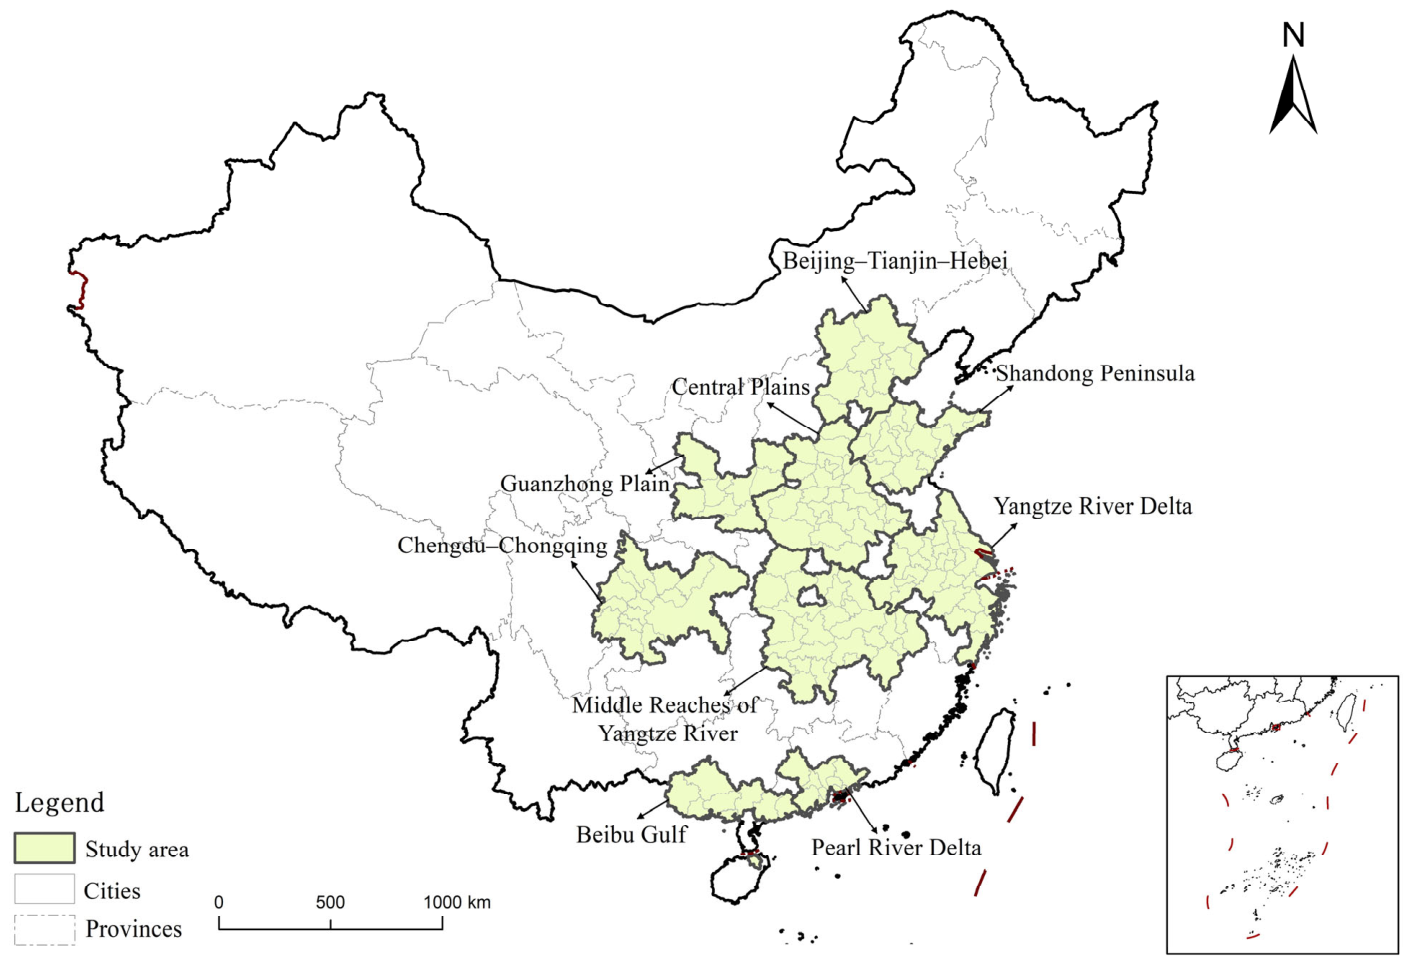
This study draws on China’s nine national-level urban agglomerations and the 148 cities within their boundaries from 2010 to 2023 as the spatiotemporal units of analysis, constructing panel data for the empirical investigation. Whereas prior research has mostly focused on national-level urban agglomerations as the primary research objects, a review of relevant Chinese policy documents reveals temporal inconsistencies and policy-driven discrepancies in how national-level urban agglomerations have been designated. For instance, the 2018 document Opinions of the Central Committee of the Communist Party of China and the State Council on Establishing a New Mechanism for More Effective Regional Coordinated Development identified seven urban agglomerations—including the Beijing–Tianjin–Hebei region—as national-level urban agglomerations tasked with promoting integrated regional development in line with major national strategies. By contrast, as of February 2019, the State Council had officially approved ten national-level urban agglomerations, namely the Middle Reaches of the Yangtze River, Harbin–Changchun, Chengdu–Chongqing, the Yangtze River Delta, the Central Plains, the Beibu Gulf, the Guanzhong Plain, Hohhot–Baotou–Ordos–Yulin, Lanzhou–Xining, and the Guangdong–Hong Kong–Macao Greater Bay Area. Although the number of designated urban agglomerations had increased, the Beijing–Tianjin–Hebei urban agglomeration was not among them. Furthermore, following the elevation of the Ecological Conservation and High-Quality Development of the Yellow River Basin strategy to national status, the Shandong Peninsula urban agglomeration has come to occupy a pivotal role in this initiative. As a major economic and populous province, Shandong likewise plays a crucial role in China’s regional economic development. In light of these considerations, and balancing data availability with sample representativeness, this study focuses on nine major urban agglomerations—Beijing–Tianjin–Hebei, the Yangtze River Delta, the Pearl River Delta, the Shandong Peninsula, the Middle Reaches of the Yangtze River, Chengdu–Chongqing, the Central Plains, the Beibu Gulf, and the Guanzhong Plain—together with the 148 prefecture-level (and above) cities within their boundaries, as the spatiotemporal scope of the empirical analysis (Figure 2). In addition, regarding city coverage, this study takes the core areas defined in the official approval or planning documents of each urban agglomeration as the benchmark, while excluding three categories of cities. The first category includes cities located in the peripheral areas of urban agglomerations, where only some of their subordinate counties or districts are incorporated into the urban agglomeration rather than the entire prefecture-level administrative area. The second category consists of ordinary county-level cities located within the boundaries of urban agglomerations. These county-level cities are not administratively subordinate to any prefecture-level city but are directly governed by provincial governments, making them difficult to match with other cities in terms of statistical standards and sample analysis. The third category includes special cities such as the Hong Kong Special Administrative Region and the Macao Special Administrative Region, which differ substantially from other cities in terms of administrative status and institutional environment. Accordingly, 148 cities are ultimately retained as the research sample to ensure the balance and comparability of the panel data. The specific spatial scope of the nine major urban agglomerations is presented in Table 1.
With respect to the selection of the sample period, this study sets 2010 as the starting year based primarily on the following considerations. First, in 2010, the State Council of China issued the National Major Function-Oriented Zone Planning, which, for the first time, clarified the strategic position of urban agglomerations as the main spatial form of urbanization from the perspective of territorial spatial planning. Since then, the plans for national-level urban agglomerations have been successively formulated and approved. Therefore, taking 2010 as the starting point allows this study to fully capture this process of institutional evolution. Second, the statistical standards for indicators related to the core explanatory variable, UFN, and the core explained variable, GTFEE, became increasingly standardized around 2010. Selecting data from 2010 onward can therefore effectively ensure the reliability of the empirical results.
The core explanatory variable is constructed as follows. First, listed companies located in the selected urban agglomerations are identified based on their registered addresses. Then, the names of their top five customers and suppliers, as well as transaction amounts and related information, are collected from the annual reports of listed companies over the sample period. The address information of these firms is obtained from Qichacha (www.qcc.com). After excluding foreign firms, missing observations, and individual customers, the locations of the companies are further standardized at the prefecture-level city scale. Other data are mainly sourced from the China Urban Construction Statistical Yearbook and the China Regional Economic Statistical Yearbook. Descriptive statistics for the main variables are presented in Table 2.

5. Results

5.1. Analysis of Regression Results

5.1.1. Baseline Regression

This study first employs a fixed-effects panel data model for the baseline regression, with the results reported in Table 3. Column (1) presents the regression results without control variables, while Column (2) includes them. Regardless of whether control variables are included, the results indicate that the effect of UFNs on GTFEE remains significantly positive at the 1% level (the results for Columns 3–4 are discussed under the robustness tests). In terms of effect size, taking the results in Column (2) as an example, a one-standard-deviation increase in UFN (0.691) leads to a 0.2% increase in GTFEE (0.003 × 0.691 × 100%). These findings suggest that UFN construction can significantly enhance GTFEE, providing empirical support for H1.

5.1.2. Robustness Tests

This study conducts robustness tests on the baseline regression results using four approaches: substituting the dependent variable, substituting the independent variable, shortening the time window, and constructing a dynamic panel model via the System Generalized Method of Moments (SYS-GMM) (Table 4). First, green total-factor energy efficiency (GTFEE′) estimated via the super-efficiency CCR model substitutes the dependent variable. Second, following Liu’s methodology, a functional linkage model based on “point-like functional nodes” and “current-state effect channels” is constructed and serves as a substitute for the core explanatory variable [52]. Third, given potential abnormal fluctuations in intercity functional linkages and energy factor allocation over the sample period—particularly given the COVID-19 pandemic—the regression is conducted using a shortened sample period (2010–2019). Fourth, to mitigate potential endogeneity, SYS-GMM is applied, incorporating lagged terms of the dependent variable into a dynamic panel framework, and re-estimating both the baseline regression and the three robustness models described above.
As shown in Columns (3) and (4) of Table 2, and Columns (3) and (4), (7) and (8), and (11) and (12) of Table 3, the AR(1) test is significant at the 1% level, while the AR(2) test is insignificant, indicating no autocorrelation in the model residuals. Likewise, the insignificant Hansen test statistic suggests that the choice of instrumental variables and lag order is appropriate, supporting the reliability of the model estimates. Overall, the four robustness tests consistently confirm that UFN construction continues to enhance GTFEE, confirming the robustness of the core conclusion.

5.2. Mechanism Testing: “Government Action” and “Market Efficiency”

Building on the theoretical mechanism analysis and the baseline regression model, this study incorporates mediating variables to identify the specific channels through which UFNs influence GTFEE, across the two dimensions of “government action” and “market efficiency.” To this end, a dynamic panel model is constructed in which the dependent variable is regressed on a series of mechanism variables ( m it ):
m i t = θ 0 + θ 1 m i t 1 + θ 2 U F N i t + θ 3 X i t + ε i t
For robustness, this study further constructs a dynamic panel model in which GTFEE is regressed on the mechanism variables:
G T F E E i t = ϑ 0 + ϑ 1 G T E E i t 1 + ϑ 2 m i t + ϑ 3 X i t + ε i t

5.2.1. Mechanism Testing for the “Government Action” Dimension

The regression results for the “government action” mechanism are presented in Table 5. First, regarding market integration, UFNs exhibit a significantly positive effect on market integration at the 1% level, which in turn exerts a significant positive influence on GTFEE, consistent with the theoretical analysis presented earlier. Specifically, UFN development helps dismantle market segmentation arising from administrative barriers, effectively reducing the construction and transaction costs of clean energy infrastructure—thereby promoting GTFEE improvements. Second, regarding land-resource misallocation, the estimates in Columns (3) and (4) indicate that UFNs exert a significantly negative effect on land resource misallocation at the 1% significance level, while land resource misallocation in turn negatively affects GTFEE. These findings suggest that UFN development enhances the spatial allocation efficiency of land relative to other factors, mitigating the inhibitory effects of land misallocation on GTFEE improvements. Finally, regarding urban sprawl, UFNs contribute to the containment of low-density, disorderly urban expansion while fully leveraging the learning effects generated by spatial agglomeration within the network. In terms of the effect sizes of the three mechanism paths under the “government action” dimension, the impact of UFNs on market integration (MAR) is relatively the strongest: a one-standard-deviation increase in UFNs leads to a 2.8% increase in MAR. Among the three mediating variables, land-resource misallocation (LRM) has the most pronounced effect on GTFEE. The results show that a one-standard-deviation increase in LRM reduces GTFEE by 5.0%. This indicates that, from the perspective of “government action,” land-resource misallocation constitutes a key institutional bottleneck constraining the improvement of GTFEE in China. In the future, mitigating the spatial misallocation of land resources through urban functional networks should become a central policy focus for improving GTFEE. This, in turn, facilitates improvements in GTFEE, providing empirical support for H2.

5.2.2. Testing the “Market Efficiency” Dimension

The regression results for testing the “market efficiency” mechanism are shown in Table 6. First, regarding factor flows, UFNs’ impact on factor flows is significantly positive at the 1% level, while factor flows likewise exert a significant positive influence on GTFEE. This confirms the theoretical analysis presented earlier: UFNs continuously integrate and optimize inter-urban interactions through their multidimensional driving effects on factor flows, achieving a market-based allocation of capital, labor, and energy—thereby contributing to GTFEE improvements. Regarding the innovative allocation of production factors, as shown in Columns (3) and (4), the effect of UFNs on this variable is 0.067 and significant at the 1% level. Meanwhile, the effect of the innovative allocation of production factors on GTFEE is 0.013, also significant at the 1% level, consistent with theoretical expectations. This indicates that UFN construction effectively enhances cross-regional precise matching and deep integration between digital technologies and the real economy, thereby reducing energy transaction costs and information asymmetry, alleviating energy inefficiencies from resource misallocation, and improving GTFEE. Regarding the diffusion of green innovative technologies, the results in Columns (5) and (6) show that UFN construction significantly promotes green technological innovation and diffusion. This indicates that cities embedded in UFNs can significantly enhance enterprises’ internal technological innovation and external learning capabilities by strengthening industrial linkages and interaction intensity with other cities within the urban agglomeration, thereby advancing green technological progress and diffusion among cities. At the same time, the diffusion of green innovative technologies also exerts a significant positive impact on GTFEE, indicating that such diffusion contributes to its improvement. In terms of the effect sizes of the three mediating paths under the “market efficiency” dimension, the impact of UFNs on the diffusion of green innovative technologies (EPC) is relatively the strongest: a one-standard-deviation increase in UFNs raises the level of EPC by 11.13%. This indicates that green technology diffusion is the main channel through which urban functional networks release the benefits of GTFEE improvement under the “market efficiency” dimension. Accordingly, policy design should prioritize strengthening the cross-city sharing of green technological knowledge and collaborative innovation within urban agglomerations. By establishing regional green technology trading platforms and improving cross-regional intellectual property protection mechanisms, the connectivity advantages of functional networks can be more rapidly transformed into widely shared green productivity. Overall, these empirical results further reinforce the reliability of the proposed transmission mechanism, providing supportive evidence for H3.

5.3. Heterogeneity Test

5.3.1. Heterogeneity Test of the Location Development Environment

Urban agglomerations are classified by location based on the distance between the coastline and the city with the largest population as well as the economic scale within each agglomeration. Using the sample mean as the grouping criterion, cities are divided into two categories: those located near the coastline and those located farther inland. The results in Table 7 indicate that, for coastal cities, the effect of UFNs on GTFEE is significantly positive at the 1% level, whereas the effect is statistically insignificant for inland cities located farther from the coast. This study further employs the Chow test to examine whether the coefficients differ significantly across the grouped regressions. The results show that the corresponding p-values are statistically significant, indicating significant differences in the coefficients between the two groups. This implies that the positive effect of UFNs on GTFEE is mainly observed in cities and urban agglomerations located near the coastline.
This difference can be attributed to several factors. On one hand, cities within coastal urban agglomerations maintain relatively close linkages in industrial clustering and collaborative development. Various factor flows continuously promote intercity complementarity and synergistic growth through polycentric spatial networks, thereby enhancing the urban agglomeration’s overall GTFEE. On the other hand, the differentiated spatial development patterns of inland urban agglomerations remain under formation. An open, interconnected urban network structure has yet to be fully established, and effective intercity collaborative relationships remain underdeveloped. Consequently, the comprehensive effects of the networked spatial structure on green and high-quality development remain relatively limited in these urban agglomerations.

5.3.2. Testing the Heterogeneity of Transportation Interconnectivity Levels

The construction and enhancement of transportation infrastructure not only significantly influence a city’s economic development but also play a crucial role in shaping the spatial development patterns of the urban agglomerations in which it is embedded. In this study, “transportation infrastructure connectivity” is measured by whether sample cities have high-speed rail (HSR) services linking them to other cities within their respective urban agglomerations in a given year. Based on this measure, cities are classified into two groups: those with HSR services and those without. As reported in Columns (3) and (4) of Table 7, the effect of UFNs on GTFEE is more pronounced in cities with HSR services, whereas it is statistically insignificant in cities without them. This study further employs the Chow test to examine whether the coefficients differ significantly across the grouped regressions. The results show that the corresponding p-values are statistically significant, indicating significant differences in the coefficients between the two groups. This implies that the positive effect of UFNs on GTFEE is mainly observed in cities with HSR services.
This difference can be attributed to several mechanisms. First, HSR introduction exerts a substitution effect on traditional transportation modes: it reduces energy consumption and environmental pollution in the transportation sector, alleviates intercity traffic congestion, and promotes the efficient flow of people and goods, thereby improving resource allocation and supporting energy conservation and emission reduction. Second, the rapid transportation network established by HSR, through reduced travel time and costs, enhances technological innovation via talent aggregation, investment clustering, and knowledge spillovers. This facilitates the formation and development of innovation networks within urban agglomerations, thereby improving cities’ green production technologies and pollution-control capabilities. Prior studies indicate that, relative to cities without HSR, the presence of HSR promotes cross-regional flows of innovation factors, accelerates the diffusion of green knowledge and advanced technologies, and enhances GTFEE at both the city and urban-agglomeration levels.

5.3.3. Testing for Heterogeneity in Policy Continuity and Synergy

Policy continuity and coordination are crucial to the spatial evolution and institutional development of urban agglomerations, as well as the transition toward green and low-carbon development. Under China’s political system and the “promotion tournament” incentive structure among local officials, municipal Party and government leaders hold substantial decision-making authority over urban spatial development and land-use policies.
Given their role as principal decision-makers in urban development strategies and policy implementation, municipal Party secretaries’ tenure length may significantly influence a city’s position and role within the functional network, generating heterogeneous effects on economic and environmental development. This study uses the sample mean tenure of municipal Party secretaries (3.4 years) as the grouping criterion, dividing cities into two categories: cities with longer-tenured Party secretaries (≥3.4 years) and cities with shorter-tenured ones (<3.4 years).
The results in Table 7 indicate that, in cities with longer-tenured Party secretaries, the effect of UFNs on GTFEE is significantly positive at the 5% level, whereas the effect is statistically insignificant in cities with shorter-tenured Party secretaries. This study further employs the Chow test to examine whether the coefficients differ significantly across the grouped regressions. The results show that the corresponding p-values are statistically significant, indicating significant differences in the coefficients between the two groups. This implies that the positive effect of UFNs on GTFEE is mainly observed in cities where municipal Party secretaries have longer tenures. Several explanations may account for this difference. On one hand, longer-tenured Party secretaries tend to possess a deeper understanding of their cities’ integration into the urban agglomeration, enabling them to maintain more stable and effective collaborative relationships with other cities in the same agglomeration, which helps ensure the continuity and stability of coordinated development policies. On the other hand, compared with shorter-tenured officials, longer-tenured Party secretaries are more likely to prioritize the long-term goals of green socio-economic transformation and high-quality development while maintaining stable economic growth, better positioning them to promote GTFEE improvements at both the city and urban-agglomeration levels.

5.4. A Re-Examination from the Perspective of Urban Cluster Spatial Optimization

To further examine the impact of UFNs on GTFEE from the perspective of spatial structure optimization within urban agglomerations, this study introduces two moderating variables—polycentricity and agglomeration externalities—to assess the moderating effects of balanced spatial development within urban agglomerations and individual cities’ agglomeration capacities, respectively, on the UFN-GTFEE relationship. Building on Equation (2), interaction terms between urban polycentricity (POLY) and UFN, and between urban economic density (DEN) and UFN, are incorporated to construct the following dynamic panel model:

5.4.1. The Moderating Role of Polycentricity

Drawing on Li et al., this study employs the intensity of intercity knowledge-innovation cooperation to measure functional polycentricity within an urban agglomeration. Higher values indicate a tendency toward polycentricity, and lower values toward monocentricity [53].
The results in Column (2) of Table 8 show that the interaction term between polycentricity and UFNs is significantly positive. This suggests that a more polycentric city-cluster spatial structure enhances UFNs’ positive effects among cities, thereby improving GTFEE.
This effect arises primarily because a city cluster’s polycentric configuration facilitates a coordinated development pattern among large, medium, and small cities. Within this framework, the spatial flows generated by the functional network are more rationalized, enabling efficient movement of factor flows across spatial entities of different scales and strengthening intercity linkages and interactions. Consequently, in a multi-centered, networked spatial structure, cities can interact more effectively, promoting improvements in resource allocation efficiency and green energy utilization.

5.4.2. The Moderating Role of Agglomeration Externalities

Building on the above findings, this study further examines how cities of varying economic scales within a networked urban agglomeration can leverage agglomeration externalities generated by spatial clustering to achieve effective internal feedback, thereby enhancing UFNs’ positive moderating role on GTFEE. Following Meijers et al., urban employment density is used to characterize urban economic density, serving as a proxy for agglomeration-externality levels [54]. The results in Column (4) of Table 8 show that the interaction term between agglomeration externalities and UFNs is significantly positive, indicating that realized agglomeration externalities strengthen the functional network’s effect on improving GTFEE. This effect arises because agglomeration externalities amplify the spillover effects of factor mobility and green technological innovation activities within cities, thereby enhancing the allocation efficiency of energy and other factors across cities in the urban agglomeration. As a result, desired outputs increase while undesired outputs are effectively reduced, further reinforcing UFNs’ contribution to GTFEE improvements.

6. Discussion

6.1. Linking the Empirical Findings to the Research Hypotheses

The empirical results offer a coherent mapping between the proposed hypotheses and the observed evidence from the research sample. First, the estimates from both the two-way fixed-effects model in the baseline regression and the SYS-GMM model used in the robustness checks point to a significantly positive association between UFNs and GTFEE at the urban agglomeration scale. This finding aligns with the theoretical expectation of H1, suggesting that UFN formation can enhance GTFEE through strengthened intercity functional linkages and network externalities. Second, the mechanism tests for the “government action” dimension show that UFNs are significantly and positively associated with market integration, while significantly and negatively associated with land resource misallocation and urban sprawl. These findings support H2 and indicate that government-led coordination, policy guidance, and cross-regional institutional integration play an important role in translating functional network linkages into improvements in green energy efficiency. Third, the mechanism tests for the “market efficiency” dimension show that UFNs are positively associated with factor mobility, the innovative allocation of production factors, and the diffusion of green technologies. This supports H3 and highlights market mechanisms’ key role in improving resource allocation efficiency, accelerating factor mobility, and promoting green technological diffusion. Taken together, the mechanism tests from the “government action” and “market efficiency” dimensions suggest that UFN construction at the urban agglomeration scale constitutes not merely a spatial restructuring process, but also an institutional evolution shaped by the dynamic interaction between an “active government” and an “effective market.” Only through coordinated integration of government guidance with market mechanisms can UFNs effectively enhance GTFEE and facilitate green socioeconomic transformation.
Therefore, urban agglomerations should serve as a strategic lever for constructing a spatial network characterized by strong functional linkages, thereby reinforcing the developmental foundation for enhancing GTFEE. By further refining regional coordinated development mechanisms, intercity interactive and collaborative capabilities within urban agglomerations should be continuously strengthened. In this process, the roles of government and market actors should be clearly delineated to ensure organic integration between active government and efficient market logics.

6.2. Reconciling Our Findings with the Predominantly Positive Evidence on Urban Networks and Energy Efficiency

A growing body of literature, particularly studies set in the Chinese context, has documented a predominantly positive relationship between urban networks and energy efficiency [24,37,55]. The empirical evidence obtained here at the urban agglomeration scale is broadly consistent with this mainstream literature, suggesting that China’s functional urban networks are likely to generate positive effects on GTFEE. Therefore, this study’s contribution lies not only in moving beyond the single-city perspective, but also in explaining how UFNs affect GTFEE through functional linkages and interactions among cities within urban agglomerations.
As this research field has developed, increasing attention has been paid to the underlying transmission mechanisms. Existing studies emphasize the effective use of market forces as a crucial pathway, highlighting factor mobility, industrial agglomeration capacity, technological innovation, and green knowledge diffusion [12,14,16]. The Chinese academic literature has also focused on market mechanisms such as labor mobility, digital-factor allocation, and foundational green innovation [56,57,58]. At the same time, research in China places greater emphasis on government administrative forces, including integration policies across administrative boundaries, government-led resource allocation, and urban spatial structure optimization [59,60,61]. These strands provide important theoretical and empirical support for understanding green development through the dual dimensions of government action and market efficiency.
This study’s second contribution lies in identifying the logical relationships among the three agglomeration externalities—sharing, matching, and learning—and linking them to UFNs’ direct impact on GTFEE. Specifically, this study maps these externalities onto the two mechanism pathways of “government action” and “market efficiency,” thereby revealing how UFNs affect GTFEE through both institutional coordination and market-based resource allocation. This framework helps clarify the spatial effects generated by functional networks and their implications for GTFEE. In China, it also offers a more nuanced account of the current policy logic, emphasizing the combination of an “active government” and an “effective market”.
In the Chinese context, given that the mechanisms through which UFNs enhance GTFEE differ across the government and market dimensions, the division of responsibilities between these actors should be carefully defined. Specifically, the government should focus on strengthening both the hard and soft infrastructure for market integration, reinforcing the role of land resources in supporting high-efficiency energy use, and establishing compact spatial development patterns. Simultaneously, the market’s decisive role in resource allocation should be fully leveraged, with market demand guiding the efficient flow of technology, talent, and capital across cities, harnessing economies of scale and agglomeration effects to continuously improve the efficiency and precision of factor allocation.

6.3. Interpreting the Moderating Effects of Urban Agglomeration Spatial Structure Optimization: External Drivers and Internal Feedback

Urban agglomeration spatial structure optimization has a significant influence on the UFN-GTFEE relationship. For cities within urban agglomerations, this moderating effect can be interpreted from two perspectives: external drivers and internal feedback.
First, external drivers emphasize the moderating role of balanced spatial development within urban agglomerations. As an urban agglomeration’s spatial structure becomes more polycentric, positive functional interactions among cities are more likely to be strengthened, thereby enhancing UFNs’ effect on GTFEE. A polycentric spatial structure may better support the formation of industrial chains characterized by a rational intercity division of labor among cities of different sizes. This, in turn, can promote the free flow of factors, improve resource allocation efficiency, and reduce inefficient energy use. This finding also aligns with China’s urban agglomeration development strategy, which emphasizes the coordinated development of large, medium, and small cities.
Second, internal feedback emphasizes the moderating effect generated by individual cities’ agglomeration-capability utilization. The stronger the agglomeration externalities of individual cities within an urban agglomeration, the more likely they are to reinforce the positive impact of UFNs on GTFEE. Such externalities may further strengthen the spillover effects of factor mobility and green technological innovation across cities, thereby improving the allocation efficiency of energy relative to other production factors.
Based on these two perspectives, the findings of this study suggest that urban agglomerations should establish a more balanced, polycentric spatial structure while also fully leveraging individual cities’ agglomeration externalities. Only through interaction between spatial structural optimization and city-level agglomeration capacity can UFNs’ positive impact on GTFEE be fully realized.
This conclusion is crucial for China’s future formulation of territorial spatial planning and urban planning policies at the urban-agglomeration scale. Urban agglomerations’ spatial structure should be continuously optimized to maximize the effectiveness of macro-level policies and regional development strategies in promoting GTFEE and advancing green socio-economic transformation. Efforts should focus on establishing a polycentric spatial system facilitating coordinated development among large, medium, and small cities, thereby enhancing UFNs’ operational efficiency. Simultaneously, the agglomeration externalities of cities within UFNs should be fully leveraged to amplify their nodal impacts and spatial spillover effects across the urban agglomeration. Given the significant moderating role of polycentric spatial structures in shaping the effects of functional networks, differentiated spatial planning schemes should be tailored to monocentric and polycentric urban agglomerations. For monocentric urban agglomerations, secondary centers should be cultivated in an orderly manner, and core functions should be appropriately decentralized to build a compact multi-node network connected by intercity rail transit. For polycentric urban agglomerations, the specialized division of labor among node cities should be further deepened, and urban functions should be optimized along hierarchical industrial functional chains, so as to fully realize agglomeration externalities and spatial spillover effects.

6.4. Locational Development Environment, Transportation Connectivity, and Continuity of Local Governance Jointly Shape the Heterogeneous Effects of UFNs on GTFEE

The heterogeneity analysis provides more nuanced evidence for understanding why the green energy-efficiency effects of UFNs vary across different contexts. In terms of locational development environment, the finding that the green energy-efficiency effect of UFNs is observed only in coastal urban agglomerations is consistent with existing studies suggesting that coastal regions, due to their earlier participation in the global division of labor and deeper marketization, are more likely to generate “borrowed-size” effects. However, this also implies that inland urban agglomerations remain constrained by relatively closed spatial structures, where functional linkages have not yet been effectively transformed into substantive improvements in environmental efficiency [24,57]. This difference reminds us that predicting green performance simply based on whether a city is embedded in a network may be overly optimistic, as the initial endowments of spatial location still profoundly shape the efficiency-conversion capacity of networks. In terms of transportation connectivity, the amplifying effect of high-speed rail confirms that reduced knowledge-diffusion costs can promote green technology spillovers. It also suggests that the energy-efficiency dividends of UFNs depend heavily on mobility costs and accessibility. In terms of policy continuity and coordination, the finding that longer official tenure strengthens the effect of UFNs indicates that the institutionalized operation of functional networks also relies on the relative stability of local governance structures. This provides certain insights into how China’s urban agglomeration policies can move from planning coordination toward effective performance transformation. Overall, the above heterogeneity results suggest that the effect of UFNs on GTFEE is not determined solely by network structure. Instead, it is embedded in a broader context jointly shaped by locational conditions, physical connectivity, and institutional continuity. Policy design therefore needs to respond specifically to these constraints, rather than simply promoting network expansion itself.
Therefore, differentiated development policies tailored to the individual urban agglomerations’ characteristics should be formulated and implemented, while mechanisms for regional coordinated development should be further improved. Policymakers should fully consider regional differences, including the spatiotemporal context and developmental stage of each urban agglomeration, and formulate development strategies aligned with local conditions and future development needs.

6.5. Limitations of the Study

This study primarily relies on annual city-level panel data to document robust regional associations between UFNs and GTFEE. Because major government initiatives and policy objectives are often implemented at the national or regional scale, while market development and industrial restructuring are simultaneously subject to multiple policy shocks and external influences, the estimation results cannot fully isolate all potential sources of endogeneity. Although two-way fixed effects, the SYS-GMM model, and a series of robustness checks help mitigate concerns related to omitted variables, dynamic endogeneity, and model specification, the results should still be interpreted as evidence of a stable macro-level association rather than definitive causal effects. Therefore, this study refrains from strong causal claims and treats the policy implications as suggestive rather than prescriptive.
The second limitation lies in the research topic’s dynamic nature itself. The impact of UFNs on GTFEE at the urban agglomeration scale is a long-term adjustment process requiring continuous observation over an extended period. However, owing to limitations in consecutive annual-data availability, it remains difficult to conduct empirical research over a longer horizon. Going forward, as more complete, fine-grained data become available, further studies could examine the dynamic evolution of the UFN-GTFEE relationship across different stages of China’s policy transformation, market development, and green transition.
Third, due to limitations in research scale and data availability, this study focuses on the functional network effects within urban agglomerations and does not incorporate interactive linkages and spatial spillover effects between cities inside urban agglomerations and surrounding cities outside them into the analytical framework. This may lead to an underestimation of the energy-efficiency effects of functional connections at a broader spatial scale.
Fourth, in terms of data and variable measurement, the construction of indicators for both urban functional networks and green total-factor energy efficiency is based on macro-level statistical data, which may involve measurement errors and limitations in representativeness. Meanwhile, constrained by the availability of micro-level data, this study is unable to verify the micro-level transmission mechanisms through which urban functional networks affect green total-factor energy efficiency from the firm perspective. Therefore, caution is needed when extending the findings to the behavioral responses of micro-level actors.

6.6. Future Research

Future research can be advanced in three main directions. First, future studies could expand UFNs’ multidimensional measurement and further examine their nonlinear effects. A promising direction is introducing complex network analysis to characterize topological features such as node centrality, network density, structural holes, and link strength. On this basis, future research could examine UFNs’ threshold and dynamic lagged effects on GTFEE, thereby revealing the nonlinear pathways through which spatial network structure optimization generates energy-efficiency dividends. Second, future research should strengthen causal identification at the micro-mechanism level. By collecting and matching enterprise-level data on energy consumption, production activities, innovation behavior, and interfirm collaboration, future studies could track the behavioral responses of micro-level entities embedded within functional networks. For instance, researchers could examine how firms adjust energy consumption, engage in green technology collaboration, or respond to policy incentives within intercity functional networks. In addition, quasi-natural experiments could better address endogeneity concerns and further clarify the “government action” and “market efficiency” transmission mechanisms at the micro level. Third, future research could extend the analysis to cross-scale spatial interactions and collaborative governance. Beyond examining network structures within urban agglomerations, future studies could investigate the spillover and competitive effects generated by functional linkages across different urban agglomerations. Moreover, linking functional-network characteristics across multiple spatial scales—such as cities, metropolitan areas, and urban agglomerations—future research could explore how multi-layered networks’ interaction and overlap contribute to GTFEE improvements. This would help build a more comprehensive analytical framework for understanding the relationship between spatial network restructuring, collaborative governance, and green development.

7. Conclusions

Adopting the perspective of government and market roles, this study constructs a panel dataset covering nine major urban agglomerations in China and the 148 cities within them from 2010 to 2023, empirically examining UFNs’ impact on GTFEE at the urban-agglomeration level. The results indicate that UFNs significantly enhance GTFEE, primarily through two mechanisms: government action and market efficiency. The former operates mainly by promoting market integration, reducing land resource misallocation, and curbing urban sprawl, whereas the latter functions primarily through facilitating factor mobility, enhancing the innovative allocation of production factors, and promoting technological innovation and diffusion. Heterogeneity analyses reveal that UFNs’ effect on GTFEE varies across several dimensions, including the local development environment, transportation connectivity, and policy continuity and coordination. Specifically, the effects are more pronounced in coastal cities, cities connected to other agglomeration cities via high-speed rail, and cities governed by municipal Party secretaries with longer tenures. A further analysis from the spatial-structure-optimization perspective shows that a more polycentric structure and higher agglomeration externalities enhance UFNs’ effectiveness in improving GTFEE, indicating that spatial organization and network externalities jointly reinforce the role of functional networks in promoting green development.

Author Contributions

Conceptualization, S.L. and G.X.; methodology, S.L. and G.X.; validation, S.L. and G.X.; formal analysis, S.L. and B.L.; data curation, B.L. and Y.Y.; writing—original draft preparation, S.L. and G.X.; writing—review and editing, S.L. and G.X.; visualization, S.L. and Y.Y. All authors have read and agreed to the published version of the manuscript.

Funding

This research was funded by the National Social Science Fund of China (24BJY105).

Institutional Review Board Statement

Not applicable.

Informed Consent Statement

Not applicable.

Data Availability Statement

The data presented in this study are available on request from the first author.

Acknowledgments

The authors are grateful to the Editor and the anonymous referees for their helpful comments and suggestions.

Conflicts of Interest

The authors declare no conflicts of interest.

References

  1. Peduzzi, P. The Disaster Risk, Global Change, and Sustainability Nexus. Sustainability 2019, 11, 957. [Google Scholar] [CrossRef] [Scilit]
  2. Gao, D.; Li, G.; Yu, J. Does digitization improve green total factor energy efficiency? Evidence from Chinese 213 cities. Energy 2022, 247, 123395. [Google Scholar] [CrossRef] [Scilit]
  3. Pflieger, G.; Rozenblat, C. Introduction. Urban networks and network theory: The city as the connector of multiple networks. Urban Stud. 2010, 47, 2723–2735. [Google Scholar] [CrossRef] [Scilit]
  4. Guo, J.; Li, J. Efficiency evaluation and influencing factors of energy saving and emission reduction: An empirical study of China’s three major urban agglomerations from the perspective of environmental benefits. Ecol. Indic. 2021, 133, 108410. [Google Scholar] [CrossRef] [Scilit]
  5. Feng, Y.; Yuan, H.; Liu, Y.; Zhang, S. Does new-type urbanization policy promote green energy efficiency? Evidence from a quasi-natural experiment in China. Energy Econ. 2023, 124, 106752. [Google Scholar] [CrossRef] [Scilit]
  6. Hao, Y.; Guo, Y.; Wu, H. The role of information and communication technology on green total factor energy efficiency: Does environmental regulation work? Bus. Strategy Environ. 2022, 31, 403–424. [Google Scholar] [CrossRef] [Scilit]
  7. Wu, H.; Hao, Y.; Ren, S.; Yang, X.; Xie, G. Does internet development improve green total factor energy efficiency? Evidence from China. Energy Policy 2021, 153, 112247. [Google Scholar] [CrossRef] [Scilit]
  8. Shen, Y.; Cheng, G.; Li, S.; Cao, M. Does the Construction of Smart Cities Promote Green Total Factor Energy Efficiency? A Quasi-Natural Experiment Based on China’s Smart City Pilot Policy. Sustainability 2026, 18, 3060. [Google Scholar] [CrossRef] [Scilit]
  9. Zhou, C.; Qi, S. Has the pilot carbon trading policy improved China’s green total factor energy efficiency? Energy Econ. 2022, 114, 106268. [Google Scholar] [CrossRef] [Scilit]
  10. Lu, J.; Li, H. Can digital technology innovation promote total factor energy efficiency? Firm-level evidence from China. Energy 2024, 293, 130682. [Google Scholar] [CrossRef] [Scilit]
  11. Chen, H.; Yu, Z.; Hu, S. Digital economy, human capital accumulation, and corporate green total factor productivity: Based on strategic emerging industries. Int. Rev. Financ. Anal. 2025, 103, 104152. [Google Scholar] [CrossRef] [Scilit]
  12. Li, G.; Gao, D.; Li, Y. Impacts of market-based environmental regulation on green total factor energy efficiency in China. China World Econ. 2023, 31, 92–114. [Google Scholar] [CrossRef] [Scilit]
  13. Peng, H.; Lu, Y.; Wang, Q. How does heterogeneous industrial agglomeration affect the total factor energy efficiency of China’s digital economy. Energy 2023, 268, 126654. [Google Scholar] [CrossRef] [Scilit]
  14. Zhang, Y.; Jian, C.; Li, R. A Study on the Impact of Industrial Synergistic Agglomeration on Urban Green Total Factor Energy Efficiency: Evidence from China. Econ. Bus. Manag. 2025, 2, 22–36. [Google Scholar] [CrossRef] [Scilit]
  15. Xiao, Y.; Duan, Y.; Zhou, H.; Han, X. Has digital technology innovation improved urban total factor energy efficiency?—Evidence from 282 prefecture-level cities in China. J. Environ. Manag. 2025, 378, 124784. [Google Scholar] [CrossRef] [Scilit]
  16. Yuan, B.; Gu, R.; Wang, P.; Hu, Y. How Does New Quality Productive Forces Affect Green Total Factor Energy Efficiency in China? Consider the Threshold Effect of Artificial Intelligence. Sustainability 2025, 17, 7012. [Google Scholar] [CrossRef] [Scilit]
  17. Capello, R. The city network paradigm: Measuring urban network externalities. Urban Stud. 2000, 37, 1925–1945. [Google Scholar] [CrossRef] [Scilit]
  18. Van Oort, F.; Burger, M.; Raspe, O. On the economic foundation of the urban network paradigm: Spatial integration, functional integration and economic complementarities within the Dutch Randstad. Urban Stud. 2010, 47, 725–748. [Google Scholar] [CrossRef] [Scilit]
  19. Burger, M.; Meijers, E. Form follows function? Linking morphological and functional polycentricity. Urban Stud. 2012, 49, 1127–1149. [Google Scholar]
  20. Zhou, Y.; Duan, W.; Wang, S.; Lin, X.; Wang, Z.; Luo, Y. Urban information flow networks, service industry agglomeration and their heterogeneous interactive effects: Evidence from the Guangdong-Hong Kong-Macao Greater Bay Area. Cities 2025, 166, 106285. [Google Scholar] [CrossRef] [Scilit]
  21. Xu, J.; Yang, B.; Yuan, C. The impact of supply chain digitalization on urban resilience: Do industrial chain resilience, green total factor productivity and innovation matter? Energy Econ. 2025, 145, 108443. [Google Scholar] [CrossRef] [Scilit]
  22. Chen, Y. Low-Carbon Policy and Urban Industrial Chain Resilience: The Moderating Effects of Digital Technology Innovation, AI Application, and Innovation Network Embeddedness. Int. J. Innov. Technol. Manag. 2026, 23, 2650013. [Google Scholar] [CrossRef] [Scilit]
  23. Jiang, K.; Liang, S.; Liu, Y.; Zhou, L. Change and influencing factors of city network structure based on manu- facturing supply chains: A case study of the Yangtze River Delta region. Prog. Geogr. 2025, 44, 1164–1177. [Google Scholar] [CrossRef] [Scilit]
  24. Shuai, K.; Chang, H.; He, F.; He, X. Analysis of spatial correlation network and influencing factors of green energy efficiency in urban agglomerations. Sci. Rep. 2025, 15, 32137. [Google Scholar] [CrossRef] [Scilit] [PubMed]
  25. Duranton, G.; Puga, D. From sectoral to functional urban specialisation. J. Urban Econ. 2005, 57, 343–370. [Google Scholar] [CrossRef] [Scilit]
  26. Burger, M.J.; Meijers, E.J. Agglomerations and the rise of urban network externalities. Pap. Reg. Sci. 2016, 95, 5–16. [Google Scholar] [CrossRef] [Scilit]
  27. Zhang, H.; Sun, T. Disentangling urban network externalities: The juxtaposition of central place theory and central flow theory. Reg. Stud. 2025, 59, 2461753. [Google Scholar] [CrossRef] [Scilit]
  28. Gou, T.; Zhang, Y.; Li, J.; Wang, X.; Ji, M. Measurement and Influencing Factors of Urban Network Externalities in Yangtze River Delta Urban Agglomeration. J. Urban Plan. Dev. 2026, 152, 05026003. [Google Scholar] [CrossRef] [Scilit]
  29. Zhang, D.; Shen, J.; Zong, H. Research on the Evolution of Urban Network Structure and Its Externalities in China: An Analysis Based on Listed Companies’Data. Appl. Spat. Anal. Policy 2026, 19, 147. [Google Scholar] [CrossRef] [Scilit]
  30. Guo, A.; Liu, P.; Zhong, F.; Yang, C.; Luo, X. Borrowing size and urban green development efficiency in the city network of China: Impact measures and size thresholds. Land 2022, 11, 493. [Google Scholar] [CrossRef] [Scilit]
  31. Huang, Y.; Li, L.; Yu, Y. Do urban agglomerations outperform non-agglomerations? A new perspective on exploring the eco-efficiency of Yangtze River Economic Belt in China. J. Clean. Prod. 2018, 202, 1056–1067. [Google Scholar] [CrossRef] [Scilit]
  32. Gao, D.; Feng, H.; Cao, Y. The spatial spillover effect of innovative city policy on carbon efficiency: Evidence from China. Singap. Econ. Rev. 2026, 71, 1389–1411. [Google Scholar]
  33. Cobbinah, J.; Osei, A.; Amoah, J.O. Innovating for a greener future: Do digital transformation and innovation capacity drive enterprise green total factor productivity in the knowledge economy? J. Knowl. Econ. 2026, 17, 325–363. [Google Scholar]
  34. Hirst, E.; Fulkerson, W.; Carlsmith, R.; Wilbanks, T. Improving energy efficiency The effectiveness of government action. Energy Policy 1982, 10, 131–142. [Google Scholar] [CrossRef] [Scilit]
  35. Jaffe, A.B.; Newell, R.G.; Stavins, R.N. Economics of energy efficiency. Encycl. Energy 2004, 2, 79–90. [Google Scholar] [CrossRef] [Scilit]
  36. Su, H.; Liang, B. The impact of regional market integration and economic opening up on environmental total factor energy productivity in Chinese provinces. Energy Policy 2021, 148, 111943. [Google Scholar] [CrossRef] [Scilit]
  37. Yang, T.; Zhou, K.; Zhang, C. Spatiotemporal patterns and influencing factors of green development efficiency in China’s urban agglomerations. Sustain. Cities Soc. 2022, 85, 104069. [Google Scholar] [CrossRef] [Scilit]
  38. Xie, R.; Yao, S.; Han, F.; Zhang, Q. Does misallocation of land resources reduce urban green total factor productivity? An analysis of city-level panel data in China. Land Use Policy 2022, 122, 106353. [Google Scholar] [CrossRef] [Scilit]
  39. Li, X.; Huang, S.; Hamaguchi, Y.; Bhuiyan, M.A. Does Land Resource Misallocation Reduce Energy Efficiency? Empirical Evidence From 243 Prefecture Level Cities in China. Rev. Dev. Econ. 2026, 30, 716–729. [Google Scholar]
  40. Navamuel, E.L.; Morollón, F.R.; Cuartas, B.M. Energy consumption and urban sprawl: Evidence for the Spanish case. J. Clean. Prod. 2018, 172, 3479–3486. [Google Scholar] [CrossRef] [Scilit]
  41. Li, Y.; You, J.; Chen, S.; Huang, Y. Is bigger better? A machine learning reassessment of urban sprawl and energy utilisation efficiency. Cities 2026, 169, 106534. [Google Scholar] [CrossRef] [Scilit]
  42. Zhang, C.; Luo, H. Analysis of coordination between urban compactness and green total factor energy efficiency: A case study of 35 cities in China. Environ. Sci. Pollut. Res. 2022, 29, 59190–59210. [Google Scholar] [CrossRef] [Scilit]
  43. He, J.; Li, Z. Labor Mobility Networks and Green Total Factor Productivity. Systems 2024, 12, 157. [Google Scholar] [CrossRef] [Scilit]
  44. Dai, J.; Mehmood, U.; Nassani, A.A. Empowering sustainability through energy efficiency, green innovations, and the sharing economy: Insights from G7 economies. Energy 2025, 318, 134768. [Google Scholar] [CrossRef] [Scilit]
  45. Yin, P.; Liao, H. The Impact of Digital–Real Economy Integration on Green Development Efficiency: Evidence from China’s Yangtze River Delta Urban Agglomeration. Sustainability 2025, 17, 10448. [Google Scholar] [CrossRef] [Scilit]
  46. Zhong, K.; Lei, Y.; Zhao, J.; Jiang, Y. How to enhance China’s total-factor energy efficiency via digital-real economy integration: New evidence from dynamic QCA analysis. Energy Econ. 2025, 148, 108689. [Google Scholar] [CrossRef] [Scilit]
  47. Wang, Y.; Bai, Y.; Quan, T.; Ran, R.; Hua, L. Influence and effect of industrial agglomeration on urban green total factor productivity—On the regulatory role of innovation agglomeration and institutional distance. Econ. Anal. Policy 2023, 78, 1158–1173. [Google Scholar] [CrossRef] [Scilit]
  48. Tian, R.; Li, H.; Jia, H.; Gu, R. Spatial drivers of data element marketization on green total factor energy efficiency: Spillover effects, transmission pathways, and financial empowerment. Int. Rev. Econ. Financ. 2026, 107, 105081. [Google Scholar] [CrossRef] [Scilit]
  49. Gao, D.; Tan, L.; Chen, Y. Unlocking carbon reduction potential of digital trade: Evidence from China’s comprehensive cross-border e-commerce pilot zones. Sage Open 2025, 15, 21582440251319966. [Google Scholar] [CrossRef] [Scilit]
  50. Tone, K. A slacks-based measure of efficiency in data envelopment analysis. Eur. J. Oper. Res. 2001, 130, 498–509. [Google Scholar] [CrossRef] [Scilit]
  51. Zhang, J.; Sun, B.; Zhang, W. Functional division linkage pattern of urban agglomerations in China: A study from perspective of urban network. Geogr. Sci. 2025, 45, 1745–1757. (In Chinese) [Google Scholar]
  52. Liu, T. A City Linkage Study on Zhujiang River Delta Region: From a Function Network View. Econ. Geogr. 2015, 35, 57–62. (In Chinese) [Google Scholar]
  53. Li, Y.C.; Phelps, N. Megalopolis unbound: Knowledge collaboration and functional polycentricity within and beyond the Yangtze River Delta region in China, 2014. Urban Stud. 2018, 55, 443–460. [Google Scholar]
  54. Meijers, E.J.; Burger, M.J. Stretching the concept of ‘borrowed size’. Urban Stud. 2017, 54, 269–291. [Google Scholar]
  55. Sheng, K.R.; Li, X.R.; Wu, S.L.; Li, Y.Z. Examining impacts of multilayer network embeddedness on energy utilization efficiency of Chinese cities. Geogr. Sci. 2025, 45, 495–505. (In Chinese) [Google Scholar]
  56. Wang, K.L.; Zhao, B.; Xu, R.Y. Impact of Innovation Factor Flow on Energy Efficiency. Stat. Res. 2023, 40, 88–97. (In Chinese) [Google Scholar]
  57. Li, S.C.; Li, M.; Lee, S.W. How does polycentric spatial structure realize the green high-quality development witnin urban agglomerations?: A re-examination from the perspective of borrowed size and borrowed functions. Soft Sci. 2025, 39, 53–60. (In Chinese) [Google Scholar]
  58. Wang, M.R.; Wang, M.L.; Ding, M. Relaxation of Market Access Regulation and Improvement of Green Total-Factor Energy Efficiency: A Quasi-Natural Experiment Based on the Pilot ‘Negative List for Market Access’ System. Econ. Surv. 2026, 43, 19–31. (In Chinese) [Google Scholar]
  59. Feng, Y.D.; Yuan, H.X.; Liu, Y.B. Mechanisms for improving urban energy use efficiency in China’s new-type urbanization construction. China Popul. Environ. 2023, 33, 138–148. (In Chinese) [Google Scholar]
  60. Li, S.C.; Liu, M.N. How does government land allocation behavior affect urban carbon emission efficiency? A re-examination of the constraints under the dual targets of economic growth and environmental preservation. China Popul. Resour. Environ. 2025, 35, 82–96. (In Chinese) [Google Scholar]
  61. Yang, R.F.; Xia, M.F. How Regional Integration Policies Affect Energy Efficiency: Evidence form a Quasi-Natural Experiment of the Yangtze River Economic Belt Development Strategy. Resour. Environ. Yangtze Basin 2025, 34, 2406–2418. (In Chinese) [Google Scholar]
Figure 1. Conceptual framework of the UFN–GTFEE mechanism.
Sustainability 18 07426 g001
Figure 2. Spatial distribution and extent of the nine major urban agglomerations in China. Note: This map was drawn based on the standard map with the map review number GS(2024)0650 downloaded from the Standard Map Service website of the Ministry of Natural Resources of China, and the boundaries of the base map remain unchanged.
Sustainability 18 07426 g002
Table 1. Spatial scope of the nine major urban agglomerations.
Urban AgglomerationCity NameNumber of Cities
Beijing–Tianjin–Hebei (BTH)Beijing, Tianjin, Shijiazhuang, Baoding, Cangzhou, Chengde, Langfang, Qinhuangdao, Tangshan, Zhangjiakou10
Yangtze River Delta (YRD)Shanghai, Nanjing, Hangzhou, Hefei, Anqing, Changzhou, Chizhou, Chuzhou, Huzhou, Jiaxing, Jinhua, Maanshan, Nantong, Ningbo, Shaoxing, Suzhou (JS), Taizhou (JS), Taizhou (ZJ), Tongling, Wenzhou, Wuhu, Wuxi, Xuancheng, Yancheng, Yangzhou, Zhenjiang, Zhoushan27
Pearl River Delta (PRD)Guangzhou, Dongguan, Foshan, Huizhou, Jiangmen, Shenzhen, Zhaoqing, Zhongshan, Zhuhai9
Middle Reaches of Yangtze River (MRYR)Wuhan, Changsha, Nanchang, Changde, Ezhou, Fuzhou, Hengyang, Huanggang, Huangshi, Jingdezhen, Jingmen, Jingzhou, Jiujiang, Loudi, Pingxiang, Shangrao, Xiangtan, Xiangyang, Xianning, Xiaogan, Xinyu, Yichang, Yichun, Yingtan, Yiyang, Yueyang, Zhuzhou27
Shandong Peninsula (SDP)Jinan, Qingdao, Binzhou, Dezhou, Dongying, Jining, Liaocheng, Linyi, Rizhao, Taian, Weifang, Weihai, Yantai, Zaozhuang, Zibo15
Chengdu–Chongqing (CC)Chengdu, Chongqing, Dazhou, Deyang, Guangan, Leshan, Luzhou, Meishan, Mianyang, Nanchong, Neijiang, Suining, Yibin, Zigong, Ziyang15
Central Plains (CP)Zhengzhou, Anyang, Bengbu, Bozhou, Changzhi, Fuyang, Handan, Hebi, Heze, Huaibei, Jiaozuo, Jincheng, Kaifeng, Luohe, Luoyang, Nanyang, Pingdingshan, Puyang, Sanmenxia, Shangqiu, Suzhou (AH), Xingtai, Xinxiang, Xinyang, Xuchang, Zhoukou, Zhumadian27
Beibu Gulf (BBG)Nanning, Haikou, Beihai, Chongzuo, Fangchenggang, Maoming, Qinzhou, Yangjiang, Yulin9
Guanzhong Plain (GZP)Baoji, Linfen, Qingyang, Shangluo, Tongchuan, Weinan, Xian, Xianyang, Yuncheng9
Note: 1. When the spatial scopes of urban agglomerations overlap, the city is assigned to the urban agglomeration where its provincial capital is located, such as Liaocheng City in Shandong Province. 2. Some urban agglomerations include only certain counties or districts under the jurisdiction of prefecture-level cities located in their peripheral areas, such as Xingan County and Xiajiang County under the jurisdiction of Ji’an City in Jiangxi Province. Since these areas do not constitute complete prefecture-level cities, they cannot be included in the sample for econometric analysis. Therefore, the scope of the urban agglomerations examined in this study differs to some extent from their actual spatial scope. 3. As the Hong Kong Special Administrative Region and the Macao Special Administrative Region within the Guangdong-Hong Kong-Macao Greater Bay Area differ substantially from the nine mainland cities in terms of spatiotemporal development background, scale effects, functional linkages, institutional and policy environments, and statistical standards, this study excludes Hong Kong and Macao from the research scope and continues to conduct the analysis based on the scope of the Pearl River Delta urban agglomeration.
Table 2. Descriptive statistics of variables.
VariableVariable NameMeanStd.MinMax
Dependent
variable
GTFEE0.6060.0510.1731.013
GTFEE′0.8460.3550.2412.805
Core Explanatory variableln UFN8.8380.6912.3079.279
UFN′0.6440.6220.0305.672
Mechanism variableGovernment
action
ln MAR2.7730.3040.1763.433
LRM0.5690.0430.3301.527
SPR0.6170.2030.0000.950
Market efficiencyLFM0.6430.5700.0034.038
DRI0.7791.2160.0006.760
ln EPC4.4592.8250.00012.112
Moderating variablePOLY−0.2800.140−2.078−0.248
DEN0.1100.0130.0290.126
Control variablesUR0.5740.1440.2131.000
PGDP4.6832.9350.64617.192
KC18.1320.89115.42821.216
GOV0.1630.0580.0600.499
ln FDI12.5741.6245.70016.914
AGD0.0030.0010.0000.011
Table 3. Estimation results of the benchmark model.
VariablesGTFEE
(1)(2)(3)(4)
TWFETWFESYS-GMMSYS-GMM
ln UFN0.023 ***
(0.003)
0.023 ***
(0.003)
0.024 ***
(0.007)
0.024 ***
(0.007)
L.GTFEE 0.492 ***
(0.106)
0.465 ***
(0.117)
Control variablesNOYESNOYES
Constant0.410 ***
(0.026)
0.555
(0.352)
0.114 ***
(0.032)
0.073
(0.078)
AR(1) 0.0010.001
AR(2) 0.3540.502
Hansen test 0.4830.402
CityYESYESYESYES
YearYESYESYESYES
R-squared0.2230.233
N2072207217761776
Note: *** indicate significance at 1% levels, respectively. Values in parentheses are robust standard errors.
Table 4. Estimation results of robustness tests.
VariablesSubstituting the Core Explanatory Variable (UFN′)Replacement of the Dependent Variable
(GTFEE′)
Change in Time Window
(1)(2)(3)(4)(5)(6)(7)(8)(9)(10)(11)(12)
TWFETWFESYS-
GMM
SYS-
GMM
TWFETWFESYS-
GMM
SYS-
GMM
TWFETWFESYS-
GMM
SYS-
GMM
ln UFN0.028 **
(0.014)
0.028 **
(0.014)
0.084 *
(0.045)
0.079 *
(0.043)
0.023 ***
(0.003)
0.024 ***
(0.003)
0.021 ***
(0.004)
0.021 ***
(0.005)
UFN′ 0.042 ***
(0.010)
0.041 ***
(0.011)
0.045 **
(0.022)
0.046 **
(0.022)
L. GTFEE 0.853 ***
(0.055)
0.802 ***
(0.089)
0.533 ***
(0.091)
0.511 ***
(0.096)
L. GTFEE′ 0.502 ***
(0.062)
0.458 **
(0.063)
Control variablesNOYESNOYESNOYESNOYESNOYESNOYES
Constant0.594 ***
(0.010)
0.755 **
(0.363)
0.186 ***
(0.025)
0.317 ***
(0.053)
0.779 ***
(0.091)
9.988 ***
(2.447)
−0.071
(0.079)
−0.207
(0.314)
0.409 ***
(0.025)
0.405 ***
(0.104)
0.097 ***
(0.023)
0.045 ***
(0.054)
AR(1) 0.0000.000 0.0410.045 0.0010.001
AR(2) 0.5100.759 0.2700.219 0.3370.436
Hansen test 0.3250.218 0.9700.368 0.9990.997
CityYESYESYESYESYESYESYESYESYESYESYESYES
YearYESYESYESYESYESYESYESYESYESYESYESYES
R-squared0.1280.136 0.4590.548 0.1960.205
N207220721776177620722072177617761480148011841184
Note: *, **, and *** indicate significance at the 10%, 5%, and 1% levels, respectively. Values in parentheses are robust standard errors.
Table 5. Estimation results of the “Government Action” mechanism.
VariablesMarket IntegrationLand Resource MisallocationUrban Sprawl
ln MAR (1)GTFEE (2)LRM (3)GTFEE (4)SPR (5)GTFEE (6)
ln UFN0.224 ***
(0.041)
−0.005 **
(0.002)
−0.003 *
(0.002)
ln MAR 0.058 ***
(0.011)
L. lnMAR0.088
(0.089)
LRM −0.240 ***
(0.117)
L. LRM 0.513 **
(0.239)
SPR −0.036 *
(0.019)
L. SPR 0.928 ***
(0.016)
L. GTFEE 0.572 ***
(0.089)
0.410 ***
(0.072)
0.470 ***
(0.114)
Control variablesYESYESYESYESYESYES
Constant0.095
(0.734)
0.081
(0.075)
0.775
(0.095)
0.226
(0.129)
−0.213
(0.138)
0.072
(0.081)
AR(1)0.0090.0000.0140.0010.0000.010
AR(2)0.5480.1270.2420.4210.9620.753
Hansen test0.8260.4470.2500.6590.1840.566
CityYESYESYESYESYESYES
YearYESYESYESYESYESYES
N177617761776177616281628
Note: *, **, and *** indicate significance at the 10%, 5%, and 1% levels, respectively. Values in parentheses are robust standard errors.
Table 6. Estimation results for the “Market Efficiency” mechanism.
VariableFree Flow of FactorsInnovative Allocation of Production FactorsDiffusion of Green Technologies
LFM (1)GTFEE (2)DRI (3)GTFEE (4)ln EPC (5)GTFEE (6)
ln UFN0.051 ***
(0.019)
0.067 ***
(0.025)
0.513 ***
(0.161)
LFM 0.036 ***
(0.011)
L. LFM0.649 ***
(0.071)
DRI 0.013 ***
(0.004)
L. DRI 0.569 ***
(0.048)
ln EPC 0.009 *
(0.004)
L. ln EPC 0.518 ***
(0.044)
L. GTFEE 0.460 ***
(0.081)
0.455 ***
(0.108)
0.485 ***
(0.093)
Control variablesYESYESYESYESYESYES
Constant−0.333
(0.850)
0.260 **
(0.081)
−6.654 ***
(1.268)
0.245 **
(0.104)
−13.479 ***
(2.675)
0.190 *
(0.097)
AR(1)0.0030.0000.0000.0030.0000.000
AR(2)0.6830.3590.8600.6520.2570.199
Hansen test0.3940.3910.4280.4760.5960.451
CityYESYESYESYESYESYES
YearYESYESYESYESYESYES
N177617761776177617761776
Note: *, **, and *** indicate significance at the 10%, 5%, and 1% levels, respectively. Values in parentheses are robust standard errors.
Table 7. Results of heterogeneity analysis.
VariablesLocation Development EnvironmentLevel of Transportation InterconnectivityPolicy Continuity and Synergy
Proximity to the Coastline
(1)
Distance from the Coastline
(2)
High-Speed Rail Service
(3)
No High-Speed Rail Service
(4)
Long Tenure of Municipal Party Secretaries
(5)
Short Tenure of the Municipal Party Secretaries
(6)
ln UFN0.024 ***
(0.007)
−0.006
(0.012)
0.029 ***
(0.008)
0.016
(0.012)
0.019 **
(0.009)
0.010
(0.008)
L. GTFEE0.522 ***
(0.123)
0.677
(0.207)
0.431 ***
(0.127)
0.346 ***
(0.084)
0.453 **
(0.201)
0.242 ***
(0.082)
Control variablesYESY ESYESYESYESYES
Constant0.279
(0.088)
−2.376
(1.451)
−0.006
(0.145)
−0.017
(0.168)
0.087
(0.142)
0.029
(0.166)
AR(1)0.0020.0430.0090.0170.0900.061
AR(2)0.5660.4910.6390.3100.9860.571
Hansen test0.8511.0000.6331.0000.9951.000
Chow test p-value0.0100.0000.042
CityYESYESYESYESYESYES
YearYESYESYESYESYESYES
N14882881103502567392
Note: **, and *** indicate significance at the 5%, and 1% levels, respectively. Values in parentheses are robust standard errors.
Table 8. Results of analysis of polycentricity and agglomeration externalities.
VariablePolycentricityAgglomeration Externalities
(1)(2)(3)(4)
ln UFN0.043 ***
(0.012)
0.050 ***
(0.010)
0.053 ***
(0.013)
0.028 ***
(0.005)
POLY0.050 *
(0.028)
DEN 0.289
(0.284)
−5.808 *
(3.342)
POLY × ln UFN 0.017 **
(0.007)
DEN × ln UFN 0.682 *
(0.371)
L. GTFEE0.545 ***
(0.067)
0.168 *
(0.097)
0.551 ***
(0.076)
0.477 ***
(0.071)
Control variablesYESYESYESYES
Constant0.230 ***
(0.076)
0.415 ***
(0.142)
0.151 ***
(0.056)
0.199 ***
(0.055)
AR(1)0.0010.0010.0020.000
AR(2)0.5130.3440.3940.459
Hansen test0.1040.1060.1660.999
CityYESYESYESYES
YearYESYESYESYES
N1776177617761776
Note: *, **, and *** indicate significance at the 10%, 5%, and 1% levels, respectively. Values in parentheses are robust standard errors.
Disclaimer/Publisher’s Note: The statements, opinions and data contained in all publications are solely those of the individual author(s) and contributor(s) and not of MDPI and/or the editor(s). MDPI and/or the editor(s) disclaim responsibility for any injury to people or property resulting from any ideas, methods, instructions or products referred to in the content.