1. Introduction
Corporate social responsibility (CSR) has evolved into a strategic imperative in contemporary business, shaping not only firms’ ethical obligations but also their financial and competitive outcomes. Increasing global emphasis on environmental stewardship, social accountability, and governance transparency has compelled organizations to embed CSR into their core strategies [
1,
2,
3]. From a theoretical standpoint, stakeholder theory posits that firms engaging in CSR can enhance trust and cooperation among stakeholders [
4], while legitimacy theory suggests that CSR enables firms to align with societal expectations and secure continued access to critical resources [
5,
6]. Through these mechanisms, CSR may reduce information asymmetry, improve corporate reputation, and ultimately enhance FP [
7].
Despite strong theoretical support, empirical findings on the CSR–FP relationship remain inconclusive. While several studies report positive effects such as improved profitability, firm value, and return on equity (ROE) [
8,
9,
10], others document neutral or even negative relationships due to the costs and inefficiencies associated with CSR implementation [
11,
12,
13]. These inconsistencies suggest that CSR alone may not be sufficient to generate superior financial outcomes. Instead, the effectiveness of CSR appears to depend on firm-specific capabilities and contextual factors, particularly in emerging markets characterized by weaker institutional frameworks and evolving disclosure practices [
14,
15,
16]. In the present study, financial performance is assessed using return on equity (ROE), an accounting-based measure that reflects the efficiency with which firms generate returns from shareholders’ equity. ROE was selected because it directly captures value creation for shareholders and is widely employed in studies examining the financial implications of CSR and intellectual capital in publicly listed firms [
17,
18,
19].
Empirical investigations of the CSR–financial performance relationship also differ in how CSR is operationalized. While some studies evaluate firms’ underlying sustainability performance, others rely on ESG disclosures as observable indicators of corporate sustainability practices [
12,
14,
20]. Consistent with the latter approach, this study measures CSR using a content-analysis-based ESG disclosure index derived from publicly available sustainability and corporate governance reports. Findings should be interpreted as reflecting the financial implications of CSR disclosure rather than the effectiveness of firms’ underlying sustainability practices.
A critical yet underexplored mechanism in this relationship is intellectual capital (IC), which represents a firm’s stock of intangible resources, including human, structural, and capital efficiencies [
21,
22]. Drawing on the resource-based view (RBV) [
23] and dynamic capabilities theory [
24], IC enables firms to effectively design, implement, and leverage CSR initiatives to create value. HCE enhances employees’ ability to innovate and execute sustainability strategies; SCE supports the institutionalization of CSR through systems and processes; and CEE ensures that financial and physical resources are optimally allocated to CSR investments [
10,
25]. Although prior research has established the direct effects of IC on firm performance [
26,
27], its role as a moderating mechanism in the CSR–FP relationship remains insufficiently examined.
Taken together, these theoretical perspectives provide a coherent explanation for the proposed relationships. Stakeholder theory and legitimacy theory explain why firms engage in CSR to strengthen stakeholder relationships and maintain societal legitimacy, whereas the resource-based view and dynamic capabilities theory explain why the financial benefits of CSR depend on firms’ ability to mobilize and deploy strategic resources. Within this framework, intellectual capital enhances firms’ ability to translate CSR initiatives into financial value through the efficient deployment of human capabilities, organizational processes, and capital resources. Consequently, differences in the efficiency of these resources may influence the extent to which CSR initiatives contribute to financial performance, thereby providing the theoretical basis for the proposed moderating roles of HCE, SCE, and CEE.
This gap is particularly evident in emerging market contexts such as the Philippines. As a rapidly developing economy with increasing regulatory emphasis on sustainability reporting, Philippine publicly listed firms face growing pressure to balance profitability with social responsibility. However, empirical evidence on how CSR translates into FP in this context remains limited. Existing studies have largely relied on cross-sectional designs and often treated IC as a single aggregate construct, thereby overlooking temporal dynamics and the distinct roles of its components (HCE, SCE, and CEE) [
28]. Moreover, comparative evidence on which component of IC most strongly enhances the financial returns of CSR is scarce [
29].
Recent studies in other emerging economies (e.g., Vietnam, Indonesia, and Middle Eastern markets) suggest that IC can enhance the effectiveness of CSR initiatives [
30,
31,
32]. However, these findings are not readily generalizable to the Philippine setting due to differences in institutional environments, governance structures, ownership concentration, and the maturity of sustainability reporting practices. As an emerging capital market characterized by evolving ESG disclosure requirements and increasing regulatory emphasis on corporate sustainability, the Philippines provides an important context for examining whether relationships established largely in developed and other emerging markets remain applicable under different institutional conditions. Consequently, a longitudinal, context-specific analysis integrating CSR and IC can extend the external validity of existing evidence while providing insights that are relevant to managers, investors, and policymakers operating in similar emerging-market environments.
Addressing these gaps, this study employs a longitudinal panel design of Philippine publicly listed firms from 2019 to 2024 to examine the moderating role of IC, specifically HCE, SCE, and CEE, in the CSR–FP relationship. By adopting a hierarchical moderated regression approach, this study contributes to the literature in three key ways. First, it advances theoretical understanding by integrating CSR and IC within the RBV and dynamic capabilities framework. Second, it provides empirical evidence from an underexplored emerging market using panel data, thereby enhancing causal inference and robustness. Third, it identifies which component of IC exerts the strongest moderating effect, offering actionable insights for managers and policymakers seeking to optimize CSR investments and improve FP.
Against this backdrop, the present study aims to examine the relationship between CSR disclosure and financial performance among Philippine publicly listed firms while evaluating the moderating role of intellectual capital. Specifically, the study investigates the direct effect of CSR disclosure on ROE, examines the individual effects of HCE, SCE, and CEE on financial performance, and assesses whether these components of intellectual capital moderate the relationship between CSR disclosure and financial performance. By addressing these objectives using longitudinal panel data, the study seeks to provide a more robust understanding of how intellectual capital influences the financial implications of CSR disclosure in an emerging market context.
2. Literature Review
CSR is grounded in multiple theoretical perspectives that explain its potential impact on firm performance. Stakeholder theory argues that firms must address the interests of diverse stakeholders, including employees, customers, investors, and communities, to achieve long-term success [
4]. By fostering trust and cooperation, CSR can enhance a firm’s reputation and reduce transaction costs. Complementarily, legitimacy theory suggests that firms engage in CSR to align with societal norms and expectations, thereby securing legitimacy and continued access to resources [
5,
6].
Empirical evidence generally supports a positive relationship between CSR and FP. Meta-analyses [
33,
34,
35,
36] indicate that CSR contributes to improved profitability, risk management, and firm valuation. However, the trade-off perspective contends that CSR may impose additional costs that reduce short-term FP [
37,
38]. These competing perspectives highlight the importance of identifying moderating factors that condition the CSR–performance relationship.
2.1. CSR and FP
CSR activities such as environmental sustainability initiatives, employee welfare programs, and community engagement can enhance firm performance by improving stakeholder relationships, reducing regulatory risks, and strengthening corporate reputation [
39,
40,
41]. From an RBV perspective, CSR can be viewed as a strategic intangible asset that generates reputational capital and competitive advantage [
42,
43,
44].
However, the effectiveness of CSR is context-dependent. In emerging markets, institutional voids, weaker regulatory enforcement, and heterogeneous stakeholder expectations may influence how CSR translates into financial outcomes [
36,
45]. In the Philippines, increasing regulatory pressure from the Securities and Exchange Commission (SEC) and the adoption of sustainability reporting frameworks have heightened the importance of CSR disclosure and performance.
ROE is widely used as an indicator of FP, reflecting how efficiently firms utilize shareholders’ equity to generate earnings [
18,
46,
47]. Given its relevance to investors and corporate decision-making, ROE serves as an appropriate measure for evaluating the financial implications of CSR.
H1. CSR has a positive and significant effect on FP (ROE).
2.2. IC and FP
The RBV posits that firms achieve sustained competitive advantage through valuable, rare, inimitable, and non-substitutable (VRIN) resources [
23]. IC represents such a resource, encompassing knowledge-based assets that drive innovation and efficiency. The value-added intellectual capital (VAIC) framework operationalizes IC into three components: HCE, SCE, and CEE [
22].
Empirical studies consistently show that IC positively influences firm performance, particularly in knowledge-intensive and emerging market contexts [
25,
26].
2.2.1. HCE
Human capital reflects employees’ knowledge, skills, and competencies. Firms with higher HCE are better equipped to innovate, adapt to environmental changes, and implement complex strategies such as CSR [
27,
48,
49].
H2a. HCE positively affects FP (ROE).
2.2.2. SCE
Structural capital represents institutionalized knowledge embedded in organizational processes, systems, and routines. It facilitates knowledge sharing, enhances operational efficiency, and supports consistent performance [
32,
50,
51].
H2b. SCE positively affects financial performance (ROE).
2.2.3. CEE
CEE reflects how effectively firms utilize financial and physical capital to generate value. Efficient capital allocation is essential for ensuring that CSR investments translate into measurable financial outcomes [
27,
33,
52].
H2c. CEE positively affects FP (ROE).
2.3. Moderating Role of Intellectual Capital
Although CSR is expected to enhance FP, its effectiveness depends on firms’ capabilities to implement and leverage CSR initiatives. Dynamic capabilities theory emphasizes that firms must possess the ability to integrate and reconfigure resources to achieve superior performance [
24]. IC serves as a critical mechanism that enables firms to operationalize CSR strategies effectively.
2.3.1. Moderating Role of HCE
Employees are central to CSR implementation, as they design and execute sustainability initiatives. Firms with higher HCE are more likely to develop innovative CSR strategies and effectively communicate their value [
53,
54].
H3a. HCE positively moderates the relationship between CSR and ROE.
2.3.2. Moderating Role of SCE
Structural capital provides the systems and processes necessary to institutionalize CSR practices within the organization [
32,
53].
H3b. SCE positively moderates the relationship between CSR and ROE.
2.3.3. Moderating Role of CEE
Efficient capital utilization enhances the ability of firms to convert CSR investments into FP [
53].
H3c. CEE positively moderates the relationship between CSR and ROE.
While all components of IC are expected to strengthen the CSR–FP relationship, their relative influence may vary. Prior research suggests that human capital often plays a dominant role due to its direct impact on innovation and strategic decision-making [
44,
55]. However, empirical evidence comparing the relative strength of IC components remains limited, particularly in emerging market contexts.
This study addresses this gap by examining the comparative moderating effects of HCE, SCE, and CEE.
H4. One component of IC (HCE, SCE, or CEE) exerts the strongest moderating effect on the CSR–ROE relationship.
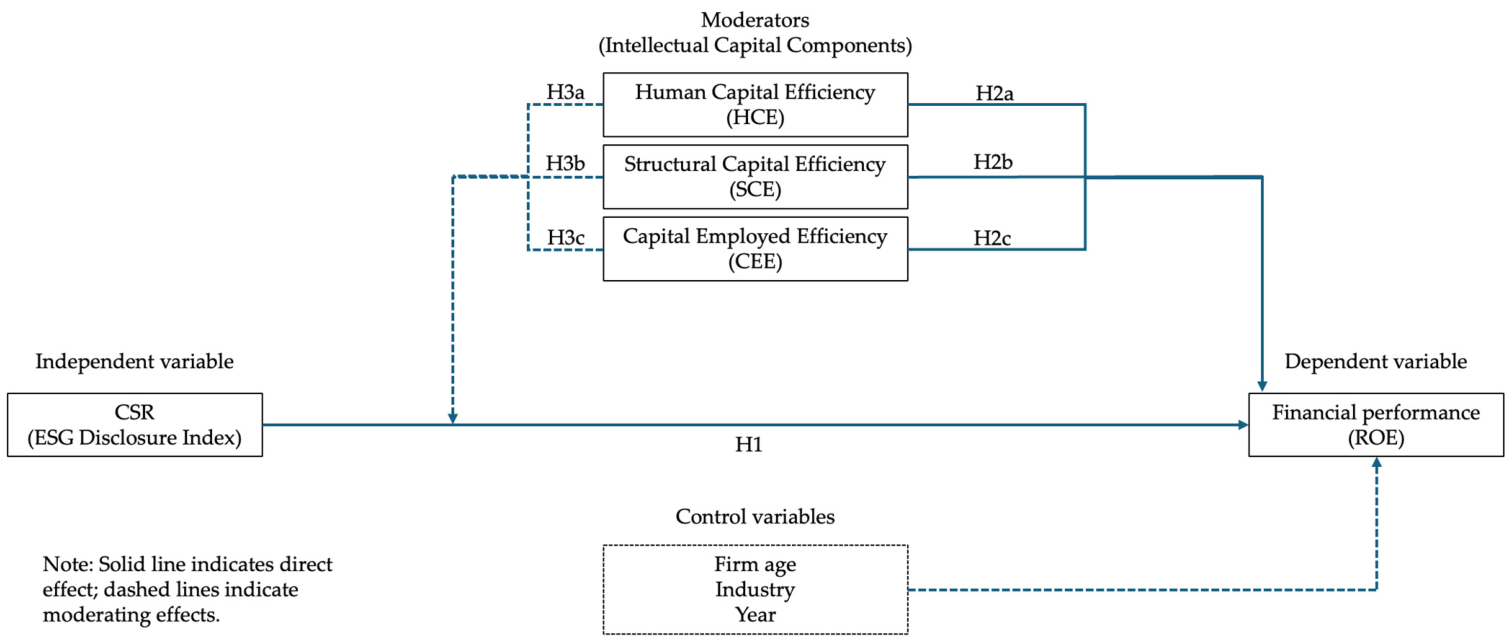
Based on the theoretical foundations and hypotheses developed in the preceding sections,
Figure 1 presents the proposed research model. The model illustrates the hypothesized relationships among CSR disclosure, financial performance, and the three components of intellectual capital, while accounting for the effects of the control variables included in the panel regression models.
3. Materials and Methods
3.1. Sample and Data Description
The sample comprised 23 firms listed in the Philippine Stock Exchange Index (PSEi) observed over a six-year period from 2019 to 2024, yielding a total of 138 firm-year observations. The dataset constitutes a balanced panel, as all selected firms were consistently included in the index throughout the study period and had complete data for all variables of interest.
Firms were drawn from multiple industry sectors, including holding firms, property, financials, services, industrials, and mining and oil, based on the sectoral classification system of the Philippine Stock Exchange. This sectoral diversity enhances the generalizability of the findings across major segments of the Philippine economy while allowing for the control of industry-specific effects in subsequent analyses.
The inclusion criterion required firms to have continuous membership in the PSEi from 2019 to 2024, ensuring consistency in firm characteristics and reducing potential bias arising from index rebalancing. No firms were excluded due to missing data, as all selected companies had complete disclosures in their sustainability reports, corporate governance reports, and financial statements over the observation period. PSEi comprises the largest and most actively traded publicly listed companies in the Philippines; the sample provides meaningful coverage of firms with relatively high market capitalization, liquidity, and disclosure obligations. Nevertheless, the findings should be interpreted as representative of large Philippine-listed firms rather than the broader population of publicly listed companies or privately held firms.
3.2. CSR Measurement
CSR was operationalized using a content analysis-based Environmental, Social, and Governance (ESG) disclosure index. The index was constructed from a comprehensive checklist comprising 158 disclosure items, including 40 environmental, 51 social, and 67 governance indicators. Accordingly, the index captures the extent of CSR disclosure rather than the actual ESG performance of firms.
The environmental and social disclosure items were derived from SEC Philippines Memorandum Circular No. 4, Series of 2019 (Sustainability Reporting Guidelines for Publicly Listed Companies), which is primarily aligned with the Global Reporting Initiative framework. The governance disclosure items were obtained from the Integrated Annual Corporate Governance Report (I-ACGR), which is based on the Code of Corporate Governance for Publicly Listed Companies issued by the SEC Philippines. All disclosures were sourced from publicly available corporate reports, ensuring transparency and replicability.
Each disclosure item was coded using a binary scoring approach (1 = disclosed, 0 = not disclosed), and no weighting scheme was applied to minimize subjectivity, consistent with prior CSR disclosure studies [
56,
57,
58]. The CSR index for each firm-year observation was computed as the proportion of disclosed items relative to the total number of possible items, expressed as a percentage.
3.3. FP and IC Measurement
FP was measured using ROE, computed as net income divided by shareholders’ equity and expressed as a percentage. Net income and equity figures were obtained from firms’ audited annual reports, with ending equity used in the computation. ROE was selected due to its widespread use in CSR–performance research [
18,
34,
35,
46,
47].
IC was operationalized using the VAIC framework [
22], which has been widely applied in emerging market contexts due to its reliance on publicly available accounting data. The model includes HCE, SCE, and CEE. Value added (VA) was computed as the sum of operating profit, employee costs, depreciation, and amortization, consistent with prior VAIC studies [
18]. Human capital (HC) was proxied by total employee costs, structural capital (SC) was calculated as VA minus HC, and capital employed (CE) was proxied by the book value of net assets. The study focuses on VAIC efficiency components (HCE, SCE, and CEE) to evaluate and compare their individual moderating effects on the CSR–financial performance relationship, rather than to estimate an overall intellectual capital index.
The efficiency measures were computed as follows: HCE was calculated as value added divided by human capital (HCE = VA/HC), SCE as structural capital divided by value added (SCE = SC/VA), and CEE as value added divided by capital employed (CEE = VA/CE). These measures capture the efficiency with which firms utilize their resources to generate value [
26,
59].
3.4. Control Variables
To mitigate omitted-variable bias, firm age, industry, and year effects were controlled for. Firm age was measured as the number of years since incorporation and serves as a proxy for organizational maturity and accumulated experience. Industry effects were controlled using the Philippine Stock Exchange (PSE) sector classification. Industry was treated as a categorical variable and represented using treatment-coded dummy variables, with Holding Firms serving as the reference category to account for sector-specific differences in regulatory environments and operational characteristics. Year dummy variables were included to capture time-varying macroeconomic conditions and external shocks that may influence firm performance [
60].
Table 1 summarizes the definitions and measurements of all variables used in the study.
3.5. Model Specification
To examine the relationship between CSR, IC, and FP, a series of hierarchical panel regression models were estimated.
Model 1: Baseline model (controls only)
Model 2: Main effects model (CSR added)
Model 3: Intellectual capital model (direct effects)
Separate models were estimated for each IC component:
Model 4: Moderation models (interaction effects)
To test the moderating role of IC, interaction terms between CSR and each IC component were included:
In all models, ROEit represents the FP of firm i in year t. CSRit denotes the CSR index, while IC is operationalized separately as HCE, SCE, and CEE. The interaction terms (CSR × IC) capture the moderating effects of IC on the CSR–FP relationship.
Firm age, industry dummy variables, and year dummy variables were included as controls. The error term is denoted by ε
it. All continuous variables were mean-centered prior to the creation of interaction terms to reduce multicollinearity and facilitate interpretation of moderation effects [
61].
3.6. Data Screening and Measurement Quality Procedures
Prior to hypothesis testing, the dataset was subjected to data screening and diagnostic procedures to ensure the validity of subsequent statistical analyses. Specifically, the data were examined for univariate and multivariate outliers and distributional assumptions. Standardized z-scores were used to identify univariate outliers, while Mahalanobis distance was employed to detect multivariate outliers. Distributional properties were assessed using skewness, kurtosis, histograms, and Q–Q plots, following established guidelines [
62]. Where appropriate, winsorization was applied to mitigate the influence of extreme values while preserving observations [
63]. Specifically, ROE, SCE, and CEE were winsorized at the 2.5th and 97.5th percentiles, whereas HCE was winsorized at the 5th and 95th percentiles. This procedure adjusted 8 values for ROE, 14 for HCE, 8 for SCE, and 8 for CEE, while retaining all 138 firm-year observations for subsequent analyses.
In addition, the measurement quality of the ESG disclosure index was evaluated. Given the content analysis approach, a rule-based coding protocol was implemented to ensure consistency in scoring. Intra-coder reliability was assessed through a repeated coding procedure, and internal consistency reliability was evaluated using Cronbach’s alpha and McDonald’s omega. These procedures ensure that the ESG index provides a reliable representation of CSR disclosure.
3.7. Statistical Techniques
The specified regression models were estimated using hierarchical panel regression analysis to evaluate both direct and moderating effects. This approach enables the assessment of incremental variance explained across model steps (Δ
R2) and is appropriate for testing interaction effects [
61]. Variables were entered sequentially in accordance with the model specification.
To ensure robustness, both fixed-effects and random-effects panel models were estimated to account for unobserved heterogeneity across firms. The appropriate model specification was determined using the Hausman test [
64], where a significant result indicates preference for fixed-effects estimation.
Although the use of longitudinal panel data, fixed-effects models, Hausman specification tests, and firm-clustered robust standard errors helps mitigate bias arising from unobserved heterogeneity, these approaches do not fully eliminate endogeneity resulting from reverse causality or omitted time-varying variables. More advanced causal identification methods, such as instrumental-variable estimation or dynamic panel estimators, were not implemented because the relatively small panel (23 firms observed over six years) limits the reliability and statistical power of such approaches. Accordingly, the findings should be interpreted as robust panel associations rather than definitive causal effects.
Potential violations of classical regression assumptions were addressed by conducting heteroskedasticity and autocorrelation diagnostics. To correct for these issues, robust standard errors clustered at the firm level were employed, ensuring consistent and reliable statistical inference in panel data settings [
60]. All analyses were conducted using Jamovi version 2.6.44, utilizing the GAMLj module for hierarchical regression and moderation analysis and the Rj Editor module for panel data estimation.
4. Results
4.1. Data Screening and Preliminary Analysis
Prior to hypothesis testing, the dataset was screened to ensure data quality, detect outliers, and assess distributional assumptions. Missing data analysis indicated no missing values across all variables. Univariate outliers were assessed using standardized z-scores (±3.29) [
62], and Winsorization was applied to variables with extreme values, consistent with robust statistical practices [
63]. Multivariate outliers were examined using Mahalanobis distance, with no observations exceeding the critical threshold (χ
2 = 20.52,
p < 0.001), indicating no influential cases. Distributional diagnostics, including skewness, kurtosis, histograms, and Q–Q plots, confirmed that all variables met acceptable thresholds for parametric analysis [
65].
4.2. Reliability and Construct Validity
Given that ESG disclosures were coded by a single researcher, inter-coder reliability could not be assessed. To minimize subjectivity, a rule-based coding protocol was applied, and intra-coder reliability was evaluated by re-coding 15% of the reports after a three-week interval. Cohen’s kappa indicated strong agreement (κ = 0.87), exceeding the recommended threshold of 0.80 [
66]. Internal consistency reliability was assessed using Cronbach’s alpha (α) and McDonald’s omega (ω). The environmental (α = 0.93, ω = 0.93), social (α = 0.92, ω = 0.91), and governance (α = 0.93, ω = 0.94) dimensions demonstrated excellent reliability. The overall ESG index also exhibited strong internal consistency (α = 0.90, ω = 0.92), exceeding the recommended threshold of 0.70 [
65]. Since the ESG index was specified as a formative construct based on predefined regulatory criteria. Cronbach’s alpha and McDonald’s omega are reported as supplementary indicators of coding consistency rather than evidence of construct validity. Accordingly, factor analysis was not conducted, and content validity was prioritized [
67].
4.3. Descriptive Statistics and Correlations
Table 2 presents the descriptive statistics and Pearson correlation coefficients among the study variables. ESG disclosure exhibited a moderate level across firms (M = 64.9, SD = 11.2), while ROE showed considerable variability (M = 13.1, SD = 8.46).
Correlation analysis revealed that ESG disclosure was not significantly associated with ROE (r = 0.013, p > 0.05). In contrast, IC components, HCE (r = 0.382, p < 0.001), SCE (r = 0.368, p < 0.001), and CEE (r = 0.829, p < 0.001), were positively and significantly correlated with ROE, providing preliminary support for H2a–H2c. ESG disclosure was positively related to CEE (r = 0.282, p < 0.001) but not significantly associated with HCE or SCE. Firm age was positively correlated with ESG disclosure (r = 0.297, p < 0.001). Notably, high correlations were observed between HCE and SCE (r = 0.816, p < 0.001) and between CEE and ROE (r = 0.829, p < 0.001), indicating potential multicollinearity concerns. Although the correlations between CEE and ROE (r = 0.829) and between HCE and SCE (r = 0.816) were relatively high, these relationships are theoretically expected under the VAIC framework because the constructs share common accounting foundations. Nevertheless, the variables represent conceptually distinct dimensions of firm performance and intellectual capital efficiency. Consistent with this interpretation, VIF remained within acceptable limits, indicating that construct overlap did not result in problematic multicollinearity in the regression analyses.
4.4. Regression Assumption Testing
Prior to hypothesis testing, the assumptions of multiple regression were evaluated. All predictor and moderator variables were mean-centered prior to analysis to reduce multicollinearity and facilitate interpretation of interaction terms. Visual inspection of scatterplots indicated that the relationships between predictors and ROE were linear. Visual inspection of the residual plots suggested no substantial departures from homoscedasticity. However, the Breusch–Pagan test indicated evidence of heteroskedasticity (BP = 22.10, p = 0.015). Accordingly, firm-clustered robust standard errors were employed in the panel analyses to account for heteroskedasticity and ensure valid statistical inference. Normality of residuals was assessed using histograms, Q–Q plots, and the Shapiro–Wilk test. Although the Shapiro–Wilk test indicated a statistically significant departure from normality (W = 0.881, p < 0.001), visual inspection of the histogram and Q–Q plot revealed only minor deviations in the tails. Given the sensitivity of formal normality tests in moderate-sized samples, the graphical diagnostics were considered more informative, indicating that the residuals were sufficiently close to normal for the purposes of the regression analyses.
Multicollinearity diagnostics showed that variance inflation factors (VIF) ranged from 1.17 to 1.92 and tolerance values exceeded 0.20 for the ESG × HCE and ESG × CEE models, indicating no multicollinearity concerns. In the ESG × SCE model, slightly elevated VIF values (approximately 6.07–6.08) were observed for SCE and its interaction term. Given that variables were mean-centered and separate models were estimated, these values were considered acceptable and reflective of the inherent overlap between interaction terms and their components. However, results should be interpreted with caution for the SCE model due to moderate multicollinearity.
The Durbin–Watson test indicated no evidence of autocorrelation (DW = 2.20, p = 0.424). Finally, Cook’s distance values were all below 1, suggesting the absence of influential observations. Overall, the results indicate that the assumptions of multiple regression were generally satisfied. Although heteroskedasticity was detected, firm-clustered robust standard errors were employed to ensure valid statistical inference.
4.5. Hierarchical Regression Results
4.5.1. Direct Effects of ESG and IC
Table 3 presents the results of the hierarchical regression analyses. In Model 1, the control variables explained 41.7% of the variance in ROE (
R2 = 0.417, adjusted
R2 = 0.366), and firm age was not a significant predictor. The inclusion of ESG in Model 2 significantly improved model fit (
R2 = 0.460, Δ
R2 = 0.0436,
F change = 10.11,
p < 0.01). Contrary to H1, ESG exhibited a significant negative effect on ROE (
B = −0.1961, β = −0.2588,
p < 0.01), indicating that higher ESG disclosure is associated with lower accounting-based FP.
In the HCE model (Model 3), explanatory power increased significantly (R2 = 0.552, ΔR2 = 0.0917, F change = 25.37, p < 0.001). HCE was positively associated with ROE (B = 1.0688, β = 0.4426, p < 0.001), supporting H2a, while ESG remained negatively significant. In contrast, SCE did not significantly predict ROE (B = 0.7702, β = 0.1359, p > 0.05), and its inclusion resulted in only a marginal increase in explained variance (ΔR2 = 0.0164, p > 0.05), providing no support for H2b.
The CEE model exhibited the strongest direct effect. The inclusion of CEE substantially increased the explained variance (R2 = 0.753, ΔR2 = 0.2927, F change = 146.9, p < 0.001). CEE was strongly and positively associated with ROE (B = 78.8028, β = 0.8950, p < 0.001), supporting H2c. ESG remained significantly negative across models.
4.5.2. Moderating Effects of IC
The moderating effects were examined by introducing interaction terms, with results summarized in
Table 4. For the HCE model, the ESG × HCE interaction was positive and significant (
B = 0.0593, β = 0.2193,
p < 0.01), contributing an additional 2.19% to explained variance (Δ
R2 = 0.0219,
F change = 6.31,
p < 0.05). This supports H3a, indicating that HCE reduces the negative ESG–ROE relationship.
In contrast, the ESG × SCE interaction was not significant (B = −0.1317, β = −0.1477, p > 0.05), and the increase in explained variance was negligible (ΔR2 ≈ 0.0006). Thus, H3b is not supported.
4.5.3. Interaction Interpretation
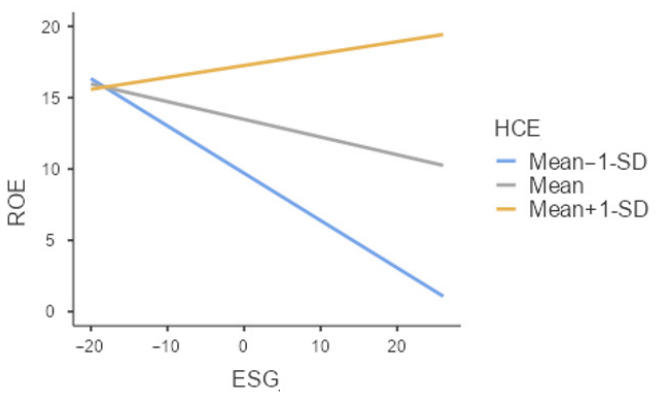
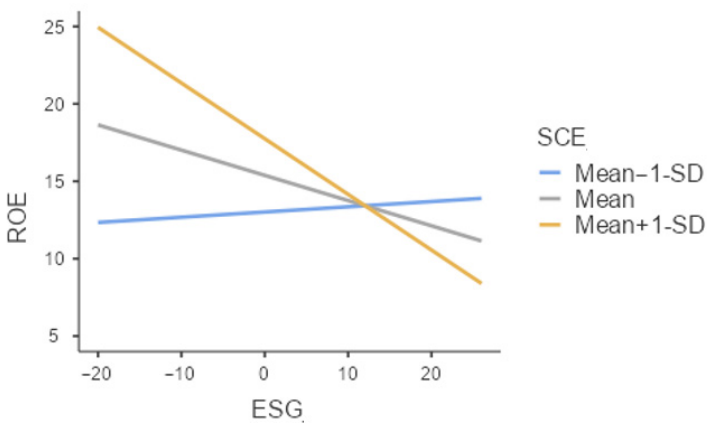
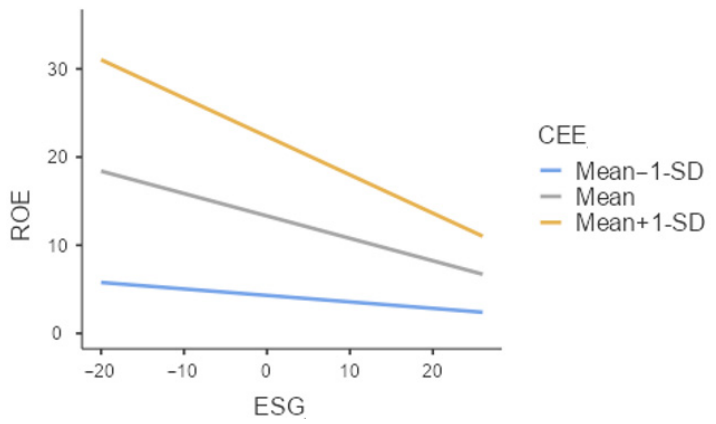
To further interpret the moderation effects, simple slopes analyses were conducted and are illustrated in
Figure 2,
Figure 3 and
Figure 4.
As shown in
Figure 2, at low levels of HCE (−1 SD), ESG had a significant negative effect on ROE (
B = −0.332, β = −0.438,
p < 0.001). At the mean level, the effect remained negative but weaker (
B = −0.124, β = −0.164,
p = 0.034). At high levels of HCE (+1 SD), the relationship became positive and nonsignificant (
B = 0.084, β = 0.110,
p = 0.466). This pattern indicates that the negative effect of ESG on ROE diminishes as HCE increases, suggesting that firms with stronger human capital are better able to offset the short-term financial costs associated with ESG activities.
As shown in
Figure 3, ESG had a significant negative effect on ROE at low (
B = −1.195, β = −1.578,
p < 0.001) and mean levels of SCE (
B = −0.265, β = −0.350,
p < 0.001), but became significantly positive at high levels (
B = 0.664, β = 0.877,
p = 0.006). However, because the overall ESG × SCE interaction term was not statistically significant, these slope differences should be interpreted with caution. Thus, SCE does not provide reliable evidence of moderation.
As shown in
Figure 4, ESG had a nonsignificant effect on ROE at low levels of CEE (
B = −0.073, β = −0.097,
p = 0.166), a significant negative effect at mean levels (
B = −0.254, β = −0.336,
p < 0.001), and an even stronger negative effect at high levels (
B = −0.435, β = −0.575,
p < 0.001). This pattern indicates that the negative effect of ESG on ROE intensifies as CEE increases, suggesting that firms with highly efficient capital utilization experience stronger short-term financial trade-offs from ESG activities.
4.5.4. Comparative Strength of Moderators
Within the pooled hierarchical regression models, the CSR × CEE interaction exhibited the largest standardized interaction coefficient (β = −0.251) and the greatest increase in explained variance (ΔR2 = 0.031), followed by HCE (β = 0.219, ΔR2 = 0.022), whereas SCE showed no meaningful interaction effect (β = −0.148, ΔR2 < 0.001). These findings initially suggested that CEE was the strongest moderator of the CSR–ROE relationship.
However, the robustness analyses yielded a different conclusion. The CSR × CEE interaction was not statistically significant in either the fixed-effects model (B = −0.419, p > 0.05) or the random-effects model (B = −0.905, p > 0.05), and it likewise became nonsignificant when estimated using firm-clustered robust standard errors (B = −0.418, SE = 1.167, p > 0.05). Consequently, although CEE appeared to be the strongest moderator in the pooled regression models, this effect was not robust after controlling for unobserved firm-specific heterogeneity and heteroscedasticity. Accordingly, the evidence does not support concluding that CEE is a stable moderating mechanism. Instead, the robustness analyses indicate that CEE is a consistently strong direct predictor of ROE rather than a robust moderator of the CSR–ROE relationship.
4.6. Robustness Checks
To ensure the validity of the main findings, additional panel regression analyses were conducted using fixed-effect (FE) and random-effect (RE) estimators, followed by Hausman specification tests and robustness checks using cluster-robust standard errors.
4.6.1. Fixed-Effects vs. Random-Effects Models
The results of the FE and RE models are presented in
Table 5. For the HCE model, the Hausman test was not statistically significant (χ
2 = 3.423,
p = 0.490), indicating that the random-effects specification is appropriate. Across both FE and RE estimations, HCE exhibited a positive and statistically significant main effect on ROE (FE:
B = 1.485,
p < 0.001; RE:
B = 1.440,
p < 0.001). Importantly, the ESG × HCE interaction remained positive and significant in both models (FE:
B = 0.0879,
p < 0.05; RE:
B = 0.098,
p < 0.01). This consistency suggests that the moderating effect of HCE is robust to unobserved firm-level heterogeneity.
For the SCE model, the Hausman test was also not significant (χ2 = 7.680, p = 0.104), supporting the use of the random-effects estimator. Neither the main effect of SCE nor the ESG × SCE interaction was statistically significant in either specification. These findings are consistent with the main regression results and reinforce the conclusion that SCE does not exert a meaningful moderating effect.
For the CEE model, the Hausman test was significant (χ2 = 11.3, p = 0.023), indicating that the fixed-effects model is preferred. In the FE specification, CEE remained a strong positive predictor of ROE (B = 118.379, p < 0.001), and ESG retained a negative effect (B = −0.164, p < 0.05). However, the ESG × CEE interaction term was not statistically significant in either FE or RE models. This contrasts with the hierarchical regression results, where the interaction was significant, suggesting that the moderating effect of CEE may be sensitive to unobserved firm-specific factors.
Overall, the panel estimations provide partial support for the moderating role of IC. The HCE interaction appears robust across estimators, whereas SCE remains consistently insignificant. The moderating effect of CEE is not supported under panel specifications, indicating potential bias in the pooled regression estimates.
4.6.2. Robust Standard Errors
To further assess robustness, fixed-effects models were re-estimated using cluster-robust standard errors at the firm level. The results are reported in
Table 6.
Across all models, the main effect of ESG on ROE became statistically nonsignificant after adjusting for heteroscedasticity and within-firm correlation (HCE: B = −0.129, SE = 0.170; SCE: B = −0.098, SE = 0.150; CEE: B = −0.164, SE = 0.097). This suggests that the previously observed negative ESG–ROE relationship is sensitive to variance assumptions.
In the HCE model, although the coefficient of HCE remained positive, it was no longer statistically significant under robust estimation (B = 1.485, SE = 0.827). More importantly, the ESG × HCE interaction also became nonsignificant (B = 0.088, SE = 0.056), indicating that the moderating effect of HCE is not robust to firm-level clustering. Similarly, in the SCE model, neither the main effect nor the interaction term was statistically significant, reinforcing earlier findings that SCE does not play a moderating role.
In the CEE model, the main effect of CEE remained strongly positive and statistically significant (B = 118.379, SE = 20.633, p < 0.001), confirming its robustness as a predictor of FP. However, the ESG × CEE interaction was not statistically significant (B = −0.418, SE = 1.167), suggesting that the previously observed moderating effect is not robust under more conservative estimation.
4.6.3. Summary of Robustness Findings
Taken together, the robustness analyses reveal important nuances in the moderating role of IC. First, while the hierarchical regression results suggested significant moderation effects for HCE and CEE, these effects are sensitive to model specification and estimation approach. The HCE interaction remains significant in FE and RE models but loses significance under cluster-robust estimation, indicating potential dependence on variance assumptions.
Second, the moderating effect of CEE is not supported under panel estimators or robust standard errors, suggesting that its significance in the main model may be driven by unobserved heterogeneity or cross-sectional variation. Third, SCE consistently shows no moderating effect across all specifications, strengthening confidence in the conclusion that SCE does not influence the ESG–ROE relationship.
Overall, the robustness analyses indicate that the evidence for the moderating role of IC is weaker than suggested by the pooled hierarchical regression models. Although HCE and CEE exhibited significant interaction effects in the baseline analyses, these effects were not consistently supported after accounting for unobserved firm-specific heterogeneity and using cluster-robust standard errors. Consequently, the moderation findings should be interpreted as model-dependent rather than conclusive. In contrast, the direct positive effect of CEE on ROE remained statistically significant across all estimation approaches, indicating that CEE contributes more consistently as a direct driver of financial performance than as a moderator of the CSR–ROE relationship.
4.7. Supplementary Analyses
To further examine the relationship between CSR and FP, supplementary analyses were conducted by disaggregating ESG into its environmental (E), social (S), and governance (G) components. The results are presented in
Table 7.
4.7.1. Direct Effects of ESG Components on Financial Performance
Environmental and social disclosures exhibited consistently negative and statistically significant relationships with ROE, particularly in the HCE and SCE models (e.g., environmental: HCE B = −0.262, β = −0.663, p < 0.001; SCE B = −0.410, β = −1.039, p < 0.001). Social disclosure showed similar negative effects across models. In contrast, governance disclosure demonstrated weaker and less consistent relationships. It was positive and significant only in the HCE model (B = 0.221, β = 0.226, p < 0.05) and nonsignificant elsewhere.
These results indicate that the negative association between aggregate ESG and ROE is primarily driven by environmental and social dimensions, whereas governance appears neutral or slightly positive.
4.7.2. Moderating Effects Across ESG Dimensions
HCE
HCE significantly moderated the environmental and social relationships, with positive interaction effects (E: β = 0.756, p < 0.001; S: β = 0.469, p < 0.001), indicating that HCE mitigates their negative impact on ROE. The governance interaction was not significant (β = 0.176, p > 0.05).
SCE
All interaction terms were statistically significant; however, given that the overall ESG × SCE interaction was not significant and earlier diagnostics indicated moderate multicollinearity, these results should be interpreted cautiously. The apparent effects likely reflect estimation instability rather than a robust moderating role.
CEE
Interaction terms for environmental and social components were not statistically significant, consistent with the robustness checks. The governance interaction was positive but modest (β = 0.364) and not consistent across models, indicating limited moderating influence.
4.7.3. Synthesis of ESG Component Effects
The disaggregated analysis highlights three key findings. First, the negative ESG–ROE relationship is driven primarily by environmental and social disclosures, suggesting higher short-term cost implications. Second, governance disclosure exhibits a neutral to slightly positive association with performance. Third, HCE emerges as the most consistent moderator, whereas SCE results are unstable, and CEE moderation is not robust. Overall, these findings reinforce the importance of disaggregating ESG and demonstrate that IC influences CSR outcomes differently across dimensions.
5. Discussion
This study set out to reconcile inconsistencies in the CSR–FP literature by examining the moderating role of IC within a longitudinal panel of Philippine-listed firms. Overall, the findings provide a more nuanced and, in several respects, cautionary interpretation of CSR’s financial implications in emerging market contexts.
Contrary to the expectations of stakeholder theory and a large body of meta-analytic evidence [
33,
34,
35,
36], the results indicate that CSR operationalized as ESG disclosure exerts a negative and statistically significant effect on ROE in the baseline hierarchical models. Because CSR was operationalized using a disclosure-based ESG index, this finding should be interpreted as reflecting the financial implications of CSR disclosure rather than the effectiveness of firms’ underlying sustainability practices. From this perspective, the observed negative association may reflect the costs associated with sustainability reporting, governance compliance, and disclosure activities, which may not immediately translate into measurable financial returns. In the Philippine context, where sustainability reporting standards are still evolving, firms may incur substantial compliance, implementation, and disclosure costs without fully realizing reputational or efficiency gains. Moreover, because CSR was operationalized using a disclosure-based ESG index, the observed association may also capture symbolic disclosure practices, increased reporting obligations, or investor perceptions that extensive sustainability disclosures do not necessarily translate into immediate financial returns. Importantly, however, this negative effect becomes statistically insignificant under cluster-robust estimation, indicating sensitivity to model specification and raising concerns about the stability of the CSR–ROE relationship. This suggests that the main effect of CSR should be interpreted conservatively and not overstated.
Consistent with the RBV [
23], IC emerges as a critical determinant of firm performance. Among its components, CEE demonstrates the strongest and most robust positive association with ROE across all specifications. This finding underscores the importance of efficient capital allocation in translating firm resources into financial returns, particularly in capital-intensive emerging-market firms. HCE also exhibits a positive and significant effect in the main models, although its significance weakens under more conservative estimations. In contrast, SCE does not significantly influence ROE, suggesting that organizational processes and systems alone may be insufficient to drive FP in this context. These results reinforce the argument that not all components of IC contribute equally to value creation. CEE is more directly linked to firms’ ability to generate accounting returns through the efficient use of financial and physical resources, making its effects more readily observable in ROE. In contrast, the benefits of structural capital, such as organizational processes and knowledge systems, are often realized more indirectly and over longer time horizons, which may explain its consistently insignificant effect in the present study [
17,
19]. Importantly, the robustness analyses demonstrate that this consistency applies only to the direct effects of CEE. Although the pooled hierarchical regression initially suggested that CEE also strengthened the CSR–ROE relationship, this interaction was not replicated under fixed-effects, random-effects, or cluster-robust estimators. Therefore, the evidence supports CEE primarily as a robust determinant of financial performance rather than as a stable moderating mechanism.
With respect to moderation, the findings partially support the theoretical expectation that IC conditions the CSR–performance relationship. The CSR × HCE interaction is positive and significant in the primary models, indicating that human capital mitigates the negative financial impact of CSR. Simple slopes analysis further reveals that at high levels of HCE, the adverse effect of CSR on ROE diminishes and becomes nonsignificant. This aligns with dynamic capabilities theory [
24], suggesting that skilled employees enhance firms’ ability to design, implement, and extract value from CSR initiatives. However, this moderating effect is not robust under cluster-adjusted standard errors, which raises concerns about its reliability. A critical reviewer would likely question whether the observed interaction reflects true economic effects or is driven by sampling variability.
In contrast, the moderating role of CEE was not supported by the panel robustness analyses. Although the pooled hierarchical regression indicated a statistically significant CSR × CEE interaction, this effect disappeared after controlling for unobserved firm-specific heterogeneity and applying more conservative variance estimators. This inconsistency suggests that the apparent moderation may reflect cross-sectional variation rather than stable within-firm dynamics. Consequently, the present findings do not provide sufficient evidence to conclude that CEE consistently strengthens or weakens the relationship between CSR and financial performance. Instead, CEE appears to contribute primarily through its robust direct effect on ROE. The disaggregated ESG analysis provides additional insight into the mechanisms underlying these relationships. The negative CSR–ROE association is driven primarily by environmental and social disclosures, both of which exhibit consistently negative effects on FP. This suggests that these dimensions entail higher immediate costs, such as environmental compliance investments and social program expenditures. In contrast, governance disclosures show neutral to slightly positive effects, implying that governance practices may be less costly and more directly aligned with investor expectations. Notably, HCE moderates the environmental and social dimensions more consistently, reinforcing the importance of human capabilities in managing cost-intensive CSR activities.
This study highlights that unlocking value from CSR is contingent, complex, and far from guaranteed, particularly in emerging market settings where capabilities and institutional conditions vary substantially.
6. Conclusions
This study examined the relationship between CSR and FP, incorporating IC as a moderating mechanism using longitudinal panel data from Philippine publicly listed firms. The findings indicate that CSR, measured through ESG disclosure, does not consistently enhance financial performance. Instead, a negative association with ROE was observed in the primary models, although this relationship proved sensitive to model specification and became nonsignificant under more robust estimation. These results suggest that CSR may entail short-term financial costs, particularly in emerging market contexts characterized by evolving institutional frameworks.
IC plays a significant role in explaining firm performance. Among its components, CEE emerged as the most robust and consistent predictor of ROE, underscoring the importance of efficient resource utilization. HCE showed a positive but less stable effect, while SCE was not a significant determinant. In contrast, the moderating role of CEE was not supported by the panel robustness analyses. Although the pooled hierarchical regression indicated a statistically significant CSR × CEE interaction, this effect disappeared after controlling for unobserved firm-specific heterogeneity and applying more conservative variance estimators. This inconsistency suggests that the apparent moderation may reflect cross-sectional variation rather than stable within-firm dynamics. Consequently, the present findings do not provide sufficient evidence to conclude that CEE consistently strengthens or weakens the relationship between CSR and financial performance. Instead, CEE appears to contribute primarily through its robust direct effect on ROE.
These findings contribute to the CSR and intellectual capital literature by showing that capital employed efficiency exhibits the most consistent direct association with financial performance across alternative panel specifications, whereas the proposed moderating effects of intellectual capital are specification-sensitive. More broadly, the study highlights the importance of evaluating moderation effects using robust panel estimation techniques before drawing substantive conclusions, particularly in emerging-market settings.
7. Implications
7.1. Theoretical Implications
This study advances CSR and the strategic management literature by challenging the assumption that CSR inherently enhances financial performance. While stakeholder theory and legitimacy theory argue that CSR strengthens firm value through improved stakeholder relations and societal alignment, the findings indicate that such benefits are conditional rather than automatic. Consistent with the trade-off perspective, CSR appears to impose short-term financial costs in emerging markets, highlighting the need for theories to incorporate temporal dynamics and institutional context into the CSR–performance nexus.
The study also extends the resource-based view by demonstrating heterogeneity within IC. Contrary to the common treatment of IC as a unified strategic asset, CEE emerges as the most influential predictor of performance, while human and structural capital efficiencies show weaker effects. This suggests that tangible and financial resource efficiency remains a dominant value-creation mechanism in emerging economies, thereby refining RBV assumptions about the universal strategic value of intangible assets.
Furthermore, the robustness analyses indicate that the moderating role proposed by dynamic capabilities theory receives only limited empirical support. Although preliminary interaction effects were observed in the pooled regression models, these effects were not sustained under more rigorous panel estimators. This suggests that intellectual capital contributes more consistently through direct value creation than through conditioning the financial returns of CSR investments.
7.2. Practical Implications
The findings offer important guidance for managers, policymakers, and investors by emphasizing that CSR must be strategically aligned with firm capabilities. Managers should recognize that environmental and social initiatives may generate short-term financial pressures, particularly in resource-constrained settings. Consequently, CSR should be implemented with careful consideration of timing, scale, and integration into core business strategy rather than treated as a standalone obligation.
The strong and consistent role of capital employed efficiency underscores the importance of disciplined resource allocation. Firms that efficiently utilize financial and physical capital are better positioned to absorb the costs of CSR and sustain long-term initiatives. This is particularly critical in capital-intensive industries, where inefficiencies can magnify the financial burden of sustainability efforts. Although human capital shows some moderating potential, its inconsistent effects suggest that employee capability alone is insufficient. Firms should complement workforce investments with organizational systems, governance structures, and strategic coherence to enhance CSR effectiveness.
For policymakers, the results caution against imposing extensive disclosure requirements without adequate institutional support. Providing incentives, technical guidance, and capacity-building mechanisms may improve CSR outcomes. Finally, investors should evaluate CSR alongside firm-specific efficiency indicators, recognizing that high ESG scores do not necessarily translate into immediate financial returns.
8. Limitations and Future Works
This study offers important insights but is subject to several limitations. First, CSR was measured using a disclosure-based ESG index, which captures reporting extent rather than the quality or actual impact of CSR activities. This may introduce bias due to symbolic disclosure. Future research should incorporate outcome-based metrics or third-party ESG ratings to better reflect substantive performance. Second, the ESG disclosure index was coded by a single researcher. Although intra-coder reliability was assessed to promote coding consistency, the absence of multiple independent coders may increase the potential for subjective judgment. Future studies should employ multiple coders and assess inter-coder agreement to further strengthen the reliability of disclosure-based content analysis. Third, IC was operationalized using the VAIC model, which relies on accounting proxies and may not fully capture intangible resources such as innovation or relational capital. Future research may extend the present framework by incorporating the modified VAIC (MVAIC), which includes relational capital efficiency, to provide a more comprehensive assessment of intellectual capital.
Fourth, the sample comprised 23 PSEi firms (138 firm-year observations), which may have limited the statistical power and precision of the estimated regression coefficients, particularly for detecting relatively small interaction effects in the moderation analyses. Accordingly, the findings should be interpreted within the context of the study sample. In addition, because the sample is restricted to large publicly listed firms, the findings may not generalize to non-listed firms, small and medium-sized enterprises, or firms operating in different institutional environments. Future research should employ larger and more diverse samples to improve statistical precision and external validity. Fifth, although the panel estimators employed in this study reduce bias arising from unobserved firm-specific heterogeneity, they do not fully eliminate endogeneity concerns, including reverse causality and omitted variable bias. Consequently, the observed relationships should be interpreted as theory-driven associations rather than definitive evidence of causality. Future research should employ stronger causal identification strategies, such as lagged-variable models, instrumental-variable estimation, or dynamic panel methods (e.g., system GMM), where appropriate. In addition, although the overall multicollinearity diagnostics were acceptable, the SCE moderation model exhibited a relatively elevated variance inflation factor despite mean-centering. Accordingly, the SCE moderation findings should be interpreted with appropriate caution and validated in future studies using alternative model specifications and larger samples.
Sixth, financial performance was measured solely using ROE. Consequently, the findings are limited to an accounting-based measure of firm performance. Future research should incorporate alternative accounting- and market-based indicators, such as ROA and Tobin’s Q, to assess the robustness of the results. Finally, the Philippine context limits generalizability. Future research should examine institutional influences across settings to better understand CSR value creation.
Author Contributions
Conceptualization, E.B.M.; methodology, L.C.E.; software, L.C.E.; validation, E.B.M., and L.C.E.; formal analysis, L.C.E.; investigation, L.C.E.; resources, L.C.E.; data curation, E.B.M.; writing—original draft preparation, E.B.M.; writing—review and editing, L.C.E. and E.B.M.; visualization, L.C.E.; supervision, E.B.M.; project administration, E.B.M.; funding acquisition, E.B.M. All authors have read and agreed to the published version of the manuscript.
Funding
This research was funded by Bulacan State University—Research and Innovation Office.
Institutional Review Board Statement
Not applicable.
Informed Consent Statement
Not applicable.
Data Availability Statement
The data of this study are available from the corresponding author upon reasonable request.
Acknowledgments
AI tools were used in the preparation of this manuscript. Specifically, ChatGPT 5.5 for conceptualization and idea refinement, and Grammarly 1.173.2.0 for grammar and language editing. All intellectual contributions, data interpretations, and final decisions were made by the authors, who take full responsibility for the content of this work.
Conflicts of Interest
The authors declare no conflicts of interest.
Abbreviations
The following abbreviations are used in this manuscript:
| CSR | Corporate Social Responsibility |
| FP | Financial Performance |
| ROE | Return on Equity |
| HCE | Human Capital Efficiency |
| SCE | Structural Capital Efficiency |
| CEE | Capital-Employed Efficiency |
| PSEi | Philippine Stock Exchange Index |
| ESG | Environmental, Social, and Governance |
| IC | Intellectual Capital |
| VAIC | Value-Added Intellectual Capital |
References
- Baker, M.; Bergstresser, D.; Serafeim, G.; Wurgler, J. The Pricing and Ownership of US Green Bonds. Annu. Rev. Financ. Econ. 2022, 14, 415–437. [Google Scholar] [CrossRef]
- Carroll, A.B.; Shabana, K.M. The Business Case for Corporate Social Responsibility: A Review of Concepts, Research and Practice. Int. J. Manag. Rev. 2010, 12, 85–105. [Google Scholar] [CrossRef]
- Gillan, S.L.; Koch, A.; Starks, L.T. Firms and Social Responsibility: A Review of ESG and CSR Research in Corporate Finance. J. Corp. Financ. 2021, 66, 101889. [Google Scholar] [CrossRef]
- Freeman, R. Strategic Management: A Stakeholder Approach; Pitman: Bath, UK, 1984. [Google Scholar]
- Dowling, J.; Pfeffer, J. Organizational Legitimacy: Social Values and Organizational Behavior. Sociol. Perspect. 1975, 18, 122–136. [Google Scholar] [CrossRef] [PubMed]
- Suchman, M.C. Managing Legitimacy: Strategic and Institutional Approaches. Acad. Manag. Rev. 1995, 20, 571–610. [Google Scholar] [CrossRef]
- Dhaliwal, D.S.; Li, O.Z.; Tsang, A.; Yang, Y.G. Voluntary Nonfinancial Disclosure and the Cost of Equity Capital: The Initiation of Corporate Social Responsibility Reporting. Account. Rev. 2011, 86, 59–100. [Google Scholar] [CrossRef]
- Budiharjo, R.; Sagita, A.; Hapsari, D.W.; Pratomo, D.; Alfaiza, S.A. Integrating Managerial Strategy with ESG and Sustainable Accounting to Enhance Financial Performance amid Climate Change. Asian Econ. Financ. Rev. 2026, 16, 88–108. [Google Scholar] [CrossRef]
- Mahmood, F.; Qadeer, F.; Sattar, U.; Ariza-Montes, A.; Saleem, M.; Aman, J. Corporate Social Responsibility and Firms’ Financial Performance: A New Insight. Sustainability 2020, 12, 4211. [Google Scholar] [CrossRef]
- Nirino, N.; Ferraris, A.; Miglietta, N.; Invernizzi, A.C. Intellectual Capital: The Missing Link in the Corporate Social Responsibility–Financial Performance Relationship. J. Intellect. Cap. 2022, 23, 420–438. [Google Scholar] [CrossRef]
- Krüger, P. Corporate Goodness and Shareholder Wealth. J. Financ. Econ. 2015, 115, 304–329. [Google Scholar] [CrossRef]
- Mohammed, S.S.; Saeed, M.M.; Kumari, M.; Borugadda, P.; Mohamed Ismail, N.B. Corporate Social Responsibility (CSR) and Corporate Financial Performance (CFP): A Panel Data Analysis of BSE 500 Companies in India. Discov. Sustain. 2025, 6, 310. [Google Scholar] [CrossRef]
- Moore, G. Corporate Social and Financial Performance: An Investigation in the U.K. Supermarket Industry. J. Bus. Ethics 2001, 34, 299–315. [Google Scholar] [CrossRef]
- Buallay, A. Is Sustainability Reporting (ESG) Associated with Performance? Evidence from the European Banking Sector. Manag. Environ. Qual. Int. J. 2019, 30, 98–115. [Google Scholar] [CrossRef]
- Ciurel, M.; Dumitrescu, C.I. Measuring Governance-Enabled Sustainability in Central and Eastern Europe: Development of a Corporate Governance–Sustainability Index (CGSI–CEE). Sustainability 2026, 18, 3350. [Google Scholar] [CrossRef]
- Xie, J.; Nozawa, W.; Yagi, M.; Fujii, H.; Managi, S. Do Environmental, Social, and Governance Activities Improve Corporate Financial Performance? Bus. Strategy Environ. 2019, 28, 286–300. [Google Scholar] [CrossRef]
- Danial, M.; Shah, S.Q.A.; Iftikhar, N.; Lai, F.; Rahman, H.U. Unveiling the Dual Role of Intellectual Capital in Value Creation and Financial Distress: Underlying Critical Moderators. Knowl. Process Manag. 2026, 1–19. [Google Scholar] [CrossRef]
- Rao, A.; Dagar, V.; Sohag, K.; Dagher, L.; Tanin, T.I. Good for the Planet, Good for the Wallet: The ESG Impact on Financial Performance in India. Financ. Res. Lett. 2023, 56, 104093. [Google Scholar] [CrossRef]
- Shah, S.Q.A.; Lai, F.W.; Tahir, M.; Shad, M.K.; Hamad, S.; Ali, S.E.A. Intellectual Capital and Financial Performance: Does Board Size and Independent Directors Matter? An Empirical Enquiry. J. Islam. Account. Bus. Res. 2026, 17, 274–296. [Google Scholar] [CrossRef]
- Qin, X.; Kuo, Y.-K.; Abourehab, M.A.S.; Mabrouk, F.; Ramirez-Asis, E.; Abdul-Samad, Z.; Makes, N. The Impact of ICT, Green Finance, and CSR on Sustainable Financial Performance: Moderating Role of Perceived Organizational Support. Econ. Res. Istraz. 2022, 36, 2151489. [Google Scholar] [CrossRef]
- Edvinsson, L.; Malone, M. Intellectual Capital: Realizing Your Company’s True Value by Finding Its Hidden Roots; Harper Business: New York, NY, USA, 1997. [Google Scholar]
- Pulic, A. VAIC—An Accounting Tool for IC Management. Int. J. Technol. Manag. 2000, 20, 702–714. [Google Scholar] [CrossRef]
- Barney, J. Firm Resources and Sustained Competitive Advantage. J. Manag. 1991, 17, 99–120. [Google Scholar] [CrossRef]
- Teece, D.J.; Pisano, G.; Shuen, A. Dynamic Capabilities and Strategic Management. Strateg. Manag. J. 1997, 18, 509–533. [Google Scholar] [CrossRef]
- Xu, J.; Li, J. The Interrelationship between Intellectual Capital and Firm Performance: Evidence from China’s Manufacturing Sector. J. Intellect. Cap. 2022, 23, 313–341. [Google Scholar] [CrossRef]
- Chen, M.C.; Cheng, S.J.; Hwang, Y. An Empirical Investigation of the Relationship between Intellectual Capital and Firms’ Market Value and Financial Performance. J. Intellect. Cap. 2005, 6, 159–176. [Google Scholar] [CrossRef]
- Nguyen, N.; Nghiem, V.T. Intellectual Capital and Financial Performance of Industrial Firms in Emerging Countries: Empirical Evidence from Vietnam. Glob. Bus. Financ. Rev. (GBFR) 2023, 28, 107–122. [Google Scholar] [CrossRef]
- Pratama, B.C. Family Ownership Role in Strengthening the Relationship Between Intellectual Capital and Financial Performance: Research in High-Tech Firms in Indonesia and Philippines. In 2018 3rd International Conference on Education, Sports, Arts and Management Engineering (ICESAME 2018); Atlantis Press: Dordrecht, The Netherlands, 2018; pp. 326–329. [Google Scholar] [CrossRef]
- Nimtrakoon, S. The Relationship between Intellectual Capital, Firms’ Market Value and Financial Performance: Empirical Evidence from the ASEAN. J. Intellect. Cap. 2015, 16, 587–618. [Google Scholar] [CrossRef]
- AlObaid, R.O.H.; Al Farooque, O.; Qasem, A. Does Disclosure of CSR Activities Improve Corporate Value? Moderating Role of Intellectual Capital and COVID-19 Pandemic. Humanit. Soc. Sci. Commun. 2025, 12, 401. [Google Scholar] [CrossRef]
- Savitri, E. Corporate social responsibility, economic value added, enterprise risk management, and financial performance: Intellectual capital moderation. J. Apl. Manaj. 2022, 20, 878–888. [Google Scholar] [CrossRef]
- Tran, N.P.; Dinh, C.T.H.; Hoang, H.T.T.; Vo, D.H. Intellectual Capital and Firm Performance in Vietnam: The Moderating Role of Corporate Social Responsibility. Sustainability 2022, 14, 12763. [Google Scholar] [CrossRef]
- Gupta, J.; Das, N. Multidimensional Corporate Social Responsibility Disclosure and Financial Performance: A Meta-Analytical Review. Corp. Soc. Responsib. Environ. Manag. 2022, 29, 731–748. [Google Scholar] [CrossRef]
- Margolis, J.D.; Walsh, J.P. Misery Loves Companies: Rethinking Social Initiatives by Business. Adm. Sci. Q. 2003, 48, 268–305. [Google Scholar] [CrossRef]
- Orlitzky, M.; Schmidt, F.L.; Rynes, S.L. Corporate Social and Financial Performance: A Meta-Analysis. Organ. Stud. 2003, 24, 403–441. [Google Scholar] [CrossRef]
- Wang, Q.; Dou, J.; Jia, S. A Meta-Analytic Review of Corporate Social Responsibility and Corporate Financial Performance: The Moderating Effect of Contextual Factors. Bus. Soc. 2016, 55, 1083–1121. [Google Scholar] [CrossRef]
- Bawuah, I. The Moderator Role of Corporate Governance on Capital Structure-Performance Nexus: Evidence from Sub-Saharan Africa. Cogent Bus. Manag. 2024, 11, 2298030. [Google Scholar] [CrossRef]
- Minh, N.; Khan, M.; Bensemann, J.; Sulaiman, R. Corporate Social Responsibility among Service Sector SMEs in Vietnam: Exploring the Influence of National Context. Qual. Quant. 2025, 59, 3977–4001. [Google Scholar] [CrossRef]
- Aras, G.; Aybars, A.; Kutlu, O. The Interaction between Corporate Social Responsibility and Value Added Intellectual Capital: Empirical Evidence from Turkey. Soc. Responsib. J. 2011, 7, 622–637. [Google Scholar] [CrossRef]
- Jaroensombut, L.; Yiengthaisong, A.; Promsaka, T.; Sakolnakorn, N. Corporate Social Responsibility Management for Sustainable Development: A Systematic Literature Review. Int. J. Adv. Appl. Sci. 2025, 12, 172–183. [Google Scholar] [CrossRef]
- Yan, X.; Espinosa-Cristia, J.F.; Kumari, K.; Cioca, L.I. Relationship between Corporate Social Responsibility, Organizational Trust, and Corporate Reputation for Sustainable Performance. Sustainability 2022, 14, 8737. [Google Scholar] [CrossRef]
- El Nemar, S.; El-Chaarani, H.; Dandachi, I.; Castellano, S. Resource-Based View and Sustainable Advantage: A Framework for SMEs. J. Strateg. Mark. 2025, 33, 798–821. [Google Scholar] [CrossRef]
- Salam, M.A.; Jahed, M.A. CSR Orientation for Competitive Advantage in Business-to-Business Markets of Emerging Economies: The Mediating Role of Trust and Corporate Reputation. J. Bus. Ind. Mark. 2023, 38, 2277–2293. [Google Scholar] [CrossRef]
- Surroca, J.; Tribó, J.A.; Waddock, S. Corporate Responsibility and Financial Performance: The Role of Intangible Resources. Strateg. Manag. J. 2010, 31, 463–490. [Google Scholar] [CrossRef]
- Hyun, E.J.; Yu, S. The Strength Within: CSR Governance as an Environmental Performance Driver in Weak Institutional Contexts. Systems 2024, 12, 515. [Google Scholar] [CrossRef]
- Al Hawaj, A.Y.; Buallay, A.M. A Worldwide Sectorial Analysis of Sustainability Reporting and Its Impact on Firm Performance. J. Sustain. Financ. Invest. 2022, 12, 62–86. [Google Scholar] [CrossRef]
- Sandberg, H.; Alnoor, A.; Tiberius, V. Environmental, Social, and Governance Ratings and Financial Performance: Evidence from the European Food Industry. Bus. Strategy Environ. 2023, 32, 2471–2489. [Google Scholar] [CrossRef]
- Reboredo, J.C.; Sowaity, S.M.A. Environmental, Social, and Governance Information Disclosure and Intellectual Capital Efficiency in Jordanian Listed Firms. Sustainability 2021, 14, 115. [Google Scholar] [CrossRef]
- Zheng, C.; Islam, M.N.; Hasan, N.; Halim, M.A. Does Intellectual Capital Efficiency Matter for Banks’ Performance and Risk-Taking Behavior? Cogent Econ. Financ. 2022, 10, 2127484. [Google Scholar] [CrossRef]
- Kwaku Mensah Mawutor, J.; Boadi, I.; Antwi, S.; Buawolor Tetteh, A. Improving Banks’ Profitability through Income Diversification and Intellectual Capital: The Sub-Saharan Africa Perspective. Cogent Econ. Financ. 2023, 11, 2271658. [Google Scholar] [CrossRef]
- Weqar, F.; Haque, S.M.I. The Influence of Intellectual Capital on Indian Firms’ Financial Performance. Int. J. Learn. Intellect. Cap. 2022, 19, 169. [Google Scholar] [CrossRef]
- Papíková, L.; Papík, M. Intellectual capital and its impacts on SMEs profitability during COVID-19 pandemic. J. East. Eur. Cent. Asian Res. 2022, 9, 521. [Google Scholar] [CrossRef]
- Awad Bakry, A.E. Does Intellectual Capital Efficiency Improve the Corporate Social Responsibility of Egyptian Firms? J. Financ. Report. Account. 2022, 20, 693–711. [Google Scholar] [CrossRef]
- Dkhili, H. ESG and Human Capital Investment: A Moderator Effect Based on Product Market Competitiveness and Corporate Reputation in African Companies. Int. J. Discl. Gov. 2025, 23, 402–435. [Google Scholar] [CrossRef]
- Bataineh, H.; Abbadi, S.S.; Alabood, E.; Alkurdi, A. The Effect of Intellectual Capital on Firm Performance: The Mediating Role of Family Management. J. Islam. Account. Bus. Res. 2022, 13, 845–863. [Google Scholar] [CrossRef]
- Gamerschlag, R.; Möller, K.; Verbeeten, F.; Gamerschlag, R.; Möller, Á.K.; Verbeeten, F. Determinants of Voluntary CSR Disclosure: Empirical Evidence from Germany. Rev. Manag. Sci. 2010, 5, 233–262. [Google Scholar] [CrossRef]
- Oware, K.M.; Worae, T.A. Sustainability (Disclosure and Report Format) and Firm Performance in India. Effects of Mandatory CSR Reporting. Cogent Bus. Manag. 2023, 10, 2170075. [Google Scholar] [CrossRef]
- Sampong, F.; Song, N.; Boahene, K.O.; Wadie, K.A. Disclosure of CSR Performance and Firm Value: New Evidence from South Africa on the Basis of the GRI Guidelines for Sustainability Disclosure. Sustainability 2018, 10, 4518. [Google Scholar] [CrossRef]
- Firer, S.; Mitchell Williams, S. Intellectual Capital and Traditional Measures of Corporate Performance. J. Intellect. Cap. 2003, 4, 348–360. [Google Scholar] [CrossRef]
- Wooldridge, J.M. Econometric Analysis of Cross Section and Panel Data, 2nd ed.; The MIT Press: Cambridge, MA, USA, 2010. [Google Scholar]
- Aiken, L.S.; West, S.G.; Reno, R.R. Multiple Regression: Testing and Interpreting Interactions; Sage: Thousand Oaks, CA, USA, 1991. [Google Scholar]
- Tabachnick, B.G.; Fidell, L.S. Using Multivariate Statistics Title: Using Multivariate Statistics; Pearson: London, UK, 2019. [Google Scholar]
- Tukey, J. The Future of Data Analysis; Springer: Berlin/Heidelberg, Germany, 1992; pp. 408–452. [Google Scholar] [CrossRef]
- Hausman, J.A. Specification Tests in Econometrics. Econometrica 1978, 46, 1251. [Google Scholar] [CrossRef]
- West, S.G.; Finch, J.F.; Curran, P.J. Structural Equation Models with Nonnormal Variables: Problems and Remedies; Sage Publications, Inc.: Thousand Oaks, CA, USA, 1995. [Google Scholar]
- Cohen, J. A Coefficient of Agreement for Nominal Scales. Educ. Psychol. Meas. 1960, 20, 37–46. [Google Scholar] [CrossRef]
- Jarvis, C.B.; Mackenzie, S.B.; Podsakoff, P.M.; Giliatt, N.; Mee, J.F. A Critical Review of Construct Indicators and Measurement Model Misspecification in Marketing and Consumer Research. J. Consum. Res. 2003, 30, 199–218. [Google Scholar] [CrossRef] [PubMed]
| Disclaimer/Publisher’s Note: The statements, opinions and data contained in all publications are solely those of the individual author(s) and contributor(s) and not of MDPI and/or the editor(s). MDPI and/or the editor(s) disclaim responsibility for any injury to people or property resulting from any ideas, methods, instructions or products referred to in the content. |