1. Introduction
The disposal of red mud (RM) has become a major challenge in environmental protection. One promising utilization pathway is fertilizer that enables large-scale consumption. Red mud has been shown to remediate heavy metal-contaminated soils and prevent groundwater contamination [
1]. However, its low phosphorus content limited its utilization as fertilizer. Increasing phosphorus content can resolve this problem.
Our previous studies confirmed that RM-based composites can efficiently adsorb ammonia, making them a potential nitrogen fertilizer [
2]. However, the phosphorus adsorption of RM-based composites remains unclear. Studies have shown that RM contains significantly less phosphorus than other organic solid wastes. This is a characteristic that makes the current research on the effective utilization of phosphorus in red mud relatively scarce.
Biogas slurry contains abundant phosphorus. Recovering phosphorus from biogas slurry offers dual benefits of cost reduction in treatment and resource circularity. At present, the phosphorus content of biogas is high, such as chicken manure biogas; the phosphorus content is as high as 500~1000 mg·L
−1 [
3]. The phosphorus adsorption of RM-modified composite was up to 142.6 mg·g
−1, in order to realize the high efficiency of phosphorus removal from the biogas [
4].
As for RM, its low porosity, small specific surface area, and complex composition resulted in its poor adsorption capacity [
5]. As in a previous study, RM has a surface area exceeding 60 m
2/g, an average particle size below 10 μm, and a density ranging from 2.84 to 2.87 g/cm
3, which are not characteristics that are suitable for adsorption. More importantly, the complex chemical composition of high alkalinity (Na
2O, K
2O, CaO) can lead to an increase in negative surface charge, which repels phosphate anions [
6]. Additionally, surface salt crusts (mainly Na-carbonates) occupy adsorption sites and maintain localized high pH, suppressing phosphate uptake.
In contrast, biochar has a highly porous structure and large surface area, which can compensate for RM’s limitations in adsorption capacity [
7]. The phosphorus adsorption performance of the biochar by MgCl
2 impregnation-pyrolysis modification (500 °C) reached 29.22 mg·g
−1, which was an 11-fold enhancement compared with that of the homologous virgin biochar [
8]. Biogas residue (BR) can be converted into biochar through pyrolysis, which, as a phosphorus-rich effluent (150–250 mg·L
−1), presented significant recovery potential [
9].
Despite previous studies exploring the potential of RM-based composites for phosphorus adsorption, the combination of RM with BR under co-pyrolysis has not been widely explored. This study proposes the innovative co-pyrolysis of RM with BR to create carbonized composites that significantly enhance phosphorus adsorption from biogas slurry. The unique aspect of this approach lies in leveraging the highly porous structure of BR, which compensates for RM’s relatively low surface area and porosity, while simultaneously improving the phosphorus retention capacity. The synergistic effects of RM and BR during co-pyrolysis, particularly the stabilization of iron (Fe) species and enhanced surface reactivity, contribute to a more efficient phosphorus immobilization process. This work provides novel theoretical and practical insights into the large-scale utilization of RM as a sustainable fertilizer material, particularly in the context of phosphorus recovery from biogas slurry.
Phosphorus recovery from biogas slurry offers significant potential for sustainable fertilizer applications. However, the bioavailability of recovered phosphorus is crucial for its effectiveness as a fertilizer. This study proposes the co-pyrolysis of RM with BR to prepare carbonized composites that not only enhance phosphorus adsorption from biogas slurry but also improve the bioavailability of recovered phosphorus. The process of co-pyrolysis promotes the formation of FePO4 and other phosphorus species, which have been shown to have higher bioavailability compared to other forms of phosphorus typically found in waste materials.
Thus, this study proposes co-pyrolysis of RM with BR to prepare carbonized composites that enhance phosphorus adsorption from biogas slurry. Furthermore, this study aims to evaluate both the technical feasibility and the environmental implications of deploying a co-pyrolysed composite. Ultimately, our goal is to deliver the theoretical framework and engineering basis required for the large-scale valorization of RM as a phosphorus-bearing fertilizer.
2. Materials and Methods
2.1. Experimental Materials
The BR used in this study was sourced from an anaerobic fermentation facility at a waste treatment plant in Hunan Province. Meanwhile, the RM was procured from an RM storage yard in Shandong Province. The chemical composition of RM is closely re-lated to the bauxite production process and predominantly comprises various metal oxides. Among these, aluminum oxide and iron oxide are the most abundant, account-ing for 68.30% of the total composition (
Table S1). The elemental composition of BR (
Table S2) is associated with the fermentation feedstock and process. In this study, BR was generated from the fermentation of food waste and exhibited a high carbon con-tent (58.13%), which is beneficial for the production of biochar.
2.2. Preparation and Screening of the Composite Materials
BR was dried in an oven for 48 h, then sieved through a 100-mesh screen. The sieved material was then stored in a desiccator for subsequent use. Subsequently, BR was mixed with RM at mass ratios of 25% and 50%. Deionized water was added to form granules, which were shaped into spherical materials with a diameter of approximately 7 mm. To ensure the stability of the materials before pyrolysis, they were placed in an oven and dried at 105 °C for 2 h. The resulting materials were designated as RM75-BC and RM50-BC. These materials were then placed in a tube muffle furnace, and argon gas was introduced for 30 min to create an oxygen-free atmosphere. The materials were subsequently pyrolyzed at a heating rate of 10 °C/min at different temperatures (300 °C, 400 °C, 500 °C, 600 °C, and 700 °C) for 2 h. After cooling, the resulting composite materials with different ratios and temperatures were obtained. The materials were named T-RM75-BC and T-RM50-BC, where T denotes the preparation temperature.
To assess the stability of the materials in water, composite materials prepared at different temperatures and ratios were accurately weighed and placed in sample bottles. A total of 40 mL of deionized water was added to each bottle, and the samples were subjected to static adsorption at room temperature for 6 h. Afterward, the samples were removed, dried in an oven at 105 °C until constant weight was achieved, and weighed again. The mass loss rate was calculated according to Equation (1) [
10]. The mass loss rate of the material under different temperatures and RM ratios is presented in
Table S3:
In the equation, m1 represents the mass of the material before soaking, in grams (g); m2 represents the mass of the material after soaking in grams (g), which were dried to constant weight in an oven.
2.3. Adsorption and Evaluation of the Composite Materials
2.3.1. Adsorption Performance Experiments
A simulated phosphate standard solution was prepared by configuring a 50 mg·L
−1 potassium dihydrogen phosphate solution. The pH of the potassium dihydrogen phosphate solution was adjusted to 7 using 0.1 mol/L NaOH solution and hydrochloric acid. Subsequently, we added 40 mL of the prepared phosphate solution (e.g., 50 mg·L
−1 KH
2PO
4 unless otherwise stated) to a 50 mL centrifuge tube. The dosage reported in later experiments (e.g., 10 g·L
−1) refers to the mass of composite adsorbent added per liter of solution (i.e., g adsorbent·L
−1). The centrifuge tube was then placed in a constant-temperature shaker incubator, where it was agitated at a rate of 100 r/min at room temperature for 24 h. Afterward, the solution was filtered using a 0.45 μm pore-sized filter membrane. The concentration of phosphate was determined at a wavelength of 600 nm using the molybdenum blue spectrophotometric method for the determination of total phosphorus in water (GB 11893-89) [
11]. The materials after phosphate adsorption were removed and dried, and were, respectively, designated as T-RM75-BC-P and T-RM50-BC-P.
To reflect the phosphorus adsorption capacity of the composite materials, the adsorption capacity of the adsorbents was represented by both the removal rate and the specific adsorption capacity. The specific adsorption capacity
qe and the removal rate
λ of the materials were calculated based on the difference in phosphorus concentration in the simulated solution before and after adsorption. The specific calculation formulas are as follows (Equations (2) and (3)) [
12]:
In the equations, qe represents the specific adsorption capacity of the composite material at equilibrium (mg·g−1); C0 represents the initial concentration of the solution (mg·L−1); Ce represents the concentration of phosphate in the solution at equilibrium (mg·L−1); m represents the mass of the adsorbent (g); V represents the volume of the solution (L); λ represents the phosphate removal rate (%).
2.3.2. Adsorption Kinetics
The adsorption capacity of the composite materials for phosphate was examined using a 50 mg·L
−1 potassium dihydrogen phosphate solution as a simulated phosphate solution. A 0.4 g composite was weighed into a 50 mL screw-capped centrifuge tube, followed by the addition of 40 mL of the 50 mg·L
−1 potassium dihydrogen phosphate solution. The pH of the phosphate solution was adjusted to 7 using 0.1 mol/L NaOH solution and hydrochloric acid. The tubes were then placed in a constant-temperature shaker incubator and agitated at 100 r·min
−1 at room temperature. Samples were taken at intervals of 0, 15, 30, 60, 90, 120, 180, 240, 300, 360, 420, and 480 min, respectively. After each sampling, the mixture was centrifuged and filtered through a 0.45 µm membrane to determine the phosphate concentration at adsorption equilibrium. The experimental data were fitted using the pseudo-first-order kinetic model (Equation (4)) and the pseudo-second-order kinetic model (Equation (5)) [
13]:
In the equations, Qe is the adsorption amount of phosphorus at equilibrium (mg·g−1); Qt is the adsorption amount of phosphorus at time t (mg·g−1); k1 is the reaction rate constant of the pseudo-first-order kinetic model (min−1); k2 is the reaction rate constant of the pseudo-second-order kinetic model (g·mg−1·min−1).
2.3.3. Adsorption Isotherm
Potassium dihydrogen phosphate solutions with initial concentrations of 0, 10, 30, 50, 70, 100, 150, and 200 mg·L
−1 were prepared, respectively. The pH of the simulated phosphate solution was adjusted to 7.0 using 0.1 mol·L
−1 hydrochloric acid and sodium hydroxide solutions. A 0.4 g sample of the composite material was placed in a 50 mL screw-capped centrifuge tube, followed by the addition of 40 mL of the phosphate solution with varying concentrations. The tubes were then placed in a constant-temperature shaker and agitated at 25 °C and 100 r·min
−1 for 24 h. Afterward, samples were taken and filtered through a 0.45 µm filter membrane, and the phosphate concentration in the filtrate was determined. The experimental data were fitted using the Langmuir isotherm model (Equation (6)) and the Freundlich isotherm model (Equation (7)) [
14]:
In the equations qe is the adsorption capacity at equilibrium of the material at different phosphate concentrations (mg·g−1); qm is the maximum adsorption capacity obtained by fitting with the Langmuir isotherm model (mg·g−1); Ce is the equilibrium concentration after phosphate adsorption (mg·L−1); KL is the fitting parameter of the Langmuir isotherm model (L·mg−1); KF is the fitting parameter of the Freundlich isotherm model (mg·g−1); 1/n is the adsorption intensity parameter of the Freundlich isotherm model.
2.4. Analysis Methods
All adsorption experiments were performed in triplicate to ensure reproducibility, and data are presented as mean ± standard deviation. Statistical significance of differences was evaluated by a one-way ANOVA, and p ≤ 0.05 was considered statistically significant. Error area and statistical analyses for kinetic and isotherm fitting were included using OriginPro 2021 software. The changes in crystal structure and phase composition of the composite materials before and after pyrolysis and phosphate adsorption were analyzed using an X-ray diffractometer (XRD, SmartLab SE, Tokyo, Japan). The variations in elemental bonding and chemical states of the composite materials before and after phosphate adsorption were examined using X-ray photoelectron spectroscopy (XPS, Thermo Scientific K-Alpha, Waltham, MA, USA). The chemical composition and content of RM were determined using an X-ray fluorescence spectrometer (XRF, PANalytical Axios, Almelo, The Netherlands). The elemental content of the BR was analyzed using an elemental analyzer (Elementar Vario EL, Langenselbold, Germany). The concentration of phosphate was measured using a UV-Vis spectrophotometer (TZ-9S, Jingke Industrial Co., Shanghai, China).
3. Results and Discussion
This study systematically investigated the co-pyrolysis of RM and BR for phosphorus adsorption from sewage slurry. The optimized pyrolysis condition was 600 °C with an RM:BR ratio of 3:1, achieving a maximum adsorption capacity of 2.877 mg·g−1. The adsorption process followed the pseudo-second-order kinetic model and Langmuir isotherm, indicating a monolayer chemisorption mechanism. XRD and XPS results confirmed the formation of Fe-O-P and FePO4 species, suggesting that chemical precipitation and surface complexation dominated the phosphate immobilization. The environmental assessment further demonstrated a lower carbon footprint and global warming potential compared with conventional coagulation methods.
3.1. The Optimization of Co-Pyrolysis Conditions of RM and BR for Phosphorus Adsorption
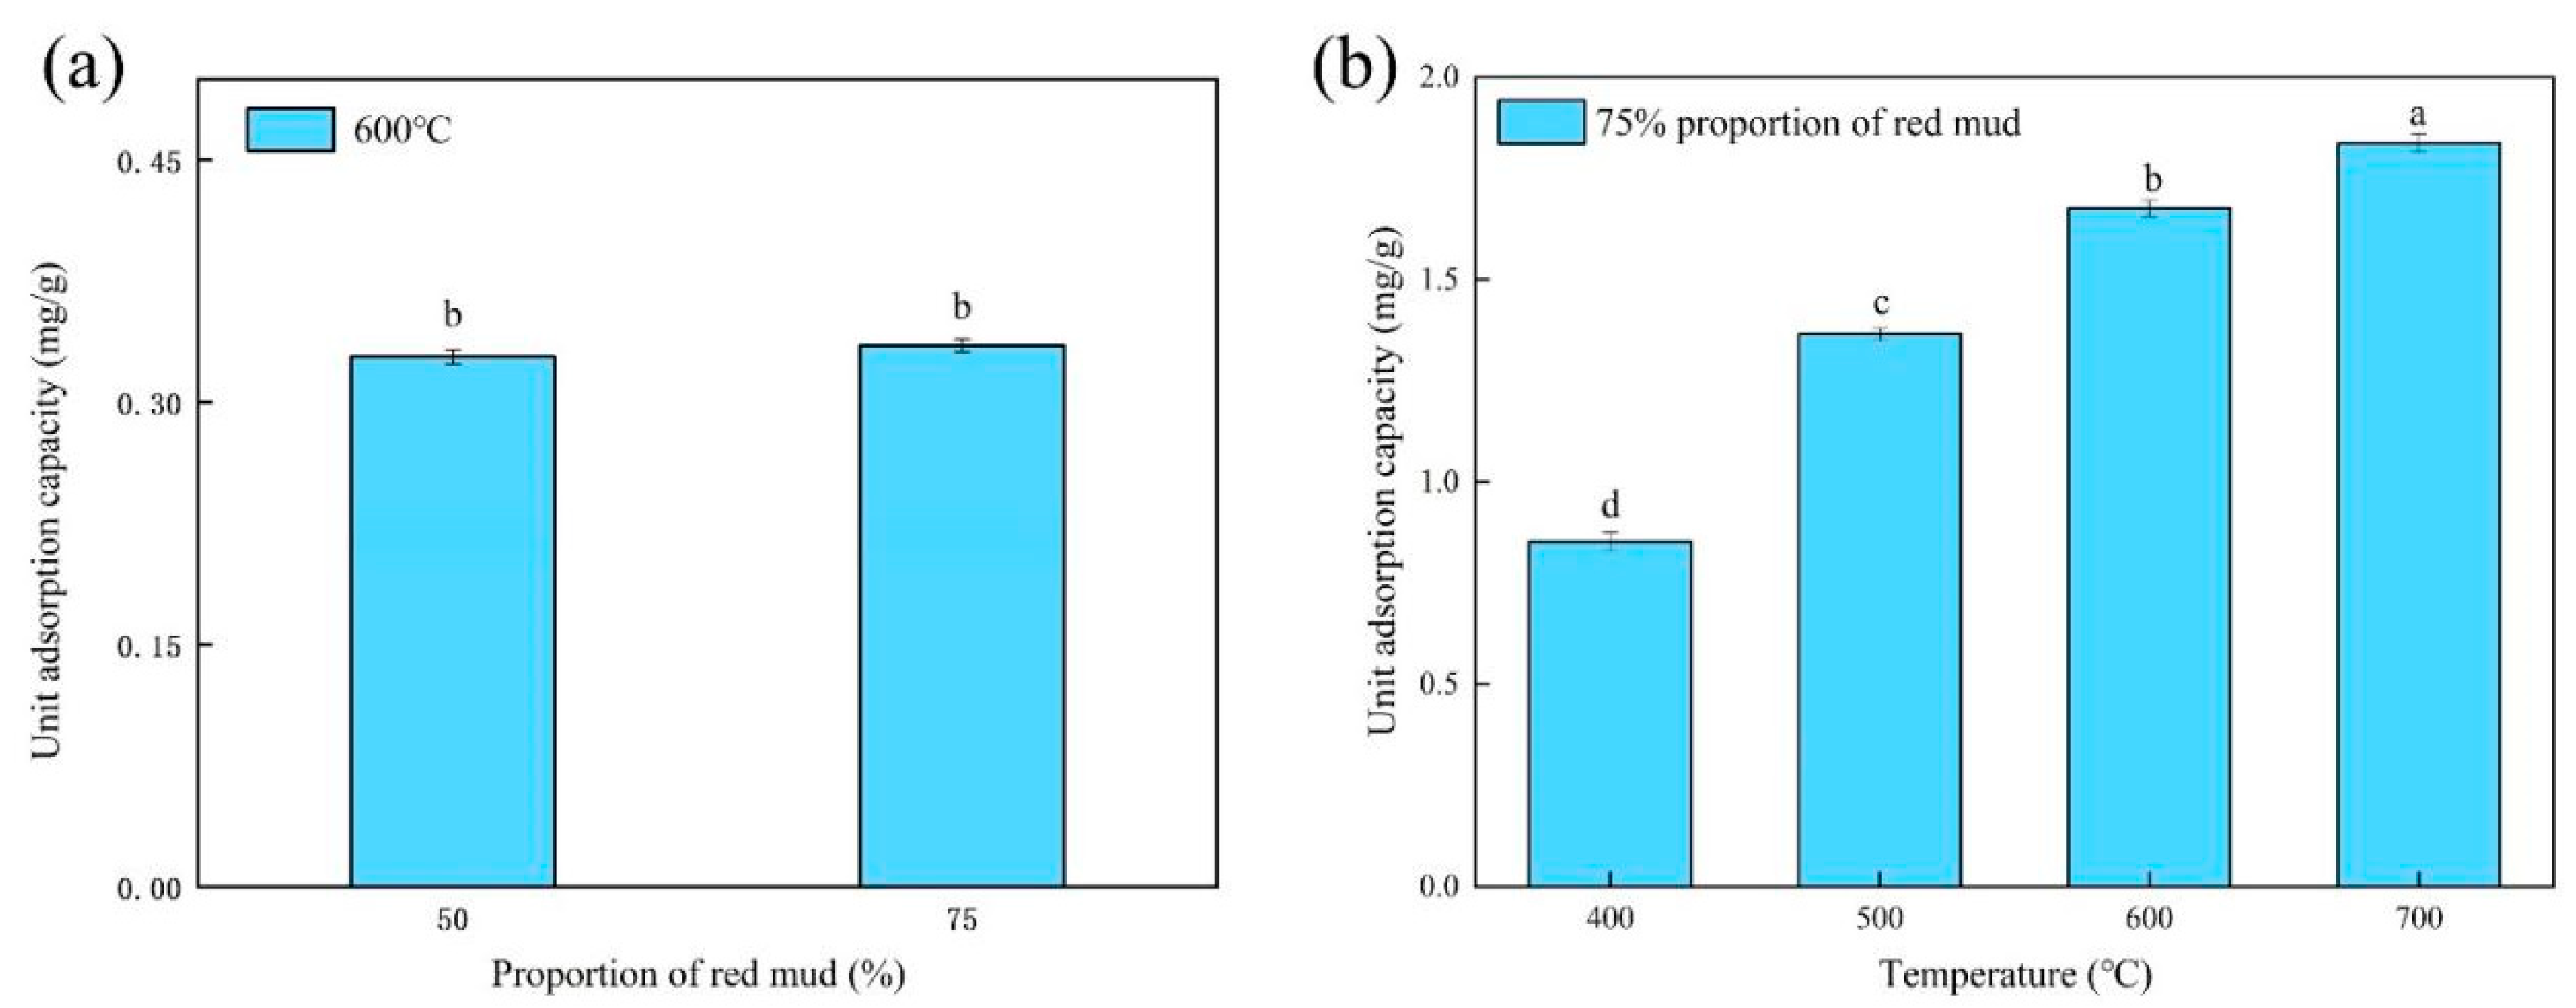
As shown in
Figure 1a, the amount of phosphate adsorption capacity at equilibrium by composites increased slightly when the RM proportion increased from 50% to 75% (0.328 to 0.335 mg·g
−1). However, this difference was not statistically significant (
p > 0.05; two-tailed t-test). More importantly, the RM75-based composites showed substantially better hydrostability than RM50: the mass-loss test (static soaking in deionized water, 6 h) showed much lower mass loss for RM75 at the same pyrolysis temperature (see
Table S3), indicating that RM75 yields a more robust framework during pyrolysis and subsequent handling [
15]. Therefore, considering both adsorption performance and material stability, RM75 (i.e., 75% RM) was selected for follow-up experiments.
Figure 1b shows that the phosphate adsorption increases with pyrolysis temperature from 400 °C to 700 °C, with values of 0.853 mg·g
−1 (400 °C), 1.676 mg·g
−1 (600 °C), and 1.830 mg·g
−1 (700 °C). This phenomenon could be attributed to the increase in the pores in the material with rising pyrolysis temperature [
6,
16]. However, the increase from 600 °C to 700 °C was not statistically significant (
p > 0.05). A temperature of over 600 °C led to a more molten and dense internal structure due to the enhanced chemical bonding, which in turn limited improvement in adsorption capacity [
17]. In addition, materials pyrolyzed at 700 °C exhibited greater mass loss and signs of internal sintering (
Table S3), and higher energy input is required for higher temperature pyrolysis. Combining (1) the negligible statistical improvement in adsorption at 700 °C, (2) the relatively lower hydro-stability and higher mass loss at the higher temperature, and (3) engineering considerations (energy consumption and environmental risk), we selected 600 °C as the optimal temperature for subsequent experiments.
In addition, when the temperature was 400 °C, the composites could be stable in water, while at 600 °C, they exhibited superior adsorption performance. Therefore, materials prepared at 400 °C and 600 °C were selected for adsorption performance analysis. These findings are consistent with previous reports [
6,
16], which also found that Fe-containing biochars prepared at 550–650 °C exhibited optimal phosphate adsorption. The slight differences may result from the reductive atmosphere generated by biomass decomposition in co-pyrolysis, which promotes Fe
2O
3 reduction and stabilizes Fe
3O
4, enhancing the surface reactivity.
3.2. The Adsorption Performance of Phosphorus with Composites in Sewage Slurry
3.2.1. The Effect of Composite Dosage on Phosphorus Removal Rate
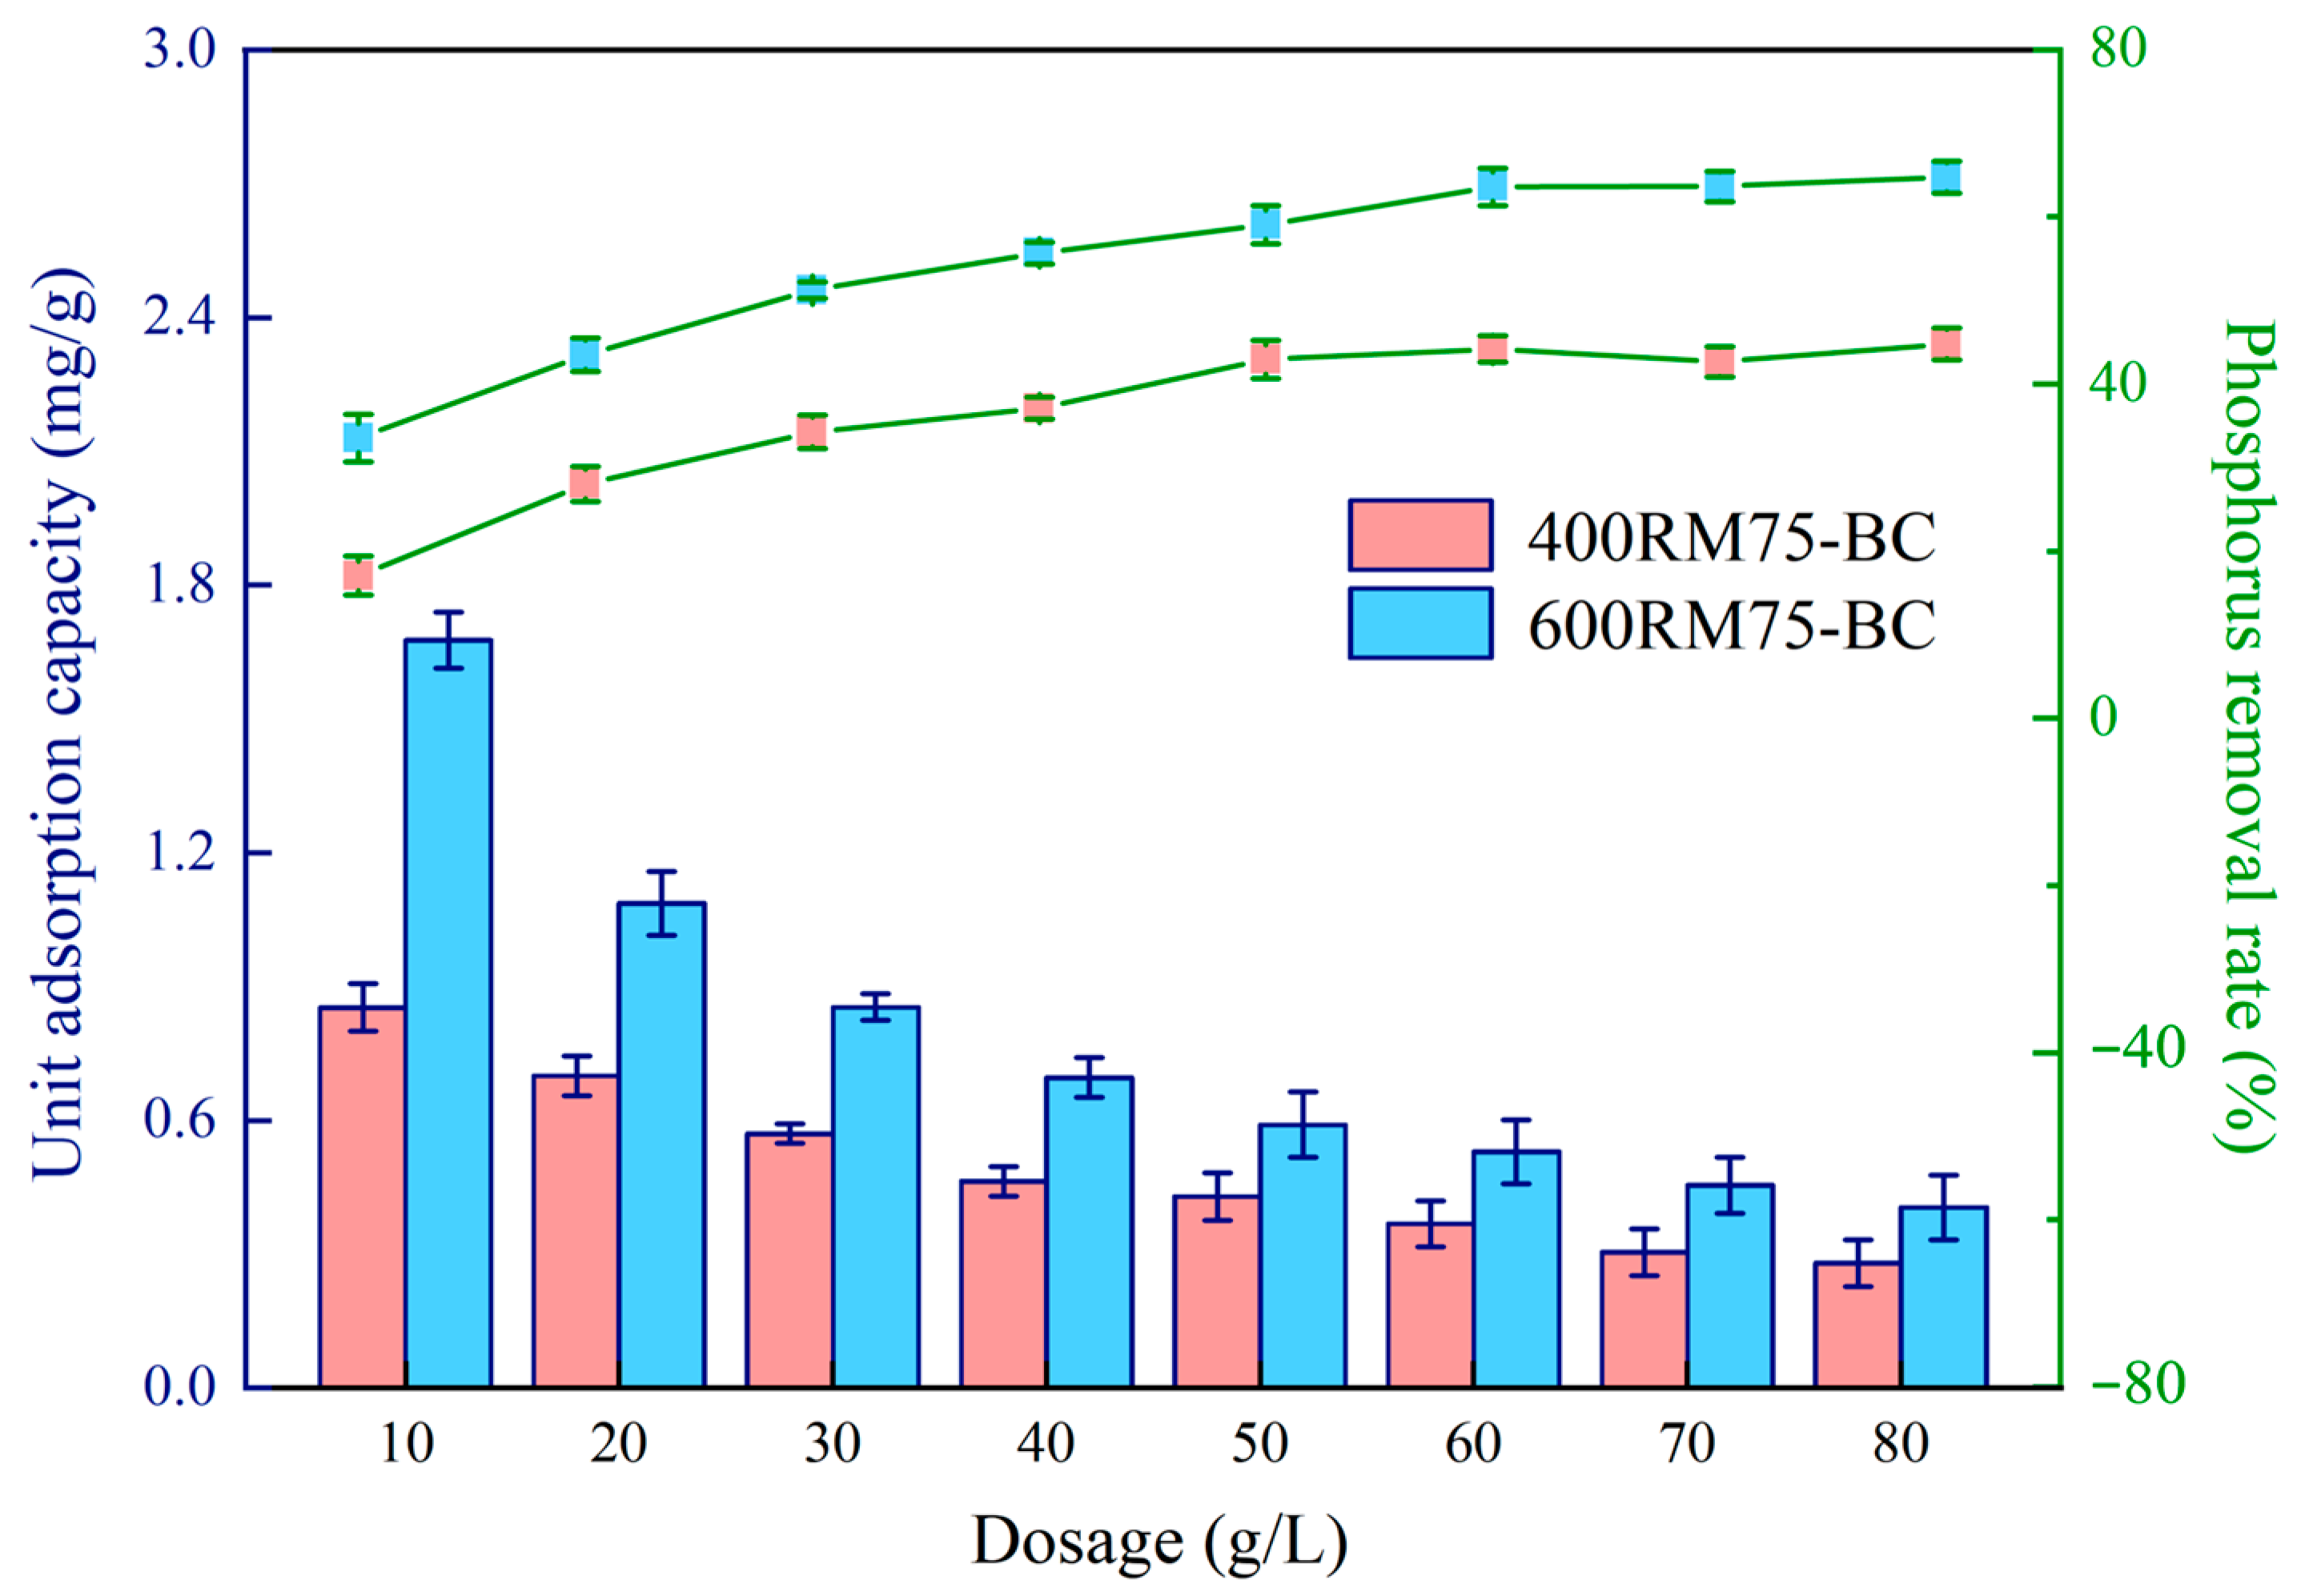
The changes in phosphorus removal rate and adsorption capacity of the two composites at various dosages are shown in
Figure 2. The initial phosphate concentration was 50 mg·L
−1, and the pH environment was 7. As the dosage increased, the phosphorus removal efficiency increased from 17.06% and 33.53% to 44.79% and 64.75% for 400RM75-BC and 600RM75-BC. The corresponding unit adsorption capacities gradually decreased from 0.853 mg·g
−1 and 1.676 mg·g
−1 to 0.279 mg·g
−1 and 0.404 mg·g
−1, respectively. Thus, with the increase in dosage, the phosphorus removal efficiency increased, while the unit adsorption capacities decreased. This was because the number of adsorption sites and surface area of the materials increased. But there was a lower adsorption capacity in the unit composites as the total phosphate concentration was constant. As the concentration gradient drove the adsorption process, a larger gradient resulted in a higher osmotic pressure, which promoted phosphorus adsorption [
5].
When the dosage was less than 50 g·L
−1, there was a significant increase in phosphorus removal rate. However, as the dosage continued to increase, the phosphorus removal rate continued to rise but at a slower rate. A 50 g·L
−1 dosage was suitable as an initial phosphate concentration for the sewage slurry. The removal rate difference was about 25% for both composites. Consequently, as the dosage increased over the optimal point, the initial concentration of phosphorus in the solution decreased. Furthermore, this reduced the concentration gradient and osmotic pressure and weakened the unit adsorption capacity [
6]. Considering the cost, a dosage of 10 g·L
−1 was selected for practical engineering applications.
3.2.2. The Influence of the Initial pH on the Phosphorus Adsorption Capacity
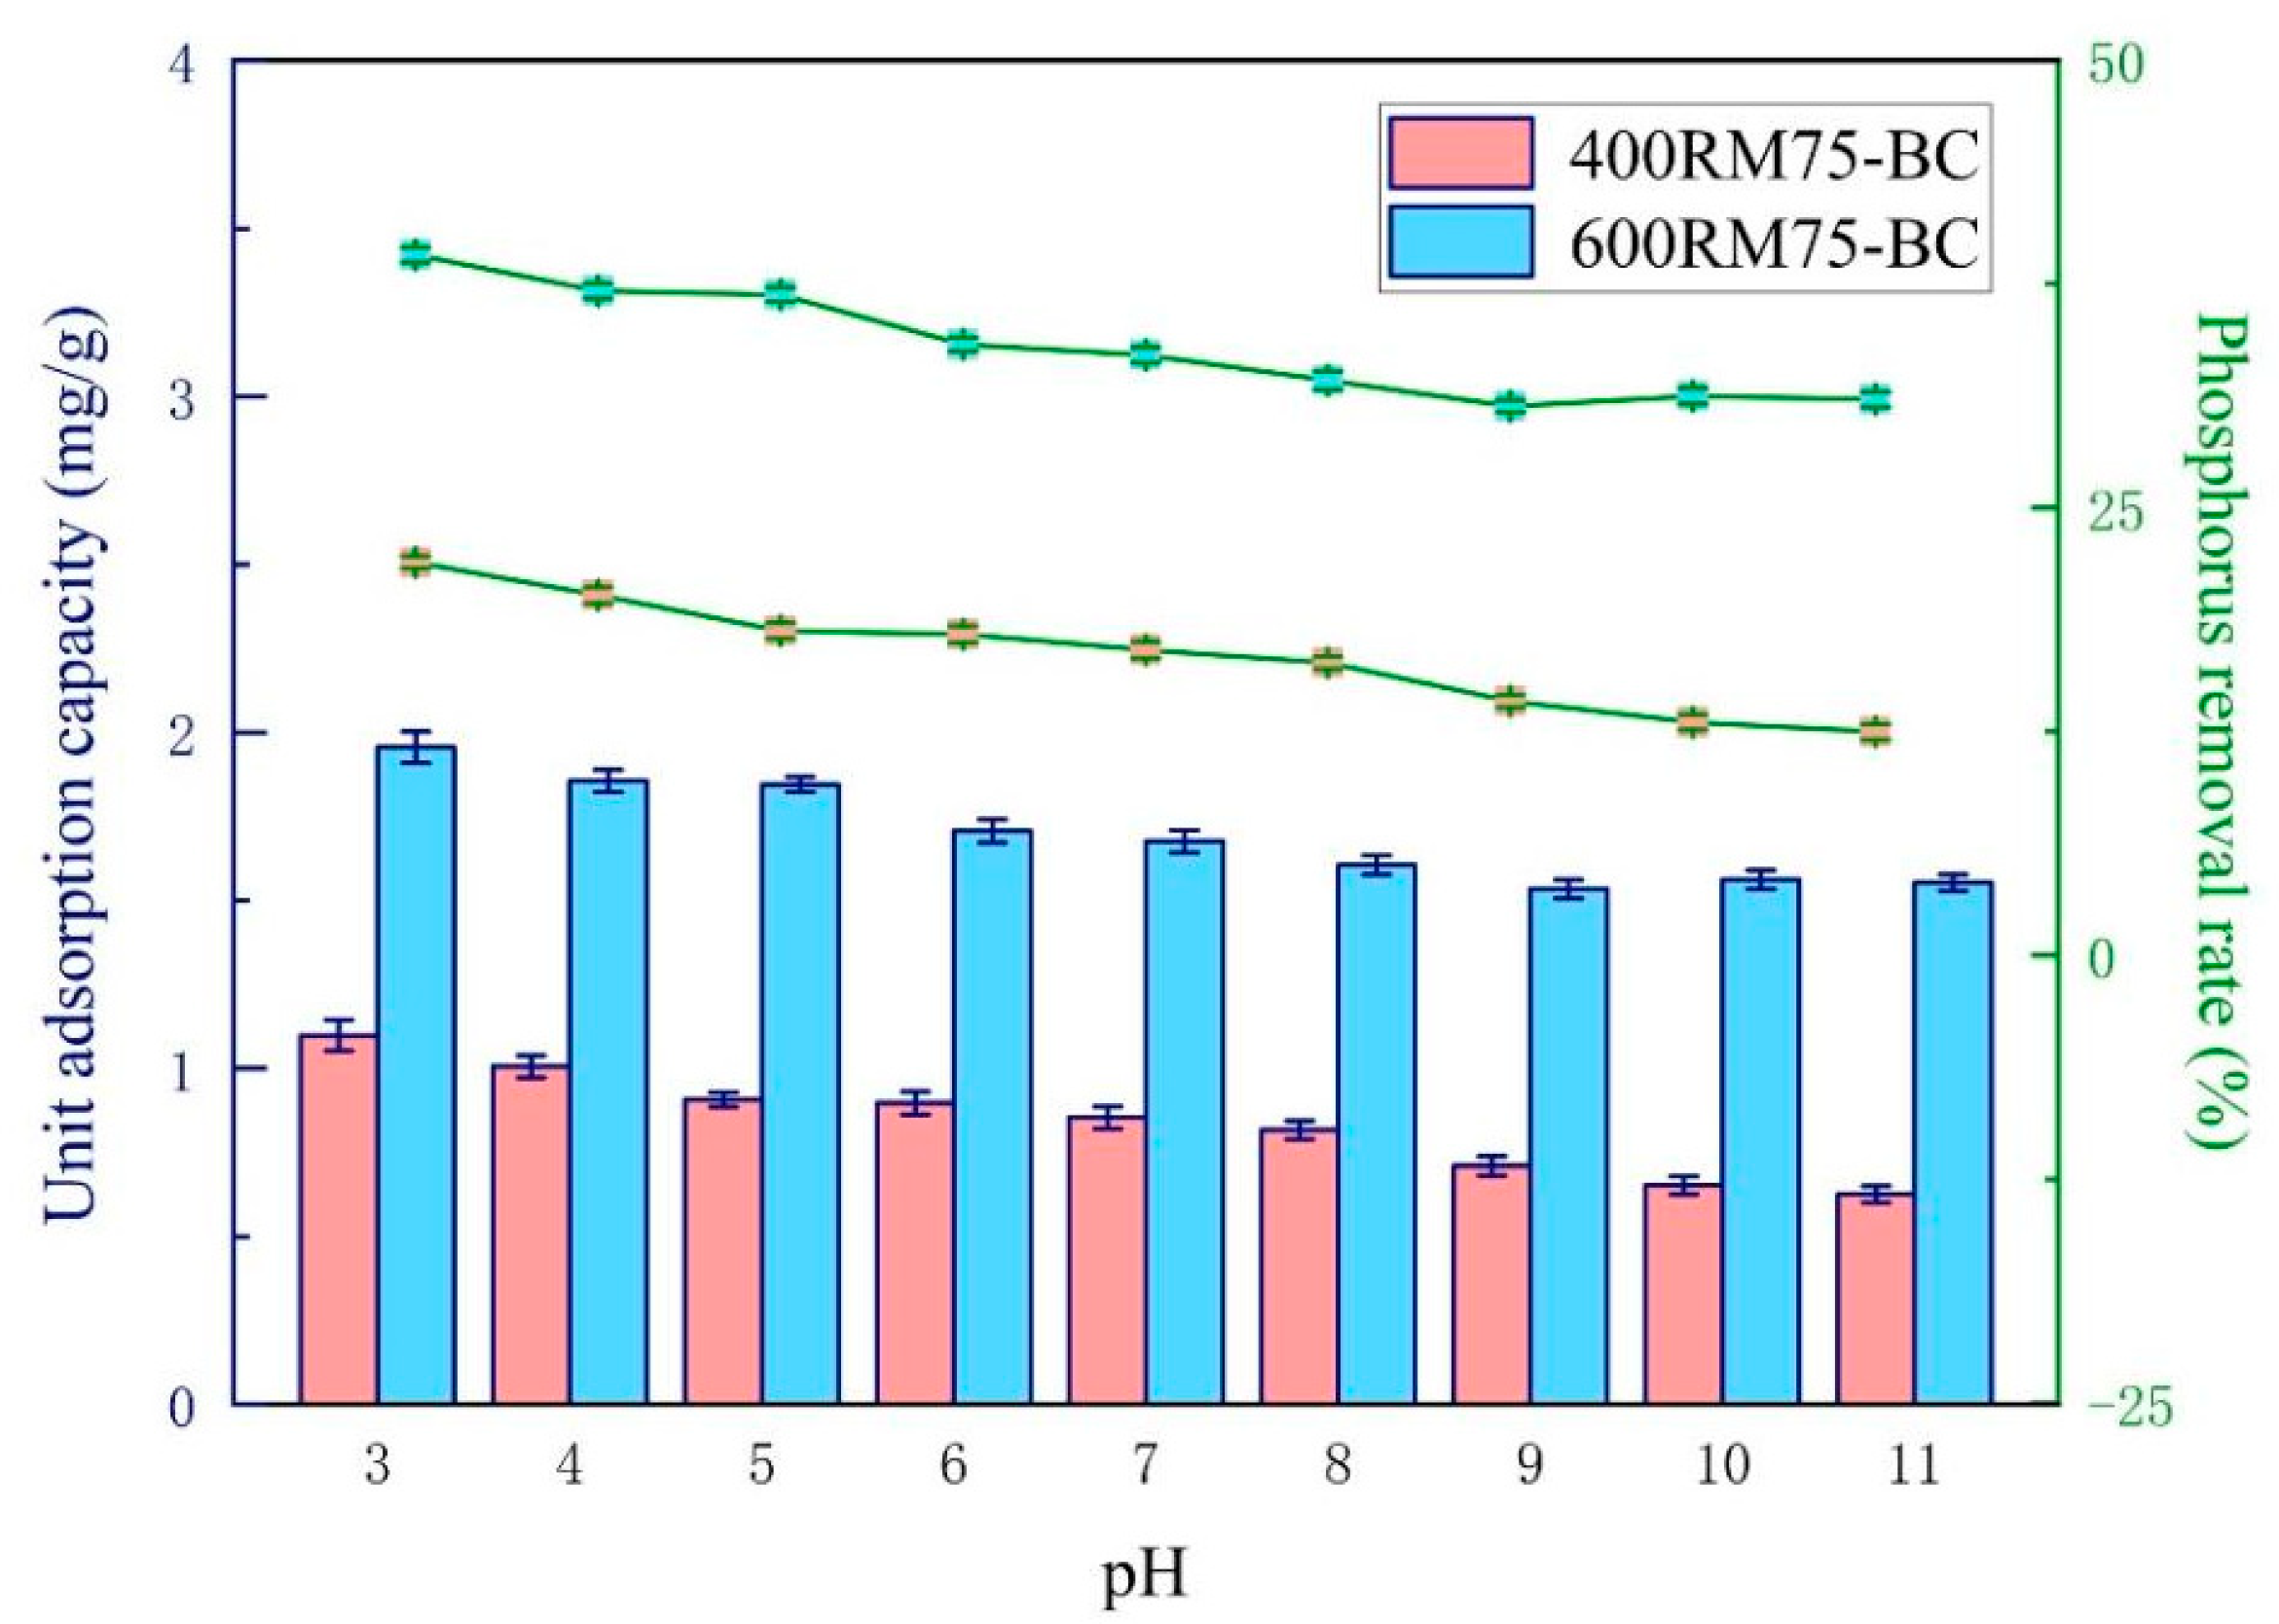
The variations in phosphorus adsorption performance and unit adsorption capacity of composites under different initial pH conditions were observed (
Figure 3). The sewage slurry had an initial phosphate concentration of 50 mg·L
−1 and a dosage of composite material at 10 g·L
−1. At a pH of 3, the phosphate removal rate achieved by 600RM75-BC and 400RM75-BC reached the maximum of 39.12% and 21.96%. This efficiency gradually decreased to 31.05% and 12.50% as the pH increased to 11. In addition, the unit adsorption capacity was also decreased as pH increased. The adsorption of phosphate by the materials was more effective under acidic pH conditions.
The trend discussed above is consistent with previous studies [
18,
19]. When the solution pH increases, PO
43− might form colloids, resulting in increased repulsion that hinders the adsorption of phosphate by the composites [
20,
21]. Conversely, when the solution pH decreased, a higher concentration of H
+ dissociated from the solution and attached to the material surface, enhancing the adsorption of anions. Considering that most water bodies were neutral, all subsequent experiments were conducted at a pH of 7 to enhance the practical applicability of the material.
3.2.3. The Effect of Initial Phosphate Concentration in the Solution
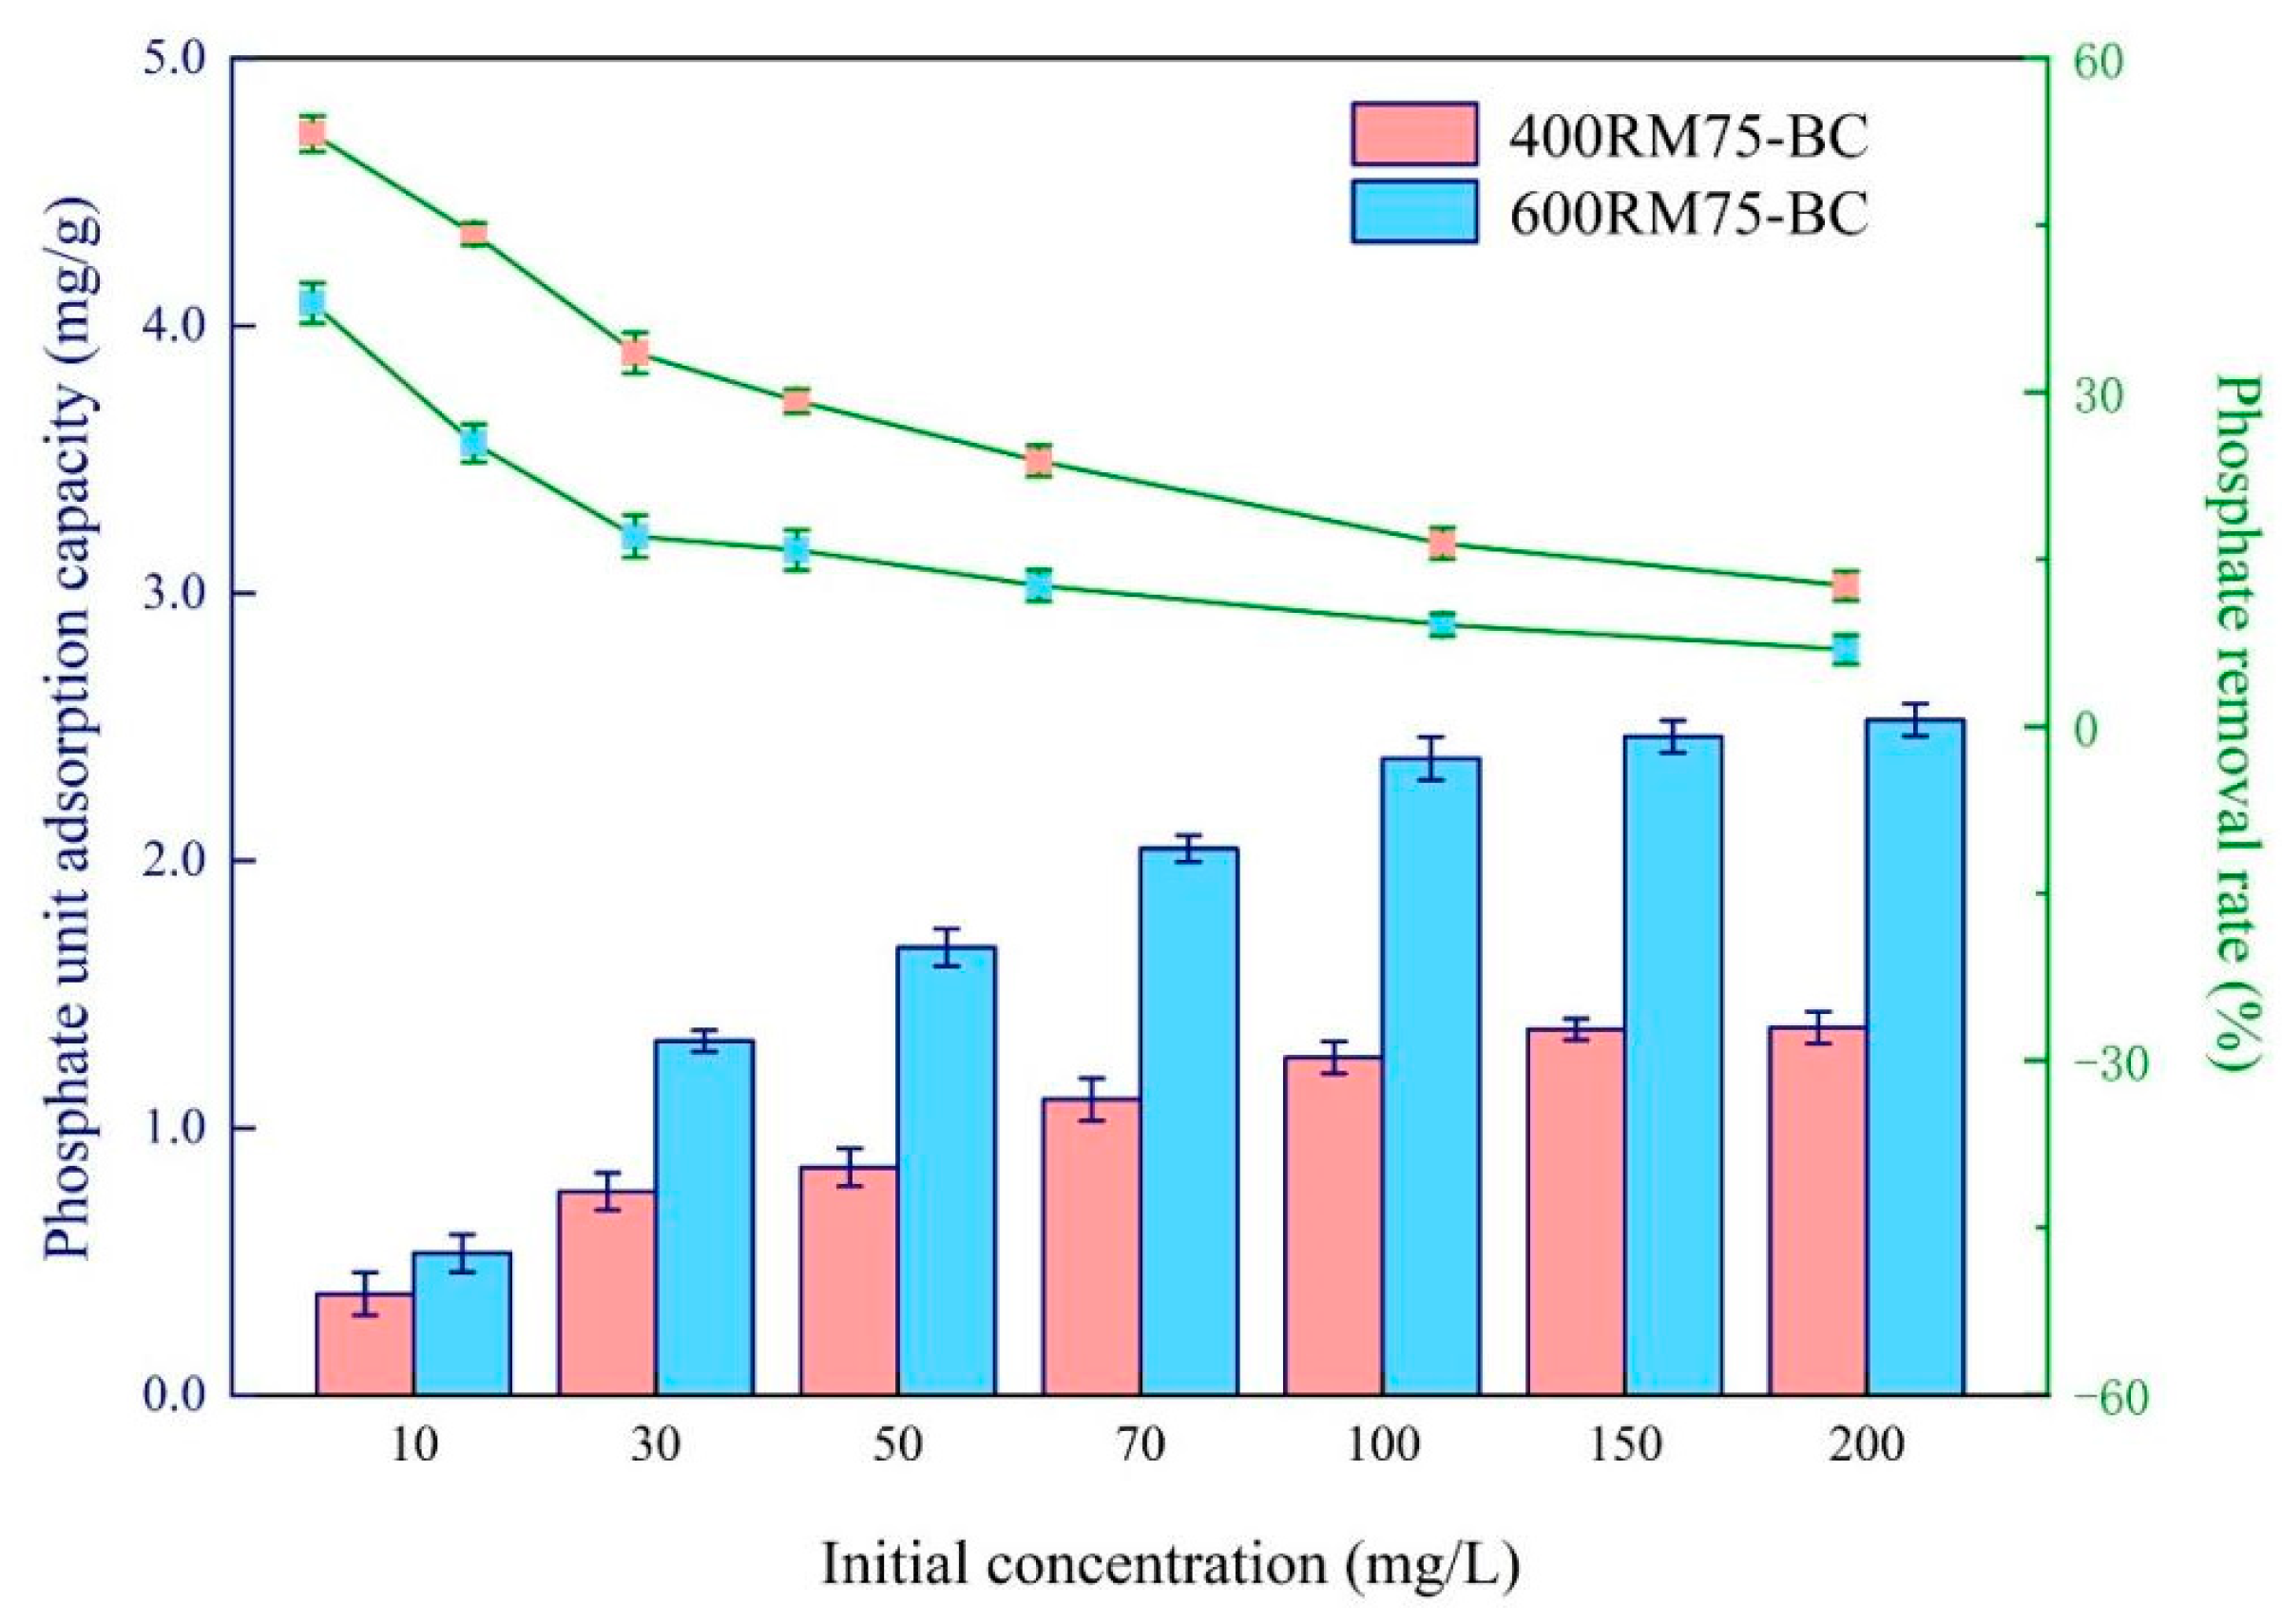
The phosphorus adsorption capacity and removal rate of the composites were investigated under varying initial phosphate concentrations (
Figure 4). It was observed that the phosphate adsorption removal rates of the two materials decreased from 38.11% and 53.20% to 6.88% and 12.63% across the range of initial concentrations tested from 10 mg·L
−1 to 200 mg·L
−1. Meanwhile, the unit phosphorus adsorption capacities increased from 0.38 mg·g
−1 to 1.38 mg·g
−1 and from 0.53 mg·g
−1 to 2.53 mg·g
−1 for 400RM75-BC and 600RM75-BC. Consequently, higher initial concentrations resulted in lower removal rates.
This trend could be attributed to the fact that, with increasing initial phosphate concentration, the dosage of the material remained constant, limiting the total amount of phosphorus that the material could adsorb. When the material was exposed to high concentrations of phosphate, the larger concentration gradient compared to low concentrations facilitated more efficient adsorption [
22].
3.3. Characteristics of Phosphorus Adsorption with Composites
3.3.1. Adsorption Kinetics of Phosphorus
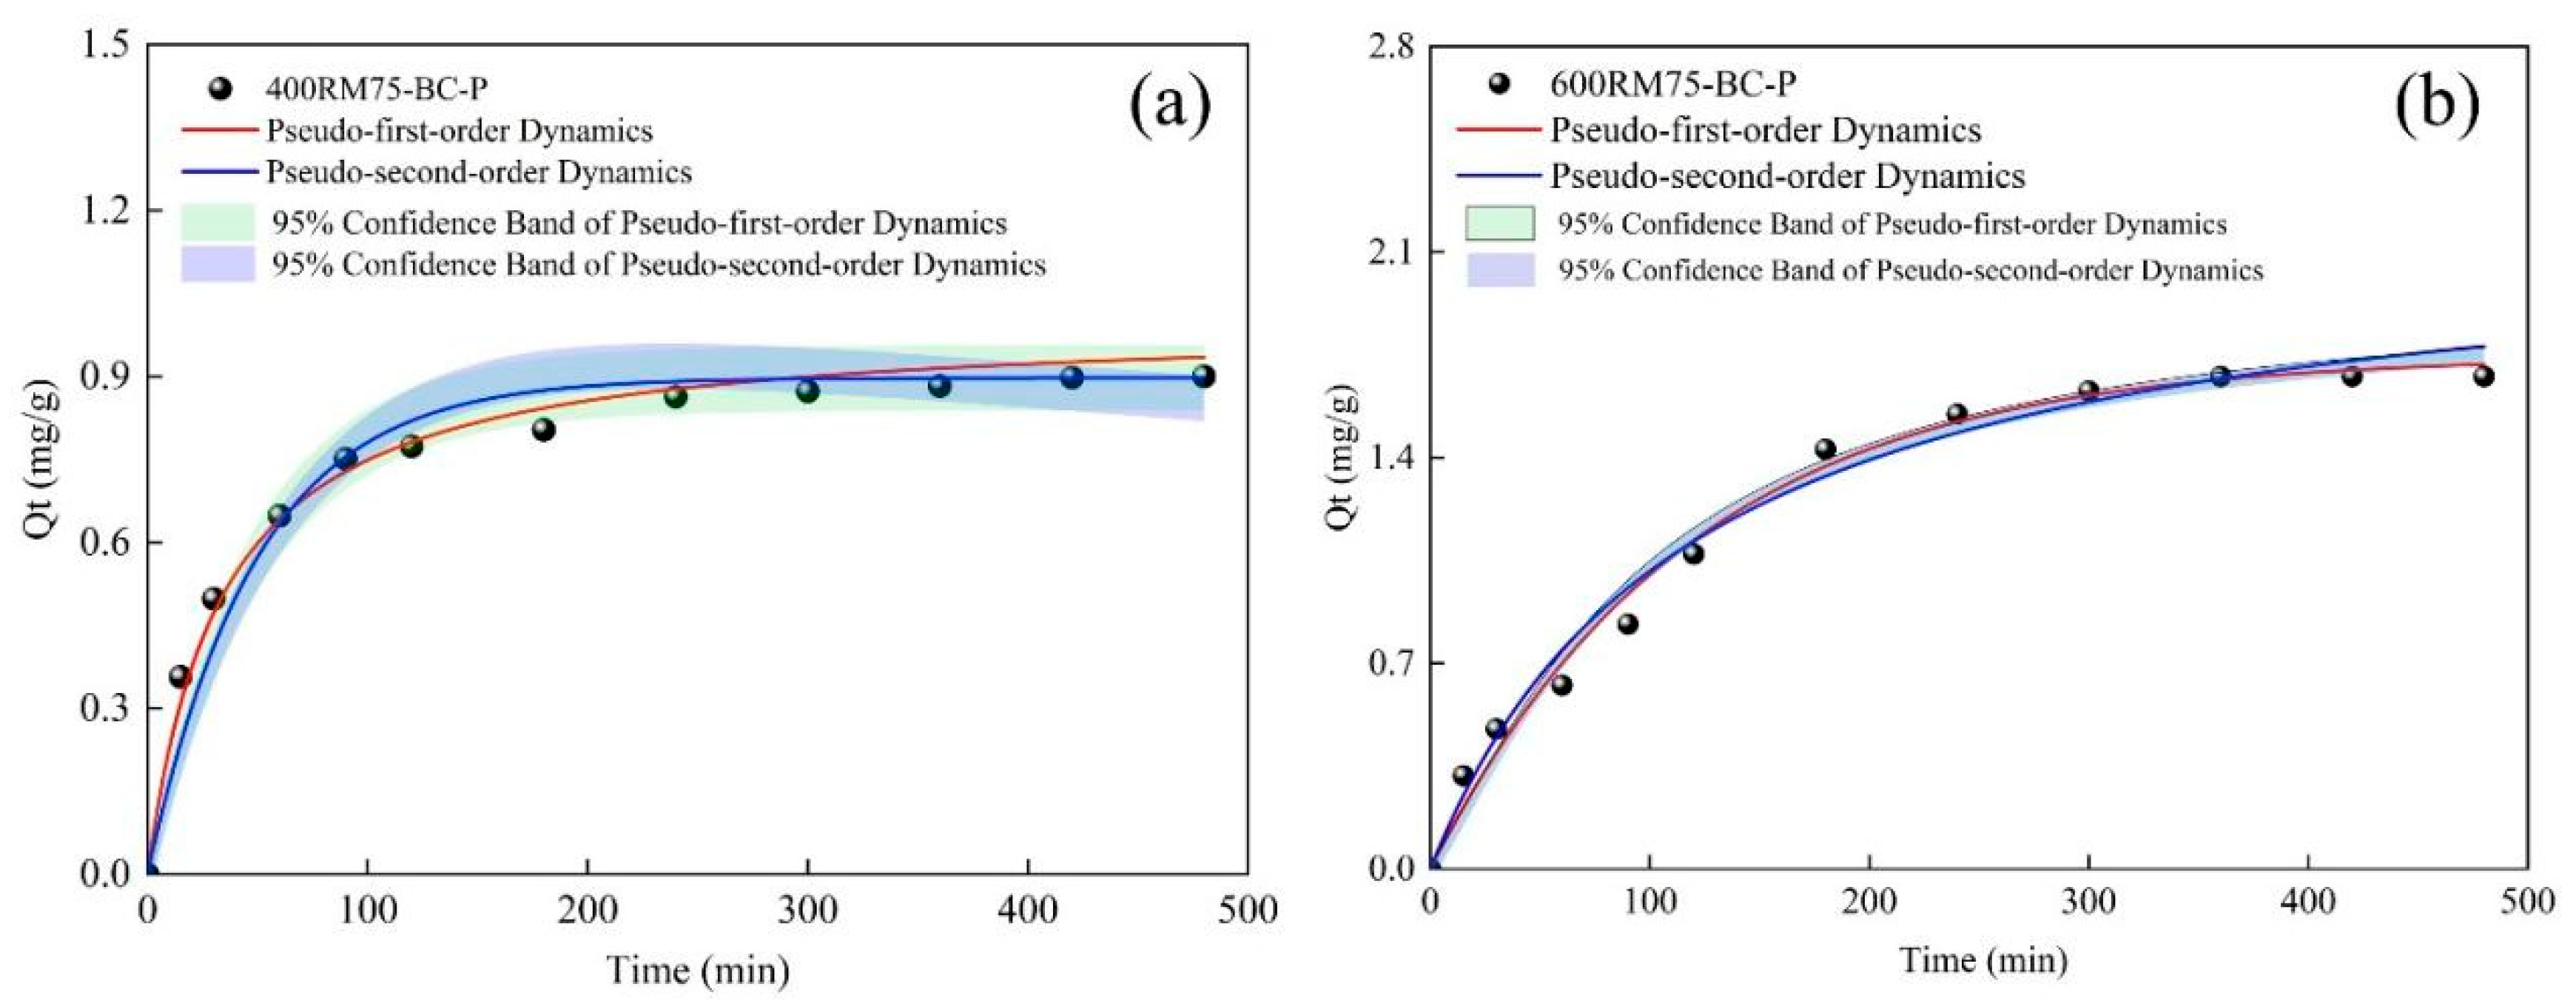
The adsorption kinetic model for 400RM75-BC and 600RM75-BC is shown in
Figure 5. The adsorption process of phosphate by the composites could be divided into three stages. The first stage was rapid adsorption in 0–100 min, the second stage was 100–300 min for slower adsorption, and the last stage was saturated adsorption during the rest of the time. The adsorption performance of the two composites was transformed over time.
At the initial stage, the adsorption rate was determined by the concentration gradient between the composites and the phosphate in the sewage slurry. And this stage was primarily driven by physical adsorption [
23]. As the metal sites became saturated, the physical adsorption gradually decreased or ceased, and the ion equilibrium between the composite surface and the solution was gradually established. In the final stage, the adsorption mechanism shifted from physical to chemical adsorption. The adsorption of phosphate was primarily achieved through ion exchange, surface precipitation, and electrostatic attraction, eventually reaching equilibrium [
24].
The adsorption behavior of phosphate by the materials was fitted using pseudo-first-order and pseudo-second-order kinetic equations. Both kinetic models provided good fits to the experimental data (
Table S4). The fitting parameters for 400RM75-BC and 600RM75-BC yielded
R2 of 0.9619 and 0.9852 for the pseudo-first-order model and 0.9909 and 0.9949 for the pseudo-second-order model. Pseudo-second-order model had better fits than the pseudo-first-order model to the adsorption behavior. These findings suggested that the adsorption of phosphate was influenced mainly by chemical adsorption, including surface precipitation and complexation [
25]. Therefore, the adsorption of phosphate by the composites was majorized by chemical adsorption.
3.3.2. Adsorption Isotherm of Phosphorus
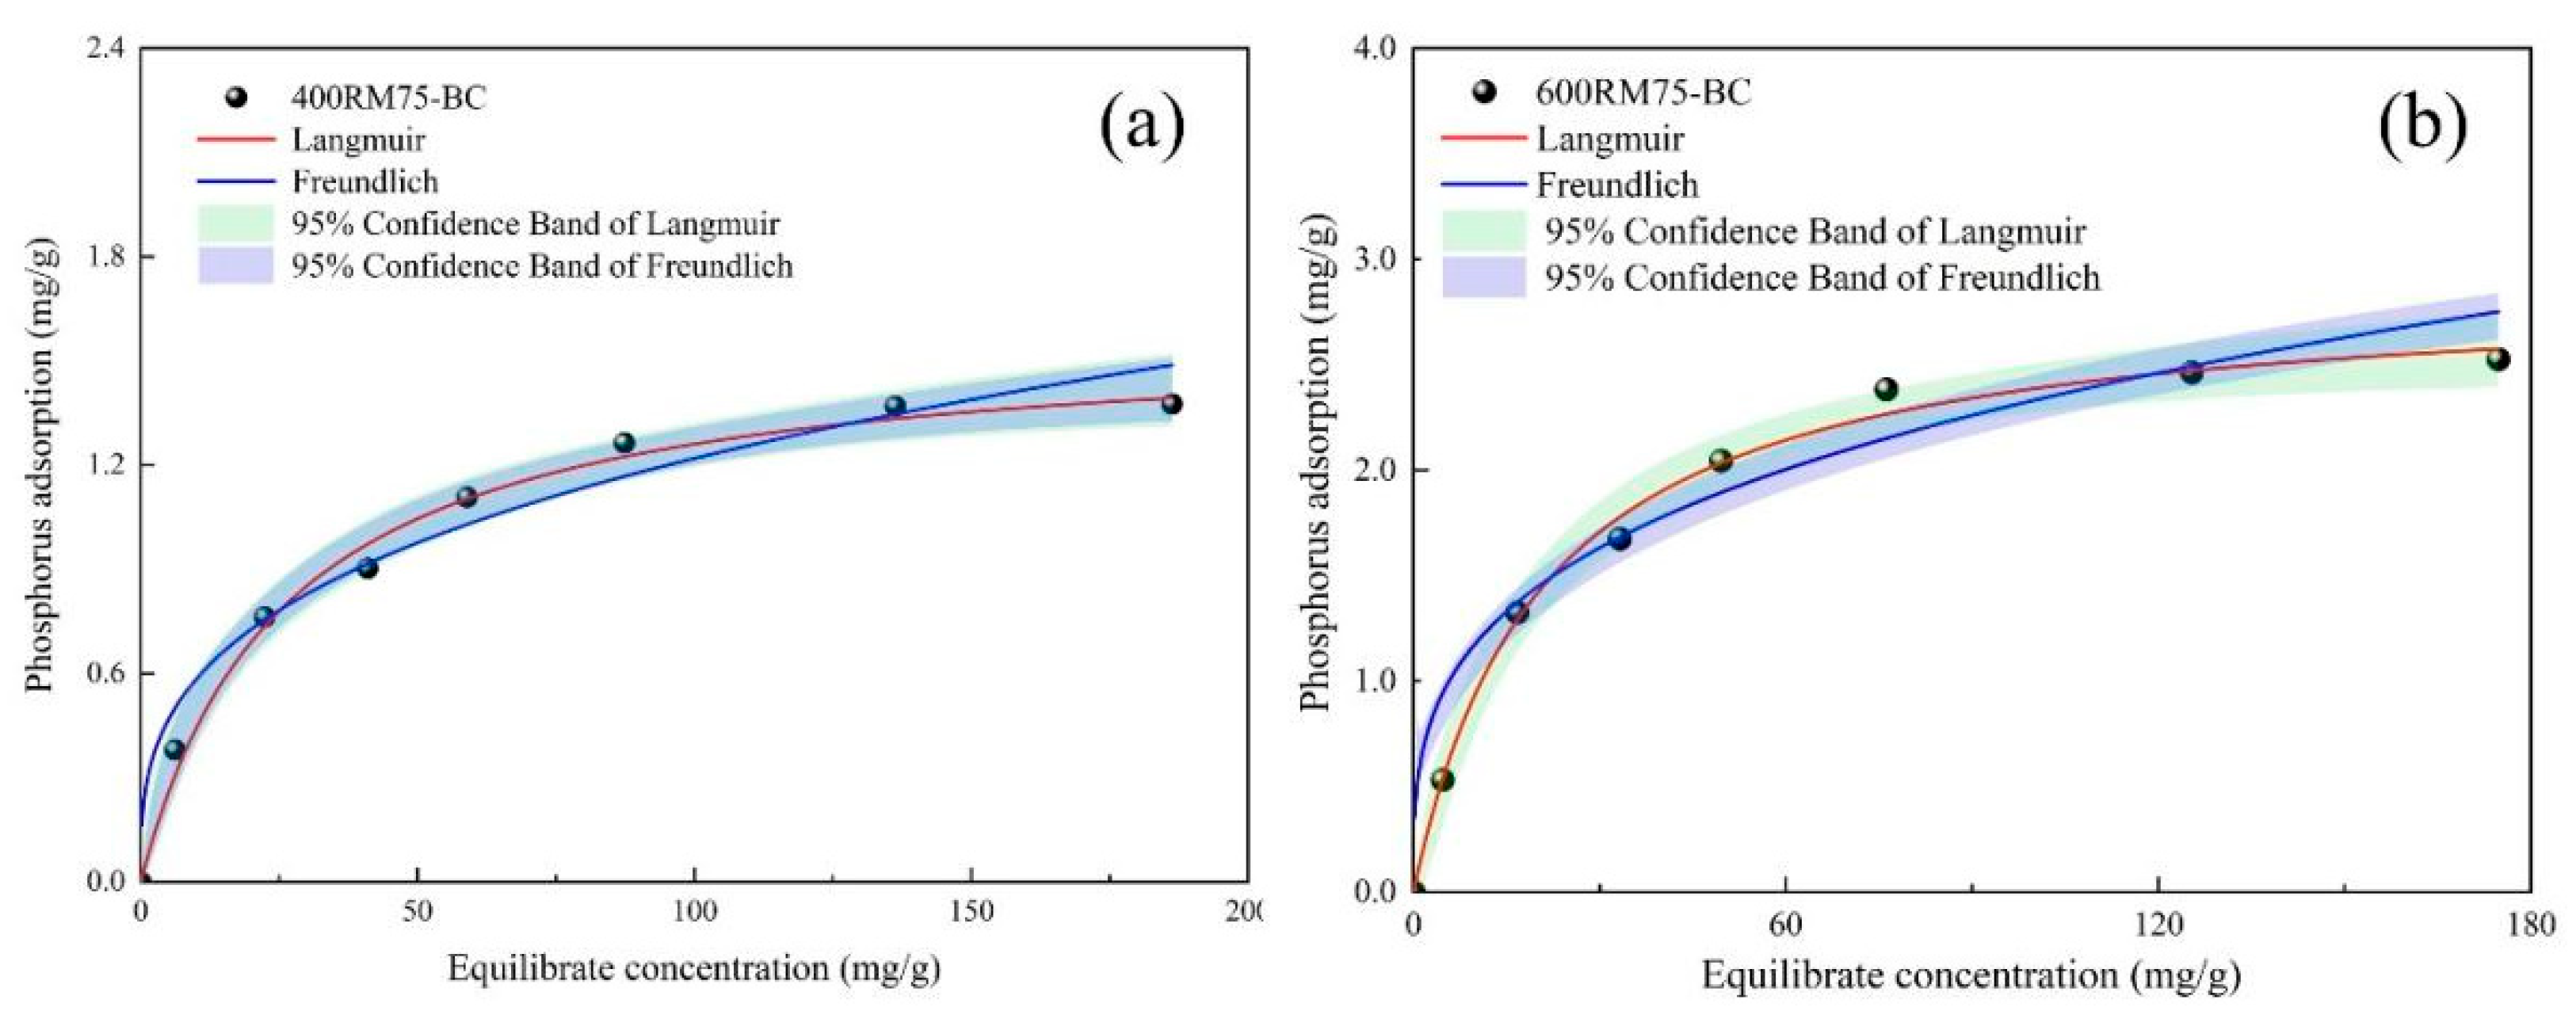
The adsorption isotherms of phosphate by the two composites at 25 °C were observed (
Figure 6). A rapid increase in the phosphorous adsorption occurred at a lower equilibrate concentration of both composites and then approached 1.586 mg·g
−1 and 2.877 mg·g
−1 at a higher equilibrate concentration. This increased the adsorption behavior for both composites during the adsorption isotherm experiments. As the initial concentration of phosphorus increased, the driving force of the concentration gradient enhanced the transfer of phosphate ions from the solution to the active sites of the composites [
23], resulting in an increased adsorption capacity for phosphorus.
The Langmuir model (
R2 was 0.969 and 0.991) exhibited a better fit than the Freundlich model (
R2 was 0.945 and 0.936), with maximum adsorption capacities reaching 1.586 mg·g
−1 and 2.877 mg·g
−1, respectively (
Table S5). The adsorption data were fitted to both the Langmuir and the Freundlich models. But the Langmuir models provided a better fit to the adsorption behavior of the composites for phosphorus. Thus, the composites tended to favor a monolayer adsorption mechanism, which was consistent with the previously reported results on phosphate adsorption [
25].
To evaluate the competitiveness of the adsorption capacity of the composites, we compared the results with similar adsorbents reported in the literature. For instance, biochar modified with iron oxide has been shown to exhibit maximum adsorption capacities ranging from 1.5 to 3.5 mg·g
−1 [
6], and other RM-based adsorbents have been reported to have values up to 2.5 mg·g
−1 [
26]. Our composite, with a maximum capacity of 2.877 mg·g
−1, falls within the competitive range, indicating its strong potential for phosphorus removal. This comparison highlights the effectiveness of our composite in removing phosphate from sewage slurry, positioning it as a promising candidate for further application in large-scale phosphorus recovery.
3.4. Adsorption Pathways of Phosphorus by Composites
3.4.1. Mineral Composition and Crystal Structure Changes
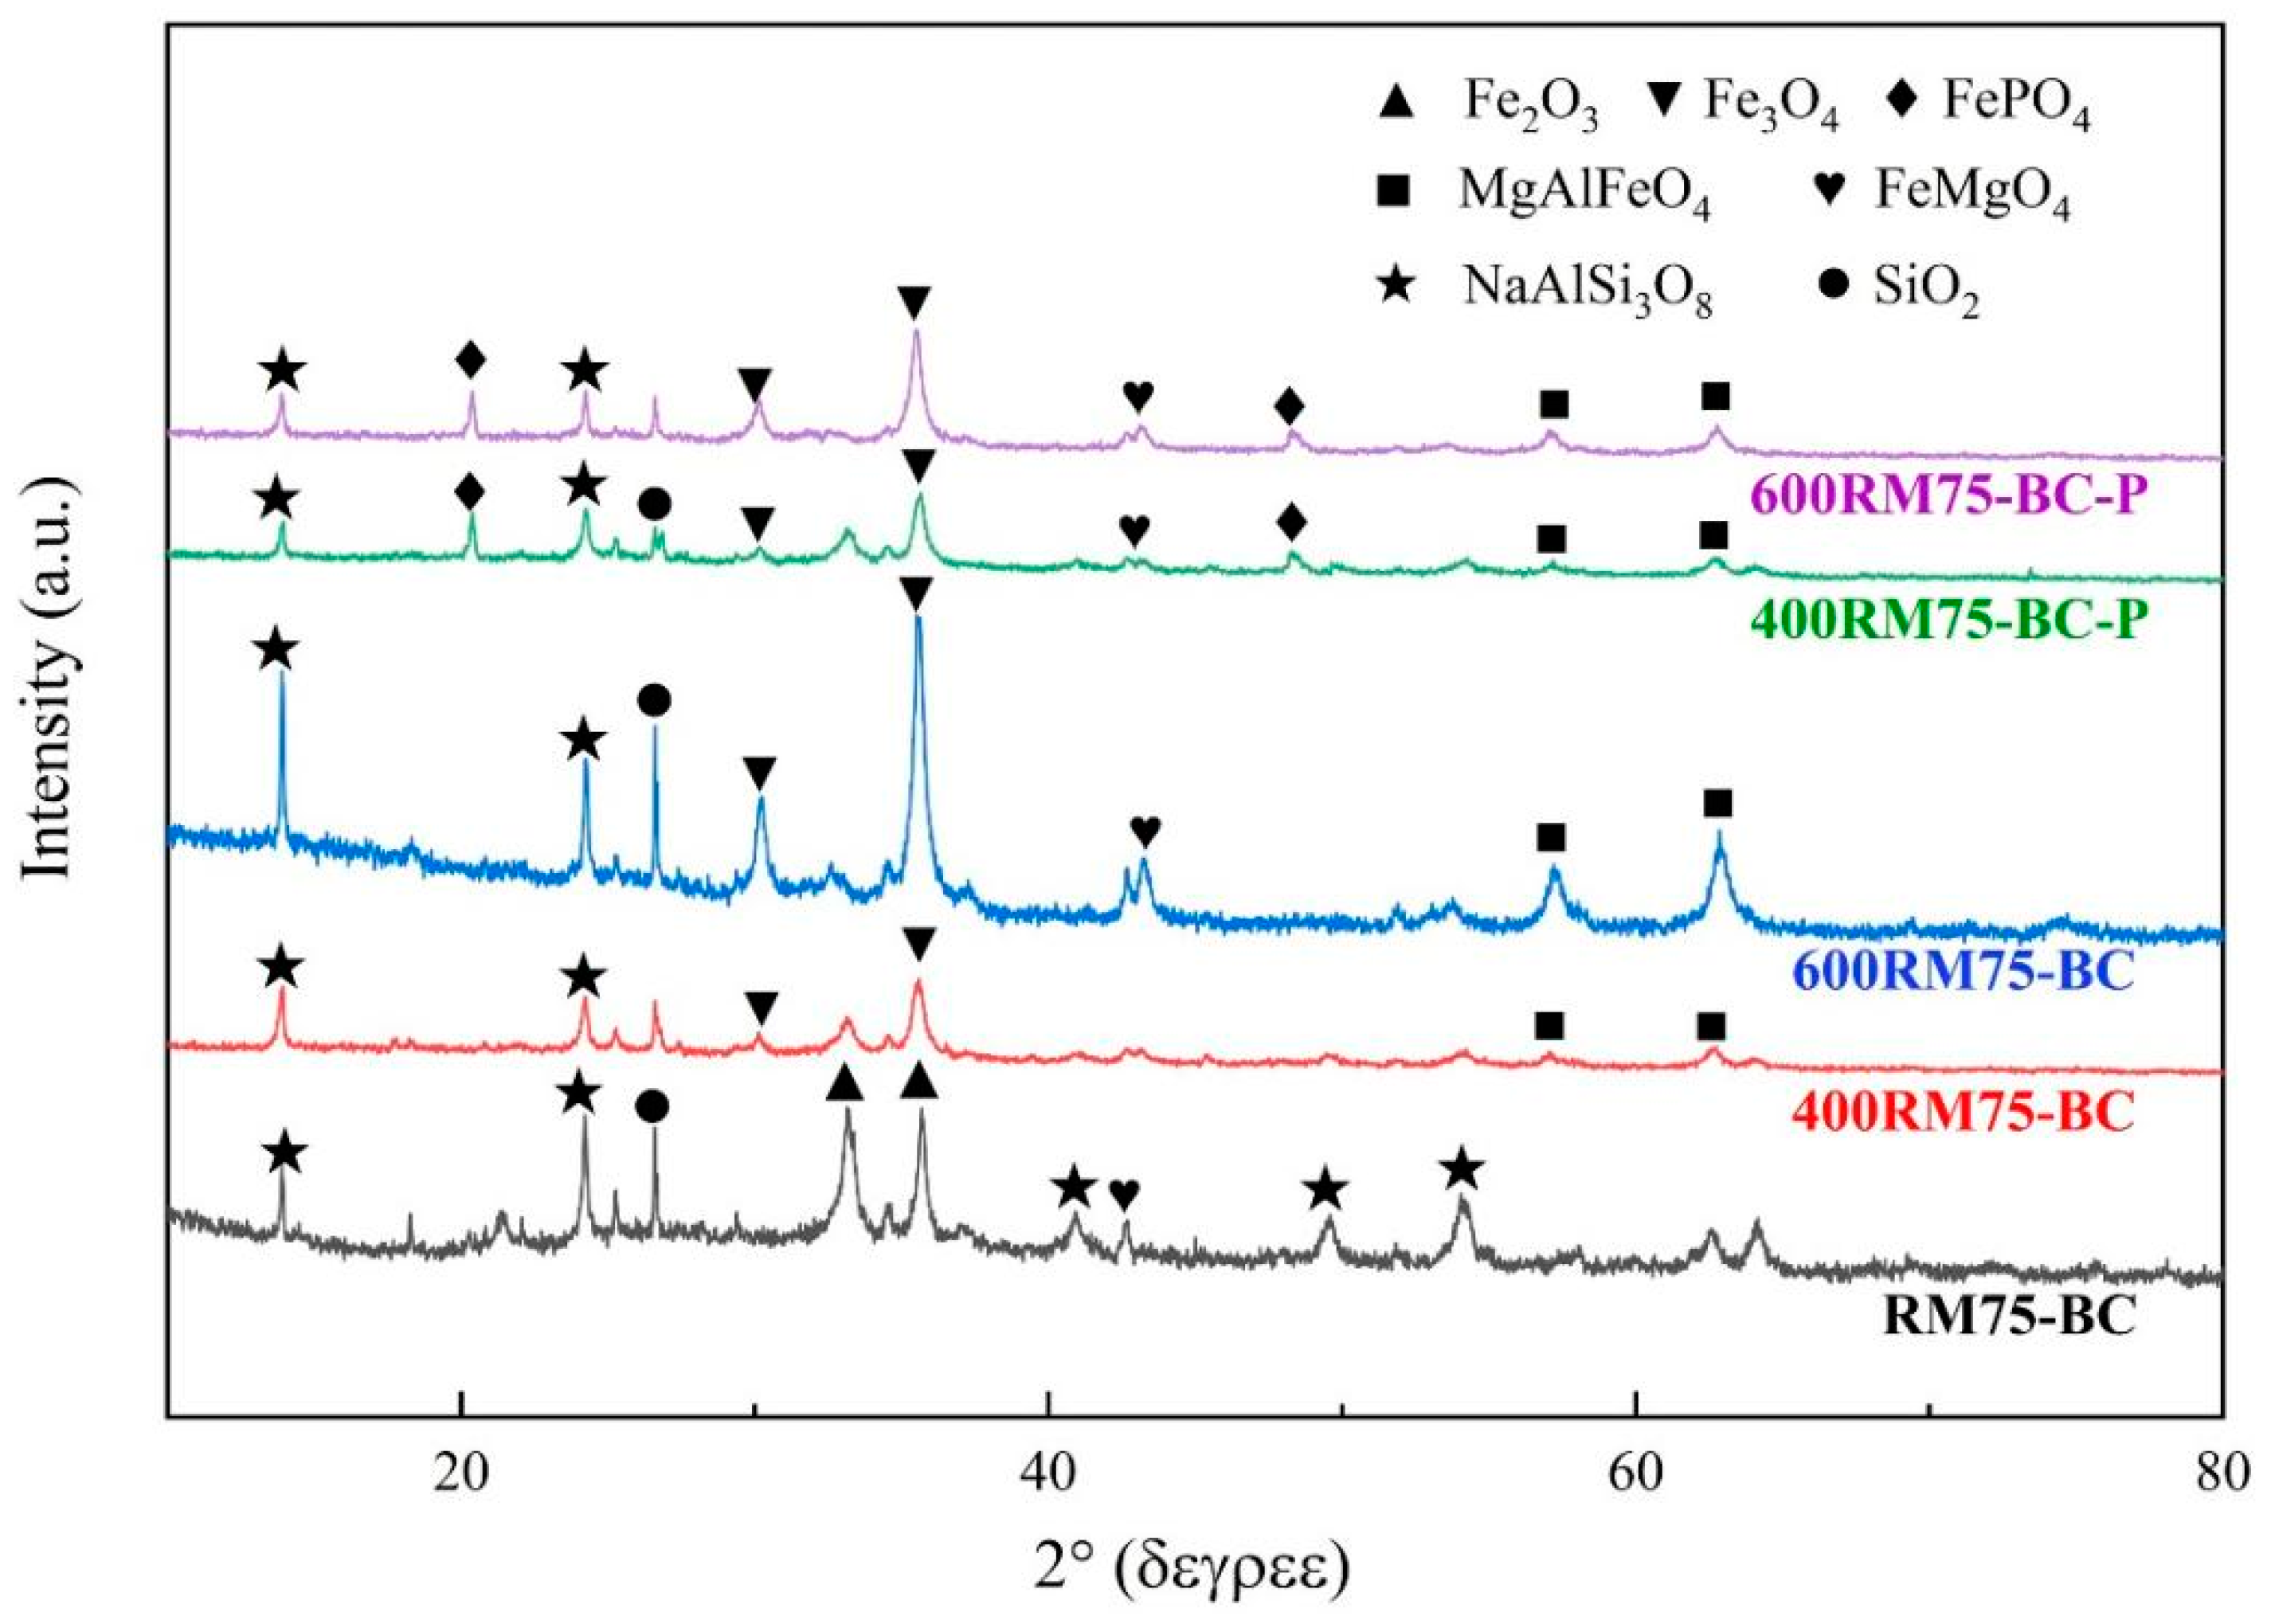
In this study, X-ray diffraction (XRD) analysis was employed to investigate the mineral composition and crystal structures of RM75-BC, 400RM75-BC, 600RM75-BC, 400RM75-BC-P, and 600RM75-BC-P (
Figure 7). Prior to pyrolysis (M75-BC), distinct peaks were observed at 13.91°, 24.23°, 33.11°, 32.78°, 35.60°, and 42.73°, which were NaAlSi
3O
8 and Fe
2O
3. Research has shown that RM alone has relatively weak phosphorus adsorption ability [
26].
After pyrolysis, new diffraction peaks appeared at 30.36°, 37.41°, 57.08°, and 63.77°, which related with Fe
3O
4 and MgAlFeO
4 [
6,
27]. The co-pyrolysis of RM and BR demonstrated superior phosphorus adsorption performance. This phenomenon was attributed to the generation of reductive gases during RM pyrolysis, which reacted with hematite and formed magnetite [
28]. Simultaneously, the high temperature caused the magnesium and aluminum oxides in RM to rearrange, forming composite oxides. Thus, after co-pyrolysis, an increased number of active adsorption sites emerged on the material surface [
29].
Studies have shown that the formation of similar Fe-O-P bonds has been observed in iron-modified sludge biochar [
27], but the RM-BR composite in this study produced more crystalline FePO
4 and stronger Fe-P binding. This difference may be attributed to the synergistic effects of Al and Mg oxides in RM, which stabilized Fe
3+ and promoted nucleation of FePO
4. The co-pyrolysis route thus enhanced both the chemical reactivity and long-term stability of phosphorus immobilization.
3.4.2. Changes in Functional Groups
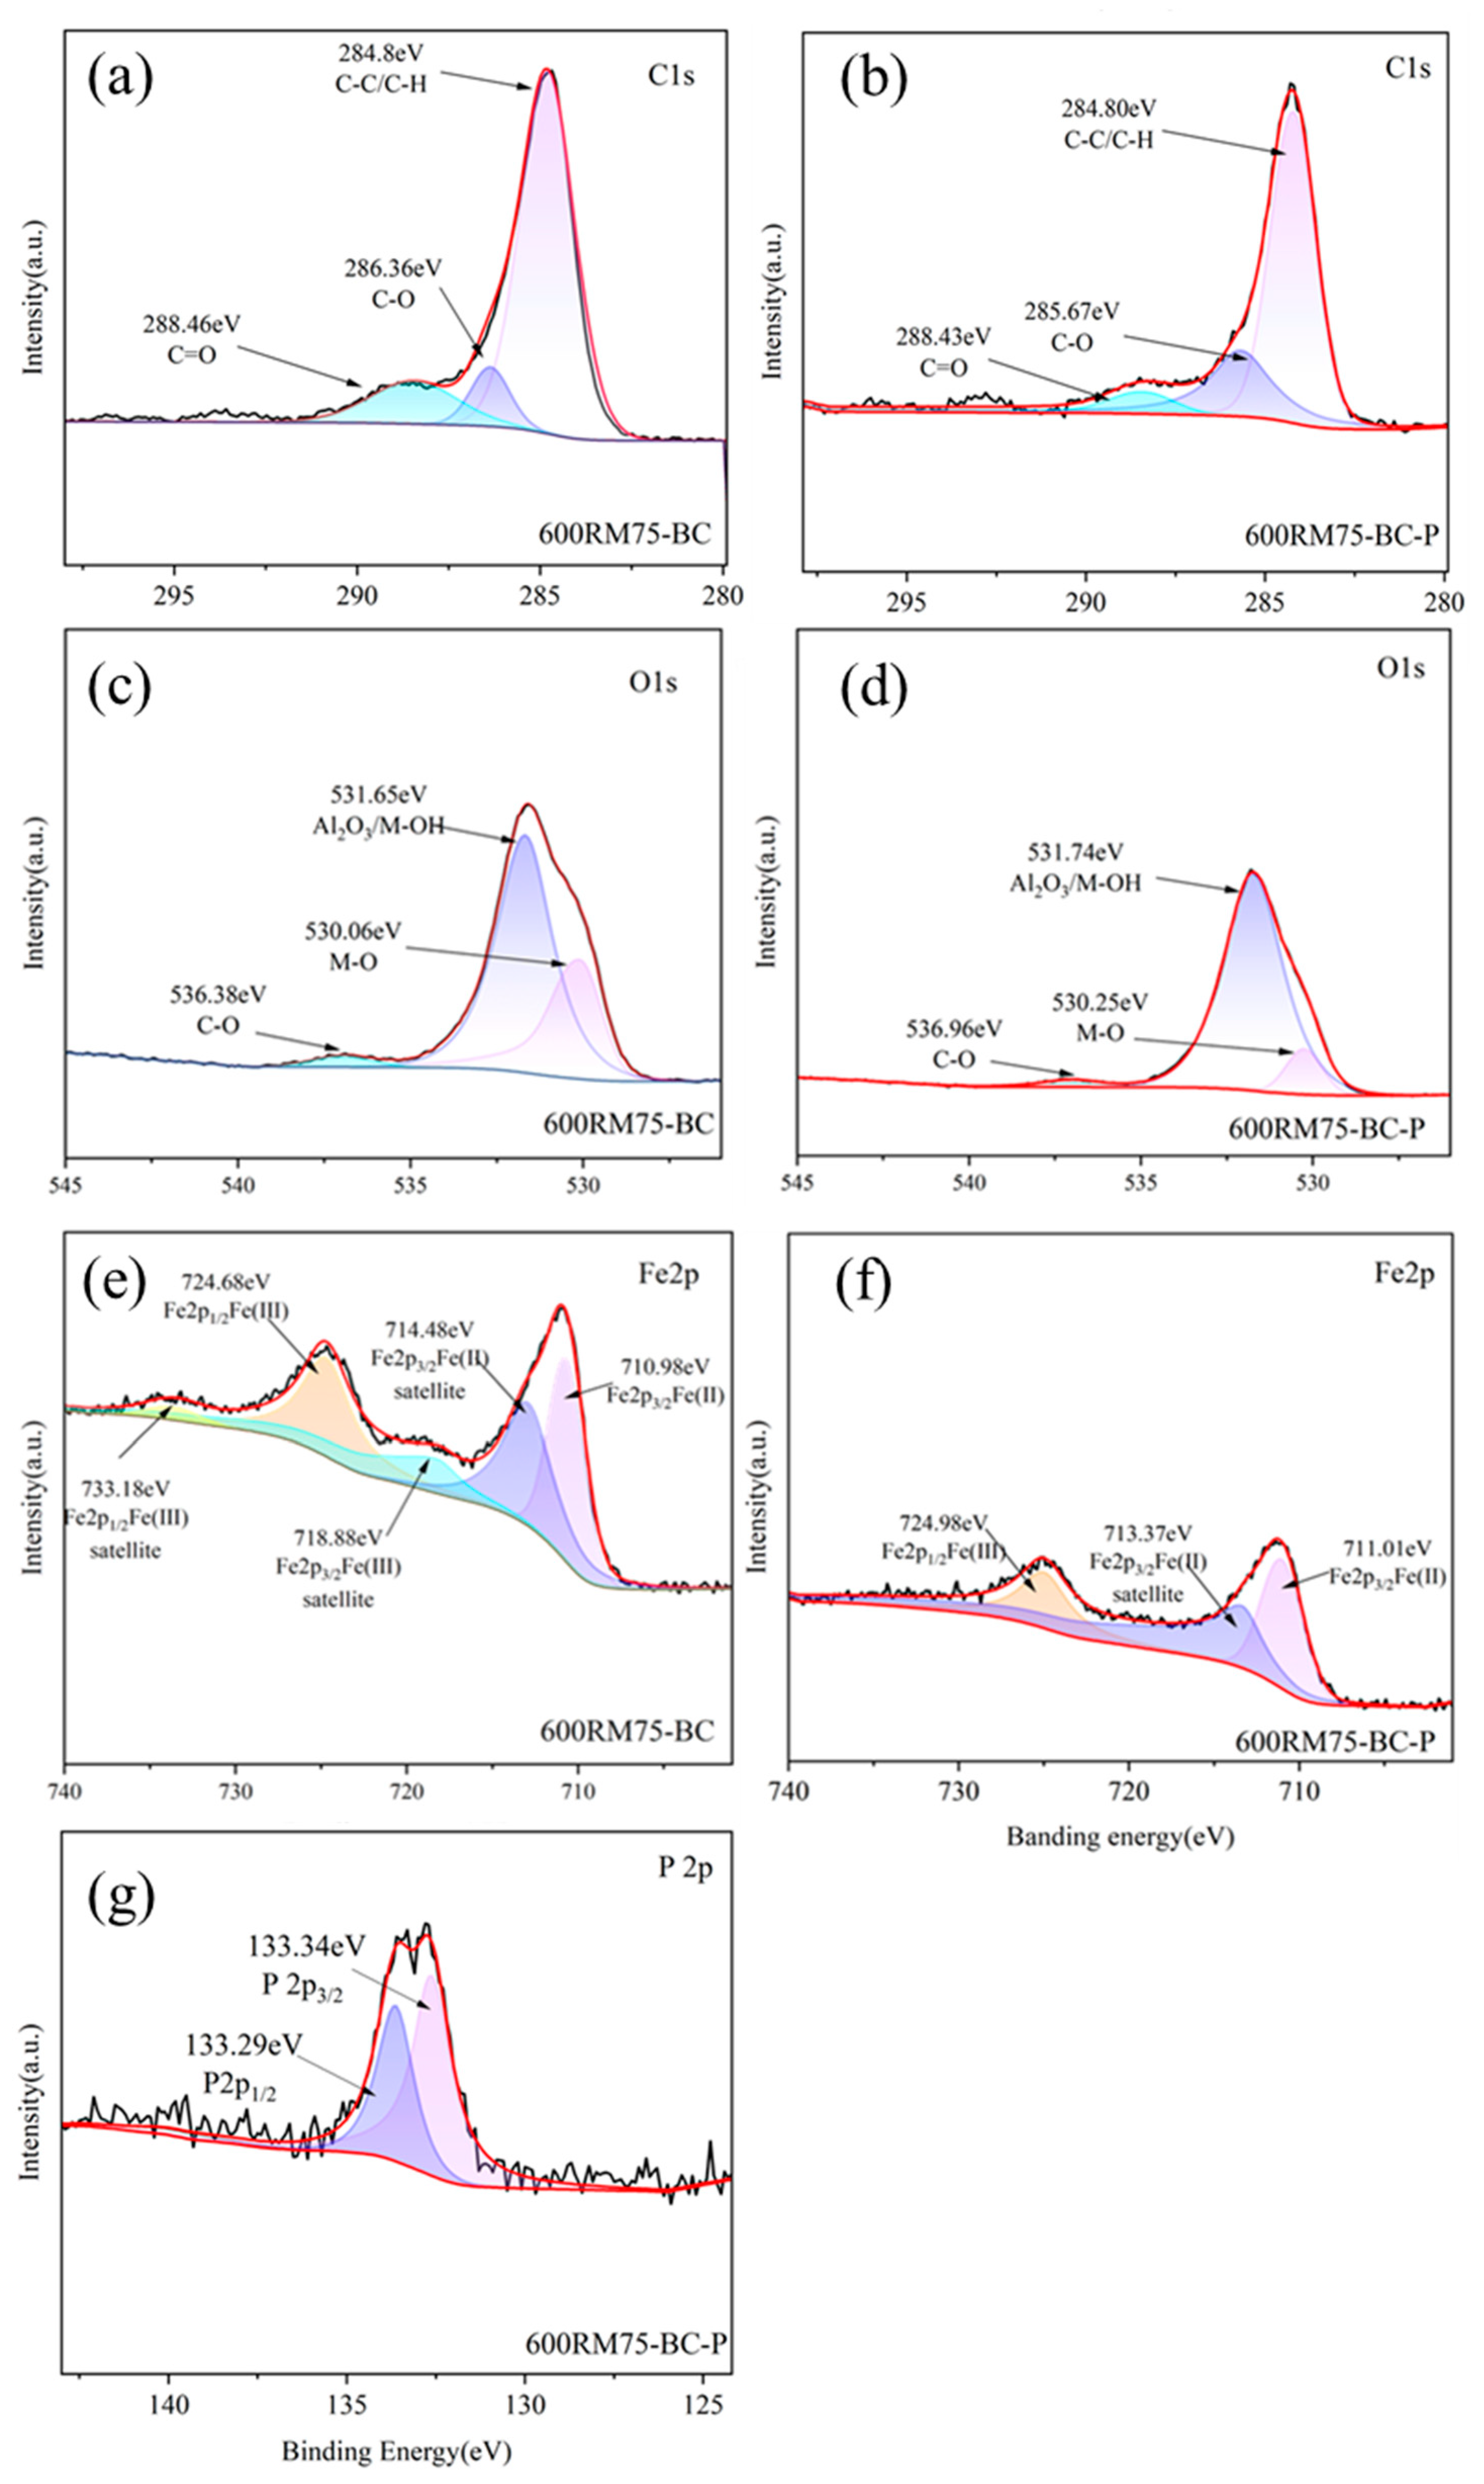
In this study, X-ray photoelectron spectroscopy (XPS) was employed to further investigate the changes in major functional groups of the 600RM75-BC composite. As shown in
Figure 8a,b, the C 1s spectrum was separated into three peaks, which corresponded to C=O (288.24 eV), C-O (286.13 eV), and C-C/C-H (284.80 eV). After phosphate adsorption, these peaks shifted to C=O (288.34 eV), C-O (285.67 eV), and C-C/C-H (284.80 eV). This shift was likely due to the chemical bonding or electrostatic attraction between phosphate and the composite through functional groups, such as -COO-, -R-O-, and M-O, which facilitated phosphate adsorption [
4]. This phenomenon was also consistent with findings from other materials [
20,
27].
The O 1s core-level spectra of the material before and after phosphate adsorption were also examined (
Figure 8c,d). The O 1s spectrum was deconvoluted into three characteristic peaks with binding energies at 536.38 eV, 531.11 eV, and 529.35 eV, corresponding to C-O, M-OH, and M-O, respectively. After phosphate adsorption, the peak areas of C-O, M-OH, and M-O decreased significantly, and the peaks shifted to 536.96 eV (C-O), 531.71 eV (M-OH), and 530.25 eV (M-O). This shift altered the chemical environment around the oxygen atoms. The reduction in M-O and M-OH functional groups was likely associated with the formation of FePO
4 complexes during the phosphorus adsorption process [
18], which was consistent with the XRD characterization results.
The main and satellite peaks of Fe 2p include the Fe 2p
3/
2 peak located at 710.99 eV and the Fe 2p
1/
2 peak at 724.05 eV (
Figure 8e,f). After phosphate adsorption, the peak area of Fe 2p
1/
2 decreased, while that of Fe 2p
3/
2 increased. Iron in RM75-BC was reduced to Fe
3O
4, while Fe-O-P functional groups were formed during the pyrolysis process. Studies demonstrated that Fe in RM was capable of forming Fe-P compounds that directly hydrolyzed to multinuclear hydroxyl complexes, such as Fe(OH)
2 and Fe(OH)
3, and that immobilized phosphorus through adsorption [
29]. The P 2p spectrum was deconvoluted into two types of P 2p bonds with binding energies at 134.5 eV and 133.6 eV, corresponding to the spin–orbit splitting peaks of metal phosphates/metal phosphides (
Figure 8g). Combined with the previous detailed analysis of Fe 2p and the XRD results, these peaks were also likely associated with the formation of Fe-O-P. This indicated that Fe in 600RM75-BC underwent a chemical reaction with phosphorus during the adsorption process, resulting in the formation of FePO
4.
3.5. Comprehensive Analysis
Integrating the results from XPS and XRD analyses, the adsorption mechanisms of phosphorus in sewage slurry by the co-pyrolysis products of RM and BR were majorized by chemical precipitation.
The fitting of experimental data to the pseudo-second-order kinetic model indicated that the adsorption process of phosphate by the composites was predominantly governed by chemical adsorption. The good fit of the model further confirmed the significant role of chemical adsorption in phosphorus adsorption. Metal ions (such as Fe3+ and Al3+) on the material surface formed stable complexes with phosphate through coordination reactions, enhancing the efficiency of the adsorption process.
XRD analysis revealed the formation of FePO4 crystals on the surface of the composites after phosphate adsorption, indicating that phosphate not only reacted chemically with metal ions but also formed FePO4 precipitates through precipitation reactions. This finding was consistent with the XPS results, suggesting that precipitation was one of the key mechanisms for phosphate adsorption by the composites.
From XPS results, during the co-pyrolysis process, Fe in RM was transferred to BR through a loading effect, causing its oxidation state (Fe
2O
3) to transform into reduced states (FeO and Fe
3O
4). These findings were confirmed by XPS analysis, where the reduction in the peak area of Fe 2p
1/
2 and the increase in the peak area of Fe 2p
3/
2 indicated that Fe
3+ underwent a chemical reaction with phosphate during the adsorption process, forming Fe-O-P functional groups [
4,
30].
3.6. Environmental Sustainability Assessment
This study uses the CML2016 evaluation system in the Gabi software (10.7.1) to assess the environmental impacts of the traditional disposal process of coagulation precipitation and the disposal process with composites in this study for the phosphorus removal from biogas slurry. The system boundaries started from the consumption (such as drags and energy) in the biogas slurry treatment and ended at the production of sludge and recycled water. After classifying and characterizing the inventory data (
Table S6) [
31], to enable a comparison of environmental impact indicators between the two disposal processes, the different CML impact categories were normalized and weighted according to various standard values (
Table S7). Through the normalization process, the environmental impacts of the two processes were made comparable.
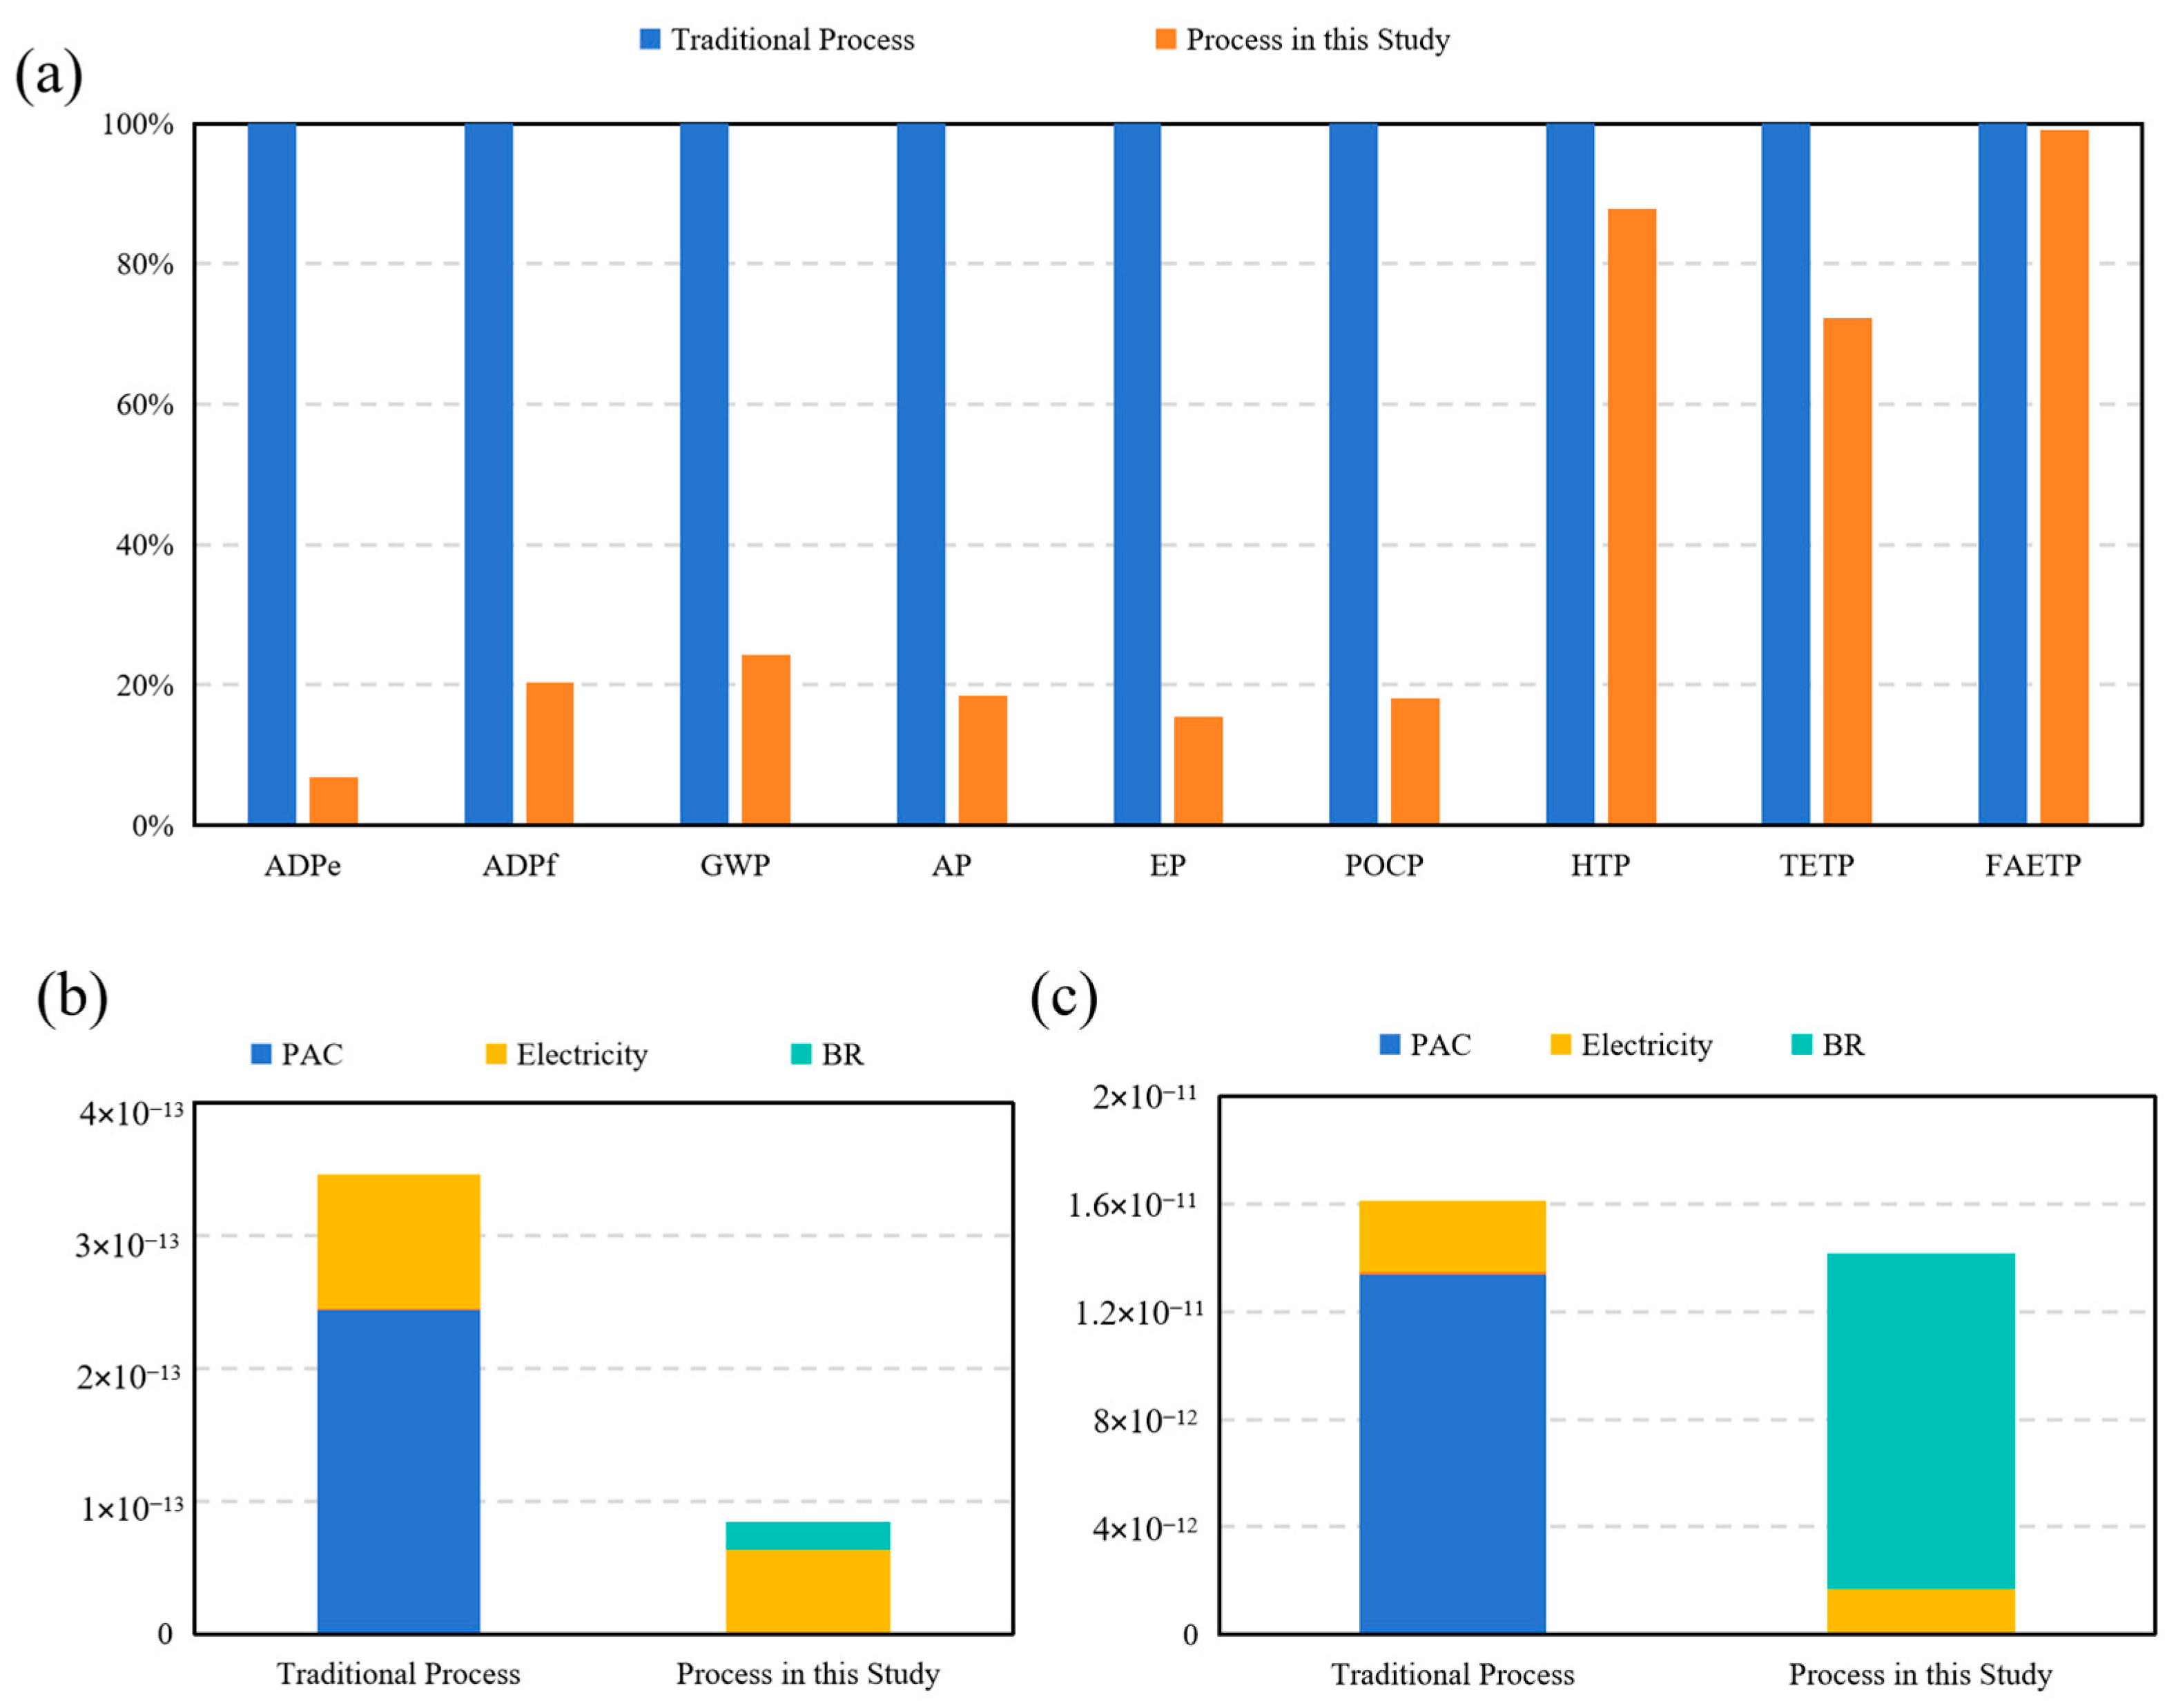
According to
Figure 9a, by comparing the environmental impacts of the two disposal processes across nine categories, if the traditional process indicators were set to 100%, the relative values of the environmental impacts of the innovative process could be observed from the Figure. Except for the impact indicators of human toxicity (HTP), freshwater aquatic ecotoxicity (FAETP), and terrestrial ecotoxicity (TETP), the traditional disposal process had higher values for six environmental impact indicators, including global warming potential (GWP), compared to the disposal process in this study.
Figure 9b shows the comparison of the environmental impact indicator GWP between the two disposal processes. The results indicated that the weighted result of the traditional disposal process was 3.5 × 10
−13, while the disposal process in this study was 8.4 × 10
−14. The overall GWP was quite low, indicating that the disposal process in this study not only had generally lower environmental impact indicators but also significantly reduced carbon dioxide emissions.
The comparison of FAETP between the two disposal processes is shown in
Figure 9c. The results indicated that the weighted result of the traditional disposal process was 8.6 × 10
−13, while the disposal process in this study was 8.5 × 10
−13. The FAETP values of both disposal processes were similar overall, but the FAETP impact in the disposal process of this study was mainly dominated by the biogas sludge production stage. In contrast, the traditional disposal process was primarily influenced by the production process of polyalanine chloride (PAC). An innovation in this process could be adopting a greener production method for BR, which would further reduce the impact on FAETP.
4. Conclusions
Co-pyrolysis of RM and BR increased the phosphorus adsorption to 2.877 mg·g−1. The optimized conditions were as follows: a pyrolysis temperature of 600 °C, a RM to BR ratio of 3:1, the biogas slurry with a dosage above 50 g·L−1, a pH of 3, and being below 30 mg·L−1 of initial phosphate concentration. The adsorption results of phosphorus by the composites can be well fitted by the pseudo-second-order kinetic equation (R2 = 0.9949) and the Langmuir model (R2 = 0.991), which is more inclined to a monolayer adsorption mode. After co-pyrolysis, the composite surface was enriched with Fe-O functional groups, which promoted the formation of Fe-based phosphate species (e.g., FePO4) and enhanced phosphate sequestration. Thus, the adsorption process of phosphate by the composite material mainly includes chemical precipitation. This new composite has large potential for RM resource utilization and phosphorus recovery in sewage slurry. However, scalability, long-term stability in real biogas slurry, and economic viability of large-scale phosphorus recovery remain unproven. Future work should optimize adsorption, enhance durability under diverse conditions, validate field performance, and compare disposal impacts to cut BR use and boost sustainability.





 ,
,