Article

The Impact of the Energy Use Rights Trading System on Corporate Energy Technology Innovation

1
School of Economics, Zhongnan University of Economics and Law, Wuhan 430073, China
2
Department of Food Science and Engineering, Qilu University of Technology, Jinan 250353, China
*
Author to whom correspondence should be addressed.
Sustainability 2026, 18(14), 7322; https://doi.org/10.3390/su18147322
Submission received: 27 April 2026 / Revised: 7 July 2026 / Accepted: 9 July 2026 / Published: 17 July 2026
(This article belongs to the Section Energy Sustainability)

Abstract

Facing the energy use rights trading system with an emphasis on source control, will enterprises opt for traditional fossil energy technology innovation or new and renewable energy technology innovation, and will they choose substantive or strategic innovation activities? Will the energy use rights trading system lead to competitive crowding-out effects or innovation compensation effects for corporate energy technology innovation? Taking the “Pilot Program for the Paid Use and Trading of Energy-Consumption Rights” as a quasi-natural experiment, this paper, based on the energy technology patent data of listed companies, conducts a theoretical analysis and a series of empirical tests to examine the impact of the energy use rights trading system on corporate energy technology innovation. The results indicate the following: Firstly, the energy use rights trading system significantly enhances corporate energy technology innovation, primarily inducing traditional fossil energy conservation innovations, while the driving effect on new and renewable energy technology innovation is not pronounced. Secondly, the system promotes corporate energy technology innovation by strengthening financing channels such as government subsidies. Thirdly, the energy technology innovation induced by this system stems from the competitive crowding-out effect on R&D resources, rather than the innovation compensation effect. Fourthly, the driving effect of the tradable energy permit system exhibits distinct path-dependent characteristics, which is manifested in the fact that the system exerts a more significant driving effect on substantive energy technology innovation activities, the most prominent impact being on substantive innovation in traditional fossil energy. Finally, enterprises across pilot regions respond differently to the system, with Zhejiang and Fujian Provinces showing more significant driving effects in energy technology innovation. The system mainly stimulates substantive innovation activities in non-state-owned, large-scale, and low-energy-consuming enterprises. This study contributes to the refinement of the energy use rights trading system and supports innovation-driven energy transition.

1. Introduction

Since President Xi Jinping first proposed the energy revolution at the sixth meeting of the Central Financial and Economic Affairs Commission in 2014, China has been committed to cultivating independent innovation capabilities in the energy sector. In 2016, the National Development and Reform Commission (NDRC) issued the “Innovation Action Plan for Energy Technology Revolution (2016–2030)”, clearly proposing the long-term goal of “comprehensively enhancing independent innovation capabilities in energy and establishing a sound energy technology innovation system by 2030”. Furthermore, deeply advancing the innovation-driven development strategy in the energy sector requires not only reorienting the allocation of innovation resources but also strengthening institutional innovation to incentivize enterprise enthusiasm for innovation [1]. The “Pilot Program for the Paid Use and Trading of Energy-Consumption Rights” provides an empirical opportunity to examine the driving effect of the energy use rights trading system on corporate energy technology innovation. The energy use rights trading system (EURTS) emphasizes source control of total energy consumption [2], and a well-established system will make the price signals of energy use rights more responsive and increase quota turnover rates, thereby driving enterprises to engage in energy technology innovation activities and guiding innovative resources toward energy technology research that is more energy-efficient and cleaner. This enhances the alignment between energy use rights and carbon emission rights and holds significant practical importance for advancing the “Dual Carbon” goals and the energy technology revolution.
The existing literature has primarily focused on the nexus between heterogeneous environmental regulations and energy technology innovation. The narrow Porter hypothesis posits that the “innovation compensation effect” induced by certain stringent and flexible environmental regulations can offset the negative costs of regulation [3], while the “compensatory effect of environmental regulation on enterprise energy technology innovation” is strongly associated with domestic environmental regulations [4,5,6,7], foreign environmental regulations [8,9], energy market competition [10], types of energy technology innovation [11], and organizational slack [12]. It was not until Acemoglu et al. (2012) [13] incorporated the bias of technological progress into the endogenous economic growth framework that research on how environmental regulation affects the bias of technological progress attracted widespread attention. Environmental regulation often leads to rising energy costs, thereby driving technological progress biased toward energy conservation or scarce resources. For example, Xiu (2016) [14] found that in developed countries, capital and energy are complementary, and increased energy costs drive energy-saving technological progress. Further combining these insights with China’s energy resource endowment, Yang et al. (2018) [15] found that technological progress in China’s industry is biased more toward fossil energy and labor, rather than non-fossil energy and capital.
Relevant research primarily focuses on three strands: (1) the economic effects of the EURTS, (2) the drivers of energy technology innovation, and (3) comparative analysis of the energy use rights trading system and other quota-based trading regimes. The first strand of the literature primarily addresses: the design of the EURTS [2,16]; its synergistic effects with the carbon emission trading system and energy consumption taxes [17,18]; and its impacts on energy conservation and emission reduction [19,20,21], economic growth potential [22], industrial structure upgrading [23], green total factor productivity [24], low-carbon transition of the energy structure [25], corporate earnings management [26], urban ecological resilience [27], and corporate carbon emission intensity [28]. The second strand of the literature, beyond environmental regulation, also incorporates natural resource theory, stakeholder theory, and market theory. Natural resource theory posits that environmental pressure stemming from energy consumption and carbon emissions can invoke energy technology innovation [29,30]; however, once this pressure exceeds the environmental carrying capacity threshold, the resulting natural disasters are negatively correlated with energy technology innovation [31]. Stakeholder theory identifies risk sharing among project participants [32], promotional pressures on local officials [33], public R&D expenditures by local governments [34], and corporate cash flow [35] as the key constraints on energy technology innovation. Market theory holds that both foreign and domestic market demand [36,37,38] can drive energy technology innovation, that market competition helps dismantle market barriers to energy technology innovation [39], and that fossil fuel and electricity prices elevated by competition directly or indirectly induce energy technology innovation [40,41,42]. The third strand of the literature primarily investigates the similarities and differences between the energy use rights trading system and other market-based regulatory instruments—the carbon emission trading system [43] and the emissions trading system [44]—along dimensions including design objectives, regulated entities, allocation rules, and compliance requirements.
In summary, the existing literature both domestically and internationally has primarily employed cross-national or single-EU-country panel data to examine the relationship between environmental regulations—such as carbon trading schemes, carbon taxes, and the Clean Development Mechanism—and energy technology innovation; however, research on the EURTS remains scarce, and studies focusing on the typology of enterprise-level energy technology innovation are likewise limited.
Building on the existing literature, this paper makes four key contributions: First, this study identifies patent data on energy technologies from Chinese listed firms using the Green Patent List and IPC codes, combined with the incoPat database, and employs difference-in-differences (DID) and triple-difference (DDD) methods to examine the impact of the EURTS on enterprise-level energy innovation. Second, building on an enterprise-level perspective, this paper examines the indirect pathways through which the EURTS influences energy innovation by analyzing financing channels such as fiscal support, financial constraints, and R&D investment. Third, from the perspective of the co-opetition relationship between energy technology innovation and non-energy technology innovation within innovation activities, this paper attempts to test whether the driving effect of the tradable energy permit system exhibits path dependence, including the system’s impact on innovation input in energy technology versus non-energy technology. In particular, with respect to energy technology innovation, do firms choose to innovate in traditional fossil energy technologies or new energy and renewable energy technologies, and do they prioritize substantive or strategic innovation activities? Fourth, it explores heterogeneous effects across regional contexts and firm characteristics.

2. Theoretical Impact Mechanism

2.1. The Direct Impact Mechanism of the EURTS on Enterprise-Level Energy Technology Innovation

The EURTS is a market-based environmental regulation that aims to cap aggregate corporate energy consumption. Enterprises exceeding their allocated quotas must purchase additional rights from either the government or the market. Since quota purchases consume finite financial resources, they may simultaneously constrain production investment or reduce R&D expenditures, thereby exerting a negative pressure on corporate market competitiveness. It was only with the formulation of the Porter hypothesis that this traditional view was fundamentally challenged. Porter and van der Linde [45] argued that well-designed environmental regulations, by stimulating technological innovation, can offset part or even all of the costs associated with pollution abatement.
Relative to command-and-control environmental regulation, the EURTS enhances corporate flexibility and stimulates energy technology innovation [46] through three mechanisms: First, it imposes binding energy consumption quotas on high-energy firms, signaling pressure to improve energy efficiency and pursue technological innovation. Second, it generates financial returns from surplus quotas for low-energy firms, reducing investment risk in energy-related R&D and intensifying innovation incentives. Third, it provides direct R&D funding through government tax incentives and subsidies to support energy technology development. Enterprise energy technology innovation exhibits significant dual externalities [47]—knowledge spillovers and environmental externalities—and is closely linked to public energy R&D investment [48], yet it is constrained by external financing constraints. The policy supports energy technology innovation by expanding corporate financing channels.
Hypothesis 1.
The EURTS promotes enterprise energy technology innovation.

2.2. The Impact Mechanism of the EURTS on Different Types of Energy Technology Innovation

Environmental regulations promote innovation not universally, but rather only those innovations that either comply with regulatory standards or generate higher profits [49], while resource endowments remain a key factor in shaping firms’ choices of innovation type [50,51]. The source control of total energy consumption is primarily achieved through two pathways: first, technological innovation for reducing consumption of traditional fossil fuels; second, new and renewable energy technology innovation, including solar, hydropower, and hydrogen energy. On the one hand, drawing upon the theory of biased technological change posited by Acemoglu et al. (2012) [13], under the imperative of profit maximization, rising energy costs precipitated by environmental regulations compel technological innovation to favor the conservation of relatively scarce factors of production. Specifically, when a particular factor commands a higher cost share and greater market demand, the returns on innovation correspondingly increase, prompting enterprises to prioritize R&D activities aimed at economizing that specific input [15]. In the context of China’s energy usage rights trading framework and its prevailing energy mix, stock capacity in energy-intensive sectors—such as coal-fired power, steel, and chemicals—remains predominantly reliant on fossil fuels. Furthermore, since the onset of the “14th Five-Year Plan” period, mandates issued by the State Council and the National Development and Reform Commission have excluded newly added renewable energy consumption from assessments of total energy consumption for localities and key energy-using entities. Consequently, energy usage rights saved by enterprises through enhanced fossil fuel efficiency can be directly monetized in trading markets. This dynamic renders the expected returns on technological innovations targeting fossil fuel conservation superior to those for new and renewable energy technologies, thereby skewing technological progress toward reducing fossil fuel inputs. On the other hand, regarding energy-saving potential, such measures not only serve to alleviate the mounting pressure of escalating energy consumption, but also fundamentally reduce energy consumption and serve as a long-term strategy for constraining energy intensity and total energy consumption; however, such innovation entails substantial technical challenges [52], imposing higher financing constraints and greater innovation risk on enterprises. Accordingly, along the two dimensions outlined above, within the institutional context of energy use rights trading, corporate innovation in traditional fossil energy technologies and innovation in new and renewable energy technologies represent complementary instruments for alleviating pressure on total energy consumption across different stages of energy transition.
Environmental regulation is also a critical determinant of technological innovation [10]. In this paper, we proxy firm innovation quality by patent classification [53]—granting invention patents as indicators of substantive innovation and utility model patents as proxies for strategic innovation. We find that innovation yield is closely associated with innovation quality: when the expected returns from substantive innovation significantly exceed R&D investment, firms tend to prioritize such innovation to achieve optimal decision-making at minimal cost [54]. Moreover, substantive innovation exhibits higher quality than strategic innovation, more authentically reflecting a firm’s autonomous innovation capacity [55]. Participating firms in the EURTS face additional costs from quota purchases and potential inter-departmental joint penalties for non-compliance, thereby tending to prioritize substantive energy technology innovation that yields higher returns. Due to the high capital intensity and extended R&D cycles of invention patents, firms with weak innovation capacity sometimes exhibit a tendency to prioritize innovation quantity over quality [56], opting for strategic innovation to comply with environmental regulation.
Hypothesis 2.
The EURTS is more conducive to fostering fossil energy technology innovation than new and renewable energy technology innovation.
Hypothesis 3.
Compared to strategic energy innovation, the EURTS promotes substantive energy innovation more strongly.

2.3. The Indirect Impact of the EURTS on Enterprise Energy Technology Innovation

Green technology innovation is capital-intensive, entails prolonged payback periods, and is subject to information asymmetry, all of which exacerbate firms’ internal and external financing constraints, necessitating diversified financial support [57] to realize the “Porter effect” under the EURTS. This study, grounded in the foundational principles of “market-led, government-nurtured” under the system, further identifies the indirect mechanisms influencing enterprise energy technology innovation. Faced with compliance pressure from energy allowance constraints imposed by the energy use rights trading system, two scenarios may unfold for enterprises. On the one hand, when research and development (R&D) resources are relatively abundant, firms may choose to proactively pursue energy technological innovation to optimize production processes and improve energy efficiency. Specifically, they will further increase investment in energy technological innovation on the basis of existing non-energy innovation activities, thereby giving rise to an innovation compensation effect. On the other hand, when R&D resources are constrained, enterprises may reallocate funds originally earmarked for technological innovation to cover the cost of energy allowances, leading to a crowding-out effect on overall innovation input. Alternatively, they may redirect R&D expenditure away from non-energy technological innovation toward energy technological innovation, generating a crowding-out effect of energy innovation investment on non-energy innovation investment. It is important to note that this paper primarily examines the impact of the policy on enterprise innovation investment and external financing constraints, which is critical to the sustainability of energy technology innovation expenditures.
First, in the EURTS, government fiscal subsidies—delivered through dedicated innovation funds—can effectively alleviate financial constraints in enterprise energy technology R&D. Moreover, technical review and project oversight within subsidy disbursement processes signal credibility to investors, mitigating information asymmetry and facilitating greater external financing and increased innovation investment [58]. Second, in the system, the government leverages tax policy to incentivize innovation: tax incentives can offset firms’ initial R&D expenditures and generate subsequent funding for research, thereby reducing the risk and cost burden of innovation investment and ultimately encouraging greater investment in energy technology innovation. Third, the system incentivizes financial institutions to develop differentiated financial instruments based on firms’ energy use efficiency and design green finance solutions, including energy use rights pledge financing and central bank re-lending support. This not only diversifies firms’ financing options but also increases the funding supply for energy technology innovation through market-based mechanisms. Fourth, the system requires that trading implementation in pilot regions be incorporated into the energy consumption “dual-control” assessment framework, with stringent energy consumption audits triggering market-based quota purchases for firms exceeding limits and inter-departmental credit penalties for non-compliant firms, thereby compelling increased R&D investment.
Hypothesis 4.
The tradable energy permit system promotes corporate energy technology innovation through financing channels, including strengthening government subsidies and tax preferences, easing external financing constraints, and increasing corporate R&D investment.
Hypothesis 5.
The corporate energy technological innovation induced by the tradable energy permit system may originate from either the competitive crowding-out effect of R&D resources or the innovation compensation effect, which is associated with firms’ R&D resource constraints.

3. Research Design

3.1. Model Specification

To mitigate endogeneity arising from omitted variable bias in the DID framework, this paper carefully selects control variables and considers that the EURTS exhibits no reverse causality with energy technology innovation. Pilot provinces exhibit significant heterogeneity: Henan and Sichuan possess lower energy efficiency and weaker technological innovation capacity, whereas Zhejiang and Fujian operate at substantially higher levels. This regional variation is not subjectively selected based on development levels, thereby effectively mitigating endogeneity-induced causal inference bias. To this end, this paper applies a DID approach to estimate the net effect of the EURTS, with the model specified as follows:
Y ijkt = α 0 + α 1 D it + α 2 X + θ i + η t + ϕ j + τ k + ε ijkt
In model (1), i , j , k , t denote firm, region, industry, and year fixed effects; Y ijkt denotes the number of energy-related patent applications by listed firms; D i t = Treat i × Time t , Treat i is assigned a value of 1 if the firm is located within a pilot region and 0 otherwise; Time t is set to 1 for years 2017 and earlier, and 0 otherwise; X denotes a vector of control variables, including firm maturity, profitability, leverage ratio, cash flow level, and regional economic development; α 0 is the intercept; θ i , η t , ϕ j , and τ k represent firm, year, region, and industry fixed effects; and ε ijkt is the idiosyncratic error term. Due to potential industry transitions among listed firms, industry–year fixed effects are incorporated as controls to mitigate the bias induced by industry reallocation on the estimates of the key coefficients.
To identify the indirect pathways by which the EURTS influences enterprise energy technology innovation, this paper examines the financing channels and constructs a mediation model as follows:
M ijt = β 0 + β 1 D i t + β 2 X + θ i + η t + ϕ j + τ k + ε ijkt
In model (2), M ijt serves as the mediating variable, encompassing government subsidies and tax incentives, market financing constraints, and enterprise R&D investment; β 0 denotes the estimated coefficients of the EURTS on government subsidies, tax incentives, external financing constraints, and R&D investment; and β 1 is the constant term. All other variables retain the same definitions as in Equation (1).

3.2. Variable Selection

3.2.1. Dependent Variable

Following the approach of Zhu et al. (2019) [59] and referencing the Green Patent List released by the World Intellectual Property Organization (WIPO) in 2010, this paper screens low-carbon technologies based on the IPC classification codes provided therein. Specifically, the IPC classification codes for energy conservation published in the Green Patent List are designated as the IPC classification codes for traditional fossil energy technology patents, while the IPC classification codes for alternative energy production and transportation, as well as nuclear power generation, are designated as the IPC classification codes for new energy and renewable energy technology patents. Based on this classification, a manual search was conducted in the incoPat database, using “energy patent applications” and “energy patent grants” as proxies for energy technology innovation, “traditional fossil fuel patent applications” for traditional fossil energy technology innovation, and “new energy and renewable energy patent applications” for new and renewable energy technology innovation. Subsequently, annual data on patent application and grant volumes for listed firms across these categories were manually retrieved from the incoPat database, with the objective of precisely capturing firms’ distinct types of energy technology innovation activities. When using patent count as an indicator to gauge the level of technological innovation, inherent limitations persisted, including measurement errors stemming from selection bias, sample heterogeneity, and cross-institutional disparities. Recent scholarship has redefined the conceptual connotation of patent quality [60,61], and future assessments may adopt a multi-indicator approach or construct composite indices complemented by grouping strategies to yield more accurate measurements of technological innovation.

3.2.2. Control Variables

To carefully select control variables, this paper follows the prior literature [52,62] in adopting: firm age ( A g e ), proxied by years since establishment, where a longer tenure is associated with greater accumulation of R&D experience and human capital for innovation; profitability ( P r o f i t ), proxied by the natural logarithm of net profit, where higher profitability implies a greater incentive to leverage innovation for first-mover advantages; leverage ratio ( L e v ), proxied by the ratio of total liabilities to total assets, where a moderate increase in leverage helps alleviate financing constraints on innovation investment; cash flow level ( C a s h ), proxied by the ratio of net cash flow to total assets, where a higher cash flow entails greater financial capacity for innovation investment and stronger resilience to innovation-related risks; economic development level ( G d p ), proxied by the natural logarithm of provincial GDP, where higher regional development is associated with greater emphasis on resource and environmental protection and elevated demand for innovation in resource and environmental sectors; government subsidies ( Gov ), proxied by the ratio of government subsidies to firm revenue; and government tax incentives ( Tax ), proxied by the ratio of tax rebates to firm revenue. External financing constraints can be measured via the SA index [63] or long-term borrowings, which reflect firms’ financing capacity. On balance, given that investment in energy technology innovation requires long-cycle capital input, this paper uses long-term borrowings to capture changes in firms’ external financing, which are specifically measured by taking the logarithm of long-term borrowings. R&D investment ( R & D ) is proxied by the ratio of total R&D expenditure to firm revenue.

3.3. Data Sources

This paper selected listed firms on the Shanghai and Shenzhen A-share markets from 2013 to 2022 as the sample, retaining observations in the industrial and transportation sectors (the classification is based on the China Securities Regulatory Commission’s (CSRC) 2012 “Guidelines for the Classification of Listed Companies”); patent data were manually retrieved from the incoPat database, financial indicators were integrated from the Wind and CSMAR databases, and regional statistics were compiled from provincial and municipal statistical yearbooks. Sample data were cleaned by excluding ST/*ST firms and observations with missing key variables; to enhance the reliability of regression analysis, nominal values were realigned using provincial GDP deflators. This study adjusted enterprise net profit, provincial gross domestic product, government subsidies, tax incentives, R&D expenditure, and long-term borrowing using the provincial GDP deflator, while the number of relevant energy patents did not require adjustment. And winsorization was applied at the 1% and 99% levels to mitigate the influence of extreme values. The fully processed unbalanced panel dataset comprises a total of 12,582 valid observations, spanning a 10-year temporal horizon, with over a thousand valid listed firm samples retained for each individual year. The descriptive statistical outcomes for all adjusted variables are detailed in Table 1.

4. Empirical Analysis

4.1. The Impact of the EURTS on Corporate Energy Innovation

Table 2 presents the baseline model results with corporate energy innovation as the dependent variable; the estimated coefficients of D i t are positive and statistically significant. Column (4) of the baseline regression reveals that the EURTS increased energy-related patent applications by 8.9% among pilot firms. A plausible explanation is that the energy-consuming right trading system exerts a dual effect of cost forcing and revenue incentive. On the one hand, by pricing energy consumption, the system raises the cost of fossil energy utilization for enterprises, forcing them to conduct energy technological innovation to cut energy costs. On the other hand, the energy savings generated by corporate innovation can be converted into surplus quotas for trading and the additional revenue obtained further incentivizes innovation [25]; meanwhile, energy technological innovation guarantees enterprises’ energy conservation, emission reduction and stable operation [64]; thus, Hypothesis H1 is verified. Nevertheless, most existing empirical studies treat aggregate energy technological innovation as the dependent variable and fail to conduct comparative analyses by distinguishing different types, such as traditional fossil energy technological innovation and new energy and renewable energy technological innovation. This leads to overgeneralization in explaining the driving mechanism of the energy-consuming right trading system, and the subsequent analysis in this manuscript will include an in-depth discussion of the different types of corporate energy technological innovation.

4.2. Robustness Checks

4.2.1. Parallel Trends Test

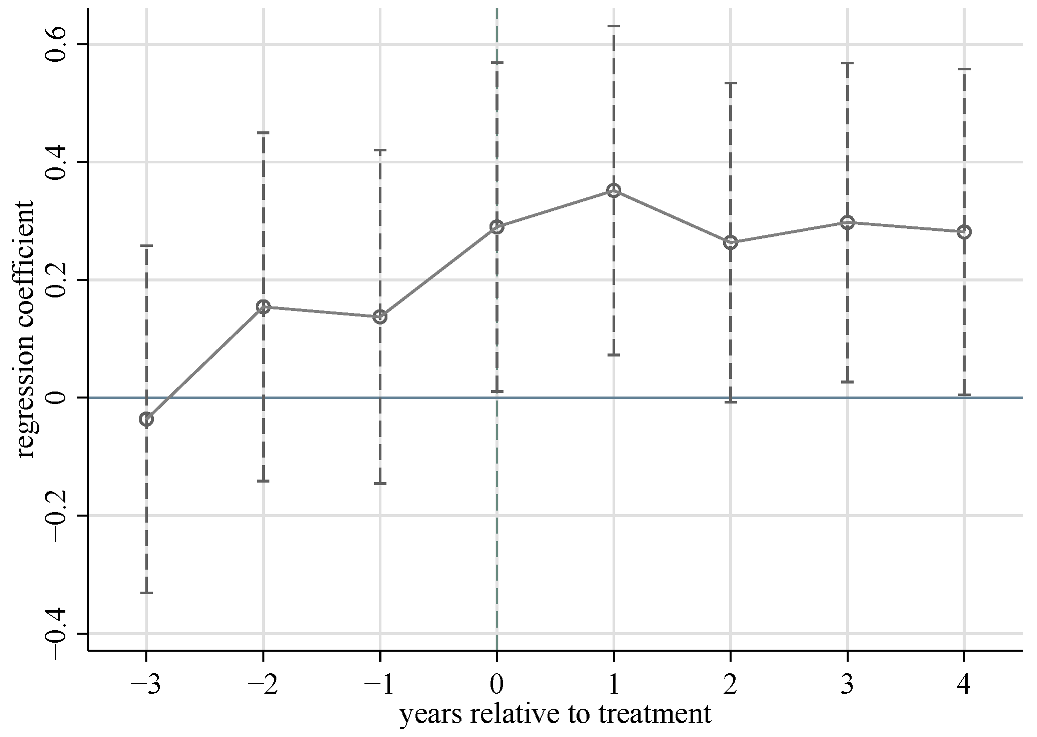
The input and output of energy innovation are subject to an uncertain innovation lag; tracking long-term capital flows and trends in energy R&D investment is therefore critical [47]. This paper constructs the following model to conduct a parallel trends test:
Y ijt = α 0 + k = 3 4 β k D t t + k + α 1 X + θ i + η t + ϕ j + τ k + ε ijkt
In Model (3), t t denotes the year of introduction of the EURTS; D t t + k captures the interaction between the policy dummy and time dummies for the pre-pilot, pilot, and post-pilot periods. Figure 1 presents the results of the parallel trends test. The coefficients of the pre-policy periods are not statistically significant, and no discernible upward trend can be observed, indicating that the parallel trends assumption holds. Following the implementation of the policy, the estimated coefficients across all post-treatment periods are statistically significant and positive. This pattern likely stems from firms’ immediate response to regulatory pressure, which spurs active engagement in energy innovation; as innovation progresses, the technical complexity and risk escalate, particularly in overcoming critical bottlenecks such as energy storage and core equipment technologies. Sustained R&D accumulation is thus required to achieve breakthroughs in high-level energy innovation, ultimately leading to a steady rise in innovation output.

4.2.2. Alternative Specification Tests

Due to significant differences in economic development levels, energy resource distribution, and city size between the two groups, divergent temporal trends may induce selection bias. To effectively address this endogeneity issue, this paper employs PSM-DID as a robustness check. The estimates, as shown in column (1) of Table 3, indicate that the EURTS significantly drives corporate energy innovation.

4.2.3. Counterfactual Analysis

To rule out the influence of other policies or random shocks, this paper conducts a time counterfactual analysis as a robustness check. Given that China implemented the EURTS in 2017, we shift the treatment date to 2015. The estimates from the baseline model, reported in column (2) of Table 3, are not statistically significant. This shows that energy technology innovation is primarily driven by the policy.

4.2.4. Clustered Standard Errors

Given that the EURTS is a provincial-level pilot policy, clustered standard errors at the provincial level are included in the baseline regression to avoid estimation bias. Column (3) of Table 3 shows that the policy continues to exert a significant positive effect on corporate energy innovation. This further corroborates the baseline findings.

4.2.5. The Multi-Period DID Model

In 2016, the National Development and Reform Commission issued the Pilot Program for the Paid Use and Trading System of Energy Use Rights, officially approving four provinces—Zhejiang, Fujian, Henan, and Sichuan—to launch pilot programs for the energy use rights trading system. Given that the policy was rolled out incrementally across provinces, Zhejiang promulgated the Guiding Opinions on Promoting the Pilot Work of Paid Use and Trading of Energy Use Rights in Our Province as early as 2015, becoming the first to implement an intra-provincial energy use rights trading pilot. In 2017, Fujian introduced the Fujian Provincial Pilot Implementation Plan for Paid Use and Trading of Energy Use Rights; in 2018, Sichuan and Henan also successively issued their own pilot implementation plans and began establishing pilot energy use rights trading markets. Against this institutional background, this paper further conducts a robustness check employing a multi-period difference-in-differences framework. Meanwhile, given that this policy was implemented across different provinces at disparate timelines, employing the standard two-way fixed-effects DID model for estimation may yield biased results. To rigorously ensure the robustness of the estimated outcomes, this paper further adopts the staggered DID heterogeneity-robust estimation approach for re-estimation. The results reported in column (4) of Table 3 demonstrate that the estimated findings align consistently with those from the baseline regression specification.

4.2.6. Controlling for Policy Confounders

Carbon emissions trading and low-carbon city pilot policies, implemented concurrently with the EURTS, may contribute to corporate energy innovation [6,7]. To control for policy confounders, carbon emissions trading and low-carbon city policies are included as control variables. As shown in columns (5) of Table 3, the coefficient of D i t is statistically significant at the 5% level and is consistent with the baseline results.

4.2.7. Alternative Dependent Variable and Control Variables

Firstly, by lagging all control variables by one period prior to regression estimation, we can rigorously ensure that these variables qualify as predetermined variables preceding policy implementation, which remain entirely insulated from the reverse causal impact of contemporaneous policy interventions. This approach effectively prevents control variables from being endogenously determined as outcomes of the policy itself, thereby eradicating the estimation bias stemming from reverse causality at its root. As demonstrated by the estimation results reported in Column (6) of Table 3, the derived findings remain highly consistent with those obtained from the baseline regression. Secondly, accurate measurement of energy technology innovation is critical to identifying the impact of the EURTS. This paper replaces patent applications with lagged patent grants as the measure of energy technology innovation. As shown in columns (7) and (8) of Table 3, the coefficient of D i t remains statistically significant at the 5% level. Thus, the policy significantly promotes energy technology innovation regardless of the patent measure used, further corroborating the preceding findings.

4.2.8. Placebo Test

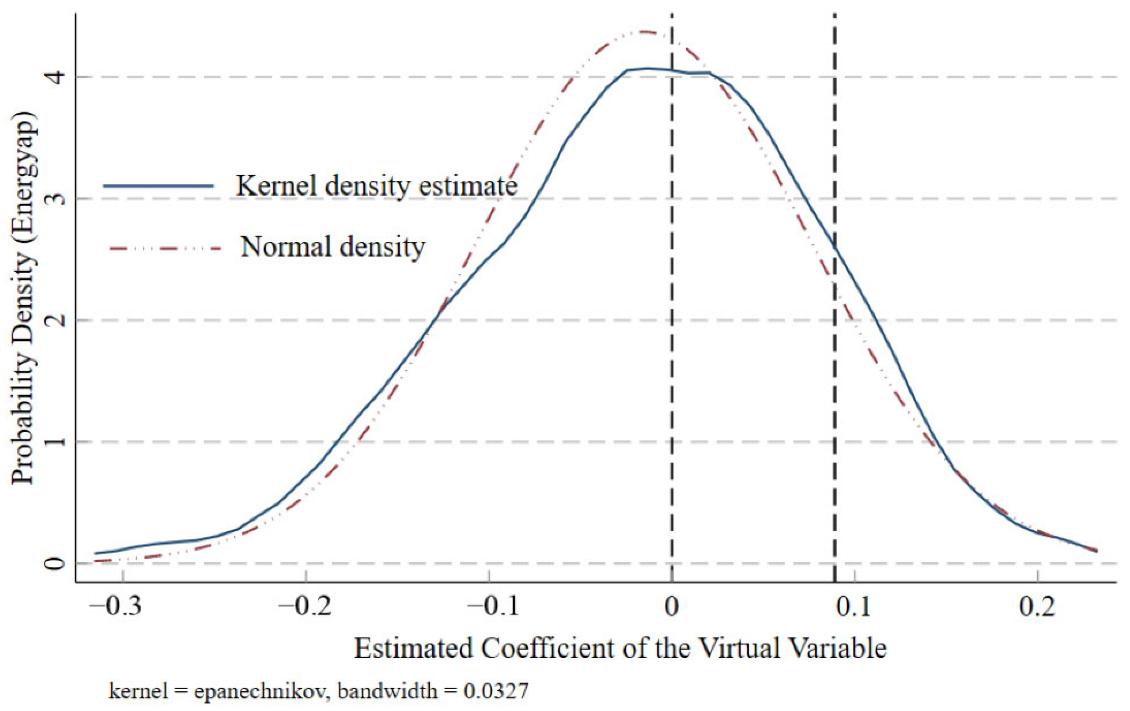
To mitigate estimation bias from unobserved confounding factors, this paper constructs a placebo framework based on 31 provincial units by randomly assigning four provinces as virtual treatment groups and the remaining 27 as control groups. The sampling procedure is repeated 1000 times. As shown in Figure 2, the estimated placebo coefficients generally present an approximately normal distribution centered at 0, and the vast majority of coefficients fail to meet the requirement for statistical significance at the 10% level, indicating that randomly constructed policy shocks cannot systematically generate significant treatment effects. And the kernel density estimate reveals that the majority of the D i t coefficient’s t-statistics are less than 2 in absolute value, with p-values exceeding 0.1, indicating no significant causal effect of the EURTS on the randomly assigned samples.

4.3. Mechanism Test

According to the regression results of the baseline model, the energy-using rights trading system can significantly drive corporate energy technological innovation. This driving force may stem from the competitive crowding-out effect on R&D resources: that is, under the condition of limited innovation resources, the pressure of rising energy costs brought by the system prompts enterprises to reallocate R&D resources, shifting them from non-energy technological innovation fields to energy technological innovation fields. It may also derive from the innovation compensation effect based on existing innovative R&D activities: that is, the innovation incentives generated by the implementation of the system encourage enterprises to increase additional R&D investment, which indicates that enterprises may launch energy technological innovation activities on the basis of their existing innovation reserves in response to rising energy costs.
Based on the foregoing possibilities, this study proceeds to test the indirect influence mechanism of the energy-using rights trading system on corporate energy technological innovation. The overall innovation ( I n n o ) is measured by the natural logarithm of one plus the number of corporate patent applications. As can be seen from the results in columns (2) and (3) of Table 4, the implementation of the energy-using rights trading system significantly increases government subsidies yet exerts no discernible effect on tax preferences. Specifically, government subsidies can be used to supplement corporate R&D capital and compensate for ex ante sunk investments, thereby reducing the upfront capital risk faced by enterprises in technological innovation. By contrast, tax preferences primarily lower the innovative tax burden of enterprises ex post, increasing the expected net return of innovation projects [65]. This outcome arises because the energy-using rights trading system explicitly exposes the cost of fossil energy consumption for traditional energy-intensive enterprises, leading to a sharp increase in transformation costs when firms implement energy conservation retrofits and phase out excess capacity. To avert social costs such as short-term unemployment and dramatic output fluctuations stemming from corporate restructuring, local governments must compensate traditional enterprises for their transformation costs through additional government subsidies. Simultaneously, for energy technological innovation characterized by large upfront investments and high uncertainty, market-oriented mechanisms cannot fully absorb the risks associated with the early research and development stage, requiring governments to share firms’ R&D capital expenditures and associated risks via government subsidies.
However, the results in Column (4) of Table 4 indicate that the Energy Use Rights Trading System (EURTS) has no statistically significant impact on external financing constraints. This may be attributable to the fact that in 2021, Zhejiang and Fujian Provinces pioneered energy use rights pledge loans, with Zhejiang explicitly utilizing the People’s Bank of China’s relending funds to support its energy use rights initiatives. Nevertheless, the scale of external financing remains limited, suggesting that the EURTS has yet to substantially activate differentiated green financial instruments to alleviate external financing constraints. A more in-depth analysis of the results in Columns (1) and (5) of Table 4 reveals that the Energy Use Rights Trading System (EURTS) has no statistically significant impact on R&D expenditure. Concurrently, the system suppresses the growth of the total number of technology patent applications. This suggests that the implementation of the EURTS has not led to an increase in the level of total R&D expenditure. Instead, it may have redirected R&D resources from non-energy technology innovation fields to energy technology innovation fields, thereby generating a crowding-out effect where investments in energy technology innovation displace those in non-energy technology innovation. Furthermore, combining this finding with the positive effect of the EURTS on energy technology innovation observed in the baseline regression results, and considering that energy technology innovation is characterized by high capital investment and long investment cycles, this crowding-out effect may negatively impact the total number of technology patent applications. This finding preliminarily validates the crowding-out effect rather than the innovation compensation effect of the EURTS. It can thus be concluded that the energy technology innovation driven by the EURTS primarily stems from the crowding-out effect of investments in non-energy technology innovation, rather than from an innovation compensation effect. As a result, Hypotheses H4 and H5 are partially validated.

5. Further Discussion

5.1. Innovation Directions

To fully explore the directions of enterprise innovation under the EURTS, this section first tests the system’s impact on energy technology innovation versus non-energy technology innovation and subsequently examines its effects on traditional fossil fuel technology innovation versus new and renewable energy technology innovation.

5.1.1. Selection of Innovation Directions

This paper employs the International Patent Classification (IPC) technical codes to define innovation types: energy technology innovation is first identified through specific IPC subclasses, while the remaining patents are classified as non-energy technology innovation and used as the alternative dependent variable in the baseline regression. Table 5 reveals that the estimated coefficient of Dit is significantly positive for energy technology innovation, indicating that the EURTS drives enterprise-level energy innovation. The estimation results using non-energy technological innovation as the dependent variable further show that the estimated coefficient of Dit is negative and statistically significant at the 5% level. When further distinguishing by innovation quality, the estimated coefficient for substantive non-energy innovation is significantly negative, while the coefficient of Dit for strategic non-energy innovation is not statistically significant. This indicates that after the implementation of the energy-consuming right trading system, it, on the one hand, facilitates energy technological innovation, including both substantive and strategic energy innovation, and, on the other hand, suppresses non-energy technological innovation activities, exerting a particularly pronounced negative impact on substantive non-energy innovation, which further verifies the crowding-out effect of the system. A plausible explanation for the inhibitory effect of the energy-consuming right trading system on non-energy technological innovation is that, given a fixed aggregate of R&D resources, the system reshapes the allocation of R&D resources across different technology categories, driving the reallocation of R&D resources from non-energy technological innovation to energy technological innovation, thus forming a competitive crowding-out effect on R&D resources.

5.1.2. Directions of Energy Technology Innovation

This paper employs traditional fossil fuel technology innovation and new and renewable energy technology innovation as proxies to examine the selection of innovation directions. Table 6 indicates that the EURTS significantly increases patent applications in traditional fossil fuels while failing to yield a significant effect on patent applications for new and renewable energy sources, indicating that enterprise-level energy technology innovation exhibits pronounced path dependence. Hypothesis 2 is validated. This indicates that the cost-forcing effect of the energy-consuming right trading system only holds for traditional fossil energy technological innovation. For new energy and renewable energy technological innovation, by contrast, such cost forcing instead crowds out R&D expenditure, meaning that the cost-forcing mechanism of the energy-consuming right trading system does not necessarily induce corporate energy technological innovation. This outcome is closely tied to the inadequate market-oriented construction of China’s current energy-consuming right trading system. For instance, the grandfather rule in initial allocation protects the vested interests of traditional fossil energy enterprises, and market-oriented incentives only benefit incremental innovation in existing traditional fossil energy technologies; this incomplete marketization may thereby solidify the direction of energy technological innovation. This finding confirms that corporate energy technological innovation activities exhibit notable path-dependent characteristics, and Hypothesis H2 is verified.
Specifically, first, from the perspective of political economy, China’s energy-consuming right trading pilots generally adopt the grandfather rule to allocate initial quotas. Traditional fossil energy enterprises rely on historical production capacity to obtain a large amount of surplus quotas for free and can save quotas through traditional fossil energy technological innovation to obtain stable profits. In contrast, emerging renewable energy enterprises lack historical energy consumption accumulation and have to purchase additional energy consumption indicators, which squeezes out R&D investment in new energy and renewable energy technological innovation. Meanwhile, the core policy objective of China’s energy-consuming right trading is to control total energy consumption and reduce fossil energy consumption. The institutional design, from initial allocation to trading rules, is centered on the regulation of fossil energy enterprises. Moreover, since the 14th Five-Year Plan period, the increased consumption of renewable energy power has not been included in the total energy consumption assessment of local governments and key energy-consuming units, meaning that new energy and renewable energy technological innovation have not been incorporated into the incentive framework. Second, in light of the directed technical change theory [13], enterprises in energy-intensive industries such as coal power, steel, and the chemical industry are dominated by fossil energy utilization. Even if enterprises obtain financing support such as government subsidies, they tend to carry out technological R&D activities related to production factors with higher cost savings and larger market demand [15], such as traditional fossil energy technological innovation. Third, the value realization of new energy and renewable energy technological innovation is highly dependent on grid integration and accommodation. Current barriers such as grid integration quotas and standards hinder the incentive transmission of the energy-consuming right trading system to renewable energy innovation. For example, even if an enterprise develops more efficient photovoltaic or wind power technology, it may not be able to achieve large-scale production due to grid integration quota restrictions. Alternatively, after completing new energy and renewable energy technological innovation, enterprises still need additional support to cover the high costs of adapting to grid connection standards and testing and certification, which offsets the innovation benefits. Consequently, the impact of China’s energy-consuming right trading system on new energy and renewable energy technological innovation is not significant.

5.2. Quality of Energy Technology Innovation: Substantive or Strategic Innovation

The existing literature suggests that the true motivation behind some firms’ innovation activities is not to enhance product competitiveness or drive production transformation, but rather to treat innovation as a strategic activity aimed at evading regulation or seeking government support [66]. Building on the aforementioned classification of innovation types, this section further examines the quality of different innovation categories, where energy invention patents are defined as energy substantive innovation and energy utility model patents as energy strategic innovation. Table 5 and Table 6 show that enterprise-level substantive energy innovation and substantive traditional fossil fuel innovation are both significantly positive at the 1% level, while strategic energy innovation and strategic traditional fossil fuel innovation are significantly positive at the 10% and 1% levels. Moreover, the coefficient estimates for substantive energy innovation are substantially larger than those for strategic energy innovation. This is because a sustained and stable revenue expectation is the core of incentivizing substantive innovation [67]. When the revenue from energy-consuming right quotas is linked to enterprises’ actual energy savings, the trading system can deliver predictable and sustained quota returns for substantive energy innovation, thereby more effectively encouraging substantive energy innovation activities. By contrast, strategic energy innovation cannot generate continuous energy savings, and its long-term returns are far lower than those of substantive energy innovation. Consequently, under R&D budget constraints, enterprises will reallocate R&D funding in favor of substantive energy innovation, and Hypothesis H3 is verified.

5.3. Heterogeneity Analysis

5.3.1. Regional Heterogeneity

Considering substantial heterogeneity across pilot regions in economic development and energy resource endowments, this section incorporates regional dummy variables into the baseline model to examine the regional heterogeneity in the effect of the EURTS on energy technology innovation and introduces a DDD dummy variable constructed by interacting the regional dummy variable, Dit with the core variable, regionj in Model (1), as follows:
Y ijt = α 0 + α 1 D i t × region j + α 2 X + θ i + η t + ϕ j + τ k + ε ijkt  
When   j is a pilot region, the dummy variable equals one; otherwise, it equals zero. Table 7 shows that the policy significantly stimulates energy technology innovation in enterprises in Zhejiang and Fujian Provinces, while exhibiting no statistically discernible effect in Henan and Sichuan Provinces. The potential explanation is that Zhejiang and Fujian Provinces possess stronger economic foundations and innovation capabilities; have long prioritized energy conservation, emissions reduction, and energy structure optimization; and exhibit relatively high energy efficiency. Further reliance on conventional methods such as improving energy allocation efficiency or production quotas yields diminishing returns. Consequently, these provinces are more likely to increase investment in energy technology innovation to achieve emissions reduction at a fundamental level. In contrast, Sichuan and Henan Provinces exhibit lower energy efficiency, and enterprises therein are more inclined to adopt lower-cost conventional approaches to control energy consumption [68], rather than pursue energy technology innovation, which entails higher R&D costs and risks.

5.3.2. Industry-Level Energy Consumption Heterogeneity

The EURTS sets an upper limit on enterprise energy consumption to cap total energy use, thereby exerting heterogeneous effects across industries with varying energy intensities. This section stratifies the sample into energy-intensive and low-energy-intensive industries for group regressions. In accordance with the “Classification of National Economic Industries” (GB/T 4754-2017) [69] issued by the National Bureau of Statistics, six major categories of energy-intensive industries are clearly defined, including coal mining and washing, petroleum processing, coking and nuclear fuel processing, manufacturing of chemical raw materials and chemical products, non-metallic mineral product manufacturing, smelting and pressing of ferrous metals, smelting and pressing of non-ferrous metals, and production and supply of electric power and heat. All other industries are classified as low-energy-consuming industries. Table 8 shows that, excluding new and renewable energy technology innovation, the EURTS exerts positive effects on traditional fossil fuel technology innovation, substantive energy innovation, and strategic energy innovation among low-energy-intensive firms, with most coefficients significant at the 1% level, indicating that the mechanism significantly stimulates energy technology innovation in low-energy-intensive enterprises. The potential explanation is that energy-intensive firms, due to their long-term dependence on traditional fossil fuels, are prone to carbon lock-in in innovation, whereas low-energy-intensive firms, in the short run, gain additional revenue from selling surplus allowances, thereby incentivizing energy technology innovation.

5.3.3. Firm Heterogeneity

(1)
Property rights heterogeneity
The shock of the EURTS pilot may generate differential impacts with distinct property rights structures. This paper stratifies the sample by ownership type and conducts subgroup regressions to examine the effect of the policy. Table 9 reveals that traditional fossil fuel technology innovation among non-state-owned enterprises is significantly positive at the 1% level, while that among state-owned enterprises, though positive, is not statistically significant; further distinguishing by innovation quality, substantive energy innovation among non-state-owned enterprises is positive at the 1% level. The potential explanation is that, relative to state-owned enterprises supported by government intervention, non-state-owned enterprises are highly responsive to fluctuations in energy costs and thus the EURTS is more effective in inducing substantive energy innovation among them—reducing energy expenditure while enabling additional revenue through the sale of surplus allowances.
(2)
Enterprise size heterogeneity
This section categorizes firms by annual revenue (according to the “Provisions on the Classification Standards for Small and Medium-sized Enterprises” (MIIT & Others, Document No. 300), an enterprise shall be classified as large if its annual revenue is at least RMB 40 million, or, in the absence of revenue data, if it employs 1000 or more persons; otherwise, it shall be deemed a small or medium-sized enterprise), as reported by listed companies, and conducts group regressions to test the differential effects of the policy on large enterprises and small and medium-sized enterprises. In accordance with the “Provisions on the Classification Standards for Small and Medium Enterprises” (MIIT, Joint Circular No. 300 [2011]), enterprises with an annual operating revenue of no less than 40 million yuan (or an employee count of over 1000; if revenue data are unavailable, the employee count criterion shall be applied) are classified as large enterprises, while all others are categorized as small or medium-sized enterprises. The results in Table 10 indicate that the EURTS denotes a more pronounced positive effect on large enterprises with respect to traditional fossil energy innovation, substantive energy innovation, and strategic energy innovation, all of which are statistically significant at the 5% level or higher; in contrast, its incentive effect on small and medium-sized enterprises remains negligible. The likely explanation is that large enterprises possess substantial financial capacity and a robust foundation for innovation, enabling them to more readily attain first-mover advantages in energy-related technological advancement. But small and medium-sized enterprises typically face tighter financing constraints, which constrain their investment in innovation resources and limit access to skilled talent, thereby weakening their overall capacity for energy technology innovation.
Additionally, the results in Table 8, Table 9 and Table 10 further indicate that energy technology innovation activities in low-energy-consumption industries and non-state-owned large enterprises are predominantly focused on traditional fossil fuels, thereby reinforcing the path dependence characteristic of energy technology innovation.

6. Main Conclusions and Policy Implications

The study finds that the policy drives enterprise-level energy technology innovation, with innovation activities concentrated on traditional fossil energy technologies, while exerting no significant impact on new and renewable energy technologies—a phenomenon attributable to enterprises’ excessive dependence on traditional fossil fuels. The study on transmission mechanisms reveals that, faced with R&D resource constraints, the incentive effect of the energy-using rights trading system on energy technological innovation primarily stems from the crowding-out effect on non-energy technological innovation investment, rather than the innovation compensation effect built upon existing innovative activities. Meanwhile, the system promotes corporate energy technology innovation by strengthening financing channels such as government subsidies. Heterogeneity analysis reveals differential responses to the policy across pilot regions, with the system significantly promoting energy technology innovation in Zhejiang and Fujian Provinces; it primarily stimulates substantive energy innovation among low-energy-consumption industries and non-state-owned large enterprises, while exhibiting a pronounced path dependence in traditional fossil energy technology innovation. Additionally, the EURTS exerts no significant impact on innovation in new and renewable energy technologies, while low-energy-consumption industries and large enterprises still exhibit a degree of strategic energy innovation behavior—indicating that advancing energy technology innovation remains challenging under China’s new economic normal.
Further in-depth analysis of the above findings reveals that the institutional design of China’s energy-consuming right trading system is primarily tilted toward the interests of traditional energy enterprises and better accommodates fossil energy conservation, thus bearing the distinct characteristics of “stock bias and energy-saving binding”. Specifically, the initial institutional design follows the grandfather rule, which allocates free quotas based on historical energy consumption bases, tilting initial quotas toward incumbent traditional energy enterprises. The benefits of energy technological innovation are tied to the quota gains obtained through energy conservation, and the system essentially advances market-oriented reform without altering the vested interests of traditional fossil energy enterprises. This institutional arrangement determines that the system’s incentives are biased across different types of technological innovation, market entities and regions. First, the system is more compatible with traditional fossil energy technological innovation due to its rule that convertible tradable quotas are allocated based on current verifiable energy savings. Traditional fossil energy technological innovation constitutes marginal retrofitting of existing production processes and can generate quantifiable energy savings in the short run, allowing enterprises to obtain surplus quota revenue immediately upon the completion of innovation. In contrast, new energy and renewable energy technological innovation features long R&D cycles and cannot generate enterprise-level verifiable energy savings in the short term, and new projects lack historical energy consumption bases, forcing them to purchase additional energy-consuming right quotas, which squeezes out R&D investment in new energy and renewable energy technological innovation. Second, as a gradual market-oriented reform, the energy-consuming right trading system requires fiscal support to address transition frictions that market mechanisms cannot resolve. Traditional energy enterprises need to invest large amounts of fixed capital at one stroke to implement energy conservation retrofits, requiring government subsidies to compensate for these costs and reduce reform resistance. Meanwhile, the energy-consuming right trading market can only realize surplus quota revenue after innovation succeeds and cannot absorb the uncertainty risk in the early R&D stage, so fiscal funds are also required to share R&D investment and risk. Third, under the energy-consuming right trading system, the surplus quotas generated by energy conservation innovation of traditional energy enterprises can be sold for additional revenue. This gain induces the reallocation of R&D resources from non-energy technological innovation to energy technological innovation, indicating that the institutional design of energy-consuming right trading may cause R&D input in energy technological innovation to crowd out input in non-energy technological innovation, giving rise to the innovation “crowding-out effect”. Fourth, drawing on path dependence theory, the initial design bias toward traditional fossil energy will further strengthen traditional fossil energy technological innovation in subsequent stages, leading to an overall path-dependent pattern ordered as “substantive traditional fossil energy technological innovation > strategic energy technological innovation > new energy and renewable energy technological innovation”.
The study proposes targeted policy recommendations: (1) On the basis of refining the institutional framework of the EURTS, gradually expand the pilot scope to fully leverage its driving effect on energy technology innovation; establish a legislative foundation for the review, management, and operational oversight of energy use rights trading to standardize market operations; facilitate the trading of enterprise energy use rights quotas on legally secured, standardized public resource trading platforms, promote transparency in trading volumes and market prices, and enhance the roles of market allocation and public oversight; and formulate differentiated pricing based on various energy types to accurately unblock the incentive transmission for renewable energy innovation. The existing allocation framework anchored in the grandfathering rule that distributes quotas in accordance with historical emission levels will be progressively phased out and transitioned to a distribution system centered on industry-wide performance benchmarks. The proportion of paid quota allocation will be substantially elevated, while publicly transparent auction mechanisms will be adopted to grant newly entered renewable energy enterprises equal access to quota acquisition channels, thereby dismantling implicit market entry barriers. Concurrently, the share of quotas allocated to conventional energy enterprises based on their historical emission records will be steadily reduced in a staggered manner. Specifically, tiered premium pricing shall be implemented for new quotas allocated to fossil energy production capacity, while a free quota policy shall be adopted for new quotas corresponding to new energy and renewable energy production capacity. The new energy and renewable energy input used in enterprise production can be converted into surplus energy-consuming right quotas in a certain proportion, which can then be sold for profit in the energy-consuming right trading market, directly converting grid accommodation targets into quota revenue. In addition, by introducing a tiered renewable energy quota system, phased and differentiated targeted subsidies, and an innovation support program spanning the full R&D chain, a fair institutional environment with robust incentive compatibility can be established to foster the advancement of renewable energy and emerging new energy technologies. (2) Establish a fiscal and tax support system to underpin energy technology innovation, alleviating firms’ financing constraints and mitigating risks associated with R&D activities; enhance government tax incentives and subsidies for energy technology innovation to encourage enterprises to allocate greater innovation resources toward this domain; for critical bottleneck technologies in the energy sector, the government should establish a collaborative innovation platform, set up a project investment fund dedicated to energy technologies, and form industry–academia–research consortia led by large enterprises and involving universities and research institutes, thereby improving the efficiency of innovation talent allocation and facilitating breakthroughs and commercialization in key technologies such as the utilization of traditional fossil fuels, energy storage for new and renewable energy sources, and high-capacity long-distance power transmission. (3) The implementation of the policy requires tailored approaches, accounting for regional economic conditions and enterprise-specific characteristics: for pilot provinces with high levels of economic development and solid innovation foundations, such as Zhejiang and Fujian, energy-consuming right quotas should be dynamically tightened and the share of free quotas gradually reduced. Meanwhile, relying on the national energy-consuming right trading system, a province-level connected online energy consumption monitoring platform should be established to implement real-time monitoring for key energy-consuming enterprises with annual comprehensive energy consumption exceeding 5000 tons of standard coal, preventing enterprises from overstating energy savings to fraudulently obtain quota revenue. For non-state-owned and large-scale enterprises, innovation-supporting resources should be precisely allocated: for instance, enterprises are encouraged to use their surplus energy-consuming quotas as collateral to obtain dedicated innovation loans from commercial banks, and provincial finance should set up special subsidies for energy technological innovation to provide fixed-quota grants for granted patents of substantive energy technological innovation. For low-energy-consumption enterprises, quota offset rules should be relaxed to further amplify the marginal revenue of surplus energy-consuming right quotas generated by innovation. Meanwhile, state-owned enterprises should proactively fulfill their social responsibilities in energy conservation and the construction of a strong energy nation, with higher energy use rights quota intensity used to incentivize their engagement in energy technology innovation.
This study has the following limitations: First, patent data only reflect innovation output rather than innovation quality, entailing measurement errors such as selection bias, sample distortion, and institutional disparities when assessing technological innovation levels. Patent-based metrics may not fully reflect actual innovation activity, while classifying invention patents as foundational innovation and utility model patents as strategic innovation may oversimplify the nature of innovation. Accordingly, subsequent scholarly investigations may adopt a far more comprehensive set of innovation metrics, rather than restricting assessments to crude patent volume counts. Indicators spanning patent citation frequency, the defined scope of patent claim boundaries, technological commercialization conversion rates, revenue directly generated from innovation outputs, and industry-wide technology adoption penetration—each respectively encapsulating an innovation’s cross-sector academic and industrial influence, the breadth and legal robustness of its protected technological coverage, its end-to-end market translation and implementation capacity, its verifiable tangible economic output value, and its broader cross-industry diffusion and popularization trajectory—will collectively underpin the construction of a rigorously calibrated multi-dimensional innovation index, enabling far more precise, nuanced, and systematic evaluation of the intrinsic quality of technological innovation. Second, this study only selects A-share listed companies from the Shanghai and Shenzhen Stock Exchanges during 2013–2022 as samples. The conclusions are based on listed firms, and given that small and medium-sized enterprises are confronted with distinct innovation incentives, financing constraints and regulatory frameworks that diverge substantially from those faced by publicly listed firms, future research may expand its sample coverage beyond listed entities to include small and medium-sized enterprises so as to substantially enhance the generalizability of the derived research conclusions. Meanwhile, the temporal scope of the sample could be broadened for more comprehensive findings. Third, future scholarly endeavors may further conduct comparative empirical investigations across diverse nations or emerging economies, which will facilitate a more profound and nuanced insight into the effectiveness of energy-related policy interventions implemented in different national contexts. Fourth, this paper employs patents as the proxy indicator to evaluate innovation performance, yet patent-related activities per se do not necessarily mirror the successful technological commercialization or tangible economic benefits generated in practice. To address this inherent limitation, subsequent scholarly endeavors may further investigate whether patent assets can deliver substantive improvements in energy efficiency, environmental performance or emission reduction outcomes. Specific analytical dimensions encompass the energy-saving effects, carbon abatement contributions, productivity enhancement gains and environmental benefits brought by patents [70,71], alongside supplementary assessments of life cycle evaluation and cost–benefit analysis, which collectively facilitate a comprehensive and systematic appraisal of the tangible real-world efficacy of technological innovation. Fifth, subsequent scholarly investigations may further refine the granular analysis of underlying financial mechanisms, encompassing more targeted green financial instruments such as green bonds, energy right financing, and other diversified sustainable financial support modalities. Such analytical endeavors will enable a systematic evaluation of the heterogeneous performance of distinct financial innovation tools in incentivizing energy technology innovation activities, with a particular focus on scrutinizing financing access channels for renewable energy projects and small-scale enterprises confronted with stringent capital constraints.


Author Contributions

Conceptualization, writing—original draft, funding acquisition, S.L.; data curation, methodology, writing—review and editing, C.Z. All authors contributed to the writing of the paper. All authors have read and agreed to the published version of the manuscript.

Funding

This research was funded by the National Social Science Foundation of China (21BJY111).

Institutional Review Board Statement

Not applicable.

Informed Consent Statement

Not applicable.

Data Availability Statement

The dataset is available on request from the authors.

Conflicts of Interest

This research received no external funding.

References

  1. Gu, S.Z.; Wu, H.J.; Wu, Q.Q.; Yu, X. Innovation-driven development and breakthroughs in core technologies as the foundation of high-quality development. China Soft Sci. 2018, 10, 9–18. (In Chinese) [Google Scholar]
  2. Yang, M.; Hou, Y.; Fang, C.; Duan, H. Constructing energy-consuming right trading system for China’s manufacturing industry in 2025. Energy Policy 2020, 144, 111602. [Google Scholar] [CrossRef]
  3. Dechezleprêtre, A.; Sato, M. The impacts of environmental regulations on competitiveness. Rev. Environ. Econ. Policy 2017, 11, 183–206. [Google Scholar] [CrossRef]
  4. Pitelis, A.; Vasilakos, N.; Chalvatzis, K. Fostering innovation in renewable energy technologies: Choice of policy instruments and effectiveness. Renew. Energy 2020, 151, 1163–1172. [Google Scholar] [CrossRef]
  5. Cheng, Y.; Sinha, A.; Ghosh, V.; Sengupta, T.; Luo, H. Carbon tax and energy innovation at crossroads of carbon neutrality: Designing a sustainable decarbonization policy. J. Environ. Manag. 2021, 294, 112957. [Google Scholar] [CrossRef]
  6. Qi, S.Z.; Zhang, Z.Y. EU carbon emissions trading, allowance allocation, and renewable energy technological innovation. Stud. World Econ. 2019, 9, 119–133+136. (In Chinese) [Google Scholar]
  7. Ma, L.M.; Si, L. Low-carbon cities and renewable energy technological innovation. China Popul. Resour. Environ. 2022, 32, 81–90. (In Chinese) [Google Scholar]
  8. Sterlacchini, A. Trends and determinants of energy innovations: Patents, environmental policies and oil prices. J. Econ. Policy Reform 2020, 23, 49–66. [Google Scholar]
  9. Li, F.; Zhu, B.Q.; Sun, Y. Environmental policy, institutional quality, and renewable energy technological innovation: Evidence from 32 countries. Resour. Sci. 2021, 43, 2514–2525. (In Chinese) [Google Scholar] [CrossRef]
  10. Nesta, L.; Vona, F.; Nicolli, F. Environmental policies, competition and innovation in renewable energy. J. Environ. Econ. Manag. 2014, 67, 396–411. [Google Scholar] [CrossRef]
  11. Costantini, V.; Crespi, F.; Palma, A. Characterizing the policy mix and its impact on eco-innovation: A patent analysis of energy-efficient technologies. Res. Policy 2017, 46, 799–819. [Google Scholar] [CrossRef]
  12. Cui, J.; Liu, X.; Sun, Y.; Yu, H. Can CDM projects trigger host countries’ innovation in renewable energy? Evidence of firm-level dataset from China. Energy Policy 2020, 139, 111349. [Google Scholar] [CrossRef]
  13. Acemoglu, D.; Aghion, P.; Bursztyn, L.; Hemous, D. The environment and directed technical change. Am. Econ. Rev. 2012, 1, 131–166. [Google Scholar] [CrossRef]
  14. Xiu, J. Measurement of the green bias of industrial technological progress: Capital and labor. Reform 2016, 9, 68–78. (In Chinese) [Google Scholar]
  15. Yang, Z.; Shao, S.; Yang, L.; Miao, Z. Improvement pathway of energy consumption structure in China’s industrial sector: From the perspective of directed technical change. Energy Econ. 2018, 72, 166–176. [Google Scholar] [CrossRef]
  16. Pan, Y.; Dong, F. Design of energy use rights trading policy from the perspective of energy vulnerability. Energy Policy 2022, 160, 112668. [Google Scholar] [CrossRef]
  17. Wang, Y.; Hang, Y.; Wang, Q. Joint or separate? An economic-environmental comparison of energy-consuming and carbon emissions permits trading in China. Energy Econ. 2022, 109, 105949. [Google Scholar] [CrossRef]
  18. Liu, H.Y.; Wang, Y. Economic dividend effects under the policy combination of energy rights and carbon emission rights trading. China Popul. Resour. Environ. 2019, 29, 1–10. (In Chinese) [Google Scholar]
  19. Zhang, Y.; Guo, S.; Shi, X.; Qian, X.; Nie, R. A market instrument to achieve carbon neutrality: Is China’s energy-consumption permit trading scheme effective? Appl. Energy 2021, 299, 117338. [Google Scholar] [CrossRef]
  20. Du, M.; Wu, F.; Ye, D.; Zhao, Y.; Liao, L. Exploring the effects of energy quota trading policy on carbon emission efficiency: Quasi-experimental evidence from China. Energy Econ. 2023, 124, 106791. [Google Scholar] [CrossRef]
  21. Zhang, N.; Zhang, W.J. Can energy rights trading in China achieve a win-win of economic dividend and energy conservation and emission reduction? Econ. Res. 2019, 54, 165–181. (In Chinese) [Google Scholar]
  22. Li, S.L.; Bi, Z.X. How does energy rights trading policy affect firm total factor productivity? Financ. Issues Res. 2022, 10, 35–43. (In Chinese) [Google Scholar]
  23. Zhang, Y.; Zhou, L. The impact of energy rights trading policy on regional industrial structure optimization and upgrading. China Popul. Resour. Environ. 2024, 34, 71–83. (In Chinese) [Google Scholar]
  24. Wang, W.; Wang, J.; Wu, H. The impact of energy-consuming rights trading on green total factor productivity in the context of digital economy: Evidence from listed firms in China. Energy Econ. 2024, 131, 107342. [Google Scholar] [CrossRef]
  25. Chen, Y.; Zhong, B.; Guo, B. Does energy-consuming right trading policy achieve a low-carbon transition of the energy structure? A quasi-natural experiment from China. Front. Environ. Sci. 2025, 12, 1502860. [Google Scholar] [CrossRef]
  26. Zhang, J.; Liu, Q.; Yang, S. Sustainability policy and corporate financial integrity: Assessing the impact of China’s energy-use rights trading scheme on earnings management. Sustainability 2025, 17, 10759. [Google Scholar]
  27. Wang, P.; Guo, B. The impact of energy-consuming right trading policy on urban ecological resilience: Evidence from China. Front. Environ. Sci. 2026, 14, 1805203. [Google Scholar] [CrossRef]
  28. Wu, B.; Peng, B.; Zhu, Y.; Elahi, E. Turning green into gold: Evidence from a quasi-experiment on energy rights trading and firm-level decarbonization. Energy Effic. 2026, 19, 39. [Google Scholar]
  29. Lin, B.; Zhu, J. Determinants of renewable energy technological innovation in China under CO2 emissions constraint. J. Environ. Manag. 2019, 247, 662–671. [Google Scholar] [CrossRef]
  30. Jiang, Z.; Lyu, P.; Ye, L.; Zhou, Y.W. Green innovation transformation, economic sustainability and energy consumption during China’s new normal stage. J. Clean. Prod. 2020, 273, 123044. [Google Scholar] [CrossRef]
  31. Zhao, X.X.; Zheng, M.; Fu, Q. How natural disasters affect energy innovation? The perspective of environmental sustainability. Energy Econ. 2022, 109, 105992. [Google Scholar] [CrossRef]
  32. Badi, S.M.; Pryke, S. Assessing the impact of risk allocation on sustainable energy innovation (SEI): The case of private finance initiative (PFI) school projects. Int. J. Manag. Proj. Bus. 2016, 9, 259–281. [Google Scholar] [CrossRef]
  33. Cao, D.; Peng, C.; Yang, G. The pressure of political promotion and renewable energy technological innovation: A spatial econometric analysis from China. Technol. Forecast. Soc. Change 2022, 183, 121888. [Google Scholar] [CrossRef]
  34. Grafström, J.; Lindman, Å. Invention, innovation and diffusion in the european wind power sector. Technol. Forecast. Soc. Change 2017, 114, 179–191. [Google Scholar] [CrossRef]
  35. Noailly, J.; Smeets, R. Financing energy innovation: Internal finance and the direction of technical change. Environ. Resour. Econ. 2022, 83, 145–169. [Google Scholar]
  36. Kim, Y.J.; Brown, M. Impact of domestic energy-efficiency policies on foreign innovation: The case of lighting technologies. Energy Policy 2019, 128, 539–552. [Google Scholar] [CrossRef]
  37. Herman, K.S.; Xiang, J. Channeled through trade: How foreign environmental regulations induce domestic renewable energy innovation. Energy Res. Soc. Sci. 2022, 89, 102629. [Google Scholar] [CrossRef]
  38. Gao, X.; Rai, V. Local demand-pull policy and energy innovation: Evidence from the solar photovoltaic market in China. Energy Policy 2019, 128, 364–376. [Google Scholar] [CrossRef]
  39. Zhu, X.; Zhang, Y. Diffusion of marketization innovation with sdministrative centralization in a multilevel system: Evidence from China. J. Public Adm. Res. Theory 2019, 29, 133–150. [Google Scholar]
  40. Lin, B.; Chen, Y. Does electricity price matter for innovation in renewable energy technologies in China? Energy Econ. 2019, 78, 259–266. [Google Scholar] [CrossRef]
  41. Nunes, I.C.; Catalão-Lopes, M. The impact of oil shocks on innovation for alternative sources of energy: Is there an asymmetric response when oil prices go up or down? J. Commod. Mark. 2020, 19, 100108. [Google Scholar] [CrossRef]
  42. Liu, Y.; Liu, S.; Xu, X.; Failler, P. Does energy price induce China’s green energy innovation? Energies 2020, 13, 4034. [Google Scholar] [CrossRef]
  43. Li, G.; Wang, X. Energy quota trading policy and energy efficiency: The role of government supervision and public participation. Technol. Forecast. Soc. Change 2024, 206, 123565. [Google Scholar] [CrossRef]
  44. Wang, X.D.; Xue, Z.Y. The logical foundations, practical predicaments, and resolution pathways for the coordination of China’s energy-using rights trading system. J. China Univ. Pet. (Ed. Soc. Sci.) 2025, 41, 107–116. (In Chinese) [Google Scholar]
  45. Porter, M.E.; Linde, C.V.D. Towards a new conception of the environment-competitiveness relationship. J. Econ. Perspect. 1995, 4, 97–118. [Google Scholar] [CrossRef]
  46. Tang, R. Environmental regulation and firm innovation: Evidence from China. Work Pap. 2015, 1–40. Available online: https://sites.ualberta.ca/~econphd/Ruotao_Tang_JMP.pdf (accessed on 2 July 2026).
  47. Pless, J.; Hepburn, C.; Farrell, N. Bringing rigour to energy innovation policy evaluation. Nat. Energy 2020, 5, 284–290. [Google Scholar] [CrossRef]
  48. Meckling, J.; Galeazzi, C.; Shears, E.; Xu, T.; Anadon, L.D. Energy innovation funding and institutions in major economies. Nat. Energy 2022, 7, 876–885. [Google Scholar] [CrossRef]
  49. Wu, W.; Liu, Y.; Wu, C.H.; Tsai, S.-B. An empirical study on government direct environmental regulation and heterogeneous innovation investment. J. Clean. Prod. 2020, 254, 120079. [Google Scholar] [CrossRef]
  50. Li, J.; Chi, J.; Wu, H.Q. Measurement and analysis of industrial green-biased technological progress based on water resources. China Popul. Resour. Environ. 2018, 28, 131–142. (In Chinese) [Google Scholar]
  51. Gugler, K.; Szücs, F.; Wiedenhofer, T. Environmental policies and directed technological change. J. Environ. Econ. Manag. 2024, 124, 102916. [Google Scholar] [CrossRef]
  52. Liu, J.K.; Xiao, Y.Y. China’s environmental protection tax and green innovation: Leverage effect or crowding-out effect? Econ. Res. 2022, 57, 72–88. (In Chinese) [Google Scholar]
  53. Zhuge, L.; Freeman, R.B.; Higgins, M.T. Regulation and innovation: Examining outcomes in Chinese pollution control policy areas. Econ. Model. 2020, 89, 19–31. [Google Scholar] [CrossRef]
  54. Hering, L.; Poncet, S. Environmental policy and exports: Evidence from Chinese cities. J. Environ. Econ. Manag. 2014, 68, 296–318. [Google Scholar] [CrossRef]
  55. Zhang, J.; Zheng, W.P.; Xin, F. Banking deregulation, structural competition, and firm innovation. China Ind. Econ. 2017, 10, 118–136. (In Chinese) [Google Scholar]
  56. Li, W.J.; Zheng, M.N. Substantive innovation or strategic innovation?—Macro industrial policy and micro firm innovation. Econ. Res. 2016, 51, 60–73. (In Chinese) [Google Scholar]
  57. Huang, Z.H.; Liao, G.K.; Li, Z.H. Loaning scale and government subsidy for promoting green innovation. Technol. Forecast. Soc. Change 2019, 144, 148–156. [Google Scholar] [CrossRef]
  58. Meuleman, M.; Maeseneire, W.D. Do R&D subsidies affect SME’s: Access to externalfinancing. Res. Policy 2012, 41, 580–591. [Google Scholar] [CrossRef]
  59. Zhu, J.; Fan, Y.; Deng, X.; Xue, L. Low-carbon innovation induced by emissions trading in China. Nat. Commun. 2019, 10, 4088. [Google Scholar] [CrossRef] [PubMed]
  60. Zhang, Y.F.; Liu, H.B.; Chen, G.H.; Jin, Z. Are patents a valid measure of innovation? Foreign Econ. Manag. 2018, 40, 3–16. (In Chinese) [Google Scholar]
  61. Liu, L. Patent quality: A critique of the state of the discussion. IIC-Int. Rev. Intellect. Prop. Compet. Law. 2024, 55, 499–529. [Google Scholar] [CrossRef]
  62. Qi, S.Z.; Lin, S.; Cui, J.B. Can environmental rights trading markets induce green innovation?—Evidence from green patent data of Chinese listed companies. Econ. Res. 2018, 53, 129–143. (In Chinese) [Google Scholar]
  63. Hadlock, C.J.; Pierce, J.R. New evidence on measuring financial constraints: Moving beyond the KZ index. Rev. Financ. Stud. 2010, 23, 1909–1940. [Google Scholar] [CrossRef]
  64. Popp, D. International innovation and diffusion of air pollution control technologies: The effects of NOX and SO2 regulation in the US, Japan, and Germany. J. Environ. Econ. Manag. 2006, 51, 46–71. [Google Scholar] [CrossRef]
  65. Jin, Y.; Wang, P. R&D subsidies, tax reductions and innovation outsourcing of enterprises. Int. Rev. Financ. Anal. 2024, 96, 103684. [Google Scholar] [CrossRef]
  66. Kelm, K.M.; Narayanan, V.K.; Pinches, G.E. Shareholder value creation during R&D innovation and commercialization stages. Acad. Manag. J. 1995, 38, 770–786. [Google Scholar] [CrossRef]
  67. Tao, F.; Zhao, J.Y.; Zhou, H. Does environmental regulation achieve “incremental expansion and quality enhancement” of green technological innovation?—Evidence from China’s environmental target responsibility system. China Ind. Econ. 2021, 2, 136–154. (In Chinese) [Google Scholar]
  68. Xue, F.; Zhou, M.L. Can energy rights trading systems improve energy use efficiency?—Evidence from Chinese listed companies? China Popul. Resour. Environ. 2022, 32, 54–66. (In Chinese) [Google Scholar]
  69. GB/T 4754-2017; Industrial Classification for National Economic Activities. Standardization Administration of the People’s Republic of China: Beijing, China, 2017.
  70. Alnor, N.H.A. Applications of modern technology in developing management accounting systems and how they affect the organizational performance. Wseas Trans. Bus. Econ. 2024, 21, 2591–2601. [Google Scholar] [CrossRef]
  71. Soltani, M.R.; Alnor, N.H.A.; Mahasneh, J.N.A.; Abdulrahman, B.M.A.; Ibrahim, A.M.M. Evaluating Renewable Energy’s Contribution to Saudi Arabia’s Economic Growth and Environmental Sustainability. Sustainability 2026, 18, 3429. [Google Scholar] [CrossRef]
Figure 1. Parallel trends test.
Sustainability 18 07322 g001
Figure 2. Placebo test.
Sustainability 18 07322 g002
Table 1. Descriptive statistics of variables.
VariablesDefinitionObs.MeanStd. Dev.MinMax
E n e r g y a p ln(energy patent applications + 1)12,5820.6301.00808.353
E n e r g y g r ln(energy patent grants + 1)12,5820.2970.72907.103
E n e r g y c o ln(fossil fuel patent applications + 1)12,5820.4260.88207.814
E n e r g y a l ln(new and renewable energy patent applications + 1)12,5820.3280.74107.508
A g e Current year–establishment year + 112,58218.7736.5461.00067.000
P r o f i t ln(net profit)12,58218.5561.5348.91622.768
L e v Total liabilities/total assets12,5820.4280.1870.0710.868
C a s h Net cash flow/total assets12,5820.0160.081−0.2140.325
G d p ln(provincial GDP)12,58210.6790.6946.71911.731
Gov ln(government subsidies)12,58216.9921.5639.64523.231
Tax Tax rebates/firm revenue12,5820.0170.0240.0010.574
EFln(long-term borrowing + 1)12,582−1.5950.339−3.822−0.734
R & D Total R&D expenditure/firm revenue12,5820.0490.05301.694
Table 2. Baseline regression.
VariablesEnergyap
(1)(2)(3)(4)
D i t 0.088 **0.086 *0.089 **0.089 **
(2.205)(1.903)(2.204)(1.963)
A g e −0.002 0.063 ***
(−0.655) (12.096)
ln P r o f i t 0.120 *** 0.061 ***
(12.191) (5.018)
L e v 0.551 *** 0.189 *
(6.378) (1.720)
C a s h −0.065 −0.027
(−0.574) (−0.239)
ln P e r g −0.021 0.076
(−0.066) (0.240)
Constant1.696 ***−1.122 ***1.476 ***−0.700 ***
(6.959)(−3.588)(56.653)(−2.800)
ControlsNYNY
Individual fixed effectsNNYY
Year fixed effectsYYYY
Region fixed effectsYYYY
Industry fixed effectsYYYY
Industry–year fixed effectsNNYY
N12,58212,58212,58212,582
R20.0820.0850.0950.096
Note: *, **, and *** denote statistical significance at the 10%, 5%, and 1% levels, respectively; t-values are in parentheses.
Table 3. Robustness checks.
VariablesEnergyapEnergygr
PSM-
DID
Counterfactual AnalysisClustered at Provincial LevelStaggered DIDExclude Relevant PolicyLagged Control VariablesFE
(1)(2)(3)(4)(5)(6)(7)(8)
D i t 0.090 **0.0850.090 *0.079 *0.106 **0.093 **0.093 **0.095 **
(2.115)(1.575)(1.747)(1.711)(2.362)(2.049)(2.130)(2.190)
Carbon trading policy −0.014
(−0.274)
Low-carbon city pilot policy −0.076
(−1.644)
Constant−0.337−0.340−0.337−0.332−0.286−0.668 ***1.507 ***0.475 **
(−1.519)(−1.529)(−1.323)(−1.493)(−1.295)(−2.735)(54.304)(2.035)
ControlYYYYYYNY
Individual fixed effectsYYYYYYYY
Year fixed effectsYYYYYYYY
Regional fixed effectsYYYYYYYY
Industry fixed effectsYYYYYYYY
Industry–year fixed effectsYYYYYYYY
Clustered at provincial levelNNYYYYNY
N806812,58212,58212,58212,58212,58212,58212,582
R20.1060.1080.1070.1060.1070.0970.0270.033
Note: *, **, and *** denote statistical significance at the 10%, 5%, and 1% levels, respectively; t-values are in parentheses.
Table 4. Mechanism test.
Variables(1)(2)(3)(4)(5)
InnoGovTaxEFR&D
D i t −0.078 **0.184 ***−0.0340.0920.001
(−2.214)(3.702)(−0.564)(0.557)(1.465)
Constant0.27511.917 ***10.306 ***11.097 ***0.039 ***
(1.341)(42.150)(25.011)(11.823)(12.723)
ControlYYYYY
Individual fixed effectsYYYYY
Year fixed effectsYYYYY
Regional fixed effectsYYYYY
Industry fixed effectsYYYYY
Industry–year fixed effectsYYYYY
N12,58212,58212,58212,58212,582
R20.1390.1790.1610.0950.023
Note: **, and *** denote statistical significance at the 5%, and 1% levels, respectively; t-values are in parentheses.
Table 5. Selection of innovation directions.
VariablesEnergy Technology InnovationNon-Energy Technology Innovation
(1)(2)(3)(4)(5)(6)
Aggregate InnovationSubstantive InnovationStrategic InnovationAggregate InnovationSubstantive InnovationStrategic Innovation
D i t 0.098 **0.089 **0.076 *−0.074 **−0.066 **−0.008
(2.001)(1.963)(1.726)(−2.108)(−2.001)(−0.225)
Constant0.175−0.700 ***−0.1970.2820.585 ***−0.052
(0.674)(−2.800)(−0.843)(1.380)(6.412)(−0.249)
ControlYYYYYY
Individual fixed effectsYYYYYY
Year fixed effectsYYYYYY
Regional fixed effectsYYYYYY
Industry fixed effectsYYYYYY
Industry–year fixed effectsYYYYYY
N12,58212,58212,58212,58212,58212,582
R20.1200.0960.0720.1320.1190.101
Note: *, **, and *** denote statistical significance at the 10%, 5%, and 1% levels, respectively; t-values are in parentheses.
Table 6. Directions of energy technology innovation.
VariablesTraditional Fossil Fuel Technology InnovationNew and Renewable Energy Technology Innovation
(1)(2)(3)(4)(5)(6)
Aggregate InnovationSubstantive InnovationStrategic InnovationAggregate InnovationSubstantive InnovationStrategic Innovation
D i t 0.151 ***0.187 ***0.128 **0.0640.0610.056
(2.816)(3.142)(2.568)(1.092)(0.979)(0.858)
Constant0.118−0.625 **0.0280.079−0.860 ***−0.591 *
(0.424)(−1.974)(0.103)(0.261)(−2.721)(−1.814)
ControlYYYYYY
Individual fixed effectsYYYYYY
Year fixed effectsYYYYYY
Regional fixed effectsYYYYYY
Industry fixed effectsYYYYYY
Industry–year fixed effectsYYYYYY
N12,58212,58212,58212,58212,58212,582
R20.0380.0910.0580.0520.0980.116
Note: *, **, and *** denote statistical significance at the 10%, 5%, and 1% levels, respectively; t-values are in parentheses.
Table 7. Regional heterogeneity.
VariablesEnergy Technology Innovation
(1)(2)(3)(4)
Zhejiang ProvinceFujian ProvinceHenan ProvinceSichuan Province
D i t × region j 0.104 *
(1.901)
D i t × region j 0.251 ***
(2.814)
D i t × region j −0.053
(−0.496)
D i t × region j −0.101
(−0.996)
Constant−0.291−0.298−0.313−0.317
(−1.323)(−1.355)(−1.423)(−1.442)
ControlYYYY
Individual fixed effectsYYYY
Year fixed effectsYYYY
Regional fixed effectsYYYY
Industry fixed effectsYYYY
Industry–year fixed effectsYYYY
N12,58212,58212,58212,582
R20.1060.1060.1050.105
Note: * and *** denote statistical significance at the 10% and 1% levels, respectively; t-values are in parentheses.
Table 8. Industry-level energy consumption heterogeneity.
VariablesTraditional Fossil Fuel Technology InnovationNew and Renewable Energy Technology InnovationSubstantive Energy InnovationStrategic Energy Innovation
(1)(2)(3)(4)(5)(6)(7)(8)
Energy-Intensive FirmsLow-Energy-Intensive FirmsEnergy-Intensive FirmsLow-Energy-Intensive FirmsEnergy-Intensive FirmsLow-Energy-Intensive FirmsEnergy-Intensive FirmsLow-Energy-Intensive Firms
D i t −0.0350.167 ***−0.0860.095−0.0800.168 ***0.0220.088 *
(−0.166)(2.992)(−0.689)(1.412)(−0.621)(3.254)(0.171)(1.873)
Constant0.2310.137−0.3430.281−0.759−0.554 **−0.664−0.045
(0.296)(0.455)(−0.652)(0.747)(−1.473)(−2.011)(−1.242)(−0.170)
ControlYYYYYYYY
Individual fixed effectsYYYYYYYY
Year fixed effectsYYYYYYYY
Regional fixed effectsYYYYYYYY
Industry fixed effectsYYYYYYYY
Industry–year fixed effectsYYYYYYYY
N26649918266499182664991826649918
R20.0680.0270.0710.0210.1120.1050.1510.073
Note: *, ‌**, and ***‌ denote statistical significance at the 10%, 5%, and 1% levels, respectively; t-values are in parentheses.
Table 9. Property rights heterogeneity.
VariablesTraditional Fossil Fuel Technology InnovationNew and Renewable Energy Technology InnovationSubstantive Energy InnovationStrategic Energy Innovation
(1)(2)(3)(4)(5)(6)(7)(8)
State-OwnedNon-State-OwnedState-OwnedNon-State-OwnedState-OwnedNon-State-OwnedState-OwnedNon-State-Owned
D i t 0.0940.173 ***−0.0240.1120.0330.186 ***0.1030.064
(0.91)(2.69)(−0.22)(1.58)(0.35)(3.31)(1.23)(1.21)
Constant0.571−0.2590.2960.031−0.178−1.112 ***0.357−0.499
(1.33)(−0.70)(0.65)(0.07)(−0.47)(−3.47)(1.00)(−1.57)
ControlYYYYYYYY
Individual fixed effectsYYYYYYYY
Year fixed effectsYYYYYYYY
Regional fixed effectsYYYYYYYY
Industry fixed effectsYYYYYYYY
Industry–year fixed effectsYYYYYYYY
N37178865371788653717886537178865
R20.0500.0380.0800.0450.1410.0960.0930.086
Note: ***‌ denote statistical significance at the 1% level; t-values are in parentheses.
Table 10. Firm size heterogeneity.
VariablesTraditional Fossil Fuel Technology InnovationNew and Renewable Energy Technology InnovationSubstantive Energy InnovationStrategic Energy Innovation
(1)(2)(3)(4)(5)(6)(7)(8)
Large FirmsSmall and Medium-Sized FirmsLarge FirmsSmall and Medium-Sized FirmsLarge FirmsSmall and Medium-Sized FirmsLarge FirmsSmall and Medium-Sized Firms
D i t 0.205 ***−0.0720.0710.0820.174 ***0.0070.120 **−0.104
(3.45)(−0.57)(1.11)(0.60)(3.24)(0.07)(2.46)(−1.04)
Constant0.182−0.169−0.0781.199 *−0.591 **−1.056 **−0.2650.292
(0.58)(−0.28)(−0.23)(1.74)(−2.13)(−2.28)(−1.01)(0.57)
ConstantYYYYYYYY
YYYYYYYY
ControlYYYYYYYY
Individual fixed effectsYYYYYYYY
Year fixed effectsYYYYYYYY
Regional fixed effectsYYYYYYYY
N94863096948630969486309694863096
R20.0460.0260.0660.0210.1210.0720.0970.046
Note: *, ‌**, and ***‌ denote statistical significance at the 10%, 5%, and 1% levels, respectively; t-values are in parentheses.
Disclaimer/Publisher’s Note: The statements, opinions and data contained in all publications are solely those of the individual author(s) and contributor(s) and not of MDPI and/or the editor(s). MDPI and/or the editor(s) disclaim responsibility for any injury to people or property resulting from any ideas, methods, instructions or products referred to in the content.