1. Introduction
Across the world, higher education has become a strategic driver of sustainable development by concentrating knowledge production, shaping human capital, and anchoring innovation activities in particular places. As universities and research platforms increasingly function as core “knowledge infrastructures” within regional innovation systems, the uneven geography of higher education can translate into persistent disparities in innovation capacity, employment quality, and opportunities for upward social mobility. These socio-spatial effects make the spatial organization of higher education not only an educational policy issue but also a sustainability concern, because place-based concentration may lock regions into divergent development pathways and weaken inclusive growth.
Education geography provides a useful lens for examining these dynamics. Education is a deeply spatial and political social issue, and educational systems often exhibit strong gradients across places and scales [
1,
2]. The field emphasizes how location, place and scale structure the distribution of educational resources and the chances of accessing them [
3]. It conceptualizes education as a spatially embedded process in which institutional arrangements and territorial contexts jointly shape access and outcomes [
4].
In higher education, spatial unevenness is frequently expressed through clustering. Prior studies indicate that the distribution of universities, research platforms and high-quality resources tends to be spatially concentrated, generating pronounced regional differentiation in institutional scale, quality and talent cultivation capacity [
5]. While early research on higher-education inequality often centered on socioeconomic background, gender, or ethnicity [
6], more recent work brings spatial structure into the explanatory frame [
7] and shows that top-tier universities and innovation resources are more likely to accumulate in core regions [
8]. This concentration not only increases the number of institutions in advantaged areas; it also elevates research output and talent-training hierarchies, strengthening the innovation capacity of cores while limiting knowledge diffusion and network formation in peripheral regions [
9].
China represents a salient case where these issues intersect with major policy agendas on educational equity and regional coordination. Existing research documents significant regional disparities in higher education and a persistent “east–west” gradient [
10,
11], with leading coastal urban agglomerations concentrating high-quality institutions and talent, while many central and western areas face long-term constraints in supply and quality [
12,
13,
14,
15]. Mechanism-oriented studies commonly attribute these patterns to cumulative policy interventions and uneven economic and population dynamics [
16]. However, these studies primarily explain persistence, but provide limited insight into why such spatial hierarchies remain structurally difficult to reverse.
To address this limitation, this study introduces the concept of geographic lock-in as an analytical framework to explain the structural persistence of higher education disparities. Importantly, geographic lock-in in higher education is not only a descriptive account of spatial persistence, but also has important implications for regional sustainability. Lock-in processes reshape development trajectories by reinforcing spatial concentration of educational resources and stabilizing existing hierarchies. These dynamics may generate long-term consequences for innovation capacity through the persistent concentration of research infrastructures and high-level talent in core regions. They also influence social mobility by structuring unequal access to high-quality educational opportunities. Furthermore, such persistence constrains regional resilience by limiting the ability of peripheral regions to transform educational inputs into sustainable development outcomes. In this sense, geographic lock-in provides a useful analytical bridge between spatial inequality in higher education and broader sustainability concerns.
Building on path dependence and cumulative causation theories, geographic lock-in is conceptualized as a process through which early spatial advantages and institutional arrangements generate self-reinforcing feedbacks via policy continuity, reputation accumulation, and talent concentration. In China’s higher education system, such dynamics are reinforced by long-standing state-led key-university construction programs, which have continuously strengthened the hierarchical spatial structure [
17]. Meanwhile, spatial immobility further contributes to lock-in effects, as constraints related to institutional capacity, distance, and differential mobility reduce cross-regional flows of students and skilled labor [
18]. As a result, spatial inequality may evolve into a durable structural condition rather than a transitory imbalance.
From a policy perspective, conceptualizing China’s higher education disparities as geographic lock-in shifts attention from “closing gaps” through scale expansion alone to breaking self-reinforcing mechanisms that couple higher education, innovation systems, and social mobility. It implies that regional sustainability strategies should move beyond compensatory funding and adopt coordinated, place-sensitive instruments—such as cross-regional research and training consortia, targeted capacity building in teaching-and-research processes, and mobility/retention arrangements that reduce one-way talent drainage—to strengthen peripheral regions’ endogenous development capabilities. In doing so, higher education can better serve as an inclusive infrastructure for balanced regional innovation and fairer mobility opportunities, aligning education governance with sustainability goals.
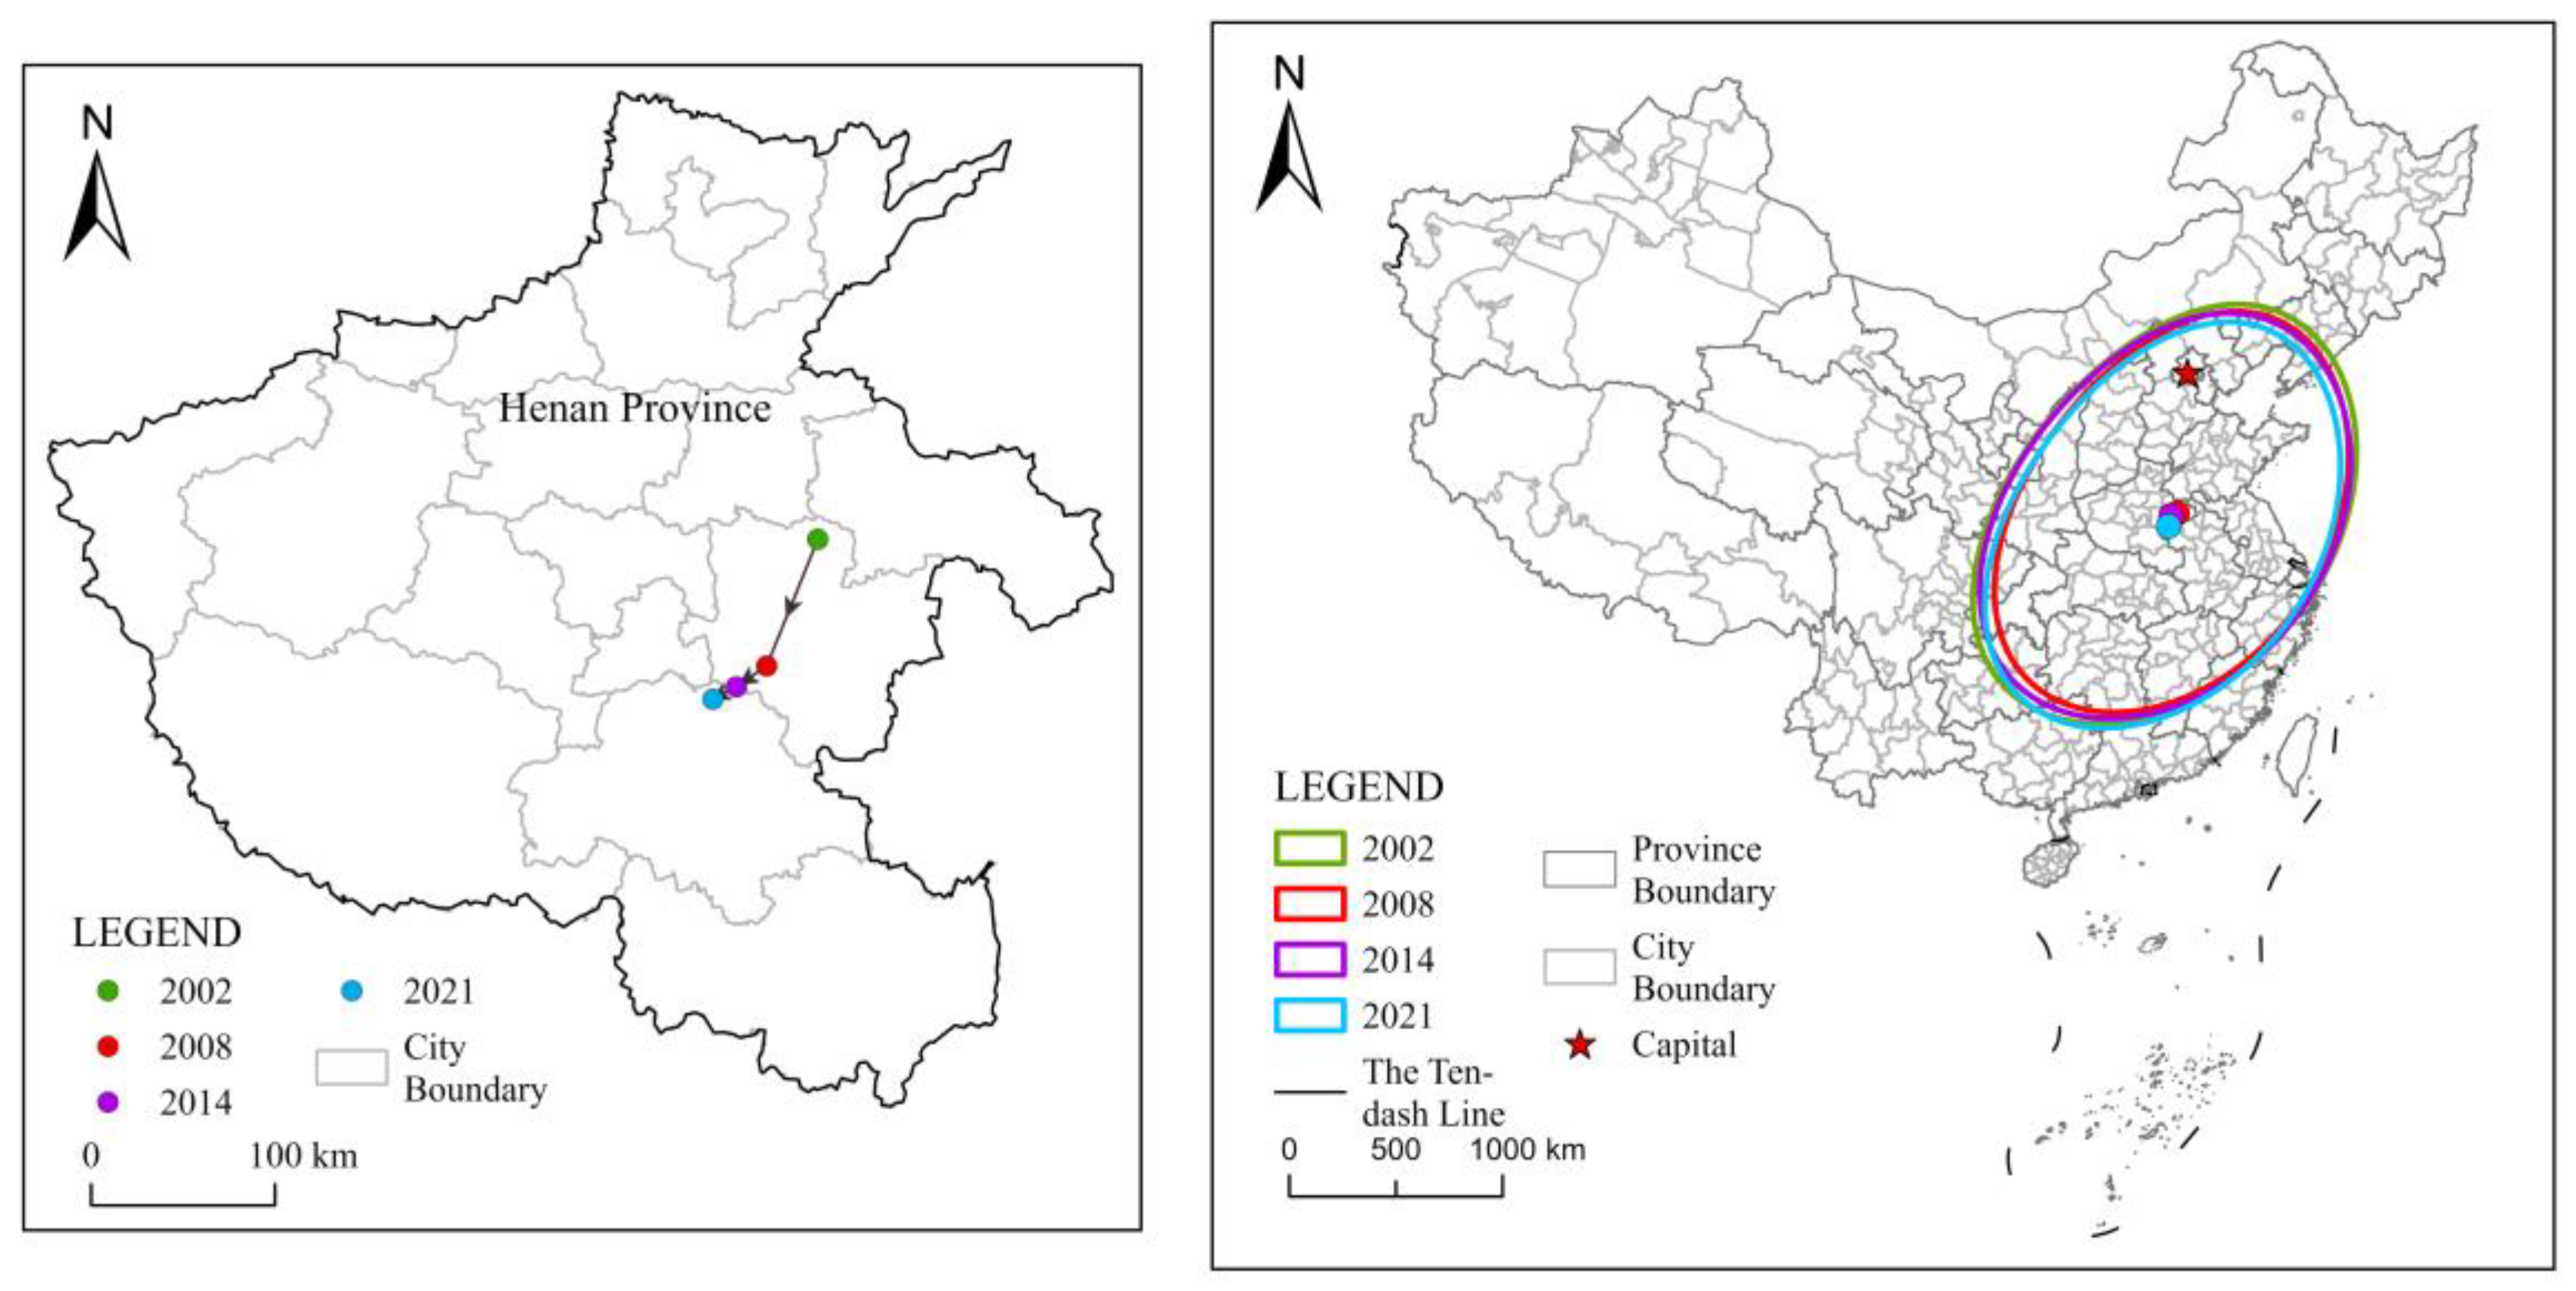
To distinguish geographic lock-in from general spatial persistence, this study defines geographic lock-in as a structural condition characterized by persistent spatial hierarchy combined with limited upward mobility and strong path dependence. Operationally, a region is considered to exhibit lock-in when the following three conditions are jointly satisfied: (1) high temporal stability in spatial ranking or classification; (2) low probability of inter-class upward or downward mobility; and (3) strong persistence in spatial concentration patterns as measured by hotspot overlap and centroid migration stability. This definition allows lock-in to be empirically distinguished from ordinary spatial inequality that may fluctuate over time without exhibiting structural rigidity.
Based on the above theoretical and empirical gap, this study addresses the following research questions:
RQ1: Does higher education development (HED) in China exhibit a persistent core–periphery spatial structure during the period 2002–2021?
RQ2: How has the spatial inequality of higher education evolved over time in terms of stability and structural change?
RQ3: What are the dominant drivers of higher education development, and how do they jointly contribute to the formation of a geographic lock-in mechanism?
2. Literature Review
2.1. Higher Education as a Sustainability-Relevant Spatial Infrastructure
In sustainability-oriented regional studies, higher education is increasingly viewed not merely as a social service but as a form of spatial infrastructure that conditions long-run development trajectories [
19]. Universities and research institutes organize knowledge production, advanced skills formation, and technology diffusion, and they often act as anchor institutions within regional innovation systems. When these functions are spatially concentrated, they can shape where high-productivity industries emerge, where quality employment accumulates, and how resilient regional economies are to shocks. In this sense, the geography of higher education is tightly coupled with key sustainability concerns—inclusive growth, territorial cohesion, and equal opportunity—because educational infrastructures influence both economic upgrading and the distribution of life chances across space.
From a socio-spatial perspective, higher education affects sustainability through at least three linked channels. First, it structures the spatial distribution of human capital: where high-quality institutions are located strongly influences who can access advanced education and where graduates subsequently settle [
20]. Second, it shapes regional innovation capacity by concentrating research platforms, laboratories, and collaborative networks that enhance knowledge spillovers and absorptive capacity. Third, it mediates social mobility through credential acquisition and labor-market sorting, thereby affecting whether disadvantaged regions can retain and reproduce skilled populations over time [
9]. In addition, recent research further suggests that when higher education is spatially concentrated, it may generate self-reinforcing regional trajectories through the co-evolution of knowledge production, innovation systems, and labor mobility [
21,
22,
23]. This implies that higher education not only supports sustainability outcomes but may also embed regions into long-term development paths, thereby linking spatial inequality with structural persistence.
2.2. Mapping and Measuring Socio-Spatial Inequality in Higher Education
Education geography conceptualizes education as a political and spatial process in which resources, opportunities, and outcomes are distributed unevenly across places and scales [
24,
25]. Accordingly, a large body of work focuses on describing and measuring socio-spatial inequality in higher education. At the macro level, scholars commonly document concentration patterns and regional gradients in the distribution of institutions and resources [
26]. At finer scales, research emphasizes accessibility and opportunity structures—how distance, urban hierarchy, and administrative boundaries shape the feasibility of attending higher-quality institutions.
Empirically, inequality has been examined using multiple types of indicators, often reflecting different stages of the higher-education “production chain.” Resource-oriented measures focus on the distribution of institutions, faculty, and funding. Opportunity-oriented measures emphasize enrollment capacity and admission chances. Process-oriented measures capture training quality and research production, such as student–faculty ratios or research platform availability. Outcome-oriented measures relate to graduates, employment quality, or academic output. These dimensions matter because an equalization in one dimension (e.g., expansion of enrollment) does not necessarily translate into equalization in others (e.g., research capacity or graduate outcomes), which is crucial for sustainability-relevant questions about capability building rather than short-term scale growth.
In the Chinese context, many studies report persistent spatial differentiation and a clear “core–periphery” structure. High-quality resources tend to cluster in leading metropolitan areas and coastal urban agglomerations [
27], while many inland and peripheral provinces face relative scarcity in both elite institutions and high-level research capacity [
28]. This pattern is frequently interpreted as part of a broader spatial restructuring in which major city-regions become dominant nodes for innovation and high-end services. Higher education both responds to and reinforces these spatial hierarchies: core regions attract investment and talent, which further strengthens their universities and research platforms, deepening regional gaps in educational and innovation capacity [
29].
Methodologically, the literature has used descriptive spatial analysis to visualize clustering and regional gradients, as well as inequality decomposition to separate within-region and between-region disparities. Such approaches clarify whether inequality is driven mainly by differences among large regions (e.g., east–central–west) or by divergence within regions (e.g., among provinces within the east). This distinction is policy-relevant: if between-region differences dominate, redistribution and interregional collaboration may be central; if within-region differences dominate, more attention should be given to internal spatial governance and networked capacity building. In addition, the growing use of spatially explicit models reflects an increasing recognition that mechanisms may vary across space rather than operate uniformly.
Taken together, these descriptive and measurement-based studies provide a necessary empirical foundation, but they are less able to fully explain why such spatial patterns persist over long time horizons, which calls for a shift toward mechanism-oriented and path-dependent explanations.
2.3. Explanatory Mechanisms: From “Unevenness” to “Geographic Lock-In”
While documenting spatial disparities is essential, a persistent challenge lies in explaining why certain spatial patterns endure and remain difficult to reverse. To move beyond static descriptions, recent work draws on evolutionary economic geography and institutional perspectives, emphasizing that higher-education systems can become locked into particular spatial configurations through cumulative and self-reinforcing processes. In this study, “geographic lock-in” is used to describe a durable, path-dependent spatial order characterized by (i) long-term stability, (ii) positive feedback that reinforces existing advantages, and (iii) structural constraints that make reversal costly or unlikely.
(a) Path dependence and policy-led accumulation. Path dependence suggests that early institutional choices and resource allocation patterns can generate increasing returns that shape long-term spatial outcomes [
30,
31]. In higher education, this is reflected in policy priorities and funding structures that repeatedly concentrate resources in a limited set of institutions and locations, producing reputation advantages, stronger faculty recruitment capacity, and hierarchical student sorting.
In China, existing studies have emphasized the path-dependent nature of the key-construction approach, where early concentration of elite universities continues to shape the spatial distribution of quality and institutional capacity [
32]. Importantly, recent work further indicates that such policy-led accumulation should be understood as a self-reinforcing institutional process rather than a static allocation outcome: early advantages are continuously amplified through evaluation systems and performance-based reinforcement, thereby stabilizing spatial hierarchy over time.
(b) Agglomeration, regional innovation systems, and cumulative causation. Beyond formal policy, agglomeration dynamics operate as a second reinforcing layer. Core regions concentrate dense innovation networks, high-value markets for skilled labor, and diversified industrial structures [
33], thereby increasing the returns to spatial co-location between universities, firms, and research institutions. These conditions strengthen knowledge spillovers, collaborative production, and the conversion of research into economic and social outcomes [
34]. From an evolutionary perspective, cumulative causation ensures that initial advantages are continuously reinforced, making core regions increasingly attractive to both institutions and individuals and reducing the relative competitiveness of peripheral regions [
35]. In this sense, higher education is not only embedded in regional development but also actively reproduces spatial inequality through its role in innovation networks, directly linking geographic lock-in to long-term regional sustainability challenges.
(c) (Im)mobility and social mobility constraints. A third mechanism concerns mobility constraints. Educational resources—including universities, research platforms, and institutional quality—are not perfectly mobile, and neither are students and skilled labor. Institutional barriers, uneven mobility capacity, and spatial frictions limit equal access to high-quality educational opportunities [
36]. When educational and employment opportunities are concentrated in core regions, mobility flows become structurally asymmetrical, contributing to persistent outmigration from peripheral regions and reinforcing “brain drain” dynamics [
37]. Importantly, recent studies suggest that such mobility asymmetries should not be viewed merely as demographic outcomes, but as constitutive elements of lock-in systems, since they directly shape the long-term reproduction of regional human capital disparities [
38]. Furthermore, because higher education is closely linked to credential-based labor market sorting, spatial inequality in educational quality translates into differentiated social mobility opportunities, reinforcing broader concerns about equitable and sustainable regional development.
Together, these mechanisms operate as interdependent processes that collectively stabilize the spatial hierarchy of higher education. Their interaction produces a cumulative and path-dependent system in which advantages are continuously reinforced, thereby transforming spatial inequality into a condition of geographic lock-in.
2.4. Breaking Lock-In: Policy Debates for Sustainability
Policy debates on higher-education inequality often begin with the intuition that expanding enrollment or increasing funding in disadvantaged areas will narrow gaps. While such measures may improve aggregate access [
39], the lock-in perspective implies that compensatory inputs alone may be insufficient if disparities persist in educational processes and outcomes—such as faculty quality, research platforms, institutional governance capacity, and the ability to retain graduates. For sustainability-oriented governance, the key challenge is therefore not only to “add resources” but to weaken the self-reinforcing mechanisms that reproduce spatial hierarchy.
A first policy implication is the shift from scale expansion to capability building. If lock-in is driven by cumulative advantages and institutional quality differences, policies should focus on organizational and process dimensions of higher education—such as research capacity, graduate training systems, and stable academic labor markets—rather than physical expansion or short-term projects. A second implication is the need for cross-regional coordination. Because higher education and innovation systems operate through networks, interregional collaboration platforms (joint laboratories, shared graduate programs, co-supervision mechanisms, and coordinated discipline development) may help peripheral regions access knowledge networks and reduce isolation. A third implication concerns mobility governance. If one-way flows of students and talent reinforce lock-in, policies promoting balanced circulation—through retention programs, return channels, and arrangements reducing cross-regional costs—can support inclusive opportunity and regional resilience.
Crucially, the lock-in framing aligns higher-education policy with a broader sustainability agenda: reducing spatial inequality is not only a matter of equity, but also a strategy to avoid entrenched regional divergence in innovation capacity and social mobility. This suggests that regional higher-education governance should be evaluated by whether it improves lagging regions’ endogenous development capabilities and strengthens the inclusiveness of regional development pathways.
2.5. Research Gap and Contribution
Despite substantial progress, three limitations remain in the existing literature. First, many studies primarily document disparities without explicitly conceptualizing and empirically engaging with the idea that inequality may be stable, self-reinforcing, and difficult to reverse—that is, a form of geographic lock-in. Second, measurement is often fragmented: analyses commonly rely on single indicators (e.g., number of institutions or enrollment) and therefore cannot distinguish whether inequality is driven mainly by inputs, access, processes, or outcomes. This limits the ability to identify where, along the higher-education chain, lock-in is most strongly produced and reproduced. Third, explanatory analyses frequently assume spatially uniform mechanisms, even though policy effects, agglomeration forces, and mobility constraints are likely to vary across space.
To respond to these gaps, this study frames China’s higher-education spatial inequality through the concept of geographic lock-in and assesses its long-term evolution using a multi-dimensional perspective that links resources, opportunity structures, educational processes, and development-relevant outcomes. By doing so, the study aims to connect higher-education inequality with regional sustainability concerns—innovation capacity and social mobility—while providing a policy-relevant basis for designing interventions that go beyond compensatory expansion and toward structural de-locking through capability building and cross-regional coordination.
To clarify the methodological alignment with the identified research gaps, a mapping framework is provided to explicitly link each research gap with its corresponding empirical methods (
Table 1).
3. Materials and Methods
3.1. Index System
Because the meaning of “educational development” depends on evaluation purposes, international organizations and national agencies have developed multiple indicator systems since the 1970s to support cross-regional comparison. For example, the OECD framework commonly follows an economics-inspired logic of “background–input–process–output”, whereas other systems (e.g., UNESCO and the World Bank) emphasize education as a capability-building process and highlight both access and outcomes. Building on these approaches and adapting them to China’s higher-education context, this study constructs a higher education development index from the supply side, organized into four dimensions: Input, Access, Process, and Outcome.
This four-dimensional structure is designed to distinguish “how much is provided” (Input), “who can enter and under what competitive conditions” (Access), “how education is delivered and transformed into capability” (Process), and “what is finally achieved” (Outcome). Importantly, this design helps avoid the common limitation of single-indicator assessments (e.g., counting institutions only), by allowing inequality to be traced along the full chain from resource provision to development-relevant results.
Input reflects the basic conditions and guarantees for higher-education activities and captures a region’s capacity and priority for higher-education provision. It is operationalized using (i) annual higher-education enrollment, (ii) number of higher-education teachers, and (iii) number of colleges and universities.
Access captures inequality of opportunity in higher education, which is typically discussed as unequal access to college under selective admission systems [
40]. Under China’s highly competitive admission regime, access is shaped by the coupling between demand (number and competitiveness of candidates) and supply (enrollment capacity and quality distribution). We therefore use two indicators to approximate relative access conditions: (i) Priority Selection (the competitiveness threshold for applicants’ first-choice selection) and (ii) Quality of Admission (the comprehensive quality level of admitted students). These indicators jointly reflect the competitive entry conditions associated with local higher-education systems.
Process represents the internal transformation stage, where inputs are converted into educational and research capabilities. In theory, the education process is jointly produced by faculty and institutions and is expressed through teaching, research, and local service functions. To reflect these core functions, we use four indicators: (i) Talent Cultivation, (ii) Comprehensive Level of Teachers, (iii) Scientific Research, and (iv) Teachers’ Performance.
Outcome reflects the performance and effectiveness of higher education as the combined result of initial conditions and educational processes. To represent outcomes relevant to both individual development and regional sustainability, we include (i) Employment Quality of graduates and (ii) Enrollment Rate for postgraduate continuing education.
Table 2 presents the full indicator system. Based on the above, the HED level is expressed as:
where denote the composite scores of the four dimensions (Input, Access, Process, Outcome), respectively.
3.2. Main Methods
3.2.1. Entropy Weight TOPSIS
To obtain an overall HED score for each spatial unit, we employ an entropy-weighted TOPSIS approach. Entropy weighting determines indicator weights objectively based on information variability, while TOPSIS ranks each unit by its relative closeness to the positive ideal solution and distance from the negative ideal solution. This combined method is widely used for multi-criteria assessment when indicators have different units and distributions. The specific calculation methods are as follows:
First, construct the standardized decision matrix
calculate entropy weights
Second, construct the weighted standardized matrix
Third, determine the positive and negative ideal solutions
Fourth, calculate Euclidean distances
Finally, calculate the comprehensive closeness coefficient (HED index)
where
m is the number of cities,
i is the index for cities, and
j is the index for indicators.
3.2.2. Dagum Gini Coefficient
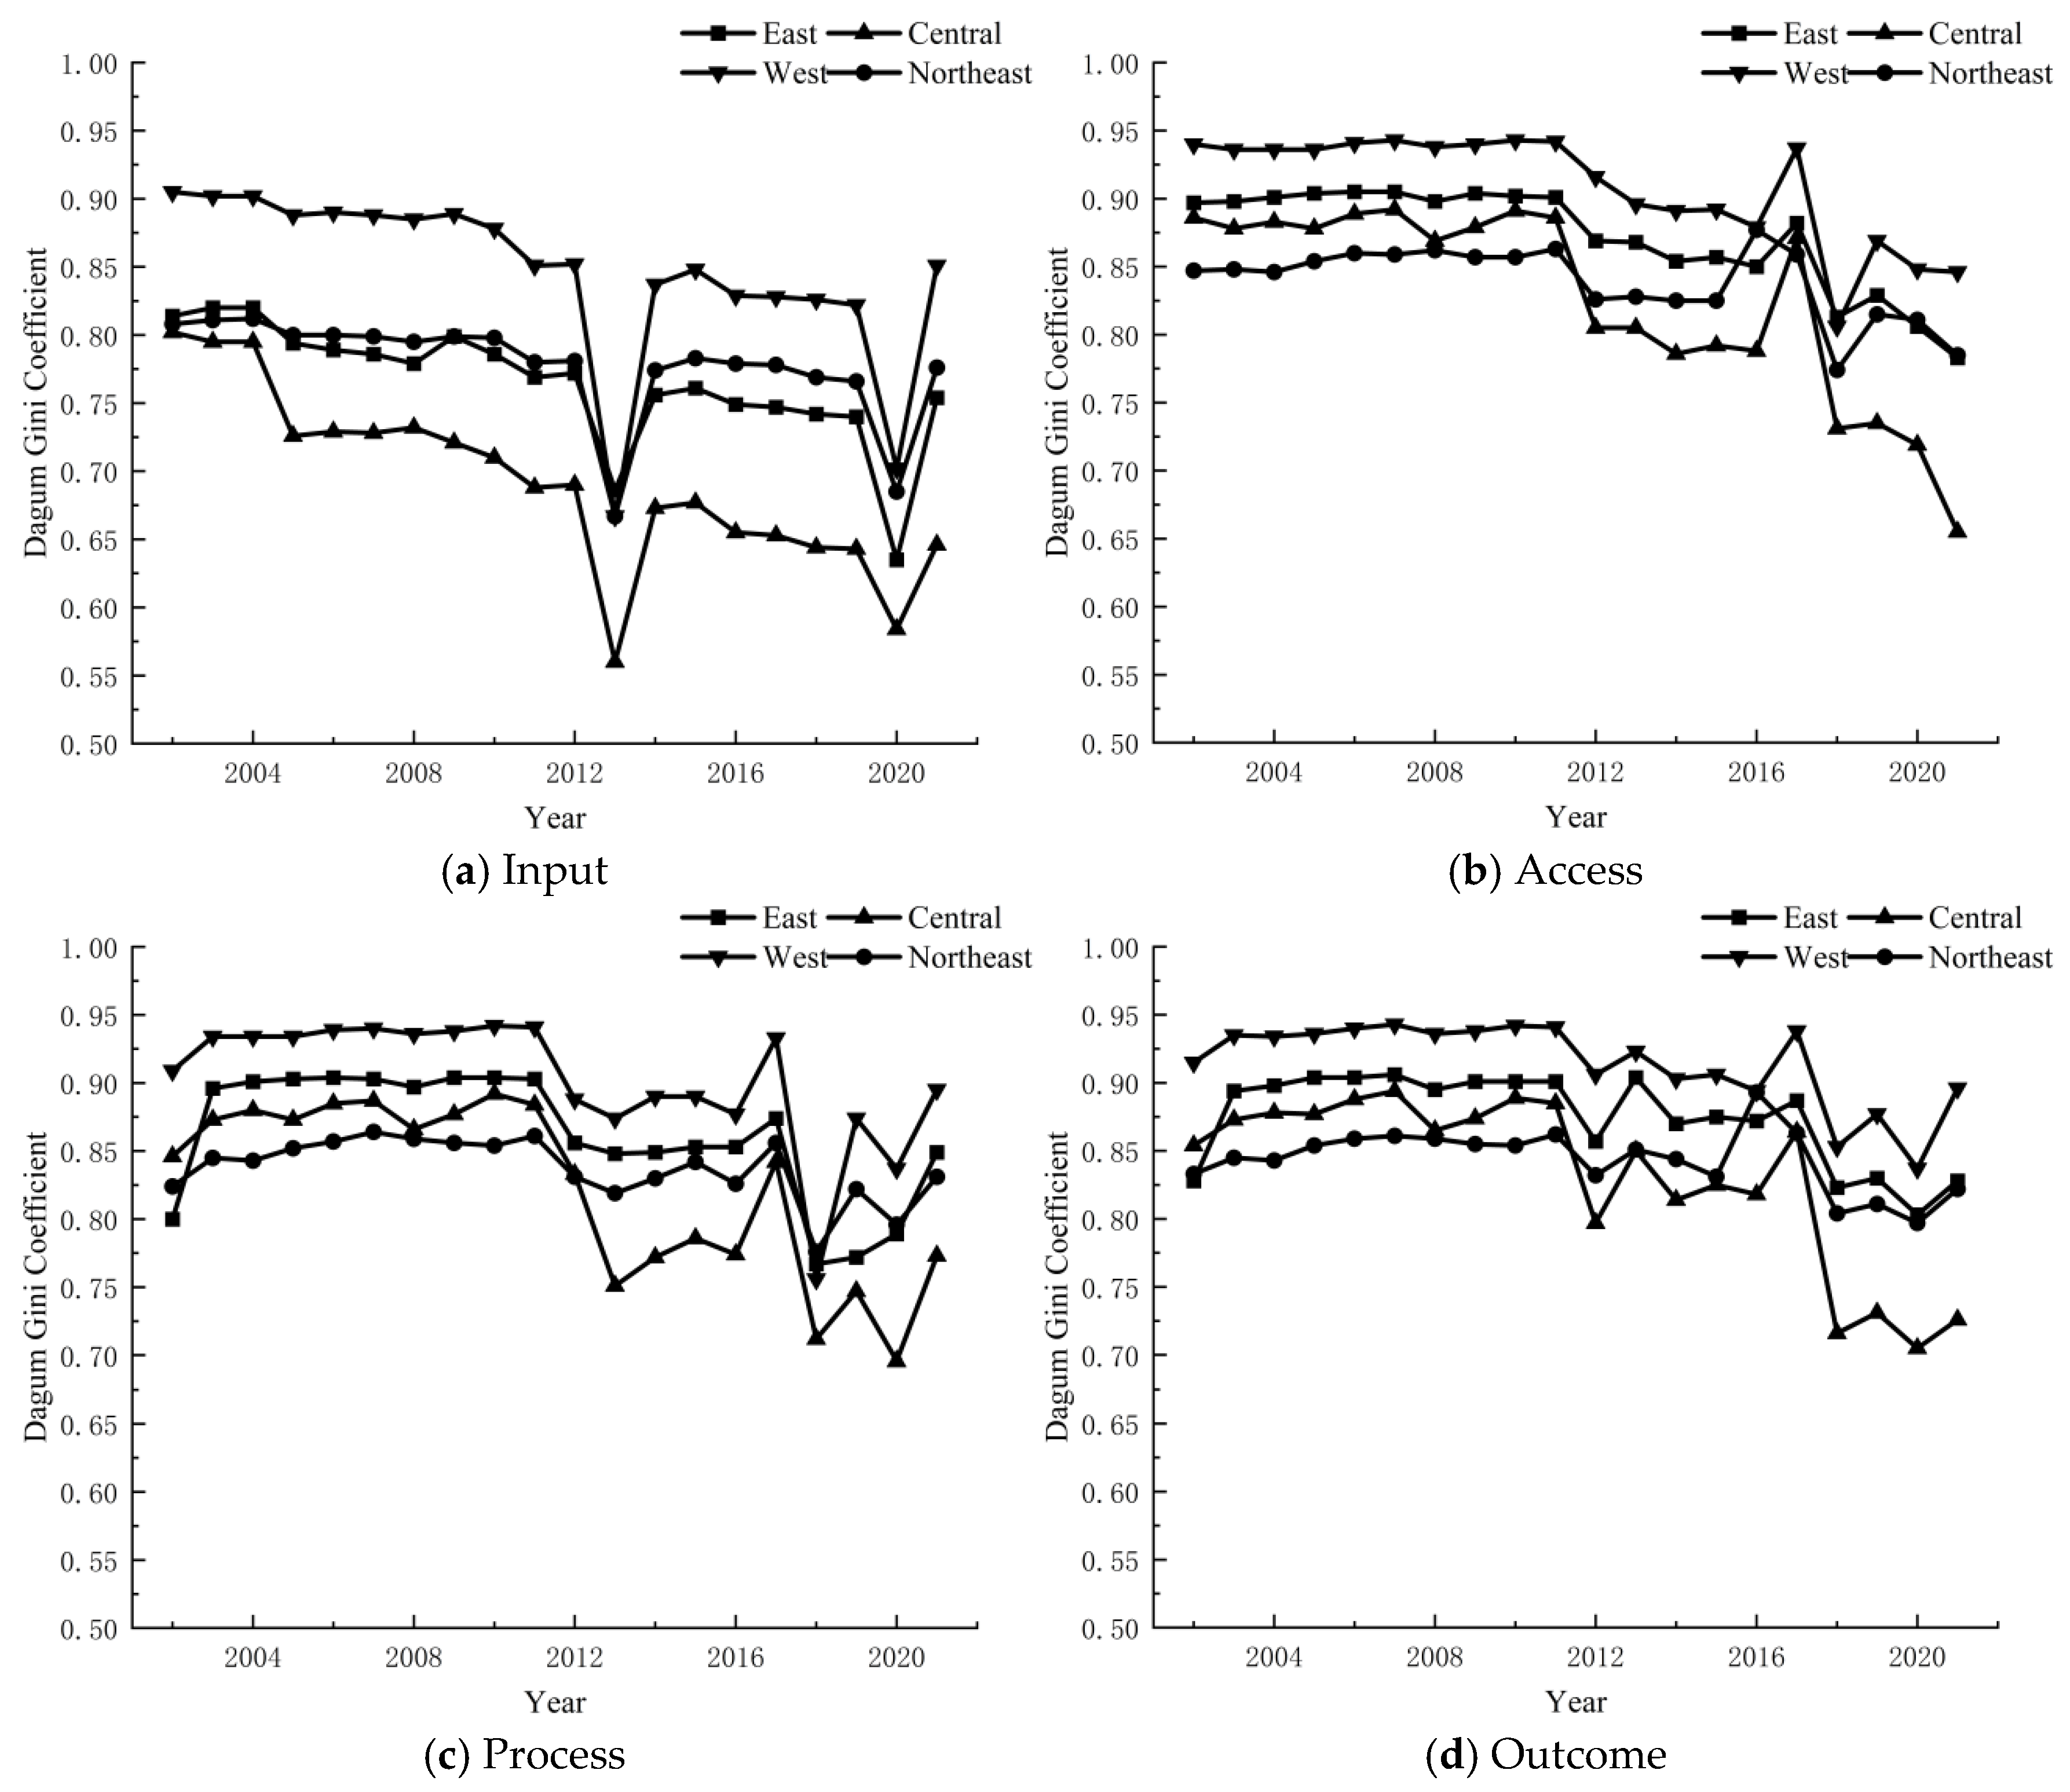
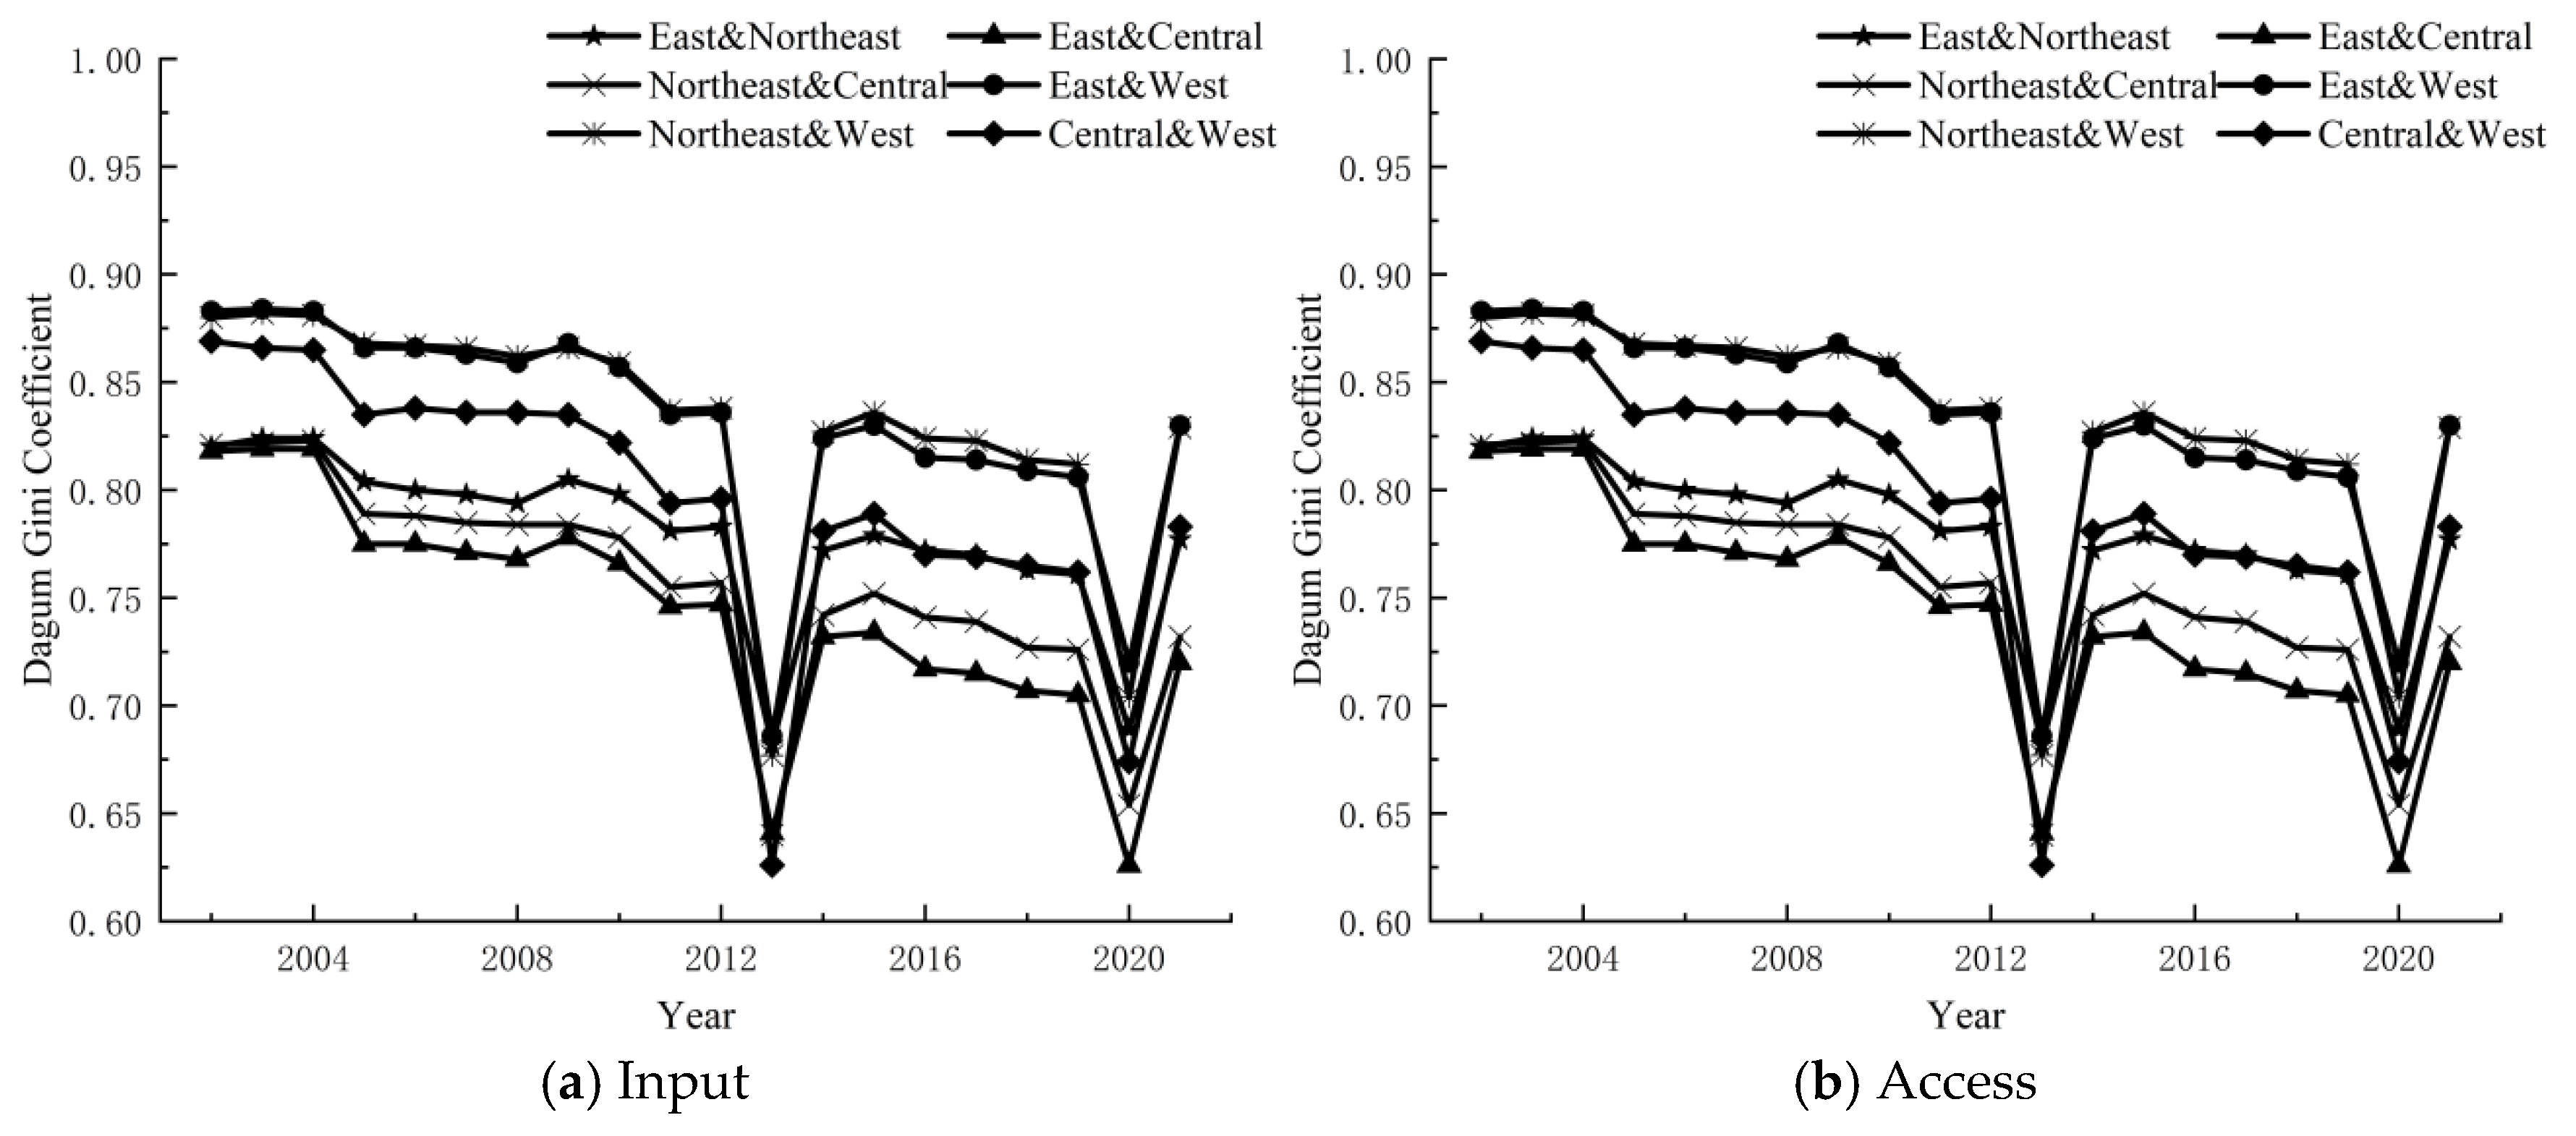
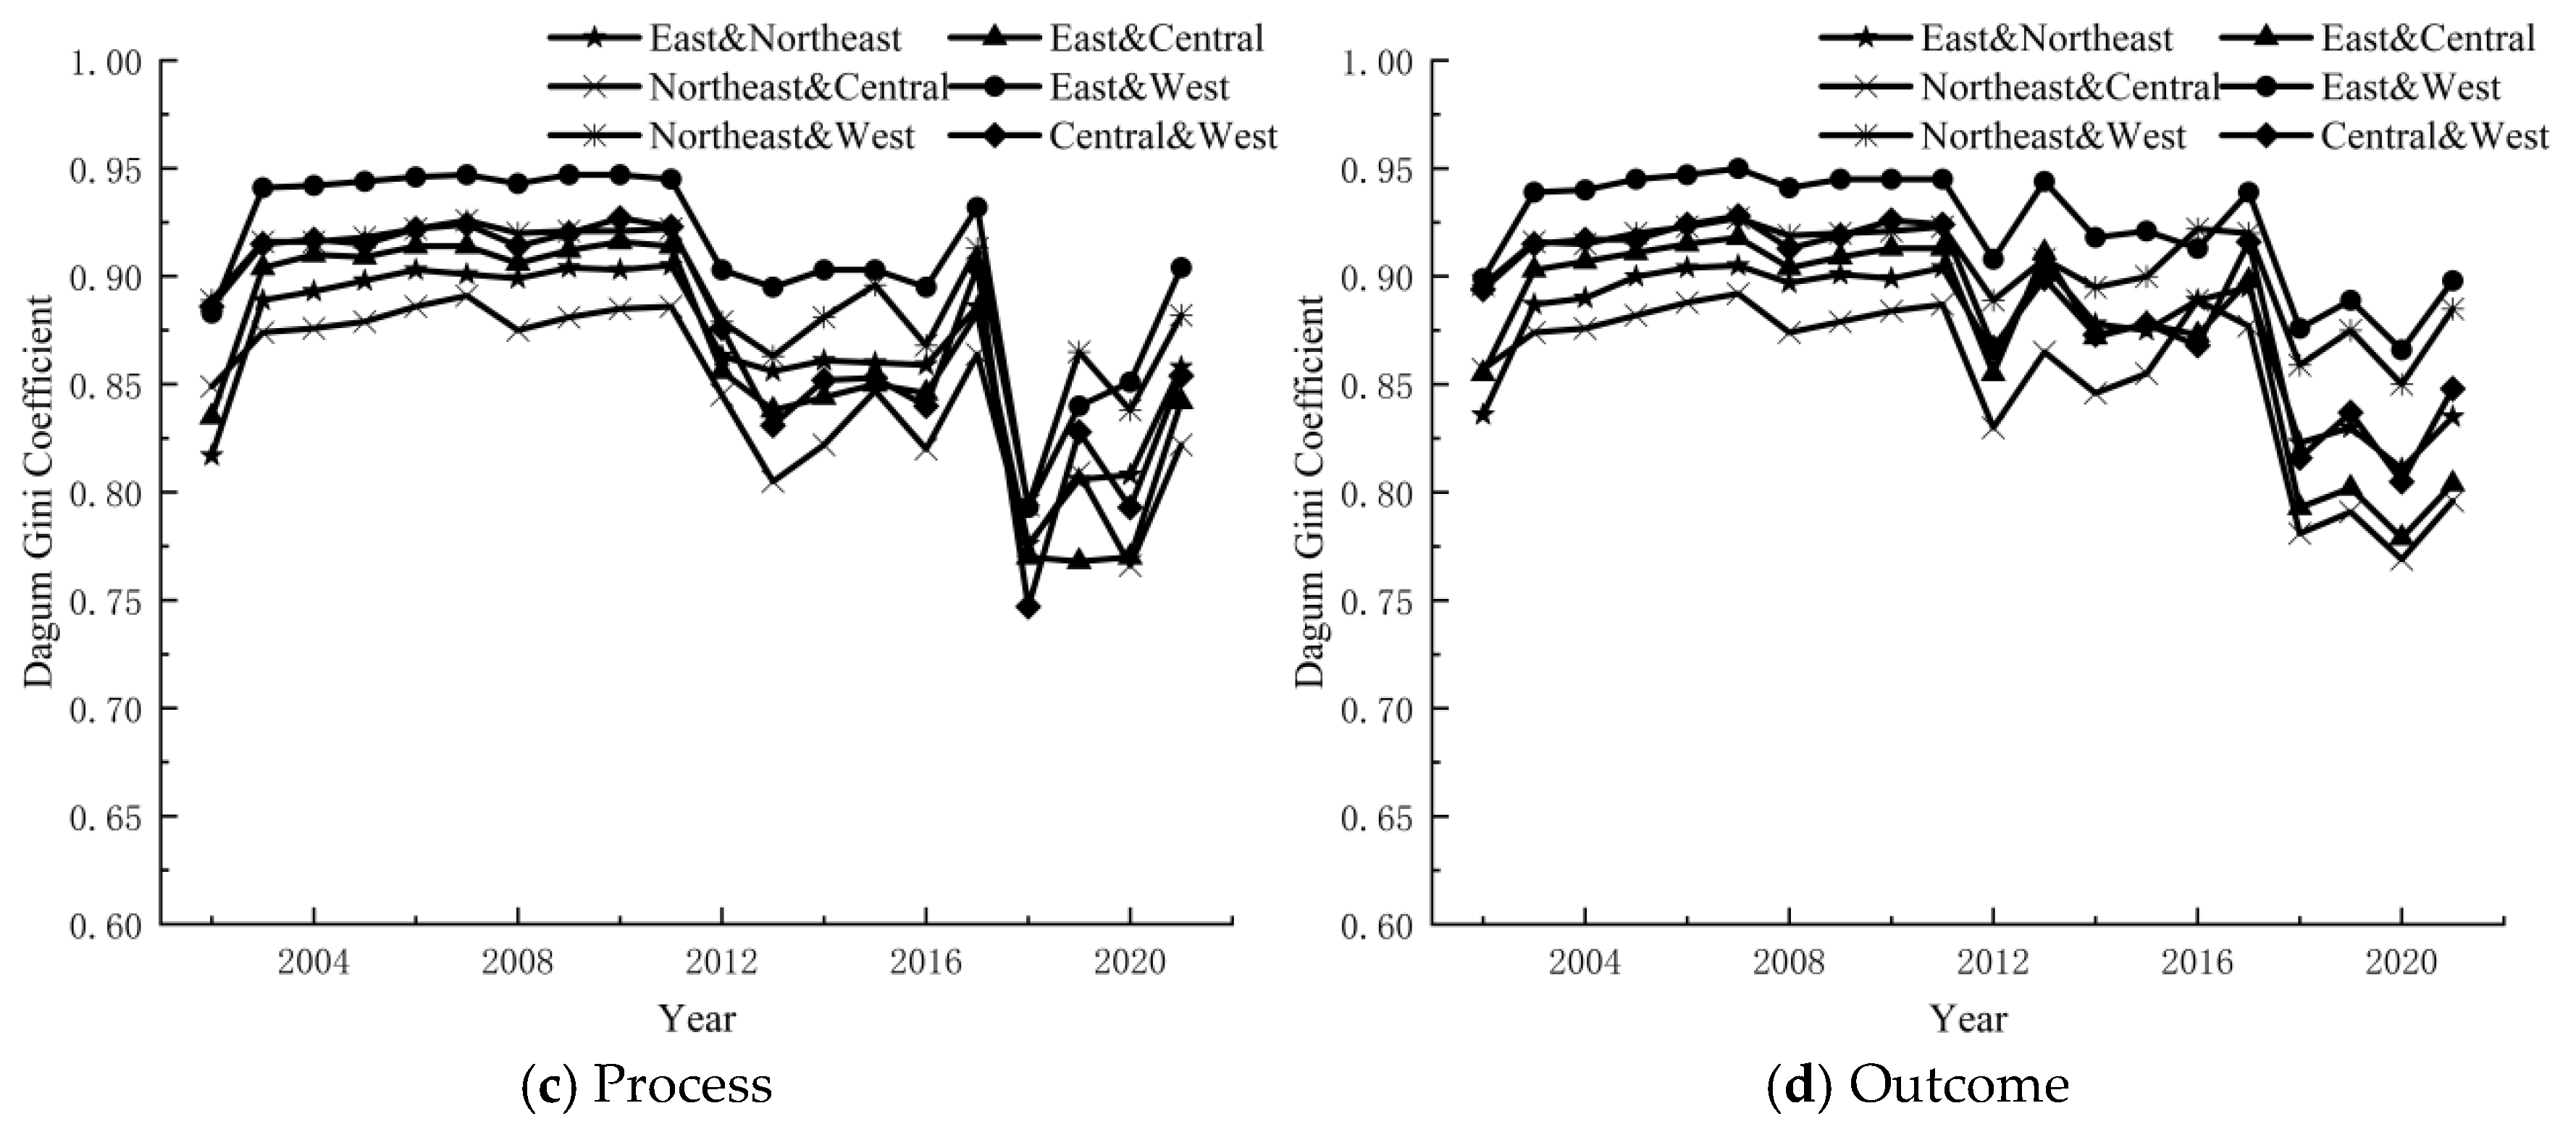
To quantify regional inequality in HED and identify its sources, this study uses the Dagum Gini coefficient, which extends the traditional Gini by allowing decomposition into (i) within-group inequality, (ii) between-group inequality, and (iii) transvariation (overlap) intensity. This is particularly suitable for China’s regional development because distributional overlap across groups is common and cannot be captured well by conventional decompositions.
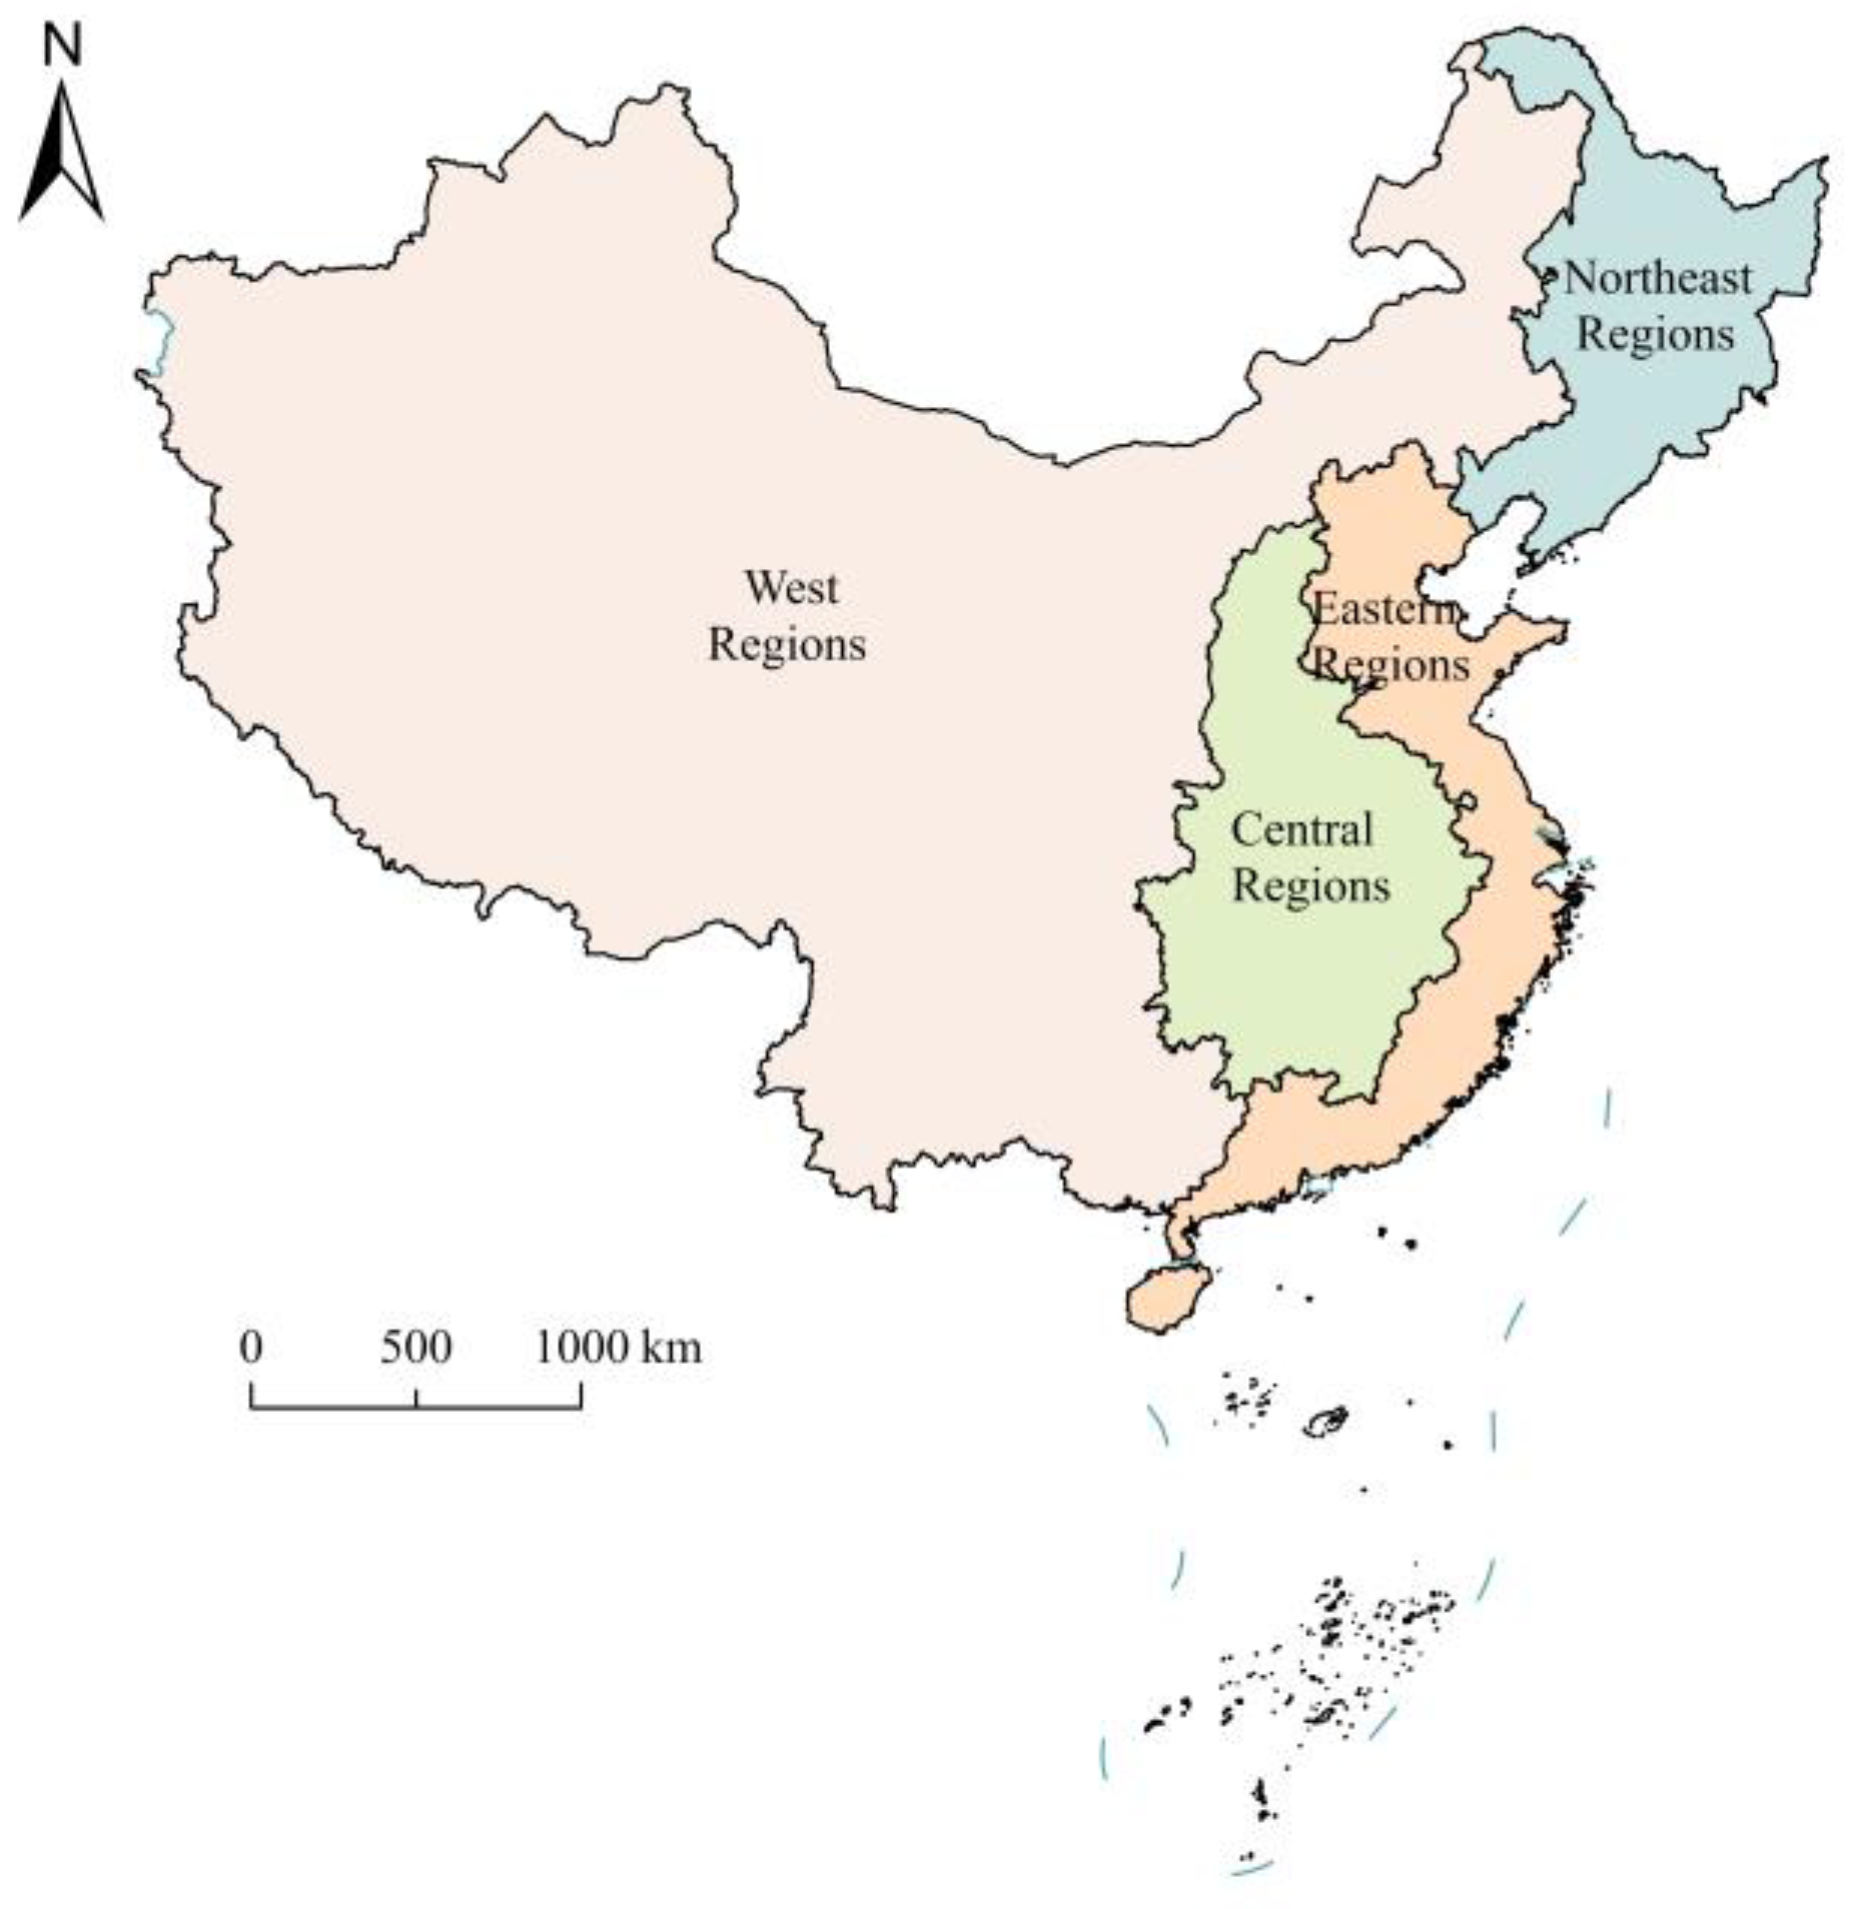
Following standard practice, China’s spatial units are grouped into four macro-regions: Eastern, Central, Western, and Northeastern China. The Dagum decomposition is then used to determine whether overall inequality in HED is mainly driven by disparities within these macro-regions, between them, or by distributional overlap among them. This directly supports policy interpretation: for example, a high between-group component would suggest that macro-regional strategies (e.g., cross-regional allocation and coordination) are crucial, whereas a high within-group component would imply that intra-regional governance and networked development (e.g., within the East or within the West) deserves more emphasis. The specific calculation methods are as follows:
where
G denotes the Gini coefficient;
k represents the region, and
n denotes the number of cities;
i and
r refer to different cities;
represents the Gini coefficient within region
j; while
represents the Gini coefficient between regions
h and
j.
3.2.3. Kernel Density Analysis
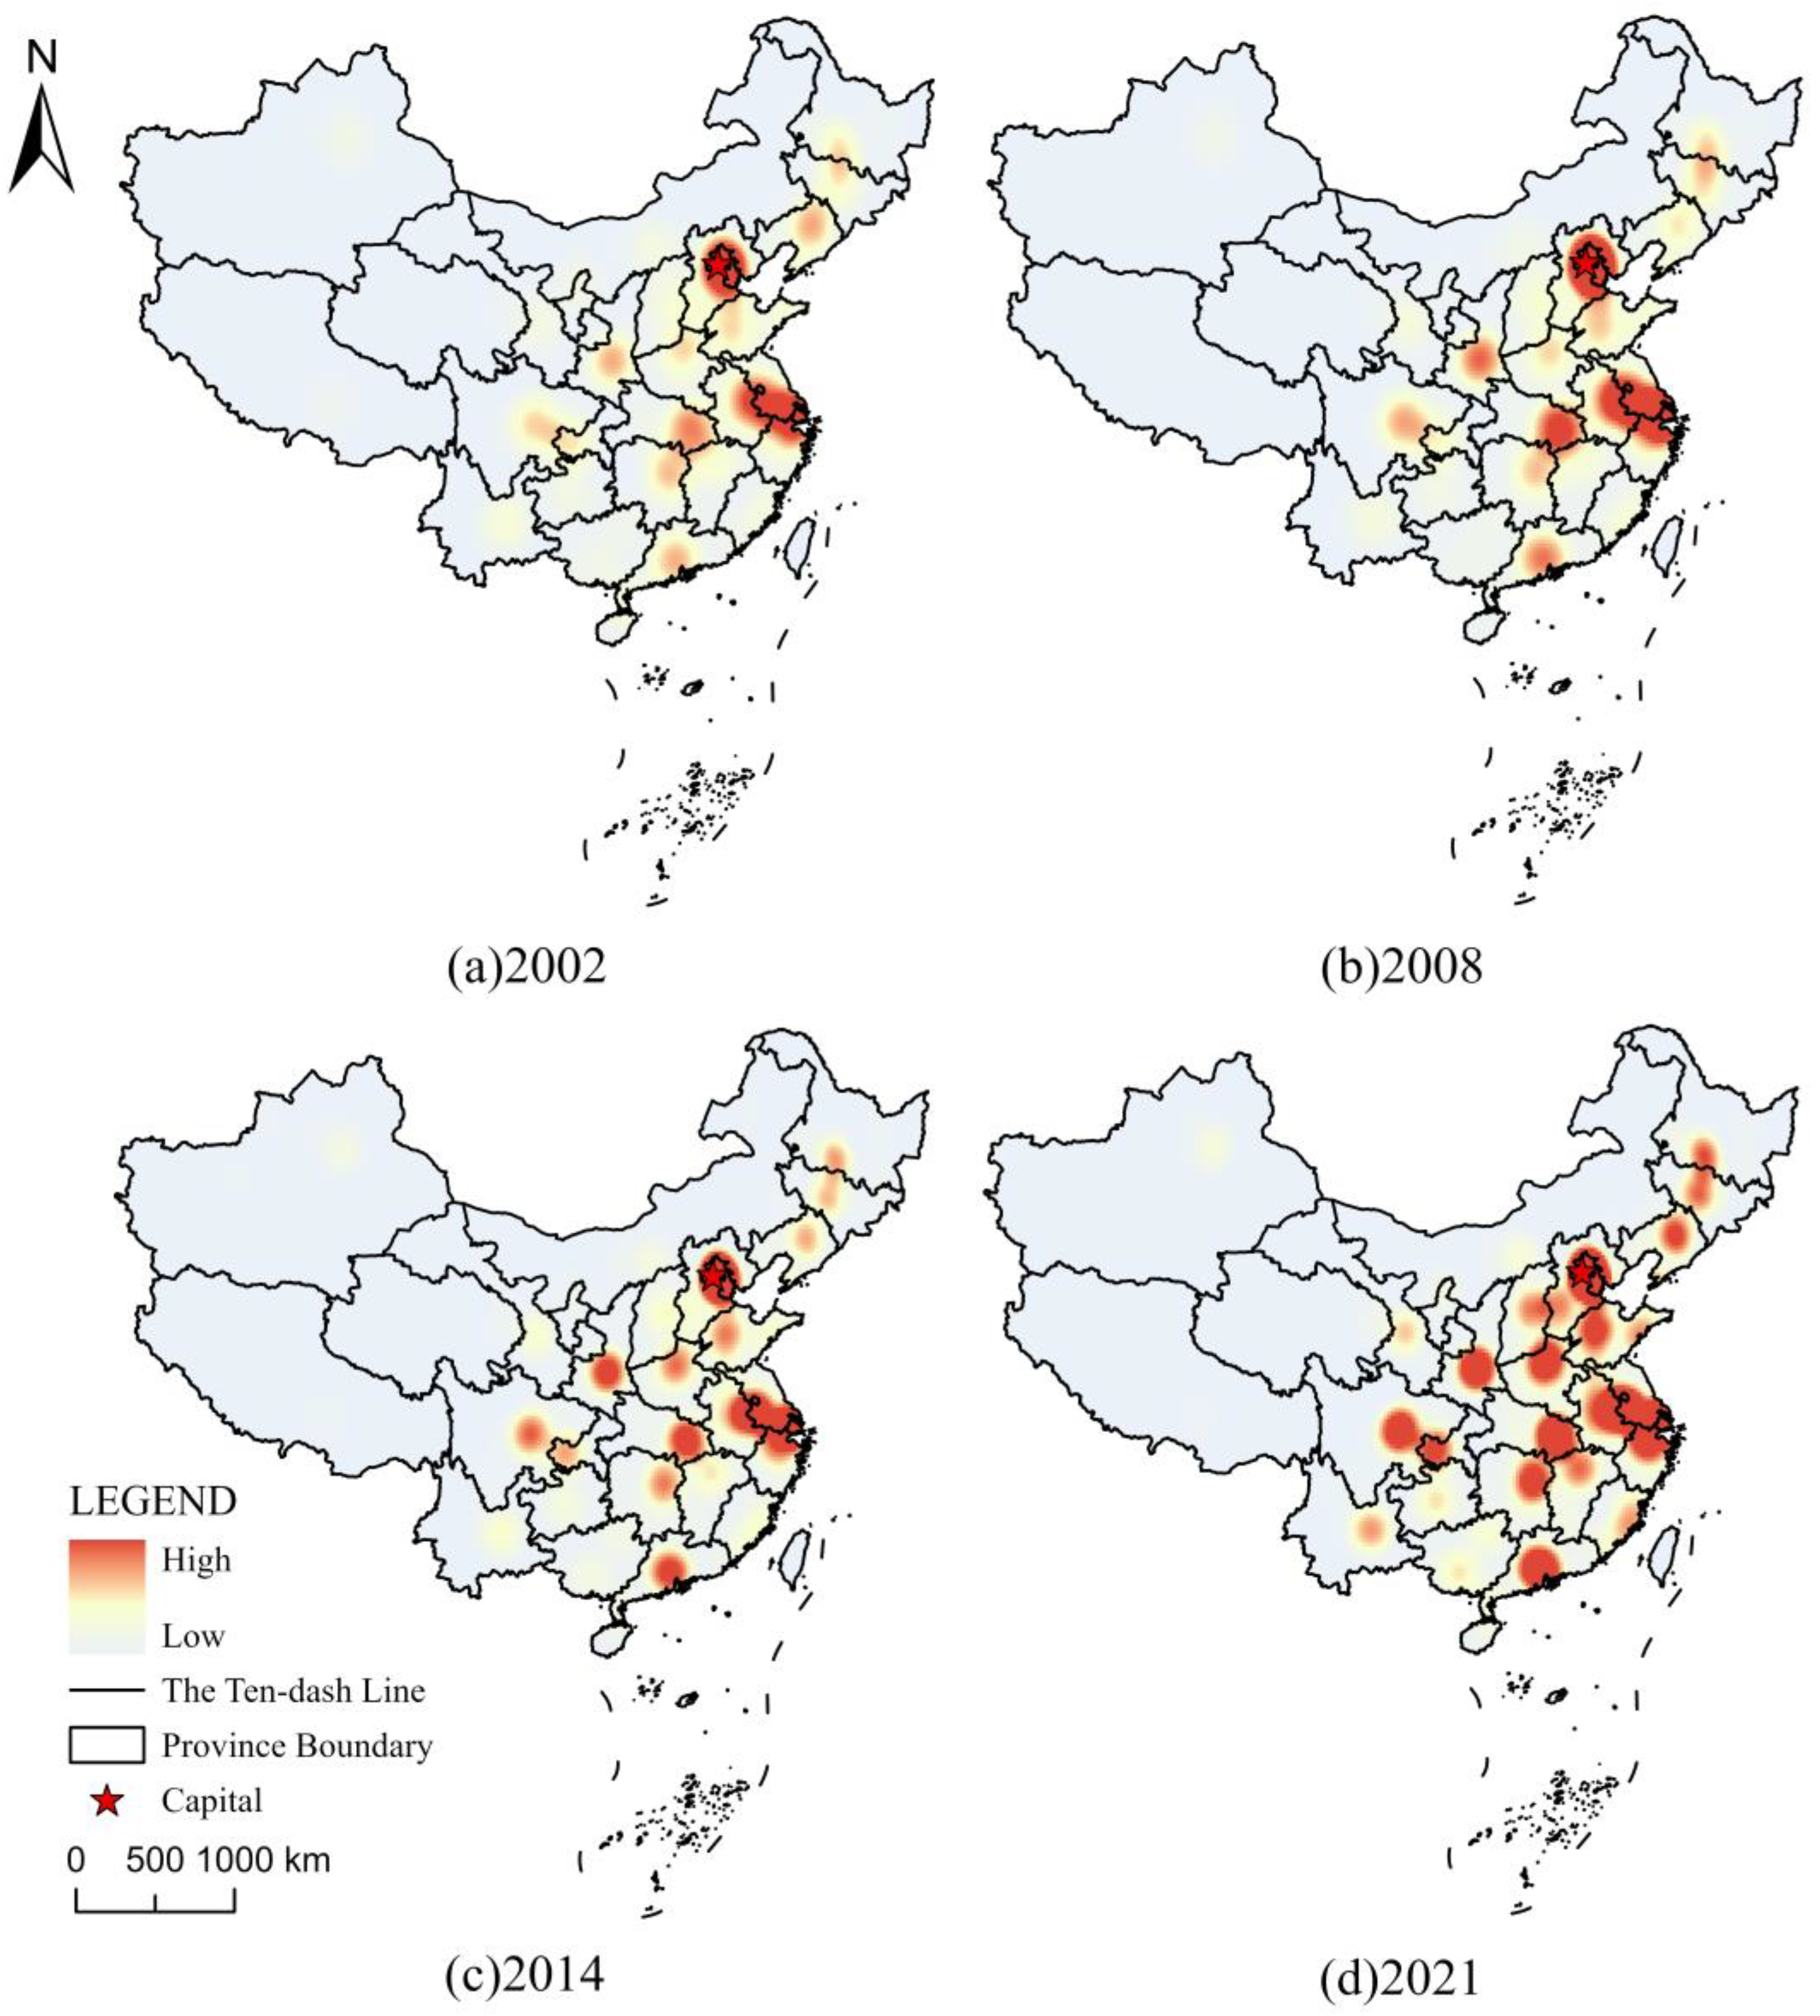
To characterize the spatial agglomeration patterns of HED and identify the spatial extent and intensity of high- and low-value clusters, this study employs kernel density analysis, which generates a continuous density surface to visualize the non-uniform distribution of higher education resources across geographic space. This is particularly suitable for geographic lock-in research because it can clearly depict the location, scale and temporal evolution of agglomeration cores, which cannot be effectively captured by discrete administrative unit-based statistical indicators.
Kernel density analysis is a nonparametric spatial statistical method. It generates a continuous, smooth density surface by calculating the distribution density of point or line features within a defined neighborhood, thereby revealing spatial clustering patterns and hotspots within the data. This study employs kernel density analysis to calculate the spatial distribution characteristics and patterns of educational quality across different regions. The specific calculation method is as follows:
where
is the kernel density value at location
x,
n is the number of schools,
h is the bandwidth, and
k is the kernel function.
3.2.4. Hotspot Overlap Rate
To examine spatial clustering characteristics of higher education development, we apply the hotspot overlap rate method. This approach measures the spatial consistency between HED and its influencing factors by quantifying the overlap of statistically identified hotspot areas. It is used to assess whether high-value clusters of explanatory variables coincide with those of HED, thereby revealing spatial coupling patterns that may not be captured by global methods.
In this study, hotspot overlap rate is used to evaluate the spatial correspondence between HED and its potential drivers, and to identify areas where strong spatial coupling or spatial mismatch occurs. Hotspots are identified using standard spatial statistical techniques, and the overlap rate is calculated to quantify the proportion of shared hotspot areas between variables. Higher values indicate stronger spatial alignment. The specific computational methodology is as follows:
where
t denotes the year;
represents the hotspot overlap rate between period
and
;
denotes the number of high-value/low-value cities identified in period
;
represents the number of cities that are classified as high-value/low-value in both periods
and
.
3.2.5. Geodetector
To examine spatially heterogeneous mechanisms behind HED, we apply the Geodetector method. Geodetector is designed to detect spatial stratified heterogeneity and quantify the explanatory power of driving factors based on the consistency between the spatial distributions of the dependent and explanatory variables. It does not rely on assumptions of linearity or independence, making it suitable for complex socio-spatial processes such as higher education systems, where resource allocation, agglomeration economies, and mobility constraints may jointly shape spatial patterns.
In this study, Geodetector is used to identify dominant constraints on HED and to assess the explanatory power of each factor, as well as potential interaction effects between factors. The model is implemented through factor detection and interaction detection, where the q-statistic is used to measure the extent to which each explanatory variable explains the spatial variance of HED. Higher q values indicate stronger explanatory power. Interaction detection is further employed to determine whether pairs of factors enhance, weaken, or independently affect the spatial distribution of HED. The specific computational methodology is as follows:
where
h denotes the classification of the independent variable; and
L represents the number of strata of the factor;
h refers to the city;
represents the variance of higher education development levels across all cities in the country.
3.3. Data Resources and Processing
To empirically assess the geographic lock-in of higher education development, this study constructs a city-level dataset that can capture (i) the spatial concentration and persistence of higher-education resources and (ii) the cumulative advantages reflected in access, process, and outcome dimensions. The analysis uses prefecture-level cities as the basic spatial units, which allows both cross-sectional comparison and the examination of macro-regional differences under China’s uneven development pattern.
3.3.1. Study Objects, Spatial Units, and Regional Grouping
The primary objects of this study include higher education institutions listed by the Ministry of Education. Following the “place-based” logic embedded in geographic lock-in research, institutional-level information is aggregated to the prefecture-level city (municipal) unit, allowing for an examination of how higher education development is embedded within broader urban and regional systems rather than being analyzed at the isolated campus scale.
Prefecture-level cities are adopted as the basic spatial unit because they represent the core administrative level for higher education resource allocation and policy implementation in China, and are therefore well suited for capturing core–periphery lock-in dynamics. Compared with this scale, provincial-level aggregation tends to mask substantial intra-provincial disparities, while county-level units generally lack sufficient higher education institutions for robust comparative analysis.
For inequality decomposition and comparative interpretation, cities are further grouped into four macro-regions: Eastern, Central, Western, and Northeastern China (
Figure 1). This regional classification is employed in the Dagum Gini decomposition to identify the relative contributions of within-region inequality, between-region inequality, and distributional overlap, which are key mechanisms underlying the formation of geographic lock-in.
To ensure temporal comparability while capturing structural changes in China’s higher education system, this study selects 2002, 2008, 2014, and 2021 as benchmark years. These years correspond to major policy-driven turning points in higher education and regional development: the initiation of mass higher education and the Western Development Strategy (2002), the reinforcement of higher education capacity under the 211/985 Phase III and regional development strategies (2008), the transition toward quality-oriented development and preparatory reforms for the Double First-Class initiative (2014), and the completion of the first-round Double First-Class evaluation alongside the launch of the 14th Five-Year Plan (2021). This staggered temporal design balances the detection of long-term structural evolution with the avoidance of short-term fluctuations, while ensuring data completeness and comparability across periods.
3.3.2. Data Sources
Data come from two complementary sources that jointly support the four-dimensional HED index:
(i) Official statistical publications (primarily for Input indicators). Education input data are obtained from authoritative yearbooks and municipal statistical bulletins, including the China Statistical Yearbook (2002–2021), China Urban Statistical Yearbook (2002–2021), and the Statistical Bulletin of National Economic and Social Development (2002–2021) for each city. These sources provide consistent information on enrollment, teacher counts, and the number of higher-education institutions.
(ii) University ranking and evaluation compilations (primarily for Access–Process–Outcome indicators). Data on educational access, educational process, and educational outcomes are drawn from Choosing a University and Select a Major in 2002–2021 (General Universities edition) and Choosing a University and Select a Major in 2002–2021 (Private Universities edition), edited/compiled by Wu Shulian and published by China Statistics Press. This series has been published continuously for many years and is widely referenced in China’s university application context (Gaokao), offering standardized rank-based information on admission competitiveness, training quality, faculty strength, research performance, and graduate employment quality.
Although the higher-education indicators used in this study are derived from the Chinese University Evaluation database (Wu Shulian, 2020), which has been subject to criticism regarding transparency, it remains one of the most widely used and systematically compiled datasets in China’s higher-education evaluation research. To mitigate potential bias associated with a single-source dataset, this study focuses on relative rather than absolute measurement, and further examines the robustness of the results through sensitivity analyses.
3.3.3. Data Harmonization and Preprocessing (Rank-to-Score Conversion)
A key challenge is that some indicators (e.g., enrollment, teacher number, number of institutions) are continuous statistics, whereas others (particularly from the ranking source) are ordinal rank/grade data. To ensure comparability within the composite index and to support entropy-weighted TOPSIS, we harmonize all indicators onto a consistent numerical scale.
Specifically, we transform raw values and rank-based categories into an 11-level graded score. The overall distribution is divided from low to high into 11 grades, where higher grades indicate better performance. The grading shares are set as follows: Grades 1–2 each account for 15% of observations; Grades 3–8 each account for 10%; Grade 9 accounts for 5%; Grade 10 accounts for 3%; and Grade 11 accounts for 2%. After reclassification, each indicator is assigned a score from 1 to 11 and then enters subsequent normalization and weighting procedures. The 11-point scale strictly follows the standard grading method proposed by Wu Shulian in his Guide to Choosing Universities and Majors series officially published by China Statistics Press.
This discretization strategy serves two purposes in the lock-in framework. First, it reduces the influence of extreme outliers and improves cross-indicator comparability. Second, it allows ordinal “reputation-like” measures (often central to cumulative advantage and lock-in) to be incorporated into a unified evaluation system, thus reflecting the spatial hierarchy of higher education development.
3.3.4. Robustness Analysis of the HED Index
To examine the robustness of the higher education development index, this study conducts a comprehensive sensitivity analysis from two perspectives: classification schemes and weighting schemes.
First, to verify whether the 11-class discretization introduces systematic bias, the HED index is recalculated using an alternative 5-class classification scheme based on an equal-proportion rule, where each category accounts for 20% of the total observations (
Table 3). Pearson and Spearman correlation coefficients are calculated annually from 2002 to 2020 to assess both numerical consistency and rank consistency between the two classification schemes. The results show that Pearson coefficients range from 0.92 to 0.98, while Spearman coefficients vary between 0.89 and 0.97, indicating strong stability of the HED index with respect to alternative discretization schemes.
Second, to further test the sensitivity of weighting specification, this study constructs an equal-weight TOPSIS model and compares it with the baseline entropy-weighted results (
Table 4). The results show that the Pearson correlation coefficients between the two weighting schemes range from 0.84 to 0.97, and the Spearman rank correlation coefficients range from 0.84 to 0.96 over the study period. Both coefficients remain at relatively high levels overall, indicating that the constructed index is not sensitive to weighting assumptions.
Overall, both classification-based and weighting-based robustness checks consistently confirm that the HED index exhibits strong stability in terms of both magnitude and ranking. This ensures the reliability of the index construction and supports the robustness of subsequent spatial analysis results.
5. Discussion
5.1. Theoretical Contributions: Advancing Research Progress from “Unevenness” to “Geographic Lock-In”
Research on the geography of higher education has made substantial progress in documenting spatial inequalities and identifying persistent core–periphery structures, particularly the long-standing east–west gradient in China. Existing studies have also increasingly incorporated perspectives from education geography and regional science, demonstrating that higher education both reflects and reinforces uneven regional development through human capital formation, innovation linkages, and differentiated opportunity structures. In addition, mechanism-oriented literature has emphasized the roles of state-led university construction programs, agglomeration economies, and selective talent mobility in sustaining regional disparities.
Building on this literature, the theoretical contribution of this study is not to further document spatial inequality, but to reframe it as geographic lock-in. This concept differs fundamentally from conventional perspectives on inequality: while inequality emphasizes differences in levels, geographic lock-in highlights the structural persistence and path-dependent reproduction of spatial hierarchies. In this sense, even when aggregate expansion reduces absolute gaps, the relative spatial hierarchy may remain largely unchanged due to embedded institutional and relational constraints.
First, this study extends the distinction between spatial inequality and structural persistence by showing that higher education disparities in China exhibit not only uneven distribution, but also durable spatial ordering with limited reversibility. As evidenced by a ranking stability index above 0.90 for top-tier cities, an upward mobility rate below 1% for low-tier cities, and a reduction in gravity center migration distance from 76.58 km to 16.63 km over the 20-year study period, the spatial hierarchy shows strong structural rigidity rather than convergence. This finding refines existing assumptions in the literature that spatial inequality will naturally attenuate with policy intervention or system expansion. Instead, it suggests that spatial hierarchies may be stabilized through institutionalized allocation rules and accumulated advantage effects, forming a condition of geographic lock-in that goes beyond ordinary unevenness.
Second, the lock-in perspective provides a bridge between the geography of higher education and evolutionary economic geography, particularly the theories of path dependence and cumulative causation. While prior studies have separately identified early policy selection effects and agglomeration-driven reinforcement processes, this study integrates these mechanisms into a unified interpretation of spatial persistence. Multi-temporal Geodetector results further support this interpretation: the explanatory power of core drivers such as innovation investment in eastern China shows a long-term increasing trend, and the interaction between economic and innovation factors exhibits strengthening synergy over time, which is consistent with cumulative causation dynamics. Early advantages in university allocation, funding concentration, and talent attraction generate reinforcing feedbacks through reputation accumulation and mobility sorting, thereby embedding spatial hierarchy into institutional and relational networks over time. Meanwhile, regionally differentiated driving patterns indicate that geographic lock-in does not follow a single pathway but instead emerges through heterogeneous mechanisms across regions.
Third, this study contributes by operationalizing geographic lock-in as a multi-dimensional and multi-scalar phenomenon. Instead of reducing spatial inequality to a single East–West divide, the results reveal a layered structure of geographic lock-in: at the national level, a stable core–periphery hierarchy; at the agglomeration level, high-value clusters concentrated in major eastern coastal urban agglomerations with strong hotspot overlap; and at the intra-regional level, pronounced polarization around provincial capital cities. This multi-level structure is consistent with, while providing a more explicit interpretation than, previous findings in education geography and regional science, where such patterns are often discussed separately rather than integrated into a unified framework.
Overall, the contribution of this study lies in shifting the analytical focus from describing spatial inequality to explaining its structural persistence through the lens of geographic lock-in. Grounded in multidimensional empirical evidence, this study establishes a clearer conceptual linkage between observed spatial patterns and long-term persistence mechanisms, while positioning the geography of higher education within broader debates on path dependence, cumulative causation, and spatial persistence in regional development.
5.2. Practical Implications: Sustainability-Oriented Governance for De-Locking Higher Education Development
From a sustainability perspective, treating higher education as place-based infrastructure shifts policy attention from short-term equalization to long-run capability building and inclusive regional development. Consistent with our empirical finding that input-side equalization has narrowed absolute gaps but has not fundamentally reshaped the structural spatial hierarchy, the practical implication is that expanding supply and improving access—while necessary—may be insufficient if core advantages are increasingly generated through quality-related processes and outcomes (e.g., research capacity, postgraduate pathways, and employment quality).
In sustainability terms, the key risk of geographic lock-in is that it may solidify divergent regional development trajectories: innovation capacity, high-quality employment, and social mobility opportunities tend to accumulate in core regions, while peripheral regions are more likely to face structural constraints, thereby weakening territorial cohesion and inclusive growth.
Three practice-oriented implications follow:
First, de-locking requires a strategic shift from “scale compensation” to “quality conversion capacity.” Consistent with the finding that disparities in input and access dimensions have narrowed while process and outcome inequalities remain highly persistent, investment in lagging regions should move beyond expanding enrollments or adding institutions and instead focus on strengthening the organizational capacities that convert inputs into durable educational quality—such as faculty development systems, stable research platforms, graduate training capacity, and governance arrangements supporting long-term performance. Without strengthening such conversion capacity, peripheral regions may become locked into an input-dependent development mode, where periodic resource injections improve baseline provision but do not necessarily translate into sustained outcome upgrading.
Second, sustainability-oriented governance should prioritize networked regional collaboration to reduce regional isolation and weaken cumulative advantage concentrated in core regions. In western China, where higher education development remains primarily constrained by basic economic and consumption conditions, cross-regional consortia, jointly governed research platforms, co-supervised graduate programs, and shared disciplinary development arrangements can reduce barriers for peripheral institutions to participate in high-level knowledge networks. Importantly, such collaboration should be institutionalized and evaluated over longer time horizons; otherwise, short-term initiatives may be insufficient to counteract entrenched reputational and network advantages.
Third, mobility governance is central. Geographic lock-in is reinforced when student and talent flows are persistently one-directional—from peripheral to core regions—because this may weaken the human-capital base required for endogenous development. This is particularly relevant for northeastern China, where registered population size appears to play an increasingly important role in shaping higher education development. Sustainability-oriented interventions may therefore include place-sensitive retention and circulation policies: improved early-career academic opportunities, joint appointments across regions, incentives for return migration, and mechanisms that reduce career penalties associated with working in non-core regions. The objective is not to restrict mobility, but to promote more balanced circulation so that peripheral regions can accumulate and retain development capacities over time.
Taken together, these implications suggest that higher education policy should be evaluated not only in terms of whether input gaps are narrowing, but also in terms of whether peripheral regions are gaining the capacity to generate and sustain high-quality outcomes—an evaluation perspective aligned with regional sustainability, resilience, and equitable development.
5.3. Limitations and Future Research Directions
Several limitations should be acknowledged to avoid over-generalization and to respond directly to the broader research agenda.
First, although the lock-in interpretation is consistent with observed persistence, stronger evidence could be obtained by explicitly modeling flows and networks—student migration, faculty mobility, inter-institutional collaboration, and knowledge spillovers. These relational mechanisms are central to how cumulative advantage is reproduced spatially, and future work could incorporate mobility or co-authorship data to test reproduction pathways more directly.
Second, measurement constraints remain. Composite indices inevitably depend on the choice of indicators and data comparability across cities and years. Future research should conduct more systematic sensitivity tests (e.g., alternative indicator sets or weighting schemes) and, where possible, integrate micro-level institutional data to better capture process quality and outcome formation.
Third, the study’s results are primarily interpretive rather than causal. Lock-in mechanisms likely interact with broader regional political economy dynamics, and future work could exploit policy shocks, staggered program rollouts, or quasi-experimental designs to identify which interventions genuinely weaken lock-in rather than merely improve short-term levels.
Finally, generalizability requires caution. China’s higher education system has distinctive institutional characteristics (notably its key-construction legacy). Comparative studies across countries or governance models would clarify which elements of geographic lock-in are context-specific and which reflect broader agglomeration dynamics in global higher education.
6. Conclusions
Based on city-level panel data from 2002 to 2021, this study constructs a four-dimensional composite index of higher education development and employs entropy-weighted TOPSIS, Dagum Gini coefficient decomposition, kernel density estimation, and a Geodetector model incorporating six socioeconomic variables (X1–X6) to systematically examine the evolution and underlying patterns of China’s spatial higher education system.
The results consistently indicate a persistent geographic lock-in pattern in China’s higher education system, characterized by a relatively stable spatial hierarchy between leading and peripheral cities over the past two decades. This finding is supported by TOPSIS-based spatial evaluation results, which show limited change in the overall ranking structure over time. Meanwhile, Dagum decomposition results further confirm that regional disparities remain an important component of total inequality, although input- and access-related gaps have shown signs of narrowing. Kernel density estimation additionally suggests that the overall distribution has become slightly more dispersed over time, but the core–periphery structure remains clearly identifiable.
From a mechanism perspective, Geodetector results suggest that innovation investment, together with other socioeconomic factors, plays a central role in shaping the spatial differentiation of higher education development. In particular, innovation-related investment exhibits relatively strong and stable explanatory power, indicating its importance in shaping spatial disparities. Regional heterogeneity is also evident: the eastern region is jointly influenced by economic scale, market demand and innovation investment; the western region remains primarily constrained by basic economic conditions with relatively weaker innovation effects; the central region shows no persistent dominant factor and reflects transitional characteristics; and the northeastern region is increasingly influenced by demographic and demand-side constraints.
Compared with previous studies, this research introduces the concept of geographic lock-in into the analysis of spatial inequality in Chinese higher education within a unified multi-dimensional and multi-scale framework, moving beyond the traditional East–Central–West static classification and focusing instead on the structural persistence of spatial inequality.
Based on these findings, policy implications suggest that improving higher education development in lagging regions should not rely solely on scale expansion or compensatory investment. Greater emphasis should be placed on strengthening the capacity of Process and Outcome dimensions, including research infrastructure development, cross-regional collaboration mechanisms, and the integration of higher education systems with regional industrial structures, so as to enhance the endogenous development capacity of peripheral regions.
Overall, the geographic lock-in of higher education in China is not an incidental phenomenon but is associated with long-term historical path dependence, cumulative policy effects, regional agglomeration patterns, and heterogeneous driving forces, as evidenced by the consistent results across multiple analytical methods used in this study.