1. Introduction
Against the dual background of global green transformation and China’s efforts to construct a new development pattern, the dynamic interactive relationship between environmental policy design and capital allocation efficiency has emerged as a core topic of widespread academic concern. In 2018, the Environmental Protection Tax Law of the People’s Republic of China was officially implemented, marking the formal completion of the transition from the long-standing pollution discharge fee system to a standardized environmental protection tax system. Distinct from administrative fee collection mechanisms, the environmental protection tax internalizes the negative externalities of corporate pollution activities through targeted tax leverage; its economic impact is not limited to constraining enterprises’ polluting production behaviors but also exerts a far-reaching influence on enterprises’ long-term investment decision-making and cross-regional location selection strategies. It is noteworthy that this reform endows provincial-level governments with discretionary authority to set specific applicable tax rates within the unified range specified by the national legal framework. The resulting inter-provincial differences in actual environmental tax burdens may trigger cross-regional flows of capital from regions with higher tax rates to regions with relatively lower tax rates, inducing a potential “pollution haven” effect within the country [
1]. This effect creates a potential practical tension with the established policy objectives of building a unified national market and promoting the free and efficient flow of production factors across regions [
2,
3].
Early research on cross-regional capital flows was deeply rooted in the theory of eclectic paradigm of international production, which explained enterprises’ foreign investment behavior from three core dimensions: ownership advantages, internalization advantages, and locational advantages. Among these dimensions, locational advantages are usually interpreted as consisting of traditional economic factors such as regional market size, factor prices level, and infrastructure construction quality. In recent years, however, a growing body of researchers has confirmed that the institutional environment, as a non-traditional locational factor, is also a key force shaping enterprises’ cross-regional investment decisions [
4]. The impact of environmental regulations on capital flows has long been the focus of theoretical debate: the pollution haven hypothesis holds that strict environmental regulatory standards will increase enterprises’ environmental compliance costs, thus motivating polluting enterprises to relocate to regions with relatively loose regulatory requirements. By contrast, the Porter hypothesis argues that appropriately designed environmental regulation can effectively stimulate enterprises’ innovative activities, and the resulting “innovation dividend” is sufficient to offset even exceed the additional compliance costs brought by regulation. Nevertheless, the existing theoretical and empirical debates on these two hypotheses have largely focused on the context of cross-border foreign direct investment (FDI), while there are still very few studies exploring the impact of environmental tax reform on the spatial allocation of capital among Chinese provinces, especially a notable lack of causal identification studies based on firm-level microdata [
5,
6].
This paper treats the 2018 Environmental Protection Tax reform as a quasi-natural experiment, leveraging the fact that provincial governments were authorized to set local tax rates above the national minimum, employs the difference-in-differences (DID) method, and uses data on Chinese A-share listed companies from 2012 to 2024 to examine the impact of the tax reform on enterprises’ cross-regional investment behavior and its underlying transmission mechanisms [
7]. This study identifies the causal effect of environmental policy adjustment on domestic inter-provincial capital allocation, integrates the pollution cost mechanism and financing constraint mechanism into a unified analytical framework to reveal the complete logic of how the tax reform drives enterprises’ cross-regional investment decisions, and expands the explanatory power of the pollution haven hypothesis and Porter hypothesis in the specific institutional context of China as a large developing economy [
8,
9].
The empirical results show that the implementation of the tax reform significantly promotes enterprises’ cross-regional investment activities, and this effect is transmitted through two parallel channels: the increase in regional pollution compliance costs and the alleviation of green financing constraints for enterprises [
10]. The impact of the tax reform also shows significant heterogeneity characteristics along dimensions such as enterprise capital intensity, regional fiscal situation, and local environmental regulation enforcement intensity, which provides micro-level empirical evidence for the applicability of the two classical hypotheses in China’s institutional context [
11,
12].
The rest of this paper is structured as follows:
Section 2 reviews the relevant literature, constructs the theoretical analysis framework, and proposes research hypotheses,
Section 3 introduces the data sources, variable measurement, and empirical model design,
Section 4 reports the baseline regression results, robustness test results, heterogeneity analysis findings, and mechanism test results, and
Section 5 discusses the research conclusions, policy implications, and the limitations of this study in terms of sample composition, variable measurement accuracy, and the complete causal chain of the financing constraint channel.
3. Research Design
All statistical analyses in this study are performed using Stata 18.0, with standard errors clustered at the provincial level to address potential heteroskedasticity and intra-group serial correlation.
3.1. Model Specification
3.1.1. Baseline Regression Model
This study takes the implementation of China’s Environmental Protection Tax Law as a quasi-natural experiment and adopts the difference-in-differences (DID) approach to quantitatively evaluate the causal effect of this policy reform on firms’ cross-regional investment decisions. The baseline econometric specification is constructed as follows:
where i and t represent year and firm, respectively; the core explanatory variable is the interaction term Treat × Post; the dependent variable is
;
is the set of control variables;
are the coefficients of each term;
and
represent firm and year fixed effects, respectively; and
is the random disturbance term. Standard errors are clustered by province to account for heteroskedasticity and within-province serial correlation.
3.1.2. Model of the Mediation Effect of Pollution Costs
To identify the underlying transmission channel through which environmental tax reform affects corporate cross-regional investment, this study first tests the mediating role of pollution cost pressure. Drawing on the analytical frameworks of prior studies, we construct a three-way difference-in-differences (DDD) model to examine whether the policy effect varies systematically with the pollution cost burden faced by firms. The specific model specification is
represents a firm’s pollution cost pressure, defined as the composite cost burden arising from environmental regulatory compliance, including direct tax expenditures, pollution treatment costs, and associated adaptation investments. Under the environmental tax reform, regional variations in tax rates create heterogeneous compliance cost pressures: firms in high-tax provinces face steeper cost increases, while those in low-tax provinces experience milder pressure. When the cost differential between the home province and potential destination provinces becomes sufficiently large, firms have an incentive to relocate investments to regions with lower environmental compliance costs.
In terms of variable measurement, our main indicator for is a binary dummy variable, which takes the value of 1 if a firm’s operating cost is above the annual industry median, and 0 otherwise. This measurement is based on the rationale that the environmental tax reform imposes heavier compliance burdens on pollution-intensive enterprises, which will be reflected in their relatively higher operating costs compared to industry peers. This median-split approach effectively distinguishes between firms facing high and low pollution cost pressure and covers the full sample without relying on specialized environmental disclosure data. Considering that operating costs also include non-environmental components such as labor, raw materials, and logistics expenses, which may introduce measurement bias, we adopt two alternative proxy variables for robustness checks. The first alternative is the ratio of a firm’s actual environmental protection investment to its total assets, with data sourced from the environmental investment disclosure module of the CSMAR database. This indicator directly captures the resources allocated by firms to environmental compliance and is more conceptually aligned with the definition of pollution cost pressure. The second alternative is emission intensity, measured as the ratio of SO2 emissions to operating revenue, with data obtained from the CNRDS China Environmental Database. This output-based indicator reflects the inherent pollution intensity that drives the difference in compliance costs across firms. We expect consistent estimation results across all three measurement specifications if the pollution cost mechanism is valid. It should be noted that limited by the availability of public corporate environmental data in China, none of the above indicators can perfectly capture the theoretical construct of pollution cost pressure caused by the environmental tax reform; therefore, we report results for all specifications to ensure the robustness of mechanism inference.
3.1.3. Model of the Mediation Effect of Financing Constraints
To further test the second transmission channel, we construct another DDD model to examine whether the policy effect is heterogeneous across firms with different levels of financing constraints [
40,
41].
This model aims to identify how financing constraints moderate the impact of environmental tax reform on cross-regional investment. The core variable
measures the degree of financing constraints faced by firms in year, which reflects the difficulties firms encounter when accessing external funds, including high borrowing costs, limited credit channels, and insufficient loan availability. The theoretical basis of this mechanism is that the environmental tax reform has promoted the establishment of cross-departmental environmental information-sharing platforms and standardized corporate environmental disclosure requirements, which may reduce the information asymmetry between banks and enterprises, lower the environmental risk premium for high-quality firms, and expand credit access for enterprises with better environmental performance [
42].
Our primary measure for FC is a binary dummy variable based on the WW index, which takes the value of 1 if a firm’s WW index is above the sample median, and 0 otherwise [
43,
44]. The WW index is a widely used composite measure of financing constraints that incorporates multiple firm characteristics, including size, profitability, dividend policy, leverage, and industry growth, capturing the multidimensional nature of firms’ external capital access. The binary conversion is adopted for two reasons: first, it facilitates clear identification of heterogeneous treatment effects between firms with high and low financing constraints in the DDD framework, where the coefficient of the triple interaction term Treat × Post × FC reflects whether firms facing more severe financing constraints exhibit a larger investment response to the reform; second, this approach is consistent with the operational practice in recent related studies. To address the potential information loss caused by converting a continuous index into a binary indicator, we employ two alternative measurement specifications in robustness checks. The first alternative retains the continuous WW index in the triple interaction model, which preserves the full information of the original index and interprets the interaction coefficient as the change in policy effect per unit increase in financing constraint level. The second alternative uses the SA index constructed as SA = −0.737 × Size + 0.043 × Size
2 − 0.04 × Age, where Size is the natural logarithm of total assets, and Age is the number of years since the firm’s establishment. A key advantage of the SA index is that it is calculated solely using two relatively exogenous firm characteristics (size and age), which are unlikely to be affected by the environmental tax reform, thus avoiding potential endogeneity issues associated with the WW index, which incorporates outcome variables such as profitability and leverage. We expect consistent directional results across all three specifications if the financing constraint mechanism holds, despite possible variations in coefficient magnitude and statistical significance [
45,
46,
47].
3.2. Variable Selection
3.2.1. Cross-Regional Investment
The dependent variable in this study is firm cross-regional investment (Invest). Following the approach in existing literature, this variable is measured by counting the number of domestic subsidiaries established by listed companies outside their province of registration.
The dependent variable is measured as the number of domestic subsidiaries established outside the province of registration. This measure captures the breadth of firms’ geographic expansion and aligns precisely with the provincial-level policy variation. We acknowledge that the subsidiary count reflects geographic breadth rather than investment depth; our robustness analysis therefore employs three alternative specifications: LN_Invest (log of the subsidiary count plus one), Invest_ratio (share of out-of-province subsidiaries), and Invest_capital (log of the total registered capital of out-of-province subsidiaries).
3.2.2. Environmental Protection Tax Reform
The primary explanatory variable is the environmental tax reform interaction (Treat × Post). After the Environmental Protection Tax Law came into effect in 2018, provincial governments were authorized to set specific tax rates within the statutory range, leading to heterogeneous rate adjustments across regions. Specifically, 12 provincial administrative regions maintained the original pollution discharge fee standards unchanged under the new environmental tax framework, while 19 provincial administrative regions raised tax rates above the original fee levels. Based on this policy variation and following the grouping method of prior studies, we construct the Treat dummy variable, which takes the value of 1 if a firm is registered in a province that raised environmental tax rates (treatment group), and 0 if it is registered in a province that kept rates unchanged (control group). The Post dummy variable is set to 1 for observations from 2018 onwards (the post-reform period) and 0 for observations before 2018 (the pre-reform period).
This variable design leverages the strong exogeneity of provincial tax rate decisions, the clear policy implementation time point, and the substantial cross-regional variation to identify the causal effect of the reform. The validity of our DID identification strategy relies on two key assumptions. The first is the parallel trends assumption, which requires that cross-regional investment trends of treatment and control group firms would have been parallel in the absence of the reform. We formally test this assumption using event-study methodology in
Section 4.2.1, and find no evidence of pre-treatment divergence between the two groups. The second is the conditional independence assumption, which requires that treatment assignment (operating in a province with raised tax rates) is independent of potential outcomes after controlling for covariates and fixed effects. This assumption is plausibly satisfied for three reasons: first, provincial tax rate decisions were made by provincial people’s congresses in December 2017 based on macro-level factors, including regional environmental carrying capacity, pollution status, and socio-economic development goals, rather than the investment decisions of individual firms, ensuring the exogeneity of treatment assignment; second, the policy was implemented nationwide on 1 January 2018 simultaneously, eliminating potential biases caused by staggered adoption timing correlated with local economic conditions; third, tax rate setting was a top-down political process involving multiple provincial departments, leaving limited room for individual firms to influence the final outcome. We further address potential threats to identification through a series of robustness tests, including PSM-DID matching, placebo tests, exclusion of anticipation effects, and alternative sample compositions, all of which confirm the stability of baseline results [
48].
3.2.3. Control Variables
To mitigate the impact of confounding firm characteristics on cross-regional investment decisions, we include a set of control variables covering firms’ basic attributes, financial conditions, and governance structures. Specifically, the control variables include firm age (Age), firm size (Size), debt-to-asset ratio (Lev), return on assets (Roa), shareholding ratio of the largest shareholder (Top1), operating revenue growth rate (Growth), board size (Board), current ratio (Liq), return on equity (ROE), CEO-chairman duality (Plu), proportion of independent directors (Indratio), net operating cash flow (Cash), management expense ratio (Mfee), separation of ownership and control rights (Separa), and proportion of institutional investors (Inst_ratio). As noted in the model specification section, all regressions control for firm fixed effects and year fixed effects to absorb unobserved time-invariant firm heterogeneity and common time shocks. Definitions of all key variables are summarized in
Table 1.
3.3. Data Sources and Sample Selection
This study takes all A-share listed companies in China from 2012 to 2024 as the initial research sample. The data used in this study are collected from multiple sources: first, the geographic distribution data of subsidiaries are manually compiled from the notes of “long-term equity investments” in the annual reports of listed parent companies, following the method of prior studies, and a subsidiary is defined as a cross-regional investment if its registration province is different from that of the parent company; second, firm-level financial and governance data are obtained from the CSMAR database; third, provincial environmental tax rate data are manually collected from official policy documents and public announcements of provincial development and reform commissions and ecological environment departments; fourth, provincial-level macroeconomic data are sourced from the official website of the National Bureau of Statistics of China and provincial statistical yearbooks.
To ensure data reliability and the validity of empirical results, we filter the initial sample according to the following criteria: (1) exclude firms that were under special treatment (ST or *ST) during the sample period; (2) exclude observations with missing values for key variables; (3) exclude listed companies in the financial and insurance industries due to their unique accounting standards; (4) exclude firms whose registration place or main business location changed across provinces during the sample period to avoid the interference of relocation decisions; (5) winsorize all continuous variables at the 1st and 99th percentiles to eliminate the impact of extreme values. After the above screening process, we obtain a final sample of 40,965 firm-year observations for empirical analysis.
Table 2 reports the descriptive statistics of key variables. The dependent variable, Invest, has a mean value of 9.3773, indicating that sample firms established an average of approximately 9 out-of-province subsidiaries during the observation period. Its standard deviation is 16.333 with a coefficient of variation of 1.74, reflecting substantial heterogeneity in cross-regional investment scales across firms. The minimum value of 0 and the maximum value of 107 further confirm that some firms do not conduct any cross-regional investment, while some large enterprises have realized a nationwide strategic layout through extensive subsidiary establishment. The treatment group dummy Treat has a mean of 0.7373, meaning that 73.73% of sample firms are located in provinces that raised environmental tax rates, providing a sufficiently large treatment group for policy effect identification. The policy period dummy Post has a mean of 0.6229, indicating that 62.29% of observations are from the post-reform period, with relatively balanced distribution of observations before and after the policy implementation to support dynamic effect analysis. The statistics of all control variables are within reasonable ranges: firm age covers different development stages, the average debt-to-asset ratio is 0.4186 with a maximum of 0.91 within the normal range for listed companies, and the average return on assets is 3.36%, consistent with the overall profitability profile of Chinese listed firms. No abnormal distributions are observed for other governance and financial indicators, ensuring the reliability of subsequent regression analyses.
4. Empirical Results and Analysis
4.1. Baseline Regression
Table 3 reports difference-in-differences (DID) estimates capturing the causal effect of the environmental protection tax reform on firms’ cross-regional investment activities. Column (1) presents unadjusted estimates without control variables; column (2) incorporates firm- and year-fixed effects to account for time-invariant firm-specific heterogeneity and common year-level shocks; column (3) adds the full set of firm-level and provincial-level covariates specified in the empirical model. Across all three specifications, the coefficient of the core interaction term Treat × Post remains positive and statistically significant at the 1% level, providing direct empirical support for Hypothesis 1 that the reform exerts a positive effect on firms’ cross-regional investment.
Beyond statistical significance, the economic magnitude of the estimate is critical for evaluating the reform’s practical impact. The coefficient of 0.822 in the fully specified model (column 3) indicates that, on average, firms located in provinces that raised environmental tax rates after the reform established 0.82 additional out-of-province subsidiaries relative to firms in provinces that maintained pre-reform tax rate levels. To contextualize this effect: the sample mean of the dependent variable, Invest, is 9.38 subsidiaries, so the 0.82 increase corresponds to an 8.7% rise in cross-regional investment activity. Relative to the sample median of 4 subsidiaries, the effect translates to a 20.6% increase, demonstrating that the reform’s impact is particularly pronounced for firms at the median level of geographic expansion. This 8.7% estimated effect falls within the 5–10 percentage point range of increased relocation probability for polluting enterprises due to interprovincial environmental tax differentials reported in prior work, confirming the external validity of the baseline findings. Combined, these figures indicate a moderate-to-large economic effect, confirming that the environmental protection tax reform has materially altered the spatial allocation of corporate investment across Chinese provinces.
4.2. Robustness Tests
4.2.1. Parallel Trends Test
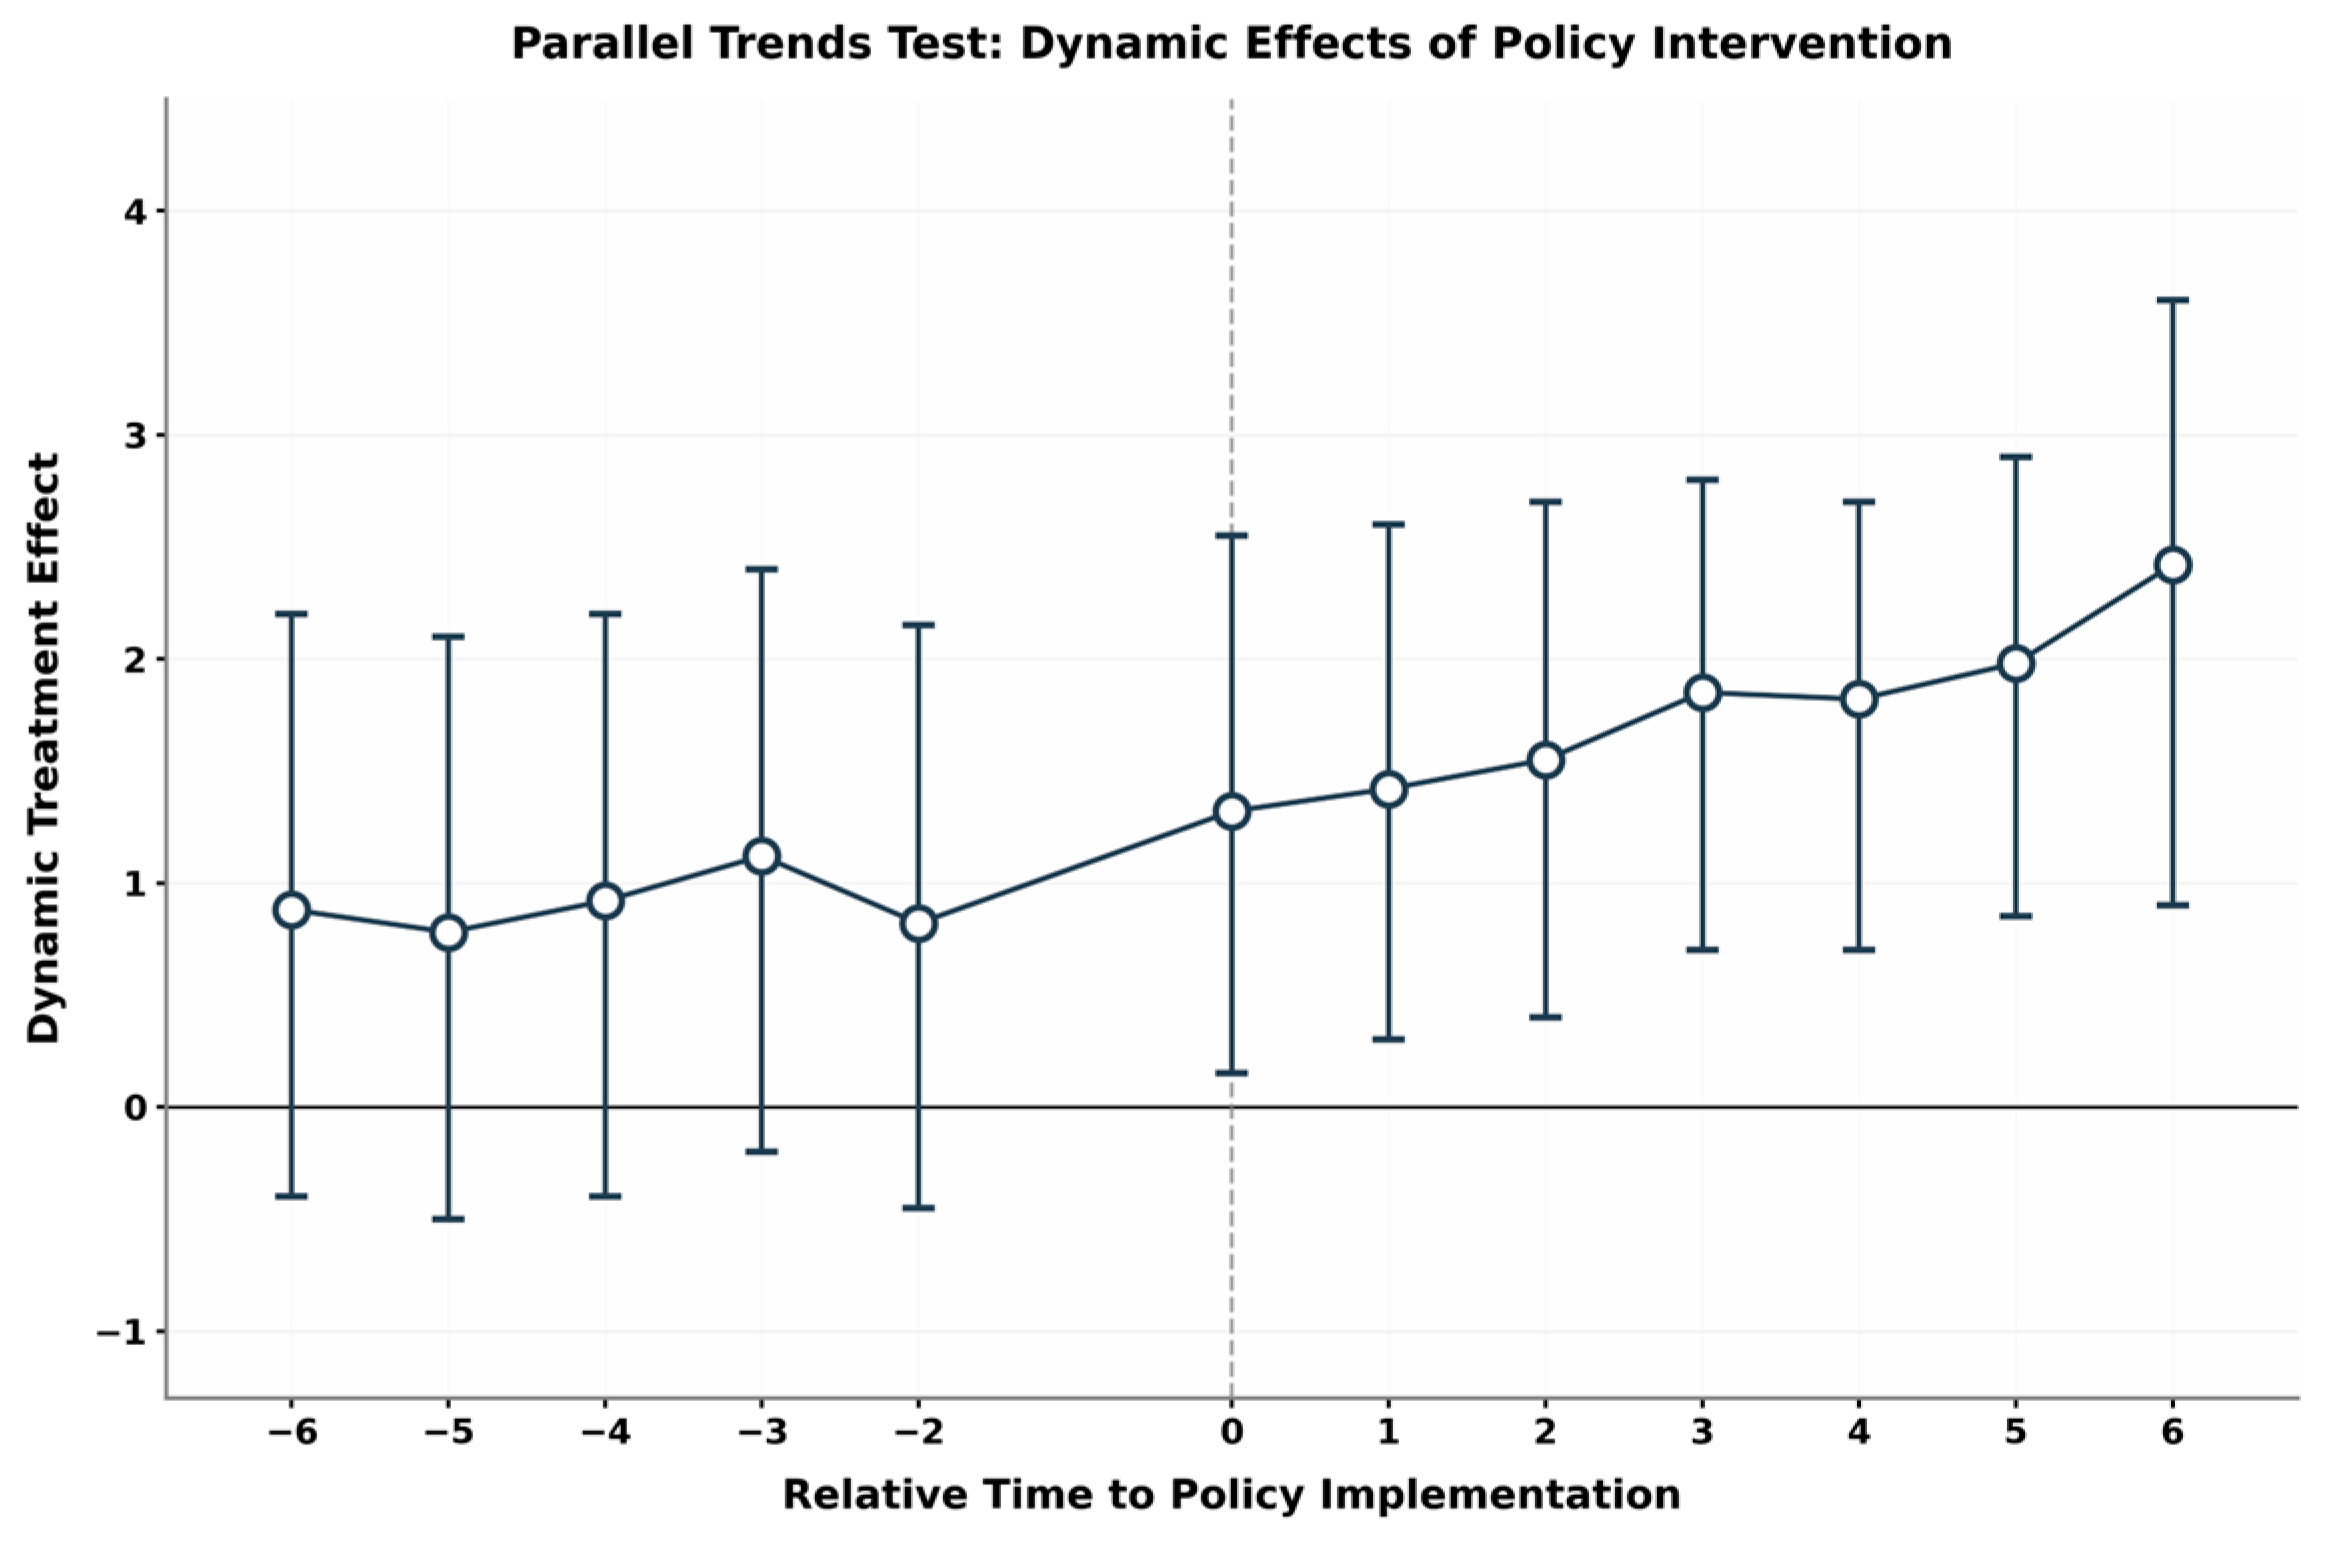
The validity of the DID identification strategy rests on the parallel trends assumption, which requires that cross-regional investment trajectories of treated and control firms follow statistically indistinguishable patterns prior to policy implementation. This study employs an event study framework to test this assumption, constructing interaction terms between treatment group status and year dummies to capture temporal differences in outcome variables between the two groups. To avoid multicollinearity with the full set of year fixed effects, the period immediately preceding the reform (2017) is set as the baseline reference period and omitted from the regression, so all estimated coefficients represent effects relative to this pre-policy benchmark.
Figure 1 presents the event-study estimates of the dynamic treatment effects. Estimation results confirm that all interaction coefficients for periods prior to 2018 are statistically insignificant at conventional levels, with 95% confidence intervals consistently containing zero. This finding verifies that no systematic pre-trend differences exist between the treatment and control groups, satisfying the parallel trends assumption and validating the causal interpretation of the baseline DID estimates.
4.2.2. PSM-DID
To address potential concerns that systematic observable differences between treated and untreated firms prior to the reform may bias the baseline estimates, this study adopts the propensity score matching (PSM) DID (PSM-DID) framework as a robustness check. Given heterogeneous treatment effects in the multi-period DID setting, the panel is converted to cross-sectional observations for matching, with all baseline covariates included in the propensity score estimation. Three matching algorithms—1:1 nearest neighbor matching, radius matching, and kernel matching—are applied to construct matched samples, with regressions re-estimated on each matched subsample.
As reported in
Table 4, the Treat × Post coefficient remains positive and statistically significant at the 1% level across all three matching specifications [
49]. This consistency confirms that the baseline results are not driven by observable pre-treatment differences between the treatment and control groups.
4.2.3. Placebo Test
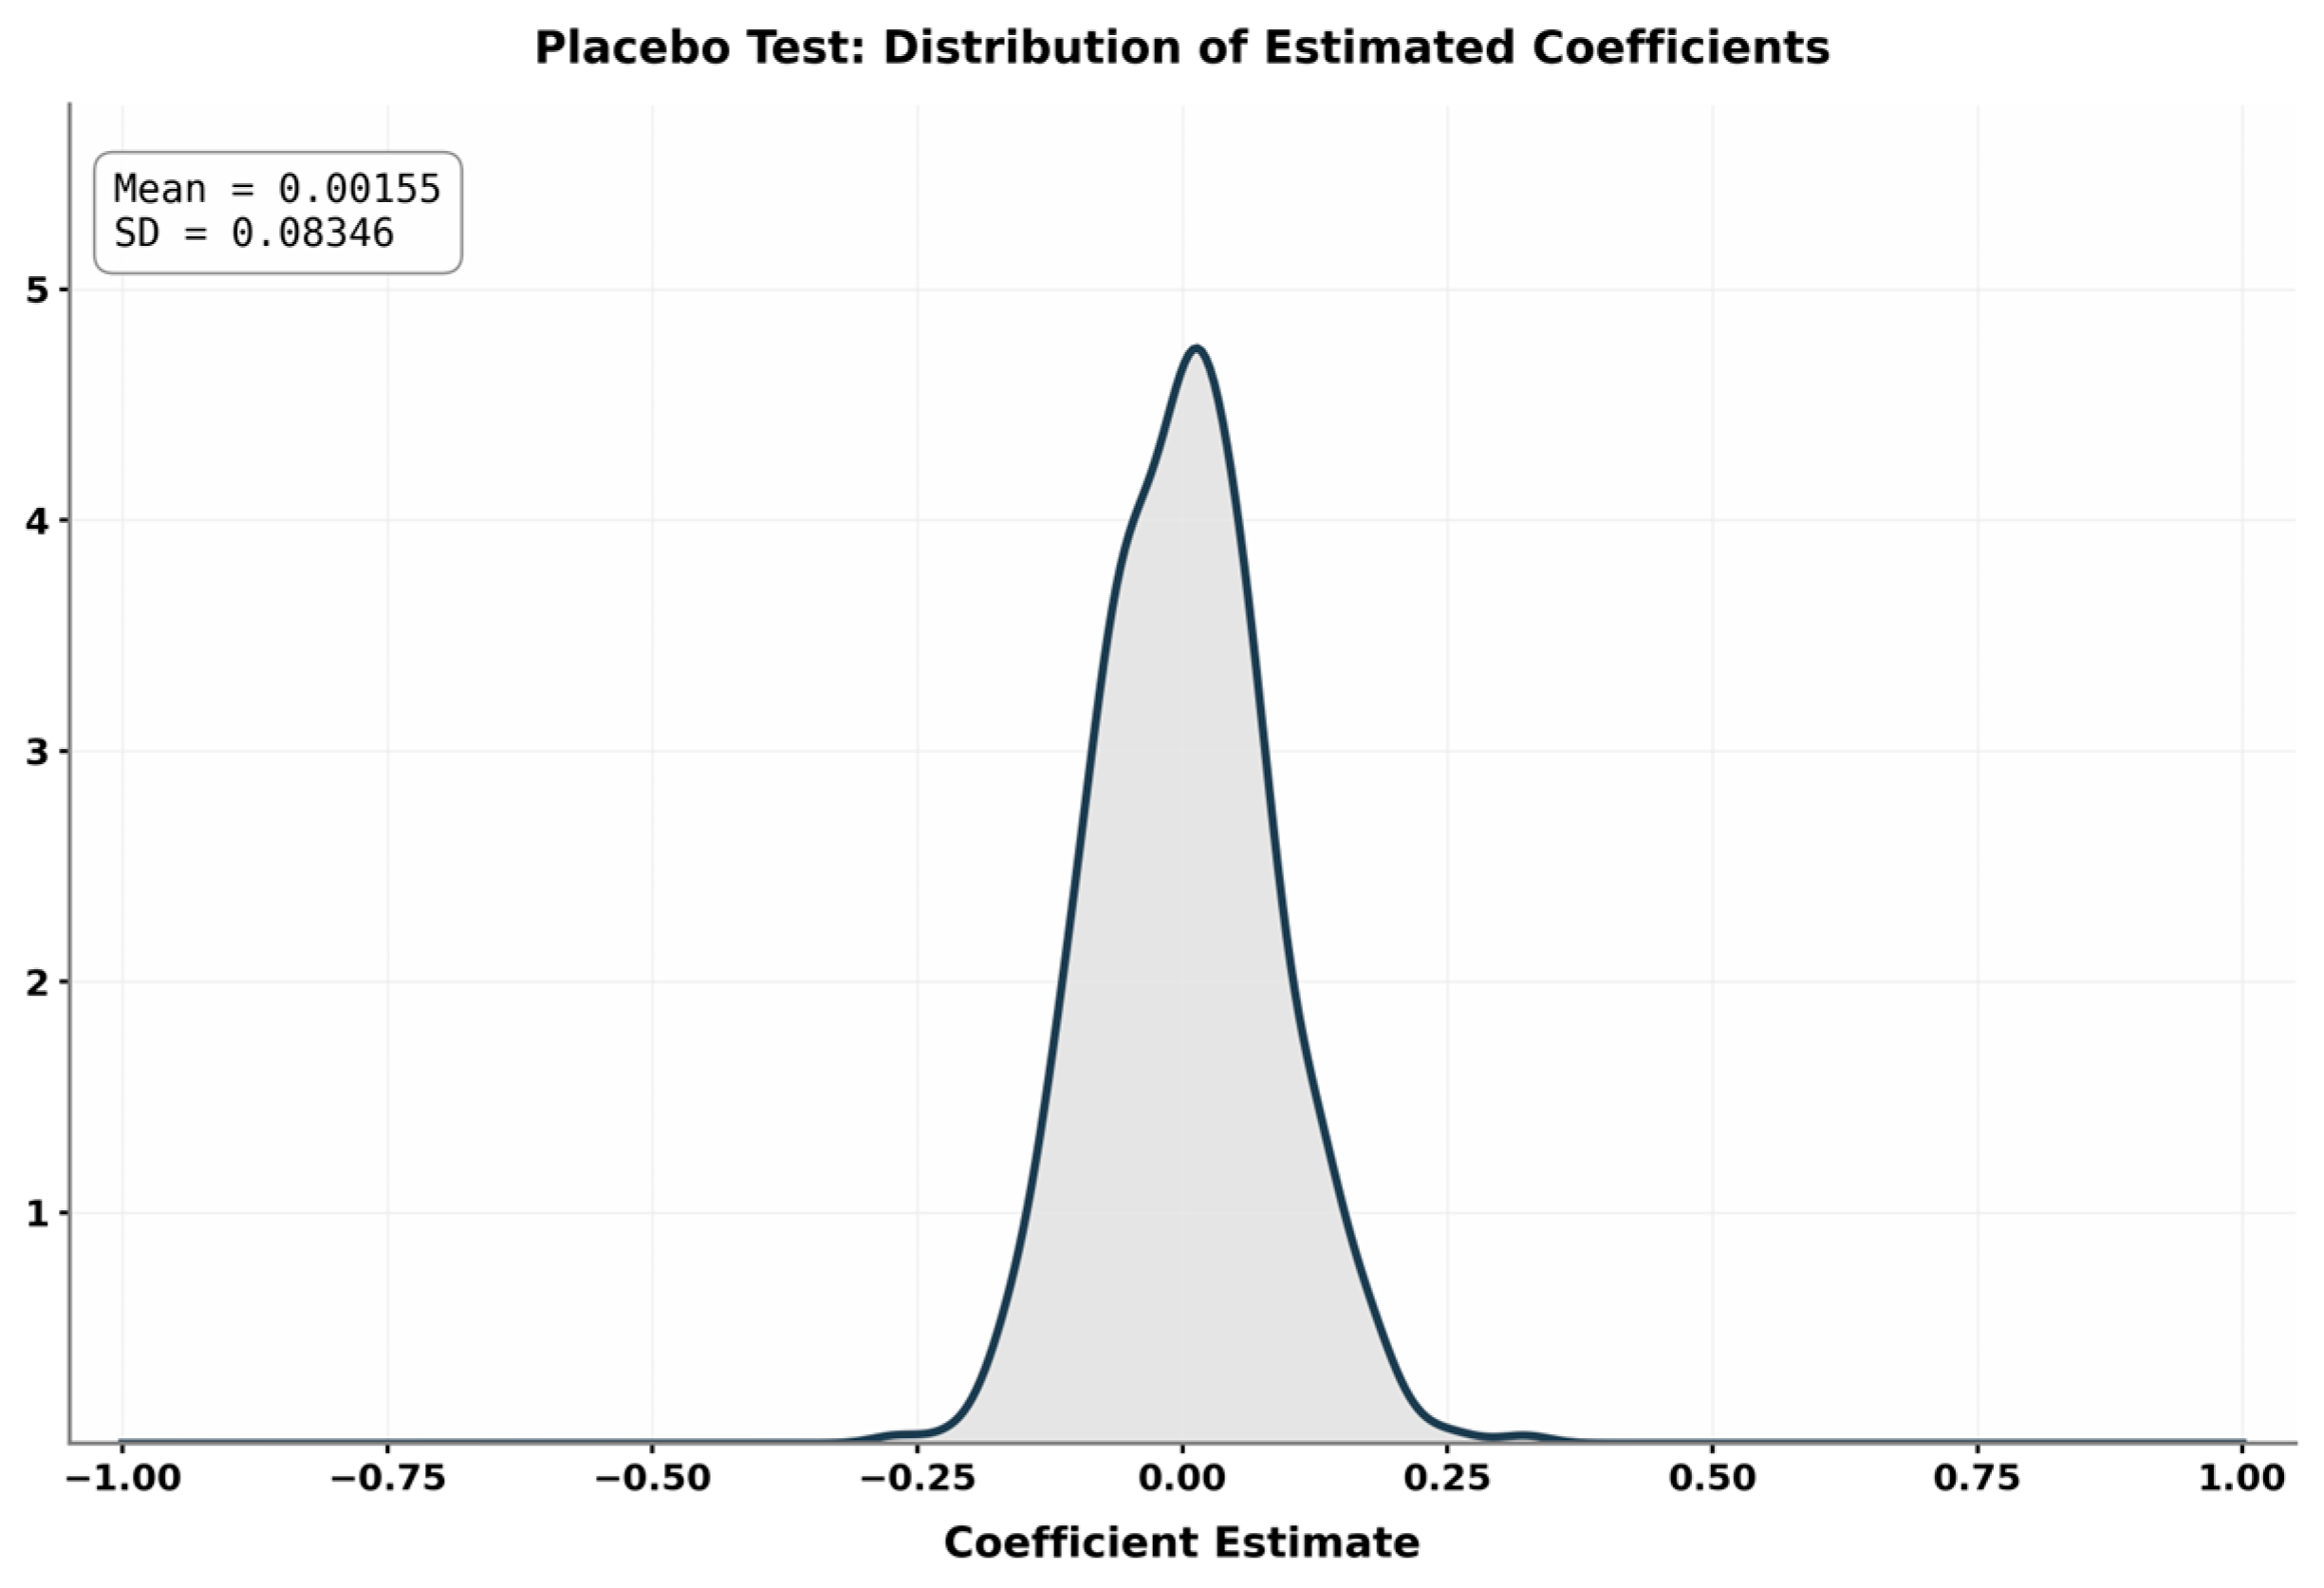
A placebo test with random treatment assignment is conducted to rule out the possibility that the baseline results are driven by unobserved random shocks or omitted variables. The test procedure holds the official reform implementation timeline constant but randomly assigns hypothetical environmental tax rate adjustments to provinces to generate 500 pseudo-treatment groups.
Figure 2 plots the distribution of the 500 placebo coefficients.
The resulting distribution of 500 placebo coefficients approximates a standard normal distribution with a mean value close to zero, and the actual baseline estimate of 0.822 lies in the far right tail of this distribution. This result confirms that the observed effect of the reform is unlikely to be a product of random chance, further validating the robustness of the core conclusions.
4.2.4. Controlling for Concurrent Policy Interference
Two potential policy shocks overlapping with the environmental protection tax reform are addressed to isolate the net policy effect. First, the 2014 Notice on Adjusting Pollution Discharge Fees mandated all provinces to raise the sulfur dioxide discharge fee standard to no less than 1.26 yuan per pollution equivalent by June 2015, with 15 provinces completing the adjustment ahead of schedule in early 2015 and the remainder implementing the change by the June 2015 deadline. The staggered implementation of this policy may confound estimates of the 2018 reform effect, so all 2015 observations are excluded from the sample, and the model is re-estimated. Results reported in columns (1) and (2) of
Table 5 show the Treat × Post coefficient remains 0.811 and significant at the 1% level, indicating no material change to the core conclusion after accounting for this prior policy shock.
Second, the 2015 Action Plan for Water Pollution Prevention and Control (the “Water Ten Measures”) introduced overlapping environmental governance requirements that may affect firms’ investment decisions, with effects potentially extending into the reform implementation period. To isolate the reform’s net effect from this confounding policy, all observations from 2015 and earlier are excluded, restricting the sample to the 2016–2020 period. Re-estimation results reported in columns (3) and (4) of
Table 5 show the Treat × Post coefficient is 1.844 and remains significant at the 1% level, confirming the positive effect of the reform persists after adjusting for this overlapping policy shock.
4.2.5. Other Robustness Tests
Two additional robustness checks are conducted to address sample composition and measurement sensitivity. First, the sample scope is adjusted in two separate specifications.
Table 6 reports the results of the sample adjustment tests. In the first adjustment, observations from Hebei, Shanghai, and Shandong provinces are excluded. These three provinces raised pollution discharge fee standards in 2017, one year prior to the formal implementation of the environmental protection tax law, potentially creating policy anticipation effects that could bias treatment group assignment. Re-estimation on the remaining sample yields a Treat × Post coefficient of 0.892, significant at the 1% level, consistent with baseline results. In the second adjustment, observations from the four centrally administered municipalities (Beijing, Tianjin, Shanghai, and Chongqing) are excluded, as these jurisdictions exhibit systematic differences from other provinces in policy enforcement, economic structure, and regulatory intensity. The re-estimated coefficient is 0.650, remaining positive and significant at the 1% level, confirming that the results are not driven by the unique characteristics of these municipalities.
Second,
Table 7 presents the results using alternative measures of the dependent variable. The first proxy is the natural logarithm of the number of out-of-province subsidiaries plus 1 (LN_Invest), capturing the absolute scale of cross-regional investment. The second proxy is the share of out-of-province subsidiaries in a firm’s total subsidiary count (Invest_ratio), measuring the relative importance of cross-regional investment in the firm’s overall portfolio. The third proxy is the natural logarithm of the total registered capital of out-of-province subsidiaries plus 1 (Invest_capital), capturing the financial scale of cross-regional investment activities. Regressions using these three alternative dependent variables all yield positive and statistically significant coefficients on Treat × Post: 0.054 (significant at 1%) for LN_Invest, 0.022 (significant at 1%) for Invest_ratio, and 0.269 (significant at 10%) for Invest_capital. These consistent results across multiple measurement approaches confirm the core conclusion is not sensitive to the specific operationalization of cross-regional investment.
4.3. Mechanism Test
Table 8 reports the results of the mechanism tests using triple interaction specifications. The coefficient on the triple interaction term Treat × Post × Cost in column (2) is 0.645, statistically significant at the 1% level. This result indicates that firms facing higher pollution cost pressure exhibit a stronger cross-regional investment response to the reform, supporting Hypothesis 2. In economic terms, this coefficient implies that the reform’s effect on cross-regional investment is 0.645 subsidiaries larger for firms with above-median pollution costs than for firms with below-median pollution costs, corresponding to a 6.9% additional increase relative to the sample mean of Invest. This magnitude confirms that pollution cost pressure is not only statistically significant but also economically meaningful as a transmission channel for the reform’s effect.
The coefficient on the triple interaction term Treat × Post × WW in column (4) is −0.537, statistically significant at the 1% level. Since higher WW index values indicate more severe financing constraints, this negative coefficient implies that firms with looser pre-reform financing constraints exhibit a stronger cross-regional investment response to the reform, supporting Hypothesis 3. Economically, this differential effect corresponds to a 5.7% additional increase in cross-regional investment for firms with below-median financing constraints relative to their more constrained counterparts, reflecting the critical role of financing capacity in enabling firms to act on cross-regional relocation incentives.
It is important to note that the financing constraint mechanism operates conditionally. The binary WW index specification captures the average effect across heterogeneous firm subgroups but cannot fully disentangle countervailing effects: firms with strong environmental performance may gain improved access to green credit following the reform, while high-polluting firms may face tightened credit conditions despite enhanced information transparency.
4.4. Heterogeneity Test
This section analyzes heterogeneous effects of the reform across three dimensions identified in the theoretical framework: firm-level capital intensity, local fiscal pressure, and local environmental regulatory intensity. All heterogeneity tests use median splits of the relevant moderating variables for subsample regression.
4.4.1. Firm Level
Following prior work, capital intensity is measured as the ratio of fixed assets to the number of employees, with firms split into above-median (high) and below-median (low) capital intensity subsamples. Regression results reported in
Table 9 show that the Treat × Post coefficient is 1.897 and significant at the 1% level for the high capital intensity subsample, but statistically indistinguishable from zero for the low capital intensity subsample. A between-group coefficient difference test confirms this heterogeneity is statistically significant at the 10% level. This pattern arises because capital-intensive firms have higher pollution emission intensities and face larger increases in tax burdens under the reform, while the high sunk costs of on-site emission reduction technology upgrades make cross-regional relocation a more cost-effective adaptation strategy. In contrast, low-capital-intensive firms face smaller tax shocks and greater operational flexibility, allowing them to adjust to the reform through internal optimization rather than geographic relocation. The 1.897 coefficient for high-capital-intensity firms corresponds to a 20.2% increase in cross-regional investment relative to the sample mean, highlighting that capital-intensive firms are the primary drivers of the spatial capital reallocation induced by the reform.
4.4.2. Government Level
Following existing research, local fiscal pressure is measured as the ratio of (fiscal expenditure minus fiscal revenue) to fiscal revenue, with provinces split into above-median (high) and below-median (low) fiscal pressure subsamples. Results reported in
Table 10 show that the Treat × Post coefficient is 2.932 and significant at the 1% level for the low fiscal pressure subsample, but 0.373 and statistically insignificant for the high fiscal pressure subsample. The between-group difference is statistically significant at the 5% level. This pattern reflects that local governments with low fiscal pressure have greater administrative capacity and fiscal flexibility to enforce the environmental protection tax strictly, leading firms to face the full statutory tax burden and stronger relocation incentives. In contrast, governments facing high fiscal pressure may adopt lenient enforcement practices to protect local tax bases and employment, effectively neutralizing the reform’s cost pressure on local firms. The 2.932 coefficient for low fiscal pressure regions corresponds to a 31.2% increase in cross-regional investment relative to the sample mean, nearly four times the size of the baseline average effect.
4.4.3. Regulatory Aspects
Following prior methodology, local environmental regulatory intensity is measured as the proportion of environment-related terms in annual provincial government work reports, with provinces split into above-median (high) and below-median (low) regulatory intensity subsamples. Results reported in
Table 11 show that the Treat × Post coefficient is 2.012 and significant at the 1% level for the high regulatory intensity subsample, but 0.704 and statistically insignificant for the low regulatory intensity subsample. The between-group difference is statistically significant at the 5% level. This pattern demonstrates that the reform’s effect is amplified in regions with strict complementary environmental enforcement, where the tax operates as part of a comprehensive regulatory regime that creates strong compliance pressure. In regions with weak enforcement, firms can absorb or circumvent the tax burden without relocating. The 2.012 coefficient for high regulatory intensity regions corresponds to a 21.4% increase in cross-regional investment relative to the sample mean, approximately 2.4 times the baseline average effect.
5. Conclusions and Implications
5.1. Main Conclusions
Taking the implementation of the 2018 Environmental Protection Tax Law as an exogenous policy shock, this study empirically investigates the influence of this regulatory reform on firms’ cross-regional investment decisions and the underlying transmission mechanisms, based on 40,965 firm-year observations of China’s A-share-listed enterprises spanning the period from 2012 to 2024. The core findings of the research provide systematic answers to the three core questions raised at the outset of the study, as outlined below.
First, the environmental protection tax reform has exerted a significant positive effect on the cross-regional investment scale of firms located in provinces where applicable tax rates were raised following the reform. Quantitatively, the average treatment effect corresponds to an 8.7% increase in cross-regional investment relative to the sample mean. This core conclusion remains robust across a series of validity tests, including event-study analysis to verify the parallel trend assumption, placebo tests with randomly assigned treatment groups, propensity score matching combined with difference-in-differences (PSM-DID) estimation to address selection bias, control for the confounding effects of concurrent policy initiatives implemented during the sample period, adjustments to the sample inclusion criteria to exclude potentially anomalous observations, and substitution of the dependent variable with alternative measures of cross-regional investment.
Second, mechanism analysis identifies two distinct and parallel transmission pathways through which the reform affects cross-regional investment. The first is the pollution cost channel: the rise in environmental tax rates directly increases firms’ environmental compliance costs in their original locations, creating strong incentives for firms to relocate part of their production capacity to jurisdictions with lower environmental tax burdens to reduce operating expenditures. The second is the financing constraint channel: the standardized environmental tax collection and information disclosure system introduced by the reform improves the information transparency of firms’ environmental performance, effectively reducing information asymmetry between firms and financial institutions and expanding access to green credit resources for eligible enterprises, thus providing sufficient financial support for their cross-regional expansion activities. Notably, the operation of this financing pathway is not universal but conditional on firms’ actual environmental performance and their corresponding risk assessment results in the credit evaluation system of financial institutions.
Third, the impact of the environmental protection tax reform on cross-regional investment exhibits significant heterogeneity across different firm characteristics and regional institutional contexts. Specifically, capital-intensive firms show a far stronger investment response to the tax reform, with their cross-regional investment scale increasing by 20.2% relative to the sample mean; this is because the high sunk costs associated with end-of-pipe emission reduction upgrades in existing production sites make cross-regional relocation a comparatively more cost-effective strategy for such firms. In addition, firms located in regions with lower fiscal pressure and stricter environmental law enforcement also exhibit larger increases in cross-regional investment, highlighting that the actual effectiveness of environmental tax policy is critically dependent on the local government’s institutional capacity and long-term commitment to consistent regulatory enforcement [
50].
5.2. Policy Recommendations
The empirical findings outlined above yield targeted policy implications that are directly aligned with the observed patterns of cross-regional investment responses to the environmental tax reform, without extending to institutional design issues beyond the scope of the study’s evidence.
Our results confirm that interprovincial tax rate differentials drive capital flows, creating a tension between local environmental goals and the national objective of building a unified market. While provincial autonomy in rate-setting allows tailored environmental policies, the resulting capital mobility may undermine environmental effectiveness if firms relocate rather than reduce pollution. Policymakers should consider establishing interregional coordination mechanisms—such as minimum effective tax floors or interprovincial revenue-sharing arrangements—to prevent “race-to-the-bottom” competition while preserving local flexibility.
The finding that fiscal pressure attenuates policy effectiveness highlights the need for central-level enforcement standards and oversight. Relying solely on local governments’ voluntary compliance may be insufficient, particularly in fiscally constrained regions where enforcement forbearance is tempting. The central government could consider establishing dedicated funding for environmental tax administration in high-need regions and implementing routine compliance audits.
The financing constraint mechanism operates heterogeneously across firms with different environmental performance. While the environmental tax information-sharing platform improves credit access for environmentally responsible firms, it may tighten financing for heavy polluters. Policymakers should design differentiated green credit policies that provide transitional financing support to firms actively undertaking emission reduction upgrades, avoiding a “one-size-fits-all” approach that could force viable firms into premature exit while merely shifting pollution across provincial borders.
Capital-intensive firms exhibit the strongest relocation responses due to their high sunk costs of on-site upgrading. Policymakers should provide targeted transition support—including technology upgrading subsidies, workforce retraining programs, and reasonable phase-in periods—to guide these firms toward “relocation as upgrading” rather than simple pollution transfer.
5.3. Limitations and Directions for Future Research
This study has several limitations that warrant acknowledgment. The sample covers all A-share listed companies, and a large proportion of non-polluting or low-emission enterprises naturally exhibit lower sensitivity to the environmental protection tax, which may dilute the estimated policy impact. While limiting the sample to heavily polluting industries could enhance homogeneity, it would also diminish the study’s value for assessing the policy’s general applicability. Future research could explore weighted regression approaches that assign greater weight to pollution-intensive industries.
This study has several limitations. First, the sample includes many non-polluting firms that are naturally less sensitive to the reform, potentially diluting the estimated effects. Second, our mechanism variables rely on proxy measures subject to measurement error; future research with direct environmental expenditure data could enhance precision. Third, the causal chain of the financing constraint channel—from information-sharing platforms to improved bank credit—relies on statistical correlations rather than direct institutional evidence. Finally, our analysis captures short-to-medium-term effects (2018–2024); long-term consequences for relocated subsidiaries and host-region environments await further research.