1. Introduction
Evaluating quality of life (QoL) in Ulaanbaatar requires understanding both the city’s physical conditions and residents’ subjective experiences during rapid urban growth. Since 2000, the capital population has more than doubled, currently comprising 49.5% of Mongolia’s total population. Urban expansion has been dramatic yet uneven. From 1990 to 2017, the urbanized area increased threefold, followed by a 78.4% increase from 2009 to 2019. While high-density development increased 34-fold from 2017 to 2020, ger areas expanded only marginally, highlighting widening spatial inequality [
1,
2,
3,
4].
In response to these transformations, urban policy has attempted to guide Ulaanbaatar’s future growth. The “Amendments of the Ulaanbaatar 2020 Master Plan and Development Approaches for 2030” set a strategic direction for urban development [
5]. It promotes decentralization through new settlement zones and subcenters supported by infrastructure investment. Since 2013, more than 10,000 apartment units have been built, and nearly 2000 households have relocated to central ger districts as part of middle and high-rise redevelopment. In middle-zone
ger areas (traditional Mongolian relocatable dwellings and self-built houses, often characterized by limited infrastructure, lower service accessibility, and comparatively poor environmental conditions), land readjustment projects have improved infrastructure access for 200–300 households per site, according to international valuation and compensation models [
6].
Despite multiple urban policy efforts, implementation has remained inconsistent. Spatial and demographic transformation has created significant urban challenges, including severe air pollution, unregulated land use, chronic traffic congestion, soil contamination, infrastructure overload, and spatial inequality [
7,
8,
9]. These pressures are reflected in critical environmental and economic costs: PM2.5 concentrations that exceed the World Health Organization (WHO) 24 h guideline by more than 100 times [
10], whereas traffic congestion alone led to MNT 2.7 trillion (≈USD 945.9 million, on the basis of the 2023 average rate) in lost productivity in 2021, approximately 11% of Ulaanbaatar’s GDP [
11]. Natural hazards such as floods [
12] and fires [
13] highlight vulnerabilities in disaster preparedness and environmental governance.
Drawing on the environment–behavior perspective [
14,
15], this study treats urban development type as a structural context that shapes residents’ subjective quality of life through three interrelated pathways. The first concerns infrastructure and service provision, whereby the type and completeness of urban development determine residents’ access to roads, utilities, transport, healthcare, and education. The second involves environmental exposure, as different development contexts generate distinct patterns of air quality, noise, green space availability, and neighborhood esthetics. The third encompasses residential experience, including housing quality, tenure security, length of residence, and social interaction density, all of which contribute to place attachment and well-being. Importantly, urban development type is not conceptualized as a direct cause of life satisfaction but as a conditioning context that determines which factors matter and to what degree, which motivates the comparative, stratified analytical approach adopted in this study.
QoL is a comprehensive indicator that integrates the urban development, social well-being, and everyday experiences of residents. Spatial transformation via urbanization, infrastructure pressure, and environmental degradation not only reshapes the physical environment but also directly and indirectly influences residents’ life satisfaction and well-being [
14,
16]. An examination of the QoL therefore makes it possible to assess the outcomes of urban development not only in terms of economic growth, infrastructure provision, or construction intensity but also in terms of how residents perceive and evaluate these changes.
In urban contexts, QoL is influenced by challenges such as infrastructure gaps [
17,
18,
19], informal settlements [
20,
21], environmental degradation [
9,
22], and unequal access to public services [
23,
24,
25]. In contrast, developed urban settings often emphasize factors such as mobility [
26,
27,
28], environmental esthetics [
28,
29,
30], and psychological well-being [
31,
32].
Recent studies have increasingly emphasized the central role of urban form in shaping the quality of urban life (QoUL), particularly through its influence on spatial equity and perceived livability. Refs. [
33,
34] reported that greenness and land use diversity are among the most influential factors of life satisfaction, particularly for older adults and residents in high-density areas. Ref. [
20] reported that urban sprawl contributes to regional inequality despite perceived environmental benefits in suburban areas. Ref. [
28] reported that street quality and esthetics, rather than simple accessibility, are more strongly tied to walkability and satisfaction. Ulaanbaatar’s specific studies [
9,
35] show that air pollution significantly decreases life satisfaction, whereas social and environmental conditions vary sharply between apartment districts and ger districts. On the basis of evidence from Hong Kong, ref. [
36] reported that compared with housing availability alone, housing quality, particularly comfort, space adequacy, and safety-related conditions, was more closely associated with mental well-being.
In many studies, objective indicators such as infrastructure quality, environmental conditions, housing characteristics, and access to services reflect tangible urban features. Furthermore, subjective indicators such as life satisfaction, perceived safety, and emotional well-being capture residents’ lived experiences and perceptions. This dual approach allows for a more nuanced understanding of how physical environments and psychological responses interact to shape the QoUL.
Structural equation modeling [
20,
28,
29,
36,
37,
38,
39,
40,
41,
42], principal component analysis [
19,
35,
43,
44], and factor analysis are typically used to explore these multidimensional relationships [
19,
35,
43,
44]. In addition, ordered logit models are being increasingly used to analyze life satisfaction and QoL outcomes when dependent variables are measured on ordinal scales, making them particularly suitable for evaluating overall and domain-specific satisfaction categories [
45,
46]. Spatial methods such as GIS and remote sensing further enable researchers to assess spatial variations and contextual effects on both objective and subjective QoUL dimensions [
22,
23,
33,
47,
48]. Multicriteria decision-making tools, such as the analytic hierarchy process (AHP) and best–worst method (BWM), support composite index construction [
44,
49,
50]. More recently, deep learning and remote sensing have enhanced data integration and indicator extraction [
33,
47,
51].
While the global literature on QoUL is extensive, empirical evidence from Ulaanbaatar remains notably limited. Existing studies have examined only narrow and isolated aspects of urban life rather than QoUL as a multidimensional urban phenomenon. For example, ref. [
35] focused primarily on validating the Mongolian WHOQOL-BREF as a measurement instrument, without examining the structural or spatial determinants of urban life. Similarly, ref. [
9] reported a negative association between particulate matter and life satisfaction, but their analysis was restricted to a single environmental stressor. As a result, previous research has remained fragmented, issue specific, and analytically limited. These existing studies fail to elucidate how distinct modes of urban expansion in Ulaanbaatar—ranging from urban sprawl and redevelopment to land readjustment and new development—engender disparate quality of urban life (QoUL) outcomes. Furthermore, the literature lacks a cohesive framework that connects the nexus between urban form, domain-specific living conditions, and aggregate life satisfaction. This theoretical deficit is particularly acute in the context of Ulaanbaatar, where rapid, heterogeneous urban transformation has catalyzed significant sociospatial fragmentation.
Addressing this gap is critical because Ulaanbaatar’s contrasting urban development patterns are likely to produce different combinations of service access, mobility constraints, environmental exposure, and residential conditions, all of which may shape residents’ quality of urban life in distinct ways. A comparative perspective across these developmental contexts can therefore provide a clearer understanding of how spatial inequalities are experienced in everyday life. Such evidence is essential for informing urban planning and policy, particularly in relation to housing, infrastructure, public services, transport, green space, and environmental management, not only in terms of physical provision but also in terms of their actual contribution to residents’ life satisfaction.
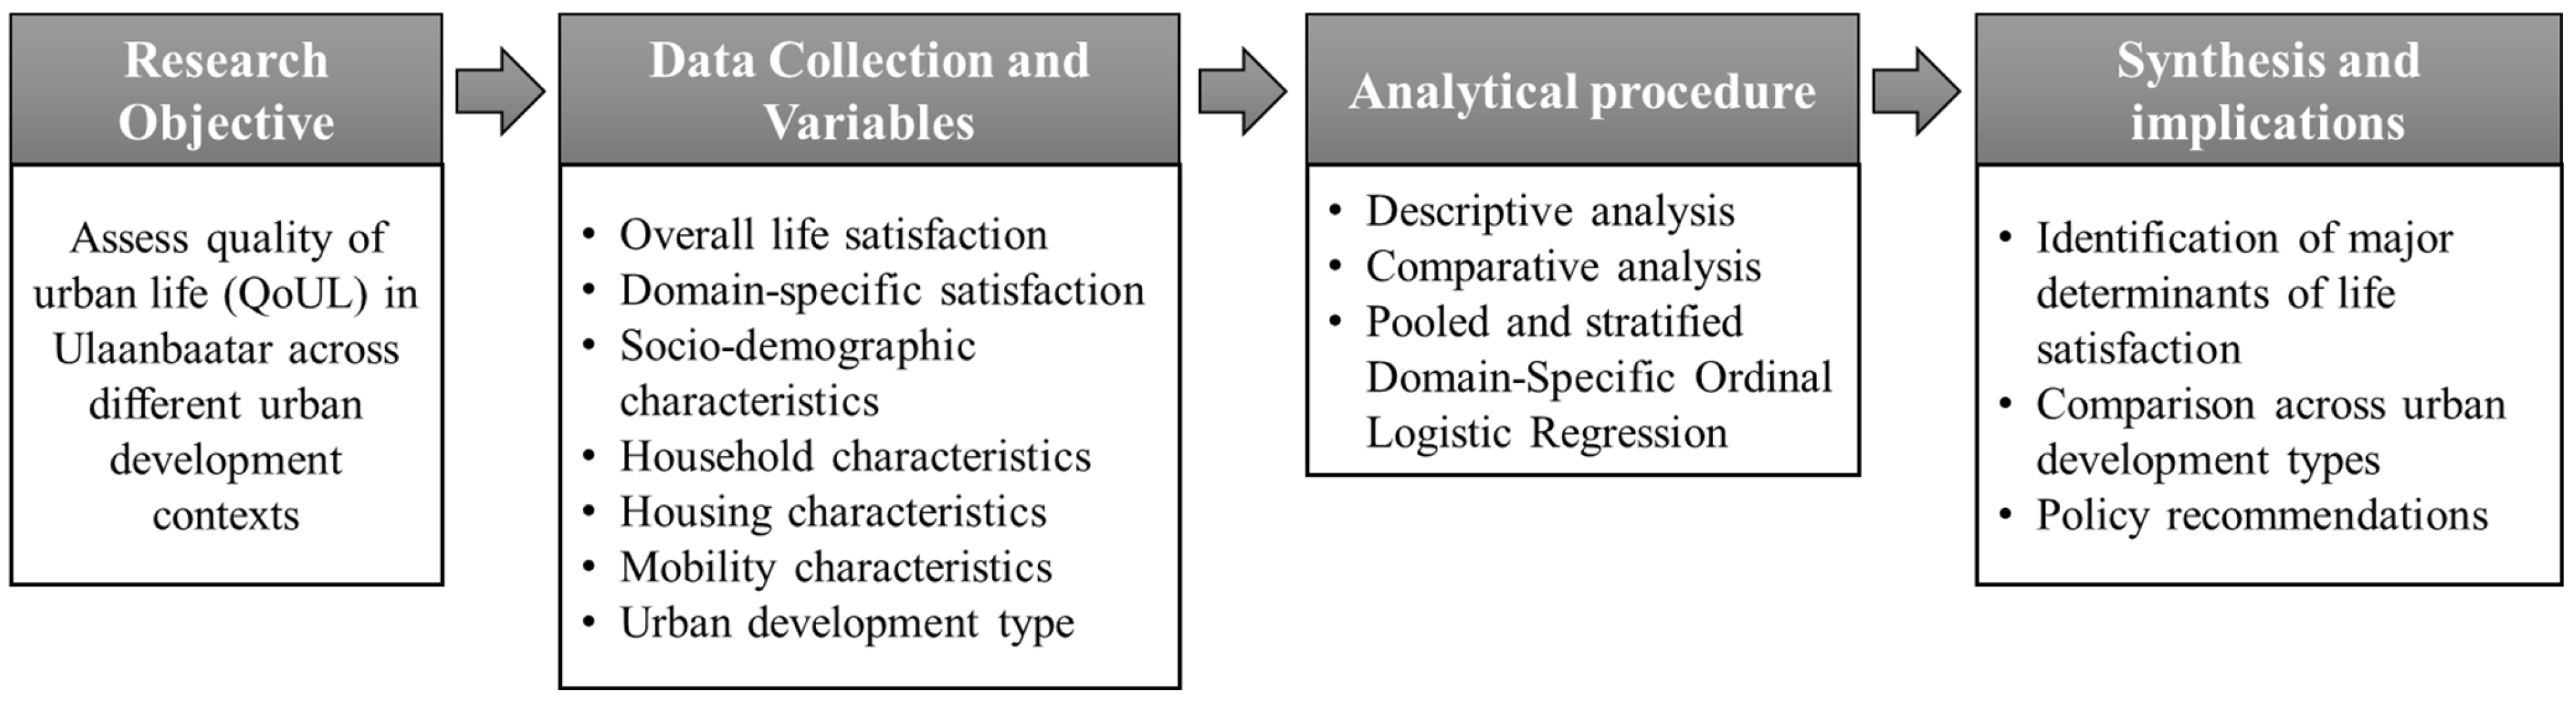
Accordingly, this study examines QoUL in Ulaanbaatar by explicitly considering the urban development context alongside sociodemographic, household, and mobility characteristics, as well as residents’ subjective evaluations of urban life, to provide a more integrated understanding of how urban conditions and development patterns are associated with both overall life satisfaction and domain-specific urban experiences, practical insights for policymakers and planners to design more context-sensitive interventions, prioritize investments in underserved areas, and improve the overall effectiveness of urban development policies.
This study makes three contributions to QoUL literature. First, it advances a development-type-specific analytical framework by demonstrating that urban form functions as a structural conditioning context for the relationship between household characteristics and life satisfaction. Second, while environmental quality and accessibility consistently predict life satisfaction in line with established QoUL theory, the present findings show that their relative weight is conditioned by the specific development form, thereby both corroborating and contextualizing existing urban livability models. Third, by drawing on evidence from a rapidly urbanizing post-socialist city, the study broadens the geographic scope of QoUL research beyond its predominant focus on European, East Asian, and South Asian contexts. The paper proceeds as follows.
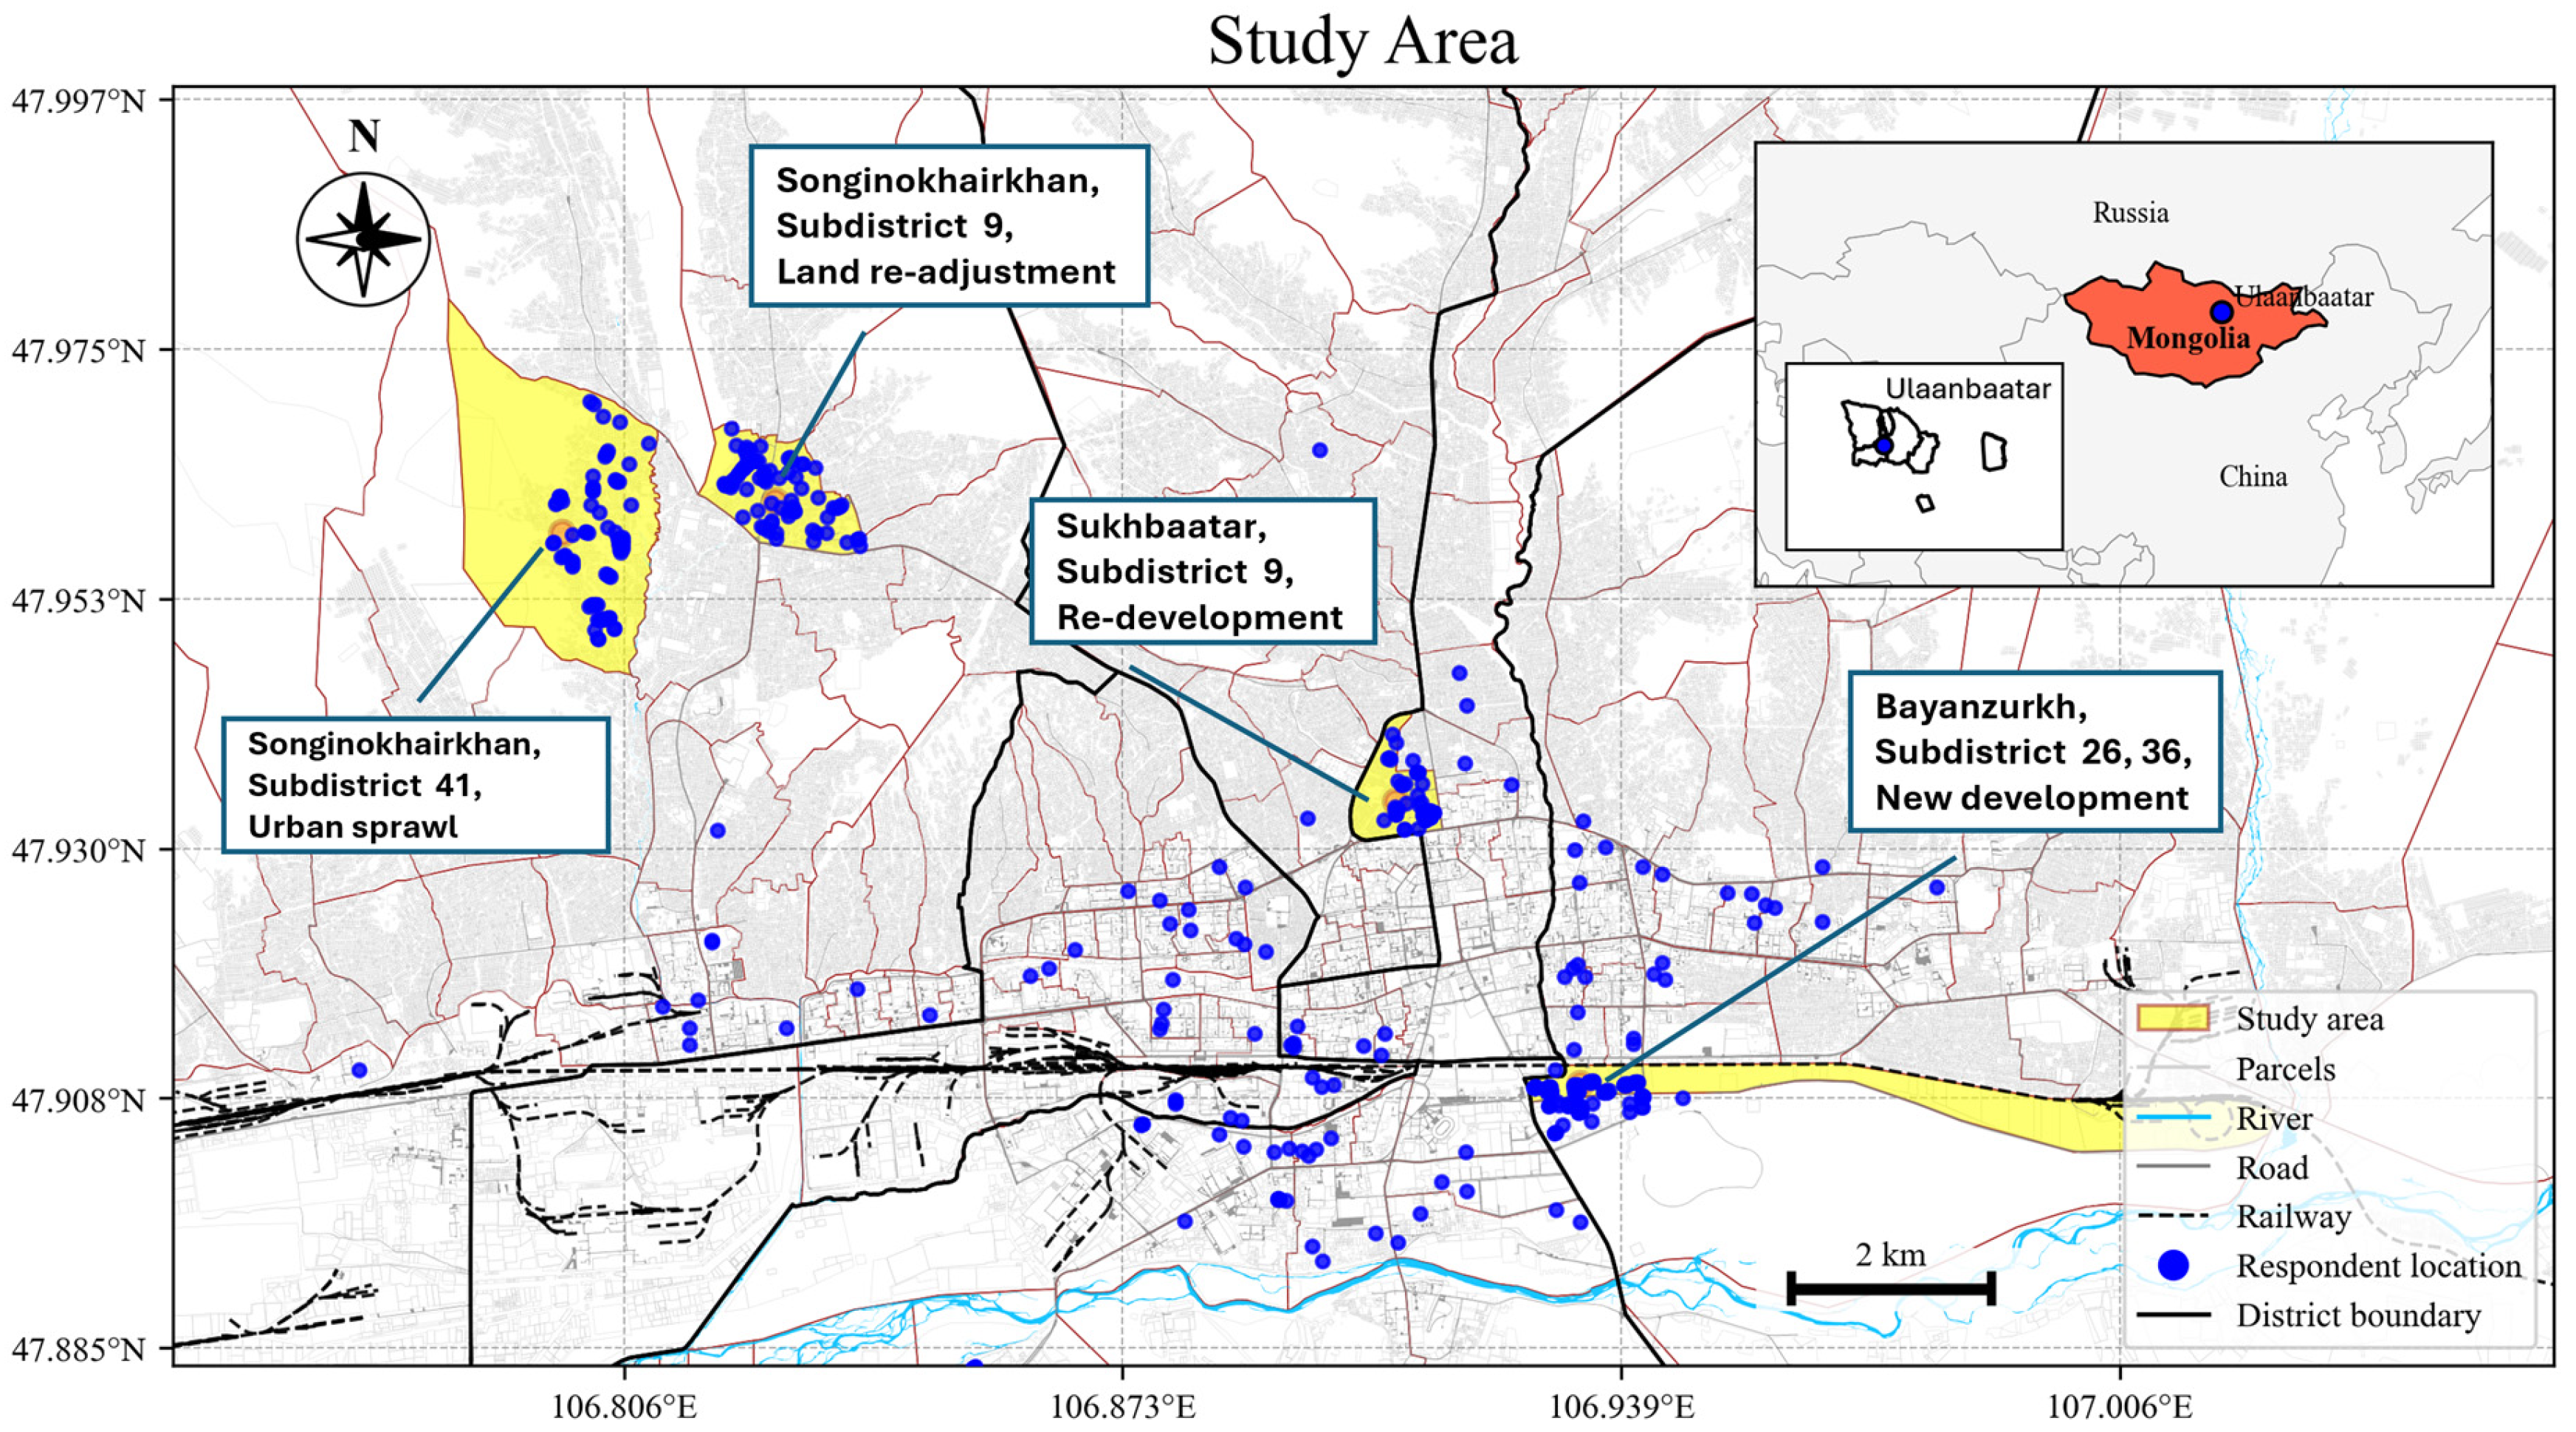
Section 2 describes the study area,
Section 3 presents the data and methods,
Section 4 reports the results,
Section 5 discusses their implications, and
Section 6 concludes with policy recommendations and directions for future research.
4. Results
4.1. Demographic and Socioeconomic Differences
A total of 529 complete responses were collected across five areas in Ulaanbaatar: new development (n = 178), redevelopment (n = 70), land readjustment (n = 77), urban sprawl (n = 82), and other areas (n = 122, including 85 online). The “Other areas” category was included to facilitate citywide comparison of overall life satisfaction levels but is not considered a spatially defined development type equivalent to the four study areas. Results for this category should therefore be interpreted within that context.
The demographic data revealed that 66% of the respondents were female, with the 36–45 age group being the most common. The new development and land readjustment zones had more working-age adults, whereas the Other Area category had older participants. Education levels varied widely; 67% of the new development respondents held bachelor’s degrees, whereas 57% held secondary degrees or fewer in urban sprawl. Public sector employment was most common overall (32%) but lowest in urban sprawl. The land readjusted areas had more self-employed and retired individuals.
Housing and infrastructure access reflected sharp disparities. In New development, 100% lived in apartments with full access to services. In contrast, 63% of urban sprawl and 29% of land readjustment lived in gers or simple housing with limited access to piped water, centralized heating, and sewage. Pit latrines and stove heating were still common.
Residence duration differed with respect to mobility. New development residents had shorter tenure (only 1% > 20 years), while 65% of land readjustment and urban sprawl residents lived there for more than 11 years. Migrants in new areas typically moved from other apartment districts, whereas those in peripheral zones received more from ger areas or rural regions.
Mobility patterns varied: 36% of urban sprawl residents commuted less than 15 min, whereas 45% of newly developed residents had commuted more than 30 min. Private car usage was highest in the new and redeveloped areas (35–37%), whereas walking and public transport dominated in the ger settlement areas.
4.2. Overall Life Satisfaction Across Urban Development Types
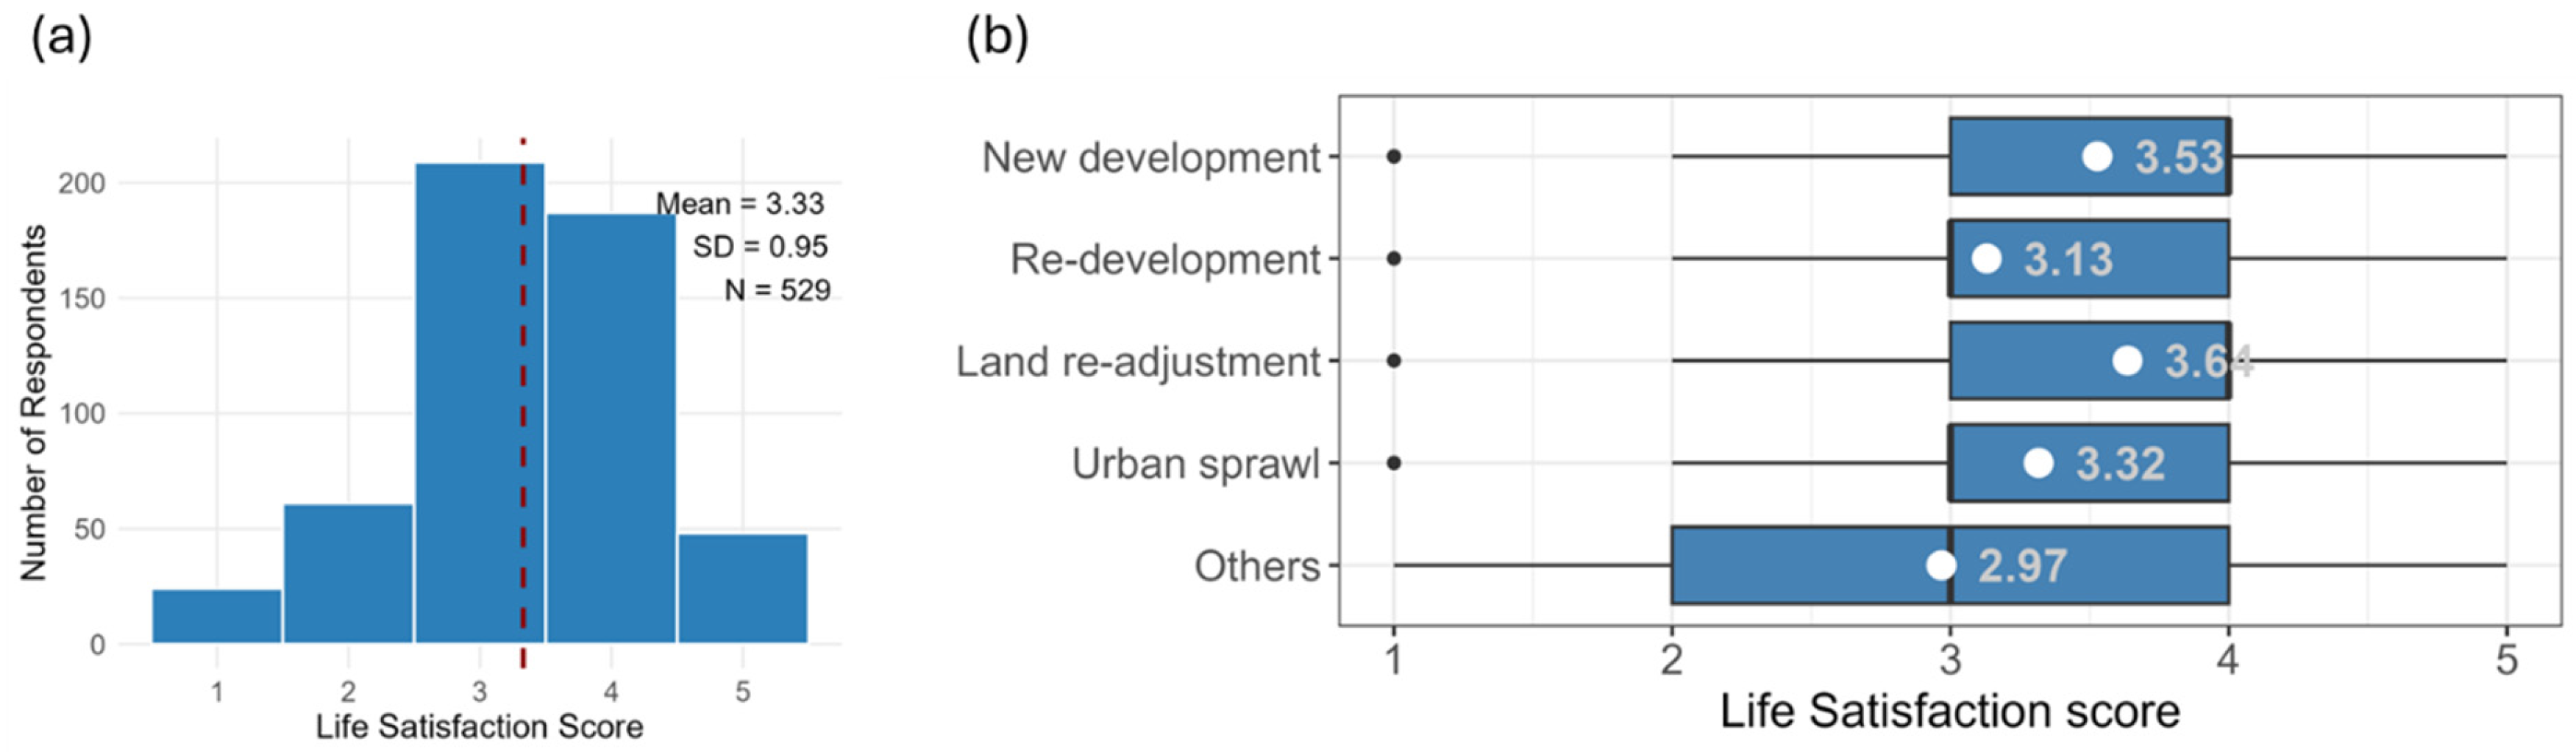
The distribution of overall life satisfaction among respondents is generally moderate, with the majority of respondents reporting neutral to positive evaluations, as shown in
Figure 3a. The largest proportion of participants selected a score of 3 (39.5%), followed by 4 (35.4%), while relatively small shares reported low satisfaction levels (1 = 4.5%, 2 = 11.5%). A median value of 3 further indicates that most respondents perceive their overall life satisfaction as moderate rather than extremely high or low. Overall, these results suggest a generally moderate but positively skewed perception of life satisfaction among urban residents.
Descriptive statistics showing the variation in overall life satisfaction across the five urban development types are presented in
Figure 3b. The land readjustment area scored highest in terms of mean life satisfaction (3.64), followed by the new development area (3.53). The urban sprawl area indicates moderate satisfaction (3.32), while the redevelopment areas report lower satisfaction (3.13), and the “others” category indicates the least satisfaction (2.97). The median values align with these statistics, indicating generally higher satisfaction in planned environments. With respect to new development, elderly males reported the highest level of satisfaction (3.95), with moderate differences noted across demographics and housing types. In the redevelopment area, 35–55-year-old females have the highest level of satisfaction (3.30), but the level of satisfaction is relatively consistent across demographics. The land readjustment area reflects varied levels of satisfaction among migrants, particularly for long-term residents from apartments. Life satisfaction in urban sprawl areas tended to be higher among older respondents, whereas the “others” category displayed uneven satisfaction levels, with the lowest mean observed among males younger than 35 years (2.46). Overall, planned developments exhibit higher and more stable life satisfaction, which differs sharply from the variability seen in unstructured environments.
4.3. Associations of Sociodemographic, Housing, and Mobility Characteristics with Overall Life Satisfaction
Table 1 reports ordinal logistic regression estimates for overall life satisfaction. The results indicate that significant predictors were selective rather than universal: higher educational attainment, longer residential duration, the presence of school-age children in the household, occasional public transport use, and urban development type each showed statistically significant associations with overall life satisfaction, while most other sociodemographic and mobility characteristics did not.
Age and sex were not significantly associated with overall life satisfaction. In contrast, education showed a clearer pattern: Compared with respondents with a junior high school education or below, those with higher education reported significantly lower overall life satisfaction, indicating that their odds of being in a higher life satisfaction category were approximately 70% lower. The mid-education group also had approximately 40% lower odds of being in a higher life satisfaction category, but the association was not statistically significant.
Residential duration was one of the clearest positive predictors. Compared with respondents who had lived in the area for 0–2 years, those who had lived there for 11–20 years had approximately 90% higher odds of being in a higher overall life satisfaction category, whereas those who had lived there for more than 20 years had approximately 150% higher odds. The odds of respondents with 3–5 years of residence were also approximately 60% greater, and those with 6–10 years of residence were approximately 40% greater, although these shorter residence categories were not statistically significant. Household composition produced more mixed results. Households without children aged 6–17 years had approximately 60% lower odds of higher life satisfaction. Compared with households with no children, households with two children had approximately 60% lower odds, those with three children had approximately 80% lower odds, and those with four children had approximately 70% lower odds of being in a higher overall life satisfaction category, with the strongest negative association observed among households with three children. However, family size was not significantly associated with overall life satisfaction. In this study, family size refers to the total number of household members, which may include grandparents and other co-residing relatives across multiple generations, and is conceptually distinct from the child-specific variables described above (children under 5 years; children aged 6–17 years).
Housing and mobility characteristics were selective rather than consistent predictors. Compared with respondents living in ger dwellings, those living in apartments had approximately 170% higher odds of reporting greater life satisfaction, although this association was only marginally significant, whereas those living in improved houses had approximately 430% higher odds, but this effect was not statistically significant. Commuting type and commuting time were not significantly associated with overall life satisfaction. Relative to respondents whose commuting time was less than 30 min, those whose commuting time was 30–60 min and more than 60 min each had approximately 10% lower odds of being in a higher overall life satisfaction category, but neither association was significant.
With respect to public transport use, compared with respondents who used public transport very infrequently, those who sometimes used public transport had approximately 40% lower odds of being in a higher overall life satisfaction category, and this association was statistically significant. In contrast, those who usually used public transport had approximately 10% higher odds, while those who always used public transport had approximately 20% lower odds, although neither association was statistically significant.
Income, origin, and participation in redevelopment projects did not emerge as significant predictors of overall life satisfaction. Relative to the reference groups, respondents in the middle- and high-income categories had approximately 10% and 40% lower odds, respectively, of being in a higher life satisfaction category, while respondents of rural origin had approximately 10% lower odds than those of urban origin did. In contrast, those who had not participated in redevelopment projects had approximately 10% higher odds of higher overall life satisfaction. However, none of these associations reached statistical significance.
4.4. Results for Life Satisfaction Across Urban Development Types
Stratified ordinal logistic regression results by urban development type refer to the analysis in which the sample is divided into different urban development categories, such as new development, redevelopment, land readjustment, urban sprawl, and others, and a separate ordinal logistic regression model is estimated for each group. This approach makes it possible to examine whether the factors associated with overall life satisfaction differ across urban development contexts.
The stratified models for the redevelopment (n = 69) and land readjustment (n = 77) subgroups are based on relatively small samples, limiting statistical power and increasing the likelihood of unstable coefficient estimates in the ordinal logit models.
Results from these models, particularly non-significant findings, should therefore be interpreted cautiously. The redevelopment and land readjustment models should be regarded as exploratory rather than confirmatory, and replication with larger samples is needed.
Compared with respondents living in new development areas, those residing in redevelopment areas had approximately 60% lower odds of being in a higher overall life satisfaction category, and this association was statistically significant. Similarly, respondents living in other urban development types had approximately 70% lower odds, which was also statistically significant. In contrast, those living in land readjustment areas had approximately 90% higher odds; this association was not statistically significant (OR = 1.9, p = 0.24). Those in urban sprawl areas had approximately 20% higher odds (OR = 1.2, p = 0.74); this estimate is too close to the null to support any meaningful directional interpretation and should not be read as a difference from new development.
In new development areas, relatively few variables were significant. Compared with the reference group, the respondents of rural origin had approximately 70% lower odds of reporting higher life satisfaction. Similarly, respondents in large families had approximately 80% lower odds of higher life satisfaction. In addition, those with a commuting time of 30 min to 1 h had approximately 60% lower odds of higher life satisfaction. These findings suggest that in new development areas, life satisfaction is shaped less by socioeconomic status and more by household burden, migration background, and daily mobility constraints.
In redevelopment areas, education appeared to be the strongest determinant. Compared with those in the reference category, respondents in the mid-level education category had approximately 90% lower odds of reporting higher life satisfaction. Those with high levels of education showed an even stronger negative association, with the odds of higher life satisfaction being close to zero. The other variables were not statistically significant at the 5% level, although some showed marginal tendencies toward higher life satisfaction. For example, female respondents had approximately 230% higher odds, those living in improved houses had approximately 1700% higher odds, and those who usually used public transport had approximately 730% higher odds. Overall, redevelopment areas appear to be characterized by stronger dissatisfaction among more educated residents, possibly reflecting higher expectations or unmet aspirations.
In land readjustment areas, residential duration and family structure emerged as especially significant. Compared with the reference group, residents who had lived in the area for 3–5 years had approximately 42,590% higher odds of higher life satisfaction, those residing there for 11–20 years had approximately 7960% higher odds, and those living there for more than 20 years had approximately 880% higher odds. Moreover, several child-related variables were negatively associated with life satisfaction. Households without children under five years of age had approximately 90% lower odds of higher life satisfaction, and households without children aged 6–17 years had odds that were close to zero.
Households with one, two, three, or six children also had substantially lower odds of higher life satisfaction. In addition, those who commuted by car had approximately 90% lower odds of higher life satisfaction. These results suggest that life satisfaction in land readjustment areas is highly differentiated by household composition and settlement duration. However, the extremely large percentage increases indicate likely sparse-cell or small-sample problems, so the magnitude should be interpreted with caution. Estimates marked with (
+) in
Table 1 require cautious interpretation because the extremely large odds ratios likely arise from quasi-complete separation caused by sparse cells in small subgroup samples and do not represent meaningful effect sizes. These estimates should be interpreted only in terms of the direction and statistical significance of the association.
In urban sprawl areas, long-term residence was the dominant predictor. Residents living in the area for 6–10 years had approximately 1110% higher odds of higher life satisfaction, while those residing there for more than 20 years had approximately 16,160% higher odds. Public transport use was also significant: respondents who usually used public transport had approximately 1210% higher odds of reporting higher life satisfaction. These findings suggest that in sprawling areas, life satisfaction depends strongly on both place attachment and functional mobility. Unlike in new development or redevelopment areas, socioeconomic and household variables were not significant.
In other areas, household and child-related variables were the most prominent predictors. Households without children under five years of age had approximately 80% lower odds of higher life satisfaction, and households without children aged 6–17 years had approximately 90% lower odds. Similarly, households with one, two, three, four, or five children all showed markedly lower odds of higher life satisfaction, with odds ratios close to zero and statistically significant p values in most cases. These patterns indicate that family structure is a central determinant of life satisfaction in this category. Some mobility-related variables were only marginally significant; for example, respondents who always used public transport had approximately 80% lower odds of higher life satisfaction. Overall, the pattern in these areas was dominated by household composition rather than commuting or socioeconomic status.
4.5. Variation in Determinants Across Urban Development Types
The stratified results in
Section 4.4 reveal four cross-cutting patterns that are not evident from any single model in isolation. First, the dominant predictor shifts systematically with urban form, such that place attachment (residential duration) governs satisfaction in established ger-type environments (land readjustment and urban sprawl), whereas household burden and commuting constraints are primary in newly built areas, and perceived adequacy relative to expectations drives dissatisfaction in redevelopment zones. Second, education operates as a consistent negative moderator in contexts undergoing physical transformation—redevelopment and, to a lesser extent, the pooled sample—but becomes negligible in more stable or peripheral environments, suggesting that dissatisfaction among educated residents is tied to unmet aspirations rather than to objective deprivation. Third, mobility exerts opposing effects depending on urban context, acting as a daily burden in higher-density, car-dependent new development areas yet functioning as an enabling resource that amplifies satisfaction in low-density urban sprawl where alternatives are scarce. Fourth, household composition produces its strongest and most consistent effects precisely where infrastructure lags behind family needs—land readjustment and other heterogeneous areas—while remaining largely insignificant in urban sprawl, where long-term social embeddedness appears to buffer the pressures of family life. These patterns collectively indicate that no single sociodemographic or mobility factor determines QoUL uniformly; rather, each operates within the structural opportunity set defined by its urban development context. Coefficient estimates for land readjustment, urban sprawl, and other subgroups that yield very large or near-zero odds ratios should be interpreted only in terms of direction and statistical significance, as their magnitude likely reflects sparse cells rather than substantive effect sizes (see
Section 4.4 and
Table 1 notes).
4.6. Domain-Specific Life Satisfaction
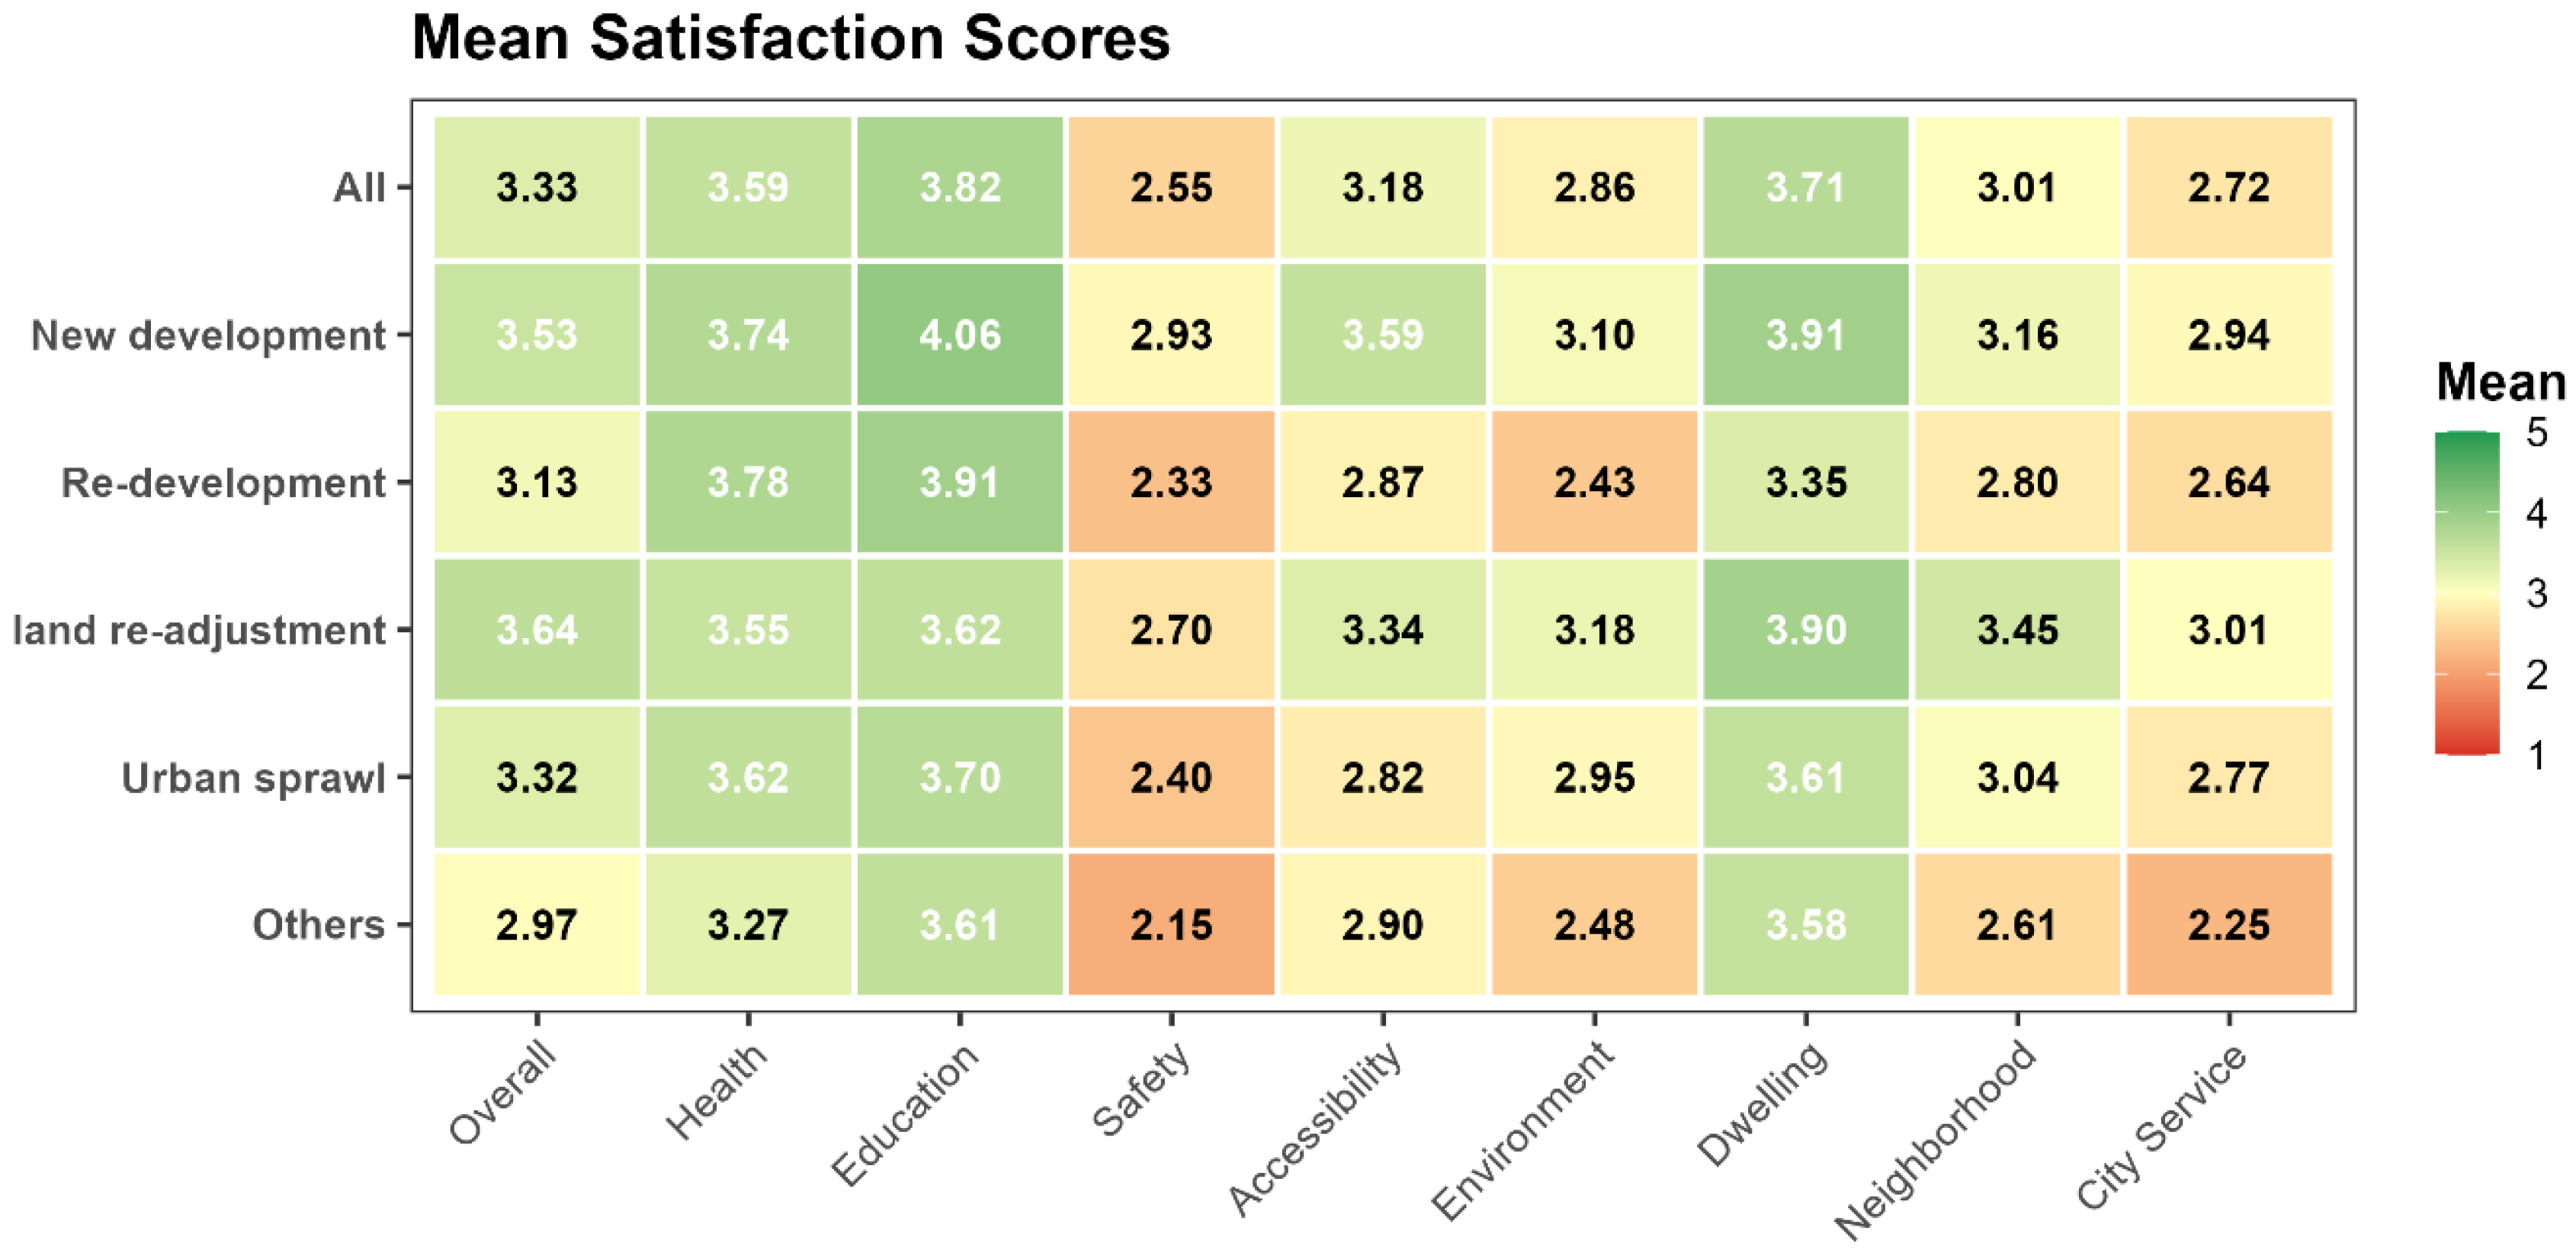
The mean domain satisfaction scores for the eight QoL dimensions across the five urban development types are presented in
Figure 4. Overall, new development areas exhibit the highest level of satisfaction across several domains, particularly in education (4.06), living conditions (3.91), and health (3.74), indicating relatively favorable living environments in recently planned neighborhoods. The land readjustment areas also have relatively high levels of satisfaction in multiple domains, especially in terms of dwelling (3.90) and neighborhood conditions (3.45), suggesting that coordinated land restructuring and infrastructure improvements contribute positively to residential quality.
In contrast, redeveloped areas display lower levels of satisfaction in several dimensions, particularly safety (2.33), environmental quality (2.43), and accessibility (2.87), despite relatively high levels of satisfaction with health (3.78) and education (3.91). Overall, urban sprawl areas have moderate levels of satisfaction, with relatively higher scores for dwelling (3.61) but lower scores for safety (2.40) and accessibility (2.82). The “other” development category consistently records the lowest level of satisfaction across several domains, particularly safety (2.15), environmental quality (2.48), and city services (2.25), indicating more heterogeneous or less favorable urban conditions.
Across all development types, education and dwelling conditions receive higher satisfaction scores, whereas safety and city services consistently have lower values, suggesting that improvements in urban safety, environmental quality, and service provision remain key priorities for enhancing overall QoUL.
Table 2 presents the ordinal logit model results for the association between domain-specific satisfaction and overall life satisfaction across the five urban development types.
In new development areas, several domains were significant positive predictors of overall life satisfaction. Greater satisfaction with accessibility was associated with a 120% increase in the odds of being in a higher life satisfaction category, whereas environmental satisfaction and dwelling satisfaction were the strongest predictors, corresponding to 250% and 270% increases in the odds, respectively. Satisfaction with health and neighborhood also had significant positive effects, increasing the odds of higher overall life satisfaction by 80% and 60%, respectively. In contrast, satisfaction with education, safety, and city services was not significantly associated with overall life satisfaction.
In the redevelopment areas, accessibility satisfaction was the most influential predictor, increasing the odds of higher overall life satisfaction by 210%. Dwelling satisfaction was also significant, corresponding to a 140% increase in the odds (). Environmental satisfaction showed a marginally significant positive association, with a 100% increase in the odds of higher life satisfaction. The other domains were not significantly different.
In land readjustment areas, higher overall life satisfaction was significantly associated with several domains. Environmental satisfaction showed one of the strongest relationships, increasing the odds of higher life satisfaction by 260%. Accessibility satisfaction and dwelling satisfaction were associated with 100% and 80% increases in the odds, respectively. In contrast, health satisfaction was associated with a 40% decrease in the odds of being in a higher overall life satisfaction category. Education, safety, neighborhood, and city services were not significant.
In urban sprawl areas, fewer domains were significant. Environmental satisfaction was associated with a 100% increase in the odds of higher overall life satisfaction, whereas neighborhood satisfaction increased the odds by 80%. The remaining domains were not statistically significant.
In the other categories, accessibility satisfaction and environmental satisfaction emerged as the strongest predictors. Accessibility satisfaction was associated with a 320% increase in the odds of being in a higher overall life satisfaction category, whereas environmental satisfaction was associated with a 370% increase. Dwelling satisfaction also showed a marginally significant positive effect, corresponding to a 70% increase in the odds. No significant associations were observed for health, education, safety, neighborhood, or city services.
Overall, the findings indicate that accessibility, environment, and dwelling were the most consistent and influential predictors of overall life satisfaction across urban development types. Among these, environmental satisfaction showed the strongest and most stable association, which was significant for new development, land readjustment, urban sprawl, and other areas and marginally significant for redevelopment. This suggests that residents’ perceptions of environmental quality are a central determinant of life satisfaction regardless of urban form.
Accessibility satisfaction was also highly significant, particularly in redevelopment and other development contexts, where its odds ratios were especially large. This implies that the ease of reaching jobs, services, and daily destinations plays a crucial role in shaping perceived QoUL, especially in more spatially complex or transitional urban areas.
Dwelling satisfaction significantly predicted life satisfaction in new development, redevelopment, and land readjustment areas, suggesting that housing conditions remain a key contributor to overall life satisfaction when residential environments are actively changing or being formalized.
In contrast, education, safety, and city service satisfaction were generally not significant predictors for most development types. These findings may indicate that these domains either vary less across respondents or contribute more indirectly to overall life satisfaction than accessibility, environment, and housing do.
One notable result is the health domain in land readjustment areas, where the reported odds ratio is 0.6. Since an odds ratio less than 1 implies a negative association, higher health satisfaction was associated with lower odds of reporting higher overall life satisfaction in this group. Substantively, this is an unexpected pattern and may reflect contextual complexity, suppression effects, measurement issues, or overlap with other domains in the model. These findings should therefore be interpreted cautiously.
Model assessment. The pooled sociodemographic model provided a statistically significant improvement over the null model (LR χ2 = 55.16, df = 33, p = 0.009), but its higher AIC (1425.7) relative to the null model (1414.8) indicates limited parsimony. In contrast, the domain-specific satisfaction model achieved a substantially better fit (LR χ2 = 457.8, df = 8, p < 0.001) and a markedly lower AIC (973.04), demonstrating much stronger explanatory power. This comparison indicates that domain-specific satisfaction is more strongly associated with overall life satisfaction than are sociodemographic, household, and mobility characteristics alone.
5. Discussion
The findings demonstrate that the determinants of overall life satisfaction vary systematically across urban development types, indicating that QoUL in Ulaanbaatar is shaped by the combined influence of household characteristics, mobility conditions, and residents’ subjective evaluations of key urban domains. Across the five development contexts, the same sociodemographic or mobility factor did not have a uniform influence on life satisfaction; instead, its effect depended on the spatial, residential, and functional conditions associated with each urban form.
This extends previous research on Ulaanbaatar, which has largely focused on isolated issues such as air pollution, general QoL measurement, or broad disparities between apartment and ger areas, by showing that life satisfaction is structured by the wider urban development context and by the combined influence of multiple urban and household factors.
In this sense, the present study offers a more comprehensive and robust account of QoUL because it captures the context-dependent pathways through which different development forms shape residents’ lived experiences. This interpretation is consistent with QoUL research emphasizing that subjective well-being emerges from the interaction between personal circumstances, neighborhood context, accessibility, and residential experience [
14,
15,
16,
26,
54,
55].
The stratified findings also both align with and extend earlier research on quality of life and subjective well-being in Ulaanbaatar. In particular, the importance of environmental satisfaction in several urban contexts is consistent with that reported by [
9], who reported that air pollution was negatively associated with life satisfaction in Ulaanbaatar, underscoring the central role of environmental conditions in subjective well-being. Similarly, ref. [
35] highlighted the importance of assessing quality of life through multiple physical, psychological, social, and environmental domains. Building on this multidimensional perspective, the present study demonstrates that the relative importance of these domains differs across urban development types and that the relationships between urban conditions and overall life satisfaction are spatially differentiated within Ulaanbaatar. This provides important new insight, indicating that urban inequalities are expressed not only through social and environmental disadvantages but also through distinct patterns of urban development. Accordingly, efforts to improve QoUL should move beyond uniform citywide interventions and adopt development-type-specific strategies tailored to combinations of environmental, accessibility, housing, and family-related factors [
56,
57] that are most salient in each urban context.
Several unmeasured factors may also have confounded the observed relationships between urban development type and life satisfaction. Stronger social ties in long-established ger areas may partially explain the positive association between residential duration and life satisfaction in land readjustment areas. Cultural preferences for ger-style living may introduce unmeasured heterogeneity into the redevelopment and land readjustment models, and seasonal environmental variation may affect satisfaction within the environmental domain in ways that are not fully addressed by the cross-sectional design. A more detailed discussion of these potential confounding effects is provided in the
Section 5.2.
In new development areas, life satisfaction is shaped mainly by migration background, household size, commuting burden, and a broad range of domain satisfactions, particularly accessibility, environment, dwelling, health, and neighborhood satisfaction. These findings suggest that the contribution of new development to the quality of urban life depends not only on improved housing and infrastructure but also on whether these areas facilitate migrant integration, support family life, and provide effective everyday accessibility.
In redevelopment areas, life satisfaction was influenced most strongly by higher educational attainment, which was negatively associated with accessibility and dwelling satisfaction. These findings suggest that in transitional urban settings, physical upgrading alone may not be sufficient to improve perceived quality of life if it does not enhance convenience, residential adequacy, or the lived experience of a place.
In land readjustment areas, longer residential duration and household composition involving children were the key sociodemographic influences, whereas satisfaction with environmental conditions, accessibility, and dwelling were the main positive predictors of overall life satisfaction. These findings suggest that the benefits of land readjustment programs depend not only on physical upgrading and infrastructure regularization but also on residential stability, family-supportive neighborhood conditions, and residents’ positive perceptions of their immediate living environment. This implies that land readjustment initiatives should go beyond land tenure formalization and infrastructure provision to actively strengthen neighborhood livability, support households with diverse family structures, and ensure that improvements in environmental quality, local accessibility, and housing conditions translate into sustained gains in residents’ quality of urban life.
In urban sprawl areas, life satisfaction is shaped primarily by long-term residence, public transport use, and satisfaction with the environment and neighborhood. While this pattern is broadly consistent with earlier evidence that environmental burdens reduce subjective well-being in Ulaanbaatar, the present results further show that in peripheral areas, such effects are closely intertwined with transport connectivity and neighborhood conditions.
In the other development categories, household composition and child-related characteristics emerged as the strongest sociodemographic influences, whereas accessibility and environmental satisfaction were the dominant domain-specific predictors. These findings suggest that these heterogeneous areas may be among the least supportive for families and among the most uneven in terms of service provision and residential quality.
These findings advance the QoUL literature in three respects. The study develops a development-type-specific analytical framework in which urban form functions not as background control but as a structural moderating context, one that determines which household, mobility, and perceptual factors shape life satisfaction and to what degree. With respect to existing urban livability models, the results are both confirmatory and qualifying: environmental quality and accessibility emerge as consistent predictors across all development types, as established QoUL theory would anticipate, yet their relative weight— alongside that of other predictors—shifts markedly depending on the development form, which extends rather than merely replicates prior evidence. Finally, situating this analysis in a rapidly urbanizing, post-socialist Central Asian city moves QoUL research beyond its prevailing geographic concentration in European, East Asian, and South Asian contexts. More broadly, the findings demonstrate the value of development-type-sensitive analytical approaches for understanding quality of urban life and informing context-responsive strategies for sustainable urban development in cities experiencing rapid and internally heterogeneous spatial transformation.
5.1. Policy Implications
Across the five urban development types, the recurring significance of environmental and accessibility satisfaction suggests that perceived urban functionality and environmental quality are central mechanisms linking urban form to life satisfaction, which is consistent with evidence from other metropolitan contexts, including Northern European and Japanese metropolitan cities [
26,
58,
59].
However, the variation in other predictors across development contexts indicates that these relationships are not universal but are conditioned by the specific sociospatial characteristics of each urban form. This is an important contribution of the present study, as it demonstrates that QoUL in Ulaanbaatar cannot be adequately understood through single-issue explanations or citywide averages alone. Instead, life satisfaction is shaped by differentiated combinations of contextual, household, mobility, and perceptual factors across the city’s contrasting development patterns.
Planned and more structured urban forms, such as new development and land readjustment, appear to provide relatively supportive environments, although their benefits are not equally distributed across household types. In contrast, redevelopment areas highlight the importance of expectations and perceived adequacy, urban sprawl emphasizes adaptation and transport connectivity, and the other development categories reveal more persistent inequalities linked to family structure and local service deficits. These patterns suggest that policies to improve QoUL in Ulaanbaatar should be tailored to the specific conditions of different urban development types. More broadly, policy should move beyond a narrow focus on physical upgrading toward a more integrated approach that combines housing, transport, environmental improvement, neighborhood services, and family-supportive interventions. Monitoring and evaluation frameworks should also incorporate both objective urban indicators and residents’ subjective satisfaction so that urban development can be assessed in terms of its contribution to overall life satisfaction rather than only its physical or spatial outcomes.
More targeted policy implications emerge across the four development contexts. In new development areas, where rural origin and larger family size were associated with lower life satisfaction and commuting burden remained a significant factor, policy interventions should focus on three priorities. First, migrant households could be better integrated through community reception programs and culturally accessible services. Second, family-supportive amenities, including childcare facilities, playgrounds, and schools, should be located within walking distance of high-density residential blocks. Third, improvements in public transport frequency and spatial coverage are needed to reduce commuting time and cost for working households.
In redevelopment areas, higher educational attainment was strongly and negatively associated with life satisfaction, while accessibility satisfaction emerged as a key predictor. Policy responses should therefore ensure that physical redevelopment upgrades translate into meaningful improvements in everyday accessibility, including pedestrian infrastructure, access to local public transport stops, and proximity to daily services. Participatory planning mechanisms are also needed to allow residents—particularly more educated and critically engaged groups—to influence redevelopment outcomes. In addition, maintaining affordable housing options remains important to reduce the displacement of long-term residents during densification.
For land readjustment areas, residential duration, household composition involving children, and satisfaction with environmental conditions and accessibility were the dominant predictors. Policy should therefore prioritize the timely completion of planned road, drainage, and green space infrastructure in the Songinokhairkhan 9th subdistrict so that infrastructure investment results in perceptible improvements in environmental quality. Given the strong sensitivity of satisfaction to child-related conditions, schools, health posts, and playgrounds should be accessible within walking distance. Land readjustment programs should also be designed to support residential stability explicitly and minimize involuntary displacement, as longer residence duration was positively associated with higher life satisfaction.
In urban sprawl areas, long-term residence and public transport use were the strongest predictors of life satisfaction. Appropriate planning measures include investment in reliable and affordable bus services linking the Songinokhairkhan 41st subdistrict with central employment and service hubs, supported by dedicated routes and stops that reduce travel time for daily commuters. Neighborhood improvement programs that strengthen place attachment among long-term residents—such as upgrades to community open spaces, improved access to local markets, and enhanced basic service provision—may also be beneficial. Finally, tenure security incentives could encourage long-term settlement and reduce the instability associated with informal land occupation.
5.2. Limitations
Several limitations warrant acknowledgement. First, because the analysis relies on cross-sectional data, the findings should be interpreted as associational rather than causal. The observed relationships among urban development type, domain satisfaction, and overall life satisfaction do not establish causal directionality. Residential self-selection represents one plausible source of confounding: individuals with higher baseline life satisfaction may preferentially choose, or have the financial capacity to access, more planned or better-serviced areas, rather than these areas producing higher satisfaction. At the same time, improved urban conditions may exert a causal influence on satisfaction over time. Future research would benefit from longitudinal designs and quasi-experimental approaches, including difference-in-differences and propensity score matching, to better disentangle these causal pathways. Second, although subjective evaluations are central to QoUL research, they may reflect adaptation, expectations, and individual response tendencies in addition to actual urban conditions. Third, the categorization of urban development types necessarily simplifies the complexity and internal diversity of Ulaanbaatar’s residential environments, particularly in heterogeneous areas.
Fourth, several potentially relevant determinants of life satisfaction, including social ties, cultural preferences, and temporal environmental variation, were not included in the present model. Their omission may have implications beyond conventional omitted-variable bias. Stronger social networks in long-established ger areas may partly explain the positive association between residential duration and life satisfaction in land readjustment areas, reflecting social embeddedness rather than physical familiarity or infrastructure quality alone. Cultural preferences related to ger-style living, land ownership, and residential autonomy may also shape satisfaction differently across development types, potentially introducing unmeasured heterogeneity, particularly in redevelopment and land readjustment models. In addition, seasonal environmental variation in Ulaanbaatar may influence environmental satisfaction, as air quality, heating availability, and thermal comfort differ markedly between heating and non-heating periods. Future longitudinal or multi-season studies would help address these temporal confounds.
Fifth, the 85 online responses included in the “Other areas” category may be subject to self-selection bias, as online respondents may differ systematically from face-to-face participants in digital access, education level, and residential type. This may limit the representativeness of the subgroup in citywide comparisons.
Sixth, the survey was conducted during a single period, and environmental satisfaction may therefore reflect seasonal conditions at the time of data collection rather than year-round perceptions, potentially affecting the generalizability of the findings.
Seventh, the redevelopment (n = 70), land readjustment (n = 77), and urban sprawl (n = 82) stratified models are based on relatively small samples, limiting statistical power and increasing the risk of unstable estimates. Non-significant findings should therefore be interpreted cautiously. Several models, particularly for the land readjustment and urban sprawl subgroups, produced extremely large odds ratios for residential duration, likely due to quasi-complete separation arising from sparse cells. These estimates should be interpreted only in terms of the direction and statistical significance of the association. Larger subgroup samples would enable more stable estimation. These limitations suggest several directions for future research. Longitudinal designs and stronger integration of subjective and objective indicators would help clarify the causal and contextual mechanisms linking urban development to life satisfaction. Further comparative research across different cities and under different seasonal conditions would also improve the broader applicability of the findings.
6. Conclusions
This study investigated QoUL in Ulaanbaatar by examining overall life satisfaction across different types of urban development and by identifying the sociodemographic, household, mobility, and domain-specific factors associated with these differences. The findings confirm that QoUL is not distributed evenly across the city. Instead, it is strongly associated with the urban development context, reflecting the uneven outcomes of rapid urban expansion, redevelopment, and infrastructure transformation. The results show the following:
- (1)
Planned and more structured urban forms tend to report higher life satisfaction. New development and land readjustment areas tend to report higher levels of life satisfaction than redevelopment, urban sprawl, and other heterogeneous areas do. However, the advantages of planned development are not universal. Even in better-performing areas, life satisfaction remains sensitive to migration background, household composition, commuting burden, and residents’ perceptions of lived experience.
- (2)
The determinants of overall life satisfaction differ substantially across urban development types. In the pooled model, longer residence was positively associated with life satisfaction, while higher education was negatively associated, suggesting the importance of place attachment on the one hand and rising expectations on the other. However, the stratified models reveal that these relationships are not uniform. In new development areas, life satisfaction is shaped by migration background, family size, and commuting constraints. In redevelopment areas, more educated residents were less satisfied, while accessibility and housing satisfaction were particularly significant. With respect to land readjustment and urban sprawl areas, long-term residence emerged as a strong positive factor, indicating the importance of local adaptation and residential stability. In other areas, household and child-related characteristics played the most central role.
- (3)
Domain-specific satisfaction is the most consistent predictor of overall life satisfaction across urban contexts. Satisfaction with accessibility, environmental quality, and dwelling conditions are the most consistent predictors of overall life satisfaction across urban contexts. Among these, environmental satisfaction showed the strongest and most stable association with higher life satisfaction. These findings suggest that residents’ perceptions of environmental quality are central to overall life satisfaction in Ulaanbaatar. Accessibility also emerged as a critical dimension, especially in redevelopment and mixed urban areas, highlighting the importance of functional connectivity in everyday life. Dwelling satisfaction was likewise significant across several development types, confirming that housing quality remains a core component of QoUL. At the descriptive level, mean satisfaction scores further support these findings: across all development types, education and dwelling conditions tended to receive higher satisfaction ratings, whereas safety and city services consistently showed lower levels of satisfaction. This pattern suggests that improvements in accessibility, dwelling conditions, urban safety, environmental quality, and service provision should be considered key priorities for enhancing overall QoUL.
These findings suggest that improving QoUL in Ulaanbaatar requires more than increasing the housing supply or expanding infrastructure coverage. Urban policy should adopt development type-specific strategies that respond to the distinct social and spatial realities of different areas. In new development areas, attention should focus on family-supportive services, transport efficiency, and the integration of migrant households. In redevelopment areas, policy should address the mismatch between physical upgrades and residents’ expectations, especially in relation to accessibility and residential adequacy. In land readjustment areas, sustained support is needed to strengthen neighborhood conditions, environmental quality, and family-oriented services. In urban sprawl areas, improving transport connectivity and local environmental conditions is essential. In heterogeneous areas, reducing inequality in service provision and supporting households with children should be a priority.
Overall, this study demonstrates that QoUL in Ulaanbaatar is associated with the interactions among urban form, household conditions, mobility, and subjective perceptions of everyday urban experience. Although the findings are grounded in the context of Ulaanbaatar, they highlight the potential relevance of development-type-sensitive approaches for understanding and improving quality of urban life and advancing sustainable urban development in rapidly urbanizing cities characterized by diverse urban forms, heterogeneous development patterns, and uneven development trajectories, particularly in Central Asia and other parts of the Global South. However, broader applicability should be interpreted cautiously, and comparative studies across multiple cities are needed to assess the extent to which these patterns generalize across urban contexts.