Article

An Indexation of Startup Ecosystem Maturity and Sustainable Economic Growth

by
Daina Kleponė
and
Laima Okunevičiūtė Neverauskienė
*
Faculty of Business Management, Vilnius Gediminas Technical University, LT-10223 Vilnius, Lithuania
*
Author to whom correspondence should be addressed.
Sustainability 2026, 18(14), 7212; https://doi.org/10.3390/su18147212
Submission received: 30 May 2026 / Revised: 17 June 2026 / Accepted: 25 June 2026 / Published: 15 July 2026

Abstract

Startup ecosystems and venture capital (VC) are increasingly recognized as critical drivers of sustainable economic growth, yet their macroeconomic effects remain insufficiently quantified. This study develops and validates a composite VC activity index (V Index) as a proxy for startup ecosystem maturity across 23 European countries from 2013 to 2024. The V Index is derived via Principal Component Analysis applied to four VC metrics: VC investment amount, VC divestment amount, number of investment rounds, and number of divestment rounds. Using panel data regression methods—including fixed and random effects specifications, the study considers associations between the V Index and four macroeconomic outcomes: labor productivity, capital productivity, high-technology exports, and business R&D expenditure. The results show that a more mature startup ecosystem is associated with immediate gains in labor productivity, while capital productivity, high-technology exports, and innovation expenditure show positive associations with a one- to two-year lag, reflecting time-to-build and knowledge diffusion dynamics. These findings provide empirical support for VC-driven startup ecosystems as contributors to sustainable, knowledge-based economic growth and present actionable evidence for decision-makers designing startup support programs aligned with sustainable growth objectives.

1. Introduction

The European debate over competitiveness and sustainable economic growth has grown more heated in recent years. The Draghi policy review [1] revealed that the European Union (EU) lacks major technology companies and has difficulty developing innovation at scale. The startup and scale-up pipeline in Europe faces structural barriers according to academic research, and market data show that acquirers from both the U.S. and Europe focus on domestic and regional transactions, but European startups experience fewer large exits than United States (U.S.) startups, and U.S. companies lead the acquisition of European startups [2]. The noted patterns are important because they enable capital and talent recycling, technology validation, and reflect the maturity of the startup ecosystem.
More importantly, the modern economic setting demands that competitiveness be fundamentally connected to sustainable growth. The transition toward sustainable economic models requires technological innovation and dynamic startup ecosystems [3]. Startups, particularly those operating in digital and deep technology ecosystems, are increasingly recognized as drivers of progress toward the United Nations Sustainable Development Goals (SDG), notably SDG 8 (Decent Work and Economic Growth) and SDG 9 (Industry, Innovation and Infrastructure) [4]. For example, deep tech and clean technology startups possess the agility to introduce disruptive, environmentally friendly solutions that traditional corporate systems frequently struggle to deploy rapidly [5], and venture capital (VC) often acts as a critical catalyst not only for general economic growth but specifically for funding sustainable innovations, providing the risk capital necessary to bridge the divide between scientific discovery and commercial viability [6,7].
The conceptual framework of entrepreneurial ecosystem research shows that innovation and firm creation emerge from the interactions among entrepreneurs, investors, corporations, universities, and public agencies operating within institutional and network contexts. VC functions as a catalyst within this framework by providing funding, screening services, governance, and market access, which help startups develop their capabilities and expand their operations [8,9,10]. Even when startups fail, knowledge spillovers, founders’ learning, and labor mobility contribute to regional productivity and innovative output.
However, here, the EU policy faces two challenges: one is the absence of a unified, operational definition of the “startup” at the EU level, and the other is the fragmented measurement of startups’ ecosystem development, as different countries use different methods to assess their startup ecosystems [11]. Most current assessments rely on individual indicators, such as investment deal numbers, amounts, and exit statistics, which capture only partial activity data and fail to reveal the full investment–divestment cycle that reflects mature ecosystem development.
The research addresses three essential problems in the field. Using Principal Component Analysis (PCA) of four VC metrics, which combine investment and divestment data with the number of investment rounds, the study creates and validates a unified startup ecosystem maturity indicator—the VC activity index—and assesses its relationship with economic growth indicators. The research examines startup ecosystems across 23 European nations using panel data from 2013 to 2024. The study considers the V Index’s relationships with labor and capital productivity, high-technology exports, and business R&D expenditure, examining both contemporary and lagged responses. Research findings show three main discoveries. First, the V Index shows immediate positive associations with labor productivity. Second, positive effects on high-technology exports and capital productivity emerge only after a one- to two-year delay, indicating the time required to expand operations, establish distribution channels, and integrate new capital assets. Business R&D expenditure increases with a two-year lag, signifying sustained investment in knowledge development.
The research makes two essential contributions within the field. The study demonstrates that VC activity is strongly associated with both short-term productivity improvements and longer-term patterns in trade performance, capital utilization, and research and development across European economies. Second, it presents a measurable composite index that can help researchers and government officials track startup ecosystem maturity, apply evidence-driven support programs and assessment methods, and estimate when and where interventions, particularly those aimed at facilitating sustainable economic growth, are likely to yield the largest economic and social returns.
The paper is organized as follows: Section 2 reviews the related literature; Section 3 details the materials and methods; Section 4 presents the results; Section 5 discusses the results; and Section 6 concludes the paper.

2. Literature Review

The relationship between startup ecosystem development and macroeconomic outcomes has attracted growing academic attention, yet the field remains fragmented across disciplines—entrepreneurship, regional economics, innovation studies, and finance—lacking a unified empirical framework to measure ecosystem-level effects on national economic performance. This review synthesizes the existing literature along three interconnected dimensions that underpin the empirical design of the present paper. First, it examines how startup ecosystems are defined and how their maturity is conceptualized, establishing the theoretical basis for the research. Second, it reviews the role of venture capital as both a driver of ecosystem development and a measurable indicator of ecosystem maturity. Third, it surveys the evidence on the macroeconomic outcomes—productivity growth, high-technology exports, and business R&D expenditure—through which startup ecosystems transmit their effects to the broader economy.

2.1. Startup Ecosystem Maturity

The unclear definition of “startup” creates problems for researchers studying startup firms and ecosystems. Ref. [11] conducted a comparative study revealing that the term “startup” is inconsistently defined across EU legal texts, EU analytical reports, national documents, and international sources, with divergences regarding firms’ age, size, innovativeness, and development potential. Most definitions of startup include age requirements, innovative elements, and expansion prospects, but they rarely specify exact numerical boundaries for these criteria. This ambiguity is reflected in other important EU documents as well; for example, the EU Digital Package fails to establish clear definitions for tech startups, which leads researchers and practitioners to rely on informal, literature-based descriptions of “young, innovative firms with scalable business models, equity-based capital, and fast-growth targets” [12].
The conceptual framework of startup ecosystem research draws on entrepreneurial ecosystem theory, which demonstrates how entrepreneurship operates through complex institutional networks and relational structures. A startup ecosystem is a network of stakeholders collaborating to support new business ventures, enabling knowledge production, technology development, and the generation of business opportunities. Multiple essential participants perform distinct functions within this system: research and academic institutions act as core components enabling technology transfer; support organizations such as accelerators and incubators afford essential guidance during early development stages; government organizations form supportive policies and regulations; and financial providers—VC firms, business angels, and alternative finance providers—supply the capital required for growth and expansion [13].
Beyond the definitional question, a central challenge in the literature is the conceptualization and measurement of ecosystem maturity—the degree to which a startup ecosystem has developed the full set of interdependent structural components required for self-sustaining, innovation-driven growth. The European Commission’s analysis of startup innovation ecosystems [13] identifies distinct phases of ecosystem development, ranging from nascent environments with limited institutional density to mature ecosystems characterized by deep capital markets, active knowledge networks, and a track record of successful exits. In this framework, maturity is not a function of age alone, but of the accumulated quality and interconnectedness of ecosystem components.
The concept of maturity also has a temporal dimension that is important for the empirical design of the present study. A startup ecosystem reaches maturity when startups consistently achieve successful exits and when the aggregate VC activity in the ecosystem generates measurable spillovers to the broader economy [9,14]. The Startup Genome Global Startup Ecosystem Report [14] operationalizes this temporal dimension by classifying ecosystems into activation, globalization, and expansion stages based on the depth of capital markets, exit frequency, and international connectivity—a classification that underpins the composite structure of the V Index developed in this paper.

2.2. Venture Capital as a Startup Ecosystem Maturity Indicator

In the modern entrepreneurial environment, startup ecosystems operate as interrelated elements within a global system, and the performance of a national startup ecosystem can be measured by VC funding, which serves as a proxy. The supply of VC is the primary factor determining startup creation and survival rates, economic growth, and innovation. Developing new, innovative products, especially deep tech and sustainable technologies, calls for considerable upfront time and capital, and startups often trade short-term profits for long-term market share. Consequently, they typically reach break-even later than established peers, particularly in high-tech industries [15,16,17].
The growth potential of startups depends heavily on their ability to access external funding sources. The funding needs of innovative startups without traditional market access are met through VC investments. According to [18,19], small businesses experience better growth when they have access to external funding. And here, VC firms play an essential role in the startup finance sector because, in addition to capital, they provide expertise in handling complex, high-risk, and limited-disclosure business ventures [20]. Research by [21] across 23 European countries demonstrates that VC investments drive innovation and sustained economic growth. The authors point out other important roles of VC for startup development: in transition economies, government-backed VC could serve both as a financial resource and as a legitimizing signal, thereby boosting startups’ credibility and visibility [22]. Their research likewise reflected the importance of institutional settings, which determine how well ecosystem-based interventions perform in different contexts. Similarly, the research by [23] demonstrated that staged and syndicated VC investments led to positive growth and internationalization outcomes for startups, but their combination can sometimes yield some negative effects. Studies [22,23] suggest that the form of VC and the institutional environment in which it operates jointly determine whether VC enhances or constrains startup development.
The recent literature additionally emphasizes the key role of VC in driving the transition toward a green economy. Startups are increasingly recognized as vital to solving contemporary global financial and social challenges, acting as pioneers in sustainable growth [24]. Venture capital is fundamental for financing green and sustainable innovation, notably in sectors requiring high capital intensity, such as clean energy and deep tech [5,6]. However, investments in clean energy startups have consistently faced challenges, including lower potential for outsized returns compared to digital tech, demonstrating the need for strong demand-side policies and government support to make these sustainable ventures attractive to private capital [7].
Startups and VC investors form the core of the innovation ecosystem and help keep it in balance. However, as [25] admits, in immature ecosystems, the competitive aspect of VC firms’ involvement in startup acquisitions leads inexperienced investors to take excessive risks to build their reputations, driving established expertise out of the market, weakening screening and governance, and misallocating capital to lower-quality startup firms. Then, the overall welfare produced by the ecosystem decreases. Supporting this, Ref. [26] argues that VC funding does not always have positive effects on startup firm strategy, management, and cost control, and can sometimes reduce future value growth. Taken together, both dynamics point to capital misallocation and weaker long-run sustainability outcomes.
Achieving a successful exit is the final objective for entrepreneurs focused on growth [27]. A startup ecosystem reaches maturity when startups achieve successful exits through Initial Public Offerings (IPOs) or Mergers and Acquisitions (M&A). Research by [10] reveals that VC-backed firms accounted for 56% of the 4109 IPOs between 1995 and 2018. The process of exits through IPOs and M&A functions as a vital performance metric for startup ecosystem maturity because it enables founders and investors to receive returns and demonstrates an operational system that generates valuable outcomes. The most profitable exit option for investors is an IPO, as it enables successful entrepreneurs to convert their business value into cash and invest again. Ref. [28] showed that VC investment levels directly correlate with the number of IPOs. Large corporations use M&A transactions as their primary exit strategy for acquiring startups because these deals provide access to new markets and technical capabilities [29].
The use of VC activity as a startup ecosystem maturity indicator is supported by [30], which showed, for example, that employment outcomes depend on entrepreneurial quality rather than on startup numbers. The scalability of a startup depends on the quality of ventures that VC investors choose to fund. Accordingly, greater investment depth and stricter selectivity criteria are reliable markers of high-quality scaleups, which account for much of employment creation. Research conducted by [31] in Canada, China, and South Korea provides evidence supporting the use of VC-based indicators, including VC/GDP, late-stage deal share, round size, and unicorn/exit intensity, to measure ecosystem maturity and its ability to transform entrepreneurship into sustainable economic growth. Authors also claim that the development of the startup ecosystem leads to improved performance across economic, social, environmental, and institutional domains.

2.3. Macroeconomic Outcomes

Startup ecosystems generate economic value that spreads across the entire economy while surpassing the achievements of individual startups. The economic value of a startup ecosystem emerges through three main channels that support productive entrepreneurship by enhancing growth and employment opportunities and stimulating innovation and productivity. Ref. [32] explains the economic value-creation process in an ecosystem by defining productive entrepreneurship as a basic concept. The model shows how specific entrepreneurial outputs emerge from systematic conditions within the ecosystem that produce new economic value. The definition of productive entrepreneurship includes all business operations that create economic value directly or indirectly or boost future production potential. The definition encompasses all entrepreneurial activities because failed businesses produce useful knowledge that enables subsequent startups to advance.
Evaluating ecosystem performance requires multiple assessment methods because success is measured across several dimensions. Ref. [33] recognizes two types of indicators of productive entrepreneurship: assumption-based and outcome-based. The number of VC-backed startups in a territory is often used as a proxy indicator, as investors who select startups with care tend to achieve better post-launch results and survival rates. The indicators of productivity contribution, innovation performance, and export levels serve as outcome-based measures.
The creation of new jobs is the primary way ecosystems influence macroeconomic outcomes. A thriving startup ecosystem directly creates new employment opportunities, one of its most visible economic advantages. The high-growth stages of a startup produce significant employment for the economy. The economic impact of VC on job creation is a vital factor in determining an ecosystem’s success. The research by [34] demonstrates how VC investments create sustainable employment. Through their research, the authors show that VC investments had a positive effect on labor trends, even during periods of economic and monetary challenges. The research shows that private VC investments generated more employment opportunities than government-backed funds. Other authors further demonstrate that the employment and income effects of VC supply unfold progressively over time, with the strongest aggregate effects observed in subsequent periods following the initial capital deployment [9].
The establishment of an ecosystem also determines how well a region can produce goods for export. According to [35], digitally oriented service startups with foreign ownership generate higher national export performance than their size would suggest. The research by [36] revealed the sustainable growth of Information and Communication Technologies (ICT) firms in Serbia, related to high export performance. Similarly, later, [37] provided evidence of the positive impact of R&D and rising GDP on high-tech exports, whereas, e.g., domestic credit for non-tech sectors had negative effects, highlighting the importance of the direct funding needs of technology-producing businesses. Because entering foreign markets requires startups to first establish domestic operations, overcome liability of newness, and navigate international regulatory environments, the macroeconomic impact of ecosystem maturity on aggregate high-tech exports is theoretically expected to manifest with a lag of one to two years [21].
The sustainable growth of an economy depends on technological development, capital accumulation, and the process of catching up with leading nations [38,39]. The main controversy concerns how startups create economic value through productivity and their impact on GDP growth. The research by [40] shows that typical startups generate limited economic value, but scale-up businesses that achieve annual growth rates above 20% over three years create substantial increases in GDP, turnover, and employment. Ref. [41] demonstrates that entrepreneurs operating in supportive ecosystems achieve higher innovation rates and productivity. The academic literature synthesis in [42] revealed major authors’ opinions that ecosystems boost productivity through faster technological development and knowledge dissemination, and better technology implementation in production environments, although these effects vary across geographic areas. However, Ref. [18] presented a counterargument that R&D productivity increases with firm size, suggesting that large corporations capture most of the productivity benefits of R&D, while startups excel at generating new concepts and combining ideas. This division of labor between startups, which generate new technological ideas, and established firms, which provide the scale and implementation capacity required for commercial deployment, suggests the delayed realization of capital productivity gains at the macroeconomic level. R&D productivity returns are scale-dependent, with the economic conversion of R&D investment into productivity gains requiring the absorptive capacity of larger incumbent firms [18]. This sequential process has been formalized by modeling the high-tech industry as a two-stage system in which technology development must precede economic transformation, with aggregate productivity growth primarily driven by the technology development stage—meaning that R&D expenditures must first complete the technology development cycle before affecting aggregate capital efficiency [42].
The endogenous growth framework illustrates that ecosystems drive sustainable growth through innovation activities and knowledge transfer between firms, while contributing to human capital development in the area. Ref. [43] claimed that high-growth firms, startups, university graduates, city openness, and risk finance investments lead to higher human capital development and knowledge production. The above-mentioned study by [22] also provided evidence of positive government-backed VC effects through funding and validation of innovation-intensive areas with limited private-sector investment. The Entrepreneurial Quality Index developed by [30,44] demonstrated that high-quality entrepreneurship clusters in California and Massachusetts form their own distinct convergence group, revealing ongoing spatial separation between knowledge and capital centers. Ref. [45] showed that startups participate in temporary relocations for accelerator programs, which create interconnected knowledge-sharing networks between several cities, thus disproving the idea that ecosystems exist solely within local boundaries.
The startup ecosystem generates its macroeconomic effects by creating employment opportunities, developing exportable digital services and tradable goods, while producing the most major impact through innovative and productive knowledge transfer. Incorporating sustainability into this framework is essential, as ecosystems that support high-growth, sustainable, and deep tech startups, connected to dense human capital and financial networks, generate superior long-term economic, social, and environmental outcomes [4,15,24].

3. Materials and Methods

The maturity of startup ecosystems can be proxied by VC activity, which encompasses investments and divestments (exits), as these data reflect the core characteristics of a mature startup environment. The selection of this measurement as the proxy for startup ecosystem maturity is consistent with [31,33], as well as with the market-established benchmark methods of leading ecosystem assessment frameworks:
  • Startup Genome [14] establishes its rankings and maturity typology through funding and exits by defining ecosystem value as the sum of startup valuations, including unicorn valuations and post-money exit valuations, to identify more developed ecosystems based on large exit numbers and funding volume.
  • The Global Tech Ecosystem Index by Dealroom [46] uses VC investments and enterprise value creation to rank ecosystems and performs systematic exit tracking throughout its reports and platforms.
  • The global index and analytics of Startup Blink [47] use funding and valuations alongside unicorns and exits as fundamental elements to track exit value, with funding as one of its core inputs.

3.1. V Index Construction

In this study, a startup ecosystem maturity proxy, the V Index, is developed by combining VC investment amounts, the number of rounds, and exit values (divestments), after normalizing and smoothing the data across multiple years to reduce noise. VC metrics display recurrent cycles, show concentration in mega deals and industry-specific biases, and underrepresent early-stage activity in shallow data markets. These problems are addressed through per capita scaling and triangulation of Euro-denominated investment/divestment values with the number of rounds: VC investment amount (EUR), VC divestment amount (EUR), number of investment rounds, and number of divestment rounds. Euro-denominated series are deflated to constant prices using the Harmonized Index of Consumer Prices (HICP) and normalized on a per capita basis; count variables are normalized per 1 million inhabitants. Each component is standardized using z-scores.
The V Index was constructed using Principal Component Analysis (PCA), a dimensionality reduction technique that identifies the most important sources of variation in a set of related variables. Countries were grouped into three clusters using the composite V Index to assess its ability to differentiate countries. Since VC activity data for the Baltic region (Lithuania, Latvia, and Estonia) were available only in aggregated form, they were compared with regional-level macroeconomic variables in the econometric modeling. For the Baltic region, regional values were calculated as the arithmetic mean of the respective country-level indicators. The final dataset comprised observations from 23 countries across several time periods, with sample sizes ranging from 105 to 219, depending on the specific model and data availability. The temporal dimension spans 3 to 10 years across 19 to 23 cross-sectional units, providing sufficient variation for robust panel data analysis. For the list of variables used in the empirical analysis and their grouping, see Table 1; descriptive statistics are provided in Appendix A, Table A1.

3.2. Econometric Modeling

The research applied Ordinary Least Squares (OLS) and panel data regression methods, including fixed (FE) and random effects (RE) models estimated using the Swamy–Arora feasible GLS (FGLS) procedure, while also applying robust standard errors, to ensure robustness and tackle potential econometric issues such as heteroskedasticity, serial correlation, and unobserved heterogeneity.
Five specifications were estimated: pooled OLS, one-way country fixed effects, one-way country random effects (Swamy–Arora FGLS), two-way fixed effects with country and year dummies, and two-way random effects with random intercepts for countries and years. The FE estimator removes time-stable country factors that could affect the relationship between V Index scores and economic outcomes. The RE estimation model treats country-specific effects as random draws from a shared distribution. The RE method outperforms FE when the model variables are uncorrelated with country-specific effects [48]. The OLS method served as a reference point for evaluating results, treating all data points as separate units while disregarding the panel nature of the data.
The general econometric specification for FE followed the form shown in Equation (1):
Y i t = α i + β 1 V i n d e x i t + β 2 V i n d e x i t 1 + β 3 V i n d e x i t 2 + γ X i t + ε i t
where Yit represents the dependent variable for country i at time t, αᵢ is the country fixed effect (time-invariant), V i n d e x i t is the current period V Index value, V i n d e x i t and V i n d e x i t 2 are lagged values of the V Index, and β1, β2, and β3 are the coefficients of the corresponding V Index. X i t represents control variables, γ is the vector of coefficients on the control variables X i t , and ε i t is the idiosyncratic error term. In the FE, the overall intercept α is absorbed into the unit dummies, so each country has its own intercept.
The general econometric specification for RE is shown in Equation (2):
Y i t = α + β 1 V i n d e x i t + β 2 V i n d e x i t 1 + β 3 V i n d e x i t 2 + γ X i t + δ u i + ε i t
where α is the common intercept, and u i is the random country effect, assumed to be uncorrelated with the regressors.
Four distinct sets of models were estimated, each focusing on a different dimension of economic growth:
  • Labor productivity (PRO L): The V Index’s relationship with labor productivity, controlling for employment in knowledge-intensive sectors (EMPL) and GDP growth (GDP GR).
  • Capital productivity (PRO C): The relationship between the V Index and capital productivity, incorporating controls for employment (EMPL), business R&D expenditure (BERD), and GDP growth (GDP GR).
  • High-tech exports (HT EXP): The V Index’s relationship with high-technology export performance, with controls for business R&D (BERD) and ICT export share (ICT EXP).
  • Innovation (BERD): The relationship between the V Index and business R&D expenditure, controlling for human capital (HC) and public consumption (PUB CON).

4. Results

The viability of the estimated composite V Index was tested across 23 markets, and before using it in econometric modeling, Granger causality tests were conducted between the V Index and the dependent variables. The pairwise Granger tests failed to reject non-causality in either direction for all outcomes, so the analysis was continued with panel regressions that include economically relevant lags and fixed effects to estimate associations rather than structural causal effects. All empirical analyses were implemented in RStudio (R version 4.4.2). Panel data models were estimated using the plm package, and diagnostic tests for model adequacy (multicollinearity, cross-sectional dependence, serial correlation, and specification) were conducted within the same framework.

4.1. V Index

The PCA results demonstrate that the V Index successfully captures the dominant dimension of startup ecosystem maturity from its four input variables. The first principal component (PC1) alone explains 55% of the total variance, eigenvalues, and proportion of variance explained by each principal component; see Table 2.
Using the Kaiser criterion (retain components with eigenvalue more than 1), only PC1 was retained. PC1 accounted for the largest share of common variance across the four VC indicators and therefore provided a good representation of the underlying construct. Accordingly, the V Index was defined as a weighted linear combination of the standardized input variables, with the weights determined by PC1 scores. Descriptive statistics of the V Index are provided in Appendix B, Table A2. The weights (loadings) reflect the relative contribution of each component—VC investment and divestment amount, as well as investment and divestment rounds—to the latent dimension; see Table 3.
To evaluate internal consistency, the Cronbach α coefficient was computed for the item groups identified by PCA. The two items loading on PC1 showed acceptable reliability (α = 0.75).

4.2. V Index Trend

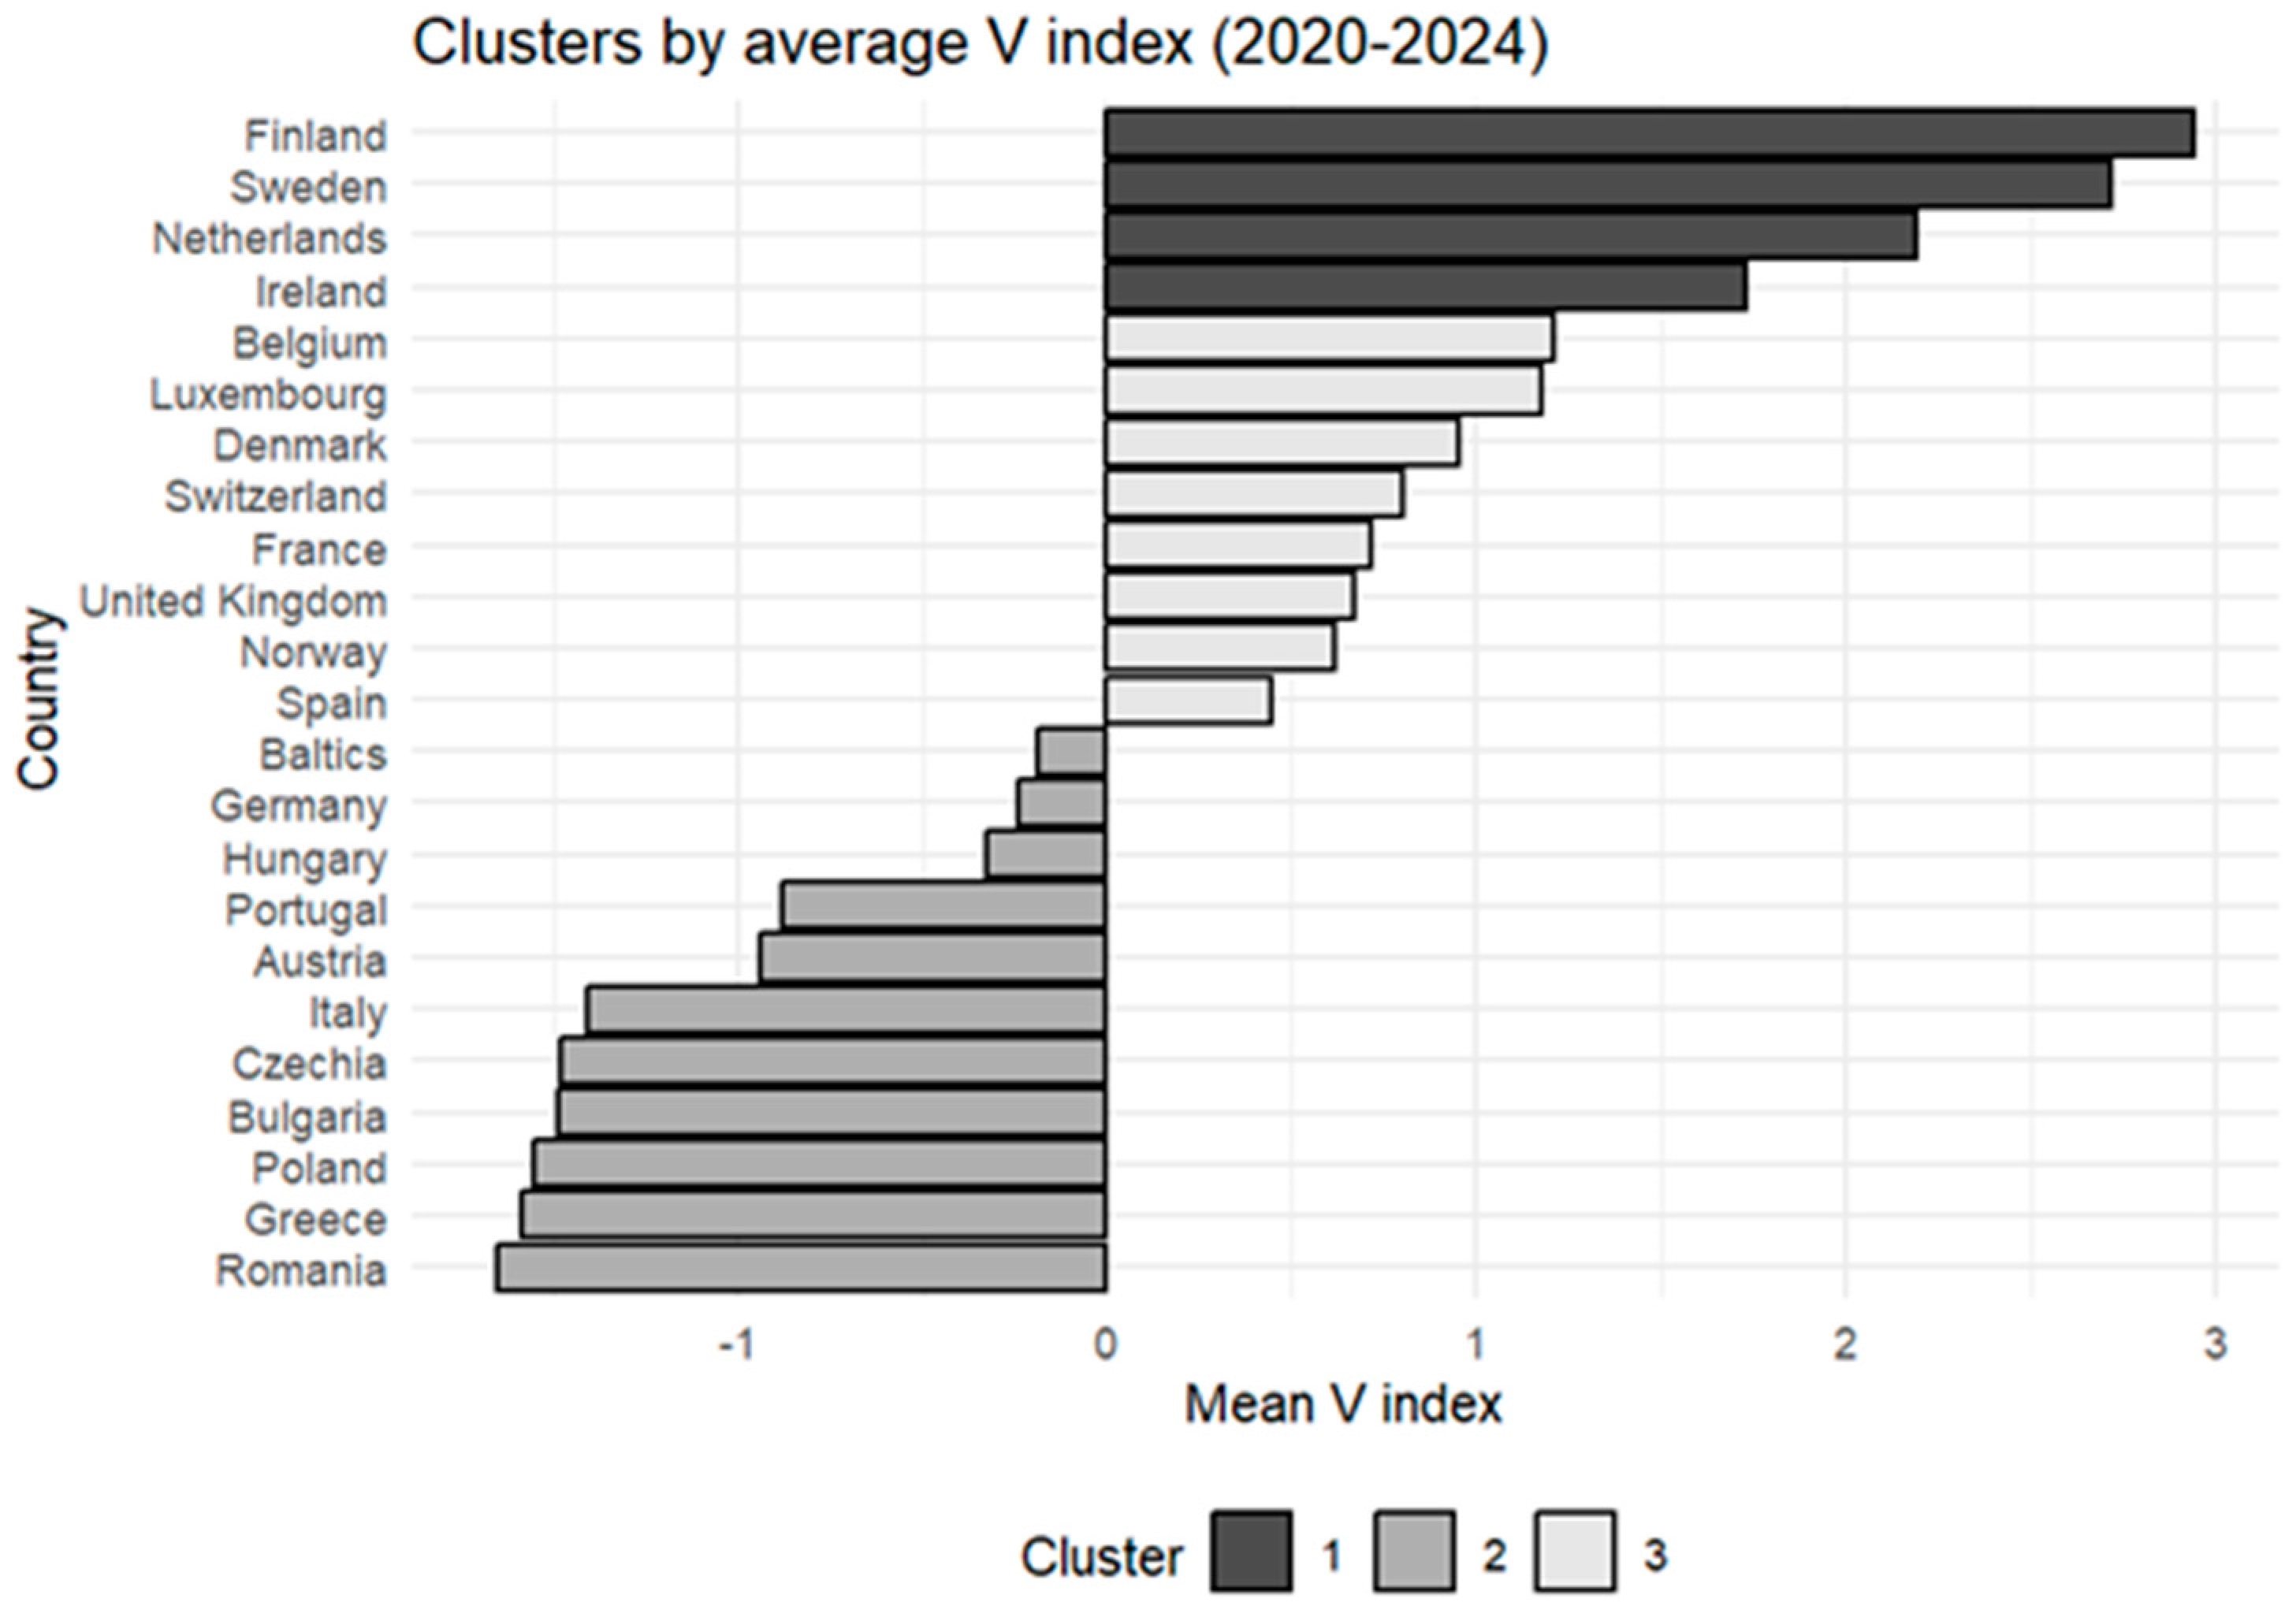
The clustering results of the most recent 5 years revealed distinct groupings of countries based on their V Index characteristics, suggesting that the index effectively differentiates between countries with varying levels of economic growth potential. This clustering provided validation of the index’s discriminatory power and its ability to capture meaningful economic differences across countries; see Figure 1.
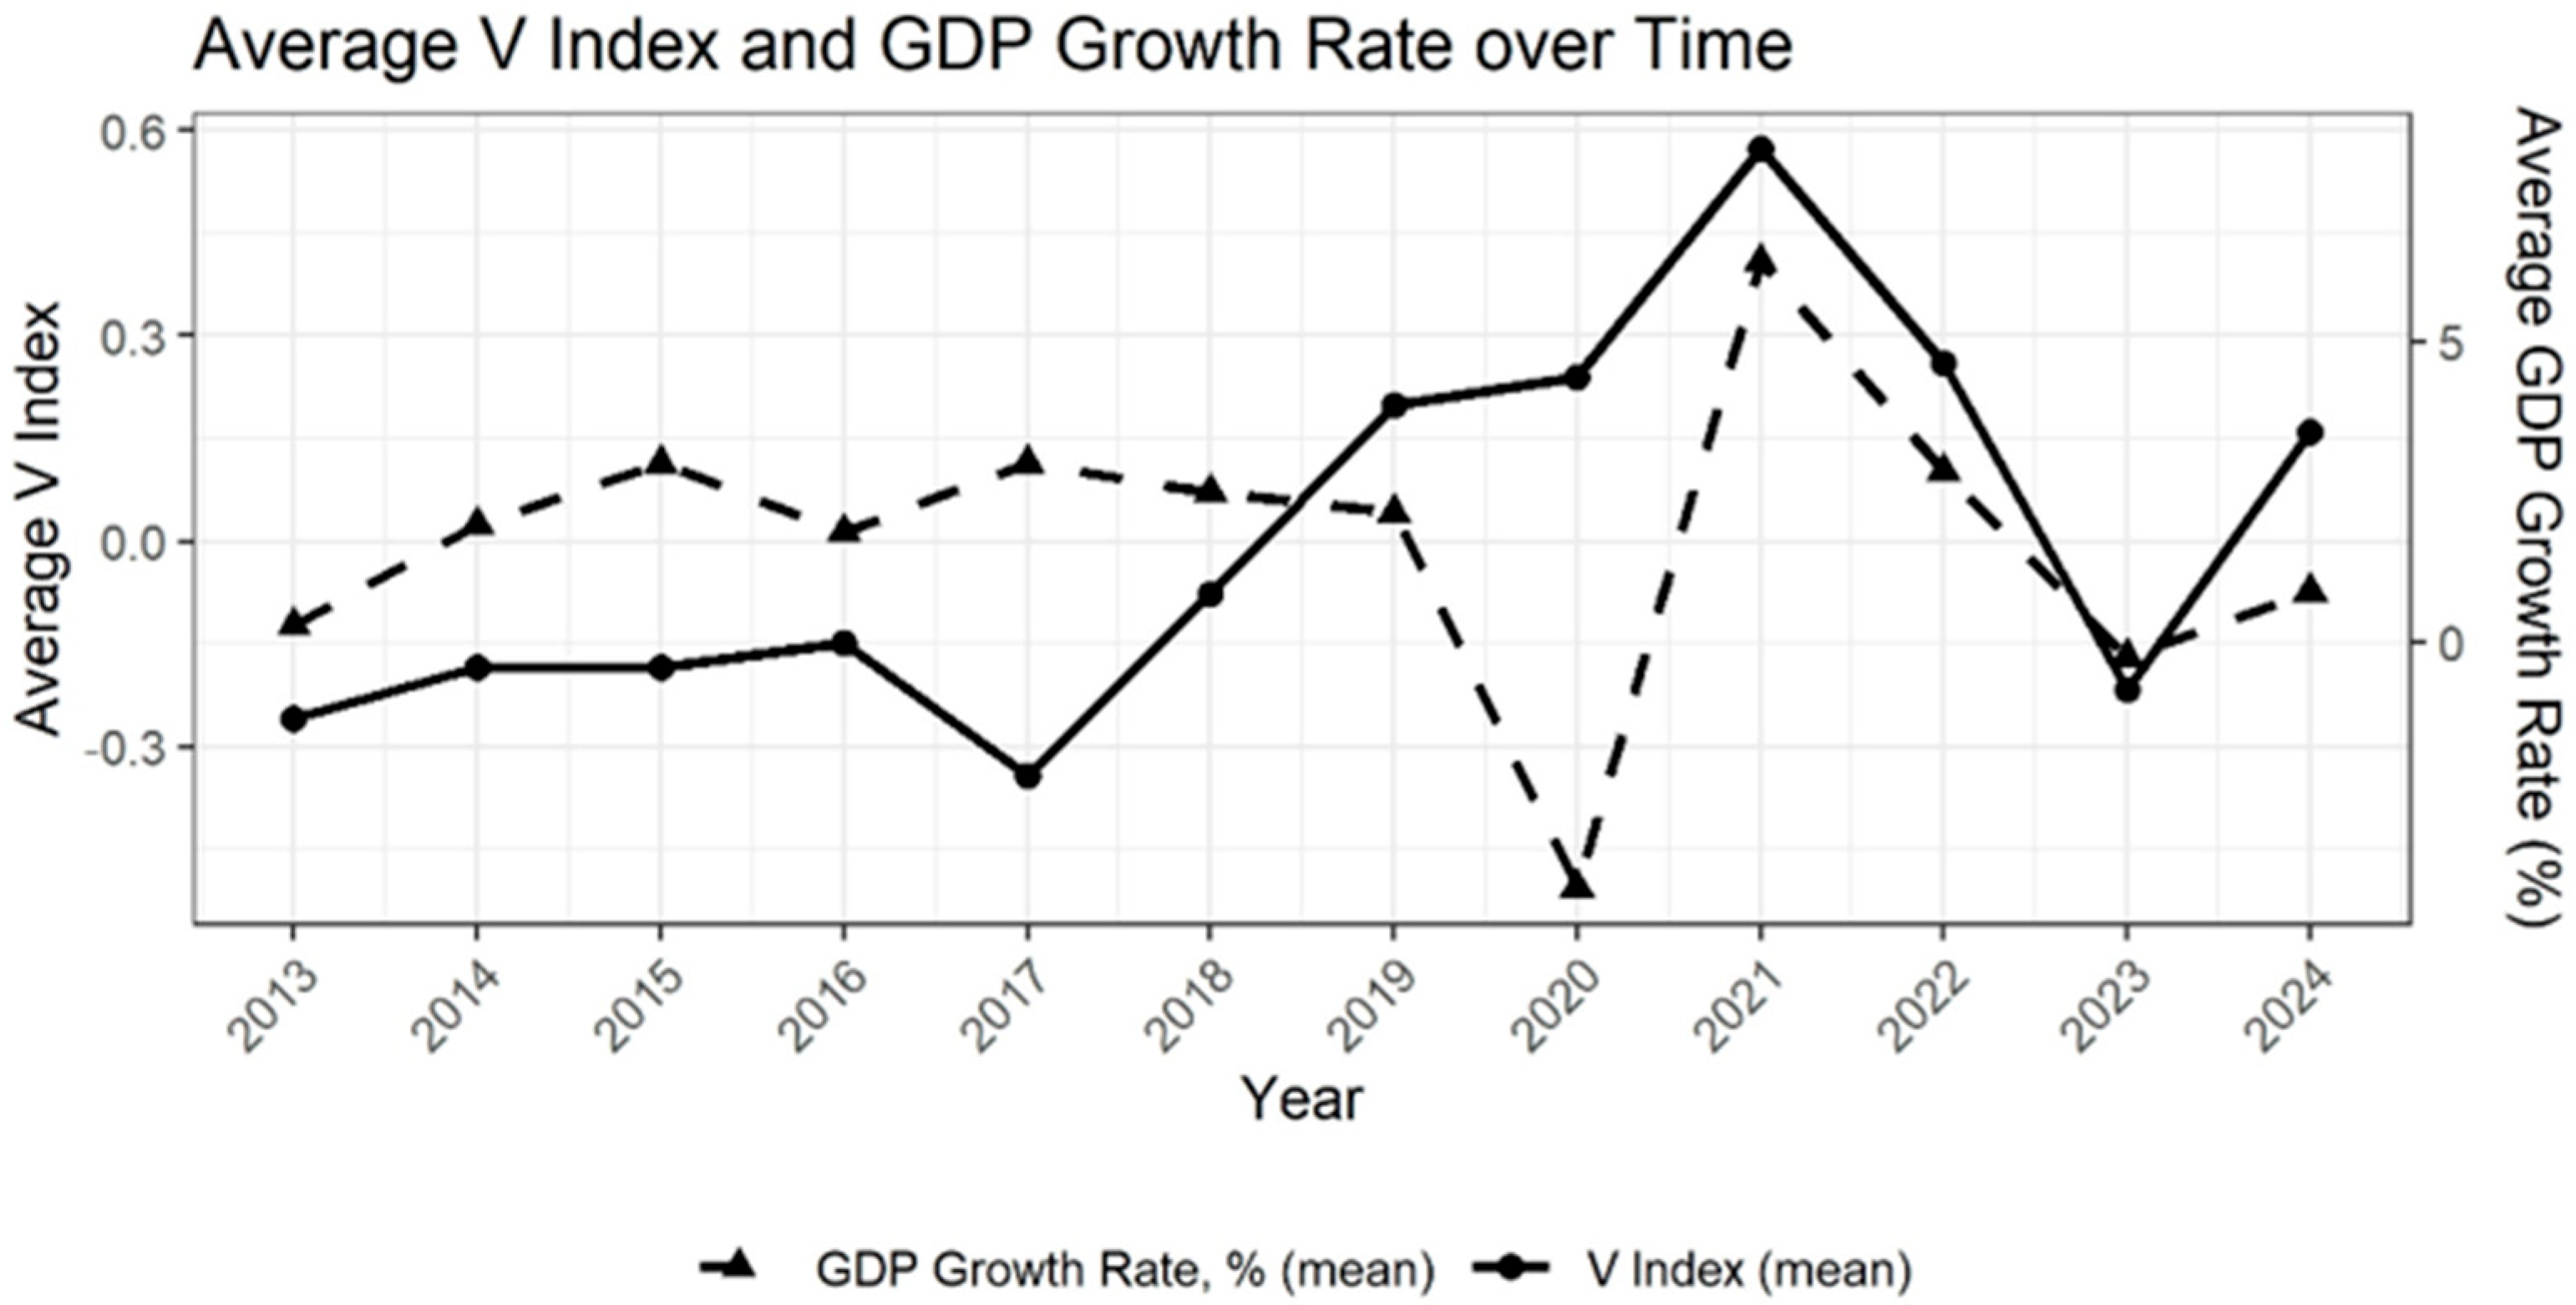
Throughout the full observation period, the V Index and GDP growth rate do not move together. The most pronounced divergence occurs in 2020, when GDP growth collapsed sharply due to the COVID-19 pandemic, while the V Index remained relatively stable—reflecting the well-documented resilience of VC activity and startup valuations during the early pandemic period, supported by historically low interest rates and abundant liquidity. Conversely, the V Index peaked in 2021 slightly ahead of the GDP growth rate, suggesting that ecosystem-level signals—such as VC deal volume and exit activity—may serve as leading indicators of broader macroeconomic recovery; see Figure 2.
Taken together, Figure 2 provides visual support for the hypothesis that higher startup ecosystem maturity, as captured by the V Index, is associated with stronger economic growth outcomes.

4.3. Macroeconomic Effects

Labor productivity: Pooled OLS as a baseline model, one-way fixed effects (country FE), random effects (RE), and two-way FE and RE were estimated on an unbalanced panel of European countries (219 obs., 22 countries, 9–10 years). Multicollinearity was modest (VIF less than 3.22); the Pesaran CD test did not indicate the presence of cross-sectional dependence (p-values ranged from 0.14 to 0.77 across specifications). The Wooldridge and Breusch–Godfrey (for RE) tests indicated first-order serial correlation, so robust clustered standard errors (type HC1) were used. The V Index was positive and statistically significant in pooled OLS, country FE, and two-way RE. In two-way FE, after absorbing time shocks, the estimate and its significance weaken. Countries with higher VC activity tend to grow productivity faster (the effect is stronger between countries). When both country and time effects are removed (two-way FE), the remaining within-country effect weakens. There is no robust evidence of delayed effects: lags of the V Index are generally small and not significant. With the Hausman test p-value range (0.10), RE estimation should not be rejected either. RE preserves between-country information that appears to drive the V Index while controlling for both country and time heterogeneity. A one-unit increase in the VC index is associated with a 1.07 percentage point increase in labor productivity growth, holding other factors constant, while GDP growth is a strong, robust correlate; see Table 4.
Capital productivity: The same set of models was estimated on an unbalanced panel (126 obs., 19 countries, 4–9 years). Multicollinearity was modest (VIF < 6). Wooldridge and Breusch–Goodfrey tests showed no first-order serial correlation (p-values 0.51–0.91). The Pesaran CD test did not indicate the presence of cross-sectional dependence (p-values ranged from 0.09 to 0.26). For the one-way FE vs. RE, the Hausman test was non-significant (p-value 0.71); with two-way effects, it was significant (p-value less than 0.001), implying a correlation between regressors and unit associations once time shocks are absorbed; see Table 5.
Two-way FE improved model fit (R.sq. 0.26), and a clear lagged VC pattern emerged—one-year lag (2.07, significant) and two-year lag (2.37, significant)—once common time shocks were controlled. Identification is now purely within-country and is the net of macro cycles captured by time dummies. The VC index raises capital productivity with a one- to two-year lag, consistent with time-to-build/adoption effects. Time-fixed effects remove the between-country business-cycle effects. In the short run, country-specific economic booms (such as rapid GDP growth) and increases in investment can dilute capital productivity (assets rise before output). Over the medium run, output catches up, and capital productivity improves. The positive BERD and EMPL in two-way FE indicate that innovation effort and knowledge-intensive employment are associated with more efficient capital use when unobserved country traits and common shocks are controlled.
High-tech export: Models were estimated on an unbalanced panel (105 obs., 19 countries, 3–7 years). Multicollinearity was modest (VIF < 5.8). The Pesaran CD test did not indicate the presence of cross-sectional dependence (p-values ranged from 0.41 to 0.94). The Wooldridge and Breusch–Goodfrey tests indicated first-order serial correlation (p-value = 0.00), so robust clustered (HC1) standard errors were used. The Hausman tests did not reject RE (one-way: p-value 0.91; two-way: p-value 0.53), indicating that RE is consistent with FE. In the OLS model, the V Index with a 2-year lag was borderline (0.98); other VC terms were insignificant. For country FE (one-way) and RE (one-way), a clear 2-year V Index lag emerges. Countries with rising VC activity convert that into export gains on average 2 years later, consistent with product development, certification, and market entry. Two-way FE R.sq. was significantly lower (0.07), and all coefficients were insignificant; see Table 6.
Common time shocks (global demand/tech cycle) explain much of the variation in high-tech exports; once absorbed by time effects, few within-country estimates remain. In two-way RE, some between-variation is retained and shows a significant estimate of V Index 1-year lag (0.41), but the overall fit is also low (R.sq. 0.03). The robust, model-invariant feature is a lagged VC association with high-tech exports: increases in venture activity translate into higher export performance with a lag of about 2 years. The loss of significance in the two-way FE suggests that high-tech exports are strongly driven by common time factors (global tech cycles), so that within-country variation is limited. As the Hausman test does not reject RE, RE is consistent and more efficient than FE. It preserves the between-country and over-time variation that carries the estimate for the V Index with a 2-year lag, delivering a stable R.sq. (0.20) and the clearest interpretation of the 2-year lag.
Innovation: For an unbalanced EU panel (129 obs., 19 countries, 3–7 years), VIF (5.6) was moderate. The Wooldridge and Breusch–Goodfrey tests indicated first-order serial correlation (p-value = 0.00), so robust clustered (HC1) standard errors were used. The results of Pesaran CD tests differed across model specifications, reflecting how the treatment of unobserved heterogeneity and common shocks affects residual cross-sectional dependence. In the RE specifications, both one-way and two-way, the null of cross-sectional independence was strongly rejected (p-values < 0.001), suggesting that unobserved common shocks persist in the residuals. By contrast, in the FE models, the test p-values ranged from 0.14 to 0.48, clearly failing to reject independence. This pattern indicates that the presence of cross-sectional dependence is sensitive to model specification, and that controlling for time-fixed effects is important, as it absorbs common macroeconomic shocks that would otherwise induce residual cross-sectional correlation. The Hausman test (one-way) was borderline (p-value 0.09), and the two-way test failed to reject (p-value 0.00) that time-varying regressors correlate with unit effects, so one-way RE or FE were taken as reference models. Country FE and one-way RE indicated consistent positive V Index estimates (both 0.03), as well as a positive V Index 2-year lag (both 0.02); see Table 7.
The VC index is associated with higher innovation levels (business research and development expenses) in the ICT sector, with the clearest effect observed after 2 years. In the two-way FE model, effects weaken and lose significance once common time shocks are absorbed; most of the explanatory power comes from between-country and common time components rather than purely within-country fluctuations. VC intensity today, and especially two years earlier (V l2), predicts a higher level of innovation, consistent with financing cycles in which VC first scales teams/projects and only later appears.
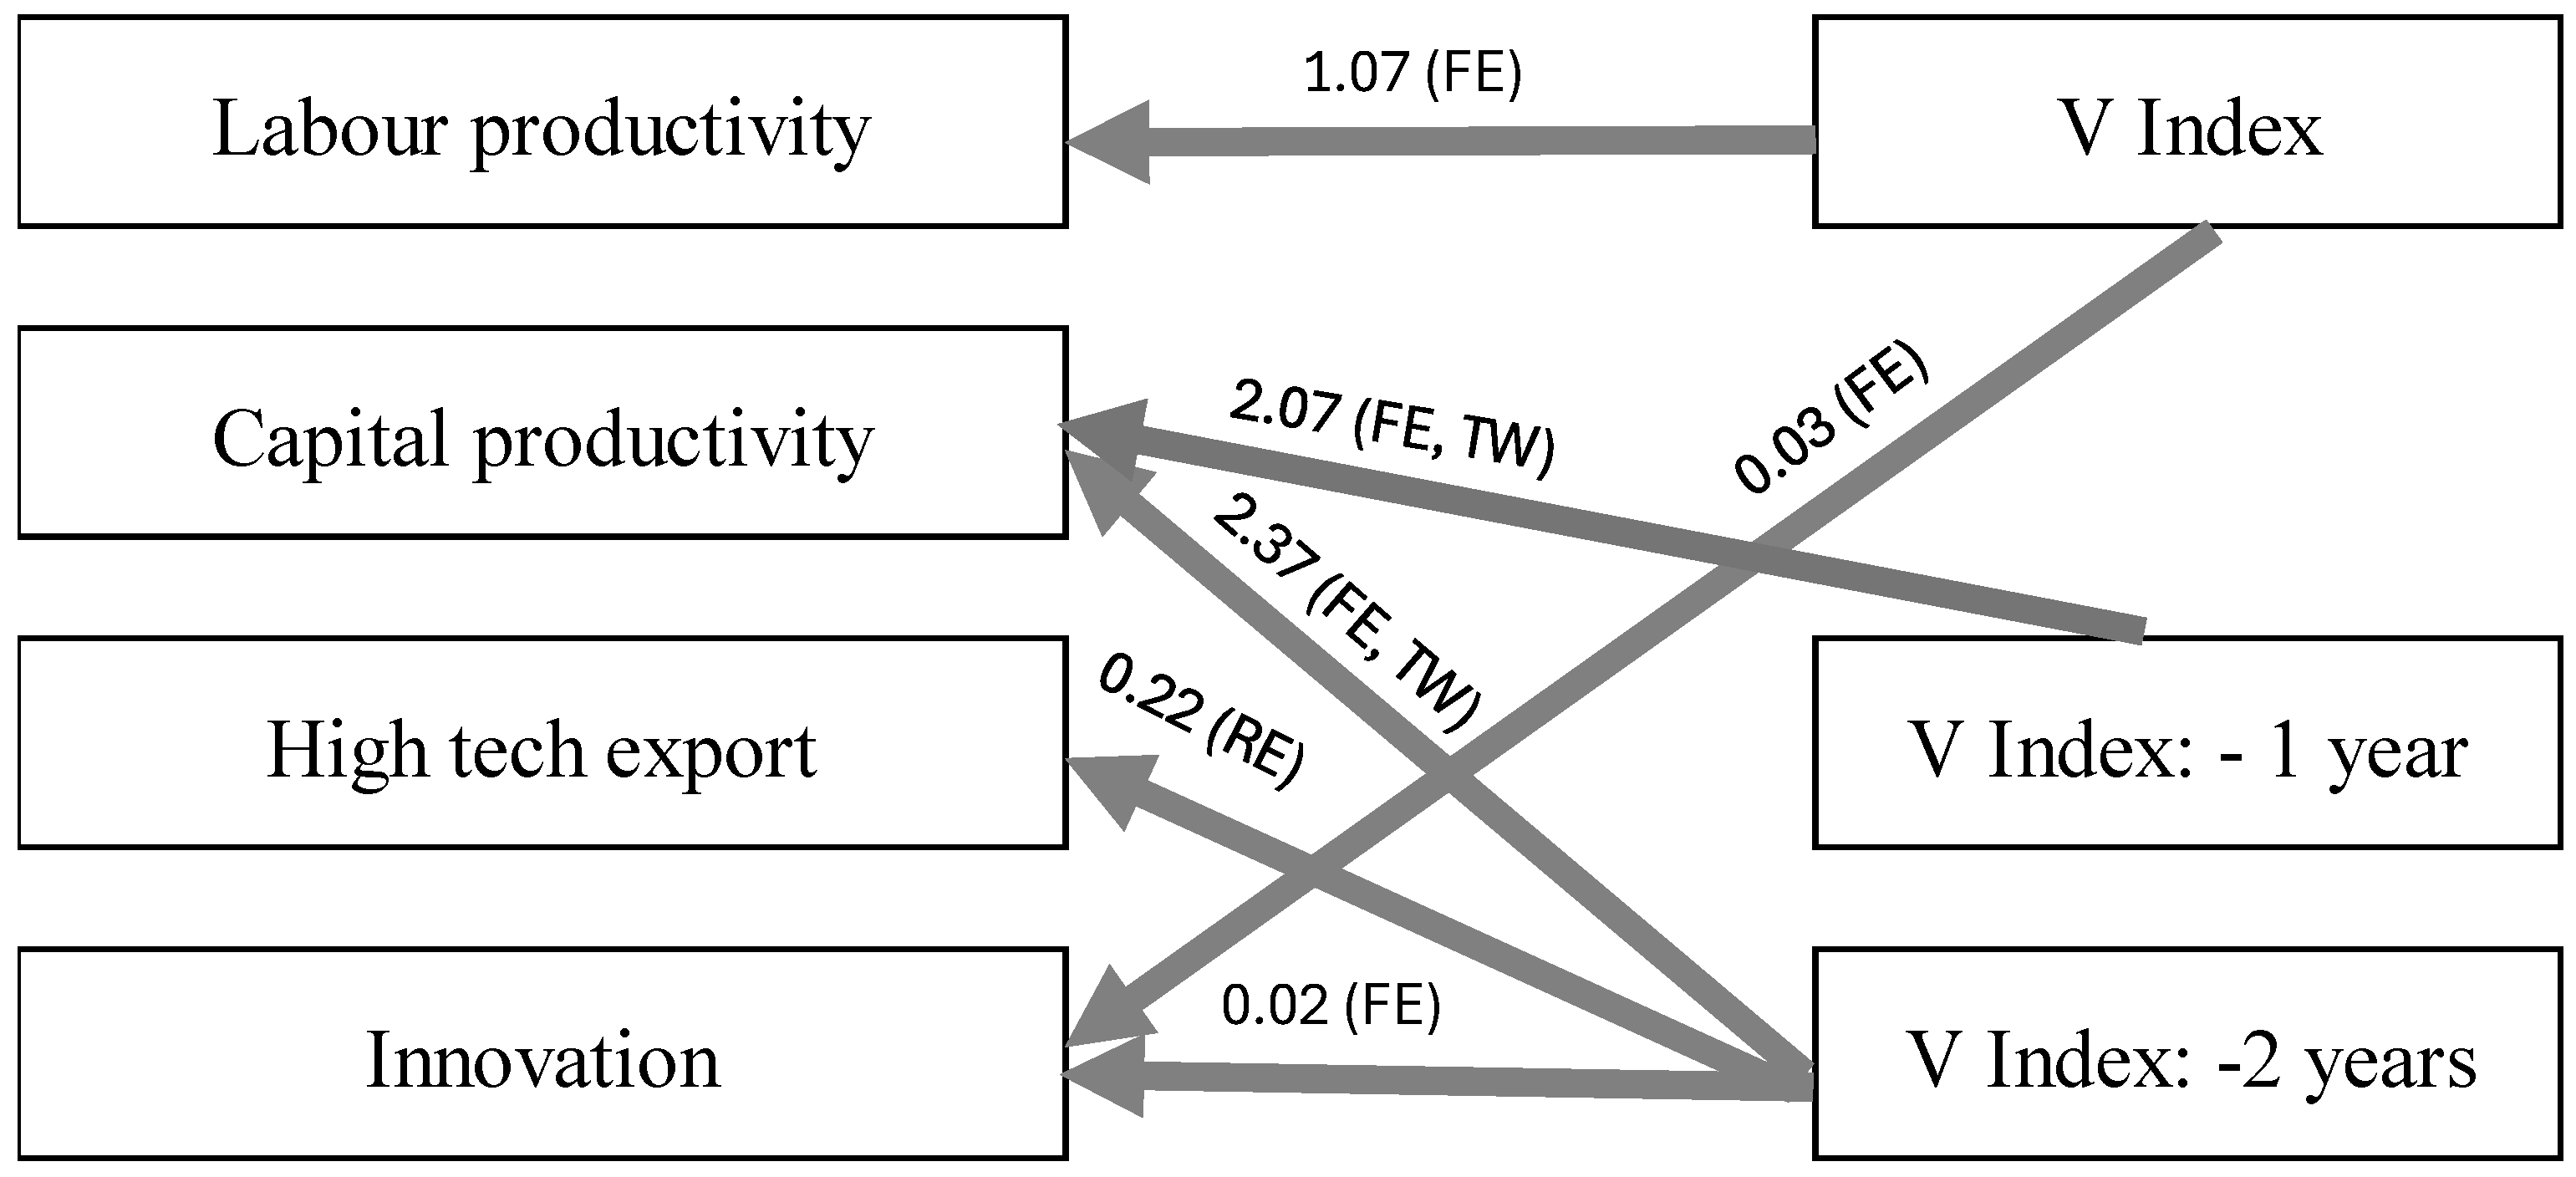
Figure 3 summarizes the statistically significant associations between the V Index and the four macroeconomic outcome variables across the three tested lag specifications. Labor productivity and business R&D expenditure (innovation) exhibit significant associations with the contemporaneous V Index, indicating that startup ecosystem maturity is related to near-term productivity and knowledge investment gains.
Capital productivity and high-technology exports, by contrast, show significant associations only at one- and two-year lags, respectively, reflecting the longer gestation periods required for capital deployment and international market entry to translate into measurable macroeconomic outcomes.

5. Discussion

The V Index as a proxy for startup ecosystem maturity: The construction of the V Index through Principal Component Analysis of four VC metrics—investment and divestment amounts and their corresponding round counts—yielded a composite indicator that captures 55% of the total variance with acceptable internal consistency. This result is consistent with the wider literature treating VC activity as a reliable proxy for ecosystem maturity [31,33], and is consistent with the methodical approaches of leading ecosystem benchmarks such as Startup Genome [14] and Dealroom [46], which similarly rely on funding volumes and exit intensity to classify ecosystems. The clustering of 23 European countries into three distinct groups based on V Index scores additionally confirms the index’s discriminatory power, confirming that VC activity meaningfully differentiates economies with varying levels of innovation-driven development potential.
The descriptive trend of the V Index and GDP growth, presented in Figure 2, reinforces the regression findings and adds an important temporal dimension to their interpretation. The sustained co-movement of the V Index and GDP growth during the 2018–2021 expansion phase—and the parallel contraction in both series following the 2022 energy and geopolitical shock—suggests that startup ecosystem maturity is not merely a structural background condition but a cyclically sensitive variable that is related to macroeconomic conditions. This has direct implications for policy design: interventions aimed at sustaining ecosystem maturity—such as maintaining VC tax incentives, public co-investment schemes, and exit market liquidity—are likely to be most effective precisely during downturns, when private capital retreats and the V Index is at risk of declining. The 2022–2023 contraction visible in Figure 2 thus underscores the vulnerability of startup ecosystems to external shocks and the importance of counter-cyclical public support mechanisms, consistent with the evidence on government-backed VC reviewed in Section 2.2 [22,34].
Associations between V Index and labor productivity: The positive and statistically significant association between the V Index and labor productivity growth, estimated at approximately 1.07 percentage points per unit increase in the index under the preferred fixed effects specification, corresponds to theoretical estimates that VC-backed startups generate productivity spillovers through knowledge diffusion, increased competitive pressure on incumbents, and the reallocation of labor toward higher-value activities [9,10]. The lack of pronounced lagged effects for this outcome indicates that the productivity channel operates relatively quickly, most likely through organizational restructuring and the redeployment of human capital, rather than through capital deepening, which typically requires a longer period to manifest. The magnitude of this coefficient has a direct policy implication: a one-unit improvement in the V Index—equivalent to moving from the panel average to approximately the level of the Netherlands or Ireland in the sample—is associated with more than one additional percentage point of annual labor productivity growth, suggesting that policies that accelerate VC market development—such as reducing capital gains tax on startup exits, expanding co-investment mandates, or streamlining IPO access for growth-stage firms—can generate measurable near-term productivity returns.
The weakening of the V Index coefficient in the two-way fixed effects specification—after absorbing both country-specific and time-specific unobserved factors—indicates that a considerable portion of the observed association is driven by persistent cross-country differences rather than within-country year-to-year variation. Countries with structurally higher VC activity tend to maintain higher productivity growth trajectories, a pattern that corresponds to the endogenous growth framework and the evidence on human capital clustering documented by [30,43]. This finding also corresponds with the Draghi competitiveness review [1], which identifies the concentration of innovation capacity in a small number of European hubs as a structural challenge for the continent’s sustainable economic growth.
Delayed associations with capital productivity: The lagged pattern noted for capital productivity, with the most robust associations emerging at one- and two-year lags (approximately 2.07 and 2.37 percentage points, respectively, in the two-way fixed effects model), is consistent with standard time-to-build and capital adoption dynamics. VC-backed firms typically experience a period of rapid asset accumulation following investment rounds, during which capital productivity may temporarily decline as new assets are integrated into production processes. The subsequent improvement, observable after one to two years, reflects the maturation of these investments as output increases to match the expanded capital base. This interpretation is further supported by the positive and significant coefficients on business R&D expenditure and knowledge-intensive employment in the two-way fixed effects model, indicating that innovation effort and skilled labor are complementary inputs to efficient capital utilization [41,42].
The two-year lag structure carries a concrete policy implication: public co-investment programs and VC tax incentive schemes should be evaluated over a minimum three-year window to capture the full capital productivity effect. A program assessed after only one year will observe, at best, the contemporaneous labor productivity gain but will miss the capital productivity improvement (approximately 2.07–2.37 pp), which materializes only in years two and three. Program designers should therefore build multi-year evaluation frameworks into the design of instruments such as the European Investment Fund’s VC windows and national fund-of-funds schemes.
From a sustainability perspective, the delayed improvement in capital productivity is especially relevant for green and deep tech investments, where the interval between asset deployment and productive output is generally longer than in software-intensive sectors [7]. Policymakers striving to accelerate the sustainable transition through VC-backed innovation should design support instruments with multi-year horizons and avoid evaluating program effectiveness over short timeframes. Specifically, given that the estimated two-year lag coefficient for capital productivity is approximately 2.37 percentage points, a green VC co-investment program of, for example, €100 million deployed in year t would be expected to generate its peak capital productivity effect only in year t + 2. Evaluation frameworks that terminate assessment at t + 1 will systematically underestimate program impact by approximately 15% relative to the full two-year effect, leading to the premature discontinuation of effective instruments.
Associations between V Index and high-technology exports: The two-year lagged association between the V Index and high-technology export performance stays robust across pooled OLS, one-way fixed effects, and one-way random effects specifications, with the random effects model providing the most stable estimates (coefficient approximately 0.22, significant at the 5% level). This lag structure is consistent with the product development and market entry timeline documented in the startup literature. VC-backed firms typically require 18 to 24 months to progress from initial funding to product certification, regulatory compliance, and the establishment of international distribution channels [2,35]. The coefficient of approximately 0.22 implies that a one-unit increase in the V Index is associated with a 0.22 percentage point increase in the high-technology export share of GDP after two years. For a country such as the Baltic aggregate—currently at approximately a 10–12% share of high-tech exports—this represents a potential uplift of roughly 2 percentage points over a two-year horizon following a sustained improvement in VC activity. A practical policy instrument consistent with this finding would be a dedicated export readiness grant scheme for VC-backed deep tech and ICT firms, targeted at the 18–24 month post-funding window when market entry costs are highest and the export conversion lag is most acute.
The loss of significance in the two-way fixed effects specification suggests that high-technology export performance is strongly influenced by common time factors, most notably global technology demand cycles and macroeconomic conditions, rather than by unique within-country VC dynamics. This finding is consistent with the data provided by [37], who demonstrated that R&D intensity and GDP growth are the primary drivers of high-tech export shares, while domestic credit conditions serve a secondary role. The implication is that national VC ecosystems contribute to export competitiveness mainly through the quality and extensibility of the ventures they support, rather than through aggregate investment volumes alone.
Associations between V Index and business R&D expenditure: The positive and statistically significant association between the V Index and business R&D expenditure—both contemporaneously and with a two-year lag—suggests that VC activity is associated with sustained investment in knowledge development within the ICT sector. This pattern is consistent with the financing cycle hypothesis: VC initially scales teams and projects, with the resulting R&D expenditure becoming measurable in firm accounts only after a period of organizational consolidation [10,21]. The one-year lag also corresponds to the typical duration of early-stage startup development cycles, during which R&D activities are funded but not yet capitalized as formal expenditure. The contemporaneous coefficient of approximately 0.03 and the one-year lagged coefficient of approximately 0.02 imply that a one-unit increase in the V Index is associated with a 0.03 percentage point contemporaneous increase and a further 0.02 percentage point increase in business R&D intensity in the following year. While these magnitudes appear modest in isolation, they are additive: a sustained one-year improvement in the V Index is associated with a cumulative R&D intensity gain of approximately 0.05 percentage points of GDP. For a country with a business R&D intensity of 1.5% of the GDP—close to the EU average—this represents a 3.3% relative increase.
The weakening of these associations in the two-way fixed effects model, where explanatory power is limited to within-country, within-year variation, suggests that much of the observed relationship between VC activity and R&D expenditure is driven by persistent cross-country differences in innovation systems and by common macroeconomic shocks. This interpretation is consistent with the findings of [18], who report that R&D productivity is positively associated with firm size, indicating that the aggregate R&D signal may reflect the behavior of both large, established firms and VC-backed startups.
Consequences for sustainable economic growth: Taken together, the empirical patterns documented in this study suggest that mature startup ecosystems, defined by high VC investment and divestment activity, are associated with a sequenced set of macroeconomic improvements. These include instant gains in labor productivity, followed by improvements in capital efficiency, export competitiveness, and R&D intensity over a one-to-two-year horizon. This sequencing is consistent with the theoretical model of productive entrepreneurship proposed by [32], which suggests that ecosystem outputs emerge from system-wide conditions through multiple transmission channels operating at different speeds.
The results carry important consequences for the design of sustainable development policies in Europe. First, the evidence that VC activity is associated with productivity and export improvements supports the case for public co-investment instruments, such as the European Investment Fund’s VC programs, as tools for promoting SDG 8 and SDG 9 objectives [3,4]. Second, the multi-year transmission lags documented in this study indicate that policy appraisal frameworks ought to adopt sufficiently long time horizons to capture the full economic benefits of ecosystem interventions. Third, the evidence that high-technology exports are strongly driven by global demand cycles suggests that domestic VC support should be complemented by trade facilitation and market access policies to accelerate the conversion of innovation into export performance [24].
The role of VC in financing green and sustainable innovation warrants particular attention in this context. As [7] demonstrates, clean energy startups face structural disadvantages in attracting private VC due to lower expected returns compared to digital technology ventures. This market failure justifies targeted public support, including grants, loan guarantees, and demand-side instruments, to make sustainable ventures commercially attractive and to ensure that the productivity and export benefits documented in this study prolong to the green economy transition.

6. Conclusions

The empirical findings of this study permit a set of specific, coefficient-grounded policy recommendations that go beyond general advocacy for startup ecosystem support. First, with respect to labor productivity, the estimated association of approximately 1.07 percentage points per unit of V Index implies that national policies capable of raising VC deal volume and exit intensity to the level of the top-quartile European ecosystems (Finland, Sweden, The Netherlands) could generate nearly one additional percentage point of annual labor productivity growth in the near term. Instruments with the highest expected impact include capital gains tax relief on startup exits, expansion of national fund-of-funds programs co-investing with private VC, and regulatory fast-tracking of IPO access for growth-stage firms.
Second, with respect to capital productivity, the two-year lagged coefficient of approximately 2.37 percentage points implies that the full capital efficiency benefit of a VC ecosystem intervention materializes only in the second year after deployment. Policymakers and program evaluators should therefore adopt a minimum three-year evaluation window for all VC co-investment instruments; evaluations conducted at 12 months will capture at most the contemporaneous labor productivity effect and will systematically underestimate total program value.
Third, with respect to high-technology exports, the two-year lagged random effects coefficient of approximately 0.22 percentage points of the GDP share implies that export promotion policies should be sequenced to coincide with the 18–24-month post-funding window, when VC-backed firms are most likely to be completing product certification and entering international markets. A dedicated export readiness support scheme—combining market access grants, regulatory compliance assistance, and international trade fair participation subsidies—targeted at VC-backed deep tech and ICT firms at this stage would be consistent with the estimated lag structure.
Fourth, with respect to business R&D expenditure, the cumulative two-year association of approximately 0.05 percentage points of GDP per unit of the V Index suggests that sustained VC ecosystem development is a meaningful complement to direct R&D subsidies in achieving the EU’s 3% R&D investment target. Policymakers should treat VC co-investment programs not only as tools for financing individual firms but as systemic instruments for raising aggregate business R&D intensity across the economy.
However, several limitations should be noted when interpreting these outcomes. First, the Granger causality tests failed to reject non-causality in either direction between the V Index and the dependent variables, which means that the associations documented here should be interpreted as conditional correlations rather than causal effects. Productive economies may attract more VC, and unobserved policy, institutional, or technological factors may jointly determine both VC activity and macroeconomic outcomes. Second, the unbalanced panel structure and the moderate number of time periods (ranging from 3 to 10 years across 19 to 23 countries) limit the accuracy of estimates and restrict generalizability to economies with broadly similar institutional characteristics. The consolidation of the Baltic countries due to data availability constraints introduces potential measurement error from using regional averages, which may fail to capture nuanced differences at the national level. Furthermore, the sample sizes for certain models—particularly the high-technology exports model, which relies on only 105 data points—are relatively small, limiting the statistical power and generalizability of those specific findings. Third, while two-way fixed effects and clustered standard errors address common shocks and serial correlation, they cannot fully account for cross-border VC network spillovers or for the endogenous co-evolution of VC markets and innovation systems.
Several directions for future research emerge from the results. First, the identification of the V Index’s associations with macroeconomic outcomes could be strengthened by exploiting exogenous variation in VC supply, for example, regulatory changes, tax incentive reforms, or fluctuations in public sector co-investment programs, as instrumental variables. This approach would help disentangle the direction of association between ecosystem maturity and economic performance. Second, subsequent research might extend the analytical system to trace the complete innovation pathway from VC funding to R&D investment, patent activity, product development, export growth, and productivity enhancement, incorporating exit events as state variables in a dynamic longitudinal model. Third, given the growing importance of green and deep tech startups for the sustainable transition, future studies should disaggregate VC activity by sector and investment stage to assess whether sustainability-oriented ecosystems generate distinct macroeconomic patterns relative to wider technology ecosystems [4,24]. Finally, extending the geographic scope beyond Europe to include emerging economies would allow for a more in-depth examination of the conditions under which VC-driven ecosystem maturity translates into sustainable economic growth [5].

Author Contributions

Conceptualization, L.O.N. and D.K.; methodology, D.K. and L.O.N.; experiment and data analysis, D.K. and L.O.N.; conclusions, L.O.N. and D.K.; discussion, D.K. and L.O.N.; writing—original draft preparation, D.K. and L.O.N.; writing—review and editing, L.O.N. and D.K. All authors have read and agreed to the published version of the manuscript.

Funding

This research received no external funding.

Institutional Review Board Statement

Not applicable.

Informed Consent Statement

Not applicable.

Data Availability Statement

The original contributions presented in this study are included in the article. Further inquiries can be directed to the corresponding author.

Conflicts of Interest

The authors declare no conflicts of interest.

Appendix A

Table A1. Descriptive statistics of variables.
AbbreviationVariableMeanMinMax
BERDResearch and development expenditure in the ICT sector,
% of GDP
0.170.020.63
HCHuman capital and research index50.2327.768.1
GDP GRReal GDP growth per capita, annual, %1.71−11.423.5
PRO CCapital productivity growth in the ICT sector,
gross value added per unit of net fixed assets;
% change on the previous period
3.67−30.731.7
PRO LLabor productivity growth in knowledge-intensive sectors,
% change from previous period
2.04−15.522.6
EMPLEmployment in knowledge-intensive service sectors, annually,
% from total
41.72060.2
HT EXPExports of high-technology products as a share of total exports,
annual, %
120.9443.5
ICT EXPICT services exports, % of the total trade32.6511.7100
PUB CONPublic consumption, 10k EUR347.6614.911992.07
VC INVVenture capital investment *, EUR21.170.07315.99
VC DIVVenture capital divestment *, EUR5.23052.27
VC INV COMVenture capital investment **, number of companies11.270.0572.82
VC DIVCOMVenture capital divestment **, number of companies2.59013.88
Note: * deflated to constant prices using the Harmonized Index of Consumer Prices (HICP) and normalized on a per capita basis; ** normalized per 1 million inhabitants.

Appendix B

Table A2. Descriptive statistics of the V Index by country, 2013–2024.
CountryMeanMinMax
1Austria−0.77−1.320.00
2Baltics−0.61−1.220.74
3Belgium0.58−0.433.86
4Bulgaria−1.57−1.69−1.17
5Czechia−1.58−1.74−1.39
6Denmark0.35−0.763.41
7Finland2.801.924.03
8France0.16−0.431.10
9Germany0.04−0.560.46
10Greece−1.61−1.69−1.52
11Hungary−0.54−1.170.21
12Ireland1.150.013.00
13Italy−1.46−1.59−1.29
14Luxembourg1.14−0.705.72
15Netherlands1.410.062.90
16Norway0.91−0.824.22
17Poland−1.59−1.67−1.49
18Portugal−0.73−1.110.50
19Romania−1.70−1.77−1.61
20Spain0.30−0.160.68
21Sweden2.481.413.84
22Switzerland0.66−0.131.37
23United Kingdom0.07−0.841.26

References

  1. Draghi, M. The Future of European Competitiveness. 2024. Available online: https://ec.europa.eu/draghi-report (accessed on 17 March 2026).
  2. Pisoni, A.; Onetti, A. When startups exit: Comparing strategies in Europe and the USA. J. Bus. Strategy 2018, 39, 26–33. [Google Scholar] [CrossRef] [Scilit]
  3. Pigola, A.; Fischer, B.; Moraes, G.H.S.M. Impacts of digital entrepreneurial ecosystems on sustainable development: Insights from Latin America. Sustainability 2024, 16, 7928. [Google Scholar] [CrossRef] [Scilit]
  4. Kowal, D.; Przewoźnik, W. Deep tech ecosystems as drivers of sustainable development: Entrepreneurship and innovation perspectives from Europe and Poland. Sustainability 2025, 17, 10195. [Google Scholar] [CrossRef] [Scilit]
  5. Kato, A.I. Venture capital as a catalyst for innovation and economic growth in emerging economies: A systematic review and future research agenda. Adm. Sci. 2025, 15, 405. [Google Scholar] [CrossRef] [Scilit]
  6. Owen, R.; Deffains-Crapsky, C.; Hussain, J. Financing SME green and sustainable innovation. Ventur. Cap. 2026, 28, 137–148. [Google Scholar] [CrossRef] [Scilit]
  7. Van Den Heuvel, M.; Popp, D. The role of venture capital and governments in clean energy: Lessons from the first cleantech bubble. Energy Econ. 2023, 124, 106877. [Google Scholar] [CrossRef] [Scilit]
  8. Kortum, S.S. A Model Of Research, Patenting, And Productivity Growth(NBER Working Paper No. 4646). Natl. Bur. Econ. Res. 1994. [Google Scholar] [CrossRef] [Scilit]
  9. Samila, S.; Sorenson, O. Venture capital, entrepreneurship, and economic growth. Rev. Econ. Stat. 2011, 93, 338–349. [Google Scholar] [CrossRef] [Scilit]
  10. Lerner, J.; Nanda, R. Venture capital’s role in financing innovation: What we know and how much we still need to learn. J. Econ. Perspect. 2020, 34, 237–261. [Google Scholar] [CrossRef] [Scilit]
  11. Vandresse, B.; Costa Cardoso, J.; Attorri, R.; Atangana Mvogo, W. European Startup Scoreboard—Feasibility Study; Publications Office of the European Union: Luxembourg, 2023. [Google Scholar]
  12. Radic, L.; Auer, D. A Europe Fit for the Age of Startups: Rhetoric and Reality in the EU’s Digital Package. 2025. Available online: https://laweconcenter.org/resources/a-europe-fit-for-the-age-of-startups-rhetoric-and-reality-in-the-eus-digital-package/ (accessed on 17 March 2026).
  13. Basso, A.; Baltar, E.; Andonova, E. Startup Innovation Ecosystems in Southern Europe; European Commission: Brussels, Belgium, 2018; Available online: https://ec.europa.eu/knowledge4policy/sites/know4pol/files/jrc113872-startup_ecosystems_in_southern_europe_en.pdf (accessed on 19 April 2026).
  14. Startup Genome. The Global Startup Ecosystem Report 2023. 2024. Available online: https://startupgenome.com/report/gser2025/introduction (accessed on 27 February 2026).
  15. Okunevičiūtė Neverauskienė, L.; Ginevičius, R.; Danilevičienė, I. The influence of wage and employment on competitiveness: An assessment. J. Compet. 2024, 16, 83–105. [Google Scholar] [CrossRef]
  16. Okuneviciute Neverauskiene, L.; Klepone, D. Empirical evidence on the startup growth in the Baltic Region high tech landscape. Transform. Bus. Econ. 2024, 23, 1164–1191. [Google Scholar]
  17. Kleponė, D. Economic Impact of Baltic Region Startups Ecosystems. Ph.D. Thesis, Vilnius Gediminas Technical University, Vilnius, Lithuania, 2026. [Google Scholar] [CrossRef] [Scilit]
  18. Knott, A.M.; Vieregger, C. Reconciling the Firm Size and Innovation Puzzle. Organ. Sci. 2020, 31, 477–488. [Google Scholar] [CrossRef] [Scilit]
  19. Acs, Z.J.; Audretsch, D.B. The determinants of small-firm growth in US manufacturing. Appl. Econ. 1990, 22, 143–153. [Google Scholar] [CrossRef] [Scilit]
  20. Bonini, S.; Capizzi, V. The role of venture capital in the emerging entrepreneurial finance ecosystem: Future threats and opportunities. Ventur. Cap. 2019, 21, 137–175. [Google Scholar] [CrossRef] [Scilit]
  21. Pradhan, R.P.; Arvin, M.B.; Nair, M.; Bennett, S.E.; Bahmani, S.; Hall, J.H. Endogenous dynamics between innovation, financial markets, venture capital and economic growth: Evidence from Europe. J. Multinatl. Financ. Manag. 2018, 45, 15–34. [Google Scholar] [CrossRef] [Scilit]
  22. Devarakonda, R.; Liu, A. A legitimacy-based view of the impact of government venture capital on startup innovation. Strateg. Entrep. J. 2024, 18, 55–90. [Google Scholar]
  23. Smolarski, J.; Kut, C. The impact of venture capital financing method on SME performance and internationalization. Int. Entrep. Manag. J. 2011, 7, 39–55. [Google Scholar]
  24. Duve, M.; Marx, B. Exploring sustainability in startups: A systematic PRISMA review. Sustainability 2025, 17, 6475. [Google Scholar] [CrossRef] [Scilit]
  25. Khanna, N.; Mathews, R.D. Skill versus reliability in venture capital. J. Financ. Econ. 2022, 145, 41–63. [Google Scholar] [CrossRef] [Scilit]
  26. Xu, N. Research on value-added effect of venture capital on enterprises based on data mining technology. J. Cases Inf. Technol. 2022, 24, 1–12. [Google Scholar] [CrossRef] [Scilit]
  27. Wennberg, K.; Detienne, D.R. What do we really mean when we talk about “exit”? Int. Small Bus. J. 2014, 32, 4–16. [Google Scholar] [CrossRef] [Scilit]
  28. Jeng, L.A.; Wells, P.C. The determinants of venture capital funding: Evidence across countries. J. Corp. Financ. 2000, 6, 241–289. [Google Scholar] [CrossRef] [Scilit]
  29. Manne, G.A.; Bowman, S.; Auer, D. Technology Mergers and the Market for Corporate Control. Mo. Law Rev. 2022, 86, 5. [Google Scholar]
  30. Almeida, A.; Golpe, A.A.; Martín-Álvarez, J.M.; Vides, J.C. New England’s pinnacle: Fostering quality entrepreneurial ecosystems. Eurasian Bus. Rev. 2025, 15, 243–271. [Google Scholar] [CrossRef] [Scilit]
  31. Ressin, M. Start-ups as drivers of economic growth. Res. Econ. 2022, 76, 345–354. [Google Scholar] [CrossRef] [Scilit]
  32. Stam, E. Entrepreneurial ecosystems and regional policy: A sympathetic critique. Eur. Plan. Stud. 2015, 23, 1759–1769. [Google Scholar] [CrossRef] [Scilit]
  33. Nicotra, M.; Romano, M.; Del Giudice, M.; Schillaci, C.E. The causal relation between entrepreneurial ecosystem and productive entrepreneurship. J. Technol. Transf. 2018, 43, 640–673. [Google Scholar]
  34. Croce, A.; Martí, J.; Reverte, C. The role of private versus governmental venture capital in fostering job creation during the crisis. Small Bus. Econ. 2019, 53, 879–900. [Google Scholar]
  35. Kerner, R.; Kitsing, M. Small is beautiful and important: Economies and firms trading in digital services. J. Bus. Econ. Manag. 2023, 24, 93–111. [Google Scholar] [CrossRef] [Scilit]
  36. Vekic, A.; Djakovic, V.; Borocki, J.; Sroka, W.; Popp, J.; Olàh, J. The importance of academic new ventures for sustainable regional development. Amfiteatru Econ. 2020, 22, 533–550. [Google Scholar] [CrossRef] [Scilit]
  37. Nitescu, D.C.; Murgu, V.; Bunea, M. Banking and high-tech exports: Premises for long-term added value creation? Amfiteatru Econ. 2024, 26, 650. [Google Scholar] [CrossRef] [Scilit]
  38. Kumar, S.; Russell, R.R.; Beaudry, P.; Chauvet, M.; Doiron, D.; Dowrick, S.; Pattan-Aik, P.; Schworm, D.P.B.; Woodland, A. Technological change, technological catch-up, and capital deepening: Relative contributions to growth and convergence. Am. Econ. Rev. 2002, 92, 527–548. [Google Scholar] [CrossRef] [Scilit]
  39. Okunevičiūtė Neverauskienė, L.; Linkevičius, D.; Tvaronavičienė, M. Visegrad region dependency on mining industries: Impact of raw material prices on housing prices and investments. Acta Montan. Slovaca 2025, 30, 320–331. [Google Scholar] [CrossRef] [Scilit]
  40. Garcia-Tapial, J.; Cardenete, M.A. Start-up or scale-up? An approach through economic impact. J. Manag. Glob. Sustain. 2023, 8, 10. [Google Scholar] [CrossRef] [Scilit]
  41. D’Andrea, A.M.C.; dos Santos, D.G.; Costa, C.V.P.; Zen, A.C. Why startups fail in emerging entrepreneurial ecosystems? REGEPE Entrep. Small Bus. J. 2023, 12, e2055. [Google Scholar] [CrossRef] [Scilit]
  42. Chen, X.; Liu, X. Comparing Malmquist and Hicks–Moorsteen productivity changes in China’s high-tech industries: Exploring convexity implications. Cent. Eur. J. Oper. Res. 2023, 31, 1209–1237. [Google Scholar] [CrossRef] [Scilit]
  43. Lai, Y.; Vonortas, N. Regional entrepreneurial ecosystems in China. Ind. Corp. Chang. 2019, 28, 875–897. [Google Scholar] [CrossRef] [Scilit]
  44. Almeida, F.; Miguel-Oliveira, J. The role of intrapreneurship in Portuguese startups. Period. Polytech. Soc. Manag. Sci. 2022, 30, 70–79. [Google Scholar] [CrossRef] [Scilit]
  45. Kuebart, A.; Santini, E.; Forrer, V. No islands of entrepreneurship—Mapping the trans-local dimension of entrepreneurial ecosystems through networks of accelerator participation. Small Bus. Econ. 2025, 65, 1427–1442. [Google Scholar] [CrossRef] [Scilit]
  46. Dealroom.co. Global Tech Ecosystem Index 2025. 2025. Available online: https://dealroom.co/reports/global-tech-ecosystem-index-2025 (accessed on 29 March 2026).
  47. StartupBlink. Global Startup Ecosystem Index 2025. 2025. Available online: https://www.startupblink.com/startupecosystemreport (accessed on 17 April 2026).
  48. Baltagi, B.H.; Song, S.H. Unbalanced panel data: A survey. Stat. Pap. 2006, 47, 493–523. [Google Scholar] [CrossRef] [Scilit]
Figure 1. Clusters of countries by V Index. Source: own estimation.
Sustainability 18 07212 g001
Figure 2. Annual cross-country means of the V Index and the GDP growth rate over 2013–2024.
Sustainability 18 07212 g002
Figure 3. Summary of statistically significant associations between the V Index and macroeconomic outcomes by lag structure. Note: “V Index” denotes a contemporaneous (lag 0) association; “V Index: −1 year” denotes a one-year lagged association; “V Index: −2 years” denotes a two-year lagged association. All associations are estimated using panel regression models with fixed (FE) and random (RE) or fixed two-way (FE, TW).
Sustainability 18 07212 g003
Table 1. Variables.
Table 1. Variables.
Group of VariableName of Variable, ExplanationAbbreviationPeriod
DependentExports of high-technology products as a share of total exports *, annual, %HT EXP2013–2022
Capital productivity growth in the ICT sector *, gross value added per unit of net fixed assets; % change on the previous periodPRO C2015–2024
Labor productivity growth in knowledge-intensive sectors *, % change from previous periodPRO L2015–2024
ControlResearch and development expenditure in the ICT sector *, % of GDPBERD2014–2023
Human capital and research index *** HC2013–2022
Employment in knowledge-intensive service sectors *, annually, % from totalEMPL2013–2024
Real GDP growth per capita, annual *, %GDP GR2013–2024
ICT services exports *, % of the total tradeICT EXP2016–2022
Public consumption *, 10k EURPUB CON2007–2024
ExplanatoryComposite V Index V Index
Composite V Index with 1-year lag
Composite V Index with 2-year lag
V 1l
V 2l
Components of explanatoryVenture capital investment **, EUR
Venture capital investment **, number of companies
Venture capital divestment **, EUR
Venture capital divestment **, number of companies
VC INV
VC INV COM
VC DIV
VC DV COM
2007–2024
Sources: * Eurostat; ** Invest Europe; *** WIPO.GII.2.
Table 2. Eigenvalues and proportion of variance explained by each principal component; V Index.
PCEigenvalueVariance ExplainedCumulative Variance
PC12.19354.8154.81
PC20.82820.6975.5
PC30.60915.2290.72
PC40.3719.28100
Source: own estimation.
Table 3. Variable contributions (loadings) to the V Index (PC1) from PCA.
Contribution VC INVVC DIVVC INV COMVC DIV COM
PC117.1629.1225.0528.66
Source: own estimation.
Table 4. Econometric models of the V Index on labor productivity.
Independent VariablesOLSFEREFE (TW)RE (TW)
V Index0.96 (0.41) *1.07 (0.54) *0.96 (0.49).0.92 (0.66)0.96 (0.49).
V l1−0.13 (0.43)0.00 (0.27)−0.12 (0.21)−0.01 (0.39)−0.12 (0.22)
V l2−0.30 (0.42)−0.03 (0.33)−0.26 (0.26)0.05 (0.39)−0.27 (0.26)
EMPL−0.07 (0.07)−0.23 (0.32)−0.08 (0.07)0.15 (0.45)−0.08 (0.08)
GDP GR0.43 (0.10) ***0.31 (0.09) ***0.41 (0.09) ***0.3 (0.17).0.41 (0.10) ***
Intercept4.28 (3.09) 4.74 (3.20) 4.69 (3.29)
R.sq.0.110.080.100.040.11
F statistic/Chisq, p-value0.030.010.030.240.00
Note: Values are reported as estimates (standard error). Significance levels are denoted as *** p < 0.01, ** p < 0.05, * p < 0.1.
Table 5. Econometric models of the V Index on capital productivity.
Independent VariablesOLSFEREFE (TW)RE (TW)
V Index−0.37 (0.98)0.87 (0.94)−0.45 (0.88)0.54 (1.09)−0.72 (0.15) ***
V l10.51 (1.02)1.82 (1.76)0.89 (1.32)2.07 (0.97) *0.85 (0.16) ***
V l20.28 (0.96)1.50 (0.86).0.20 (0.53)2.37 (1.07) *0.41 (0.15) **
EMPL−0.29 (0.13) *2.18 (1.05) *−0.24 (0.08) **3.12 (0.92) **−0.21 (0.03) ***
BERD−2.17 (7.86)−39.09 (20.61)−4.88 (8.08)0.84 (0.24) ***0.47 (0.03) ***
GDP GR0.42 (0.14) **0.62 (0.18) ***0.51 (0.11) **−45.50 (13.31) ***−10.18 (1.59) ***
Intercept15.16 (4.93) ** 13.76 (3.49) *** 13.54 (1.12) ***
R.sq.0.090.080.110.260.16
F statistic/Chisq, p-value0.000.000.000.000.00
Note: Values are reported as estimates (standard error). Significance levels are denoted as *** p < 0.01, ** p < 0.05, * p < 0.1.
Table 6. Econometric models of the V Index on high-tech export.
Independent VariablesOLSFEREFE (TW)RE (TW)
V Index−0.35 (0.57)0.17 (0.27)0.17 (0.27)0.006 (0.225)0.14 (0.20)
V l1−0.92 (0.56)0.15 (0.28)0.11 (0.26)0.294 (0.454)0.41(0.18) *
V l20.98 (0.49).0.24 (0.07) **0.22 (0.08) **0.185 (0.2)0.18 (0.18)
BERD−4.45 (7.02)10.4 (6.1).9.53 (6.07)−0.012 (0.022)0.03 (0.02)
ICT EXP0.17 (0.07) *−0.01 (0.02)0.02 (0.03)5.995 (8.137)7.05 (3.15) *
Intercept5.95 (2.36) * 9.32 (2.12) *** 9.55 (1.49) ***
R.sq.0.190.200.200.070.03
F statistic/Chisq, p-value0.000.000.000.330.00
Note: Values are reported as estimates (standard error). Significance levels are denoted as *** p < 0.01, ** p < 0.05, * p < 0.1.
Table 7. Econometric models of the V Index on innovation (BERD).
Independent VariablesOLSFEREFE (TW)RE (TW)
V Index0.02 (0.01).0.03 (0.02) *0.03 (0.01) *0.02 (0.01)0.02 (0.01).
V l10.00 (0.01)0.01 (0.02)0.01 (0.01)0.01 (0.01)0.01 (0.01)
V l20.01 (0.01)0.02 (0.01) ***0.02 (0.01) **0.01 (0.01)0.01 (0.01)
HC0.00 (0.00).0.00 (0.00)0 (0.00)0 (0.00)0.00 (0.00)
PUB CON0 (0)0 (0) *0 (0)0 (0)0 (0).
Intercept0.12 (0.05) * 0.17 (0.08) * 0.18 (0.09) *
R.sq.0.440.290.300.100.41
F statistic/Chisq, p-value0.000.000.000.060.05
Note: Values are reported as estimates (standard error). Significance levels are denoted as *** p < 0.01, ** p < 0.05, * p < 0.1.
Disclaimer/Publisher’s Note: The statements, opinions and data contained in all publications are solely those of the individual author(s) and contributor(s) and not of MDPI and/or the editor(s). MDPI and/or the editor(s) disclaim responsibility for any injury to people or property resulting from any ideas, methods, instructions or products referred to in the content.