1. Introduction
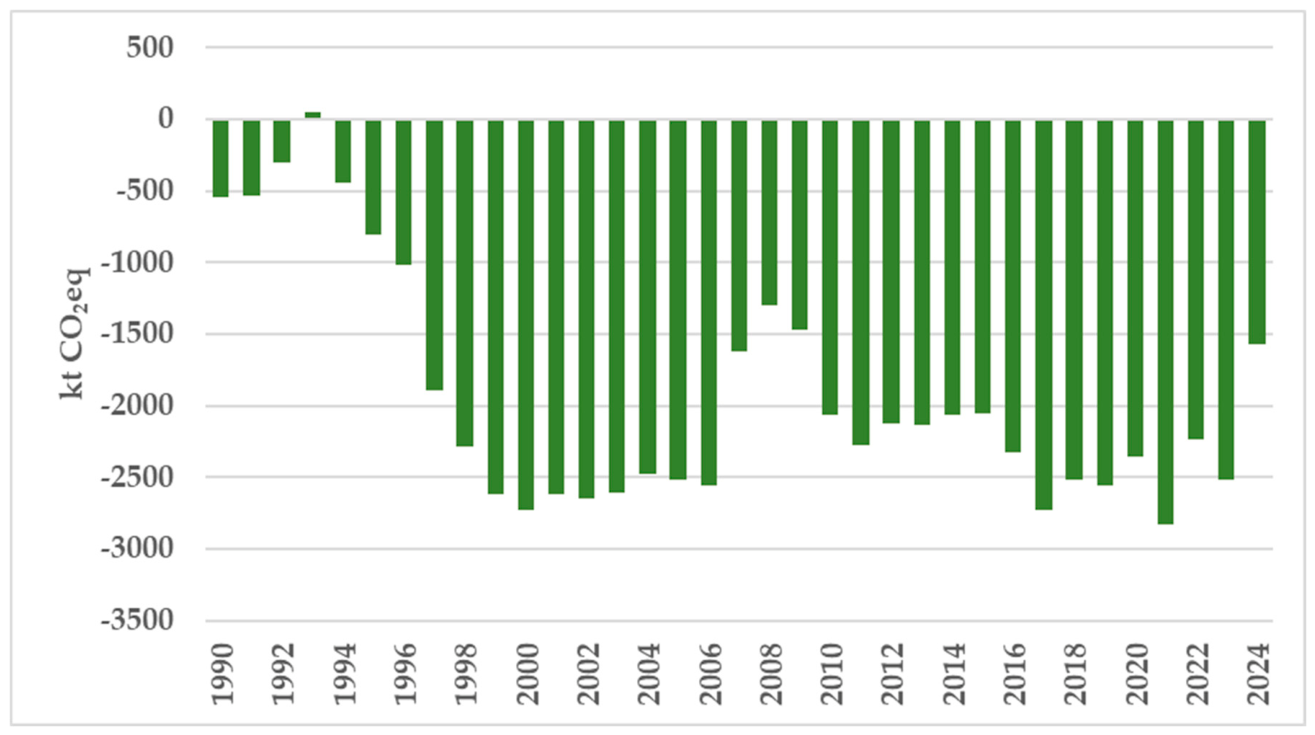
The sustainable use of wood products in building structures represents a critical element in Latvia’s transition towards climate neutrality. Utilising long-lived wood products ensures long-term biogenic carbon storage in the built environment, while simultaneously reducing reliance on emission-intensive materials such as concrete and steel. Consequently, the implementation of wood products in construction offers both a carbon storage and a material substitution effect. The Harvested Wood Products (HWP) sector acts as a carbon removal component within Latvia’s Land Use, Land-Use Change and Forestry (LULUCF) balance, and its development dynamics remain relatively stable over the long term (see
Figure 1).
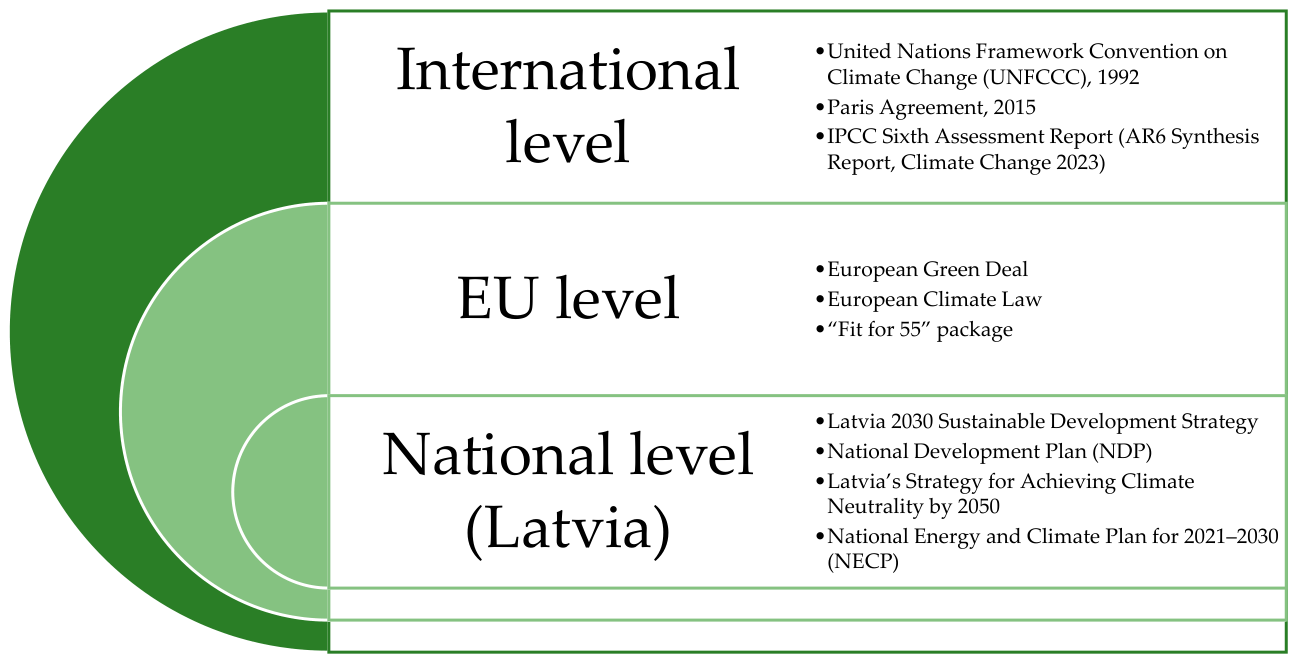
The climate policy framework of Latvia and the European Union—including key international and European Union level documents such as the UNFCCC [
2], the Paris Agreement (2015) [
3], the European Green Deal [
4], the European Climate Law [
5], the “Fit for 55” package [
6], and the IPCC AR6 Synthesis Report (Climate Change 2023) [
7]—and their integration with the Latvian construction sector and climate neutrality goals (see
Figure 2) have been analysed in detail in the authors’ prior research [
8].
In the context of climate neutrality, it is essential to comprehend the carbon cycle mechanisms in material utilisation, including the role of timber as a long-term construction material. The capacity of wood products to simultaneously store biogenic carbon and substitute emission-intensive materials has been widely analysed in the scientific literature and prior research. This work focuses specifically on the role of HWP in the carbon cycle and its quantitative modelling within the context of the Latvian building stock.
1.1. Harvested Wood Products and Long-Term Carbon Storage
Achieving global and European Union climate neutrality goals requires precise and transparent accounting of carbon removals. IPCC guidelines [
9] serve as the primary methodological basis for preparing National GHG Inventory Reports, including HWP accounting. The 2019 Refinement to the 2006 IPCC Guidelines (Chapter 12: Harvested Wood Products) [
10] includes updated approaches for assessing HWP carbon stocks, defining specific product categories, half-lives (35 years for sawnwood, 25 years for wood-based panels, and 2 years for paper), and calculation principles for carbon flows considering material lifecycles. This methodology ensures a comparable and harmonised approach to evaluating HWP carbon stocks at the national level.
The carbon storage potential of HWP and its importance in climate change mitigation are extensively analysed in scientific studies and international reports. Pingoud et al. [
11] provide a detailed comparison of different HWP accounting approaches, illustrating variations in emission allocations across countries and emphasising the role of HWP in climate mitigation. Studies indicate that substituting traditional building materials like concrete and steel with long-lived wood products can reduce GHG emissions due to lower fossil emissions and carbon storage within the material itself. Johnston et al. [
12] analyse the HWP carbon storage potential across 180 countries for the period 1961–2065, using historical FAOSTAT data and future socio-economic scenarios to forecast carbon flows. Their findings indicate that the global HWP carbon pool provided a net stock increase of approximately 335 Mt CO
2 equivalent per year in 2015, which could rise to 441 Mt CO
2 equivalent per year by 2030 under specific socio-economic development scenarios.
The report “Forest-based climate change mitigation and adaptation in Europe” [
13] analyses the potential of European forests and the forest sector in climate change mitigation and adaptation. It indicates that forests and wood products collectively provide approximately 380 Mt CO
2eq of net carbon removal and storage annually, offsetting about 10% of total EU-27 greenhouse gas emissions. According to policy targets proposed by the European Commission, the EU-27 LULUCF sector will need to increase net removals by approximately 50 Mt CO
2eq per year by 2030, 100 Mt CO
2eq by 2035, and 170 Mt CO
2eq by 2050.
1.2. Existing HWP Methodologies and Limitations
Sato and Nojiri [
14], analysing various HWP carbon accounting approaches (“instantaneous oxidation”, “stock-change”, “production”, “SCAD”, “simple-decay”, and “atmospheric-flow”), note that differences between methods primarily relate to the timing and geographical allocation of carbon stock changes. The authors emphasise that reducing uncertainties regarding emission and carbon stock allocation at the national level is critical for accurate global HWP flow assessments. Meanwhile, Fuller et al. [
15], analysing global forest sector models, conclude that the development of carbon capture and storage technologies can significantly enhance the carbon storage potential of HWP and the forest sector’s contribution to climate change mitigation.
HWP carbon stock dynamics and assessment approaches have been analysed across various countries, highlighting both methodological differences and the importance of long-lived wood products for achieving climate targets. A study in Romania [
16] found that HWP carbon stocks increased from 28.20 Mt C to 60.76 Mt C between 1961 and 2022, driven primarily by the growth of sawnwood utilisation. Conversely, the example of China [
17] shows a significant concentration of HWP carbon stocks in wood-based panels, which accounted for 559.73 Mt of the country’s total HWP carbon stock in 2019. The case of Lithuania [
18] illustrates that HWP carbon stock assessments vary considerably depending on the methodology and data sources used—ranging from 11.2 Mt to 19.5 Mt at the end of the study period. In Italy [
19], a study analysing HWP accounting at the regional level highlighted difficulties in applying national methodologies to smaller territorial units. Studies in Slovakia [
20] and Austria [
21] emphasise the need to promote the use of sawnwood and wood-based panels in long-lived building structures to maximise HWP carbon storage potential. In the Baltic States [
22], the structure of forestry and the wood industry have developed differently, affecting HWP carbon stock dynamics and assessment approaches. The literature analyses both methodological differences in HWP accounting and the role of durable wood products in maintaining carbon storage. Studies focused on Latvia [
23] emphasise that HWP carbon stock development is closely linked to the national structure of the forestry, wood industry, and construction sectors.
1.3. Building Stock and Material Intensity Literature
In recent years, building stock and material flow modelling approaches have expanded rapidly to quantitatively characterise material stocks in the built environment and forecast future material flows. In these approaches, material intensity (MI) indicators play a central role, describing the quantity of material relative to a building’s gross floor area (GFA) or volume, serving as vital input parameters for building stock and material flow models. Material intensity analysis is used to evaluate the volume and dynamics of materials accumulated in the building stock. The bottom–up approach relies on classifying buildings into typologies, construction periods, and structural systems, linking them to GFA and material intensity values.
Nasiri et al. [
24], analysing Finland’s wooden residential building stock, conclude that material intensity values are significantly influenced by structural systems, construction periods, gross floor area, building shape, and design solutions. The approach used in their study is based on dividing buildings into typologies and assessing the material volume of structural elements using material intensity coefficients per unit of gross floor area. The authors emphasise that variability in material intensity values significantly impacts building stock and material flow modelling results; therefore, the use of representative typologies and locally adapted data is critical. Structural timber intensity in the analysed residential buildings typically ranged from approximately 23 to 53 kg/m
2 depending on the structural system, material composition, and construction period, reflecting the construction technologies and design traditions of the respective eras. Heeren and Fishman [
25] indicate that the volume of materials in the building stock is determined by combining building inventory data with material intensity coefficients, where the material stock is characterised by the relationship between building stock volume and material intensity. Similarly, Gontia et al. [
26] utilised building stock statistical data and material intensity coefficients in residential material stock modelling to evaluate material accumulation and flows across different building typologies.
1.4. Knowledge Gap and Research Novelty
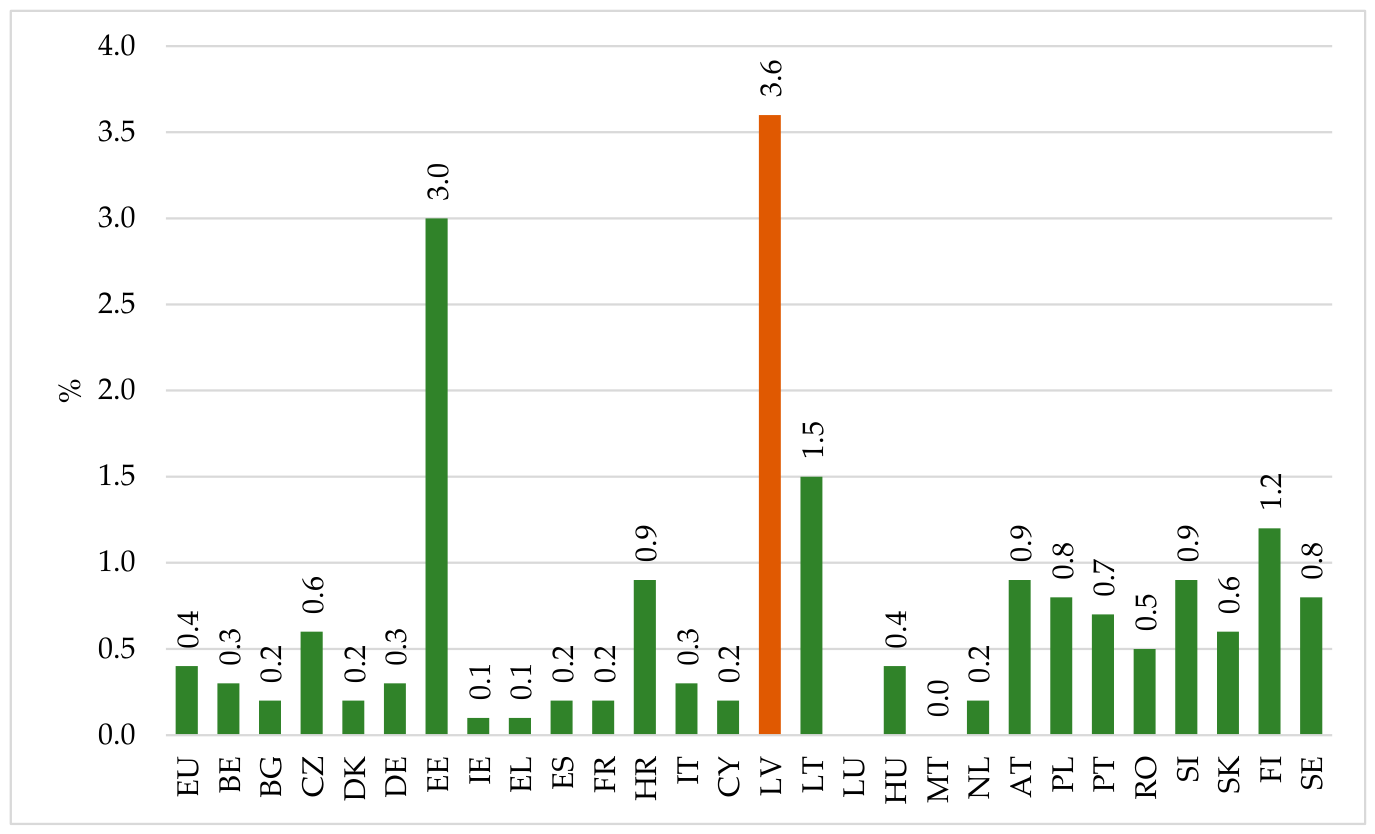
Figure 3 illustrates the gross value added by the manufacture of wood and products of wood and cork across various European countries and the EU-27 average. While the EU-27 average stands at 0.4%, the distribution of value added generated by wood product manufacturing varies widely among member states. Latvia and Estonia are leaders in this field (3.6% and 3.0%, respectively), while Lithuania (1.5%), Austria (0.9%), Finland (1.2%), and Sweden (0.8%) also display a high share of the wood industry within their total value-added structures.
These data demonstrate that wood manufacturing is the largest manufacturing sub-sector in Latvia, with its share in total industrial turnover being among the highest in the EU, hovering around 15–20% [
28] over the last decade, compared to an EU average of approximately 5%. This implies that generating value added from wood locally in Latvia can have a positive effect not only on achieving the country’s sustainable development goals but also on the national economy as a whole. The high share of the Latvian wood industry in industrial and total value-added structures indicates a potential competitive advantage for achieving climate neutrality goals using locally available resources and production capacities. Analysing and modelling HWP utilisation opportunities in building construction provides a pathway to transform this industrial potential into long-term carbon storage, thereby improving the national carbon balance.
Concurrently, scientific literature [
29] and national data [
30] lack a comprehensive assessment of structural timber and its associated HWP potential specifically at the Latvian building stock level. Existing HWP studies predominantly focus on forestry sector carbon accounting, product flows, or national-scale emissions balances, while linking building stock statistics, normative building typologies, and structural timber material intensities into a unified modelling approach remains limited in the literature. This hinders both the evaluation of potential HWP volumes in the construction sector and its integration with local wood-processing production capacity and long-term climate neutrality strategies.
This study addresses this gap by utilising a building stock and material intensity approach to evaluate the potential of structural timber and its associated HWP, linking statistical data on the Latvian building stock with detailed building typologies and structural timber material intensity values. Building-stock grouping is based on the Latvian building classification system and the building-stock characterisation used in the Long-Term Strategy for Building Renovation. In this study, structural timber volume is expressed relative to the statistically registered gross floor area of buildings using a material intensity approach, which is widely utilised in international building stock and material flow studies [
29]. Unlike previous studies that primarily focus on national carbon accounting, product flows, or forestry scenarios, this work analyses structural timber potential directly at the scale of the Latvian building stock. The results allow for an assessment of structural timber and associated HWP potential across different building typologies [
31], linking construction sector development scenarios with local wood industry production capacity and long-term biogenic carbon storage potential.
The methodological advancement of the present study lies in moving from a broad policy and sector-level assessment to a quantitative building-stock modelling framework. Specifically, this article links the Latvian building classification system with functional building groups, timber building floor-area data, group-specific structural timber material intensity coefficients, reference embedded structural timber stock estimates, adjusted HWP stock bounds, and scenario-based projections up to 2050. In contrast to the previous publication [
8], which primarily analysed the general role of timber construction within Latvia’s climate neutrality context, the present study quantifies structural timber and associated biogenic carbon storage potential at the level of selected functional building groups. The overlap between the two papers is therefore limited to the climate policy context and the broader rationale for increasing timber use in construction, while the data structure, material intensity modelling, HWP stock estimation, and scenario projections represent the new contribution of the present study.
In the context of this study, the modelling approach is intentionally positioned as a policy-oriented scenario analysis rather than a techno-economic optimisation exercise. The objective is not to determine an optimal market equilibrium share of structural timber (e.g., 30%, 50%, or 70%) but to illustrate the system-level implications of a substantial shift in construction material structure aligned with long-term climate policy objectives.
The selected time horizon of 2050 corresponds to the European Union’s legally binding climate neutrality target. Within this context, the 50% reference floor-area scenario represents a policy-oriented benchmark rather than a forecast of actual construction trends or market behaviour.
It is important to emphasise that this benchmark scenario implies not only material substitution, but also a substantially higher level of timber-based construction activity compared to historical trends. Therefore, the results should be interpreted as an illustration of potential magnitude rather than an indication of directly achievable market outcomes under current conditions.
Furthermore, this study constitutes one component of a broader research framework addressing the full lifecycle of structural timber use. The overall research design is structured into complementary analytical components, covering (i) new construction, (ii) building renovation and replacement dynamics, and (iii) circular economy pathways, including reuse and end-of-life scenarios.
The present paper focuses specifically on the new construction and net building-stock evolution component. Within this scope, the analysis quantifies the accumulation of structural timber and associated HWP under alternative development pathways.
It is important to note, however, that the benchmark scenario analysed in this study represents a high-intensity development pathway, which in practice would require not only material substitution but also increased construction and replacement dynamics within selected building groups. The modelling framework does not explicitly simulate these mechanisms, which are addressed in complementary studies within the broader research framework.
1.5. Research Aim, Hypothesis and Objectives
Research Aim: The aim of this study is to determine the potential growth of structural timber and its associated HWP volumes in the Latvian building stock using normative building typologies and a material intensity modelling approach, while identifying how this supports Latvia’s sustainable development goals.
Hypothesis: The volume of structural timber and its associated HWP can be quantitatively modelled based on building stock statistical data using normative building typologies and a material intensity approach, thereby characterising the long-term contribution of the construction sector to carbon storage.
To achieve the defined aim, the following objectives were established:
Structure the statistical data of the Latvian building stock based on the normative classification of buildings by main type of use for structural timber modelling purposes.
Develop a material intensity assessment approach to quantify structural timber volumes within the Latvian building stock.
Calculate the structural timber and associated HWP volumes for different building typologies in accordance with defined construction development scenarios.
Quantify the biogenic carbon storage in CO2 equivalent based on HWP volumes to evaluate the potential contribution to climate goals.
Compare the theoretical structural timber demand in the Latvian building stock with national structural timber-manufacturing volumes.
2. Materials and Methods
2.1. Data Sources and Building Typology
Content analysis of policy documents, monographic or descriptive methods, and the analysis and interpretation of quantitative statistical data were used to evaluate the existing and projected role of HWP in the wood industry and CO2 removal in Latvia. The graphical method was applied for synthesis and data presentation. Secondary data were obtained from the Latvian Environment, Geology and Meteorology Centre, the Official Statistics Portal of Latvia, and Eurostat.
A comprehensive approach was developed to evaluate timber utilisation in the building stock, combining statistical data analysis, structural modelling, and scenario calculations. The methodology consists of several sequential stages providing a transition from building stock statistics to timber volume and carbon storage estimates. The study relies on data regarding total building floor area and timber building area across functional groups, obtained from the State Land Service of Latvia. The building stock was structured using the Latvian building classification system in accordance with Cabinet Regulation No. 326, “Regulations on the Classification of Buildings” [
31]. Building group codes served as the base elements for typological analysis to ensure a robust link between statistical data, building function, type of use, and characteristic structural systems. A detailed description of the categories is provided in Table 2 (
Section 3.2). Initially, data were analysed using aggregated categories; however, subsequent analysis revealed that this could introduce interpretation errors due to the substantially different structures regarding storey counts and volume dynamics across building groups. Therefore, the analysis was conducted using a detailed breakdown by functional building groups.
2.2. Material Intensity Modelling and Extrapolation
Since the available statistical data did not contain detailed information on structural systems used in Latvian timber buildings, a combined material intensity approach was implemented. First, material intensity values for residential buildings in Finland [
24] were used as an initial reference for estimating timber volume in buildings. To obtain values better aligned with Latvian building practice and the scope of the present study, representative timber-frame buildings were modelled in a CADWORK CAD/CAM environment.
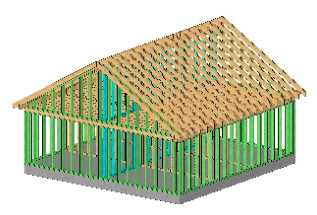
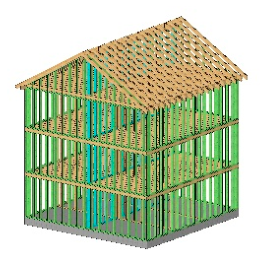
Three building models were developed: a 1-storey building, a 2-storey building, and a 3-storey building. All models shared identical geometric parameters: a footprint area of 100 m2 (10 × 10 m), a storey height of 2.8 m, and a roof slope of 30°. The models included only the load-bearing structures: external walls (45 × 195 mm, c/c 600 mm), floors/ceilings (45 × 195 mm, c/c 400 mm), roof structures (70 × 250 mm, c/c 600 mm), one load-bearing partition wall extending across the entire building length and height (45 × 145 mm, c/c 600 mm), and two non-load-bearing partition walls extending across the full building width and height (45 × 95 mm, c/c 600 mm). Finishing materials with an expected lifespan of less than 35 years were excluded. From each model, the geometric wood volume (m3) was extracted and divided by the total floor area (m2) to determine the material intensity value (m3/m2).
The CAD-based values were used as macro-level typological modelling parameters rather than deterministic design values for individual buildings. The purpose of the reference models was to provide a transparent and reproducible basis for linking building floor-area statistics to structural timber volume under standardised assumptions. Actual material intensity may vary depending on building footprint, span arrangement, structural system, roof configuration, vertical load-bearing strategy, and the use of engineered wood or hybrid timber solutions.
Based on the 1- to 3-storey building models, an extrapolation of structural timber volume was performed for higher storey counts. It was assumed that each additional storey adds a proportional volume of timber corresponding to the load-bearing structures of one floor. Consequently, the absolute timber volume (m3) increases approximately linearly, while the relative material intensity (m3/m2) decreases with an increasing storey count and approaches a lower asymptotic value under the assumed typological configuration. This extrapolation should therefore be interpreted as a simplified macro-level approximation for building-stock modelling, not as empirical validation of material intensity in multi-storey timber buildings.
To account for the uncertainty associated with geometry, structural system, and construction type, the model applies lower and upper material volume bounds. These bounds reflect the diversity of structural timber applications in the Latvian building stock, including timber-frame buildings, log buildings, mass timber structures, and more material-intensive structural configurations. Accordingly, a correction factor of 1.1 was applied for the lower bound, representing frame-type structures comparable to the reference models, while a correction factor of 1.35 was applied for the upper bound, representing structures with higher timber content. The resulting timber volumes and associated biogenic carbon storage values are therefore interpreted as interval estimates rather than single deterministic values.
For the residential buildings, the distribution of buildings by storey count is documented in national building stock data [
30]. For other functional building groups, where complete story-count distributions were not available, empirical assumption based on typical functional configurations were applied as a first approximation. A specific weighted structural timber material intensity coefficient (m
3/m
2) was then calculated for each functional building group according to its storey-count structure.
The structural timber volume for each functional building group was calculated using the relationship between total building area, timber building share, and material intensity:
where
Vi,t is the structural timber volume in a specific building group and year (m
3),
Ai,t is the total building area (m
2),
si,t is the share of timber buildings within that group, and
ki is the weighted structural timber material intensity coefficient (m
3/m
2). The total structural timber demand was determined by summing the results across all functional building groups:
Biogenic carbon storage was calculated using a simplified volume-to-carbon conversion approach. The calculation applies a nominal in-service timber density of 500 kg/m
3 at an assumed equilibrium moisture content of 12%, a dry-matter carbon fraction of 0.50, and the molecular mass conversion ratio from carbon to carbon dioxide of 44/12, following IPCC HWP accounting principles [
9,
10] and the calculation logic of EN 16449 [
32].
The adopted density is supported by EN 350:2016, which provides density values at 12% moisture content for wood species marketed in Europe. For European softwoods commonly used in structural timber applications, EN 350 reports density values of 440–460–470 kg/m
3 for Norway spruce (
Picea abies) and 500–520–540 kg/m
3 for Scots pine (
Pinus sylvestris) [
33]. Therefore, the value of 500 kg/m
3 was used as a central modelling assumption for mixed embedded construction timber, rather than as an empirically measured average density of the Latvian building stock.
Accordingly, one cubic metre of embedded structural timber was converted as follows:
where
is the timber density at 12% moisture content. Using the adopted nominal density of 500 kg/m
3, this gives approximately 0.82 t CO
2eq/m
3, which was rounded to 0.8 t CO
2eq/m
3 for the scenario calculations. The corresponding simplified mass-based factor is approximately 1.6 kg CO
2eq per kg of timber at 12% moisture content.
The actual species mix, product type, age, source, and density distribution of structural timber embedded in the Latvian building stock are not documented in the available building stock statistics. Therefore, a detailed species-specific carbon conversion was considered outside the scope of this macro-level building-stock model. To indicate the sensitivity of the carbon conversion step, the EN 350-based density range for European spruce and pine at 12% moisture content corresponds approximately to 0.72–0.88 t CO2eq/m3. This range is reported as a conversion-factor sensitivity and not as a statistical confidence interval.
2.3. Scenario Development and Embedded Structural Timber Stock Projection
Using data on floor-area distribution, the potential contribution of each functional building group to the total embedded structural timber stock was assessed. Building group “1274—Other buildings not elsewhere classified” was retained in the descriptive building stock analysis, but it was not treated as a strategic expansion group in the scenario modelling. In the static 50% reference floor-area comparison, functional groups whose 2025 timber floor-area share already exceeded the 50% reference threshold did not generate positive additional expansion potential. This applies also to group 1274. Therefore, this category is not ignored; rather, it falls outside the positive expansion potential identified by the Pareto screening.
According to Cabinet Regulation No. 326 [
31], group 1274 includes a highly heterogeneous set of buildings and auxiliary structures, such as household outbuildings, individual garages, baths, cellars, summer kitchens, greenhouses, gatehouses, individual garden houses, water closets and outhouses, as well as several specialised public-use buildings. Its average floor area is 41 m
2, compared with 155 m
2 for the overall building stock. This further supports its treatment as a separate background category rather than as a priority group for modern structural timber uptake. A Pareto approach was then applied to identify functional building groups with the greatest positive structural timber and HWP expansion potential.
Historical changes in building floor area were analysed for the selected functional groups over the period 2010–2025. The data reflect net changes in the building stock, incorporating new construction alongside demolitions and deregistration, and therefore describe overall stock evolution rather than gross new construction volumes. The analysis showed that total floor-area dynamics differed substantially between functional groups and could not be consistently represented by a single linear trend. By contrast, timber building floor area showed a more stable linear development pattern in the selected groups and was therefore used as the basis for scenario modelling.
Two deterministic scenarios were defined up to 2050. The first scenario, referred to as the historical timber floor-area trend scenario, assumes that timber building floor area continues to increase according to the linear trend observed between 2010 and 2025. Since total floor-area dynamics were not consistently linear, non-timber floor area was kept constant at the 2025 level, while timber floor area was allowed to increase according to the observed timber floor-area trend. This scenario represents the continuation of current timber construction dynamics.
The second scenario, referred to as the 50% reference floor-area scenario, was developed as a benchmark scenario rather than as a forecast of future construction activity. In this scenario, the timber floor-area share in the selected functional building groups increases linearly from its 2025 level to 50% of the 2025 reference floor area by 2050. The 50% threshold was selected as a policy-oriented benchmark and is consistent with emerging regional approaches, including the Lithuanian methodology approved in 2024, where building product shares are linked to the balance between biogenic CO
2 stored in structures and emissions from inorganic materials, together with structural distribution and correction factor systems [
34]. The 50% threshold therefore refers to the 2025 reference floor area and should not be interpreted as 50% of the dynamically evolving total floor area in 2050. The purpose of this scenario is to quantify the order of magnitude of structural timber and HWP potential under a substantial material substitution pathway.
For both scenarios, reference embedded structural timber stock was calculated using the group-specific material intensity coefficient. The material intensity correction factors of 1.10 and 1.35 were then applied to derive lower and upper adjusted HWP stock estimates. These adjusted estimates were carried through to the biogenic carbon storage calculation. The resulting values represent deterministic modelling bounds, not statistical confidence intervals. Formal uncertainty propagation or Monte Carlo simulation was not applied, because probability distributions for material intensity, storey-count assumptions, structural systems, and future building stock dynamics were not available. Accordingly, the reported intervals should be interpreted as scenario-based modelling ranges reflecting the main material intensity assumptions.
It should be noted that the underlying building stock data represent net changes in total floor area, incorporating new construction, demolition, and deregistration processes. Consequently, the scenario results reflect aggregate system-level dynamics rather than explicitly disaggregated construction and demolition flows.
While the modelling framework is based on net building stock dynamics, the scale of change observed in the 50% reference floor-area scenario suggests that, in practice, such an outcome would likely require a combination of new construction, replacement, and renovation processes.
Therefore, the scenario should not be interpreted as achievable solely through material substitution within unchanged construction volumes. Instead, it represents a high-level benchmark illustrating the magnitude of potential structural timber and HWP accumulation under an intensified development pathway.
The developed approach relies on several assumptions that affect result precision. Material intensity values derived from reference models may not capture the full diversity of practical structural solutions, and complete storey-count distributions were available only for selected building groups. Furthermore, the 50% reference floor-area scenario does not define a specific implementation pathway through new construction, replacement, or renovation. Nevertheless, the methodology provides a consistent macro-level framework for comparing the continuation of historical timber floor-area trends with the theoretical scale of structural timber potential in priority functional building groups.
The second scenario, referred to as the 50% reference floor-area scenario, is defined as a benchmark scenario rather than a projection of expected development.
Based on the model results, the required annual increase in embedded structural timber stock under this scenario (approximately 0.232 million m3/year) is around 24 times higher than under the historical timber floor-area trend scenario (approximately 0.0095 million m3/year).
This indicates that achieving the benchmark scenario would require a fundamental shift in construction dynamics, including significantly increased timber-based construction activity in selected functional building groups, rather than a gradual continuation of existing trends or a simple reallocation of materials.
3. Results
3.1. Wood Material Intensity by Number of Storeys
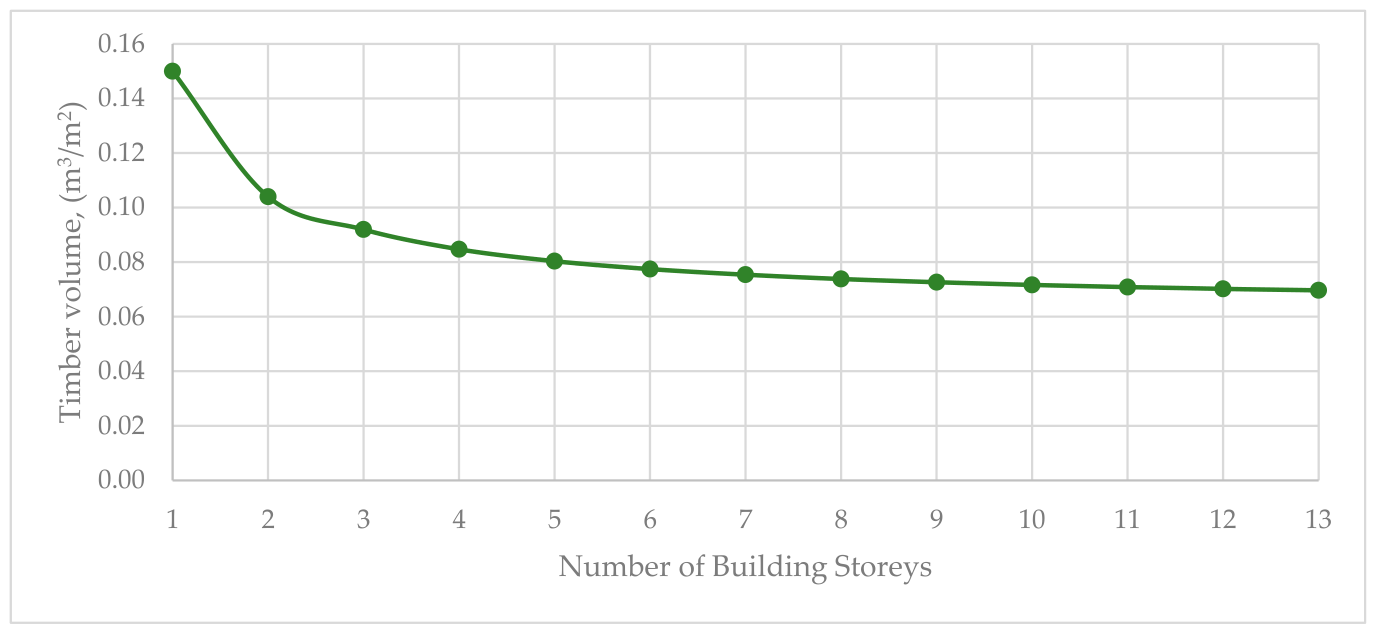
Based on the structural modelling of representative timber-frame buildings, the volume of structural timber and its relationship to floor area were quantified (see
Table 1). For a single-storey building, the material intensity is 0.150 m
3/m
2, decreasing to 0.104 m
3/m
2 for a two-storey building and 0.092 m
3/m
2 for a three-storey building.
Extrapolation to higher storey counts demonstrates that while absolute wood volume increases linearly, relative material intensity decreases and asymptotically stabilises at approximately 0.070 m
3/m
2. Correction factors (1.1 to 1.35) define the possible range across structural variations (see
Figure 4).
3.2. Existing Building Stock Structure and Timber Share
The analysis of the existing building stock reveals substantial variation across functional groups regarding both the timber building share and their significance within total floor area (
Table 2).
In contrast to the authors’ previous study [
8], where the building stock was analysed in an aggregated division between residential and non-residential buildings, this study applies a detailed typological classification of buildings in accordance with the Latvian building classification system. Such an approach is necessary to identify functional building groups with the greatest impact on structural timber volume, material intensity indicators and the HWP potential within the building stock.
The share of timber buildings by number exceeds 50% in several building groups. For example:
However, when analysed in terms of floor area, the share of timber buildings is significantly lower, indicating that larger buildings are predominantly constructed using alternative materials. For instance, in multi-apartment buildings, the share of timber by floor area is only around 6–7%, despite a relatively higher share by number.
This reveals a structural imbalance between the number of buildings and their total floor area, which has a significant effect on the overall potential for timber use.
Table 2 presents not only the share of timber buildings within each functional group but also the relative contribution of each group to the total building stock in terms of number and floor area. This approach enables the identification not only of groups with a high concentration of timber buildings but also of those functional groups that have a substantial influence on the overall structural timber volume and HWP potential within the building stock.
3.3. Wood Volume Boundaries and Pareto Analysis
Based on data from 2025 and the derived material intensity indicators, lower and upper bounds of timber volume were calculated for each functional building group (see
Table 3). The total timber volume within the building stock was estimated to range from approximately 5.979 million m
3 to 7.344 million m
3.
In the static 50% reference floor-area comparison, the potential additional embedded structural timber stock was estimated by comparing the 2025 timber floor-area share in each functional building group with the 50% reference level (
Table 4). This calculation is not interpreted as annual timber demand or as a forecast of construction activity. It is used as a screening step to identify functional building groups where the current timber floor-area share remains below the reference threshold and where additional structural timber stock could therefore be expected under the benchmark scenario.
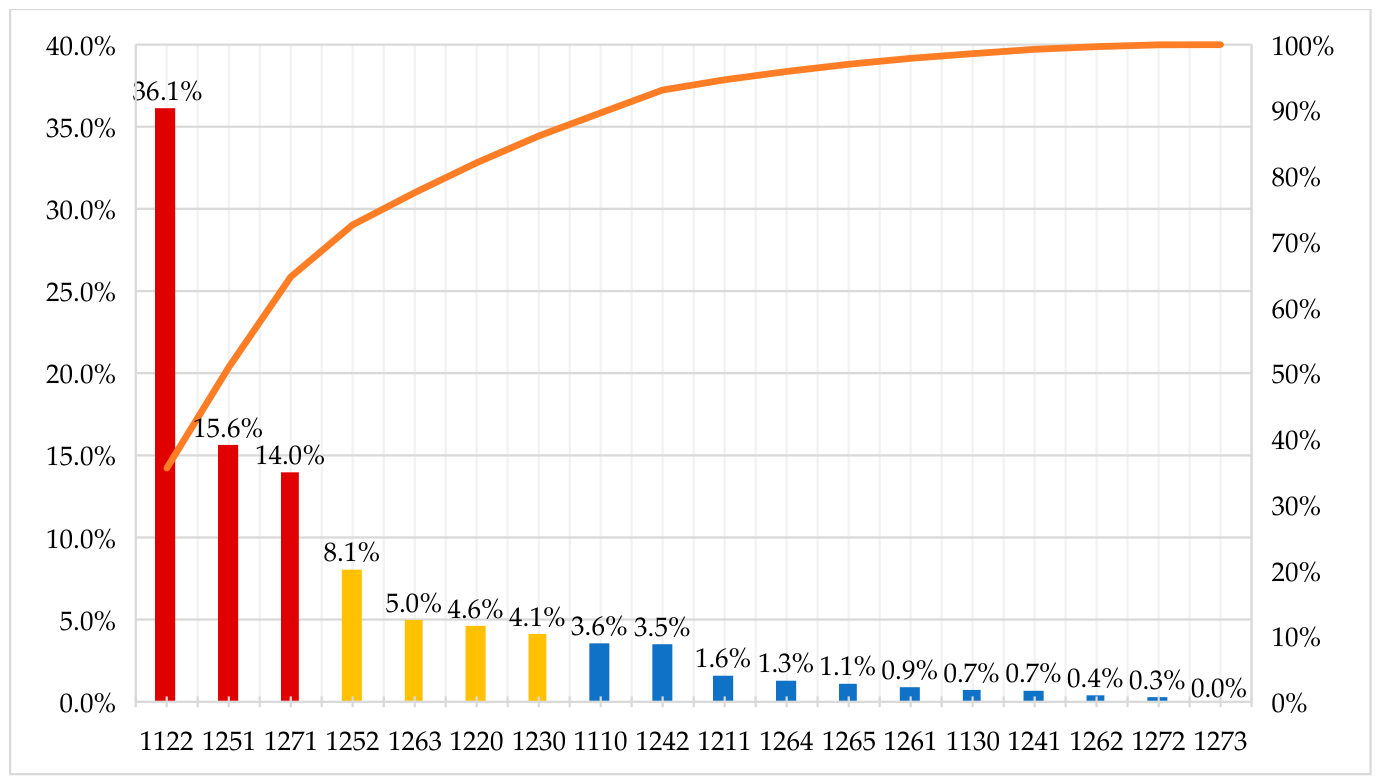
The Pareto screening shows that the main positive expansion potential is concentrated in a limited number of functional building groups. The dominant contributors are multi-apartment houses (1122), industrial buildings (1251), non-residential agricultural buildings (1271), and reservoirs, silos and warehouses (1252). These groups form the main strategic basis for the subsequent scenario modelling and policy interpretation.
Functional groups with a timber floor-area share already exceeding the 50% reference level are not treated as strategic expansion groups, because they do not generate positive additional volume in this comparison. This applies also to building group 1274 (“Other buildings not elsewhere classified”), which is documented in the existing building stock analysis but does not drive the strategic Pareto result. The category is therefore not ignored; rather, it is excluded automatically from the positive expansion potential because its current timber share is already above the reference threshold (
Figure 5).
3.4. Building Stock Development Dynamics
To evaluate trends in the use of structural timber and to prepare input data for scenario modelling, the dynamics of building floor area were analysed across selected functional building groups over the period from 2010 to 2025. The analysis focused on those building groups previously identified as the most significant in terms of structural timber use and HWP potential.
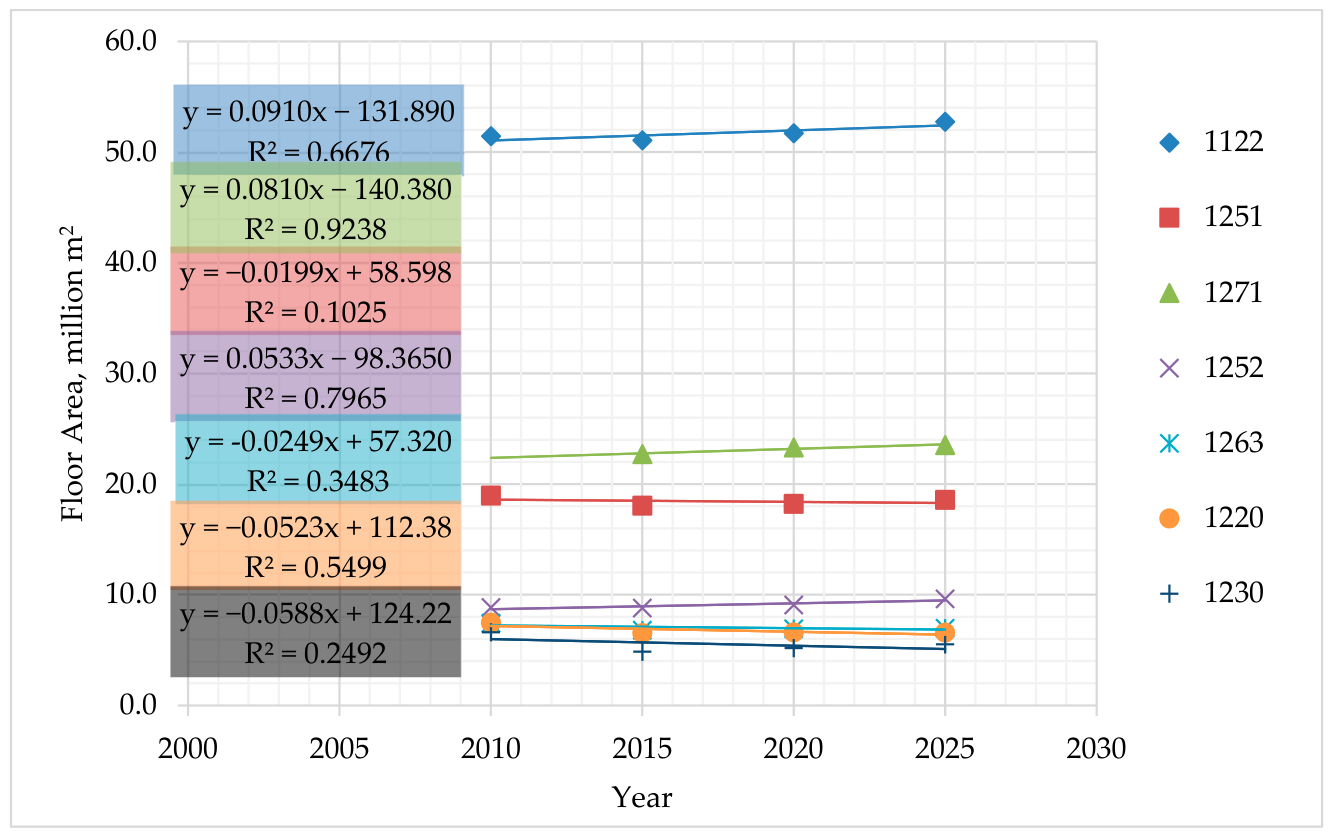
The analysed functional building groups exhibit substantially different building stock development trajectories (see
Figure 6). In multi-apartment residential, agricultural, and logistics building groups, the total floor area increased over the analysed period, whereas office, retail, and certain industrial building groups showed stagnation or a decline in floor area. This indicates that building stock development across different functional groups is uneven and cannot be interpreted as a single linear growth process in construction activity.
Regression analysis shows that the strongest linear relationship was observed in the agricultural non-residential building group (R2 ≈ 0.92), as well as in the warehouse, reservoir and silo building group (R2 ≈ 0.80), indicating relatively stable development trajectories over the analysed period. In the multi-apartment building group, moderate growth was observed with a medium level of linear correlation (R2 ≈ 0.67). In contrast, the industrial, retail, office and education building groups exhibited weaker linear relationships, suggesting greater variability or uneven development dynamics during the analysed period.
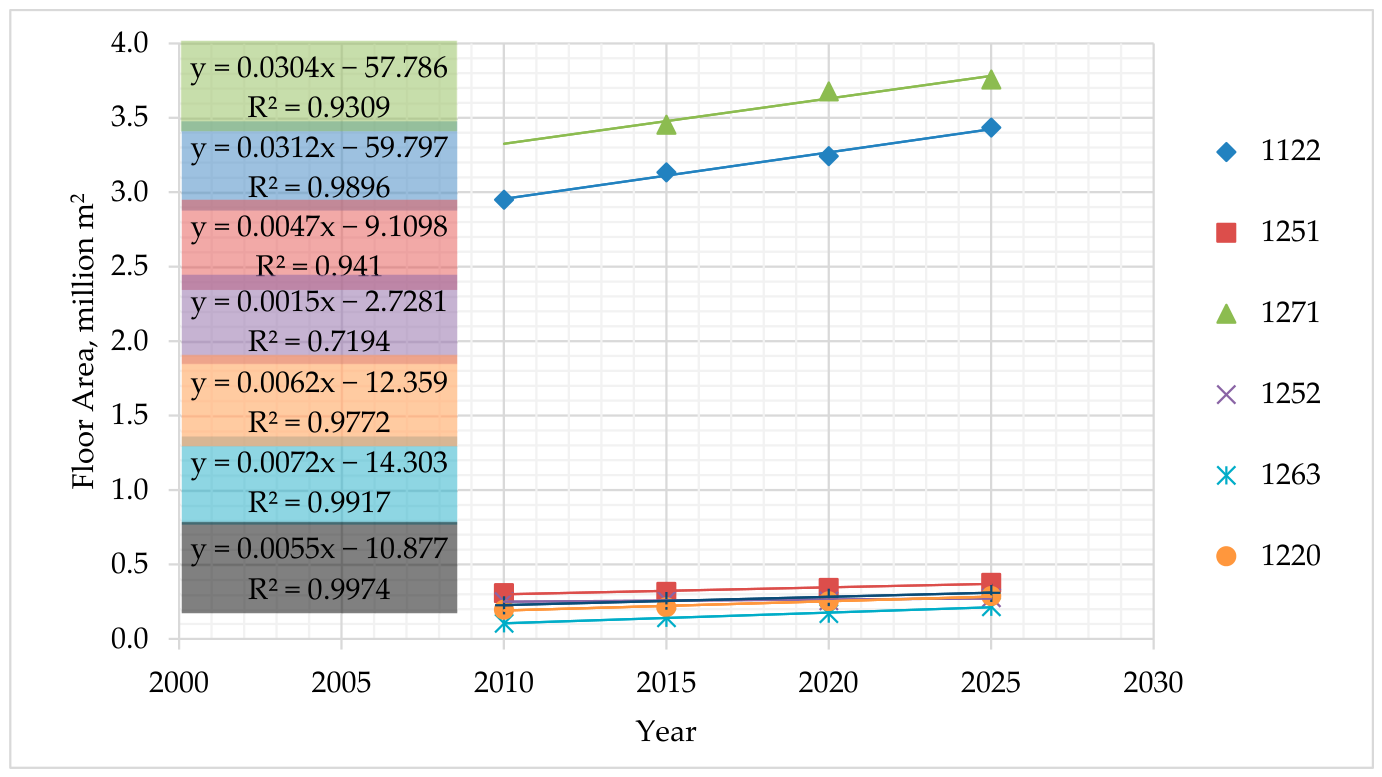
Despite differences in the overall building stock dynamics, changes in the floor area of timber buildings across several functional building groups show a more pronounced linear development trend (see
Figure 7). The highest linear correlation was observed in the multi-apartment building group (R
2 ≈ 0.99), and in office, retail, education and industrial building groups (R
2 > 0.9). This indicates relatively stable and consistent growth in the floor area of timber structures over the analysed period, regardless of the overall development trends within the respective functional building groups.
In certain groups, such as agricultural buildings, the growth in timber building floor area remains positive; however, the linear relationship is weaker (R2 ≈ 0.73), indicating a more uneven development trajectory over the analysed period. Overall, the results suggest that the development of structural timber use across the analysed functional building groups is more consistent than the overall development of the building stock. This allows the application of a linear growth approach for timber building floor area as a first approximation in scenario modelling for subsequent HWP potential analysis.
3.5. Scenario Projections and Embedded Structural Timber Stock Dynamics
Based on the previously analysed building stock development dynamics and trends in the use of structural timber, two deterministic scenarios were developed to assess the potential accumulation of embedded structural timber and HWP up to 2050: (1) the historical timber floor-area trend scenario and (2) the 50% reference floor-area scenario. The scenarios differ in the assumed development of timber building floor area, while both use the same functional building group structure and group-specific material intensity coefficients.
In the (1) the historical timber floor-area trend scenario, timber building floor area in each selected functional group continues to increase according to the linear trend observed between 2010 and 2025. Non-timber floor area is kept constant at the 2025 level, and changes in total floor area are therefore driven only by the continuation of the observed timber floor-area trend. This scenario represents the continuation of current timber construction dynamics and provides a baseline for comparison.
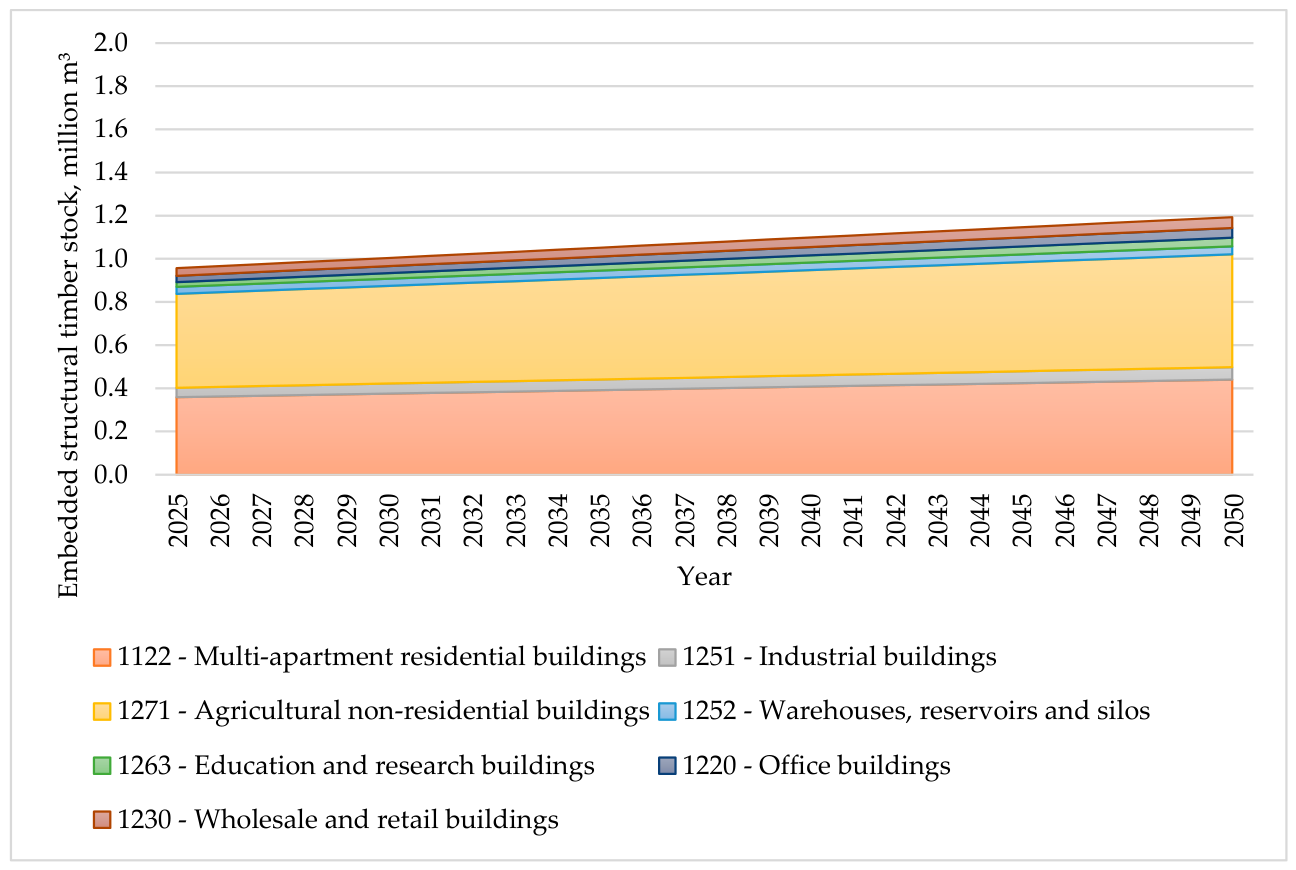
The results indicate that the total stock of embedded timber in the analysed functional building groups increases from 0.957 million m
3 in 2025 to 1.194 million m
3 in 2050 (see
Figure 8). The largest contribution to the total stock is provided by the multi-apartment residential building group (1122), followed by agricultural non-residential buildings (1271), industrial buildings (1251), and warehouses, reservoirs and silos (1252). Office, education and retail building groups contribute less to the total HWP stock, although they remain relevant for targeted timber adoption.
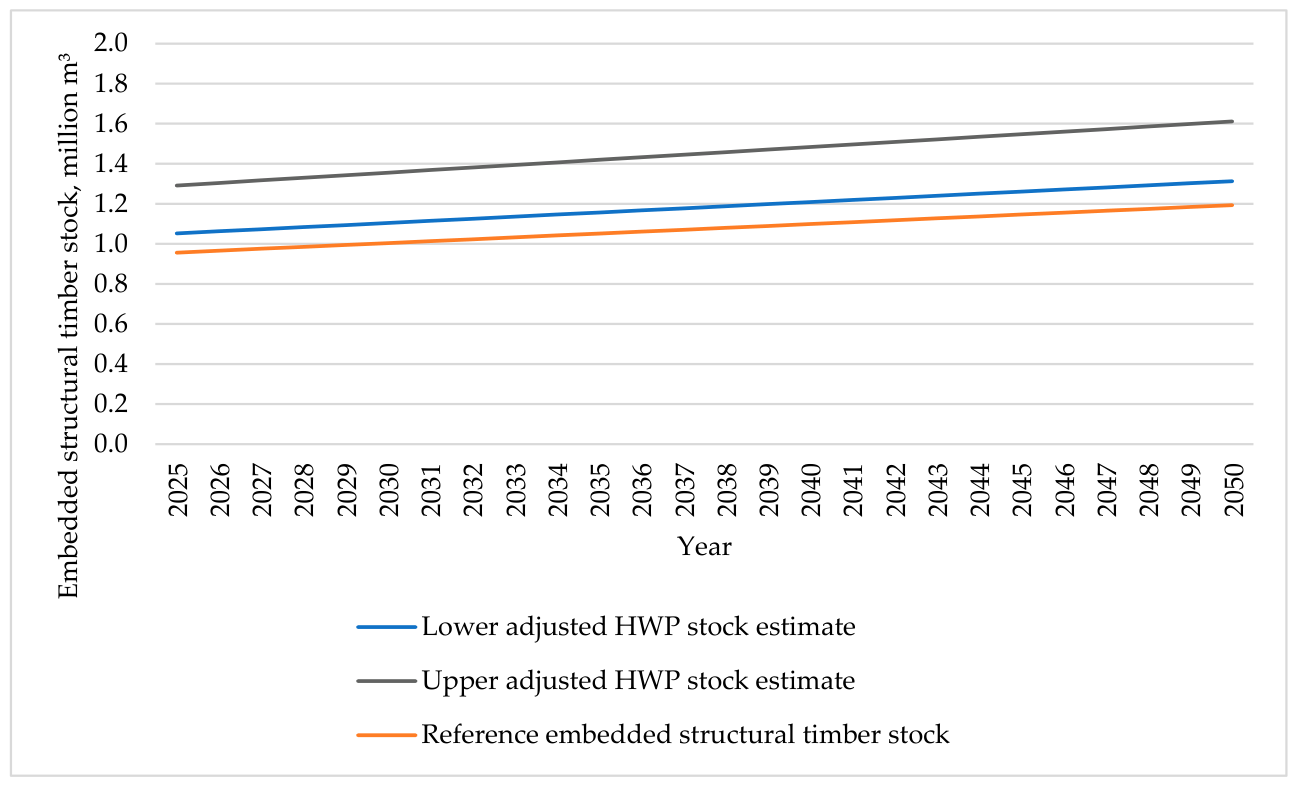
After applying the material intensity correction interval, the adjusted HWP stock estimate under the historical timber floor-area trend scenario reaches 1.313–1.611 million m
3 in 2050 (
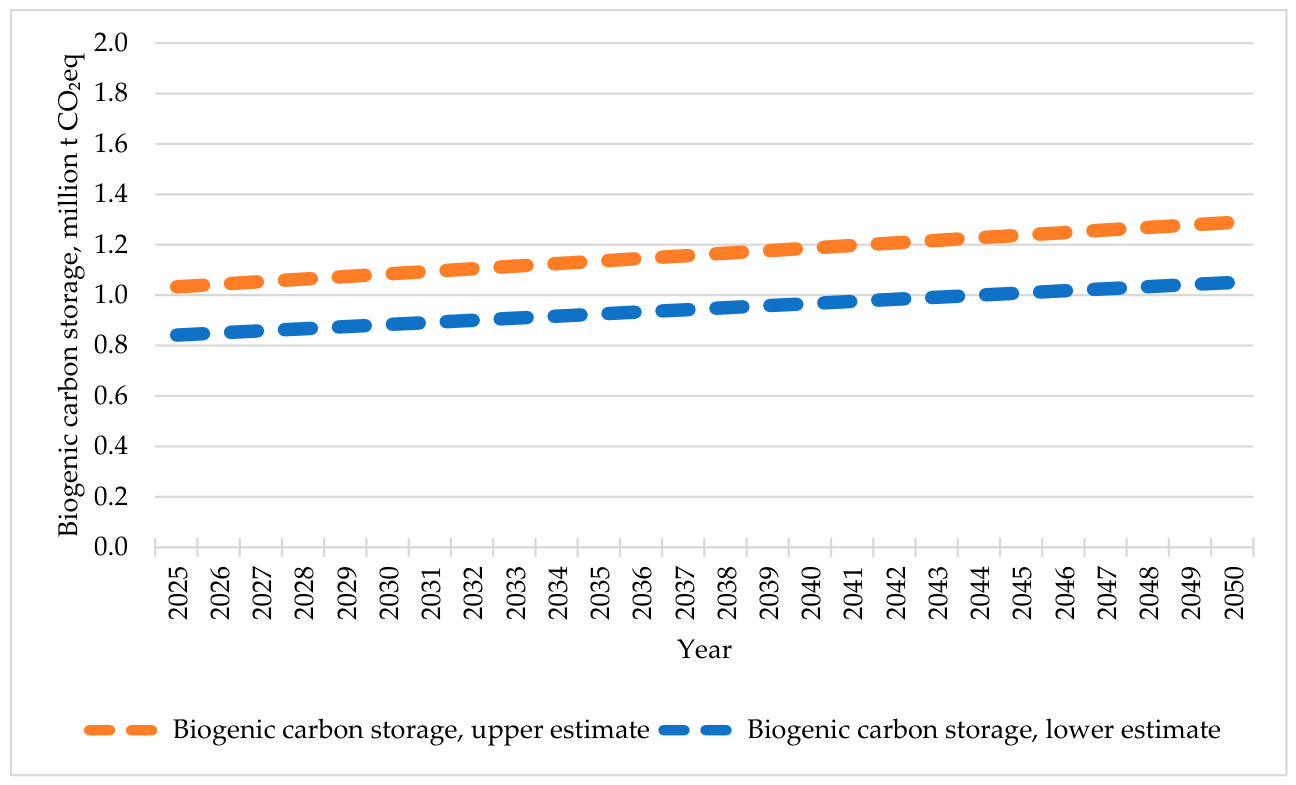
Figure 9). The corresponding biogenic carbon storage increases to 1.05–1.29 million t CO
2eq by 2050 (
Figure 10). The annual increase in reference embedded structural timber stock is approximately 0.0095 million m
3 per year, indicating that continuation of the existing timber floor-area trend results in only moderate HWP growth.
The 50% reference floor-area scenario (2) was developed as a benchmark scenario to estimate the potential scale of HWP accumulation under substantially increased structural timber use. In this scenario, the timber floor-area share in the selected functional building groups increases linearly from its 2025 level to 50% of the 2025 reference floor area by 2050. Therefore, the 50% threshold refers to the 2025 reference floor area and should not be interpreted as 50% of the dynamically evolving total floor area in 2050.
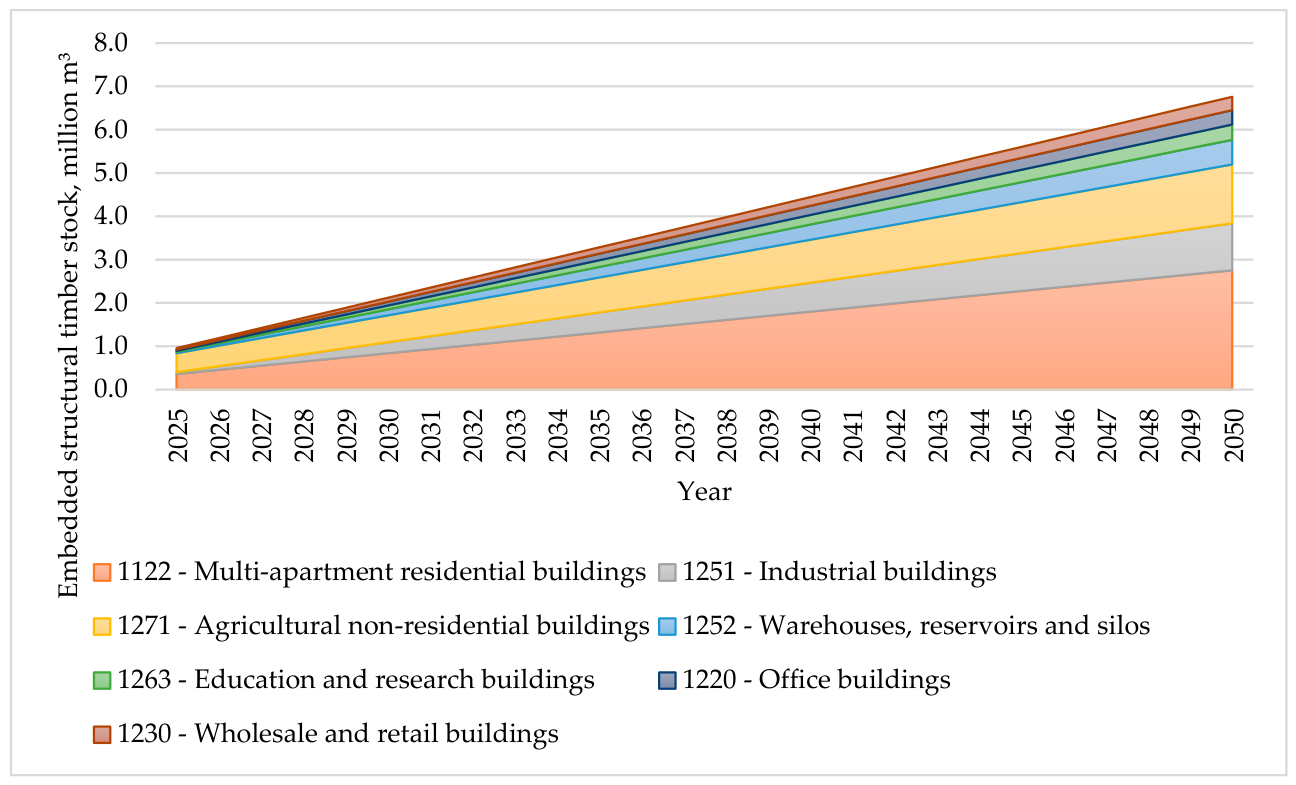
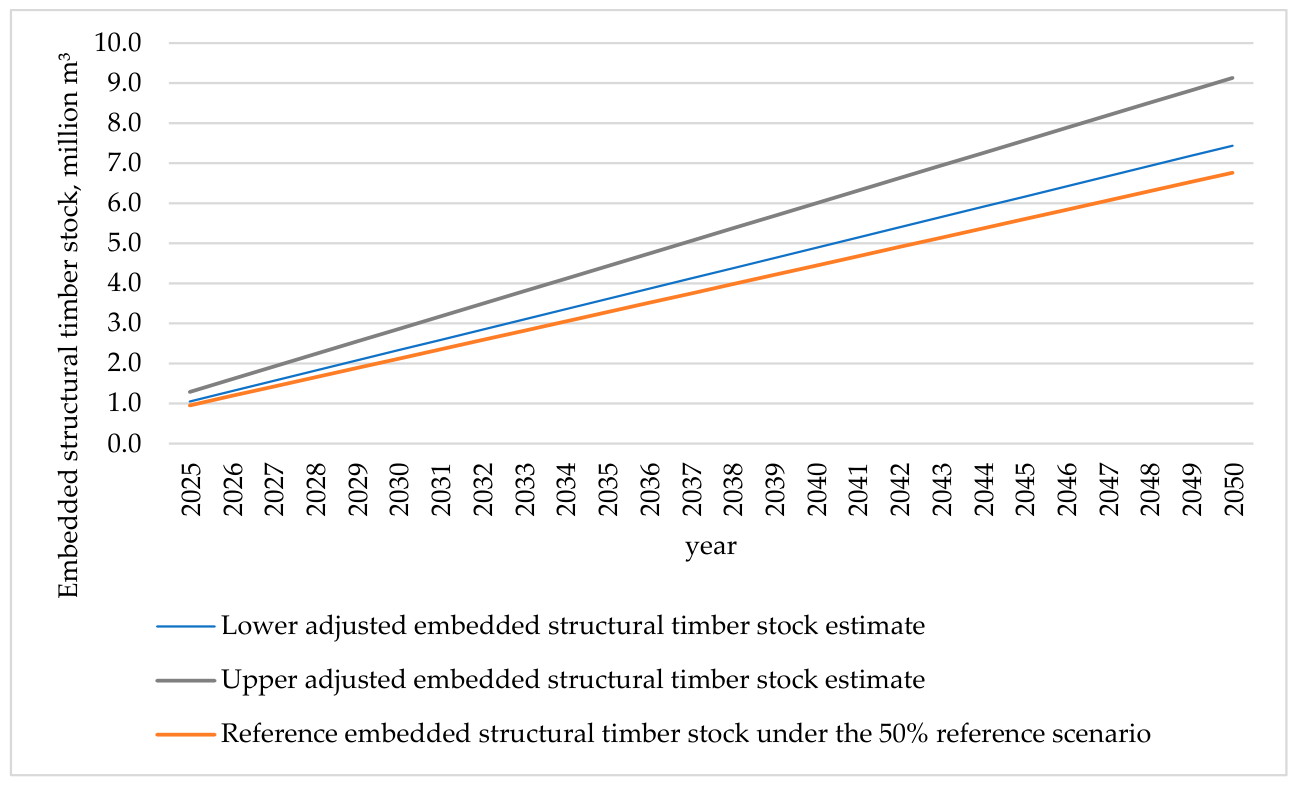
Under the 50% reference floor-area scenario, the reference embedded structural timber stock increases from 0.957 million m
3 in 2025 to 6.764 million m
3 in 2050 (
Figure 11). After applying the material intensity correction interval, the adjusted HWP stock estimate in 2050 ranges from 7.441 to 9.132 million m
3 (
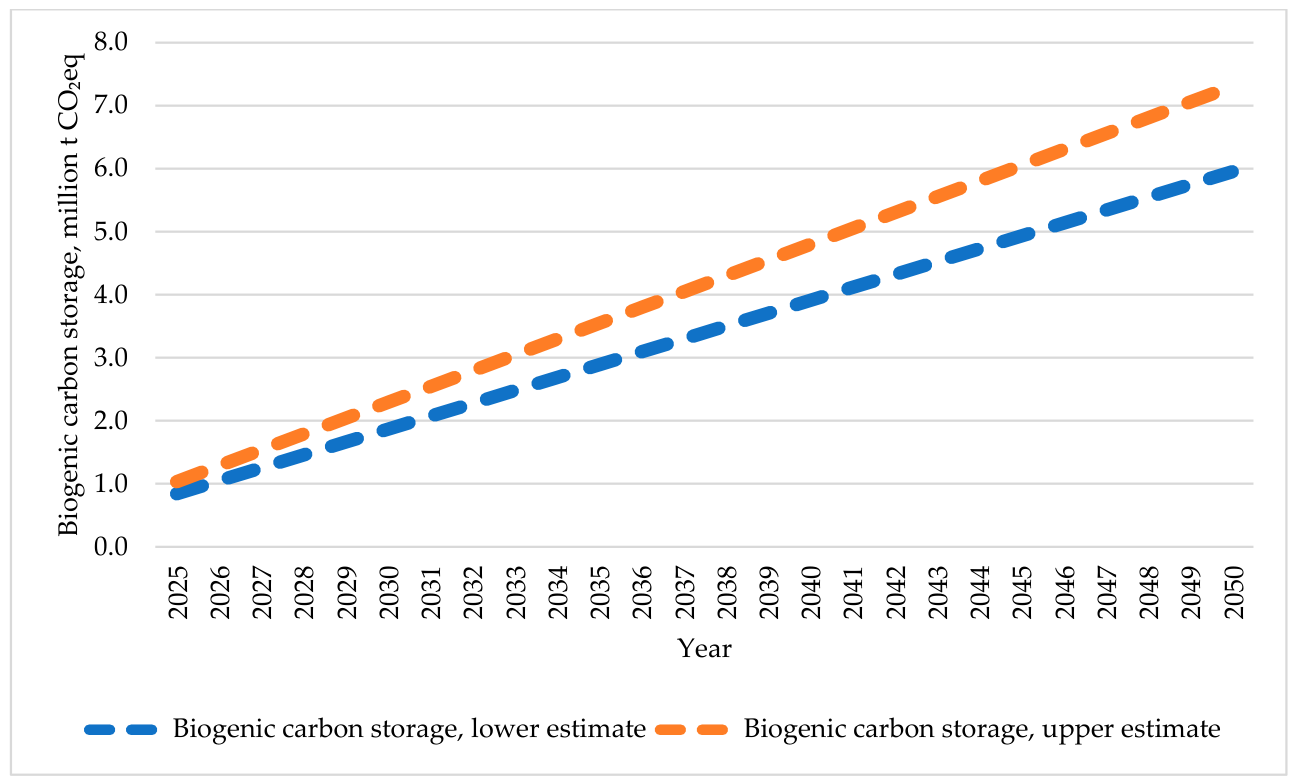
Figure 12). The corresponding biogenic carbon storage reaches 5.95–7.31 million t CO
2eq by 2050 (
Figure 13). The required annual increase in reference embedded structural timber stock under this scenario is approximately 0.232 million m
3 per year.
The comparison between the two scenarios shows that the theoretical HWP and biogenic carbon storage potential of increased timber use is substantial. By 2050, the reference embedded structural timber stock under the 50% reference floor-area scenario is approximately 5.7 times higher than under the historical timber floor-area trend scenario. However, the required annual stock increment is also substantially higher than the historical trend. This indicates that the main limitation is not only the availability of timber material, but also the rate at which timber-based construction, replacement, and renovation can realistically be implemented.
The results therefore demonstrate the difference between continuation of current timber construction dynamics and the theoretical scale of structural timber potential under a policy-oriented reference scenario. Achieving a substantially higher HWP stock would require targeted increases in timber use within priority functional building groups and should be further assessed in relation to realistic construction, replacement, and renovation rates.
4. Discussion
4.1. Significance of Material Intensity in Building Typologies
The structural modelling results indicative an inverse relationship between the number of building storeys and structural timber material intensity under the assumed reference typology. The reduction from 0.150 m3/m2 for single-storey structures to 0.092 m3/m2 for three-storey buildings, with an extrapolated value approaching 0.070 m3/m2 for higher storey counts, reflects the effect of distributing roof, floor, wall, and load-bearing elements over a larger gross floor area. However, this relationship should be interpreted as a simplified macro-level approximation rather than as a universal design-level rule for all multi-storey timber buildings.
Importantly, the baseline material intensity value established by the single-storey model (15 m
3 of timber per 100 m
2 of gross floor area) demonstrates high consistency with recent international sector benchmarks. For instance, the Wood Solutions Timber Framing Carbon Calculator [
35] assumes a typical consumption of approximately 14 m
3 of structural timber for a standard single-family dwelling of comparable dimensions.
From a material flow modelling perspective, this implies that the potential for timber use cannot be assessed solely based on relative material intensity. Equal importance must be placed on the overall structure of the building stock in terms of floor area, as well as on the functional building groups in which the largest gross floor areas are concentrated.
For this reason, even relatively low timber intensity in multi-storey or industrial buildings can still result in a substantial increase in total HWP at the national level. Nevertheless, the extrapolated material intensity values for buildings above three storeys remain a methodological limitation, as they are not validated against a purpose-sampled dataset of constructed multi-storey timber building; such validation is therefore identified as a priority for further research.
4.2. Structural Disproportions Between Building Count and Area
The analysis revealed a significant imbalance between the share of timber buildings by number and by floor area. In several functional building groups, the share of timber buildings by number is high; however, their contribution to the total building stock in terms of floor area is considerably lower.
The most pronounced example is the segment of single-family residential buildings, where the share of timber buildings exceeds 50% in terms of building count, while their share in terms of floor area is substantially lower. In contrast, the multi-apartment building group (1122) exhibits an opposite pattern, where the share of timber buildings by floor area in 2025 was only approximately 6.5%, despite the very large total floor area of the group—exceeding 52 million m2.
A similar situation is observed in industrial buildings (1251), warehouse buildings (1252), office buildings (1220), and wholesale and retail buildings (1230), where the share of timber structures by floor area remains low, while the total gross floor area of these groups is very large. These groups therefore represent the highest potential for future HWP growth.
The results also indicate that different functional building groups exhibit distinct development dynamics. Analysis of total building stock floor area over the period 2010–2025 shows that the multi-apartment building group experienced steady growth with relatively high linearity (R2 ≈ 0.67), while agricultural non-residential buildings demonstrated an even stronger linear trend (R2 ≈ 0.92). A pronounced upward trend is also observed in the warehouse and logistics segment (R2 ≈ 0.80). In contrast, office and retail building groups show stagnation or a slight decline.
Similar patterns are observed in the dynamics of timber buildings. The floor area of timber multi-apartment buildings increased from approximately 2.95 million m2 in 2010 to 3.44 million m2 in 2025, maintaining very high linearity (R2 ≈ 0.99). Timber floor area in agricultural buildings increased from approximately 3.45 to 3.76 million m2, while growth in office and retail timber building segments remained minimal.
This structural imbalance between building number, floor area, and the share of timber structures represents one of the key factors determining the overall HWP potential in the building stock.
4.3. Pareto Effects in Embedded Structural Timber Stock Potential
The results indicate a Pareto-type distribution in the positive expansion potential of embedded structural timber stock. Under the static 50% reference floor-area comparison, the majority of additional structural timber potential is concentrated within a limited number of functional building groups.
The dominant contribution is observed in the following:
Multi-apartment residential buildings (1122);
Industrial buildings (1251);
Agricultural non-residential buildings (1271);
Warehouse and logistics buildings (1252).
Under the static 50% reference floor-area comparison, the potential additional volume of embedded structural timber in the multi-apartment building group exceeds 2.6 million m3, while in the industrial building group it exceeds 1.1 million m3. In agricultural buildings, the additional potential reaches more than 1.8 million m3, and in the warehouse sector approximately 0.6 million m3.
This indicates that measures aimed solely at increasing timber use in the single-family housing sector cannot generate a significant systemic effect on the overall HWP balance. To achieve a substantial impact on the carbon storage potential of the construction sector, a targeted approach is required, focusing on large-scale functional building groups with substantial floor area and currently low timber floor-area shares.
From an industry development perspective, this highlights the need to advance the following:
Multi-storey timber structural systems;
Timber-based solutions for industrial and logistics buildings;
Design and fire safety expertise;
Regulatory frameworks;
Domestic production capacity for structural timber and engineered wood products.
4.4. Systemic Impacts of Scenario Projections
The comparison between the historical timber floor-area trend scenario and the 50% reference floor-area scenario shows that the theoretical potential for increasing embedded structural timber stock is substantial. However, this potential should be interpreted as a benchmark for the scale of transition required rather than as a direct forecast of market development. The historical timber floor-area trend scenario results in only moderate HWP stock growth, while the 50% reference floor-area scenario requires a substantially higher annual increase in structural timber use.
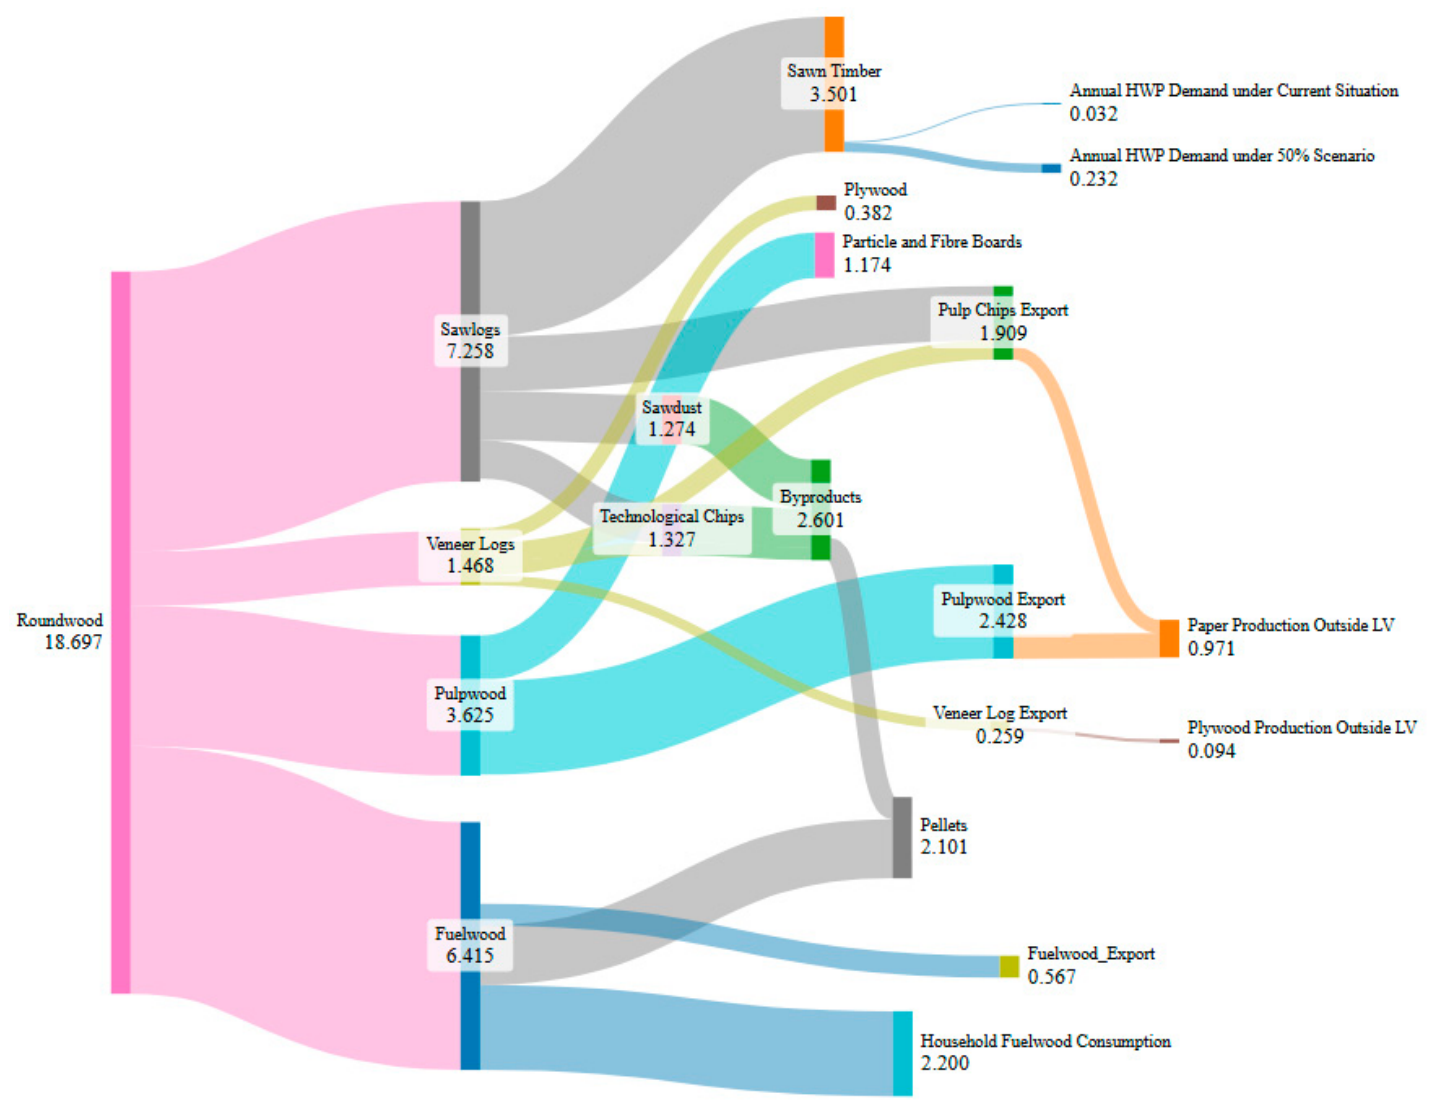
Under the 50% reference floor-area scenario, the required annual increase in reference embedded structural timber stock amounts to approximately 0.232 million m
3 per year. When compared with Latvia’s sawn timber production flow of approximately 3.501 million m
3 per year [
36], this corresponds to about 6.6% of annual sawn timber production. The Sankey-based comparison indicates that the required material flow is not prohibitive in relation to national sawn timber production volumes. However, this should not be interpreted as evidence that the scenario is directly achievable under current construction dynamics.
The main limitation is not only material availability, but also the rate at which timber-based construction, replacement, and renovation can realistically be implemented. Achieving a substantial increase in HWP stock would require coordinated changes across the construction and wood-processing value chain, including product availability, logistics, design competencies, fire safety solutions, regulatory development, education, and professional training. Therefore, increasing the use of timber in construction should not be interpreted merely as a material substitution issue, but as a systemic transformation involving both the construction sector and the wood-processing industry (
Figure 14).
From a resource perspective, the required annual increase in structural timber demand under the 50% reference floor-area scenario corresponds to approximately 6.6% of Latvia’s historical sawnwood production.
While this indicates that the required timber volume is not excessive relative to national production capacity at a macro level, this should not be interpreted as evidence of straightforward implementation feasibility.
Given that the required annual increase in timber stock is approximately 24 times higher than under historical trends, the transition implies a substantial increase in construction activity and systemic transformation of the construction sector, rather than a simple reallocation of existing material flows or export volumes.
Consequently, the realization of such a scenario depends on multiple enabling factors, including regulatory frameworks, engineering and design capacity, fire safety solutions, supply chain adaptation, and market acceptance.
From a feasibility perspective, the results indicate that the additional structural timber demand associated with the target scenario represents approximately 6.6% of Latvia’s average annual sawnwood production.
This suggests that the transition can be achieved without increasing forest harvesting intensity, but rather through a reallocation of existing wood product flows, particularly by increasing the share of domestically retained long-lived HWP.
At the same time, it must be emphasised that such a transition is inherently systemic, requiring coordinated developments across supply chains, industrial capacity, professional competencies, and regulatory frameworks. These enabling conditions are not modelled as constraints in this study, but are considered endogenous to a policy-driven transformation pathway, where targeted policy measures (e.g., green public procurement, regulatory incentives, and carbon pricing frameworks) play a central role in facilitating market uptake.
4.5. Carbon Storage Potential and Climate Policy Alignment
The results of the study demonstrate that increasing the use of structural timber can contribute to the growth of HWP carbon storage within the building stock. At the same time, this potential cannot be assessed independently of the broader forestry and wood-processing system. The climate relevance of HWP depends on sustainable forest management, forest regeneration, product service life, material reuse, and circularity.
In this context, the structure of Latvia’s wood-processing industry is important. A significant share of national wood product flows already consists of long-lived HWP products, including sawn timber, plywood, panels, and other materials with potential use in structural and building applications. At the same time, a large share of these product flows is directed to export markets. This means that future strategies for increasing domestic structural timber use should consider not only the total availability of timber products but also the allocation of suitable product flows between domestic construction needs and export-oriented value chains.
The modelled annual structural timber increment of approximately 0.232 million m3 under the 50% reference floor-area scenario indicates a potential linkage between construction sector development and the HWP product flows relevant to national climate policy. However, the results should be interpreted as an order-of-magnitude estimate rather than a direct implementation pathway. Further research is needed to assess how realistic construction, replacement, and renovation rates could support higher timber use in priority functional building groups.
Future research should also examine domestic and export market flows, the distribution of HWP products by product category, the impact of construction sector demand on the national HWP balance, and opportunities to improve the efficiency of structural timber use. Such analysis would support more detailed policy recommendations on how Latvia’s forestry, wood-processing, and construction sectors can contribute to climate neutrality while maintaining economic value creation.
The estimation of biogenic carbon storage in this study is based on a simplified representation consistent with IPCC-aligned HWP stock accounting, focusing specifically on the accumulation phase of carbon in long-lived wood products within the building stock.
The analysis does not explicitly model end-of-life pathways of timber products—such as reuse, recycling, energy recovery, or landfill disposal—nor their time-dependent carbon release dynamics.
As a result, the presented results should be interpreted as gross biogenic carbon storage potential under long-lived product assumptions, and should not be interpreted as a net lifecycle-based mitigation outcome.
The dynamic representation of post-use pathways, including cascading use, circular economy strategies, and associated carbon flows over time, is outside the scope of this study.
These aspects constitute a separate analytical component within the broader research framework and will be addressed in a dedicated follow-up study focusing on end-of-life processes, material reuse, and the implications for net carbon balances in timber construction systems.
5. Conclusions
The central research hypothesis of the study is supported. The volume of structural timber and its associated HWP stock within the built environment can be estimated at macro level by linking building stock statistical inventories with normative building typologies and structural timber material intensity coefficients. However, the resulting values should be interpreted as deterministic modelling estimates rather than design-level measurements or statistical confidence intervals.
Under the assumed typological configuration, structural timber material intensity decreases as building storey counts increase, from 0.150 m3/m2 for single-storey buildings to approximately 0.070 m3/m2 in the extrapolated multi-storey range. This result indicates decreasing relative material intensity with increasing floor area, while large buildings may still contain high absolute volumes of embedded structural timber due to their substantial aggregate floor area.
A structural disproportion exists between timber building shares by count and by floor area. Timber construction is highly represented in individual low-rise residential units, but remains limited in high-area functional groups such as multi-apartment housing, industrial buildings, warehouses, and logistics facilities. This indicates that the largest latent HWP potential is not necessarily located in building groups with the highest number of timber buildings, but in those with substantial total floor area and low current timber floor-area shares.
A pronounced Pareto effect was identified in the distribution of embedded structural timber stock potential. The dominant share of latent carbon storage capacity is concentrated within four primary groups: multi-apartment houses, industrial production buildings, non-residential agricultural structures, and logistics facilities. Under the 50% reference floor-area scenario, the additional embedded structural timber potential is concentrated particularly in multi-apartment buildings, agricultural buildings, industrial buildings, and warehouses. Policy measures aimed at increasing structural timber use should therefore prioritise these functional groups in order to achieve macro-scale impacts.
For the selected functional building groups, the reference embedded structural timber stock in 2025 is estimated at 0.957 million m3. After applying the material intensity correction factors, this corresponds to an adjusted HWP stock estimate of approximately 1.053–1.292 million m3. These values provide the reference point for comparing the two deterministic scenarios developed in the study.
Under the historical timber floor-area trend scenario, the reference embedded structural timber stock increases from 0.957 million m3 in 2025 to 1.194 million m3 in 2050. After applying the material intensity correction factors, the adjusted HWP stock estimate reaches 1.313–1.611 million m3 by 2050, corresponding to 1.05–1.29 million t CO2eq of biogenic carbon storage. The annual increase in reference embedded structural timber stock is approximately 0.0095 million m3/year, indicating that continuation of the current timber floor-area trend would result in only moderate growth of structural timber and associated HWP stock.
Under the 50% reference floor-area scenario, the reference embedded structural timber stock reaches 6.764 million m3 by 2050. The adjusted HWP stock estimate reaches 7.441–9.132 million m3, corresponding to 5.95–7.31 million t CO2eq of biogenic carbon storage. Compared with the historical timber floor-area trend scenario, the reference embedded structural timber stock in 2050 is approximately 5.7 times higher. This scenario should therefore be interpreted as a policy-oriented benchmark potential rather than a forecast or directly implementable market trajectory.
The required annual increase in reference embedded structural timber stock under the 50% reference floor-area scenario is approximately 0.232 million m3/year. This is about 24 times higher than the annual increase under the historical timber floor-area trend scenario. Compared with Latvia’s annual sawn timber production flow of approximately 3.501 million m3/year, it corresponds to about 6.6%. This indicates that the required material flow is not prohibitive relative to national sawn timber production volumes. However, this does not by itself demonstrate that the scenario is directly achievable under current construction dynamics, since implementation would depend on construction and replacement rates, domestic product allocation, market uptake, logistics, design competence, fire safety solutions, regulatory conditions, and professional education and training.
Overall, the results suggest that increasing structural timber use in priority building groups can substantially increase long-term biogenic carbon storage in the Latvian building stock. The modelling framework provides an order-of-magnitude link between construction sector development and HWP carbon accounting, while highlighting the need for further research on realistic construction, replacement, and renovation rates, structural timber efficiency, product allocation between domestic use and exports, and circular end-of-life pathways.
The results should be interpreted within the defined scope of the study, which focuses on the material substitution effect and the HWP accumulation phase within the construction sector. While additional factors—such as lifecycle emissions, cost competitiveness, and renovation-driven transitions—are critical for a comprehensive system assessment, they are outside the scope of the present analysis.
The findings demonstrate that substantial climate mitigation potential exists in the construction sector through increased structural timber use, particularly within selected functional building groups. However, the results also indicate that achieving higher timber shares at the scale represented by the 50% reference floor-area scenario would require a significant increase in construction activity and building stock turnover, rather than incremental adjustments within existing development patterns.
Consequently, the study provides a robust evidence base for policymakers by illustrating the order of magnitude of structural timber and HWP potential under a policy-oriented transformation pathway, while also highlighting that the realisation of such potential depends on systemic factors including construction intensity, replacement dynamics, market readiness, and regulatory frameworks.
These findings support the development of integrated policy approaches that combine material substitution strategies with measures that influence building stock dynamics and construction activity over time.