


Abstract
Against the backdrop of optimizing national energy mix and advancing industrial low-carbon transformation to achieve sustainable socioeconomic development, this study adopts prefecture-level panel data covering 2005–2020 to reveal the spatiotemporal evolution law of carbon emissions generated by urban energy consumption. We systematically characterize emission disparities from three dimensions: total carbon output, per capita carbon emissions, and carbon emission intensity, and further adopt regression analysis to quantitatively identify core socioeconomic and industrial drivers behind energy-related carbon flows. The results indicate that China’s total urban energy carbon emissions kept rising over the research window with decelerating growth momentum. Driven by cross-regional industrial transfer and uneven energy resource endowments, high-emission zones gradually spread from eastern coastal agglomerations to northern and western inland territories, forming a stable spatial layout of high emissions in the east and north, and low emissions in the west and south. Per capita carbon emissions present striking regional differentiation: northwest resource-abundant provinces become concentrated high-value clusters, while populous southeast regions maintain relatively low levels, with inter-regional per capita emission gaps continuously widening. Nationwide carbon emission intensity maintained a persistent downward trend; high-intensity zones shrank markedly while low-carbon areas expanded continuously, and inter-regional efficiency gradients gradually converged, reflecting tangible achievements in nationwide energy conservation and low-carbon industrial transition. Overall, the gravity center of energy carbon emissions shifted northwestward, with Inner Mongolia, Xinjiang, and Ningxia evolving into major high-emission hotspots relying on fossil energy exploitation and heavy industrial layout. Statistical regression associations suggest that urban construction land expansion, economic expansion, foreign capital agglomeration, and industrial energy carbon outputs are positively correlated with urban carbon emissions; by contrast, commercial housing scale and domestic enterprise development present significant negative correlational links with emission levels. The differentiated spatiotemporal carbon landscape arises from the joint interplay of regional resource endowment, coal-dominated energy structure, industrial layout restructuring, and tiered low-carbon policy implementation, demonstrating China’s overall shift from high-carbon extensive industrial growth toward energy-efficient, low-carbon intensive sustainable development. This research delivers empirical evidence for formulating zoned carbon abatement schemes, optimizing regional energy allocation and industrial layouts, and advancing long-term low-carbon sustainable development to fulfill China’s carbon peaking and carbon neutrality targets.
1. Introduction
Over the past two decades, global carbon dioxide emissions from energy consumption have continued to rise overall, increasing from approximately 2.8 billion tons in 2005 to 3.78 billion tons in 2024, representing a cumulative growth of about 35% [1]. During this period, only one pronounced decline occurred in 2020, primarily due to the COVID-19 pandemic; emissions subsequently rebounded rapidly and continued to reach new historical highs [2]. From 2005 to 2012, emissions experienced rapid growth, with an average annual increase of approximately 2.1%, driven mainly by rapid industrialization, urbanization, and coal-dependent energy structures in emerging economies [3]. From 2013 to 2019, the growth rate slowed to about 1.0–1.3% per year. During this stage, China’s economic restructuring, the substitution of coal with shale gas in the United States, and the large-scale deployment of wind and photovoltaic power contributed to an initial decoupling between economic growth and carbon emissions [4]. From 2020 to 2024, emissions exhibited a pattern of slow growth. Following the pandemic, energy demand recovered, extreme weather events increased electricity consumption, and natural gas use expanded, collectively driving a moderate rise in emissions, with an average annual growth rate of approximately 0.8–1.1% [5]. Although renewable energy capacity and emission reduction efforts have continued to expand, the pace of substitution remains insufficient to offset the growth in global energy demand [6]. At the regional level, significant disparities are evident. Emissions in developed economies have generally peaked and begun to decline, whereas emerging economies—particularly China—have become the primary drivers of global emission growth. Consequently, the global center of carbon emissions has continued to shift eastward. After China joined the WTO in 2001, it became the “world’s factory”, and its coal-dominated energy structure led to a rapid increase in emissions, surpassing the United States to become the world’s largest emitter around 2005 [7]. Overall, China’s energy-related carbon emissions have not yet peaked. The country is currently undergoing a critical transition characterized by continued growth in total emissions, a gradual slowdown in growth rate, ongoing optimization of the energy structure, and continuous reshaping of regional emission patterns [8]. A significant gap remains between this trajectory and the rapid emissions reduction pathway required to meet the 1.5 °C target under the Paris Agreement. Therefore, in order to achieve China’s carbon peak target by 2030, it is essential to systematically investigate the spatial characteristics and temporal trends of carbon dioxide emissions from energy consumption in China [9].
Chinese scholars have made systematic progress in the study of carbon dioxide emissions from energy consumption in China, particularly in emission accounting, driving force decomposition, regional heterogeneity analysis, and policy pathway evaluation [10,11]. At the accounting level, represented by the CEADs database and the “Rock·Yuheng” large model [12], researchers have corrected the overestimation bias of IPCC default emission factors using localized coal quality data, and have extended the traditional framework into a dual-perspective accounting paradigm that integrates both production-based and consumption-based emissions [13]. At the driving force analysis level, methods such as LMDI, STIRPAT, and structural decomposition analysis have been widely applied. These studies identify per capita GDP growth as the dominant driver of rising emissions, while improvements in energy intensity play a key role in curbing emissions. Moreover, the contribution of each factor varies across different stages of development [14,15]. At the regional level, research reveals pronounced spatial imbalances in carbon emissions, as well as a significant interprovincial embodied carbon transfer network driven by inter-regional trade [16]. Accordingly, China’s 30 provinces have been classified into five categories, including efficiency-driven and economy-driven regions, providing a scientific basis for differentiated emission reduction strategies. At the policy evaluation and transition pathway level, difference-in-differences (DID) analyses confirm that carbon emissions trading pilot policies significantly reduce urban carbon intensity, mainly through mechanisms such as government subsidies, industrial upgrading, and increased R&D investment. In addition, scholars have conducted extensive studies on current carbon reduction and control strategies [17]. Relevant action plans have been proposed from the perspectives of energy targets [18], climate change performance [19], and the integration of economic benefits [20], thereby providing practical implementation pathways for carbon governance [21]. Overall, the above progress provides localized theoretical foundations and decision-making references for China to achieve its “dual carbon” goals.
From the perspective of the spatial evolution trend of emissions, there are mainly the following deficiencies in relevant research in China. Firstly, the dynamic evolution of carbon emission patterns is described using static descriptions and trend fitting at the provincial or three-zone scale [22,23]. The lack of refined causal identification and spatiotemporal heterogeneity analysis of the driving mechanisms behind shifts in emission centers of gravity, as well as spatial concentration and dispersion, leads to insufficient explanatory power regarding where it evolves and why it evolves [24,25]. Secondly, scholars’ research on the spatial evolution of emissions within urban agglomerations and at the urban scale is relatively weak, especially due to the lack of long-term carbon emission data for small- and medium-sized cities and county-level units [26]. This makes it difficult to reveal the microscopic path of emission space diffusion or contraction from core cities to the periphery during rapid urbanization [27,28]. Finally, there are few studies that provide scenario analyses of the future spatial evolution of emissions, most of which are based on extrapolation of historical trends [29,30]. There is no dynamic spatial general equilibrium model that can integrate industrial transfer policies, technology diffusion paths, and regional carbon peak timing differences, making it difficult to address the forward-looking policy question of when and where emission space converges [31,32]. We propose five hypotheses from the perspective of characterizing urbanization processes.
Hypothesis H1:
City expansion drives carbon emission growth.
Hypothesis H2:
Rising urban economies will also boost carbon emissions.
Hypothesis H3:
Better urban living contributes to lower carbon emissions.
Hypothesis H4:
Urban firm size is also correlated with carbon emissions.
Hypothesis H5:
Emissions from different sectors of the urban economy contribute to carbon growth in varying degrees, with the agricultural sector contributing significantly more.
Based on this, this study adopts the CO2 database of energy consumption produced by the China City Greenhouse Gas Working Group (CCG) and uses the ArcGIS 10.2 spatial analysis method to dynamically characterize the CO2 emission pattern and evolution trend of energy consumption in Chinese cities. Then, the SPSS 19.0 multiple linear regression statistical method is applied to construct an interpretation model for carbon emissions from urban energy consumption in China. This paper systematically analyzes the driving factors of carbon emissions from energy consumption during the process of rapid urbanization in China, providing a research basis for the formulation of policies aimed at reducing carbon emissions from energy consumption in China. The theoretical contribution of this study to the study of urban carbon emissions in China consists of mainly two aspects. Firstly, we clarify the spatiotemporal coupling law of the differentiation of three types of carbon emission indicators. It explains the inherent mechanism of industry moving westward, with resource endowment and urbanization jointly shaping the pattern of high in the east, low in the west, high in the north, and low in the south. Secondly, a carbon emission interpretation model is constructed from urbanization perspectives at the city scale, economic level, and enterprise scale. This study fills in the gaps of existing research on the differential emission effects of urban construction and market entities.
2. Methods and Materials
2.1. Research Methods
2.1.1. Energy Consumption Carbon Emission Level Measurement Indicators
Common indicators to measure carbon emission level of energy consumption mainly include total carbon emission, per capita emission, and carbon emission intensity [33,34]. These indicators can quantify the scale, efficiency, and intensity of carbon emission in Chinese cities from different dimensions.
The formula for calculating emissions per capita is:
where represents the carbon emissions per capita of the city’s energy consumption (unit: t/person), C represents the total urban population (unit: 104 persons), and represents the total amount of carbon emissions from urban energy consumption (unit: 104 t).
The formula for calculating carbon emission intensity is:
where represents the carbon emission intensity of urban energy consumption (unit: t/104 RMB), and represents the total Gross Domestic Product of the city in that year (unit: 108 RMB).
2.1.2. Standard Deviational Ellipse
The Standard Deviation Elliptic Algorithm was proposed by sociology professor D. Welty Lefever in 1926 to measure the direction and distribution of a set of data [35,36]. The standard deviational ellipse method was used to characterize the carbon emission trend of urban energy consumption in China. The elliptical trend of carbon emission in Chinese cities from 2005 to 2020 was calculated, and the future carbon emission trend of Chinese cities was predicted by the elliptical orientation, area, and long and short axis evolution trend. Among them, the ellipse area can represent the change in carbon emission scale, and the azimuth angle and long and short axis change can explain the change in carbon emission azimuth. The calculation formula is as follows:
where {, } represents the average center of gravity of the feature, and are the coordinates of n features, and m is the total number of features.
2.1.3. Carbon Emission Interpretation Model
China’s urbanization and industrialization have led to a rapid increase in energy consumption, resulting in a sharp rise in carbon emissions. When exploring the driving factors behind the unbalanced distribution of carbon emissions from energy consumption, urbanization indicators should be used as primary research samples. This study aims to systematically explore the impact of urban development on carbon emissions. We model this from the dimensions of urban construction indicators, such as city size, industry, population, economy, and energy consumption. SPSS 19.0 software was used to construct the interpretation model for the carbon emission differences in energy consumption [37,38]. The dependent variable is , and the independent variables are city size, economy, and industry-related indicators. This model explains the correlation between urban energy consumption, carbon emissions, urban size, industrial structure, and the urban economy. From the perspective of these indicators, this paper analyzes the inherent impact logic of urban development and construction on carbon emission differences. By explaining the variation in the variable coefficients, the influence of each index on carbon emissions is quantified, providing a basis for local governments in Chinese cities to formulate carbon reduction and control strategies according to local conditions. The calculation formula of the interpretation model is:
where represents the carbon emissions from energy consumption of city i, is the influence coefficient of the explanatory variable, is constant, and is the value of the explanatory variable.
2.2. Data Collection
We mainly use the Chinese urban carbon dioxide emission dataset and urban statistical yearbook data. The urban energy consumption carbon emission data mainly come from the China City Greenhouse Gas Working Group (CCG) (https://lca.cityghg.com/). The data were downloaded on 30 October 2025. To address global climate change, the China City Greenhouse Gas Working Group (CCG) was established in June 2017. The main task of this working group is to build a full-caliber, full-coverage, long time-series carbon emission database for urban energy consumption in China [39,40]. The database includes total urban energy-related carbon emissions in China for 2005, 2010, 2015, and 2020. It does not provide continuous observations for 2006–2009, 2011–2014, and 2016–2019. These four time points are evenly spaced. The dataset fully covers key stages of China’s industrialization, urbanization, and low-carbon transition from 2005 to 2020. It supports analyses of total carbon emissions, per capita emissions, emission intensity, spatial pattern comparison, and standard deviation elliptical trajectory evolution. We introduce estimation errors to avoid artificial interpolation. Missing annual carbon emission values are not filled in this study. All time-series analyses characterize overall interval patterns based on changes between adjacent base years. We focus on 15-year long-term evolution features and do not analyze short-term year-to-year fluctuations. In addition, urban construction statistical yearbook data are mainly obtained from the Ministry of Housing and Urban-Rural Development of China (https://www.mohurd.gov.cn/gongkai/fdzdgknr/sjfb/tjxx/jstjnj/index.html), URL (accessed on 30 October 2025). The dataset includes 371 urban development indicators, covering land use scale, economic level, industrial structure, and investment scale. Administrative boundaries are based on the latest official divisions. The dataset does not include Hong Kong, Macao, and Taiwan.
3. Carbon Emission Characteristics of Energy Consumption
3.1. Analysis of Macroscopic Evolution Characteristics
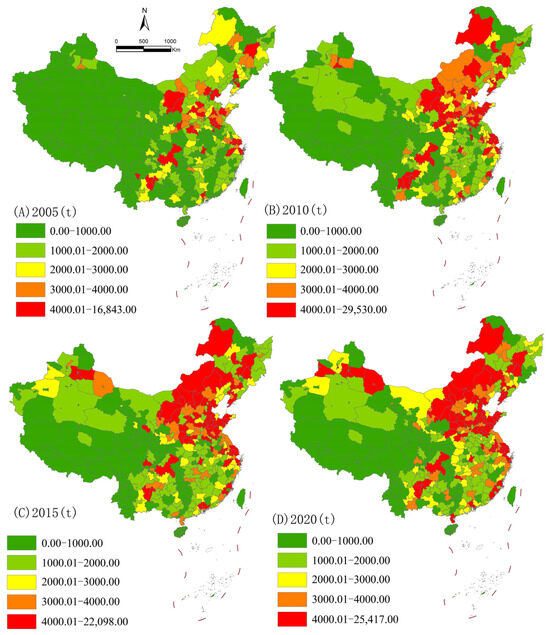
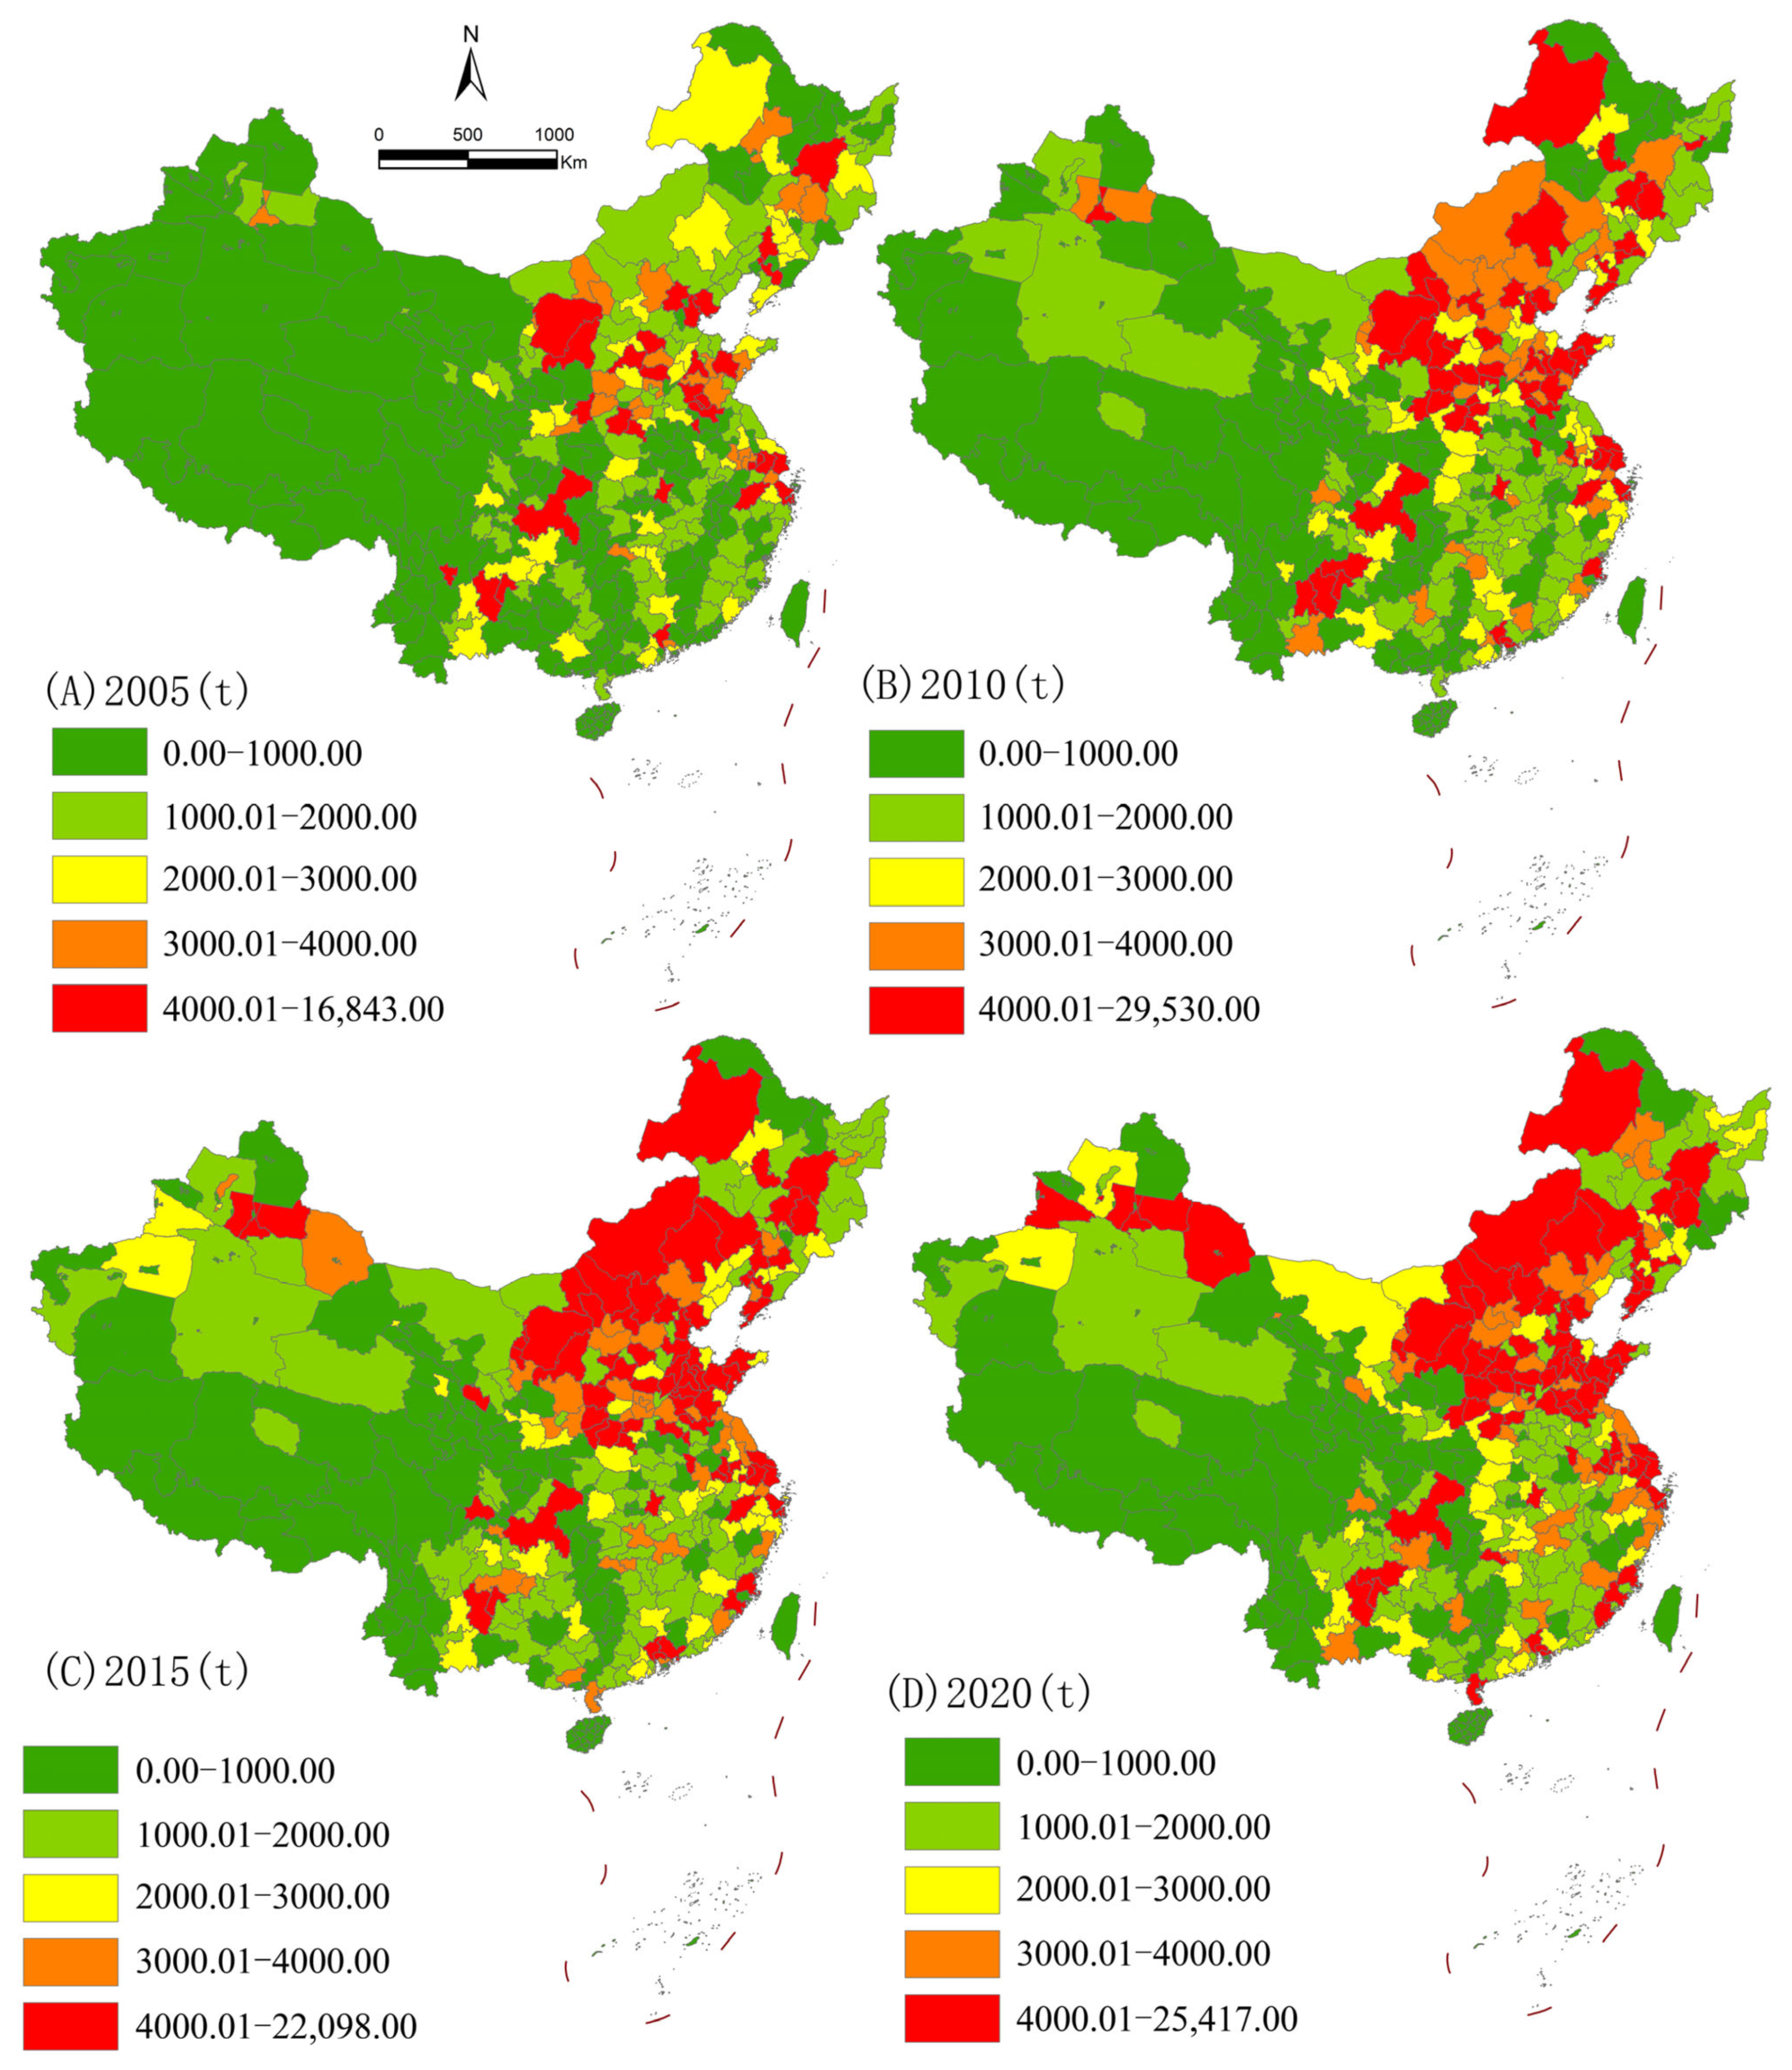
China’s energy consumption carbon emissions exhibit macro-spatial and temporal evolution characteristics, including continuous expansion of total emissions, spatial agglomeration of high-emission areas, and solidification of regional gradients. From the perspective of spatial patterns (Figure 1: the natural breakpoint classification method is first applied, then the first minimum value is taken as an integer, and subsequent categories are doubled), low-emission areas, with emissions below 1000 tons, have remained stable in regions such as the Qinghai–Tibet Plateau, the Northwest Desert, and the ecologically vulnerable areas in the southwest, which are sparsely populated and characterized by low economic activity intensity. These areas form the ecological base of the national emission pattern.
Figure 1.
Distribution of total carbon emissions from urban energy consumption in China.
Medium- and high-emission areas, with emissions above 2000 tons, were concentrated in 2005 in eastern coastal regions centered in the Beijing–Tianjin–Hebei region, the Yangtze River Delta, and the Pearl River Delta. Over time, they gradually expanded northward, westward, and into inland industrial node cities. By 2020, high-emission areas exceeding 4000 tons formed a continuous high-value belt around the Bohai Sea, North China, and Northeast China. Meanwhile, the emission intensity of urban agglomerations in the middle reaches of the Yangtze River and the Chengdu–Chongqing region increased significantly, becoming the core incremental areas of emission growth. Eventually, a stable spatial differentiation pattern of high in the east and low in the west, high in the north and low in the south, and decreasing gradients from coast to inland, was established.
From the perspective of temporal evolution, the period from 2005 to 2015 was characterized by rapid emission expansion. The scope of high-emission areas expanded significantly, emission intensity continued to rise, and energy demand increased sharply, driven by industrialization and urbanization. Heavy industry and a coal-dominated energy structures jointly drove the surge in energy consumption, significantly expanding both the scope and intensity of high emissions.
From 2015 to 2020, the growth rate slowed. The expansion of high-emission areas decelerated significantly, and some traditional high-emission regions entered a plateau stage. This reflects the mitigation effect of low-carbon transition policies on emission growth under the guidance of energy structure optimization, improvements in energy efficiency, and the “dual carbon” goals. Overall, the evolution exhibits a phased pattern of continuous growth in total volume, gradually declining growth rate, strengthened spatial agglomeration, and intensified regional differentiation.
The above spatial and temporal patterns are primarily driven by stages of economic development, industrial structure transformation, changes in the energy system, regional development strategies, and the underlying ecological base. Meanwhile, the western development strategy has promoted industrialization in key urban agglomerations in central and western China, shifting the emission pattern from eastern coastal concentration to a coastal–inland multipolar diffusion. Due to limited economic scale and total energy consumption, ecologically fragile regions such as the arid areas of Northwest China and the Qinghai–Tibet Plateau have maintained low emission levels for a long time, becoming an important component of the national emission spatial pattern.
Overall, the spatiotemporal evolution of carbon emissions from energy consumption in China during this period is not driven by a single factor but results from the combined effects of economic development, industrial structure, energy systems, and regional development strategies. The phased characteristics clearly reflect China’s transition from high-carbon extensive development to low-carbon green development, providing an important basis for subsequent regionally differentiated emission reduction strategies and carbon peak pathway design.
3.2. Evolution Characteristics of Provincial Emissions
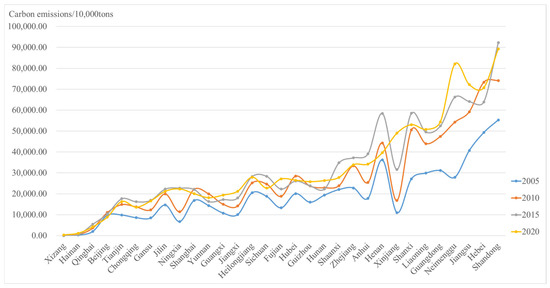
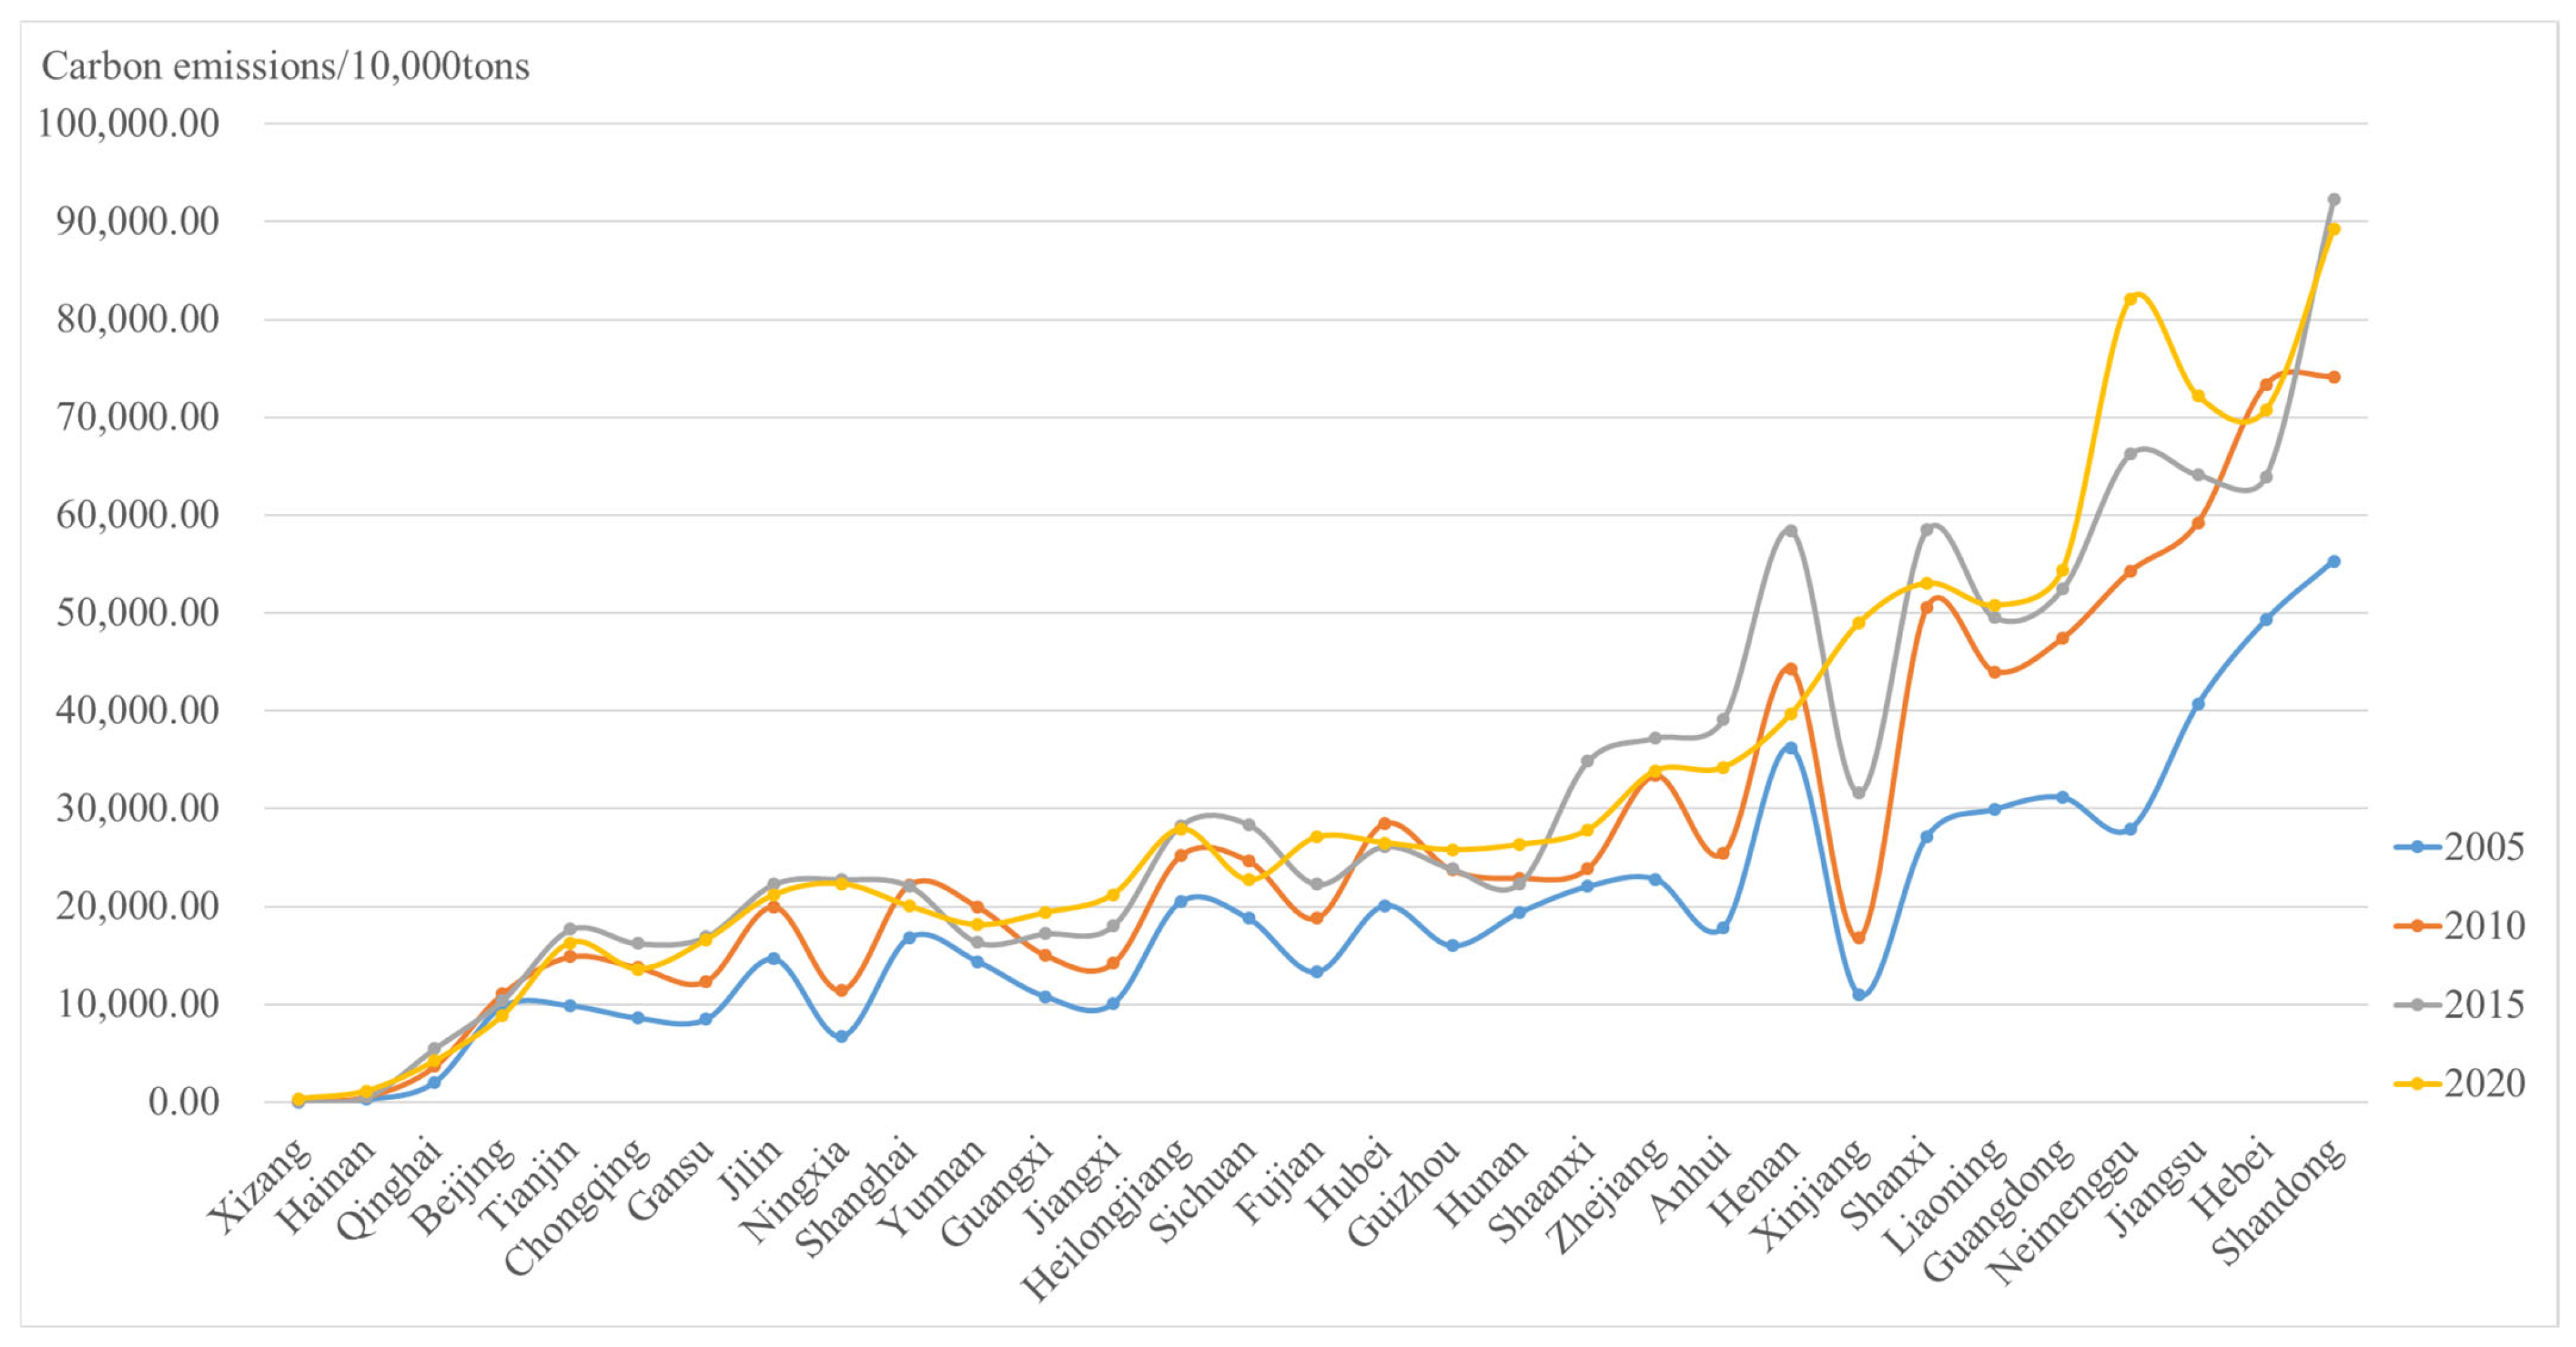
From 2005 to 2020, China’s provincial energy consumption carbon emissions exhibited four core characteristics: rapid growth in total emissions, a gradual slowdown in the growth rate, significant strengthening of spatial agglomeration, and clear interprovincial differentiation (Figure 2). This spatiotemporal differentiation pattern is not simply the result of regional economic scale accumulation. It instead reflects the dynamic interaction and coupled evolution of economic development stages, industrial structure changes, energy resource endowment, and low-carbon transition policies.
Figure 2.
Changes in carbon emissions from energy consumption across various provinces in China.
From the perspective of driving mechanisms, the rapid increase in emissions from 2005 to 2015 was mainly driven by the agglomeration of heavy chemical industries, the expansion of energy-intensive sectors, and a coal-dominated energy structure under rapid industrialization and urbanization. This led to the formation of high-emission core regions in eastern coastal industrial provinces such as Shandong, Hebei, and Jiangsu. Emissions also expanded to energy-resource-rich provinces such as Inner Mongolia and Xinjiang.
However, the marked slowdown in emission growth after 2015 indicates that China entered a stage of high-quality economic development. The main driving forces shifted to energy structure optimization, improvements in energy efficiency, and stronger policy regulation under the “dual carbon” targets. These factors effectively restrained emission growth in traditional high-energy-consuming regions and promoted early emission peaking and structural transformation in eastern developed provinces.
In terms of spatial patterns, the agglomeration of high-emission areas has further strengthened. This pattern is closely linked with regional industrial specialization, population distribution, and natural ecological carrying capacity. Due to low economic activity and limited total energy consumption, ecologically fragile regions such as Northwest China’s arid areas and the Qinghai–Tibet Plateau have maintained low emission levels for a long time. These regions constitute an important ecological foundation of China’s national carbon emission pattern.
3.3. Evolution Characteristics of Emissions per Capita
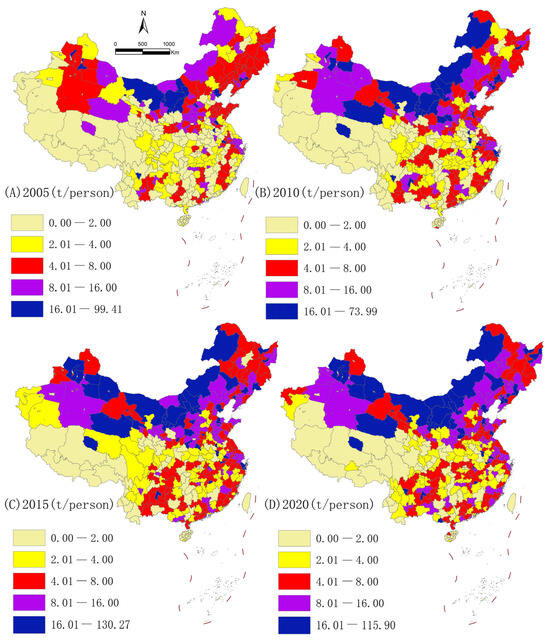
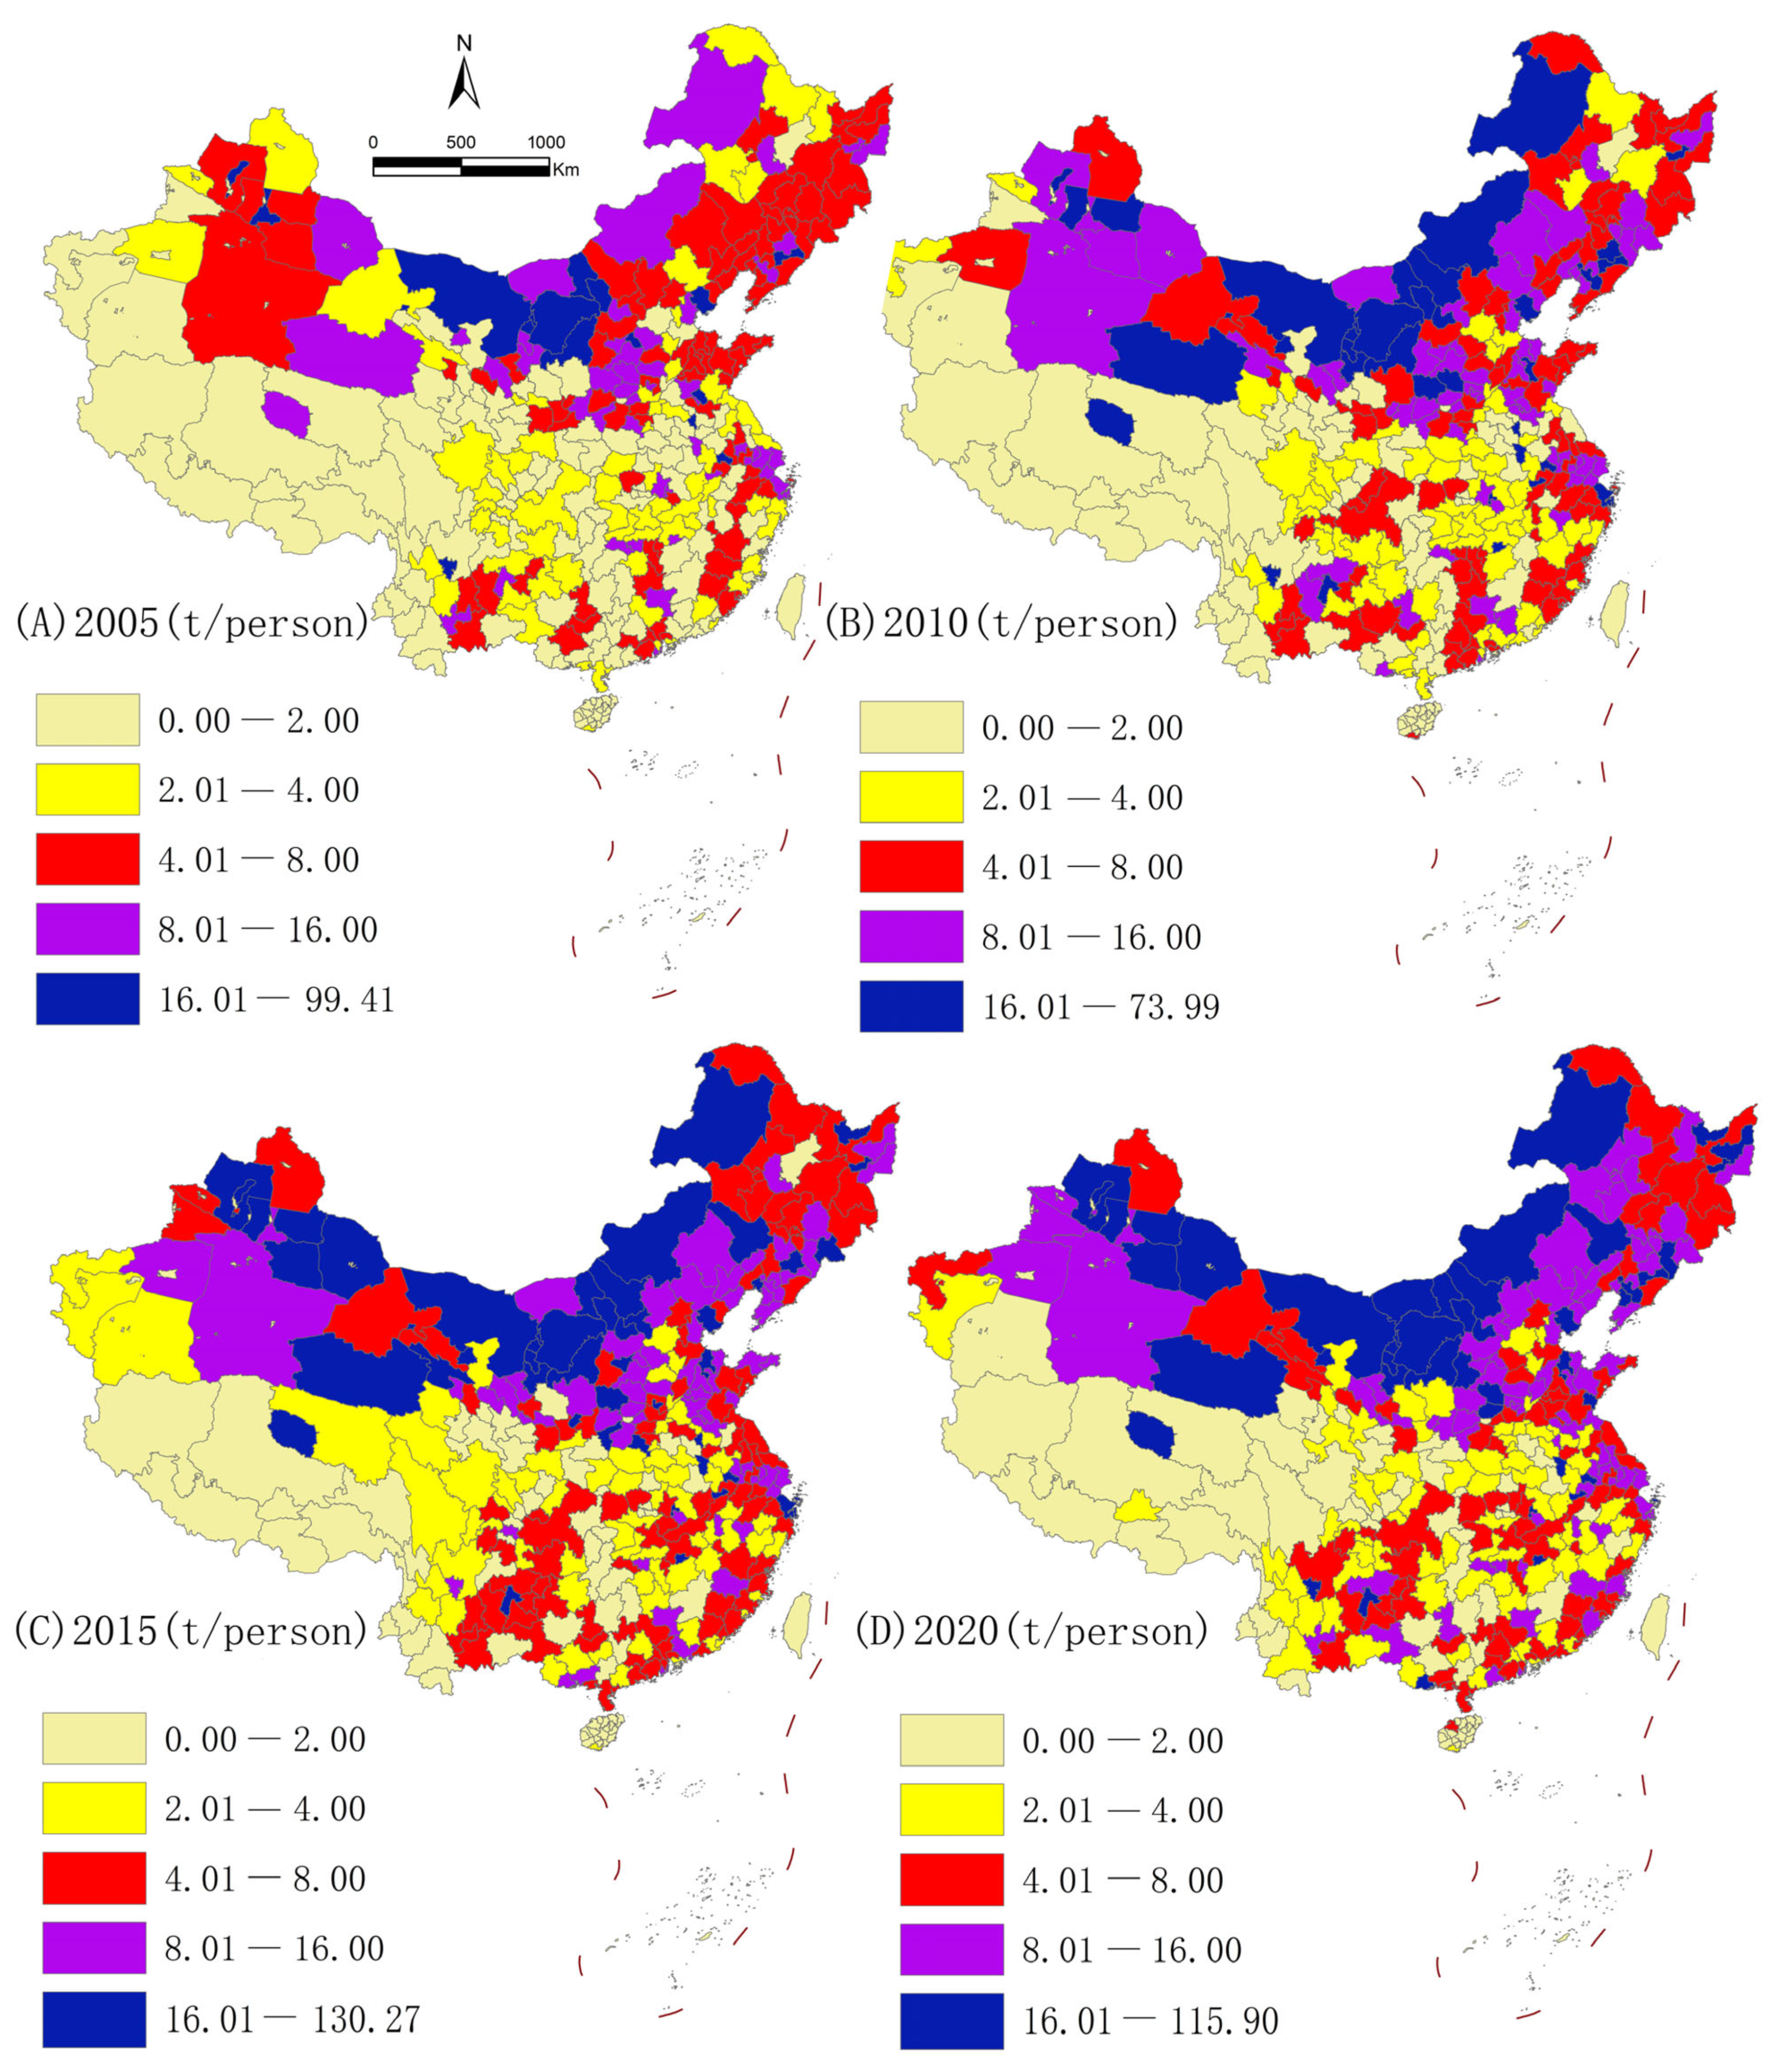
Per capita carbon emissions are also key indicators for measuring regional carbon emissions. The per capita carbon emissions from energy consumption in China exhibit core spatiotemporal evolution characteristics, including a continuous increase in total emissions, spatial expansion of high-value areas, and solidification of the resource–consumption bipolar pattern (Figure 3).
Figure 3.
Distribution of carbon emissions per capita of urban energy consumption in China.
From the perspective of spatial distribution, national per capita carbon emissions have long maintained a stable gradient pattern of high in the northwest, low in the southeast; high in resource-based areas, low in densely populated areas. Extremely high-value areas, with per capita emissions above 16 tons, are concentrated in Inner Mongolia, Xinjiang, Ningxia, and other northwestern arid regions, as well as in some resource-based cities in Northeast China. These areas rely heavily on energy resources such as coal, oil, and gas, as well as high-energy-consuming heavy chemical industries. They form a resource-export-oriented pattern with high per capita emissions and constitute the core high-emission region in China.
The red and purple high-value areas were initially concentrated in 2005 around old industrial bases in the Bohai Rim and Northeast China. They gradually expanded to industrial node cities in North China, East China, and central-western regions. By 2020, a continuous high-value belt had formed, covering Beijing–Tianjin–Hebei, Shandong, Jiangsu, and other traditional industrial provinces.
Low-value areas, with per capita emissions below 4 tons, are stably distributed in densely populated regions and areas with light industrial structures, such as the southern Yangtze River region, southwestern mountainous areas, and the Qinghai–Tibet Plateau. Provinces such as Sichuan, Guizhou, and Guangxi have consistently maintained low to medium per capita emission levels, forming the national baseline region for per capita carbon emissions.
The spatial differentiation of per capita carbon emissions is intensifying. On the one hand, the upper limit of high-emission values increased from 110.27 tons per person in 2005 to 115.90 tons per person in 2020, and the spatial extent of high-emission provinces expanded. This reflects the lock-in effect caused by the relocation of energy-intensive industries to central and western regions and increased dependence on local coal consumption. On the other hand, the lower bound of low-emission areas decreased from 0 to 2 tons per person to 0–1 ton per person, and per capita emissions in some ecologically fragile or economically lagging regions further declined. This has led to a polarization pattern of higher highs and lower lows. Provinces such as Hebei, Shandong, and Jiangsu remain in the mid-range of 4–16 tons per person, with relatively stable fluctuations. This indicates that emission levels, industrial structure, and energy efficiency have reached a stage of relative balance.
Overall, the per capita carbon emission pattern in China shows strengthening spatial clustering of high-emission hotspots, convergence of low-emission areas at low levels, and widening regional disparities. This pattern is closely related to energy resource endowment, industrial spatial transfer, and differences in local environmental regulation intensity. It also suggests that differentiated emission reduction pathways are needed across emission ranges to achieve staged regional carbon peaking in the future.
3.4. Analysis of Carbon Emission Intensity Evolution
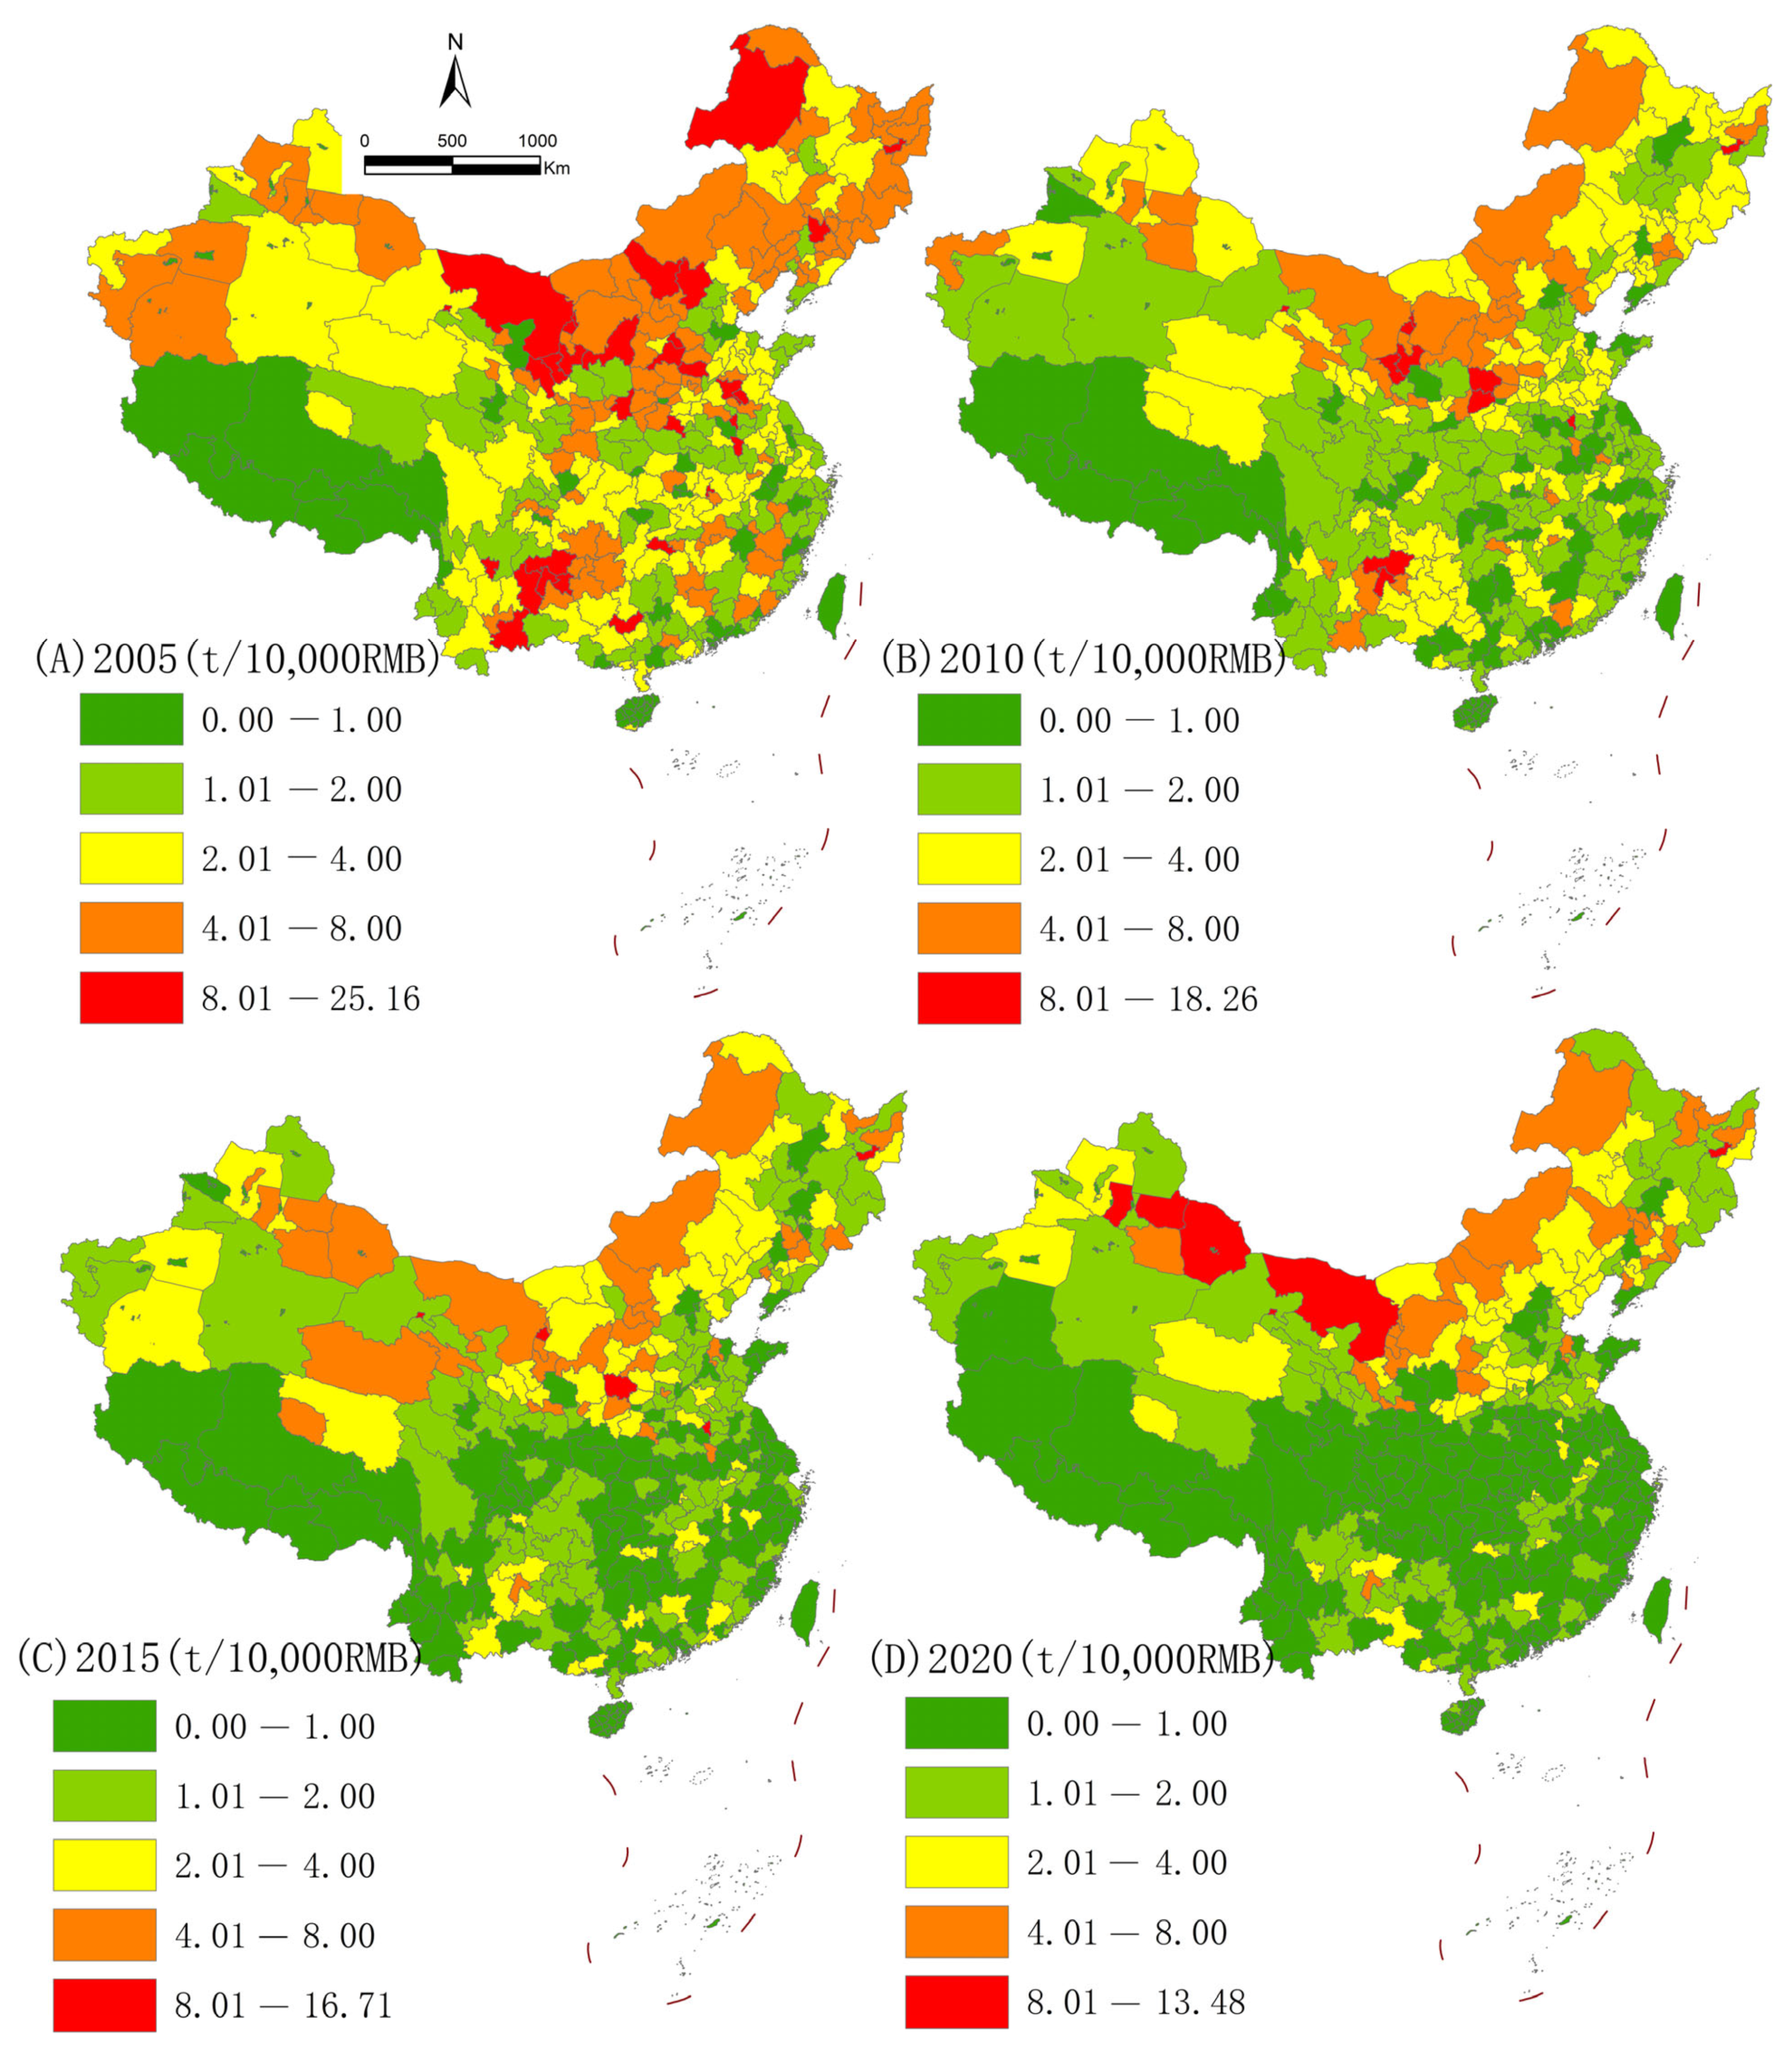
Carbon intensity refers to the carbon emissions from energy consumption generated per 10,000 yuan of Gross Domestic Product (GDP) in a city. This indicator is mainly used to measure the relationship between urban economic development and carbon emissions, and is commonly applied to evaluate emission efficiency. The carbon emission intensity of energy consumption in China exhibits several key spatiotemporal evolution characteristics, including a continuous regional decline, significant contraction of high-value areas, substantial optimization of spatial patterns, and gradual convergence of regional gradients. These trends clearly reflect the systematic effects of low-carbon transformation and improvements in energy efficiency.
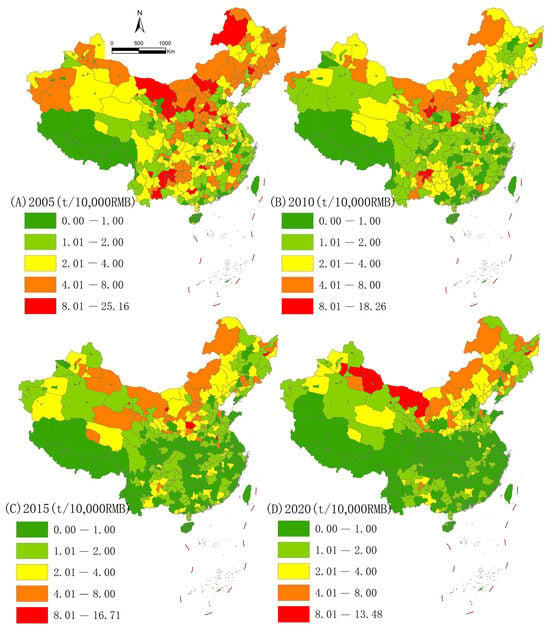
From the perspective of spatial patterns, carbon emission intensity shows a distribution pattern of being high in resource-based areas and low in economically developed areas (Figure 4). Economically developed eastern coastal provinces such as Beijing, Shanghai, and Guangdong exhibit low carbon intensity due to advanced technology levels and a high share of service industries, typically below 1 ton per 10,000 yuan. In contrast, provinces such as Hebei, Shanxi, and Inner Mongolia, as well as some northeastern regions, show high carbon intensity (2–4 tons per 10,000 yuan or higher) due to concentrated heavy chemical industries and coal-dependent energy structures. Although western provinces such as Xinjiang, Ningxia, and Gansu have smaller economic scales, their carbon intensity remains relatively high due to resource exploitation and energy-intensive industries.
Figure 4.
Changes in carbon emission intensity of urban energy consumption in China.
In 2005, high-value areas (red and orange zones) were concentrated in resource-based provinces such as Inner Mongolia, Shanxi, and Ningxia, as well as old industrial bases in Northeast China. Some industrial cities in North and Southwest China also showed high-intensity values. By 2020, extreme high-value areas remained only sporadically in the northwest, and high-value zones had shrunk significantly. Only Inner Mongolia, Shanxi, and a few traditional energy provinces maintained relatively high levels, while most other regions shifted to medium and low values. The medium-value (yellow) zone, which was widely distributed across central and western regions, North China, and most of Northeast China in 2005, became the dominant level nationally. After 2010, this zone gradually contracted toward the northwest and parts of North China. By 2020, it had largely withdrawn from central and eastern China and was mainly distributed in resource-based provinces in the northwest.
Low-value areas (green and light green) in 2005 were concentrated in economically developed regions with light industrial structures, such as the Yangtze River Delta, Pearl River Delta, and Southeast Coast. After 2010, these low-value areas expanded into central and western China and along the Yangtze River Basin. By 2020, they covered most of the country, forming a continuous low-value belt centered on the southeastern coastal region and extending nationwide. The Qinghai–Tibet Plateau and southwestern ecological regions have long maintained the lowest intensity levels, forming the spatial foundation of low-carbon development in China.
From 2005 to 2015, national carbon emission intensity declined rapidly, with an average annual reduction exceeding 4%. High-value areas shrank significantly, and many medium-value areas transitioned into low-value zones. The main drivers include industrial structure upgrading, improvements in energy efficiency, technological progress, and energy-saving and emission-reduction policies. Developed eastern provinces led the decline, followed by central and western regions.
From 2015 to 2020, carbon emission intensity entered a period of steady optimization. Although it continued to decrease, the rate of decline stabilized. High-value areas continued to contract, and the low-intensity pattern became more consolidated. This reflects China’s transition into a stage of high-quality development. Energy structure optimization, substitution of non-fossil energy, and large-scale deployment of green and low-carbon technologies became the main drivers of intensity reduction. Regional disparities in carbon intensity continued to narrow, and the spatial pattern gradually moved toward balance.
3.5. Analysis of Changes in Carbon Emission Pattern
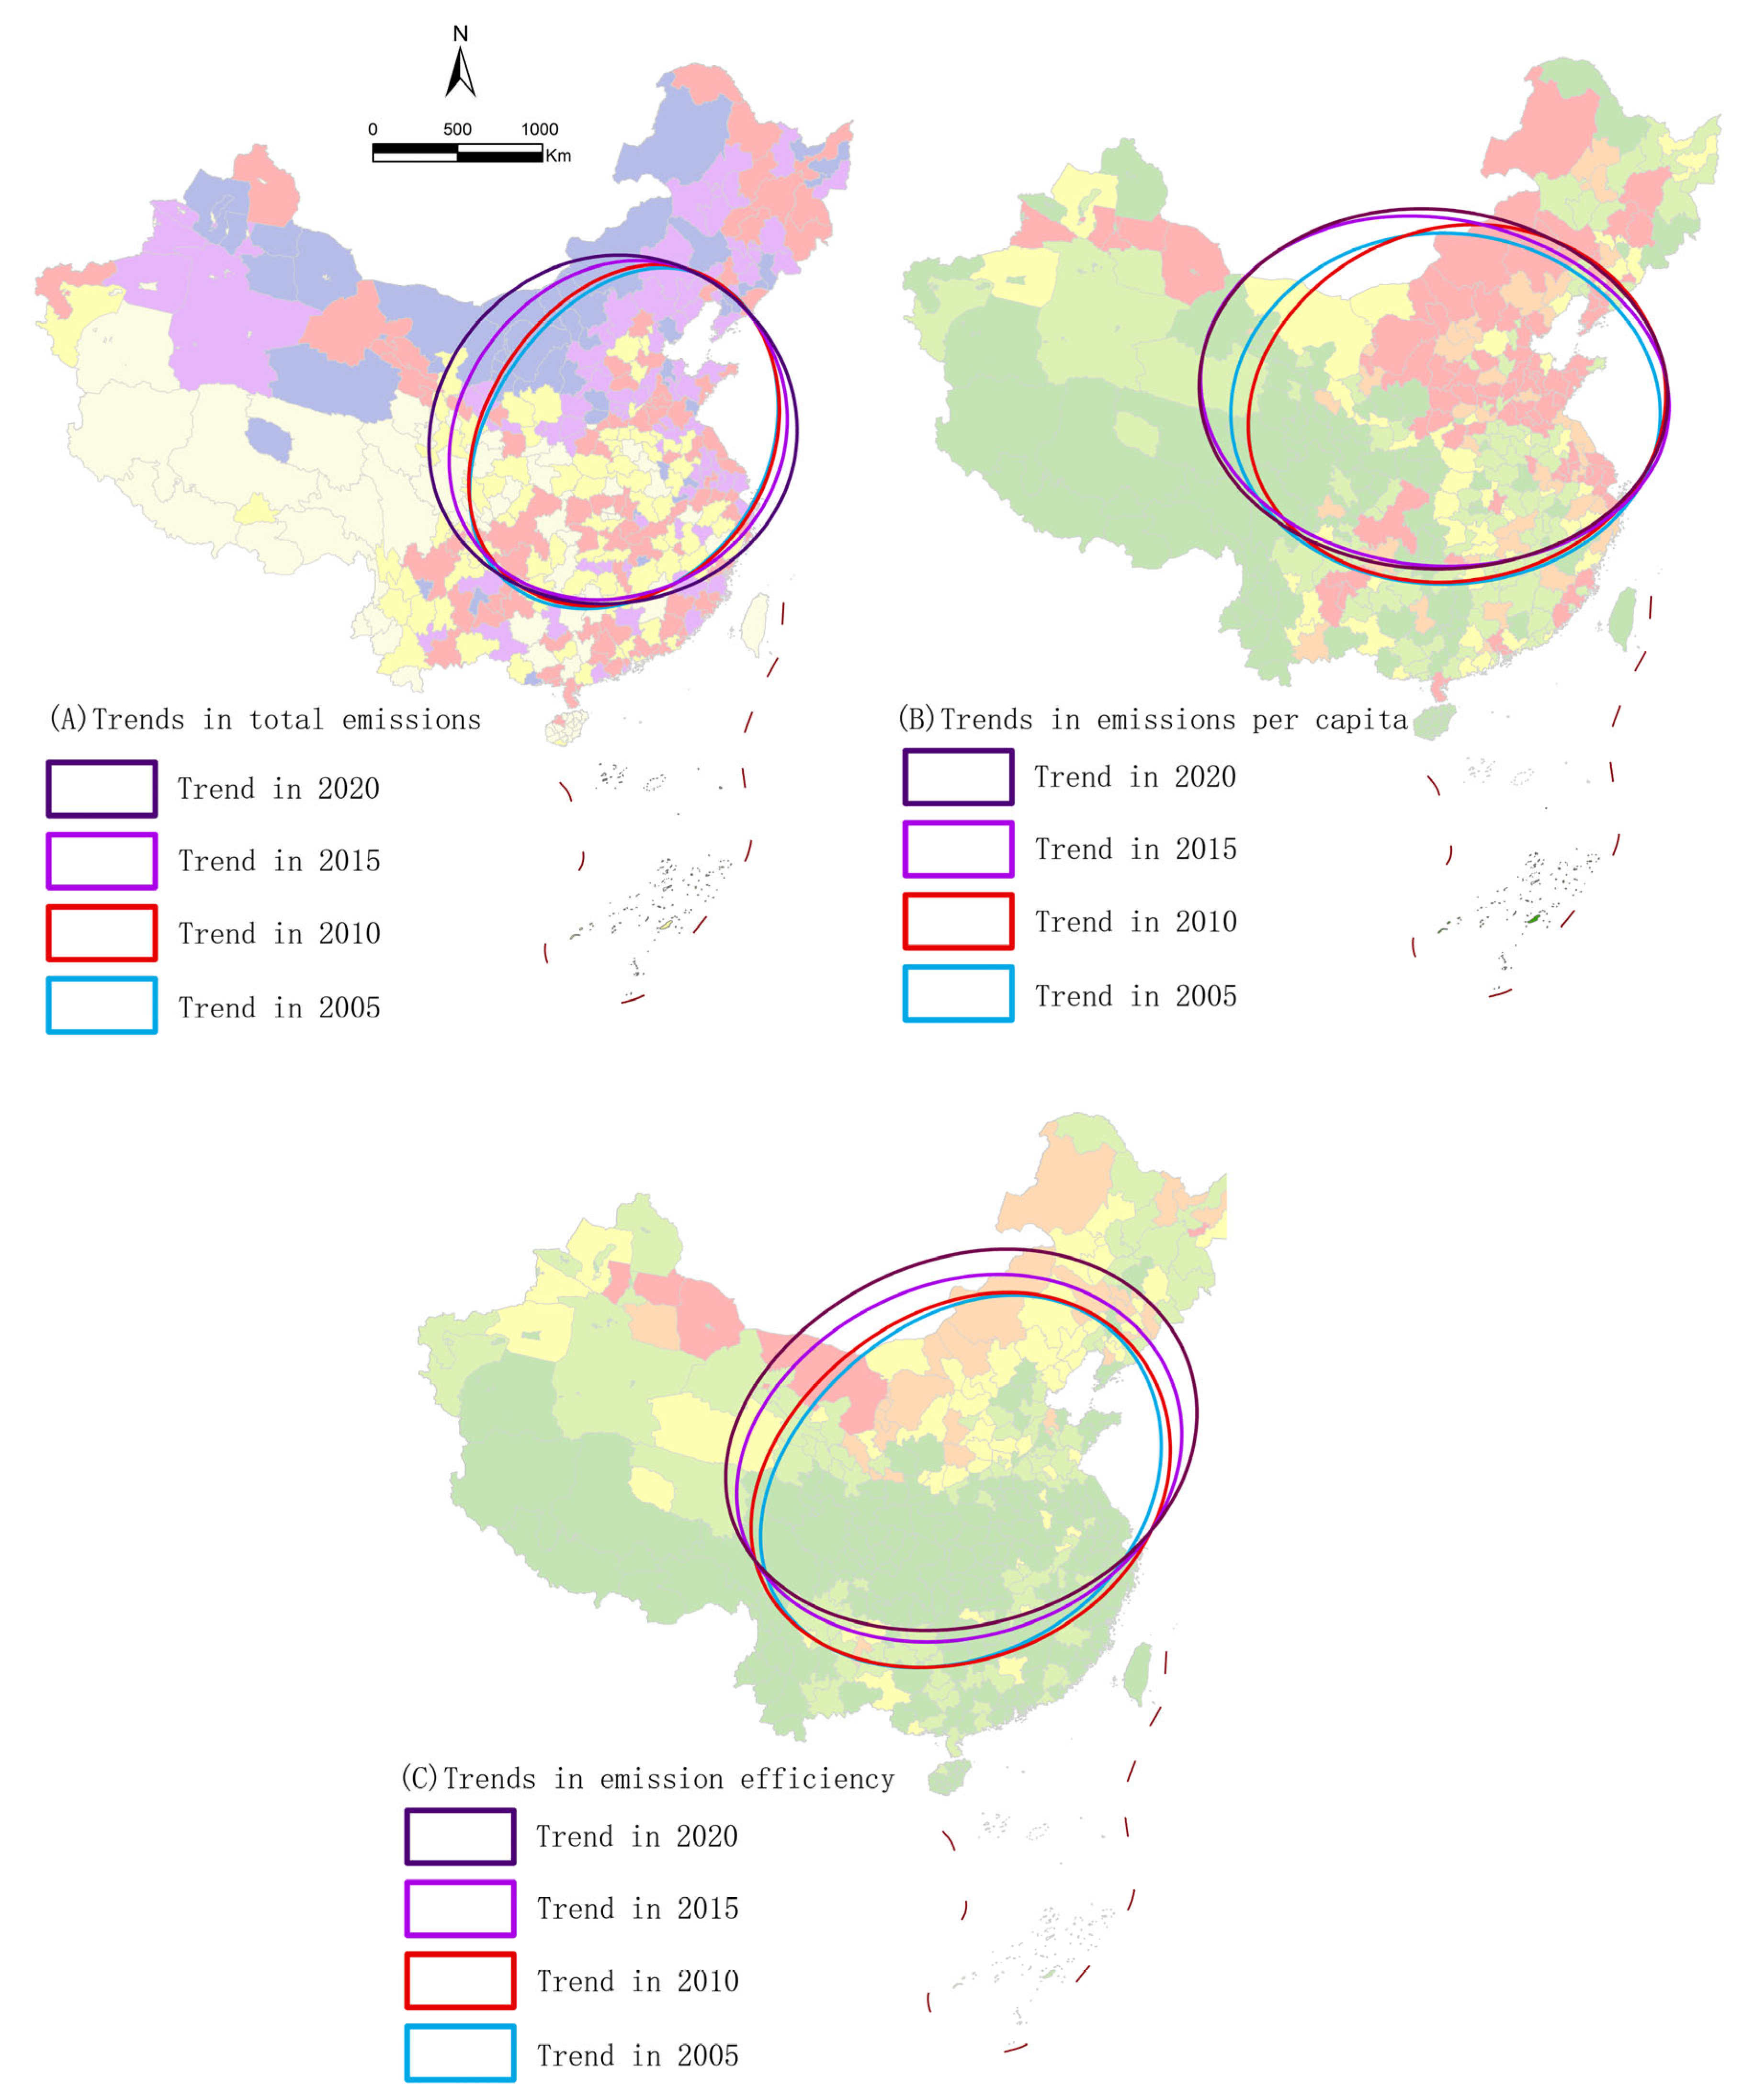
We use the GIS standard deviation ellipse analysis tool to analyze the carbon emission pattern changes in urban energy consumption in China from 2005 to 2020, including total carbon emissions, per capita carbon emissions, and carbon emission intensity (Figure 5). The pattern center of gravity of total carbon emissions shows a dynamic trajectory characterized by a continuous northward shift and gradual westward expansion. From 2005 to 2010, the emission center was located in the eastern coastal industrial provinces. High-growth areas were concentrated in traditional economic hubs such as Beijing–Tianjin–Hebei, the Yangtze River Delta, and the Pearl River Delta. From 2010 to 2015, with the acceleration of industrialization and energy development in central and western regions, the center of gravity continued to shift toward North and Northwest China. Provinces such as Inner Mongolia, Shanxi, and Xinjiang became the core drivers of emission growth. From 2015 to 2020, the center of gravity further moved northwest. High-growth areas expanded to both Northeast and Northwest China. Growth in eastern developed provinces slowed significantly, and some regions entered a plateau stage. Overall, the pattern is characterized by stabilization in the east, continuous growth in the central and western regions, and northward and westward migration of the center of gravity. This reflects a transition from eastern single-core dominance to a multipolar diffusion pattern involving the east, central, and western regions.
Figure 5.
Trend analysis of carbon emissions from urban energy consumption in China.
The pattern gravity of per capita carbon emissions shows a pattern of northwestward concentration and increasing regional differentiation. From 2005 to 2010, high-growth areas of per capita emissions were concentrated in the Bohai Rim and old industrial bases in Northeast China, with the center of gravity located in North China. From 2010 to 2015, the center of gravity continued to shift northwest. Resource-rich provinces such as Inner Mongolia, Ningxia, and Xinjiang recorded the highest per capita emission growth rates and became the main growth poles. From 2015 to 2020, the center of gravity moved further northwest. The growth rate of per capita emissions in densely populated southeastern coastal regions continued to decline, and some developed cities reached their emission peaks. A polarization pattern emerged, characterized by high growth in resource-based regions of Northwest China and low growth in consumption-based regions of Southeast China. This highlights the strong influence of resource endowment, industrial structure, and population scale on per capita emission patterns.
The barycenter of carbon emission intensity shows a continuous decline and gradual spatial convergence. From 2005 to 2010, the main driving force of intensity reduction was concentrated in developed eastern provinces, with the center of gravity located in East China. The reduction in central and western resource-based regions lagged behind. From 2010 to 2015, the center of gravity shifted toward the Midwest and Northwest. From 2015 to 2020, it moved further northwest, where intensity reductions in resource-rich provinces became more pronounced. Regional differences in emission intensity continued to narrow, and a nationwide synchronized decline with spatial convergence was ultimately achieved. This demonstrates the systematic effects of industrial upgrading, energy efficiency improvement, and nationwide low-carbon policies.
Overall, from 2005 to 2020, China’s energy-related carbon emission patterns exhibited strong spatiotemporal differentiation and coupling characteristics. The center of gravity of total emissions continues to move northward and westward, evolving from initial eastern dominance to multipolar diffusion. The per capita emission center of gravity is concentrated in northwest resource-based regions, with increasing regional differentiation. The co-evolution of these indicators reflects China’s transition from high-carbon extensive development to low-carbon intensive development and provides a scientific basis for regionally differentiated emission reduction and coordinated governance.
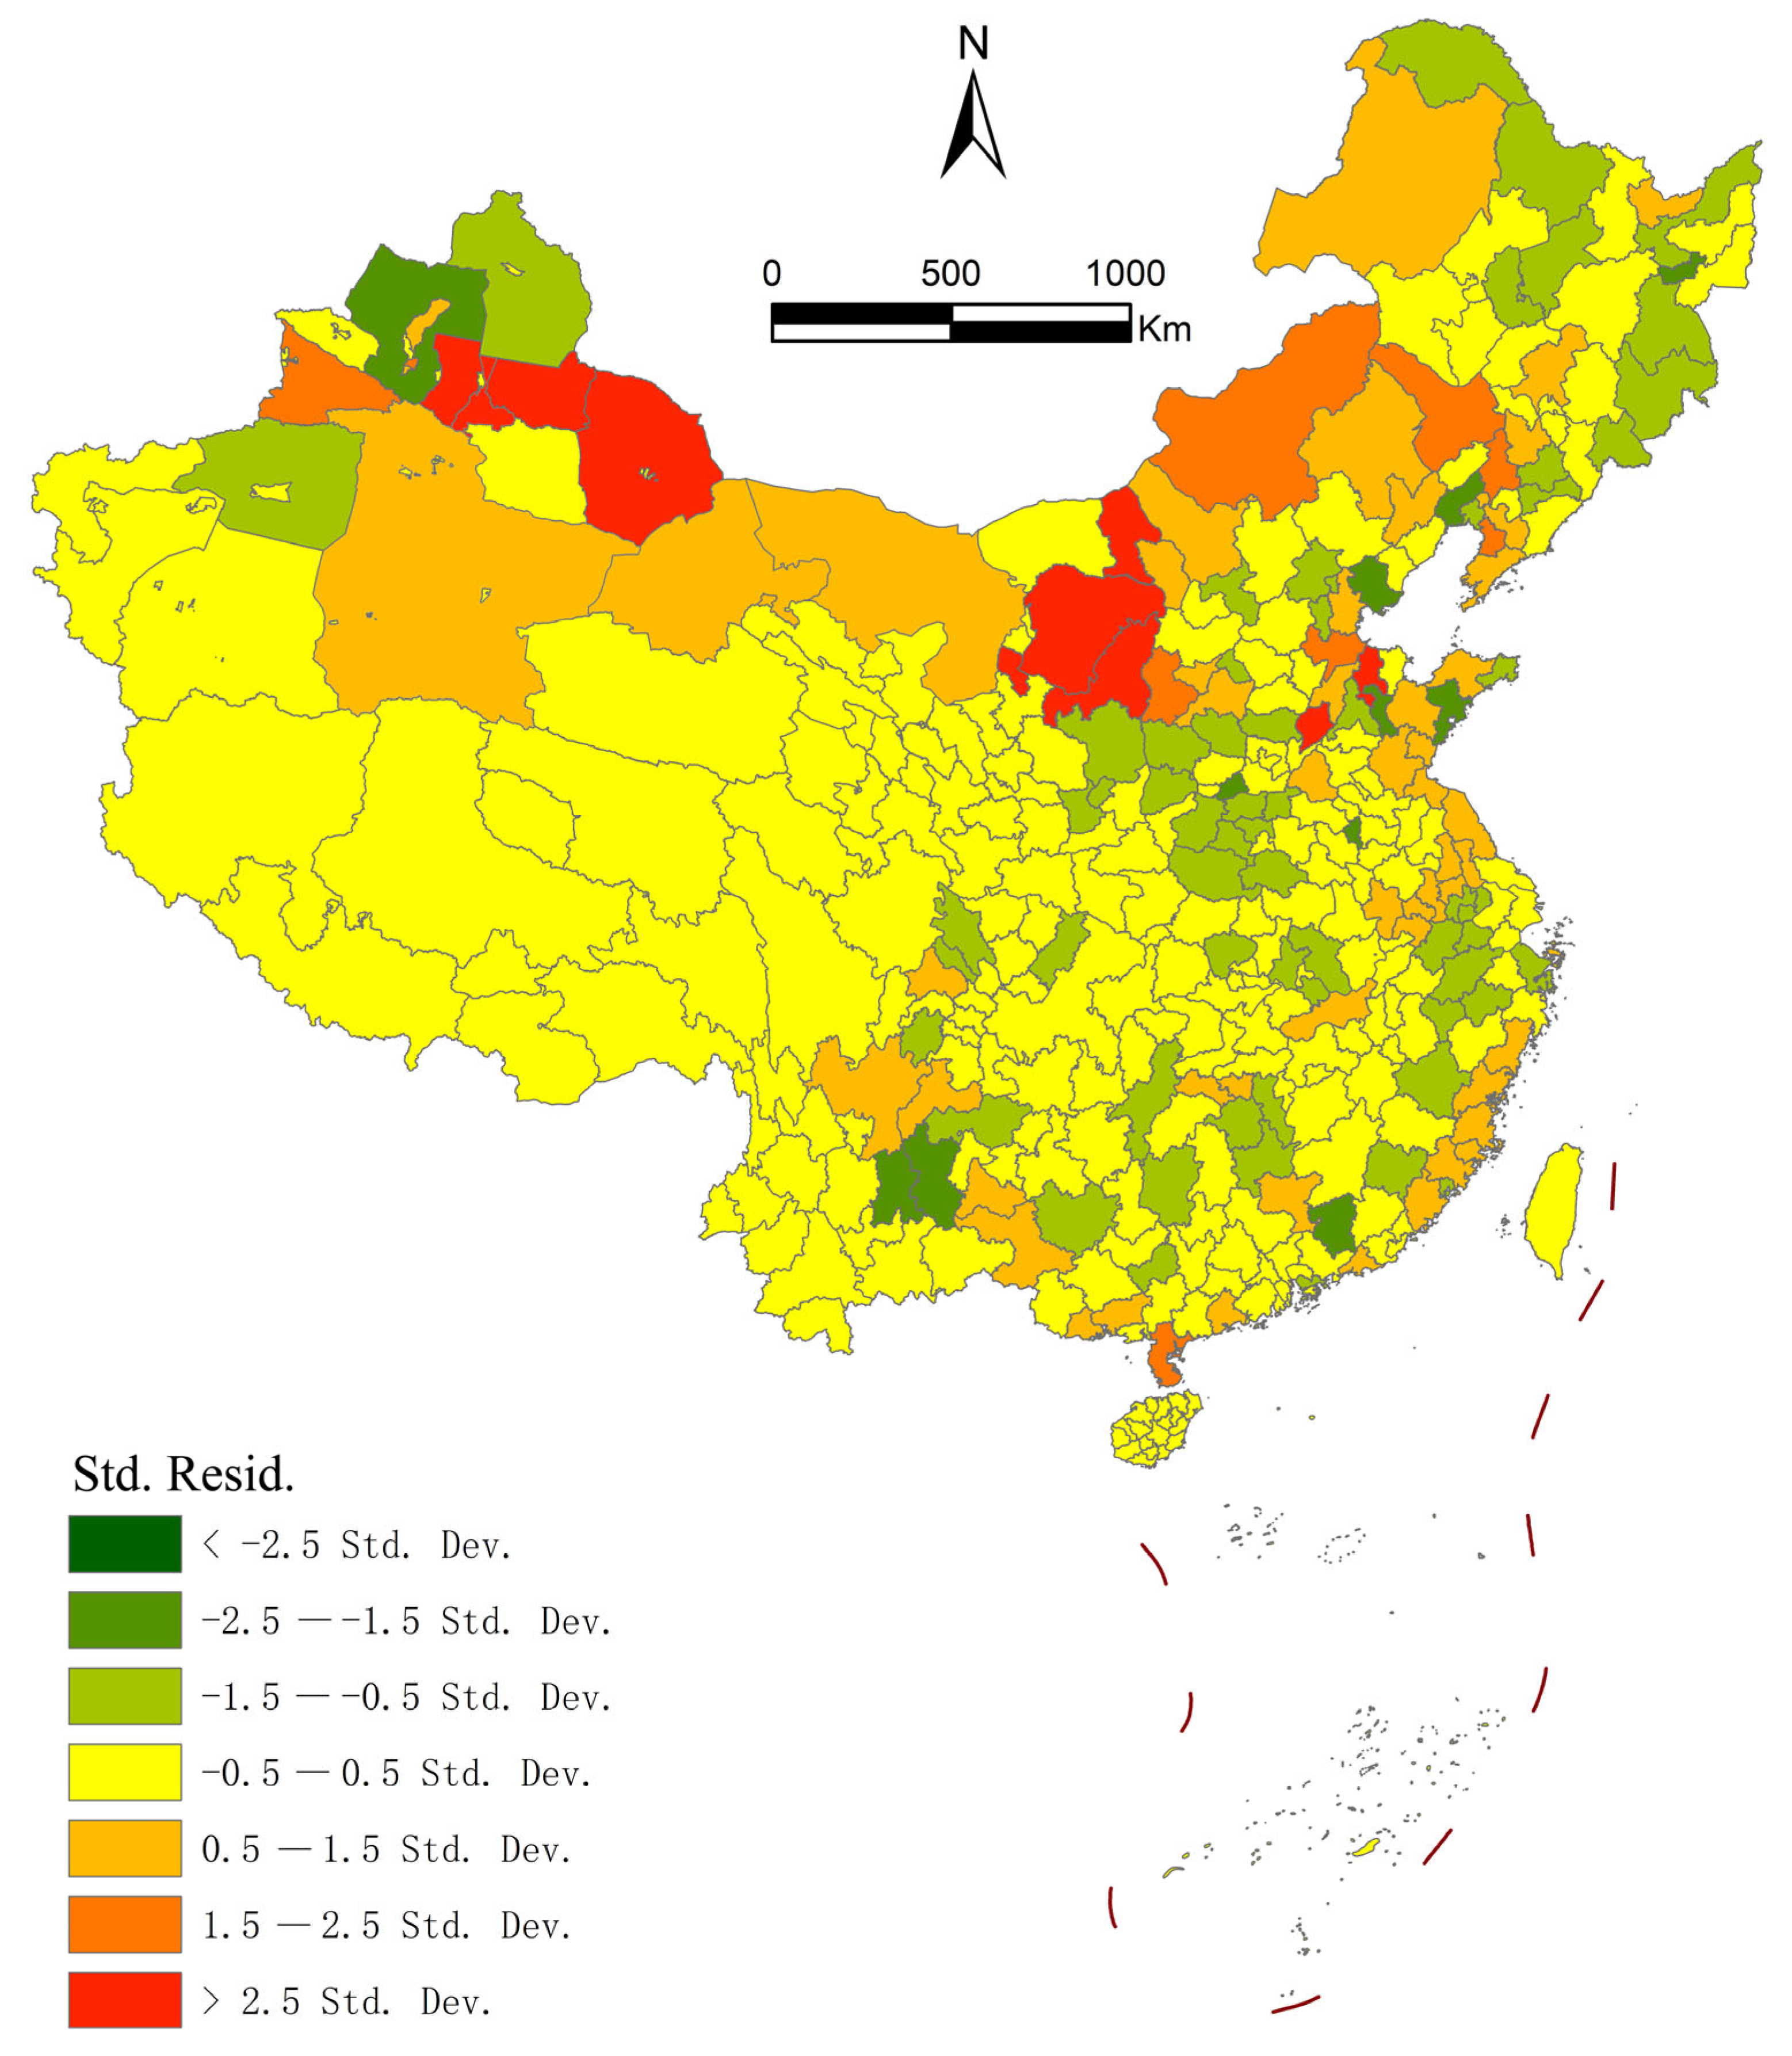
Carbon emissions exhibit significant spatial dependence, so this study further constructs a geographically weighted regression (GWR) model to capture local spatial non-stationarity, which complements the global multiple linear regression (MLR) benchmark model. The conventional MLR model only estimates the average nationwide correlation between explanatory variables and carbon emissions, reflecting universal overall driving relationships but masking regional spatial heterogeneity of factor effects; the GWR model breaks the assumption of fixed global coefficients and quantifies geographic differences in the influence of urban construction, economic development, industrial structure, housing supply, and domestic and foreign-funded enterprises. We incorporate the eight core indicators consistent with the MLR model into the GWR framework (Figure 6). The model’s optimal adaptive bandwidth is 11.60, which accurately identifies prefecture-level spatial heterogeneity of carbon emission drivers. The GWR achieves an adjusted R2 of 0.825, meaning the selected variables jointly explain 82.51% of the spatial variation in urban energy carbon emissions, demonstrating reliable local fitting performance.
Figure 6.
Geospatial weighted regression (GWR) analysis.
Standardized residuals of the GWR model present obvious regional agglomeration and zonal differentiation, which further interpret the spatial heterogeneous logic behind the global MLR results. For ordinary central and southwestern prefecture-level cities, residuals concentrate within −0.5 to 0.5 standard deviations, with optimal fitting effects. In these regions, the promoting/inhibiting strength of industrial, economic, and urban construction factors aligns closely with the global average coefficients derived from MLR, showing balanced and stable driving mechanisms. Northern arid and semi-arid resource-rich provinces form contiguous positive residual zones with severe model underestimation. Areas including northern Xinjiang, Ningxia, and Ordos have standardized residuals exceeding 2.5, and residual values gradually decline outward from the northwest energy core. Inner Mongolia, northern Shanxi, Hebei, Shandong, and Henan show moderate positive residuals of 1.5–2.5. Consistent with the global MLR result that industrial expansion and energy resource exploitation strongly drive carbon emissions, the GWR local coefficients reveal that the emission amplification effect of urban construction land and high-carbon industries reaches its maximum in northern resource zones. The global average coefficient of the MLR model weakens this extreme regional impact, leading to systematic underestimation of local emissions.
Concentrated negative residual clusters appear in southeast coastal urban agglomerations and southwest agricultural plateaus and tourism cities. Extreme negative residuals below −2.5 are distributed in the Yili River Valley, western Sichuan, and western Yunnan borderlands, while moderate negative residuals cover the middle-lower Yangtze River and southern hilly cities. These regions feature dominant service sectors, widespread clean energy adoption, and early low-carbon policy implementation. In line with the MLR finding that commercial housing scale and domestic enterprises exert significant emission-reduction effects, GWR local coefficients show that the mitigation impact of these two factors is strongest in the southeast coast. The global average MLR coefficient dilutes this strong local emission-reduction advantage, resulting in model overestimation of theoretical emissions relative to actual observed values.
In summary, the MLR model identifies universal nationwide driving and restraining relationships between socioeconomic factors and carbon emissions, while the GWR model supplements local spatial heterogeneity characteristics. The residual spatial clustering and local coefficient distribution of the GWR model effectively explain why the magnitude of each factor’s impact differs sharply across four typical zones (eastern developed regions, northern heavy industrial areas, northwest resource-based regions, and low-carbon ecological regions), providing a spatial empirical basis for the differentiated regional carbon reduction policies proposed in this paper.
4. Discussion on Factors Affecting Carbon Emissions from Energy Consumption
4.1. Multiple Regression Model
The influencing factors behind the spatial distribution differences of carbon emissions from urban energy consumption in China are multidimensional. Most existing studies discuss the driving mechanisms of energy-related carbon emissions separately from the perspectives of economic development level, energy efficiency, and market mechanisms [41,42]. However, relatively few studies analyze carbon emissions from the perspectives of city scale, economy, and industrial structure. It is worth noting that urban energy consumption carbon emissions are closely related to urban development patterns and construction layout. Based on this, we select indicators that characterize urban development and construction to measure their influence on carbon emissions.
In addition, urban development factors usually exhibit spatial heterogeneity, meaning that the same factor may have different degrees of influence across cities. To construct an explanatory model of urban energy consumption carbon emissions, we select indicators such as city size, industry, economy, population, and technology to systematically explain the driving logic of emissions across different cities. SPSS 19.0 software is used to analyze the effects of city scale, industry, population, economy, and technology on carbon emissions. Variables with weak multicollinearity or insignificant correlations are excluded. An explanatory model for inter-city differences in carbon emissions from energy consumption is then constructed. It is worth noting that, in order to measure the carbon contribution of major economic sectors, emissions from three sectors—industry, agriculture, and tourism—are included as explanatory variables. This is used to capture the impact of sectoral differences on carbon emissions. In addition, residential and housing-related activities also contribute to total energy-related carbon emissions. It is therefore inappropriate to assume that energy carbon emissions originate only from the three sectors mentioned above. Finally, only variables with significant and strong correlations were retained for model fitting (Table 1).
Table 1.
Statistics of energy consumption carbon emissions via multiple regression model.
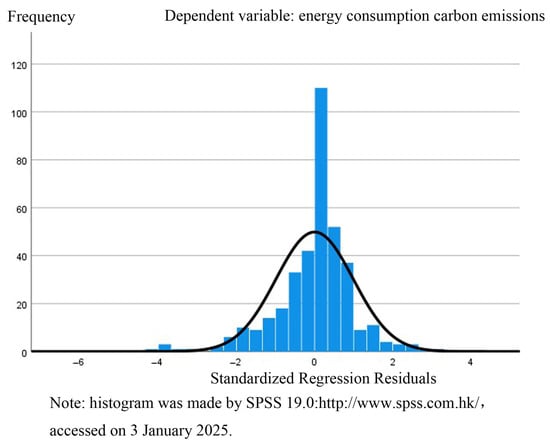
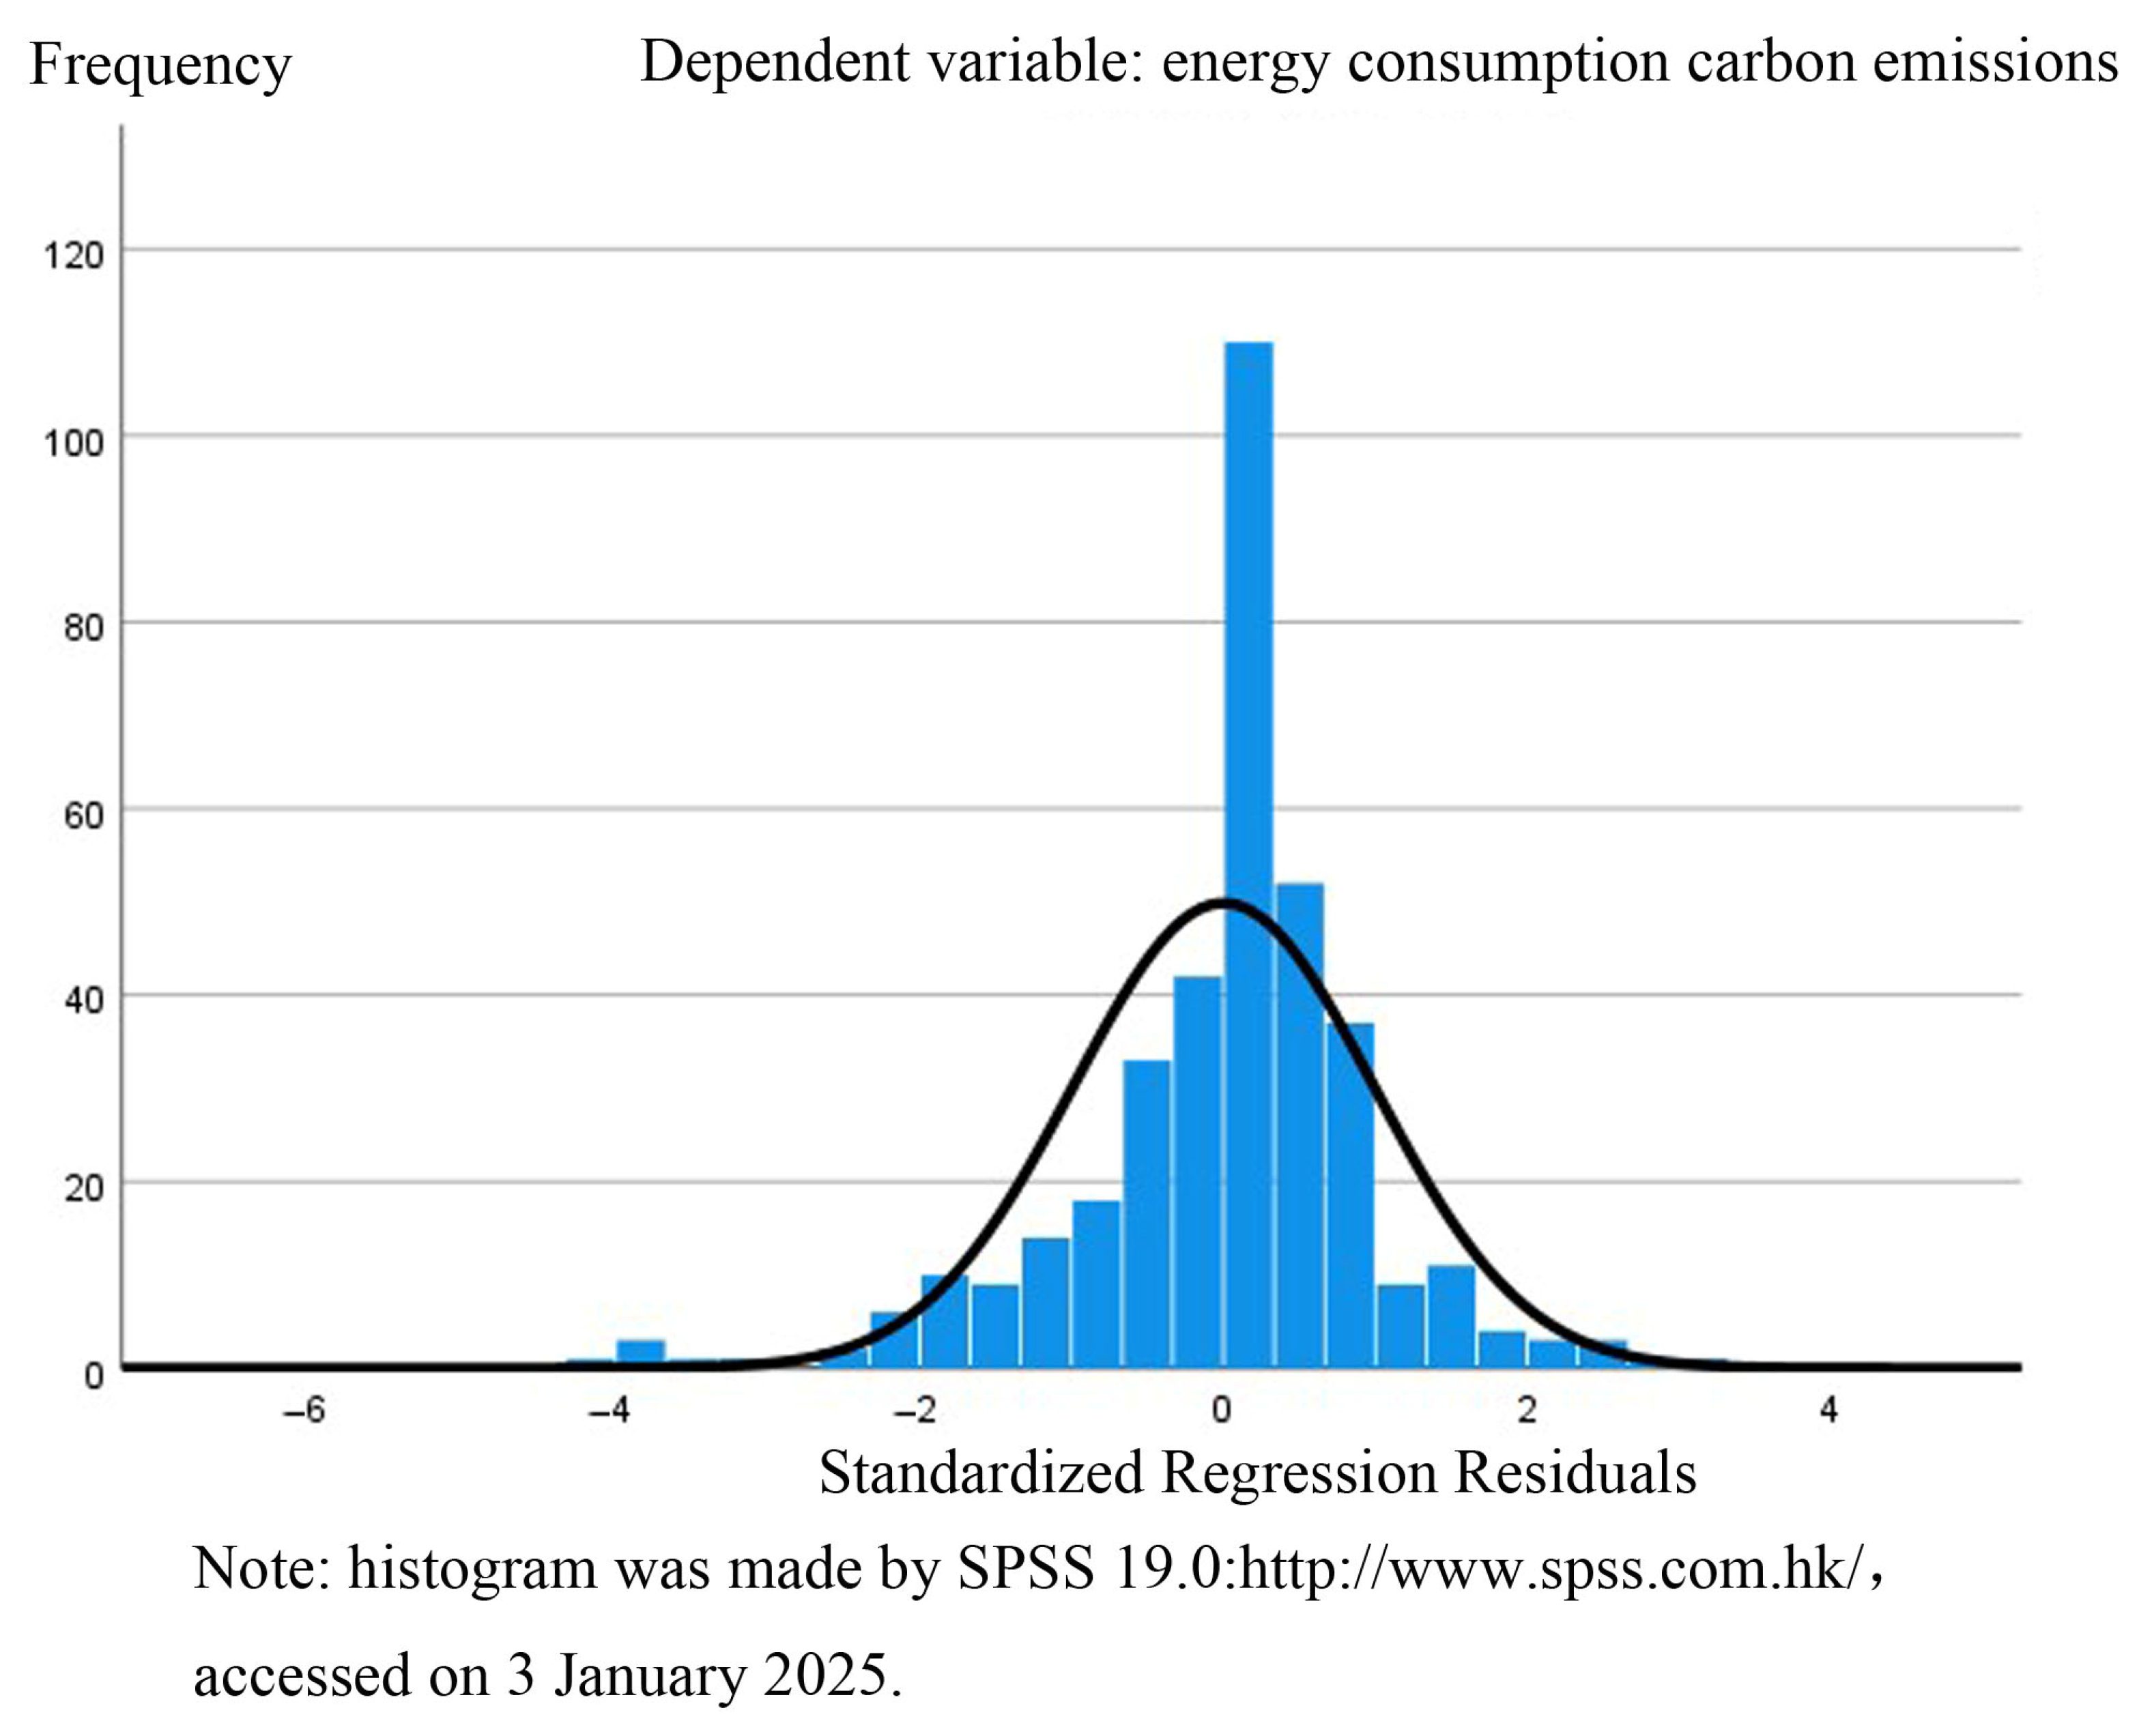
In order to ensure the reliability of the multiple linear regression results, tests for multicollinearity, overall significance, and goodness-of-fit were conducted on the model. The variance inflation factors (VIFs) of all variables are below 7.5, indicating that no serious multicollinearity problem exists in the model. Based on the correlation matrix, we further confirm that there is no multicollinearity among the relevant factors. The adjusted R2 values of the models are all greater than 0.6 (Table 2), indicating strong overall explanatory power of the energy consumption carbon emission model. The adjusted R2 of the benchmark regression reaches 0.982, seemingly indicating strong overall explanatory power of the selected independent variables. Nevertheless, this high fitting degree cannot be directly regarded as solid evidence of complete theoretical explanatory capacity, due to an obvious statistical limitation: industrial, agricultural, and service carbon emissions are sub-items constituting total urban energy carbon emissions. The inherent compositional correlation between these sectoral variables and the dependent variable naturally pushes up the model’s goodness-of-fit. To eliminate misjudgment caused by this structural collinearity, a series of robustness checks are carried out, including replacing total emissions with per capita carbon emissions as the alternative explained variable, segmenting regression by research stage, eliminating extreme samples, and correcting heteroscedasticity. Across all validation schemes, the positive driving effects of urban construction land expansion, economic growth, and foreign-invested enterprises, as well as the emission-reduction effects of commercial housing scale and domestic enterprises, remain stable regarding both the sign and statistical significance of the coefficients. It demonstrates that the core driving mechanisms identified in this study are not merely derived from the internal composition relationship of sectoral emissions, and the empirical findings maintain reliability after fully acknowledging the limitation of the inflated R2. At the same time, the significance level is Sig. = 0.000 b, indicating that the multiple linear regression model is significant overall. The independent variables jointly explain the dependent variable, and the model is statistically valid. The regression constant term is −79.224 and is significant at the 1% level (Sig. = 0.000), providing a stable baseline effect for the model. The residual histogram of the model shows an approximately normal distribution (Figure 7), further confirming good model quality, high fit, and robustness. Overall, the model can effectively explain the key factors driving differences in urban energy consumption carbon emissions in China. The explanatory model is as follows:
C = −79.224 + 1.024X1 + 0.067X2 − 0.183X3 + 0.946X4 − 0.121X5 + 0.926X6 + 2.365X7 + 1.024X8.
Table 2.
Model summary.
Figure 7.
Standardized residual histogram. Histogram was made by SPSS 19.0 (http://www.spss.com.hk/, accessed on 3 January 2025).
From the explanatory model, it can be found that the scale of urban construction land, total economic output, the number of foreign-invested enterprises, and carbon emissions from the three major industrial sectors are key factors promoting the growth of urban energy consumption carbon emissions. In contrast, the sales area of commercial housing and the number of domestic-funded enterprises show certain emission reduction effects. When other variables remain constant, carbon emissions from urban expansion are significant. For every additional square kilometer of urban construction land, energy-related carbon emissions increase by 1.024 tons. The expansion of urban land increases energy demand for infrastructure construction, building operation, and supporting industries. This directly raises the overall carbon emission level of the city and reflects the rigid emission pressure associated with urban expansion.
Urban economic growth also has a significant positive effect on carbon emissions. This indicates that a strong coupling relationship still exists among urban economic development, energy consumption, and carbon emissions. Economic growth is usually accompanied by increased energy demand in industrial production, commercial activities, and household consumption. In the absence of low-carbon transformation, economic growth is directly related to carbon emissions growth.
Foreign-invested enterprises also show a significant positive effect. This is closely related to the industrial layout of foreign-funded enterprises in China. In many cases, energy-intensive and high-emission production processes have been adopted by China. At the same time, there is still room to improve the energy efficiency of foreign-funded enterprises. Domestic-funded enterprises show a significant negative effect. This reflects progress in industrial structure optimization, energy-saving technological transformation, and low-carbon production upgrades among domestic firms. These improvements have effectively constrained the growth of carbon emissions.
In addition, the optimization of urban residential structure shows strong carbon reduction potential. The commercial housing sales area also has a significant negative effect [43]. This is related to improvements in residential energy consumption structure. With the promotion of green buildings, energy-efficient housing, and low-carbon lifestyles, the unit energy consumption of new commercial housing has decreased significantly. This effectively suppresses residential carbon emissions and reflects the mitigation potential of residential structure optimization.
Carbon emissions from the industrial, agricultural, and service sectors all have significant positive effects on urban energy consumption carbon emissions. Among them, the agricultural sector has the highest regression coefficient, followed by the service sector and the industrial sector. This indicates that the emission structure of these sectors is a key determinant of the overall urban carbon emission level. In particular, emission control in the agricultural sector is crucial, while emissions from the service and industrial sectors also play important roles in shaping total urban emissions.
4.2. Discussion
Regression results show that urban construction land expansion, economic growth, the size of foreign-funded enterprises, and carbon emissions from the three industrial sectors significantly increase urban energy-related carbon emissions. In contrast, the scale of commercial housing sales and the number of domestic enterprises have emission-reducing effects. This empirical pattern can be fully interpreted within the existing literature based on established environmental economic theory. From the STIRPAT framework, the expansion of built-up urban areas corresponds to increases in population and city scale. Infrastructure construction and building operation generate rigid energy demand. This is consistent with the conclusion that unregulated urban spatial expansion increases carbon emissions.
The positive relationship between economic growth and carbon emissions confirms the theory of development stages. From 2005 to 2020, China had not yet achieved full decoupling between growth and emissions. Industrial production and residential consumption energy demand expand in parallel with economic growth. This supports the empirical finding that economic growth dominates emission increases during the industrialization stage. The differentiated effects of domestic and foreign-funded enterprises can be explained by industrial transfer and green investment theory. Foreign-funded enterprises are more concentrated in energy-intensive processing and manufacturing sectors such as steel and chemicals. The entry threshold for green and low-carbon technologies is relatively low, and improvements in energy efficiency are relatively slow. This supports the finding that the emission-reduction effect of carbon trading pilot policies on foreign-funded enterprises is limited.
In contrast, domestic enterprises are more closely aligned with domestic energy-saving and carbon-reduction policy orientations. They are more likely to implement energy efficiency improvements and green industrial upgrades, thereby forming stable emission constraints. This study fills a gap in the literature, which rarely distinguishes between heterogeneous domestic and foreign drivers. The negative coefficient of commercial housing sales reflects the environmental benefits of green building policies. The continued implementation of residential energy efficiency standards has reduced energy consumption in the residential sector. This study extends existing research that focuses mainly on industrial emission reduction and overlooks the low-carbon potential of residential space.
The differences in regression coefficients across industries reflect distinct resource and environmental endowment characteristics. The agricultural sector shows the strongest driving effect on carbon emissions. This is mainly due to continuous energy consumption from fertilizer use, agricultural machinery, and straw disposal under China’s smallholder farming system. Most existing studies focus on industrial emissions, and the role of agricultural emissions is underestimated. This study helps fill that gap. At the same time, the spatial pattern of coal-rich Northwest China and densely populated Southeast China amplifies the spillover effects of carbon emissions caused by industrial transfer. The relocation of energy-intensive industries from the east to the central and western regions has directly affected the northwestward shift in the emission center. This is consistent with the view that regional resource endowment determines the spatial differentiation of carbon emissions.
In summary, urban energy-related carbon emission control is a systematic project that requires coordination across space, economy, housing, enterprises, and industry. Governments should build an integrated emission reduction system of scale control–structural optimization–efficiency improvement–technology empowerment to support cities in achieving carbon peaking and carbon neutrality goals.
5. Conclusions and Strategy Recommendations
5.1. Conclusions
From 2005 to 2020, China’s total carbon emissions from energy consumption showed a stepwise growth pattern with a gradual slowdown. Emissions continued to rise and reached historical peaks. A brief decline occurred in 2020 due to the COVID-19 pandemic. Spatially, high-emission areas were concentrated in eastern coastal regions such as Beijing–Tianjin–Hebei, the Yangtze River Delta, and the Pearl River Delta. These areas gradually expanded northward and westward. Eventually, a continuous high-value belt formed across the Bohai Rim, North China, and Northeast China. Urban agglomerations in the middle reaches of the Yangtze River, Chengdu–Chongqing, and other central and western regions became new growth poles. The center of gravity of emissions continued to move northward and expand westward. Emission growth shifted from eastern coastal areas to energy- and resource-based regions in Northwest China. Developed eastern provinces gradually entered a plateau stage, and regional differentiation intensified.
In terms of per capita carbon emissions, the spatial pattern of high in the northwest and low in the southeast, high in resource-based areas and low in densely populated areas, remained stable over time. Inner Mongolia, Xinjiang, Ningxia, and other energy-rich provinces formed high-concentration per capita emission clusters. Densely populated southern regions remained at low to medium levels. From 2005 to 2015, per capita emissions increased rapidly. From 2015 to 2020, the growth rate slowed significantly. The eastern region stabilized earlier, while northwestern provinces maintained relatively fast growth. As a result, regional disparities continued to widen. The center of gravity of per capita emissions shifted persistently toward the northwest, reflecting the combined effects of resource endowment, industrial structure, and population distribution.
Carbon emissions per unit of GDP decreased significantly compared with 2005. Low-value areas gradually expanded from the southeast coast to central and western China. High-value areas remained mainly in a few resource-rich northwestern provinces. The regional gradient continued to converge. The period from 2005 to 2015 was characterized by a rapid decline in emission intensity. From 2015 to 2020, the trend entered a stage of steady optimization. The center of gravity of intensity reduction expanded from eastern regions to central, western, and northwestern China. This reflects the effects of industrial upgrading, energy efficiency improvement, and low-carbon policies.
Based on the spatiotemporal evolution of the three indicators, China’s carbon emission pattern shows strong coupled differentiation. The total emission center of gravity moved northward and westward. The per capita emission center shifted toward Northwest China. Carbon emission intensity showed significant spatial variation. Together, these patterns reflect a transition from high-carbon extensive development to low-carbon intensive development. This spatiotemporal pattern results from the interaction of economic development stages, industrial structure transformation, energy resource endowment, and low-carbon policies. Regression analysis further shows that urban construction land expansion, economic growth, the number of foreign-invested enterprises, and emissions from the three major industries have significant positive effects on energy-related carbon emissions. In contrast, the commercial housing sales area and the number of domestic enterprises have significant effects. This study provides an empirical basis for carbon emission control and regionally differentiated emission reduction policies.
5.2. Strategy Suggestions
We combine the temporal and spatial characteristics and driving factors of total carbon emissions, per capita carbon emissions, and carbon emission intensity from energy consumption in China. Based on regional differences and the principle of precise policy implementation, we propose differentiated carbon reduction and control strategies for key provinces and cities.
Precise zoning control is essential for addressing regional emission disparities. In high-emission coastal and northern clusters (e.g., Shandong, Hebei, Jiangsu, Liaoning), strict measures are needed to accelerate the green transformation of heavy industries such as steel, cement, and chemicals [44]. In northwestern regions with high per capita emissions (Inner Mongolia, Xinjiang, Ningxia), the disorderly expansion of coal and coal-chemical projects should be strictly restricted. Fast-growing central and western regions (Sichuan, Hubei, Hunan, Chongqing) should prioritize carbon intensity control to avoid following the high-carbon development path of eastern regions. Low-emission ecological zones (Tibet, Qinghai, Hainan, Guizhou) should maintain ecological protection red lines, preserve their low-carbon foundations, and establish a policy framework that combines classification management with regional coordination.
Strengthening the dual control of total carbon emissions and emission intensity is a national priority. Energy efficiency in key sectors should be continuously improved [45,46]. Southeastern coastal provinces with low-carbon advantages (Zhejiang, Guangdong, Fujian) should expand the application of energy-saving technologies and clean energy. Traditional energy-producing provinces (Shanxi, Shaanxi, Gansu) should promote industrial energy-saving retrofits and cascade energy utilization. They should also accelerate the elimination of outdated high-energy-consuming frameworks. At the national level, strict caps on fossil fuel consumption should be maintained in major urban agglomerations, including Beijing–Tianjin–Hebei, the Yangtze River Delta, and the Pearl River Delta. At the same time, fossil energy should be gradually replaced by wind and solar power. This will help slow total emission growth and continuously reduce carbon intensity.
Optimizing urban construction and industrial structure is crucial for controlling rigid growth in industrial carbon emissions [47,48]. The government should strictly control the disorderly expansion of construction land in central cities such as Zhengzhou, Xi’an, Chengdu, and Wuhan. Compact urban development, green buildings, and low-carbon infrastructure should be promoted. Cities with high foreign investment intensity (Shanghai, Suzhou, Guangzhou, Qingdao) should guide foreign capital away from high-carbon industries toward high-tech and green sectors. Innovation-driven cities (Shenzhen, Hangzhou, Hefei) should be supported to lead technological innovation and low-carbon transformation. In major industrial hubs such as Shanghai, Chongqing, and Shenyang, low-carbon transformation in industry, agriculture, and services should be promoted to reduce emissions from industrial sources.
Narrowing the regional gap in per capita emissions and promoting coordinated reduction between resource-based and densely populated regions are equally important [49,50]. In energy-resource provinces such as Inner Mongolia, Xinjiang, and Ningxia, industrial upgrading and cleaner energy use should be promoted to slow the growth of per capita emissions. In densely populated provinces such as Henan, Shandong, and Guangdong, the energy consumption structure of urban and rural residents should be optimized. This can be achieved through energy-efficient appliances, green transportation, and distributed energy systems. Cross-regional cooperation between northwest energy-producing regions and eastern energy-consuming regions should be strengthened. This can be achieved through west-to-east power transmission and green electricity trading. These measures help reduce per capita emission disparities and promote balanced and equitable low-carbon development across regions.
A comprehensive spatial optimization strategy is needed for different macro-regions [51,52]. Eastern developed regions (Beijing–Tianjin–Hebei, Yangtze River Delta, Pearl River Delta) should focus on achieving carbon peaking and deep decarburization. They should strictly phase out existing high-emission capacity in steel and chemical industries. At the same time, they should vigorously develop the digital economy and modern services and expand distributed energy applications. Northern heavy-industrial regions (Shandong, Hebei, Shanxi, and old industrial bases in Northeast China) should promote energy-saving retrofits and capacity replacement in heavy chemical industries. Industrial waste heat cascade utilization systems should be established. Dependence on coal power should be gradually reduced. Northwest resource-based regions (Inner Mongolia, Xinjiang, Ningxia) should develop large-scale clean energy bases and transmit green electricity to eastern regions. They should also extend green processing industrial chains. Low-emission ecological regions (Qinghai, Tibet, Guizhou, Hainan) must strictly observe ecological protection red lines and avoid undertaking high-energy-consuming transferred industries. They should develop eco-tourism and low-carbon agriculture. Cross-regional ecological compensation and carbon sink trading mechanisms should be improved to maintain their low-carbon foundations.
5.3. Research Limitations
Of course, this study carries several methodological and data limitations that deserve detailed clarification for subsequent research. First, our benchmark regression incorporates industrial, agricultural, and service sector carbon emissions as explanatory variables to quantify their relative correlational contributions to total urban energy carbon emissions. These three sectoral metrics are direct subcomponents of the dependent variable of aggregate carbon output, creating inherent partial-to-total compositional collinearity that artificially inflates the adjusted R2 to 0.982 and overstates the model’s apparent explanatory power. Although auxiliary regressions excluding sectoral variables confirm the stable statistical associations of urban construction, economic scale, and enterprise indicators, this variable setting introduces bias when interpreting goodness-of-fit metrics. Moreover, the emission inventory adopted only captures industry, agriculture, and service segments, omitting carbon flows from transportation, residential consumption, and building operations, which leaves key emission sources unaccounted for and narrows the completeness of our factor analysis. To address this drawback, future research will replace aggregate total emissions with carbon intensity or per capita emissions as the dependent variable to eliminate structural collinearity, and adopt indicators such as industrial output share and energy intensity instead of sectoral emission volumes to characterize industrial structure effects without generating an inflated model fit. In addition, given the significant spatial dependence of urban carbon emissions demonstrated via GWR residuals, the static cross-sectional framework fails to capture inter-city carbon spillover effects. Follow-up research will introduce advanced spatial panel econometric models including the Spatial Durbin Model (SDM), Spatial Lag Model (SLM), and Spatial Error Model (SEM) to systematically test spatial correlation and identify more reliable driving mechanisms. Third, the dataset only contains discrete observations for 2005, 2010, 2015, and 2020 without continuous annual panel records, making it unable to capture short-term annual emission fluctuations or track year-by-year dynamic changes in driving factor intensity, which limits the depth of temporal evolution analysis.
Author Contributions
X.Z. conceptualized the study, interpreted the results, and prepared the original draft of the manuscript. X.Z. and Z.W. conceptualized the study and methodology, performed the statistical analysis, interpreted the results, and revised the manuscript. All authors have read and agreed to the published version of the manuscript.
Funding
This research is supported by the National Natural Science Foundation of China (Project No: 52278044), and also by Tarim University Urban and Rural Planning Support Professional Construction Project (No: FCZYXJ202503).
Institutional Review Board Statement
Not applicable.
Informed Consent Statement
Not applicable.
Data Availability Statement
All the data included in this study are available upon request from the corresponding author.
Conflicts of Interest
The authors declare no conflicts of interest.
References
- Gielen, D.; Boshell, F.; Saygin, D.; Bazilian, M.D.; Wagner, N.; Gorini, R. The role of renewable energy in the global energy transformation. Energy Strategy Rev. 2019, 24, 38–50. [Google Scholar] [CrossRef] [Scilit]
- Liu, Z.; Ciais, P.; Deng, Z.; Lei, R.; Davis, S.J.; Feng, S.; Zheng, B.; Cui, D.; Dou, X.; Zhu, B.; et al. Near-real-time monitoring of global CO2 emissions reveals the effects of the COVID-19 pandemic. Nat. Commun. 2020, 11, 5172. [Google Scholar] [CrossRef] [Scilit] [PubMed]
- Ouyang, X.; Lin, B. An analysis of the driving forces of energy-related carbon dioxide emissions in China’s industrial sector. Renew. Sustain. Energy Rev. 2015, 45, 838–849. [Google Scholar] [CrossRef] [Scilit]
- Haberl, H.; Wiedenhofer, D.; Virág, D.; Kalt, G.; Plank, B.; Brockway, P.; Fishman, T.; Hausknost, D.; Krausmann, F.; Leon-Gruchalski, B.; et al. A systematic review of the evidence on decoupling of GDP, resource use and GHG emissions, part II: Synthesizing the insights. Environ. Res. Lett. 2020, 15, 065003. [Google Scholar] [CrossRef] [Scilit]
- Xu, B.; Lin, B. Can expanding natural gas consumption reduce China’s CO2 emissions? Energy Econ. 2019, 81, 393–407. [Google Scholar] [CrossRef] [Scilit]
- Bilgen, S. Structure and environmental impact of global energy consumption. Renew. Sustain. Energy Rev. 2014, 38, 890–902. [Google Scholar] [CrossRef] [Scilit]
- Balsa-Barreiro, J.; Li, Y.; Morales, A. Globalization and the shifting centers of gravity of world’s human dynamics: Implications for sustainability. J. Clean. Prod. 2019, 239, 117923. [Google Scholar] [CrossRef] [Scilit]
- Green, F.; Stern, N. China’s changing economy: Implications for its carbon dioxide emissions. Clim. Policy 2017, 17, 423–442. [Google Scholar] [CrossRef] [Scilit]
- Schleussner, C.-F.; Rogelj, J.; Schaeffer, M.; Lissner, T.; Licker, R.; Fischer, E.M.; Knutti, R.; Levermann, A.; Frieler, K.; Hare, W. Science and policy characteristics of the Paris Agreement temperature goal. Nat. Clim. Change 2016, 6, 827–835. [Google Scholar] [CrossRef] [Scilit]
- Feng, K.; Siu, Y.L.; Guan, D.; Hubacek, K. Analyzing drivers of regional carbon dioxide emissions for China: A structural decomposition analysis. J. Ind. Ecol. 2012, 16, 600–611. [Google Scholar] [CrossRef] [Scilit]
- Dong, J.F.; Deng, C.; Wang, X.-M.; Zhang, X.-L. Multilevel index decomposition of energy-related carbon emissions and their decoupling from economic growth in Northwest China. Energies 2016, 9, 680. [Google Scholar] [CrossRef] [Scilit]
- Han, P.; Zeng, N.; Oda, T.; Zhang, W.; Lin, X.; Liu, D.; Cai, Q.; Ma, X.; Meng, W.; Wang, G.; et al. A city-level comparison of fossil-fuel and industry processes-induced CO2 emissions over the Beijing-Tianjin-Hebei region from eight emission inventories. Carbon Balance Manag. 2020, 15, 25. [Google Scholar] [CrossRef] [Scilit] [PubMed]
- Peter, C.; Fiore, A.; Hagemann, U.; Nendel, C.; Xiloyannis, C. Improving the accounting of field emissions in the carbon footprint of agricultural products: A comparison of default IPCC methods with readily available medium-effort modeling approaches. Int. J. Life Cycle Assess. 2016, 21, 791–805. [Google Scholar] [CrossRef] [Scilit]
- Wu, R.; Wang, J.; Wang, S.; Feng, K. drivers of declining CO2 emissions trends in developed nations using an extended STIRPAT model: A historical and prospective analysis. Renew. Sustain. Energy Rev. 2021, 149, 111328. [Google Scholar] [CrossRef] [Scilit]
- Kober, T.; Schiffer, H.-W.; Densing, M.; Panos, E. Global energy perspectives to 2060–WEC’s World Energy Scenarios 2019. Energy Strategy Rev. 2020, 31, 100523. [Google Scholar] [CrossRef] [Scilit]
- Mačiulienė, M.; Skaržauskienė, A.; Kovaitė, K. Climate change adaptation: What is driving Us into action? Contemp. Econ. 2025, 19, 1–17. Available online: https://www.ceeol.com/search/article-detail?id=1325636 (accessed on 30 October 2025).
- Streimikiene, D. Assessment of New Climate And Energy Targets for the Baltic States. Contemp. Econ. 2025, 19, 230–239. Available online: https://www.ceeol.com/search/article-detail?id=1365015 (accessed on 30 October 2025).
- Štreimikienė, D.; Kyriakopoulos, G. Climate change performance of Baltic States based on global climate change indices. Contemp. Econ. 2025, 19, 355–370. Available online: https://www.ceeol.com/search/article-detail?id=1372084 (accessed on 30 October 2025).
- Zhang, X.; Liu, S.; Han, H. Analysis on spatial pattern evolution and policy of CO2 emissions from economic sectors in China from 2005 to 2020. J. Environ. Manag. 2025, 394, 127606. [Google Scholar] [CrossRef] [Scilit] [PubMed]
- Cai, Y.; Rahman, H.U.; Khan, A.B.; Fareed, M. The Role of Environmental Quality, Financial Development and Institutional Quality in Sustainable Economic Growth: Evidence from China. Contemp. Econ. 2025, 19, 312–328. [Google Scholar] [CrossRef] [Scilit]
- Zhou, K.; Yang, J.; Yang, T.; Ding, T. Spatial and temporal evolution characteristics and spillover effects of China’s regional carbon emissions. J. Environ. Manag. 2023, 325, 116423. [Google Scholar] [CrossRef] [Scilit] [PubMed]
- Wang, Y.; Fan, Y.; Li, H.; Shang, Z. Dynamic Simulation and Reduction Path of Carbon Emission in “Three-Zone Space”: A Case Study of a Rapidly Urbanizing City. Land 2025, 14, 245. [Google Scholar] [CrossRef] [Scilit]
- Wang, M.; Zhao, X.; Liu, F. Identification, Attribution, and Mitigation of Agricultural–Ecological Functional Conflicts in Urban Agglomerations. Sustainability 2025, 17, 2565. [Google Scholar] [CrossRef] [Scilit]
- Lin, B.; Ouyang, X. Analysis of energy-related CO2 (carbon dioxide) emissions and reduction potential in the Chinese non-metallic mineral products industry. Energy 2014, 68, 688–697. [Google Scholar] [CrossRef] [Scilit]
- Du, K.; Xie, C.; Ouyang, X. A comparison of carbon dioxide (CO2) emission trends among provinces in China. Renew. Sustain. Energy Rev. 2017, 73, 19–25. [Google Scholar] [CrossRef] [Scilit]
- Zhang, X.; Tang, Y.; Han, H.; Chen, Z. Evolution Characteristics and Main Influencing Factors of Carbon Dioxide Emissions in Chinese Cities from 2005 to 2020. Sustainability 2023, 15, 14849. [Google Scholar] [CrossRef] [Scilit]
- Tseng, S.W. Analysis of energy-related carbon emissions in Inner Mongolia, China. Sustainability 2019, 11, 7008. [Google Scholar] [CrossRef] [Scilit]
- He, Q.; Song, Y.; Liu, Y.; Yin, C. Diffusion or coalescence? Urban growth pattern and change in 363 Chinese cities from 1995 to 2015. Sustain. Cities Soc. 2017, 35, 729–739. [Google Scholar] [CrossRef] [Scilit]
- Amann, M.; Klimont, Z.; Wagner, F. Regional and global emissions of air pollutants: Recent trends and future scenarios. Annu. Rev. Environ. Resour. 2013, 38, 31–55. [Google Scholar] [CrossRef] [Scilit]
- Gidden, M.J.; Riahi, K.; Smith, S.J.; Fujimori, S.; Luderer, G.; Kriegler, E.; van Vuuren, D.P.; Berg, M.v.D.; Feng, L.; Klein, D.; et al. Global emissions pathways under different socioeconomic scenarios for use in CMIP6, a dataset of harmonized emissions trajectories through the end of the century. Geosci. Model Dev. 2019, 12, 1443–1475. [Google Scholar] [CrossRef] [Scilit]
- An, K.; Zhang, S.; Zhou, J.; Wang, C. How can computable general equilibrium models serve low-carbon policy? A systematic review. Environ. Res. Lett. 2023, 18, 033002. [Google Scholar] [CrossRef] [Scilit]
- Heggedal, T.R.; Jacobsen, K. Timing of innovation policies when carbon emissions are restricted: An applied general equilibrium analysis. Resour. Energy Econ. 2011, 33, 913–937. [Google Scholar] [CrossRef] [Scilit]
- Ma, X.; Wang, C.; Dong, B.; Gu, G.; Chen, R.; Li, Y.; Zou, H.; Zhang, W.; Li, Q. Carbon emissions from energy consumption in China: Its measurement and driving factors. Sci. Total Environ. 2019, 648, 1411–1420. [Google Scholar] [CrossRef] [Scilit] [PubMed]
- Dong, F.; Yu, B.; Hadachin, T.; Dai, Y.; Wang, Y.; Zhang, S.; Long, R. Drivers of carbon emission intensity change in China. Resour. Conserv. Recycl. 2018, 129, 187–201. [Google Scholar] [CrossRef] [Scilit]
- Zhang, X.; Han, H. Spatiotemporal dynamic characteristics and causes of China’s population aging from 2000 to 2020. Sustainability 2023, 15, 7212. [Google Scholar] [CrossRef] [Scilit]
- Chen, L.; Wang, Q. Study on the contradiction between population and cultivated land and the priority protection of cultivated land in the policy of poverty alleviation: A case study of the upper reaches of min river, sichuan province, China. Sustainability 2021, 13, 3348. [Google Scholar] [CrossRef] [Scilit]
- Wu, G.; Liu, T.; Tang, M. Analysis of household energy consumption and related CO2 emissions in the disregarded villages of Lijiang City, China. Int. J. Sustain. Dev. World Ecol. 2012, 19, 500–505. [Google Scholar] [CrossRef] [Scilit]
- Ou, J.; Liu, X.; Li, X.; Shi, X. Mapping global fossil fuel combustion CO2 emissions at high resolution by integrating nightlight, population density, and traffic network data. IEEE J. Sel. Top. Appl. Earth Obs. Remote Sens. 2015, 9, 1674–1684. [Google Scholar] [CrossRef] [Scilit]
- Yu, Y.; You, K.; Cai, W.; Feng, W.; Li, R.; Liu, Q.; Chen, L.; Liu, Y. City-level building operation and end-use carbon emissions dataset from China for 2015–2020. Sci. Data 2024, 11, 138. [Google Scholar] [CrossRef] [Scilit] [PubMed]
- Xiong, W.; Zhang, Y.; Li, J. Examining the Causal and Heterogeneous Influence of Three-Dimensional Urban Forms on CO2 Emissions in 285 Chinese Cities. ISPRS Int. J. Geo-Inf. 2024, 13, 372. [Google Scholar] [CrossRef] [Scilit]
- Gillingham, K.; Palmer, K. Bridging the energy efficiency gap: Policy insights from economic theory and empirical evidence. Rev. Environ. Econ. Policy 2014, 8, 18–38. [Google Scholar] [CrossRef] [Scilit]
- Su, Y.; Chen, X.; Li, Y.; Liao, J.; Ye, Y.; Zhang, H.; Huang, N.; Kuang, Y. China’s 19-year city-level carbon emissions of energy consumptions, driving forces and regionalized mitigation guidelines. Renew. Sustain. Energy Rev. 2014, 35, 231–243. [Google Scholar] [CrossRef] [Scilit]
- Seyfang, G. Community action for sustainable housing: Building a low-carbon future. Energy Policy 2010, 38, 7624–7633. [Google Scholar] [CrossRef] [Scilit]
- Zhang, X. Research on the optimization of low-carbon spatial layout for construction land in central urban areas. Environ. Soc. Gov. 2025, 2, 1–11. [Google Scholar] [CrossRef] [Scilit]
- Li, J.; Colombier, M. Managing carbon emissions in China through building energy efficiency. J. Environ. Manag. 2009, 90, 2436–2447. [Google Scholar] [CrossRef] [Scilit] [PubMed]
- Wang, Y.; Yang, H.; Sun, R. Effectiveness of China’s provincial industrial carbon emission reduction and optimization of carbon emission reduction paths in “lagging regions”: Efficiency-cost analysis. J. Environ. Manag. 2020, 275, 111221. [Google Scholar] [CrossRef] [Scilit] [PubMed]
- Shu, H.; Xiong, P. Reallocation planning of urban industrial land for structure optimization and emission reduction: A practical analysis of urban agglomeration in China’s Yangtze River Delta. Land Use Policy 2019, 81, 604–623. [Google Scholar] [CrossRef] [Scilit]
- Zhou, X.; Zhang, J.; Li, J. Industrial structural transformation and carbon dioxide emissions in China. Energy Policy 2013, 57, 43–51. [Google Scholar] [CrossRef] [Scilit]
- Zheng, H.; Ge, L. Carbon emissions reduction effects of sustainable development policy in resource-based cities from the perspective of resource dependence: Theory and Chinese experience. Resour. Policy 2022, 78, 102799. [Google Scholar] [CrossRef] [Scilit]
- Guo, C.; Yu, J. Determinants and their spatial heterogeneity of carbon emissions in resource-based cities, China. Sci. Rep. 2024, 14, 5894. [Google Scholar] [CrossRef] [Scilit] [PubMed]
- Chen, X.; Meng, Q.; Wang, K.; Liu, Y.; Shen, W. Spatial patterns and evolution trend of coupling coordination of pollution reduction and carbon reduction along the Yellow River Basin, China. Ecol. Indic. 2023, 154, 110797. [Google Scholar] [CrossRef] [Scilit]
- Zhao, X.; Zhang, L.; Wang, X.; Wang, K.; Pan, J.; Tian, X.; Yang, L.; Wang, Y.; Ni, Y.; Zheng, C. Quantitative Assessment of Coal Phaseouts and Retrofit Deployments for Low-Carbon Transition Pathways in China’s Coal Power Sector. Sustainability 2025, 17, 5766. [Google Scholar] [CrossRef] [Scilit]

Disclaimer/Publisher’s Note: The statements, opinions and data contained in all publications are solely those of the individual author(s) and contributor(s) and not of MDPI and/or the editor(s). MDPI and/or the editor(s) disclaim responsibility for any injury to people or property resulting from any ideas, methods, instructions or products referred to in the content. |
© 2026 by the authors. Licensee MDPI, Basel, Switzerland. This article is an open access article distributed under the terms and conditions of the Creative Commons Attribution (CC BY) license.