Article

The Enterprise-Led Innovation Cooperation Network’s Evolution Mechanism and Its Impact on Sustainable Development

1
School of Mathematical Sciences, Jiangsu University, Zhenjiang 212013, China
2
Department of Mathematics, Nanjing Normal University Taizhou College, Taizhou 225300, China
3
Ministry of Education Key Laboratory of NSLSCS, School of Mathematical Sciences, Nanjing Normal University, Nanjing 210023, China
*
Author to whom correspondence should be addressed.
Sustainability 2026, 18(14), 7116; https://doi.org/10.3390/su18147116
Submission received: 27 May 2026 / Revised: 27 June 2026 / Accepted: 9 July 2026 / Published: 12 July 2026

Abstract

Enterprise-led innovation cooperation significantly accelerates scientific and technological progress, enhances corporate competitiveness, and promotes global technological development through resource integration, cross-field integration, and risk sharing. Investigating the modes and evolutionary mechanisms of enterprise-led innovation cooperation is of important practical significance. This paper proposes a method for constructing an enterprise-led innovation team collaboration network. Based on the data of the Jiangsu Provincial Science and Technology Progress Award from 2006 to 2023, an enterprise-led innovation team collaboration network is established. Low-order and high-order network topological indicators are adopted to analyze the topological characteristics of the collaboration network in different period stages. From the dual perspectives of spatial layout and organizational structure, this paper further explores the characteristics and evolutionary process of innovation entities within the collaboration network. The results reveal that all low-order topological indicators of the innovation collaboration network show an upward trend, and the cooperative relationships among innovation entities become increasingly close. However, enterprises still lack sufficient potential and motivation in driving innovation collaboration. The proportion of non-zero high-order indicators is relatively low, indicating that innovation entities mainly engage in direct cooperation while the proportion of indirect collaborative innovation remains at a low level. Spatially, the innovation collaboration network presents a diffusion trend of innovation entities from intra-provincial cooperation to cross-provincial cooperation, forming multiple innovation clusters centered on core cities. Furthermore, with the calculated network topological indicators, a multiple regression model is constructed to explore the relationship between the enterprise-led innovation collaboration network and sustainable development. The empirical results demonstrate that the average path length of the innovation collaboration network exerts a significant negative impact on regional sustainable development, while the number of network edges has a significant positive impact.

1. Introduction

In recent years, a new round of technological revolution and industrial transformation has accelerated. General Secretary Xi Jinping pointed out during the 11th collective study session of the Political Bureau of the Communist Party of China Central Committee that efforts should be made to “accelerate the realization of high-level self-reliance and strength in science and technology, secure breakthroughs in core technologies in key fields, and enable original and disruptive technological innovations to emerge in abundance.” Core technologies exhibit notable characteristics, including wide applicability, monopolistic dominance, advanced nature, high complexity, irreplaceability, and difficulty in mastery and surpassing [1,2,3]. Achieving breakthroughs in core technologies in key fields is crucial for maintaining an enterprise’s leading position in the industry, and also holds great significance for a country’s technological security and economic development [4]. Research by numerous scholars indicates that leading technology-based enterprises are playing an increasingly prominent role in technological innovation and have become the main force in making breakthroughs in core technologies in key fields. Leveraging their profound technological accumulation, large enterprises flexibly deploy a variety of technologies and means to address standardization issues, continuously optimizing these solutions through ongoing practice and improvement [5]; they are committed to exploring and pioneering new technological pathways to solve the challenges of core technologies in key fields. Key drivers for leading enterprises to cultivate core technological capabilities in key fields include sustained investment in independent innovation; the establishment of enterprise-owned innovation platforms; continuous integration of key technologies and innovation resources within the industry through reorganization, mergers, and acquisitions; and persistent efforts in recruiting and cultivating leading talents in science and technology [6]. The innovation ecosystem of leading enterprises for core technologies in key fields is closely intertwined with the national innovation system. Policy formulation should focus on leveraging the pioneering capabilities of these leading technology-based enterprises [7]. The model of operating in isolation can no longer meet the development trends of the current market environment. Collaborative innovation is an inevitable outcome of the shift in technological innovation models from closed to open [8], as it can reduce the cost of seeking innovation resources and improve innovation efficiency [9]. Therefore, exploring the collaborative innovation models of leading enterprises and their evolutionary patterns is of great significance.
The innovation cooperation models of enterprises encompass four main types: research and development alliances among enterprises, research joint ventures, close industry–university–research collaboration, and innovation teams established under the leadership of leading enterprises. Among these, R&D alliances among enterprises, as the earliest form of cooperation model, are particularly notable for their directness. An enterprise R&D alliance refers to the collaborative efforts of two or more enterprises jointly engaged in research and development activities [10]. Such alliances facilitate resource integration, optimal allocation, and joint R&D among enterprises, helping to improve innovation efficiency [11], reduce risks and costs, share knowledge, and gain larger market shares. They experienced rapid development during the 1990s [12,13,14]. However, some alliance enterprises lack management awareness, often focusing more on short-term interests while neglecting investment in and pursuit of long-term foundational R&D goals, exhibiting a “short-sighted” tendency [15]. Research Joint Ventures (RJVs) originated from collaborative research activities among established enterprises in countries such as the United States and Japan, addressing the shortcomings of R&D alliances among enterprises. Members of RJVs engage in long-term cooperative relationships that go beyond normal market transactions but do not reach the level of merger, representing a way for enterprises to expand their business scope or develop new technologies and products without increasing the scale of the enterprise [16]. However, cooperation among large enterprises is the primary focus of RJVs, yet issues such as trust and cooperation problems among members [17,18], divergent viewpoints, and uneven distribution of benefits have led to unsatisfactory overall collaborative innovation outcomes [19]. Industry–university–research collaboration refers to cooperative innovation activities among enterprises, universities, and research institutions, and is an important form of collaborative R&D [20]. A large body of research has found that industry–university–research collaboration helps enterprises increase technological innovation outcomes, significantly promotes the number of enterprise patent applications and patent grants [21,22], and enhances the quality of enterprise innovation, and the depth of cooperation has a sustained positive impact on innovation quality [23]. However, due to insufficient attention to industrial demands, inconsistent driving mechanisms, and inadequate operational systems, industry–university–research collaboration has ultimately led to a phenomenon of disconnection [24]. Within industry–university–research collaboration, the “principal–agent” relationship has fostered narrow departmental interests and adopted an operational model of information monopolization, treating information as a power resource. This has resulted in information fragmentation, asymmetry, and a phenomenon of working in silos, which have become the theoretical roots and practical factors contributing to the “fragmentation” of industry–university–research collaboration governance [25]. These various issues hinder the innovation of result-oriented and goal-oriented organizational systems, weakening the effectiveness of industry–university–research collaboration governance [26].
Recently, some scholars have begun to focus on innovation teams led by leading or flagship enterprises. These teams are established under the leadership of leading or flagship enterprises, bringing together institutions such as universities, small and medium-sized enterprises, research institutes, and government departments to jointly form an innovation team, engaging in in-depth research and collaboration under the guidance of national science and technology strategies. Compared with R&D alliances among enterprises, research joint ventures, and industry–university–research collaboration, the most notable characteristic of innovation teams led by leading enterprises is that they ensure the leading role of enterprises in technology selection and layout during the core technology development process, emphasizing dynamic and long-term value propositions [27,28]. They are also more market-oriented [29], effectively transforming technological achievements into products and services that meet market demands. Second, leading enterprises often possess relatively well-established industrial and supply chain systems, enabling them to integrate resources from upstream and downstream enterprises and achieve complementary advantages. Therefore, innovation teams led by leading enterprises help consolidate innovation resources and address critical bottlenecks in core technologies [30]. Moreover, leading enterprises typically have strong risk-bearing capabilities and risk resistance, which not only provide stable financial support and guarantees for innovation teams, but also reduce uncertainties and risks in the R&D process through diversified operations and risk control [31]. Finally, such teams reflect the macro-level guidance and pioneering role of the government, enabling enterprises to serve as leaders in guiding innovation teams to integrate high-quality resource channels and undertake key technological tasks at the national or industrial level [32].
Complex network theory has been widely applied in the field of innovation and technology. When exploring the relationship between networks and innovation, researchers often regard enterprises as nodes in the network and accordingly construct networks such as patent citation networks, knowledge diffusion networks, joint R&D networks, and supply chain networks. On the one hand, these studies focus on analyzing the impact of node attributes within the network on innovation performance. For instance, Gao et al., using patent data from the ICT industry from 1999 to 2010, constructed an industry–university–research collaboration innovation network and found that the relationship between a firm’s openness and innovation performance is U-shaped [33]. Betweenness centrality and clustering coefficient have a significant positive impact on a firm’s technological innovation capability, whereas the constraint of structural holes has a negative impact [34]. An et al., drawing on centrality, analyzed the behavioral characteristics of enterprises in the evolution of interconnected innovation networks, concluding that the deeper an enterprise integrates into the interconnected innovation network, the more interconnected innovation activities it engages in, and the better its innovation performance [35]. Jiang et al., from both external and internal perspectives, revealed the relationship between the strength of inter-firm ties and the acquisition of tacit knowledge in networks [36]. On the other hand, existing studies have mainly focused on the innovation effects of networks. For instance, corporate innovation capability plays a mediating role in the impact of supply chain network heterogeneity on financing performance [37]; suppliers’ innovation capability is largely influenced by supply chain networks [38]; and social network embedding significantly affects the collaborative innovation of enterprises in the high-end equipment manufacturing industry [39]. Building on existing research, Li et al. [40] constructed a two-tier analytical framework integrating collaborative structures and knowledge flows using patent data on energy technology cooperation. They conducted empirical research by combining social network analysis with a two-way fixed-effects model. The results reveal that China’s urban energy innovation networks have gradually evolved from a centralized structure to a decentralized one, and advantageous network positions can significantly reduce urban energy intensity, a finding that passes robustness and endogeneity tests. Mechanism analysis verifies that network positions can improve energy efficiency by enhancing the openness of knowledge networks, technological complexity, and knowledge connectivity. Furthermore, this impact exhibits substantial heterogeneity: the effect is more pronounced in eastern and northeastern regions, and industry–university–research collaborative networks deliver the strongest green empowerment effect. This study provides empirical evidence for leveraging innovation networks to support regional sustainable development and the advancement of the “Dual Carbon” goals.
A systematic review of existing literature reveals prominent deficiencies in current studies linking innovation networks to sustainable development. First, most existing papers construct urban energy innovation networks solely using patent data, which restricts their research scope. Taking cities as macro-level analytical units, these studies ignore the core leading role of leading enterprises in collaborative innovation. Second, existing research mostly characterizes network properties via conventional low-order indicators such as degree centrality and network density, while lacking high-order network analysis. Such methods fail to accurately capture the profound and complex co-evolutionary laws of innovation networks. Third, prior literature primarily investigates how innovation networks affect single indicators including innovation performance and energy intensity, yet few studies explore the multi-dimensional enabling effects of enterprise-led innovation networks on comprehensive regional sustainable development. Fourth, most existing work centers on patent-based innovation contexts and rarely adopts official scientific and technological award data to examine the evolution of enterprise-dominated innovation networks. Consequently, they cannot well reflect China’s real-world context where enterprises lead research on core technologies and drive high-quality regional development.
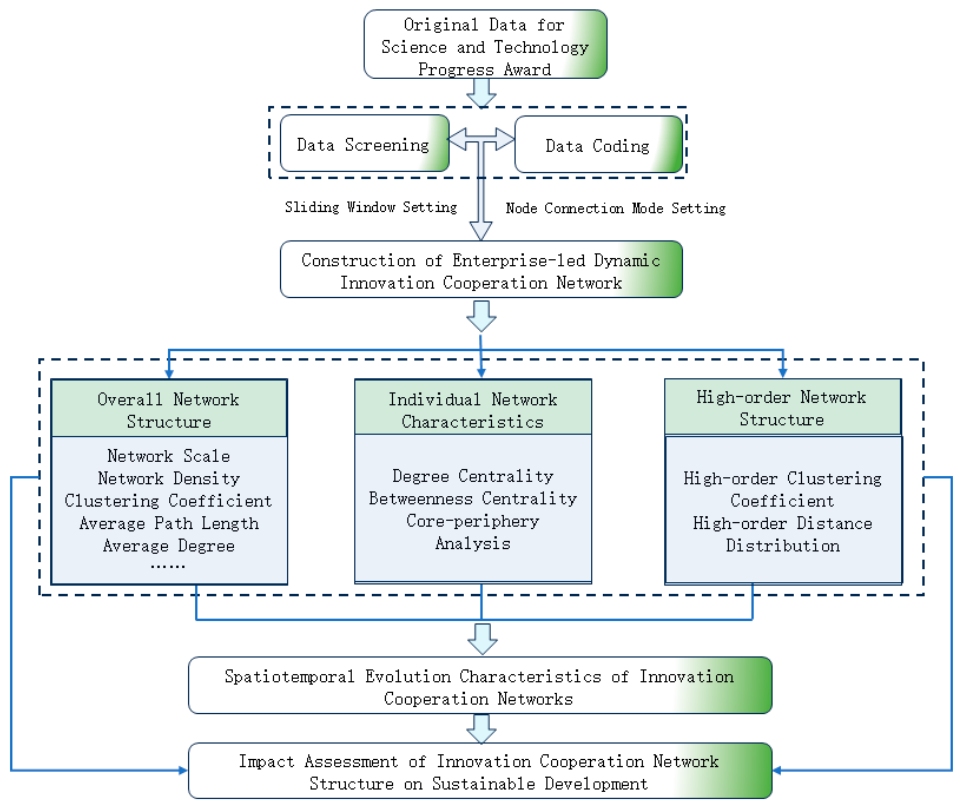
Against the above research gaps, this paper delivers innovations across multiple dimensions. In terms of research data and research context, unlike conventional patent-based innovation networks, this study constructs an enterprise-led innovation collaboration network based on authoritative data from the Jiangsu Provincial Science and Technology Progress Awards from 2006 to 2023. The enterprise-led innovation model is defined by the first completion entity of each awarded project. The dataset covers high-quality industrialized innovation activities across diverse sectors, which better mirrors real scenarios of joint research on regional core technologies and addresses the limitations of patent data, namely narrow industrial coverage and ambiguous dominant participants. In terms of research methodology, this paper overcomes the analytical constraints of traditional low-order network indicators. It integrates multi-dimensional topological metrics including low-order and high-order clustering coefficients as well as high-order distance distributions to unpack the dynamic evolutionary features of networks. This approach effectively identifies intricate collaborative innovation mechanisms undetectable by conventional indicators and improves the quantitative analytical framework for innovation networks. In terms of research perspective, departing from the prevalent research paradigm that adopts cities as macro research units, this paper adopts a dual perspective of space and organization. It focuses on analyzing the resource integration and technological breakthrough mechanisms of innovation led by leading enterprises, and clarifies the core driving function of corporate actors. In terms of research content, this paper targets the intrinsic nexus between enterprise-led innovation networks and comprehensive regional sustainable development. It empirically examines the impact mechanism of network structures on the multi-dimensional level of regional sustainable development, thus enriching the research system covering corporate innovation governance and green high-quality regional development. The research framework of this paper is shown in Figure 1.

2. Research Design

2.1. Data Sources and Processing

This paper selects the list of award-winning projects of the Jiangsu Provincial Science and Technology Progress Award from 2006 to 2023, issued by the Jiangsu Provincial People’s Government, as the research object to explore the evolutionary process of innovation team collaboration networks led by leading enterprises. The reasons for choosing this sample are threefold. First, the Science and Technology Progress Award projects fully demonstrate the important characteristics of enterprise-led innovation teams, which are reflected in the fact that industry-leading enterprises take the lead in collaborating with universities, research institutions, or other enterprises to jointly advance these projects. Moreover, most of these projects originate from important tasks commissioned by national or provincial governments, focusing on breaking through critical bottlenecks in core technologies within industries [31]. Second, the award-winning projects of the Science and Technology Progress Award are representative and authoritative. The Science and Technology Progress Award is an important award established by the Jiangsu Provincial People’s Government to recognize units and individuals that have made outstanding contributions in the field of science and technology. The selection process is rigorous and fair, ensuring the authority and credibility of the award. Furthermore, the Science and Technology Progress Award includes both applied scientific and technological achievements and basic research achievements, with award-winning projects covering multiple industries and fields, demonstrating high representativeness and broad coverage. Finally, the list of award-winning projects of the Jiangsu Provincial Science and Technology Progress Award is open and transparent, with reliable data sources, providing convenience for constructing the innovation collaboration network. Additionally, from 2006 to 2023, the selected sample spans a long period, effectively reflecting the historical changes and development trends of scientific and technological innovation collaboration in Jiangsu Province.
The award-winning projects of the Jiangsu Provincial Science and Technology Award are sourced from policy documents published on the official website of the Jiangsu Provincial People’s Government (https://www.jiangsu.gov.cn/col/col84242/index.html (accessed on 8 July 2026)). A total of 4119 science and technology awards were conferred during the research period from 1 Lanuary 2006 to 31 December 2023. We preprocessed information including award grade, project title, completing entities and contributors based on the list of award winners, with detailed procedures as follows:
First, screen collaborative projects to construct the basic sample set. Only joint award projects involving two or more completing entities are retained, while independently completed projects undertaken by a single entity are eliminated directly, as they entail no cross-agent collaborative behaviors. This step identifies samples characterized by collaborative innovation linkages.
Second, code the types of completing entities. Drawing on the classification criteria proposed by Han Zenglin et al. [41], four categories of innovation agents are distinguished via keyword matching of entity names: entities containing “university”, “college” or “school” are classified as universities; those with “research institute”, “research center”, “laboratory” or “hospital” are categorized as scientific research institutions; entities featuring “company”, “group”, “enterprise”, “mine” or “factory” are defined as firms; administrative entities with governance functions marked by keywords such as “government”, “department”, “bureau”, “commission”, “departmental office” are grouped into the government category (the Jiangsu Popular Science Writers Association is also incorporated into this category).
Third, define enterprise-led collaborative projects and verify the compliance of this operational definition. As stipulated in the Implementation Rules for the Measures of Jiangsu Provincial Science and Technology Awards, completing entities of provincial science and technology award projects are ranked in descending order of their contributions. The first completing entity provides capital, venues, overall technical schemes and cross-party resource coordination throughout the whole project, acting as the core leading agent in coordinating R&D and commercialization of research outcomes. In accordance with this official ranking rule, multi-entity collaborative projects where the first completing entity is an enterprise are defined as “enterprise-led” innovation projects. A total of 1156 such projects are screened out as analytical samples for the innovation collaboration network led by leading enterprises. This definition differentiates ordinary participating enterprises that merely occupy a high ranking from leading enterprises in charge of overall coordination, and validates the dominant position of enterprises in R&D collaboration from the perspective of official evaluation regulations.
Fourth, encode spatial information. Standard national administrative division codes are matched to identify the prefecture-level city affiliation of all completing entities, laying a foundation for analyzing the spatial evolution and regional heterogeneity of enterprise-led innovation collaboration networks.

2.2. Research Methods

Social Network Analysis (SNA) is a quantitative analytical tool for unpacking social ties and network structures. It integrates qualitative and quantitative methods to explore linkages between individuals and organizations as well as their underlying mechanisms, and interprets the regularities of complex interactive behaviors. At present, SNA is widely adopted in sociology, economics, innovation management, network science and other disciplines. This paper constructs an undirected innovation collaboration network based on award-winning projects of the Jiangsu Provincial Science and Technology Award from 2006 to 2023. The detailed operational procedures for network construction are listed as follows. First, disambiguation of institutional names: Standardize and unify the names of entities including enterprises, branches of state-owned enterprises, university-affiliated research institutes, university hospitals, various research centers and corporate subsidiaries, so as to eliminate identification biases caused by identical names for distinct entities or different names for the same entity. Second, classification of entity types: All nodes are categorized into four groups—universities, scientific research institutions, enterprises and government bodies—according to keyword matching of institutional names. Third, regional coding: Standard administrative division codes are matched to label the prefecture-level city where each institution is located. Fourth, rules for edge construction: If a single project involves multiple completing entities, collaborative ties are established pairwise among all participants within the project to form a complete graph structure. Fifth, edge weight assignment: Collaborative ties generated from different projects are assigned equal weights, and the number of edges is not adjusted according to project scale. Sixth, handling of repeated collaborations: If the same pair of entities win awards jointly on multiple occasions, multiple edges are retained to reflect the frequency of sustained collaboration between them.
After network construction, this paper calculates network characteristics from multi-level dimensions. Low-order indicators including network size, total number of edges, network density, network diameter, traditional clustering coefficient, average path length and average degree are selected to depict the overall macroscopic features of the network. Degree centrality, closeness centrality and betweenness centrality are adopted to identify the individual network position of each innovation entity. Furthermore, two high-order topological indicators, namely high-order clustering coefficient and high-order distance distribution, are introduced to deeply explore the dynamic evolutionary patterns of core network entities.
(1)
Overall Characteristic Indicators
Network size refers to the number of all nodes in the network. Number of network edges refers to the number of all edges in the network. Network density is the ratio of the actual number of connections in the overall network to the maximum possible number of connections, reflecting the closeness of connections among nodes in the network. The higher the network density, the closer the connections between nodes. Its calculation formula is [42]:
D e n s i t y = 2 M N ( N 1 ) ,
where M represents the number of actual connections, and N represents the number of network nodes. Obviously, 0 < D e n s i t y < 1 .
Network diameter is the maximum distance between any two nodes in the network, reflecting the maximum communication distance between any innovation agents in the network. Its calculation formula is:
D = max 1 i , j N d i j ,
where d ij is the distance between node v i   and   node   v j .
The clustering coefficient is the arithmetic mean of the clustering coefficients of all nodes in the network, characterizing the local connectivity and degree of clustering of the cooperation network. A higher clustering coefficient indicates the presence of more tightly connected clusters of nodes within the network. Its calculation formula is:
C = 1 N i = 1 N C i ,
where   C I   is the clustering coefficient of node v I and C i   =   2 M i / [ k i ( k i 1 ) ] , where k I is the number of neighbor nodes of node v i , and M i is the number of edges that actually exist among these k i nodes.
Average path length is the average distance between any two nodes in the network, characterizing the average degree of separation among nodes in the network, i.e., how small the network is. A smaller average path length indicates that nodes in the network can reach each other more easily, reflecting the “small-world effect.” Its calculation formula is:
L = 1 N 2 i , j = 1 N d i j .
Average degree is the average of the degrees of all nodes in the network, characterizing the overall connectivity of the network. The larger the average degree, the better the connectivity. Its calculation formula is:
k = 1 N i = 1 N k i .
(2)
Individual Characteristic Indicators
Individual characteristic indicators include degree centrality, closeness centrality, and betweenness centrality. Degree centrality measures the number of other nodes directly connected to a given node and is the most direct metric for characterizing node centrality in network analysis. In an innovation collaboration network, it reflects the central position of each innovation agent; a higher degree indicates more frequent interactions between the innovation agent and other agents, as well as more stable collaborative relationships. For a weighted undirected graph, its calculation formula is:
C D v i = j = 1 , j i N w i j ,
where w ij is the weight of the edge connected to node v i .
Closeness centrality is measured by the reciprocal of the sum of the shortest paths between a node and all other nodes in the network, characterizing the extent to which a node is centrally located within the network. Nodes with high closeness centrality can reach other nodes in the network more quickly and are suitable for disseminating information within the network. Its calculation formula is:
C C v i = ( N 1 ) / [ j = 1 , j i N d i j ] ,
Betweenness centrality is the number of shortest paths that pass through a given node in a network, reflecting the extent to which the node serves as a bridge along the shortest paths between other nodes. Nodes with high betweenness centrality frequently appear on shortest paths, controlling the flow of information and acting as “intermediaries” in the network. Its calculation formula is:
C B v i = 2 ( N 1 ) ( N 2 ) j , l j l i N j l ( i ) N j l ,
where N jl represents the number of shortest paths between node v j and node v l , and N jl ( i ) represents the number of shortest paths among all shortest paths between node v j and node v l that pass through node v i .
(3)
Higher-Order Indicators
Higher-order statistical indicators in networks have diverse applications, as they can more accurately quantify and characterize the structural features of various complex systems, thereby providing deeper insights into their underlying evolutionary mechanisms [43]. The higher-order topological indicators selected in this paper are the higher-order clustering coefficient and distance distribution.
The higher-order clustering coefficient involves more complex node associations and clustering patterns within a network, reflecting the closeness of connections among nodes at a higher level, and facilitates the analysis of both the overall organizational structure and local structural characteristics of the network. The x-order clustering coefficient of node v i is defined as the proportion of node pairs at distance x among its neighbors after removing node v i . Its calculation formula is [44]:
s i x = 2 E i ( x ) | q i | ( q i 1 ) ,
where E i ( x ) denotes the number of neighbor pairs of v i  that are separated by a distance of x after deleting node v i and its corresponding edges from the network; q i represents the number of neighbor nodes of node v i . The clustering coefficient distribution of node  v i   is   S i = { s i ( x ) | 1 x N 1 } . Since node v i is eliminated from the network when calculating its clustering coefficient distribution, the maximum possible diameter of the newly generated network is N 2 . Here, s i x 1 x N 2 stands for the x-order clustering coefficient value of node v i , while the last entry s i N 1 in s i equals the proportion of neighbor pairs of v i with no connecting path between them.
Conventional standard clustering coefficients only measure node agglomeration based on the count of triangular subgraphs, which results in a single-dimensional measurement and fails to fully capture diverse linkages among neighboring nodes. In contrast, high-order clustering coefficients extend measurement to higher-order subgraph structures. They enable refined characterization of multi-layered connections between the neighborhoods of innovation entities and accurately identify intricate topological features inside enterprise-led innovation collaboration networks. Analyzing network agglomeration characteristics and functional modular division rules via high-order clustering coefficients can clarify the internal logic behind structural resilience and stable operation of collaboration networks, and supply critical topological indicators for unpacking the dynamic evolutionary mechanisms of enterprise-led innovation collaboration networks. In empirical analysis of enterprise-led industry–university–research innovation collaboration networks, this indicator effectively excavates multi-level complex collaborative patterns across enterprises, universities and research institutes, clarifies diverse interaction logics and collaborative organizational frameworks within industrial chains and innovation alliances, and profoundly reveals the underlying evolutionary mechanisms of innovation resource aggregation and partnership iteration.
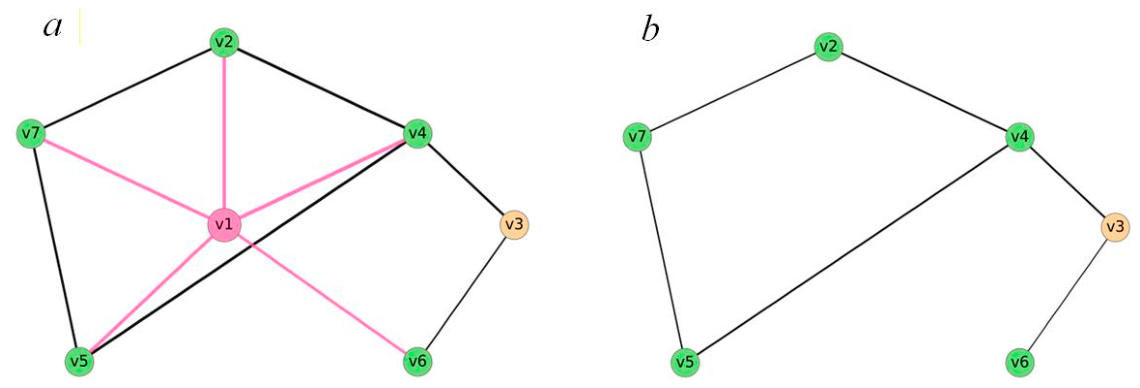
The calculation procedures of high-order clustering coefficients are illustrated with a small network consisting of seven nodes in Figure 2a. After removing node v 1 and its associated edges from this network, we obtain the network shown in Figure 2b. We calculate the distances between v 2 , v 4 , v 5 , v 6 and v 7 (the neighbors of v 1 ) in Figure 2b, and the corresponding distance matrix is as follows:
0 1 2 3 1 1 0 1 2 2 2 1 0 3 1 3 2 3 0 4 1 2 1 4 0
The distance distribution of node v 1 derived from the distance matrix is listed below.
x 123456
E i ( x ) 432100
s i x 0.40.30.20.100
Accordingly, the 1-order clustering coefficient is s 1 1 = 0.4 , the 2-order clustering coefficient is s 1 2 = 0.3 , and so on, with the 5-order clustering coefficient equal to s 1 5 = 0 .
High-order distances account for complex paths and relationships within networks, measuring inter-node distances through indirect paths involving multiple intermediate nodes. High-order distance distributions reflect the complexity and diversity of relationships between nodes. Given an order k 1 , the k-order distance distribution vector of node v i is defined as:
P i k = p i k x | 1 x D k + 1 ,
where D k = max i , j t i , j k   d i j k represents the k-order diameter of the network. The distribution probability is formulated as:
p i k x = N u m b e r   o f   n o d e s   v j   s a t i s f y i n g   t i j k   a n d   d i j k = x j i I ( t i j k ) ,
I ·  denotes an indicator function that takes the value of 1 if the condition holds and 0 otherwise. Unlike first-order distances that only focus on the optimal path with the fewest intermediate nodes, high-order distances incorporate multiple detoured and parallel indirect pathways containing numerous intermediate nodes in the network. By counting the share of nodes linked via high-order paths of varying lengths, high-order distance distributions fully capture the multiplicity, complexity and hierarchical disparities of indirect connections between nodes. While first-order distances merely describe the fastest connectivity route between two nodes, high-order distances simultaneously characterize multiple alternative indirect relationships between node pairs, and can quantify the richness, redundancy and multi-channel propagation features of relational ties.


3. Network Characteristic Analysis

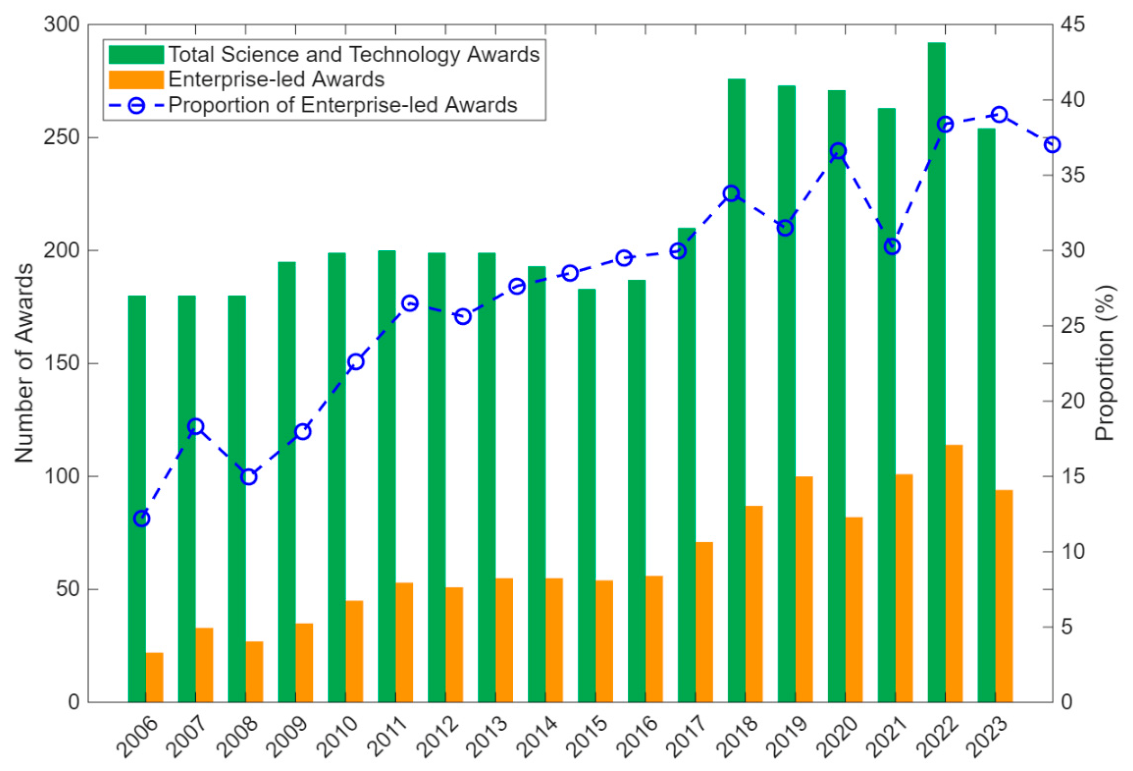
Based on the award-winning projects of the Jiangsu Provincial Science and Technology Award from 2006 to 2023, the development trend of innovation team collaborations led by leading enterprises is illustrated (Figure 3). Overall, both the total number of Science and Technology Awards and the number of innovation team collaboration projects led by leading enterprises show an upward trend, with the proportion of innovation team collaborations led by leading enterprises in the Science and Technology Awards increasing from 12.2% in 2006 to 37.0% in 2023. Furthermore, the evolutionary process of innovation team collaborations led by leading enterprises is divided into four stages: the first stage (2006–2010) is characterized by rapid growth; the second stage (2011–2015) by slow growth; the third stage (2016–2020) by fluctuations between 30% and 35%; and the fourth stage (2021–2023) by stabilization at approximately 38%. On this basis, taking all completing units within the four stages as network nodes, the scientific and technological collaboration relationships among completing units within the same award-winning project as network edges, and the number of collaborations as the weight of edges, the innovation team collaboration network led by leading enterprises in Jiangsu Province is constructed. Using Ucinet 6.0 for network global and individual metrics, MATLAB R2025a for high-order indicators and Python 3.13.6 for visualization, this study investigates the structural features of innovation team collaboration networks dominated by leading enterprises in different phases and the evolution of cross-regional cooperation among innovation agents.
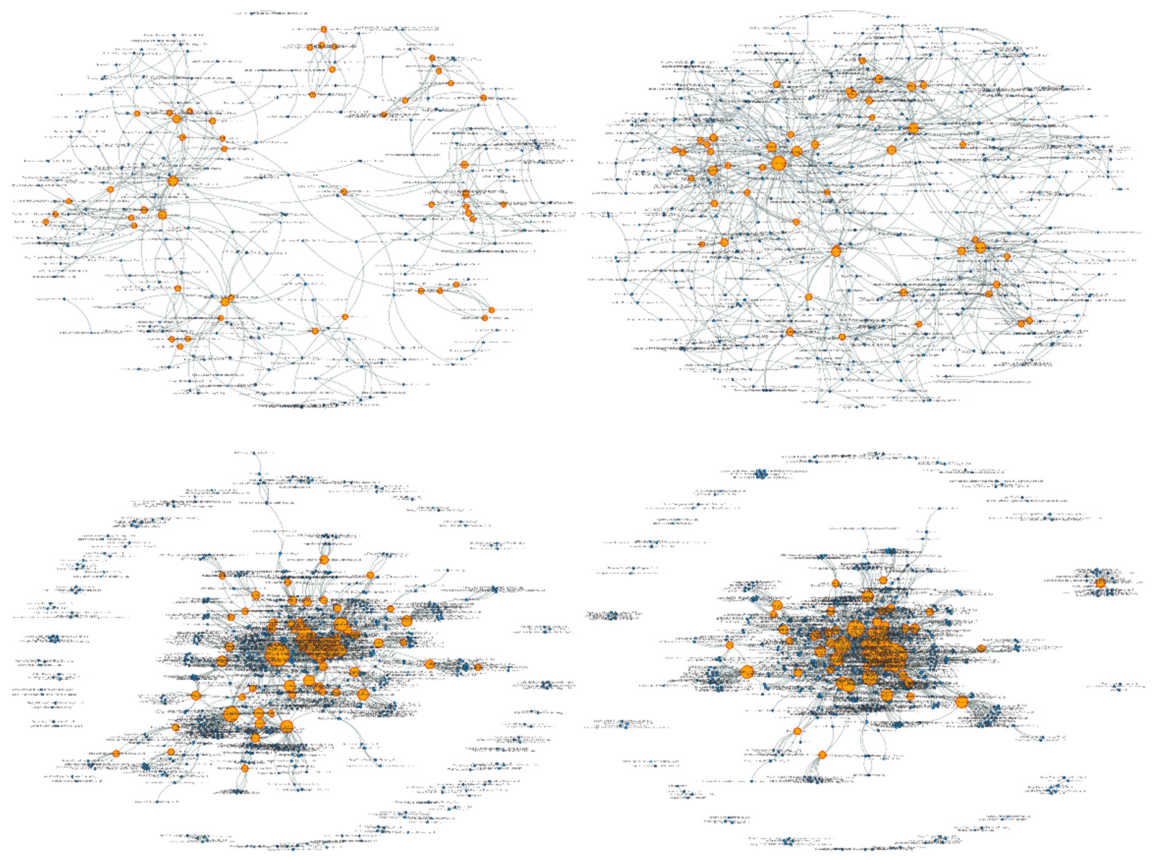
The evolution of the innovation team collaboration network led by leading enterprises in Jiangsu Province across the four stages—2006–2010, 2011–2015, 2016–2020, and 2021–2023—is illustrated in Figure 4. Nodes represent innovation agents, including four types: universities, research institutes, enterprises, and government. The degree centrality of an innovation agent is proportional to the size of its node; the larger the node, the broader its cooperation scope. The edges between nodes symbolize collaborative relationships among innovation agents, and the thickness and shade of the edges reflect the frequency of collaboration—the thicker and darker the edge, the greater the number of collaborations and the more stable the cooperative foundation.
As can be seen from Figure 4, the number of nodes in the innovation network increases continuously, indicating that the number of innovation agents in the innovation team collaboration network led by leading enterprises is steadily growing. Key core nodes such as Southeast University, State Grid Jiangsu Electric Power Co., Ltd., NARI Technology Co., Ltd., Jiangsu University, and Nanjing University of Science and Technology exhibit significant influence from the first stage through the fourth stage. In addition, some nodes, as “emerging forces,” are expanding their influence, such as Jiangsu Electric Power Test Research Institute Co., Ltd., Nanjing University of Aeronautics and Astronautics, and CRRC Qishuyan Locomotive and Rolling Stock Technology Research Institute Co., Ltd. Furthermore, the number of edges in the network increases markedly. From the first stage to the fourth stage, the edges become thicker and darker, indicating increasingly close interactions and more frequent collaborations among innovation agents within the innovation team collaboration network led by leading enterprises. Moreover, the innovation team collaboration network led by leading enterprises evolves from being isolated and dispersed in the first stage to being interconnected and integrated in the second and third stages, with a clear emergence of a core network and a peripheral network by the third stage. Over time, the degree of interconnection within the core network deepens, its radiation scope continues to expand, and the peripheral network transitions from being scattered and small-scale to becoming more concentrated, continuously interacting with the core network through core nodes such as Nanjing University of Aeronautics and Astronautics, Jiangsu Sobute New Materials Co., Ltd., and Changzhou Vocational Institute of Mechatronic Technology.

3.1. Network Low-Order Topological Indicators

3.1.1. Analysis of Overall Network Structural Characteristics

The calculated results of the overall characteristics of the innovation collaboration network across the four stages are shown in Table 1. Based on the results, we can draw the following conclusions:
(1)
Network size and number of edges. Driven by economic development and innovation collaboration policies, the number of participating entities in the innovation team collaboration network led by leading enterprises has continued to rise, increasing from 279 in the first stage to 757 in the third stage, representing a growth rate of 171.33%. Comparing the stages, the growth rate of innovation agents from the first stage to the second stage was 59.14%, while from the second stage to the third stage, the growth rate increased to 70.50%. According to Tianyancha big data, the number of registered enterprises in China showed a steady growth trend during the 13th Five-Year Plan period, with an annual registration growth rate of approximately 14%. By region, Guangdong Province, Jiangsu Province, and Shandong Province ranked among the top three in terms of the number of newly added enterprises. The substantial increase in the number of innovation agents in the innovation collaboration network during the 13th Five-Year Plan period can be partly attributed to the significant increase in the number of newly added enterprises in Jiangsu Province and across the country. Meanwhile, the number of edges in the network also increased significantly, reflecting a notable enhancement in the collaborative capacity among innovation agents. From 311 edges in the first stage to 1652 edges in the third stage, the number of edges in the innovation collaboration network increased by 4.31 times, indicating a rapid increase in collaborative relationships among innovation agents in the network. This trend benefited from the 13th Five-Year Plan for National Science and Technology Innovation, which proposed the coordinated promotion of an efficient and synergistic national innovation system, facilitating the collaboration and interaction among various innovation agents, the smooth flow and efficient allocation of innovation factors, and the strengthening of the principal role and leading function of enterprises in innovation.
(2)
Network density. From 0.0084 in the first stage to 0.0068 in the second stage, network density gradually decreased. A possible reason is that the scale of the innovation collaboration network continued to expand during this period, with a significant increase in the number of nodes. Newly added nodes require time and resources to establish close collaborative relationships with existing nodes, resulting in relatively weak connections between new nodes and other nodes in the network in the initial stage, thereby reducing the overall network density. However, we also observe that the effect of network scale has gradually weakened, as evidenced by the fact that network density decreased by only 0.0003 from 2011–2015 to 2016–2020. Overall, the average network density is approximately 0.0072, indicating that the innovation team collaboration network led by leading enterprises is relatively sparse, and the connections among members in the network are not close. Compared with the upper limit of network density of 0.5 in practice proposed by Mayhew and Levinger in 1976, there remains significant room for improvement in the current innovation collaboration network.
(3)
Clustering coefficient, average path length, and average degree. From the first stage to the third stage, the clustering coefficient increased from 0.7470 to 0.8670, indicating that connections among innovation agents in the network have become tighter and collaborative relationships among enterprises have grown stronger. This may bring both positive effects, such as improved innovation efficiency, facilitated knowledge sharing, and promotion of higher-level innovation outcomes, as well as certain risks, including excessive reliance on specific partners and existing collaboration models, and a tendency toward homogenization in the exchange of information and resources among enterprises. The average path length exhibited an inverted U-shaped trend, first increasing and then decreasing. Except for the second stage, the average path length ranged from 3.469 to 3.880, meaning that in the collaboration network, any two agents typically required no more than three intermediate nodes to establish a connection. Influenced by the expansion of network scale, the influx of a large number of new enterprises, coupled with the fact that connections among them had not yet been fully established, resulted in a longer average path length in the second stage. As the network further developed, connections among innovation agents gradually increased, forming more direct paths, and the exchange of information and sharing of resources among innovation agents became more convenient and efficient, thus shortening the average path length. The average degree consistently increased from 2.2290 in the first stage to 4.9140 in the third stage, indicating a general deepening of collaborative relationships among innovation agents and enhanced network connectivity.
(4)
Degree centralization and betweenness centralization exhibited a U-shaped trend, first decreasing and then increasing. The degree centralization of the network decreased from 0.0239 in the first stage to 0.0133 in the third stage, then increased to 0.0230 in the fourth stage, suggesting that as new innovation agents and collaborations continuously joined the network, the network structure became more complex, and the distribution of degree centralization became more even across the network. The betweenness centralization of the network decreased from 0.0346 in the first stage to 0.2096 in the second stage, then increased to 0.3701 in the third stage, indicating that the innovation network gradually matured, with certain core nodes playing important intermediary roles in the network, controlling the flow of information and the allocation of resources, and the network gradually evolved a core region.

3.1.2. Analysis of Individual Network Characteristics

The calculation results of the individual characteristics of the innovation cooperation network across the four stages are presented in Table 2.
In terms of degree centrality, the highest degree centrality increased from 22 in 2006–2010 to 183 in 2021–2023, expanding more than eightfold. This indicates that the cooperative relationships among innovation entities in the leading enterprise-led innovation team cooperation network have become increasingly close. Among the top ten innovation entities ranked by degree centrality, the proportion of universities and enterprises shifted from 8:2 in 2006–2010 to 7:3 in 2016–2020, with universities consistently accounting for a larger share. This suggests that universities possess extensive cooperation networks and have the fundamental conditions and advantages for engaging in innovation collaboration. Such advantages are reflected not only in abundant resources and technical support, but also in close linkages with governments, enterprises, and other institutions, enabling universities to respond swiftly to market demands and facilitate technology transfer and the application of research outcomes. Furthermore, the academic resources and talent advantages of universities provide a solid foundation for innovation collaboration, allowing them to excel in multidisciplinary partnerships. Consequently, universities represent the entities with the strongest capacity for external cooperation within the cooperation network, playing an indispensable role in promoting economic development and social progress. The proportion of enterprises remained between 20% and 30%, and with the exception of Jiangsu Research Institute of Building Science Co., Ltd., all other enterprises were state-owned enterprises, indicating that enterprises lack sufficient momentum and capacity to drive innovation collaboration. A possible explanation is that enterprises generally have a relatively weak innovation foundation, characterized by a lack of technological accumulation, high-level innovative talent, and a suitable innovation environment. In addition, no research institutes appeared among the top ten innovation entities, suggesting that research institutes occupy a peripheral position in the innovation cooperation network.
In terms of betweenness centrality, the betweenness centrality of the top ten innovation entities increased continuously from 2006–2010 to 2021–2023, with the maximum increase exceeding sevenfold, indicating that the capacity of innovation entities to serve as “bridges” connecting other entities has steadily strengthened. Among the top ten innovation entities, the proportion of enterprises decreased from 50% to 20%. By comparing the rankings of degree centrality and betweenness centrality, it can be observed that some innovation entities with high degree centrality also exhibit high betweenness centrality, such as Southeast University, Nanjing University of Science and Technology, State Grid Jiangsu Electric Power Co., Ltd., and NARI Technology Co., Ltd. Innovation entities with high degree centrality have more direct connections within the network. Given that these entities have established extensive direct connections with other innovation entities in the cooperation network, they are more likely to serve as “intermediaries” within the network, thus attaining high betweenness centrality. Therefore, these innovation entities not only possess the capability to initiate and drive innovation collaboration, but also wield influence in regulating cooperation among other innovation entities, making them the core drivers of the cooperation network.
From the perspective of core–periphery analysis (Table 3), stable and persistent innovation entities constitute important nodes in the innovation cooperation network. They offer multiple advantages, including accelerating the integration of technology and knowledge, enhancing communication efficiency, deepening the extent of integration, and promoting the development of the innovation cooperation network, thereby injecting strong momentum into the evolution of the overall innovation cooperation network. The proportion of persistent innovation entities increased from 16.44% in 2011–2015 to 23.47% in 2021–2023. From 2006 to 2023, there were a total of 40 persistent innovation entities in Jiangsu Province, comprising 15 enterprises and 25 universities. The number of persistent core innovation entities increased from 3 in 2011–2015 to 16 in 2021–2023.

3.2. Higher-Order Topological Indicators of the Network

3.2.1. Higher-Order Clustering Coefficient

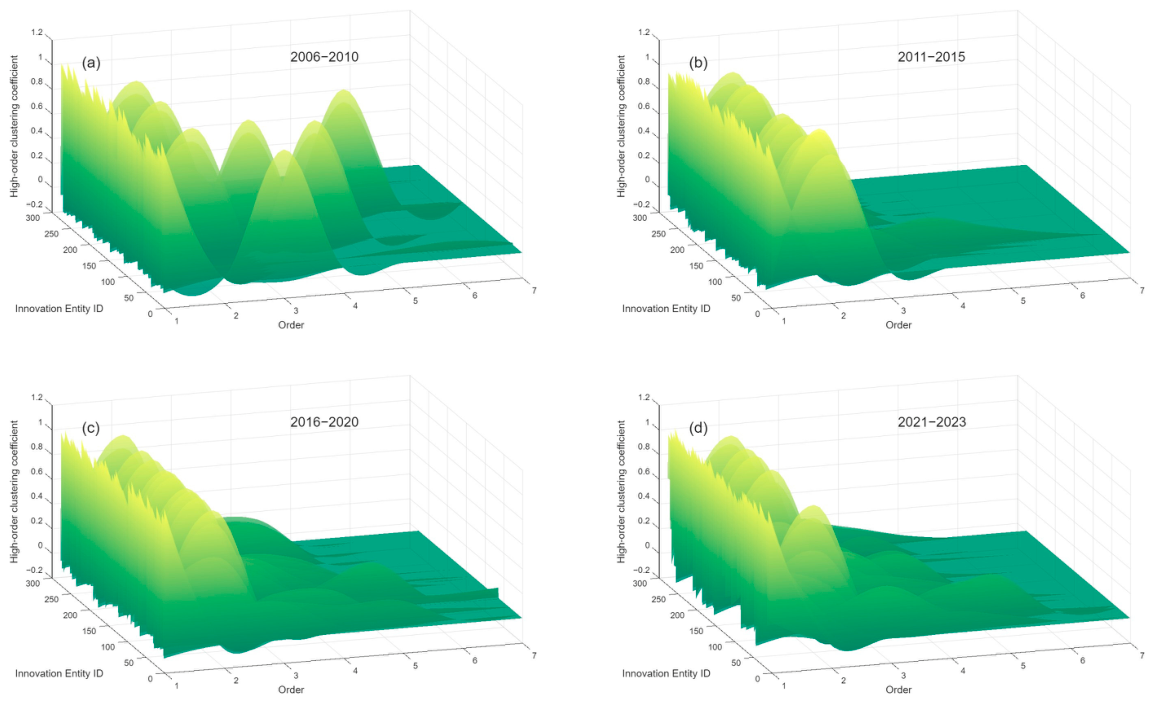
The higher-order clustering coefficient measures the degree of clustering among the neighbors of a node. Unlike the traditional clustering coefficient, the higher-order clustering coefficient takes into account higher-order subgraphs, capturing more complex patterns of connections between nodes. Figure 5 illustrates the higher-order clustering coefficients of innovation entities in the leading enterprise-led innovation team cooperation network in Jiangsu Province from 2006 to 2023. It can be observed that higher-order clustering coefficients are generally rare. From 2006 to 2010, the highest order of non-zero clustering coefficient in the leading enterprise-led innovation team cooperation network in Jiangsu Province was order 7, which involved only one innovation entity (Southeast University), and the proportion of innovation entities with a non-zero clustering coefficient of order 3 or above was only 2.89%. From 2011 to 2015, the highest order of non-zero clustering coefficient in the innovation cooperation network was order 6, involving four innovation entities (Hohai University, China University of Mining and Technology, Tongji University, and Nantong University). From 2016 to 2020, the highest order of non-zero clustering coefficient was order 9, involving one innovation entity (Southeast University). From 2021 to 2023, the highest order of non-zero clustering coefficient was order 7, involving two innovation entities (Soochow University and Southeast University). The proportion of innovation entities with a clustering coefficient of order greater than 2 in the innovation cooperation network was 4.32% from 2011 to 2015, 10.70% from 2016 to 2020, and 13.23% from 2021 to 2023. This indicates that in the leading enterprise-led innovation cooperation network, the majority of nodes exhibit low clustering, and the network is not highly clustered but rather relatively sparse. However, over time, the proportion of nodes with higher-order clustering coefficients has gradually increased, which can be attributed to the growing breadth and depth of collaboration among innovation entities. Secondly, lower-order clustering coefficients are prevalent. In the second, third, and fourth stages, the proportion of nodes for which the highest order of non-zero clustering coefficient is order 1 exceeded 40% in each stage, indicating that most nodes in the network are primarily connected through first-order connections. That is, most innovation entities have formed relatively close cooperative relationships with their direct neighbors, while no connections exist among the neighboring nodes themselves, and there is a lack of higher-order cooperative connection paths among innovation entities. These nodes play a relatively peripheral role in the network, serving as connectors only within specific small groups, and the flow of information among such nodes is relatively limited. Finally, there exist nodes whose neighbors are isolated from one another. The proportion of nodes with no paths among their neighbors decreased from 56.32% in the first stage to 41.59% in the second stage, 21.14% in the third stage, and 10.95% in the fourth stage. This indicates that in the initial stage of the leading enterprise-led innovation team cooperation network in Jiangsu Province, more than half of the nodes had no paths among their neighbors, and a considerable number of innovation entities in the network were either isolated from one another or formed small-group structures, lacking connections among themselves, which consequently led to poor overall network connectivity. By the third and fourth stages, the proportion of nodes with no paths among their neighbors decreased significantly, suggesting that innovation entities in the network began to connect more closely, forming more bridges and paths that enabled more efficient flows of information and resources within the network, thereby enhancing network connectivity.

3.2.2. Higher-Order Distance Distribution

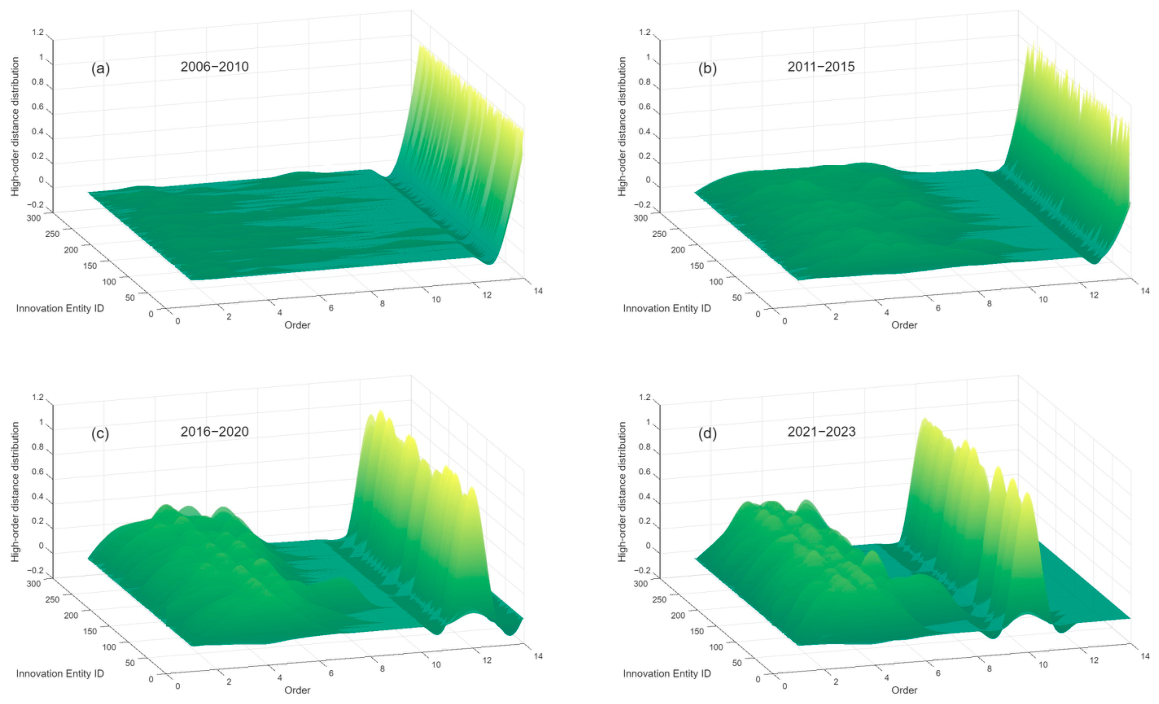
Compared with simple direct connection distances, higher-order distances in a network involve more complex relationships between nodes, potentially incorporating multiple intermediate nodes or longer paths. In social networks, higher-order distances can reveal more concealed or long-range associations among nodes. Figure 6 presents the distance distribution of innovation entities in the leading enterprise-led innovation team cooperation network in Jiangsu Province from 2006 to 2023. It can be observed that the highest-order distances in the four stages are 14, 14, 12, and 10, respectively, all of which exceed the network diameters. This indicates the presence of numerous long paths in the leading enterprise-led innovation team cooperation network in Jiangsu Province, reflecting the sparsity of the network and the weak connections among nodes. Secondly, distances between nodes have gradually shortened. According to the calculation results, over time, the proportion of nodes within a distance not exceeding 6 from a given node in the leading enterprise-led innovation team cooperation network in Jiangsu Province has slowly increased. Specifically, from 2006 to 2010, a total of 35 nodes (accounting for 12.64% of the nodes in the network) had a proportion of nodes within a distance not exceeding 6 exceeding 20%. From 2011 to 2015, this number increased to 254 nodes, accounting for 57.73% of the network. From 2016 to 2020, 81.90% of the nodes exhibited a distance distribution of order not exceeding 6 greater than 0.2. From 2020 to 2023, this proportion rose to 84.92%. This indicates that cooperative relationships among innovation entities in the leading enterprise-led innovation team cooperation network in Jiangsu Province have become increasingly close, and a growing number of nodes are able to maintain connections with other nodes within shorter distances, accelerating the dissemination of information and resources and thereby promoting innovation collaboration. It can also be observed that in the first stage, Southeast University had the lest weighted sum of distances, followed by Yancheng Power Supply Branch of State Grid Jiangsu Electric Power Co., Ltd., Jiangsu University of Science and Technology, and Jiangsu Yueda Special Vehicle Co., Ltd., indicating that these innovation entities have relatively short average distances to other nodes and occupy central positions within the network. In the second stage, the top five innovation entities with the shortest average distances were Southeast University, Nantong University, Jiangsu Zhongnan Construction Industry Group Co., Ltd., Yancheng Institute of Technology, and Funing Aoyang Technology Co., Ltd. (with Jiangsu Haomai Lighting Technology Co., Ltd. and Jiangsu Jinfeng Wind Power Technology Co., Ltd. tied for fifth). In the third stage, the top five were Southeast University, Nanjing University of Science and Technology, Jiangsu Keneng Electric Power Engineering Consulting Co., Ltd., Nanjing Qianzhi Electric Technology Co., Ltd., and COSCO Shipping Shipyard (Nantong) Co., Ltd. In the fourth stage, the top five were Southeast University, Nanjing Institute of Technology, Changzhou Vocational Institute of Mechatronic Technology, Beijing Jike Guochuang Lightweight Science Research Institute Co., Ltd., and Nanjing University of Aeronautics and Astronautics. It is evident that Southeast University has consistently maintained the shortest average distance to other nodes, continuously occupying a central position within the network. Additionally, some of these nodes rank among the top ten in both degree centrality and betweenness centrality (Table 2), such as Southeast University, Nantong University, Yancheng Institute of Technology, Nanjing University of Science and Technology, Nanjing Institute of Technology, Changzhou Vocational Institute of Mechatronic Technology, and Nanjing University of Aeronautics and Astronautics, indicating that these innovation entities occupy important positions within the network, possessing not only numerous direct cooperative partners but also strong connectivity and centrality. Furthermore, attention should also be paid to other innovation entities with relatively short average distances, such as Yancheng Power Supply Branch of State Grid Jiangsu Electric Power Co., Ltd., Jiangsu University of Science and Technology, Jiangsu Yueda Special Vehicle Co., Ltd., Jiangsu Zhongnan Construction Industry Group Co., Ltd., Jiangsu Keneng Electric Power Engineering Consulting Co., Ltd., Nanjing Qianzhi Electric Technology Co., Ltd., COSCO Shipping Shipyard (Nantong) Co., Ltd., and Beijing Jike Guochuang Lightweight Science Research Institute Co., Ltd. These innovation entities are able to connect to other nodes in the network through relatively short paths, thereby enhancing the overall information flow and cooperation capacity of the network. They serve as important hubs for information dissemination and can also bring new vitality to innovation collaboration.

3.3. Spatiotemporal Evolution Characteristics of the Leading Enterprise-Led Innovation Team Collaboration Network

Table 4 presents the regional collaboration of innovation entities within the leading enterprise-led innovation team collaboration network. During the periods of 2006–2010 and 2011–2015, innovation entities in the leading enterprise-led innovation team collaboration network were primarily located within Jiangsu Province. From 2016 to 2020, approximately half of the innovation entities originated from within Jiangsu Province, while the other half came from outside the province. By 2021–2023, 46.58% of innovation entities were from Jiangsu Province, with the majority originating from outside the province. The reasons for this are as follows. First, Jiangsu Province ranks first in China with approximately 172 universities, demonstrating significant achievements in promoting industry–university–research collaboration. Numerous universities and research institutes within the province have established long-term cooperative relationships with enterprises, jointly conducting research projects and technological innovation. Second, Jiangsu Province exhibits a clear trend toward industrial clustering, particularly in the southern Jiangsu region, where multiple globally influential industrial clusters and innovation centers have formed. Enterprises within these industrial clusters and innovation centers have established close cooperative relationships and innovation networks, facilitating the sharing and exchange of knowledge and technology. Finally, the Jiangsu provincial government has consistently prioritized scientific and technological innovation and has introduced a series of policies and measures to support innovation development among enterprises within the province. For example, the 12th Five-Year Plan outlined the construction of a regional innovation system, the development of innovative science and technology parks, and the creation of a favorable environment for technological innovation, with goals such as increasing R&D expenditure as a proportion of regional GDP to 2.5% and raising the contribution rate of scientific and technological progress to over 60%. Given such an innovation environment, geographical advantages, and policy support, innovation entities in Jiangsu Province during 2006–2010 and 2011–2015 were predominantly from within the province. Since 2016, the leading enterprise-led innovation team collaboration in Jiangsu Province began transitioning toward a focus on collaboration with innovation entities outside the province. This shift is attributable to the implementation of national strategies proposed in the 13th Five-Year Plan, such as the development of globally influential science and technology innovation centers in Beijing and Shanghai, the coordinated development of the Yangtze River Economic Belt, and the Belt and Road Initiative, all of which require strengthened innovation cooperation and exchange between regions. Concurrently, with the deepening of globalization and rapid technological advancement, innovation team collaboration in Jiangsu Province also requires new perspectives and novel ideas to stimulate inspiration.
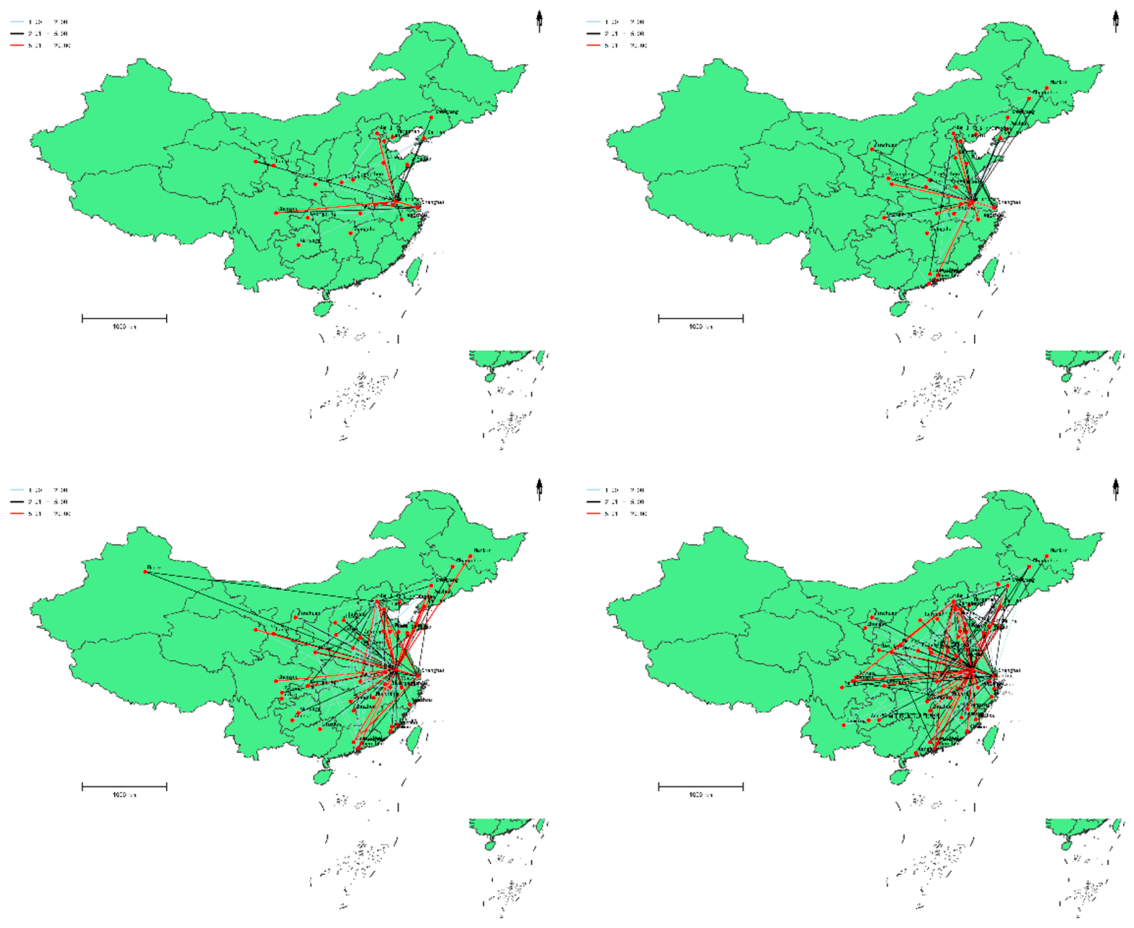
To further explore the cities to which innovation entities outside Jiangsu Province belong, a spatial distribution map of the collaboration network was constructed (Figure 7). First, as shown in the figure, the number of cities to which innovation entities belong has increased significantly, expanding from 23 cities in the first stage to 46 in the third stage and 55 in the fourth stage, more than doubling. Second, collaboration between cities has become increasingly frequent. On one hand, the figure shows a marked increase in connections between cities from the first to the fourth stage, reflected not only in the increased connections between Jiangsu and the cities to which other innovation entities belong, but also in the increasingly close exchange and collaboration between cities outside Jiangsu Province. This is attributable to the combined effects of Jiangsu’s open innovation ecosystem, enterprises’ innovation demands, policy guidance and support, convenient transportation and communication, and the synergy of industrial and supply chains. On the other hand, the density of collaboration between core cities has significantly increased. Figure 6 shows that in the first stage, there were three pairs of cities with at least five collaborative relationships: Jiangsu with Beijing, Jiangsu with Shanghai, and Jiangsu with Chengdu. By the third stage, the number of city pairs with at least five collaborative relationships had reached 24, adding collaborations between Jiangsu and cities such as Xi’an, Wuhan, Hangzhou, Shenzhen, and Tianjin, as well as collaborations between Beijing and Shanghai, and Beijing and Hangzhou, among others, based on the first stage. Moreover, the interconnections among existing core cities have steadily strengthened. For example, the collaboration intensity between Jiangsu and Beijing increased from 38 in the first stage to 198 in the third stage, a more than fourfold increase, while that between Jiangsu and Shanghai increased from 26 to 121, a more than threefold increase. Third, in terms of distances between cities, the leading enterprise-led innovation team collaboration network underwent a process of gradual expansion followed by gradual contraction. In the first stage, collaborating cities were primarily concentrated in four regions: the Northern Coastal region (Beijing, Tianjin, Hebei, Shandong), the Eastern Coastal region (Shanghai, Jiangsu, Zhejiang), the Middle Reaches of the Yellow River (Shaanxi, Shanxi, Henan, Inner Mongolia), and the Southwest region (Guizhou, Sichuan, Chongqing, Guangxi, Yunnan). With the continuous advancement and deepening of regional coordinated development policies, four additional economic regions were added in the second and third stages: the Northeast region (Liaoning, Jilin, Heilongjiang), the Southern Coastal region (Fujian, Guangdong, Hainan), the Middle Reaches of the Yangtze River (Hubei, Hunan, Jiangxi, Anhui), and the Greater Northwest region (Gansu, Qinghai, Ningxia, Xinjiang), with innovation entities’ cities gradually spreading across the country. By the fourth stage, the scope of the collaboration network had contracted, forming an innovation collaboration network architecture with Jiangsu as the core and the Northern Coastal, Eastern Coastal, Southern Coastal, Middle Reaches of the Yangtze River, and Middle Reaches of the Yellow River regions as the main supporting bases. This evolutionary process reveals a pattern: generally, geographical proximity facilitates the convenience and frequency of innovation collaboration, resulting in particularly close cooperation between Jiangsu and cities in the Northern Coastal, Eastern Coastal, Middle Reaches of the Yangtze River, and Middle Reaches of the Yellow River regions. Conversely, for more distant regions, such as Gansu, Qinghai, and Xinjiang, the opportunities for innovation collaboration may be relatively reduced due to increased collaboration costs and obstacles arising from distance. Finally, it can be observed that among the cities outside Jiangsu Province involved in innovation collaboration across the four stages, Beijing and Shanghai consistently maintained dominant positions. This is because Beijing and Shanghai are regions with strong innovation capabilities in China, having consistently ranked among the top three for many years in the China Regional Science and Technology Innovation Evaluation Report published by the Chinese Academy of Science and Technology for Development. Beijing and Shanghai possess numerous universities, abundant scientific and technological resources, and human resources, which contribute to strong knowledge creation capabilities and drive the enhancement of innovation capacity in Jiangsu Province. Additionally, this is inseparable from the support of national policies. For instance, the 13th Five-Year National Science and Technology Innovation Plan issued by the State Council explicitly supports the construction of globally influential science and technology innovation centers in Beijing and Shanghai and promotes the innovation development of national independent innovation demonstration zones and high-tech zones. In response to this call, the foundation for innovation collaboration between Jiangsu Province and these two cities has become more solid.
Table 5 presents the top five regional centralities of innovation entities in the leading enterprise-led innovation team collaboration network in Jiangsu Province. First, excluding the influence of Jiangsu Province itself, Beijing and Shanghai occupy an indisputable leading position in the leading enterprise-led innovation team collaboration network in Jiangsu Province. Across the three key indicators of network importance—degree centrality, betweenness centrality, closeness centrality, and the sum of centralities—Beijing and Shanghai consistently ranked among the top three in all four stages. This finding indicates that Beijing and Shanghai exhibit a strong capacity to establish collaborative relationships, disseminate information, and control information flows, enabling them to effectively lead innovation and R&D activities in other regions within the collaboration network, wielding unparalleled influence. Second, the importance of Wuhan and Hangzhou in the collaboration network has become increasingly prominent. From 2011 to 2015, Hangzhou and Wuhan ranked among the top five in degree centrality. By 2016–2020, their sums of centralities ranked third and fourth, respectively, highlighting that Wuhan and Hangzhou, as key cities in Central China and the Yangtze River Delta region, respectively, each assume the role of driving technological innovation and radiating influence. These two cities demonstrate high innovation activity, actively engaging in innovation collaboration with other regions and committing to promoting scientific and technological progress in their own cities and surrounding areas. In this process, they have gradually developed strong resource allocation capabilities, enabling them to respond and adapt swiftly to changes within the network, and have come to play the roles of “leaders” and “bridges.” Third, Xi’an, Shenzhen, and Qingdao hold relatively significant influence in the leading enterprise-led innovation team collaboration network in Jiangsu Province. Specifically, from 2011 to 2015, Xi’an and Shenzhen ranked fifth in degree centrality, and by 2021–2023, their closeness centrality also rose to fifth, reflecting their strong capacity to establish collaborations and disseminate information, although their ability to allocate network resources remains somewhat lacking. Fourth, within the innovation collaboration network, Zhengzhou, Shenyang, and Chongqing have demonstrated a certain degree of influence, but this influence is gradually diminishing. From 2011 to 2015, Zhengzhou and Shenyang ranked among the top four in betweenness centrality and sum of centralities, indicating that they served as key nodes for information flow within the network, playing important bridging roles by connecting different network entities. Chongqing ranked highly in degree centrality, closeness centrality, and betweenness centrality from 2011 to 2015, indicating its strong comprehensive capabilities and its status as an indispensable key city within the network. From 2016 to 2020, Zhengzhou ranked fifth in closeness centrality (tied), suggesting that it still maintained a strong capacity for control within the network. However, by 2021–2023, Zhengzhou and Shenyang had fallen out of the top ten in closeness centrality, betweenness centrality, or sum of centralities, while Chongqing also experienced a significant decline across the three centrality indicators, with its sum of centralities dropping to 30th.

4. Impact of the Leading Enterprise-Led Innovation Team Collaboration Network on Sustainable Development

4.1. Data Description and Model Specification

In this section, we adopt the provincial sustainable development performance scores of Jiangsu Province from 2010 to 2021 calculated in Reference [45] as the dependent variable. Eight variables relevant to sustainable development are selected to construct a multiple regression model for empirical analysis. The selected variables include average network degree (Degree), average path length (Path), number of network edges (Edge), permanent resident population (P, unit: ten thousand people), foreign direct investment (FDI, unit: 100 million yuan), energy consumption structure (ES), industrial structure advancement (IU), and environmental regulation intensity (ER). The raw observational data of all variables are presented in Table 6.
Descriptive statistics of selected variables are displayed in Table 7. According to the descriptive results of raw variables, the sustainable development performance score (SD) ranged steadily from 58.62 to 67.87 during 2010–2021, with a mean value of 63.7052 and mild annual fluctuations, presenting a stable upward trend year by year. Topological indicators of the network show obvious differentiation characteristics: the number of network edges (Edge) has the largest standard deviation and value span, indicating that the regional collaborative network expanded rapidly with prominent annual discrepancies. The continuous rise in average network degree (Degree) reflects the growing density of node connections year by year, while the average path length (Path) fluctuates slightly, meaning the circulation and connectivity efficiency of network elements remained stable in the long run. In terms of control variables, permanent resident population (P) and energy consumption structure (ES) changed moderately each year. Industrial structure advancement (IU) grew steadily, whereas environmental regulation intensity (ER) declined continuously, both showing distinct monotonic time trends.
To unify dimensional units and mitigate heteroskedasticity, logarithmic transformation is applied to the sustainable development score, average network degree, average path length, number of network edges, permanent resident population and foreign direct investment volume. All logarithmic independent variables ( l n D e g r e e , l n P a t h , l n E d g e , l n P , l n F D I ) together with untransformed ES, IU and ER are incorporated into the initial model for VIF multicollinearity test. Results show that the VIF of l n F D I equals 8.72 (below the critical value of 10), indicating no severe multicollinearity; however, the VIF values of all other independent variables far exceed 10. Among them, l n D e g r e e (151.27), l n E d g e (113.52), ES (91.75) and IU (92.13) exhibit the most severe multicollinearity.
We adopt backward stepwise regression with constraints that four core variables ( l n P a t h , l n E d g e , l n P , IU) must be retained. Variables with insignificant coefficients are eliminated sequentially from the largest to smallest p-values, namely l n D e g r e e , l n F D I and ES. The final regression model retains l n P a t h , l n E d g e , l n P , IU and ER. Under this optimized specification, the VIF of all independent variables falls below 10: l n P a t h (4.87), l n E d g e (6.32), l n P (5.19), IU (7.04), ER (3.61), which effectively alleviates multicollinearity. Estimation results of the optimized multiple linear regression model are reported in Table 8.
Regression results demonstrate that the p-value corresponding to the F-statistic equals 0.0003, meaning the overall model is statistically significant at the 1% level. The adjusted R2 reaches 0.907, implying the five selected independent variables can explain 90.7% of the time-series fluctuations in regional sustainable development performance. The Durbin–Watson statistic stands at 2.17, close to 2, which rules out first-order serial autocorrelation. The Jarque–Bera normality test yields a p-value of 0.624 (greater than 0.05), verifying that residuals follow a normal distribution. The model fully satisfies core assumptions of classical linear regression, ensuring stable and reliable parameter estimates. Regression coefficients of core network topological variables align with theoretical expectations: the coefficient of l n E d g e (number of network edges) is 0.1367 and significantly positive at the 1% level; the coefficient of l n P a t h (average path length) is −0.7425 and significantly negative at the 10% level. This directly confirms that network expansion empowers regional sustainable development, while extended transmission paths of network elements generate inhibitory effects. Regarding control variables, permanent resident population and industrial structure advancement both exert significantly positive impacts on sustainable development performance at the 5% level, whereas environmental regulation intensity shows a significantly negative effect at the 10% level. All variables pass significance tests.
The multiple linear regression model constructed based on time-series data of Jiangsu Province from 2010 to 2021 achieves excellent overall fitting with no obvious misspecification, enabling systematic interpretation of the mechanism through which topological structures of leading-enterprise-led innovation cooperation networks shape regional sustainable development performance. First, the proxy variable for network scale ( l n E d g e ) carries a highly significant positive coefficient of 0.1367 at the 1% level. Ceteris paribus, every 1% increase in total regional innovation cooperation ties drives a 0.1367% rise in sustainable development performance. Over the sample period, network edges expanded from 228 to 1080, indicating continuous expansion of industry–university–research and cross-firm innovation collaboration networks initiated by leading enterprises. Diversified cooperative connections smooth the flow of innovative factors, accelerate cross-agent spillover of green technologies, deepen joint research via industry–university–research synergy, and optimize the allocation efficiency of provincial innovative resources—serving as the core structural driver of steady improvements in regional sustainable development. Second, the coefficient of network connectivity efficiency ( l n P a t h ) is significantly negative: each 1% rise in transmission distance for innovative factors and technical information reduces regional sustainable development performance by 0.7425%. Average path length represents the circulation cost of network information; longer paths incur higher transaction costs and information asymmetry in diffusing green technologies and innovative achievements from leading enterprises to micro, small and medium-sized enterprises (MSMEs) along industrial chains and across cities within the province, hindering coordinated implementation of sustainable regional resources. During the sample period, the mild decline in average path length continuously cut circulation losses of production factors and further released dividends of sustainable development. For control variables, the expansion of permanent resident population agglomerates human capital and expands local consumer markets, providing talent and domestic demand support for green innovation. Industrial structure advancement raises the proportion of low-pollution, high-value-added industries and directly upgrades regional development quality from the industrial perspective. In contrast, stringent short-term environmental regulations raise corporate pollution compliance costs, crowd out investment in corporate green innovation, and impose constraints on current-period sustainable development performance.

4.2. Analysis of Transmission Mechanisms Through Which Enterprise-Led Innovation Cooperation Networks Affect Regional Sustainable Development

Drawing on time-series regression results for Jiangsu Province (2010–2021), integrated with social network theory, transaction cost theory and industrial synergy theory, this section hierarchically unpacks multiple transmission channels through which innovation networks of leading enterprises act on regional sustainable development, and distinguishes differentiated impact channels of distinct network topological characteristics. Meanwhile, population, industrial structure and environmental regulation are incorporated to identify boundary-moderating effects in transmission processes.
(1)
Network Scale Expansion: Positive Empowerment Transmission Path via Multi-Agent Collaborative Agglomeration
Regression results show l n E d g e   carries a significantly positive coefficient of 0.1367 at the 1% level, meaning every 1% growth in innovation cooperation ties lifts regional sustainable development performance by 0.1367%. This positive effect operates through three collaborative agglomeration channels: ① Agglomeration channel of green innovation factors: By expanding cooperative ties with universities, research institutes and upstream/downstream supporting firms, leading enterprises break single-agent constraints on R&D resources. Expanding network edges facilitate free flow and integration of low-carbon technologies, R&D talent and green capital within the network, supporting joint research on sustainable technologies including clean production, circular economy and energy conservation & emission reduction, and consolidating the foundational basis of regional green innovation. ② Green spillover channel of industrial chains: Diversified cooperative relationships unlock vertical industrial chain collaboration. Mature low-carbon production techniques and green management standards of leading enterprises diffuse to supporting MSMEs via cooperative ties, driving transformation and upgrading of high-energy-consuming low-end production capacity and reducing overall industrial pollution emission intensity. ③ Cross-agent collaborative governance channel: Growth in multi-party cooperation (enterprise–enterprise, enterprise–university, enterprise–government) facilitates construction of regional joint platforms for environmental innovation, shared pollution treatment facilities and co-built green transition projects. Such ties allocate regional environmental governance costs and balance dual targets of economic growth and ecological protection simultaneously. From 2010 to 2021, network edges of leading-enterprise-led innovation networks in Jiangsu surged from 228 to 1080. Sustained operation of the three collaborative channels formed the core structural engine lifting regional sustainable development performance.
(2)
Improved Network Connectivity Efficiency: Efficiency-Enhancing Transmission Path via Reduced Circulation Losses
The coefficient of l n P a t h equals −0.7425 and is significantly negative at the 10% statistical level, indicating that longer transmission distances for network elements suppress sustainable development performance. Average path length generates inhibitory effects through three loss channels of information, transaction and risk. ① Information asymmetry loss channel: Longer average paths require multi-layer node transit for green technologies and sustainable management experience, leading to severe information distortion and delay. MSMEs struggle to rapidly absorb advanced low-carbon technologies from leading enterprises, slowing the overall pace of regional green transition. ② Collaboration transaction cost channel: Extended transit chains raise communication and supervision costs for innovation negotiation, project docking and achievement commercialization, crowding out corporate funds allocated to long-term green R&D and sustainable transformation. ③ Innovation risk-sharing channel: Indirect connections dominate networks with long paths, hindering rapid dispersion of green innovation investment and low-carbon transition risks across the network and suppressing corporate willingness to fund green R&D. During the sample period, the steady mild decline in average path length of Jiangsu’s innovation networks shortened transit distances of production factors, cut various circulation losses and continuously unlocked sustainable development dividends brought by improved network connectivity efficiency.
(3)
Boundary Moderating Effects in Transmission Processes
Three external conditions—permanent resident population, industrial structure advancement and environmental regulation—exert different moderating constraints on the two core transmission paths outlined above. ① Permanent resident population ( l n P ) shows a significantly positive coefficient of 0.4182 at the 5% level. Population expansion agglomerates regional human capital, expands supply of R&D talent within innovation networks, accelerates R&D, absorption and transformation of green technologies, and positively strengthens the empowering effects of network-scale expansion and path shortening on sustainable development. ② Industrial structure advancement (IU) carries a significantly positive coefficient of 0.3719 at the 5% level. Higher industrial advancement elevates the share of high-end manufacturing and productive services, strengthens industrial capacity to absorb and digest green technologies, expands application scenarios for technology spillover from innovation networks, and amplifies positive effects of optimized network structures. ③ Environmental regulation (ER) has a significantly negative coefficient of −21.4736 at the 10% level. Rigorous current environmental regulations drastically increase corporate pollution treatment compliance costs, crowd out capital for cross-agent innovation cooperation and green technology R&D, weaken transmission effects of collaborative agglomeration and cost reduction in innovation networks, and constrain regional sustainable development performance in the short run.
(4)
Comprehensive Logical Summary of Transmission Mechanisms
Overall, innovation cooperation networks led by Jiangsu’s leading enterprises form an integrated internal functional system featuring “dual main transmission paths and multi-variable moderation”. On one hand, expanded network edges realize collaborative agglomeration of multi-agent resources, industries and governance, directly boosting sustainable development levels. On the other hand, shortened average path lengths reduce losses of information, transaction and innovation risks and release dividends of network connectivity efficiency. These two transmission paths constitute core internal channels through which network topological structures affect sustainable development. Meanwhile, regional population scale and industrial advancement positively amplify the favorable effects of optimized network structures, while stringent environmental regulations temporarily weaken the empowering role of innovation networks. This complete transmission logic perfectly matches empirical regression results: significantly positive network edges, significantly negative average path length, and differentiated significance of the three control variables. It provides theoretical and empirical support for subsequent optimization of innovation network structures and promotion of coordinated regional sustainable development.

5. Conclusions and Discussion

5.1. Conclusions

This paper takes award-winning projects of the Jiangsu Provincial Science and Technology Progress Award (2006–2023) as the data source to construct cross-agent innovation cooperation networks led by leading enterprises. Low-order and high-order dual topological indicators are combined to characterize phased network evolution, and core innovative network agents are identified from spatial and organizational perspectives. A multiple linear regression model is further established to test impacts of innovation network topological structures on regional sustainable development performance and their underlying transmission mechanisms. The main research conclusions are summarized as follows.
(1) Network evolution characteristics based on low-order topological indicators
Phased observations reveal continuous growth in network scale, number of cooperative edges, average clustering coefficient and average degree, alongside steady expansion of overall network scale, deepening cooperative ties among innovative agents and improving network connectivity. Among the top ten nodes ranked by degree centrality, universities consistently account for over 70%, boasting abundant cooperative resources and collaborative advantages. Enterprises account for a stable 20–30%, all state-owned enterprises except Jiangsu Provincial Academy of Building Research Co., Ltd., indicating insufficiently unleashed motivation and potential for private enterprises to initiate innovation collaboration. Entities including Southeast University, Nanjing University of Science and Technology and State Grid Jiangsu Electric Power Co., Ltd. simultaneously hold high degree centrality and betweenness centrality, acting as both initiators of innovation cooperation and key hubs for network resource allocation, and constituting core nodes driving regional collaborative innovation.
(2) Local structural characteristics based on high-order topological indicators
High-order clustering coefficients remain scarce across all network phases. The share of nodes with non-zero clustering coefficients of order 3 or above stands at 2.89%, 4.32%, 10.70% and 13.23% sequentially, demonstrating low local agglomeration and relatively sparse overall network structures. Low-order direct ties prevail, with over 40% of nodes in each phase maintaining close cooperation only with direct neighbors without inter-neighbor linkages. Nevertheless, isolated node ratios declined significantly over time, with multi-party cooperative bridges and connected paths gradually forming within networks to continuously improve circulation efficiency of innovative factors and technical information. Results of high-order distance distribution show gradual year-on-year growth in the share of nodes with order ≤ 6, signifying shrinking cooperation distances between innovative agents. Nodes including Southeast University, Nantong University, Yancheng Institute of Technology and Nanjing University of Science and Technology combine high centrality with short high-order distances, functioning as core carriers of internal information transmission within networks.
(3) Spatiotemporal evolution laws of innovation cooperation networks
The share of local Jiangsu innovative agents dropped from 61.74% in Phase 1 to 46.58% in Phase 4 during the sample period. Innovation cooperation initiated by leading enterprises gradually shifted from intra-provincial collaboration to cross-provincial coordination with external agents, forming a nationwide innovation network centered on Jiangsu supported by external collaborative hubs including northern coastal, eastern coastal, southern coastal, middle Yangtze River and middle Yellow River urban agglomerations. Spatially, the number of cities participating in innovation cooperation kept rising, alongside remarkable growth in inter-city cooperation frequency and cooperation density of core cities. Excluding local Jiangsu entities, Beijing and Shanghai consistently rank top three in degree centrality, betweenness centrality, closeness centrality and comprehensive centrality across the four phases, emerging as the most critical external cooperation hubs for Jiangsu’s innovation networks. Wuhan and Hangzhou entered the top five in centrality rankings starting from Phase 2 with steadily rising network influence. Zhengzhou, Shenyang and Chongqing possess certain collaborative value yet experience gradual attenuation of network importance over time.
(4) Effects of innovation networks on regional sustainable development
Average path length and number of cooperative edges constitute two core structural factors shaping Jiangsu’s sustainable development performance. Average path length exerts a significant negative impact on sustainable development: shorter transmission distances between internal innovative agents accelerate diffusion efficiency of green technologies and innovative resources, thereby facilitating regional sustainable development. The number of network edges delivers significant positive empowering effects: growth in cooperative ties implies more frequent cross-agent collaborative innovation and continuously lifts regional sustainable development levels.

5.2. Discussion

A review of domestic and international literature shows existing studies mostly analyze correlations between innovation networks and sustainable development based on patent data with cities as macro research units. Research set against Western market-oriented contexts emphasizes emission reduction effects of spontaneous corporate collaboration networks, while EU cross-border innovation alliances highlight cross-regional technology spillovers driven by unified green policies. However, few studies focus on China’s distinctive innovation scenario featuring enterprise-led initiatives and moderate government regulation. Most prior literature solely relies on low-order network indicators, neglecting the core role of leading enterprises and deep complex network structures. This paper identifies enterprise-dominated innovation ties using provincial science and technology award data, introduces high-order topological indicators to characterize network evolution, and systematically unpacks multi-layer transmission channels through which network scale and connectivity efficiency affect regional sustainable development. It supplements micro-agent research perspectives on domestic innovation networks and provides differentiated empirical support for green collaborative innovation in developing countries. Theoretically, this study improves a dual-layer quantitative analysis framework combining low-order and high-order network indicators, and constructs a complete logical chain linking network structures, transmission channels and regional sustainable development.
Nevertheless, this research has inherent limitations. It adopts only a single dataset of provincial science and technology awards without integrating multi-source information such as patents and R&D contracts. Edge weights fail to distinguish technical value of individual projects, and the regression model lacks heterogeneity tests subdivided by prefecture-level cities and industries as well as instrumental variable processing for endogeneity. Agent classification also omits refined segmentation of private enterprises, specialized, sophisticated, unique and innovative (SSUI) enterprises and local colleges, limiting the generalizability of conclusions. Future research may integrate multi-source data to construct weighted multi-layer networks, combine panel econometrics and simulation modeling for comparative analysis across regions and agent types, and further advance research on governance mechanisms through which innovation networks empower sustainable development.
Based on the empirical conclusions of this paper, hierarchical policy recommendations are proposed along four dimensions: expanding network scale, boosting network connectivity efficiency, optimizing high-order collaborative structures and extending cross-regional collaboration.
(1)
Strengthen the dominant role of enterprises in innovation and expand regional innovation cooperation networks. Introduce financial subsidies and tax incentives to attract MSMEs, research institutes, universities and local governments to participate in joint research. Prioritize deep embedding of research institutes into enterprise-led innovation teams to accelerate industrialization of cutting-edge scientific achievements. Relax thresholds for private enterprises to participate in major science and technology projects and fully unlock private-sector innovation vitality.
(2)
Optimize network connectivity channels and reduce circulation costs of cross-agent collaboration. Support enterprises to consolidate existing partners, build cross-industry innovation alliances and online collaborative innovation platforms, and leverage high-betweenness-centrality entities as bridging hubs to unlock shared channels for innovative resources and green technologies and shorten transmission paths of production factors.
(3)
Promote cross-industry high-order collaboration and alleviate innovation homogenization. Current networks feature excessive low-order ties and insufficient in-depth cross-sector collaboration, which easily leads to convergent innovation paths. Local science and technology authorities should guide innovative agents to break industrial barriers. Based on advantageous industries including electronic information, advanced materials and biomedicine, arrange joint research on national key fields such as artificial intelligence, quantum information and biological breeding to enrich high-order network ties and expand the breadth and depth of innovation.
(4)
Deepen cross-regional collaborative innovation and build a nationwide innovation cooperation system. Sustain long-term collaboration between provincial leading enterprises and research institutions in core external cities including Beijing, Shanghai and Wuhan. Rely on leading enterprises to co-build regional science and innovation centers with universities and upstream/downstream firms and foster green innovative industrial clusters. Leverage collaborative hubs of northern, eastern and southern coastal regions as well as middle Yangtze and Yellow River urban agglomerations to coordinate nationwide innovative resources for joint breakthroughs in core low-carbon technologies.

Author Contributions

Conceptualization, X.W., H.X. and M.W.; methodology, X.W., Y.S. and H.X.; software, X.W. and Y.S.; validation, X.W., H.X., Y.S. and M.W.; investigation, X.W. and Y.S.; data curation, X.W. and Y.S.; writing—original draft preparation, X.W. and Y.S.; writing—review and editing, H.X. and M.W.; visualization, X.W. and Y.S.; supervision, H.X. and M.W.; funding acquisition, H.X. and M.W. All authors have read and agreed to the published version of the manuscript.

Funding

This work was supported by the Major Project of the National Social Science Fund of China (22&ZD136), the major project of philosophy and social science research in colleges and universities of Jiangsu Province (2024SJZD129), and the major project of Basic Science (Natural Science) research in colleges and universities of Jiangsu Province (24KJA110002).

Institutional Review Board Statement

Not applicable.

Informed Consent Statement

Not applicable.

Data Availability Statement

The original contributions presented in this study are included in the article. Further inquiries can be directed to the corresponding author.

Conflicts of Interest

The authors declare no conflicts of interest.

References

  1. Yu, J.; Chen, F.; Zhang, Y.; Liu, R. Forging key national equipment: Exploration on laws and system construction of breakthroughs in core key technologies. Bull. Chin. Acad. Sci. 2019, 34, 339–343. [Google Scholar]
  2. Chen, J.; Yang, Z.; Zhu, Z.Q. Breaking through “neck-choking” technologies during the 14th Five-Year Plan period: Identification framework, strategic shift and breakthrough paths. Reform 2020, 12, 5–15. [Google Scholar]
  3. Wu, C.P.; Yan, Z.H. Government fund guidance and enterprises’ breakthrough in core technologies: Mechanisms and effects. Econ. Res. J. 2023, 58, 137–154. [Google Scholar] [CrossRef]
  4. Zheng, S.L.; Han, X.Y.; Guo, X.D.; Zhang, Z.Y. National strategic scientific and technological forces and enterprises’ breakthroughs in core key technologies: Evidence from national and provincial key laboratories. China Ind. Econ. 2024, 9, 62–80. [Google Scholar]
  5. Kim, Y.J.; Lee, D.H. Technology convergence on automotive lightweight materials: Evidence from South Korea. Technol. Anal. Strateg. Manag. 2023, 35, 286–301. [Google Scholar]
  6. Zhang, S.M.; Yuan, C.H. How do leading manufacturing enterprises cultivate the sustainable innovation capability of core key technologies? Sci. Res. Manag. 2022, 43, 103–110. [Google Scholar]
  7. Cui, Z.T.; Ning, Y.C.; Song, J.; Yang, J. Impact of national innovative city policy on enterprise green technology innovation—Mediation role of innovation environment and R&D investment. Sustainability 2024, 16, 1437. [Google Scholar] [CrossRef]
  8. Gloor, P.A. Swarm Creativity: Competitive Advantage Through Collaborative Innovation Networks; Oxford University Press: Oxford, UK, 2006. [Google Scholar]
  9. Hong, J.T.; Zheng, R.Y.; Deng, H.P.; Zhou, Y.L. Green supply chain collaborative innovation, absorptive capacity and innovation performance: Evidence from China. J. Clean. Prod. 2019, 241, 118377. [Google Scholar] [CrossRef]
  10. Yang, J. Research on approaches and mechanisms of knowledge transfer in enterprise R&D alliances. J. Hubei Univ. Philos. Soc. Sci. 2011, 38, 87–89. [Google Scholar]
  11. Zeng, S.X.; Xie, X.M.; Tam, C.M. Relationship between cooperation networks and innovation performance of SMEs. Technovation 2010, 30, 181–194. [Google Scholar] [CrossRef]
  12. Bai, Y.P.; O’Brien, G.C. The strategic motives behind firm’s engagement in cooperative research and development: A new explanation from four theoretical perspectives. J. Model Manag. 2008, 3, 162–181. [Google Scholar] [CrossRef]
  13. Li, D.H. R&D alliances of enterprises: Risks and prevention. China Soft Sci. 2002, 10, 48–51. [Google Scholar]
  14. Yu, J.Q.; Wang, X.H. Motivation analysis on the formation of domestic enterprise R&D alliances. J. Liaoning Univ. Technol. Soc. Sci. Ed. 2008, 5, 31–33. [Google Scholar]
  15. Zhang, Y.F.; Zhai, L.X. Industry-university-research R&D alliances: International experience and countermeasures for China. Sci. Res. Manag. 2008, 29, 42–48. [Google Scholar]
  16. Wu, B.; Wang, Y.; Zhong, S.M. Research on restructuring R&D system of domestic enterprise groups and exploring research consortia. Mod. Econ. Res. 2009, 4, 21–24. [Google Scholar]
  17. Ma, Z.G. Research on R&D innovation performance evaluation and development countermeasures of research consortia. Sci. Manag. Res. 2014, 32, 55–58. [Google Scholar]
  18. Nippa, M.; Reuer, J.J. On the future of international joint venture research. J. Int. Bus. Stud. 2019, 50, 555–597. [Google Scholar] [CrossRef]
  19. Ma, Z.G. Research on improvement paths of independent innovation capability of SMEs’ research consortia. Sci. Res. Manag. 2019, 40, 51–62. [Google Scholar]
  20. Fan, X.; Zhao, D.P.; He, Y. Innovation efficiency of enterprise industry-university-research cooperation and its influencing factors. Sci. Res. Manag. 2012, 2, 33–39. [Google Scholar]
  21. Wei, S.H.; Wang, Y.R.; Tang, D.N. Impact of industry-university-research cooperation on innovation performance of China’s high-tech industry. Econ. Manag. J. 2013, 5, 19–30. [Google Scholar] [CrossRef]
  22. Li, C.J. How does university-industry collaboration drive the green innovation? SAGE Open 2024, 14, 21582440241274500. [Google Scholar] [CrossRef]
  23. Liu, F.R.; Hu, L.J.; Fan, X.Q. Research on the impact of industry-university-research cooperation on enterprises’ innovation quality. Econ. Manag. J. 2020, 42, 120–136. [Google Scholar]
  24. Xiong, H.R. What are the shortcomings and challenges of in-depth integration of industry, university and research in China? Study Explor. 2021, 5, 126–133, 192. [Google Scholar]
  25. Xiong, J. Fragmentation and holistic governance of project-based governance in higher education. Educ. Sci. 2016, 6, 55–62. [Google Scholar] [CrossRef][Green Version]
  26. Huang, C.J.; Nan, X.G. Logic, challenges and paths of research on industry-university-research cooperation governance in the intelligent era. China Sci. Technol. Forum 2019, 2, 29–35+43. [Google Scholar]
  27. Liu, X.L.; Chang, X.Z. Constructing a market-oriented innovation ecosystem for core technologies. Stud. Sci. Sci. 2024, 42, 614–623. [Google Scholar] [CrossRef]
  28. Chen, L.Z.; Ma, Y.Y.; Sun, Y.T. The role of intellectual property on enterprise-led industry-university-research institution cooperation: Case of innovation awards in China. Humanit. Soc. Sci. Commun. 2024, 11, 1–14. [Google Scholar] [CrossRef]
  29. Guo, J.E.; Wang, M.D.; Leng, A.L. Mechanism and path for enterprises to build innovation consortia and reshape innovation ecosystem. J. Xi’an Jiaotong Univ. Soc. Sci. 2022, 42, 76–84. [Google Scholar]
  30. Ma, Z.G.; Lv, X.X. Research on application scenarios of innovation consortia led by leading enterprises. Sci. Manag. Res. 2023, 41, 125–130. [Google Scholar]
  31. Cao, Y.G.; Ren, S.C.; Du, M. Research on cooperation network of enterprise-led innovation consortia—Taking Shanghai Science and Technology Progress Award projects as examples. Sci. Technol. Prog. Policy 2023, 40, 1–10. [Google Scholar]
  32. Zhang, C.D.; Peng, X.Y. Concept definition and policy connotation of innovation consortia. Sci. Technol. China 2021, 6, 5–9. [Google Scholar]
  33. Gao, X.; Qi, G.Q.; Cao, J.Q. Influence of openness of industry-university-research cooperative innovation network on enterprise innovation performance. Sci. Res. Manag. 2019, 40, 231–240. [Google Scholar]
  34. Zeng, J.J.; Liu, D.J.; Yi, H.T. Agglomeration, structural embeddedness, and enterprises’ innovation performance: An empirical study of Wuhan biopharmaceutical industrial cluster network. Sustainability 2019, 11, 3922. [Google Scholar] [CrossRef]
  35. An, T.L.; Wei, J.; Jiang, G. Interconnected innovation of Chinese enterprises based on complex networks. Soc. Sci. China 2023, 10, 24–43. [Google Scholar]
  36. Jiang, Z.Y.; Wang, Z.J.; Feng, C.X. Balancing the strength of external and internal ties for tacit knowledge management. Technol. Anal. Strateg. Manag. 2020, 32, 785–800. [Google Scholar] [CrossRef]
  37. Zhang, X.; Hu, H.Q.; Xue, M. Supply chain network structure, innovation capability of SMEs and supply chain financing performance: A moderated mediation effect. J. Syst. Manag. 2025, 34(3), 823–836. [Google Scholar]
  38. Potter, A.; Wilhelm, M. Exploring supplier-supplier innovations within the Toyota supply network: A supply network perspective. J. Oper. Manag. 2020, 66, 797–819. [Google Scholar] [CrossRef]
  39. Xiao, Z.H.; Shi, J.B.; Li, X.M. Influence of social network embeddedness on collaborative innovation of high-end equipment manufacturing enterprises: Based on the role of industrial alliance relationships. Front. Eng. Manag. Technol. 2024, 43, 54–61. [Google Scholar]
  40. Li, S.Y.; Chen, R.K.; Zhou, W.J. The effect of innovation networks on urban energy intensity: Evidence from China. Energy Sources Part B Econ. Plan. Policy 2026, 21, 2629841. [Google Scholar] [CrossRef]
  41. Han, Z.L.; Yuan, Y.Y.; Peng, F. Evolution of government-industry-university research innovation cooperation network of equipment manufacturing industry in Northeast China. Econ. Geogr. 2018, 38, 103–111. [Google Scholar]
  42. Guo, S.Z.; Lu, Z.M. Fundamental Theories of Complex Networks; Science Press: Beijing, China, 2012. [Google Scholar]
  43. Xie, F.J.; Yang, P.P.; Cui, W.T. A review of higher-order network research in complex network theory. J. Syst. Sci. 2024, 32, 121–127. [Google Scholar]
  44. Chen, H.Y.; Xu, T.; Liu, C. Network similarity comparison method based on higher-order information. Acta Phys. Sin. 2024, 73, 352–362. [Google Scholar] [CrossRef]
  45. Wang, M.; Pan, X.; Shen, Y. Construction and evolutionary pattern of the coupling relationship network of regional sustainable development in China. J. Clean. Prod. 2024, 445, 141326. [Google Scholar] [CrossRef]
Figure 1. Research Framework.
Sustainability 18 07116 g001
Figure 2. Schematic diagram for calculating the high-order clustering coefficient of a network. (a) The network formed by node v 1 and its neighbors; (b) the network after removing node v 1 .
Sustainability 18 07116 g002
Figure 3. Development Trend of Innovation Team Collaborations Led by Leading Enterprises.
Sustainability 18 07116 g003
Figure 4. Evolution of the Leading Enterprise-Led Innovation Team Collaboration Network Across Four Stages in Jiangsu Province. Note: Upper left corresponds to 2006–2010; upper right to 2011–2015; lower left to 2016–2020; lower right to 2021–2023.
Sustainability 18 07116 g004
Figure 5. Higher-Order Clustering Coefficients of Innovation Entities in the Leading Enterprise-Led Innovation Team Collaboration Network in Jiangsu Province. (a) 2006–2010, (b) 2011–2015, (c) 2016–2020, (d) 2021–2023.
Sustainability 18 07116 g005
Figure 6. Distance Distribution of Innovation Entities in the Leading Enterprise-Led Innovation Team Collaboration Network in Jiangsu Province. (a) 2006–2010, (b) 2011–2015, (c) 2016–2020, (d) 2021–2023.
Sustainability 18 07116 g006
Figure 7. Spatial distribution map of innovation team cooperation networks led by leading enterprises in Jiangsu Province in four stages. Note: Upper left corresponds to 2006–2010; upper right to 2011–2015; lower left to 2016–2020; lower right to 2021–2023.
Sustainability 18 07116 g007
Table 1. Structural Characteristics of the Leading Enterprise-Led Innovation Team Collaboration Network Across Four Stages in Jiangsu Province.
2006–20102011–20152016–20202021–2023
Network size279.0000444.0000757.0000703.0000
Number of edges311.0000610.00001652.00001885.0000
Network density0.00840.00680.00650.0083
Network diameter13.000012.000010.00008.0000
Clustering coefficient0.74700.81900.86700.8680
Average path length3.88004.46803.83003.4690
Average degree2.22902.74804.91405.3630
Degree centralization0.02390.01630.01330.0230
Betweenness centralization0.03460.20960.37010.2537
Table 2. Centrality of the Leading Enterprise-Led Innovation Team Collaboration Network in Jiangsu Province: Top 10 Innovation Entities.
Innovation EntitiesDegreeInnovation EntitiesBetweenness
2006–2010Southeast University22.000Southeast University3.518
Yancheng Institute of Technology17.000Yancheng Institute of Technology2.445
Jiangsu University13.000Tsinghua University1.928
Nanjing Metro Co., Ltd.13.000Jiangsu Electric Power Dispatching and Trading Center1.536
Nanjing Tech University8.000Jiangsu Electric Power Research Institute Co., Ltd.1.423
China University of Mining and Technology7.000Nanjing Metro Co., Ltd.1.170
Jiangsu Research Institute of Building Science Co., Ltd.6.000State Grid Jiangsu Electric Power Co., Ltd.1.067
Nanjing Agricultural University6.000Central Iron & Steel Research Institute Co., Ltd.1.067
Nantong University6.000NARI Technology Co., Ltd.0.777
Tsinghua University, Soochow University6.000Zhejiang University, Soochow University0.640
2011–2015Southeast University53.000Southeast University21.190
NARI Technology Co., Ltd.31.000Yancheng Institute of Technology11.807
Nanjing University of Science and Technology26.000Jiangnan University9.479
State Grid Jiangsu Electric Power Co., Ltd.25.000Nanjing University of Science and Technology8.712
Jiangnan University23.000Nantong University8.679
Yancheng Institute of Technology23.000Jiangsu University5.904
State Grid Electric Power Research Institute Co., Ltd.22.000Hohai University5.197
Jiangsu University22.000Shanghai Jiao Tong University5.102
Nantong University19.000Tongji University5.035
Tongji University16.000NARI Technology Co., Ltd.4.055
2016–2020State Grid Jiangsu Electric Power Co., Ltd.165.000Southeast University37.218
Southeast University163.000Jiangsu University14.465
China Electric Power Research Institute Co., Ltd.94.000State Grid Jiangsu Electric Power Co., Ltd.10.307
NARI Technology Co., Ltd.71.000Nanjing University of Science and Technology9.106
Hohai University58.000China Electric Power Research Institute Co., Ltd.8.735
Jiangsu University58.000Nanjing University of Aeronautics and Astronautics6.200
Nanjing University of Science and Technology48.000Hohai University5.562
Shanghai Jiao Tong University42.000Shanghai Jiao Tong University5.078
Nanjing University of Aeronautics and Astronautics41.000China University of Mining and Technology4.652
Nanjing NARI Group Corporation38.000Tsinghua University4.345
2021–2023Southeast University183.000Southeast University25.586
State Grid Jiangsu Electric Power Co., Ltd.159.000State Grid Jiangsu Electric Power Co., Ltd.12.654
Nanjing University of Aeronautics and Astronautics81.000Nanjing University of Aeronautics and Astronautics11.284
Nanjing University of Science and Technology72.000Nanjing University of Science and Technology11.039
Nanjing Institute of Technology59.000Zhejiang University7.347
Shanghai Jiao Tong University58.000Soochow University6.902
China Electric Power Research Institute Co., Ltd.53.000Shanghai Jiao Tong University6.851
Zhejiang University43.000Nanjing Institute of Technology6.604
Hohai University42.000Changzhou Vocational College of Mechatronics Technology6.477
Tsinghua University42.000Tsinghua University6.426
Table 3. Persistent Innovation Entities in the Leading Enterprise-Led Innovation Team Collaboration Network in Jiangsu Province from 2006 to 2023.
2006–20102011–20152016–20202021–2023
Total number of innovation entities279444757703
Number of core entities43152429
Number of sustained innovation entities/73 (16.44%)124 (16.38%)165 (23.47%)
Number of core sustained innovation entities/3716
List of sustained innovation entitiesUniversities and colleges: University of Science and Technology Beijing, Dalian University of Technology, Northeastern University, Donghua University, Southeast University, Hohai University, East China University of Science and Technology, Jiangnan University, Jiangsu University, Jiangsu University of Science and Technology, Nanjing University, Nanjing Institute of Technology, Nanjing Tech University, Nanjing University of Aeronautics and Astronautics, Nanjing University of Science and Technology, Nanjing Forestry University, Nantong University, Tsinghua University, Shanghai Jiao Tong University, Soochow University, Yancheng Institute of Technology, Zhejiang University, China University of Mining and Technology, China Pharmaceutical University, Chongqing University
 Enterprises: NARI Technology Co., Ltd., State Grid Electric Power Research Institute Co., Ltd., State Grid Jiangsu Electric Power Suzhou Power Supply Company, Jiangsu Oriental Filter Bag Co., Ltd., Jiangsu Shagang Group Co., Ltd., Jiangsu Research Institute of Building Science Co., Ltd., Jiangsu Yangnong Chemical Co., Ltd., Jiangsu Ushio Chemical Co., Ltd., Jiangsu Sinopec High-Tech Industry Co., Ltd., Jiangsu Zhongtian Technology Co., Ltd., Nanjing Iron & Steel Co., Ltd., Nanjing Panda Electronics Co., Ltd., Sinopec Engineering Incorporation, Sinopec Yangzi Petrochemical Co., Ltd., Zhongtian Technology Submarine Cable Co., Ltd.
Note: Nodes with a coreness value between 0.05 and 1.00 are considered core nodes.
Table 4. Proportion of Intra-Provincial and Extra-Provincial Collaborations in the Leading Enterprise-Led Innovation Team Collaboration Network in Jiangsu Province.
2006–20102011–20152016–20202021–2023
Number of collaborations31161016521885
Number of intra-provincial collaborations192 (61.74%)385 (63.11%)860 (52.06%)878 (46.58%)
Table 5. Ranking of Regional Centrality of Innovation Entities in the Leading Enterprise-Led Innovation Team Collaboration Network in Jiangsu Province.
PeriodRankDegree CentralityCloseness CentralityBetweenness CentralityTotal Centrality
2006–20101Beijing0.051Beijing0.579Beijing1.515Beijing2.145
2Shanghai0.037Shanghai0.550Shanghai0.433Shanghai1.020
3Chengdu0.010Dalian0.550Lanzhou0.000Dalian0.557
4Dalian0.007Luoyang0.550Hefei0.000Luoyang0.555
5Luan0.006Jinan0.550Tangshan0.000Jinan0.555
2011–20151Beijing0.041Shanghai0.560Zhengzhou7.407Zhengzhou7.937
2Shanghai0.040Beijing0.549Shanghai1.720Shanghai2.320
3Hangzhou0.009Chongqing0.549Beijing1.323Beijing1.913
4Chongqing0.005Hangzhou0.528Shenyang0.132Shenyang0.654
5Wuhan, Shenzhen, Xi’an0.004Zhengzhou0.528Chongqing0.000Chongqing0.554
2016–20201Beijing0.028Beijing0.682Beijing10.217Beijing10.927
2Shanghai0.017Shanghai0.592Shanghai1.985Shanghai2.594
3Wuhan0.006Hangzhou0.556Wuhan0.842Wuhan1.404
4Xi’an0.006Wuhan0.556Hangzhou0.668Hangzhou1.229
5Hangzhou0.005Xi’an, Zhengzhou0.542Xi’an0.374Xi’an0.922
2021–20231Beijing0.024Shanghai0.659Shanghai8.079Shanghai8.753
2Shanghai0.015Beijing0.643Beijing6.276Beijing6.943
3Hangzhou0.004Xiamen0.545Qingdao4.001Qingdao4.543
4Wuhan0.004Wuhan0.545Xiamen0.792Xiamen1.339
5Shenzhen0.004Shenzhen, Xi’an, Qingdao0.54Wuhan0.579Wuhan1.128
Table 6. Raw Data for Benchmark Regression.
YearSDDegreePathEdgePFDIESIUER
201058.619634.4272.54222878691929.1570.4075 0.7834410.01127
201161.387933.692.62421480232075.3240.4201 0.8203810.01179
201260.80134.1132.5121881202257.3220.3919 0.8585310.012236
201363.057724.3742.45923481922059.810.3703 0.9177720.014844
201462.260574.5972.53330882811730.6820.3625 0.9718350.013583
201562.759225.4172.5634483151511.9250.3632 1.0167780.013367
201663.629465.6552.53941083811630.2170.3488 1.0921220.009898
201764.628526.0992.49549484231697.0930.3316 1.0914120.008331
201864.947827.1962.45473484461693.5570.3013 1.1141030.007137
201967.86587.72.44287484691802.1810.3173 1.1688120.006234
202066.746188.4982.4299084771957.5390.2976 1.2018220.005494
202167.757938.3722.414108085051861.4590.2767 1.1388420.004422
Table 7. Descriptive Statistical Analysis of Variables.
VariableMeanStd.MinMax
S D 63.7052 2.8357 58.6196 67.8658
D e g r e e 5.84311.71733.66908.4980
P a t h 2.49930.06362.41402.6240
E d g e 510.6667322.65412141080
P 8291.75202.539478698505
F D I 1850.5222214.39951511.9252257.322
E S 0.34910.04530.27670.4201
I U 1.01470.14230.78341.2018
E R 0.00990.00350.00440.0148
Table 8. Estimation Results of Benchmark Regression Model.
CoefficientStd. Errort-Statisticp-Value
Constant3.26140.84273.870.004 ***
l n P a t h −0.74250.3681−2.020.073 *
l n E d g e 0.13670.04183.270.009 ***
l n P 0.41820.14752.840.018 **
I U 0.37190.12632.940.015 **
E R −21.473610.0526−2.140.061 *
R 2 0.941
Adjusted   R 2 0.907
F-statistic27.640 Prob > F0.0003
DW statistic2.17
JB p-value0.624
Notes: * p < 0.05, ** p < 0.01, *** p < 0.001. * denotes statistically significant at the 5% level, ** denotes significance at the 1% level, and *** denotes significance at the 0.1% level.
Disclaimer/Publisher’s Note: The statements, opinions and data contained in all publications are solely those of the individual author(s) and contributor(s) and not of MDPI and/or the editor(s). MDPI and/or the editor(s) disclaim responsibility for any injury to people or property resulting from any ideas, methods, instructions or products referred to in the content.