Article

Market Concentration of ESG Debt Securities in Central and Eastern European (CEE) Countries

1
Department of Economic and Financial Analysis, University of Economics in Katowice, 40-287 Katowice, Poland
2
Department of Banking and Financial Markets, University of Economics in Katowice, 40-287 Katowice, Poland
*
Author to whom correspondence should be addressed.
Sustainability 2026, 18(14), 7113; https://doi.org/10.3390/su18147113
Submission received: 13 June 2026 / Revised: 3 July 2026 / Accepted: 5 July 2026 / Published: 12 July 2026

Abstract

The article examines the level of concentration in the ESG bond market in Central and Eastern European (CEE) countries over the period 2020–2025. The aim of the study is to assess the structure of this market in terms of value, volume, product composition, and sectoral distribution. The analysis employs the Herfindahl–Hirschman Index (HHI), which enables the measurement of concentration levels across the respective dimensions. The data are sourced from the Environmental Finance Data database. The results indicate that the ESG bond market in the CEE region is characterized by a high degree of geographical concentration, with the dominance of a limited number of countries, namely Poland, the Czech Republic (Czechia), and Hungary. At the same time, a very strong product concentration persists. Green bonds play a predominant role, while other types of instruments remain of limited significance. A high level of concentration is also observed in the structure of issuers and economic sectors. Despite an increase in both the value and number of issuances, no clear diversification of the market has occurred. The findings suggest that the development of the ESG bond market in CEE countries is uneven and is concentrated around a limited number of participants and market segments.

1. Introduction

The path toward sustainable development is based on ESG-related actions undertaken by a wide range of entities. It is a pathway that cannot be achieved without sustainable and equitable financing mechanisms. The market for sustainable financial instruments constitutes one of the most significant methods of ESG financing. With the growing importance of environmental, social, and governance (ESG) objectives, not only is there an intensification of the issuance of specialized debt instruments, but also a deepening institutionalization of the principles governing their functioning.
According to a report by the Climate Bonds Initiative (CBI), the global sustainable bond market recorded a cumulative issuance volume of USD 8.1 trillion as of the end of 2025, of which USD 6.8 trillion (83%) consisted of climate bonds. This indicates strong demand for thematic debt instruments. In 2025, the annual issuance volume of ESG bonds reached USD 1.0 trillion, marking the third consecutive year at this level, which reflects the sustained momentum of this market segment. It is noteworthy that more than 400 new ESG debt issuers entered the market in 2025. Green-labelled instruments continued to dominate, accounting for approximately two-thirds (64%) of the total cumulative ESG bond volume. ESG bond issuers are primarily large corporations (23% share), financial institutions (23%), development banks (20%), governments and municipalities (19%), and sovereign issuers (12%) [1]. Europe remains the leading region, generating 45% of both the total annual ESG issuance volume in 2025 and the cumulative ESG volume. The Asia–Pacific region ranks second; however, while Europe and Asia–Pacific are the leading regions, the United States remains the largest source of cumulative issuance volume [1]. The number of countries issuing ESG debt instruments increased to 109, including Oman in 2025 through a USD 750 million green sukuk issued by the Oman Electricity Transmission Company in October [1].
Ref. [2] highlights that the issuance of sustainable debt securities reached a global record in 2021 and accounted for nearly 10% of total public bond issuance, with further growth expected. According to [2], Europe represents the largest market for these bonds, holding a 52% share of global sustainable bond issuance in 2021, while other regional markets are gradually catching up. Emerging markets accounted for 21% of total bond issuance in 2021, compared to 17% in 2020. Similarly, ref. [3] confirms that Europe was the largest issuer of ESG debt instruments, with USD 405 billion, representing 46% of the total value in 2023. In contrast, ref. [4] emphasizes that less than 0.3% of the global ESG bond issuance volume is allocated to projects in Africa. Ref. [5] underline that the ESG bond market in EU countries plays a leading role in the global green energy finance market, with the total value of bonds issued in EU countries accounting for 40% of the global total. Moreover, the European Commission has implemented a range of regulations aimed at combating climate change and promoting green finance. Ref. [6] note that since the European Investment Bank (EIB) initiated the green bond market by issuing the world’s first ESG bonds at the end of 2007, the European market has developed dynamically, achieving an average annual growth rate of 50% between 2015 and 2020. The EU is currently a global leader in this segment, issuing 51% of the world’s total bond volume. The EU Taxonomy Regulation [7] and the related EU Green Bond Standard have played a crucial role in strengthening the European sustainable finance market. Ref. [5], in their analysis covering the period 2014–2019, found that ESG bonds were issued in 19 European Union countries. Countries such as France, Germany, the Netherlands, and Sweden issued green bonds every year within the analyzed period, and these countries accounted for more than 60% of total EU issuance. Low issuance levels in terms of volume and frequency were observed in Portugal, Greece, Lithuania, Slovenia, Estonia, and Latvia. In nine countries (Bulgaria, Croatia, Cyprus, Czech Republic, Hungary, Luxembourg, Malta, Romania, and Slovakia), no ESG bond issuance was identified.
The ESG bond market in Europe is growing rapidly; however, Central and Eastern Europe (CEE) still represents a relatively small, albeit dynamically developing, segment of this market. Quantitative data for the CEE region usually need to be extracted from broader European analyses or country-specific case studies. As noted in [8], Poland was the first country in the world to issue a sovereign green bond compliant with ICMA principles in 2016, while corporate ESG bond issuance has also been observed in the Czech Republic, Estonia, Romania, and Slovakia, although in marginal amounts. In the Czech Republic, such activity is associated with relatively small-scale issuances by subsidiaries of Raiffeisenbank and the Czech gas transmission operator. Meanwhile, in Slovakia, the issuer was also a bank—Tatra Banka—supported by the EBRD, with a limited issuance volume, compliant with ICMA green bond principles. The authors indicate that sovereign issuances in countries with less developed capital markets, such as those in CEE, are intended to support the development of local green bond markets and to diversify the investor base. According to [9], Poland is the largest issuer of green bonds among the Visegrad Group (V4) countries, followed by the Czech Republic, Hungary, and Slovakia. Individual bond issuances in these countries are characterized by heterogeneous levels of yield, maturity structure, issuance size, and counterparty risk.
Accordingly, the following research hypothesis was formulated:
H1. 
In the period 2020–2025, ESG bond issuances in CEE countries were characterized by a high level of concentration within a limited number of countries, both in terms of nominal issuance value and the number of executed issuances.
ESG bonds are an umbrella term encompassing several distinct types with varying scale and issuance dynamics, often referred to in the literature as GSSS (i.e., green, social, sustainability, and sustainability-linked bonds). Four main categories are typically distinguished: green bonds, the proceeds of which are used to fully or partially finance or refinance new or existing environmentally friendly projects; social bonds, whose proceeds are allocated to financing social projects; sustainability bonds, whose proceeds are used to finance both environmental and social projects; and sustainability-linked bonds (SLBs), the proceeds of which are used to finance and support companies contributing to sustainable development (from environmental, social, or governance perspectives) [10,11]. Research indicates that green bonds dominate the GSSS structure, which is associated with the high priority of climate-related risk. According to [12], green bonds accounted for 50% of total global GSSS issuance in 2020 (compared to 2018, when green bonds represented over 85% of total GSSS issuance). In emerging markets, approximately four-fifths of total GSSS issuance in 2019 concerned green bonds; moreover, green bonds accounted for 51% and 59% of total GSSS issuance in Latin America and Asia, respectively. In contrast, ref. [13] shows that although green bonds dominate in terms of issuance volume, the share of social bonds, sustainability bonds, and SLBs is growing rapidly, including in developing and emerging markets. Ref. [14] indicates that green bonds were the dominant instrument in the early years (2014–2020), while sustainability and social bonds gained significant popularity in the debt market following the COVID-19 crisis. However, the number of sustainability and social bonds remains limited, and issued instruments provide a complementary picture of the GSSS market. There are significant differences between EU and non-EU countries, with a larger volume of GSSS issuance (as a percentage of total issuance within each jurisdiction) typically originating from firms located in EU countries. The largest issuers of these instruments are based in France, Italy (around 16%), the Netherlands, and Sweden (around 14%). In Europe, the share of ESG bond issuance is the highest globally—Europe accounts for approximately half of the global volume—but within CEE the green bond component dominates, as confirmed by studies conducted by [3,15,16].
GSSS constitute a rapidly growing segment of the debt market; however, in Central and Eastern Europe (CEE), the market remains relatively immature and is still dominated primarily by green bonds. The available data are fragmented, as most studies focus on green bonds and selected countries; therefore, the following research hypothesis was formulated:
H2. 
In the period 2020–2025, the green bond segment was characterized by the highest level of concentration, indicating that it constitutes the dominant category among all financial instruments financing sustainable development in CEE countries.
Sustainable development debt securities may be issued, under relevant national legal frameworks, by international financial institutions, which in the early stages of market development contributed to stimulating both demand and supply as well as establishing best market practices, transparency standards, and minimum issuance principles; sovereigns and government-related issuers, such as local state-owned financial institutions financing public projects; non-financial corporate enterprises, particularly from the energy sector; financial institutions, mainly banks; and local government units [17]. Multilateral financial institutions were the first to take a leading role in sustainable development financing and currently lead the development of new financial instruments aimed at financing both environmental and social projects, which has contributed to the emergence of sustainability bonds. The World Bank and the EBRD were among the earliest green bond issuers, financing, among others, projects in Poland, Hungary, and the broader CEE region [18]. According to [19], on the global market, the majority of ESG bonds are issued by investment corporations and entities from the financial sector. They emphasize that the corporate sector, multilateral organizations, and sub-sovereign entities were the first ESG debt issuers, whereas governments have become increasingly active participants in this segment. The share of ESG bonds in total bond issuance (government and corporate) increased from below 0.03% to just over 5% of total bond issuance value between 2011 and 2021. Governments became active issuers, and their share of all ESG issuance doubled in 2020–2021, accounting for 8% of total ESG debt issuance in that year. ESG issuance by governments increased 2.7-fold between 2020 and 2021, while issuance by governments in emerging markets increased 2.3-fold. In contrast, ref. [20] indicates that financial issuers play a dominant role in asset allocation through ESG bond issuance. Nevertheless, these patterns vary at the country level. For instance, in Germany and France, governments play a key role in line with public green finance strategies, whereas in China and the United States non-government sectors dominate, with more than 50% of issuance volume coming from non-financial corporates. Ref. [21], in a study of the global ESG bond market, finds that corporate sustainable bond issuers account for 40% of the sample, followed by governments (20%) and development banks (17%). Ref. [22] highlights a shift in issuer structure away from the corporate sector toward the official sector. Although the corporate sector still plays a dominant role in the ESG bond market, its overall share has clearly declined over time. The sharp increase in the role of the non-corporate sector began during the pandemic, driven by the official sector. Both sovereigns and, to an even greater extent, other official sector issuers (such as subnational entities and agencies) currently account for approximately 45% of outstanding debt volume and over half of issuance volume since the pandemic. Ref. [15] emphasizes that Europe remains the largest issuing region, accounting for over half of global issuance, and that, consistent with 2022 trends, the corporate sector drove green bond volumes in Europe in 2023, accounting for 57% of total issuance. Non-financial corporate issuers accounted for a 29% market share in 2023, while financial institutions represented 28%, and the government sector is expected to continue issuing green bonds to finance its investments. In contrast, ref. [23] highlights that the issuer structure in Europe has shifted, with corporate issuers dominating as many smaller, higher-risk issuers entered the market, accounting for nearly 20% of total outstanding ESG bond volume. The share of private firms has been steadily increasing, reaching approximately one-third of new issuers. According to [24], in selected CEE countries the main ESG bond issuers are the public sector (Poland 66% of total issuance, Hungary 86%) and state-controlled enterprises (e.g., Poland’s largest bank and largest oil company). In the Czech Republic and Slovakia, issuers are predominantly corporate entities. Public sector activity is essential for the development of the green bond market, as governments—and especially state-linked firms—are expected to pursue sustainable development and invest in this area. This is a necessary but insufficient condition. Greater attention should be given to private enterprises (both financial and non-financial), which invest in sustainable development and should be incentivized to raise capital through bond issuance.
Research on ESG bond issuers in CEE countries is primarily focused on individual countries and demonstrates the presence of all major issuer types known from developed markets, although their shares and roles differ across countries. These issuers include supranational institutions, sovereigns and their agencies, local governments (still to a limited extent), and—of increasing importance—private-sector issuers, such as banks and large corporations. While the issuer structure varies across countries, a common trend can be observed: the growing participation of the corporate sector alongside the continued key role of sovereign and supranational issuances in supporting market development. Accordingly, the following research hypothesis was formulated:
H3. 
In the period 2020–2025, the concentration of ESG bond issuers in CEE countries was primarily observed in the corporate and sovereign sectors, with these sectors serving as the leading issuers in the ESG bond market.
Issuance of ESG bonds is clearly concentrated in several key sectors, primarily the financial sector, utilities and energy-related activities, and selected industrial sectors. According to [25], during the period 2012–2021, approximately 40% of ESG bonds were issued by the financial sector (banks and other financial institutions), with the proceeds being used to refinance green loans and provide indirect financing for clean transport, energy efficiency, and green buildings. In addition, sectors such as manufacturing, energy, and transport account for a significant share of ESG bond issuance. Debt instruments issued by agency, supranational, and sovereign entities also meet ESG criteria. Considering ESG bond issuance by use of proceeds, the objective “Clean Transportation” accounted for 20.65% of all issued instruments. Furthermore, the study demonstrated a relationship between economic sectors and the objectives financed through ESG bond issuance; however, the strength of this relationship was weak. A strong positive relationship was observed between issuance objectives such as clean transportation, energy efficiency, eligible green projects, green buildings, and alternative energy. By contrast, a weak negative relationship was identified between climate change adaptation and renewable energy projects, as well as between climate change adaptation and alternative energy. In turn, ref. [26] notes that ESG bonds are issued predominantly by the financial sector and indicate that the number of ESG bonds issued by financial institutions has increased significantly since 2020, accounting for approximately 75% of the total number of such bonds. However, no comparable difference is observed in terms of issuance value. They also point out that bond issuance is more prevalent in certain sectors, including utilities, consumer goods, real estate, and, to a lesser extent, energy. Moreover, when sectors are grouped according to environmental, social, and governance dimensions based on MSCI ESG Industry Materiality Scores, ESG bonds are more common in sectors where environmental issues are highly material to business operations. Ref. [14] indicates that ESG bonds appear to be issued primarily to finance investments aimed at climate change mitigation and decarbonization. Within a large sample of Fitch-rated debt securities, renewable energy and energy efficiency together account for approximately half of total issuance value. Clean transportation and green buildings represent around one-third of the reported value. Among Fitch-rated sustainability bonds, green buildings constitute the most common category, confirming that these instruments are particularly suitable for financing projects that generate both environmental and social benefits. Affordable housing, socioeconomic development and empowerment, and affordable basic infrastructure are among the most frequently reported expenditure categories motivating the issuance of these bonds. Ref. [15] emphasizes that investments in low-carbon buildings and energy-efficiency projects remain the most common green projects financed through bond proceeds. Although this sector experienced a decline in 2022 compared with 2021, it recorded growth again in 2023. Investments in the transport sector constituted the second most important category after buildings and energy efficiency, while less significant categories included water management, waste management, land use, industry, ICT, and unspecified adaptation and resilience (A&R) sectors. Among corporate issuers in Europe, the dominant sectors are energy, utilities, automotive, transport, and construction, all of which have historically depended on fossil fuels. Ref. [5] indicates that in Europe, projects financed through ESG bond issuance are primarily concentrated in the energy, construction, and transport sectors. Energy-related objectives constitute the highest priority, with building projects ranking first and energy projects second. In turn, ref. [27] finds that, in Hungary, the most important sectors for ESG bond issuance are real estate activities, construction, and finance. The financial sector is divided into two clearly distinguishable subgroups: mortgage banks and asset portfolio management companies (holding companies). All of these groups and subgroups are directly or indirectly linked to the real estate market. Placing these findings in a broader European context, the authors note that the EU green bond market exhibits a somewhat different structure, being dominated by the financial sector (38%), companies supplying electricity, gas, steam, and air-conditioning services (30%), and real estate developers (15%). The importance of developers stems from the fact that buildings account for approximately 40% of energy consumption and 36% of greenhouse gas emissions in the EU, primarily due to construction, demolition, renovation, and operational activities. Furthermore, the European Commission estimates that approximately 2.5–3% of the building stock should be renovated and modernized annually to achieve the EU’s net-zero emission targets by 2050, whereas the current renovation rate is only around 1–1.5%. Moreover, ref. [28] argues that deep energy renovations can generate environmental benefits (energy savings, reduced greenhouse gas emissions, and improved air quality), economic benefits (an additional 160,000 green jobs), and social benefits (enabling approximately 7 million people to escape energy poverty). Finally, ref. [29] indicates that ESG bond issuances in the Visegrad Group countries (the Czech Republic, Hungary, Poland, and Slovakia) have occurred in sectors such as real estate, construction, manufacturing, and agriculture, with particular emphasis placed on objectives related to pollution prevention and energy efficiency.
Accordingly, the following research hypothesis was formulated:
H4. 
In the period 2020–2025, the concentration of ESG bond issuances by issuer sector indicates that the ESG bond market in CEE countries developed in a linear manner.
In Central and Eastern European countries, the ESG bond market is concentrated almost exclusively in green bonds, which are issued primarily by the public and financial sectors. Issuances of social bonds, sustainability bonds, and sustainability-linked bonds are not yet statistically significant in studies covering this region. Europe as a whole is the global leader in ESG bond issuance; however, within Europe, the CEE region remains at an early stage of market development, characterized by the dominance of green bonds and limited issuance of other ESG bond categories. Although the European ESG bond market is large and rapidly expanding, CEE countries account for only a small share of total issuance, with a few leading countries and several others still at the stage of relatively limited market activity. Existing studies on the region focus more frequently on individual country cases than on the CEE region as a whole. Moreover, the degree of concentration within the sustainable bond market in CEE countries constitutes an important indicator of market development that has so far received limited attention in the literature and therefore represents a significant research gap. Accordingly, the following research question was formulated: How is the sectoral allocation of ESG bond proceeds distributed across individual CEE countries at the subsector level (e.g., types of renewable energy sources, building categories, and transport segments)? Based on this premise, the objective of this article is to assess the degree of concentration in the ESG bond market in Central and Eastern European (CEE) countries during the period 2020–2025 across the following dimensions:
(1)
value-based concentration (total ESG bond issuance value),
(2)
volume-based concentration (number of ESG bond issuances),
(3)
product-based concentration (types of ESG bonds),
(4)
issuer sector concentration (according to ESG bond issuer type),
(5)
sector concentration (according to the sector associated with ESG bond issuance).
The results of the study indicate that the ESG bond market in Central and Eastern European (CEE) countries during the period 2020–2025 was characterized by a persistently high level of concentration, particularly in geographical and product dimensions. Issuance activity was concentrated primarily in Poland, the Czech Republic, and Hungary, while the market structure was clearly dominated by green bonds. At the same time, despite the growth in the number of issuances and the gradual emergence of other ESG bond categories, the diversification process remained limited. The findings suggest that the market is still at an early stage of development and remains highly dependent on selected market segments and groups of issuers.
The conducted study has practical relevance for both public policymakers and participants in the financial market. The results of the ESG bond market concentration analysis are particularly useful for regulators and supervisory authorities, as they support the design of policies that foster the development of sustainable finance while mitigating systemic risk. At the same time, they provide valuable insights for issuers considering entry into the ESG bond market. From the perspective of institutional investors, the findings offer information on the degree of market concentration, which may affect risk assessment, pricing efficiency, and portfolio diversification opportunities. Furthermore, this analysis responds to the growing demand within the academic community for more in-depth research on the structure of sustainable finance markets.

2. Materials and Methods

The study employs a quantitative approach of a descriptive and comparative nature, aimed at assessing the degree of concentration in ESG bond issuance. The analysis focuses on the market structure from both cross-sectional and dynamic perspectives, allowing for the identification of differences between categories of issuances as well as changes occurring over time. At the same time, the adopted dynamic perspective is based on the comparison of HHI values and market structures across successive years rather than on modelling causal relationships. Consequently, the study does not include trend estimation, regression analysis, or other econometric methods designed to identify the mechanisms driving the observed changes. This approach is consistent with the use of concentration measures in industrial economics, sectoral analyses, and financial market research [30,31].
The primary analytical tool employed in this study is the Herfindahl–Hirschman Index (HHI), one of the most widely used measures of concentration in economics and finance. The index is used to assess the extent to which a given market or one of its segments is dominated by a limited number of entities or categories. Consequently, it is widely applied in analyses of market structure as well as in studies of the banking sector and financial markets [30,31,32].
The index was independently proposed by O. C. Herfindahl and A. O. Hirschman and remains one of the fundamental measures used in studies of market structure [33,34]. The HHI is defined as the sum of the squared market shares of individual entities:
H H I = i = 1 N s i 2
where:
  • si—denotes the market share of the i-th entity,
  • N—denotes the number of entities.
The values of the index range from 0 to 1 (or alternatively from 0 to 10,000 depending on the scale adopted).
There is no single universally accepted scale for interpreting HHI values in the literature. Originally, the index was primarily comparative in nature and was used to assess relative differences in concentration levels across markets as well as to monitor changes in concentration over time. One of the earliest studies to systematize the interpretation of HHI values was [32], which emphasized the usefulness of this measure in analyzing the degree of concentration and its evolution over time.
In the classical approach, HHI values below 0.10 indicate a dispersed market, whereas an increase in the index signals a shift toward greater market concentration. The dissemination of HHI interpretation was significantly influenced by guidelines issued by U.S. competition authorities, according to which markets with an HHI below 0.15 are considered unconcentrated, values between 0.15 and 0.25 indicate moderate concentration, and values above 0.25 reflect high concentration [35,36]. A similar approach is also adopted in OECD studies on market concentration [31].
At the same time, the academic literature indicates that in the case of highly concentrated markets, further differentiation of HHI levels is justified. Studies [32,37] emphasize that values exceeding 0.30 are typical of oligopolistic market structures, while further increases in the index indicate an increasingly strong dominance of one or a few entities. In turn, research on the banking sector suggests that levels above 0.40–0.50 can be interpreted as very high concentration, approaching a quasi-monopoly structure [30].
Due to the absence of a single universally accepted classification, this study adopts a synthetic interpretation scale of the HHI, integrating the most commonly used approaches in the literature and analytical practice [30,31,32,35,36,37] (Table 1). This scale has an ordinal character and has been adapted to the specific features of the ESG bond market analysis. The use of the HHI enables the assessment of whether issuance activity is concentrated within a narrow group of categories or whether it exhibits a more diversified structure. Consequently, the index allows for both the comparison of concentration levels across the analyzed dimensions and the identification of structural changes over time.
In this study, the research period covers the years 2020–2025 and includes Central and Eastern European (CEE) countries, with the exception of Bulgaria, where no ESG bond issuance occurred during the analyzed period. The data used for the analysis were obtained from the Environmental Finance Data database (https://efdata.org/, accessed on 19 February 2026).
The aim of this article is to assess the degree of concentration in the ESG bond market issued in Central and Eastern European (CEE) countries in the period 2020–2025 across the following dimensions: overall value-based and volume-based concentration for CEE countries, product-based concentration by type of green bonds, and two sectoral dimensions, namely issuer-type concentration and issuer sector concentration. The analysis period covers full annual observations from the point at which ESG bond issuance became more widespread in CEE countries.

3. Results

3.1. Value Concentration of ESG Bond Issuance in CEE Countries in the Period 2020–2025

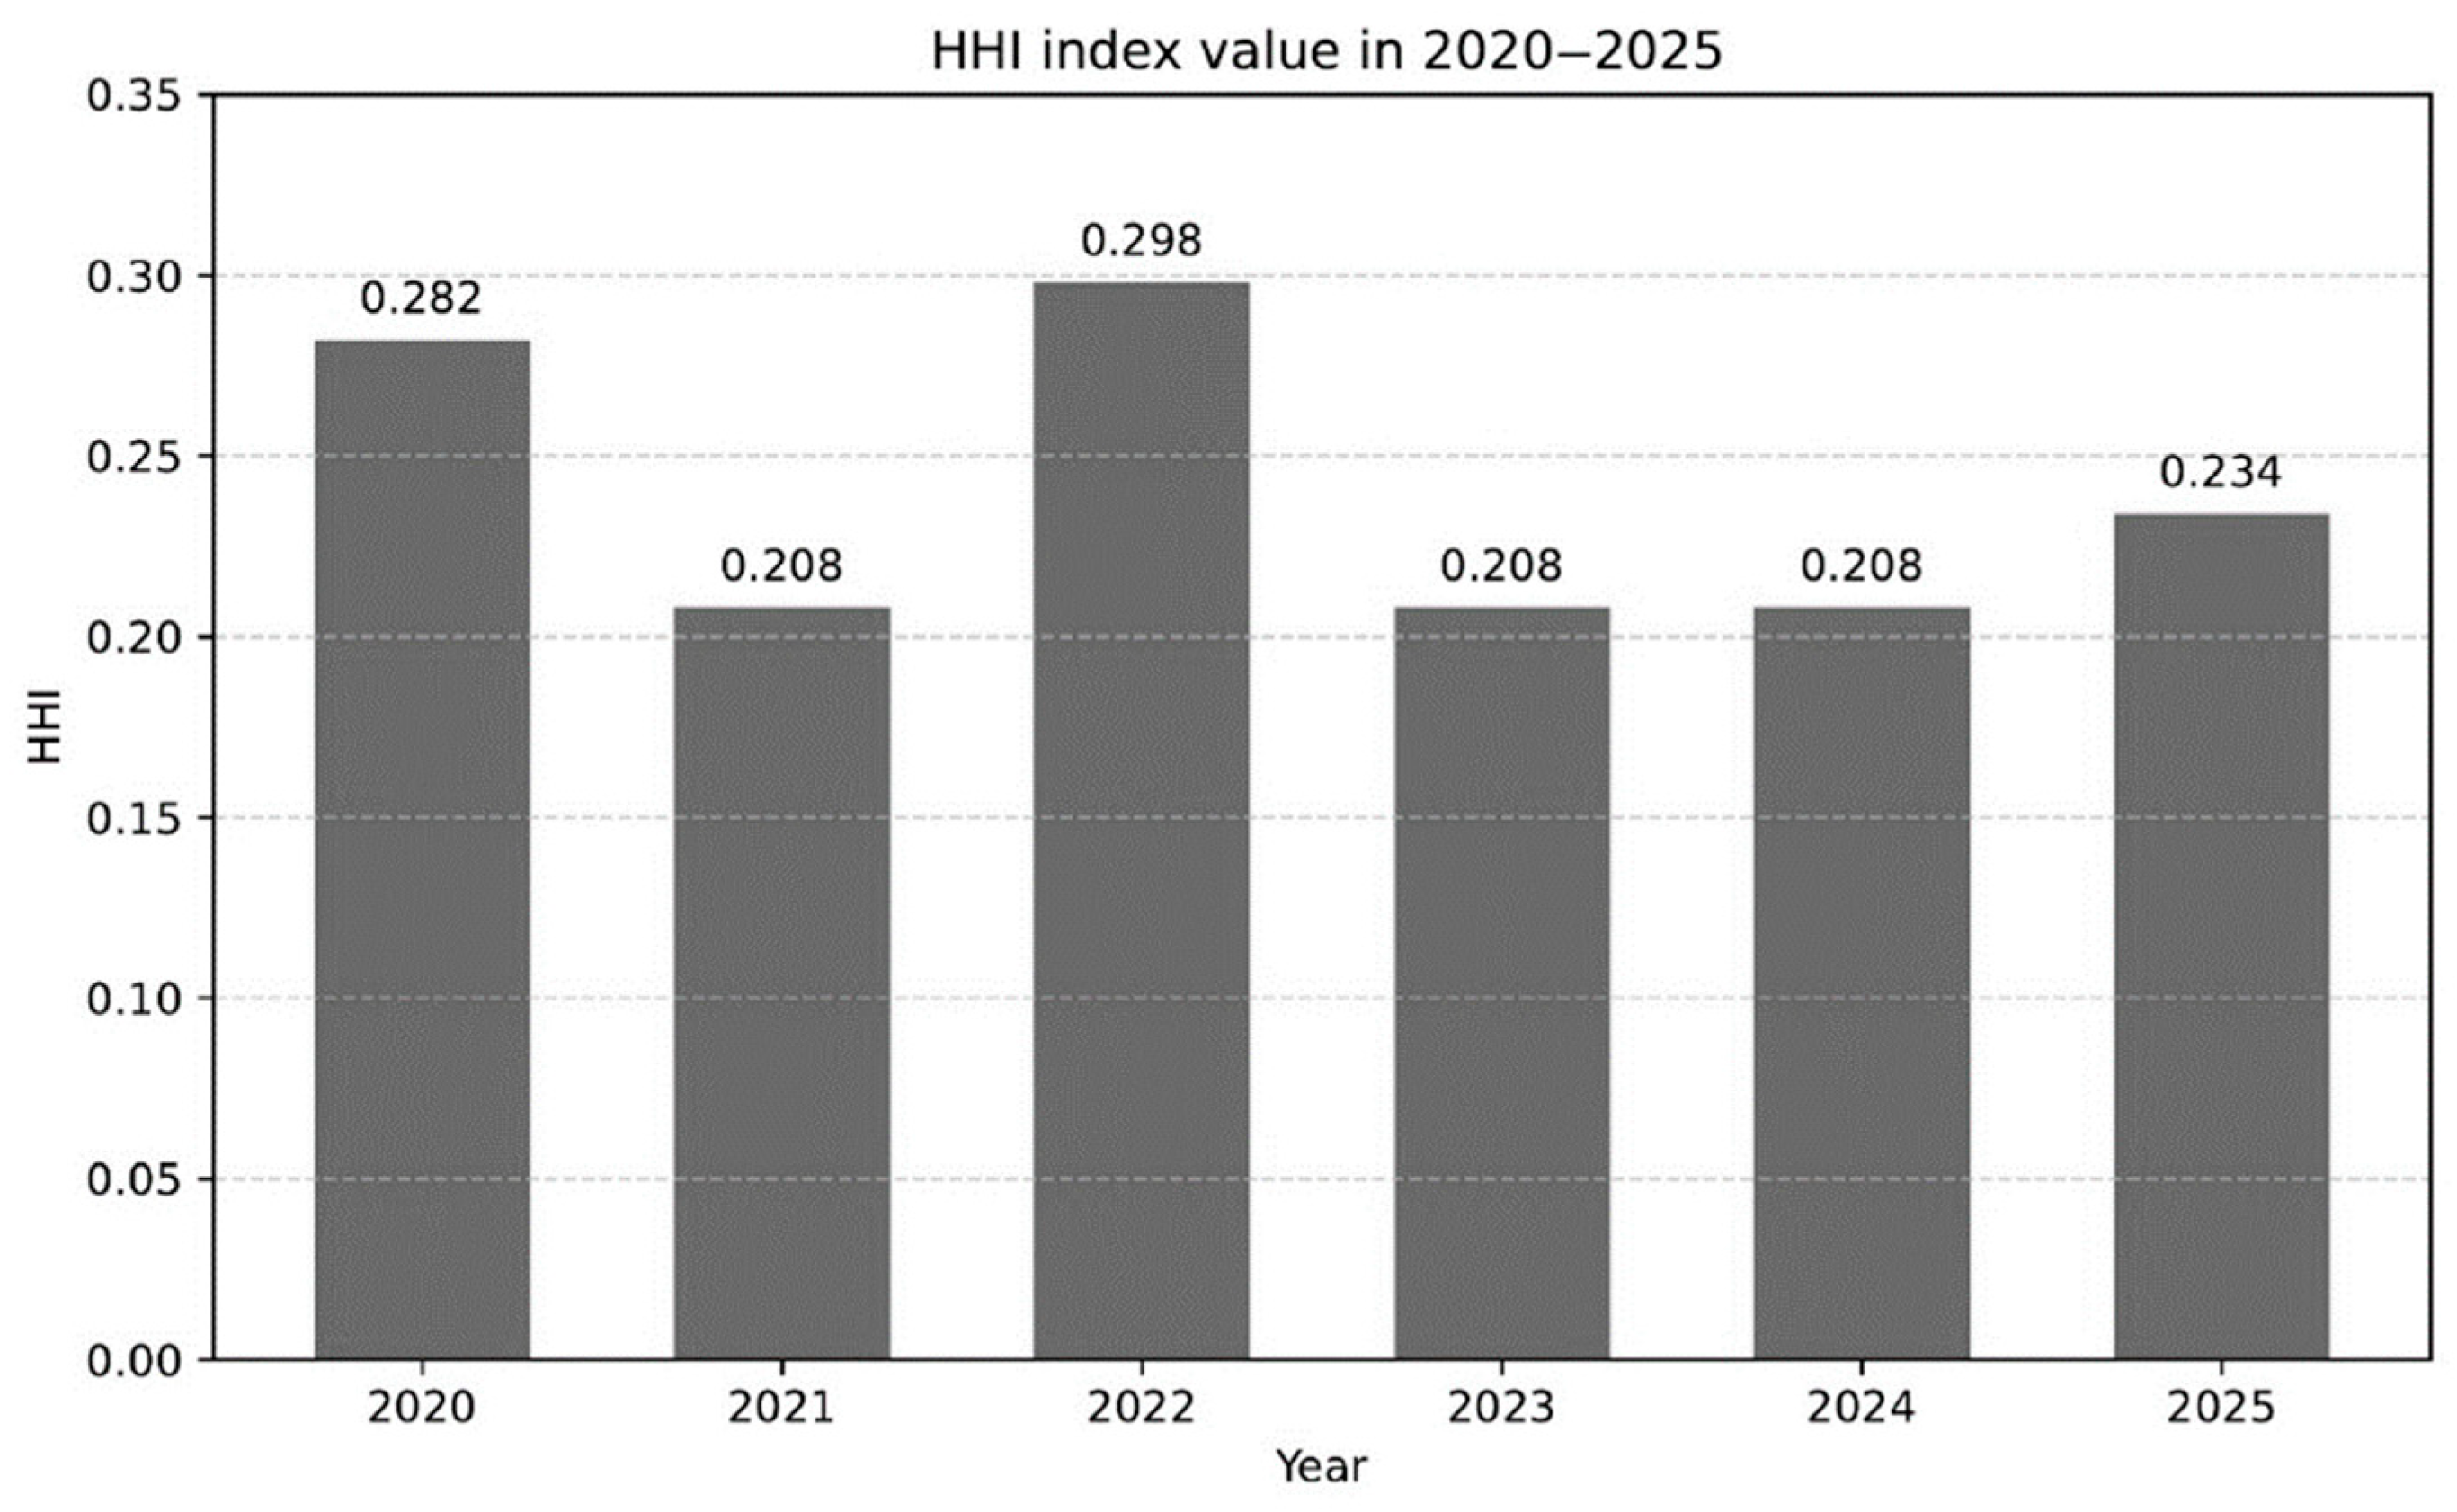
Throughout the entire period 2020–2025, HHI values ranged from 0.208 to 0.298 (Figure 1), which, according to the adopted interpretative thresholds (Table 1), indicates that the ESG bond issuance market in CEE countries was characterized by high concentration in every year of the analyzed period.
In 2020, the HHI value amounted to 0.282, indicating a high level of concentration. As shown in Table 2, issuances were carried out in only five countries in the region, with a total of 14 transactions and an aggregate issuance value of USD 5395.81 million. The highest shares of issuance value were recorded in Hungary (41.47%), the Czech Republic (22.88%), and Romania (19.17%), while several countries reported no issuance activity. Such a structure, characterized by the dominance of a limited number of markets and the absence of activity in others, contributed to elevated concentration levels.
The year 2021 brought a decline in the HHI to a level of 0.208, although it remained within the range of high concentration. According to Table 3, the number of issuances increased to 43, and the total market value reached 9896.23 million USD. The structure of market shares was more dispersed than in 2020: the Czech Republic accounted for 35.92% of issuance value, Hungary for 16.37%, Poland for 15.71%, and Slovenia for 12.6%. A higher number of active countries and a more balanced distribution of percentage shares resulted in a lower level of concentration compared to the previous year.
In 2022, the HHI increased to 0.298 reaching the highest value in the entire analyzed period and a level very close to the threshold of very high concentration. At the same time, the number of issuances increased to 59 (Table 4). However, the rise in issuance activity did not translate into value diversification—Hungary accounted for as much as 47.72% of the total issuance value, while the shares of other countries were significantly lower (Czech Republic—22.58%, Slovakia—10.01%). The dominance of a single market combined with a high volume of transactions clearly increased the level of concentration.
The HHI value in 2023 amounted to 0.208 indicating a return to the level observed in 2021 (Table 5). The number of issuances reached 37, while the total market value was 10,173.80 million USD. The largest share of issuance value was held by Poland (35.19%), followed by Slovenia (19.03%) and Romania (13.06%). Although the market structure still exhibited a clear dominance of a few countries, the distribution of shares was more balanced than in 2022, which was reflected in a lower level of concentration.
In 2024, the HHI value again amounted to 0.208 keeping the market in the high concentration range. According to Table 6, the number of issuances increased to 55, while the total issuance value reached 16,474.09 million USD. The percentage shares of the largest markets were relatively similar: Czech Republic—26.86%, Romania—23.46%, Hungary—22.61%, Poland—16.25%. The absence of a clear dominance of a single country and a more even distribution of issuance values among the four largest markets contributed to the stabilization of the concentration level.
The HHI increased to 0.234 in 2025, which still indicates a high level of concentration (Table 7). The number of issuances amounted to 39, while the total market value was the highest in the entire analyzed period at 16,795.32 million USD. The largest shares of issuance value were held by the Czech Republic (33.99%) and Poland (30.54%), indicating a renewed concentration of a significant portion of market value in two countries within the region.
Analysis of Table 2, Table 3, Table 4, Table 5, Table 6 and Table 7 indicates that changes in the number of issuances (from 12 in 2020 to 59 in 2022) and in the total market value were not clearly associated with a decline in concentration. In some years, an increase in issuance activity coincided with a growing share of a single dominant country (2022), whereas in other years a more balanced distribution of percentage shares among several major markets led to relative stability of the HHI (2023–2024). This implies that ESG market development in the CEE region was uneven, and the structure of issuance value remained persistently concentrated in a limited number of countries.

3.2. Concentration of ESG Bond Issuance by Instrument Type in CEE Countries in the Period 2020–2025

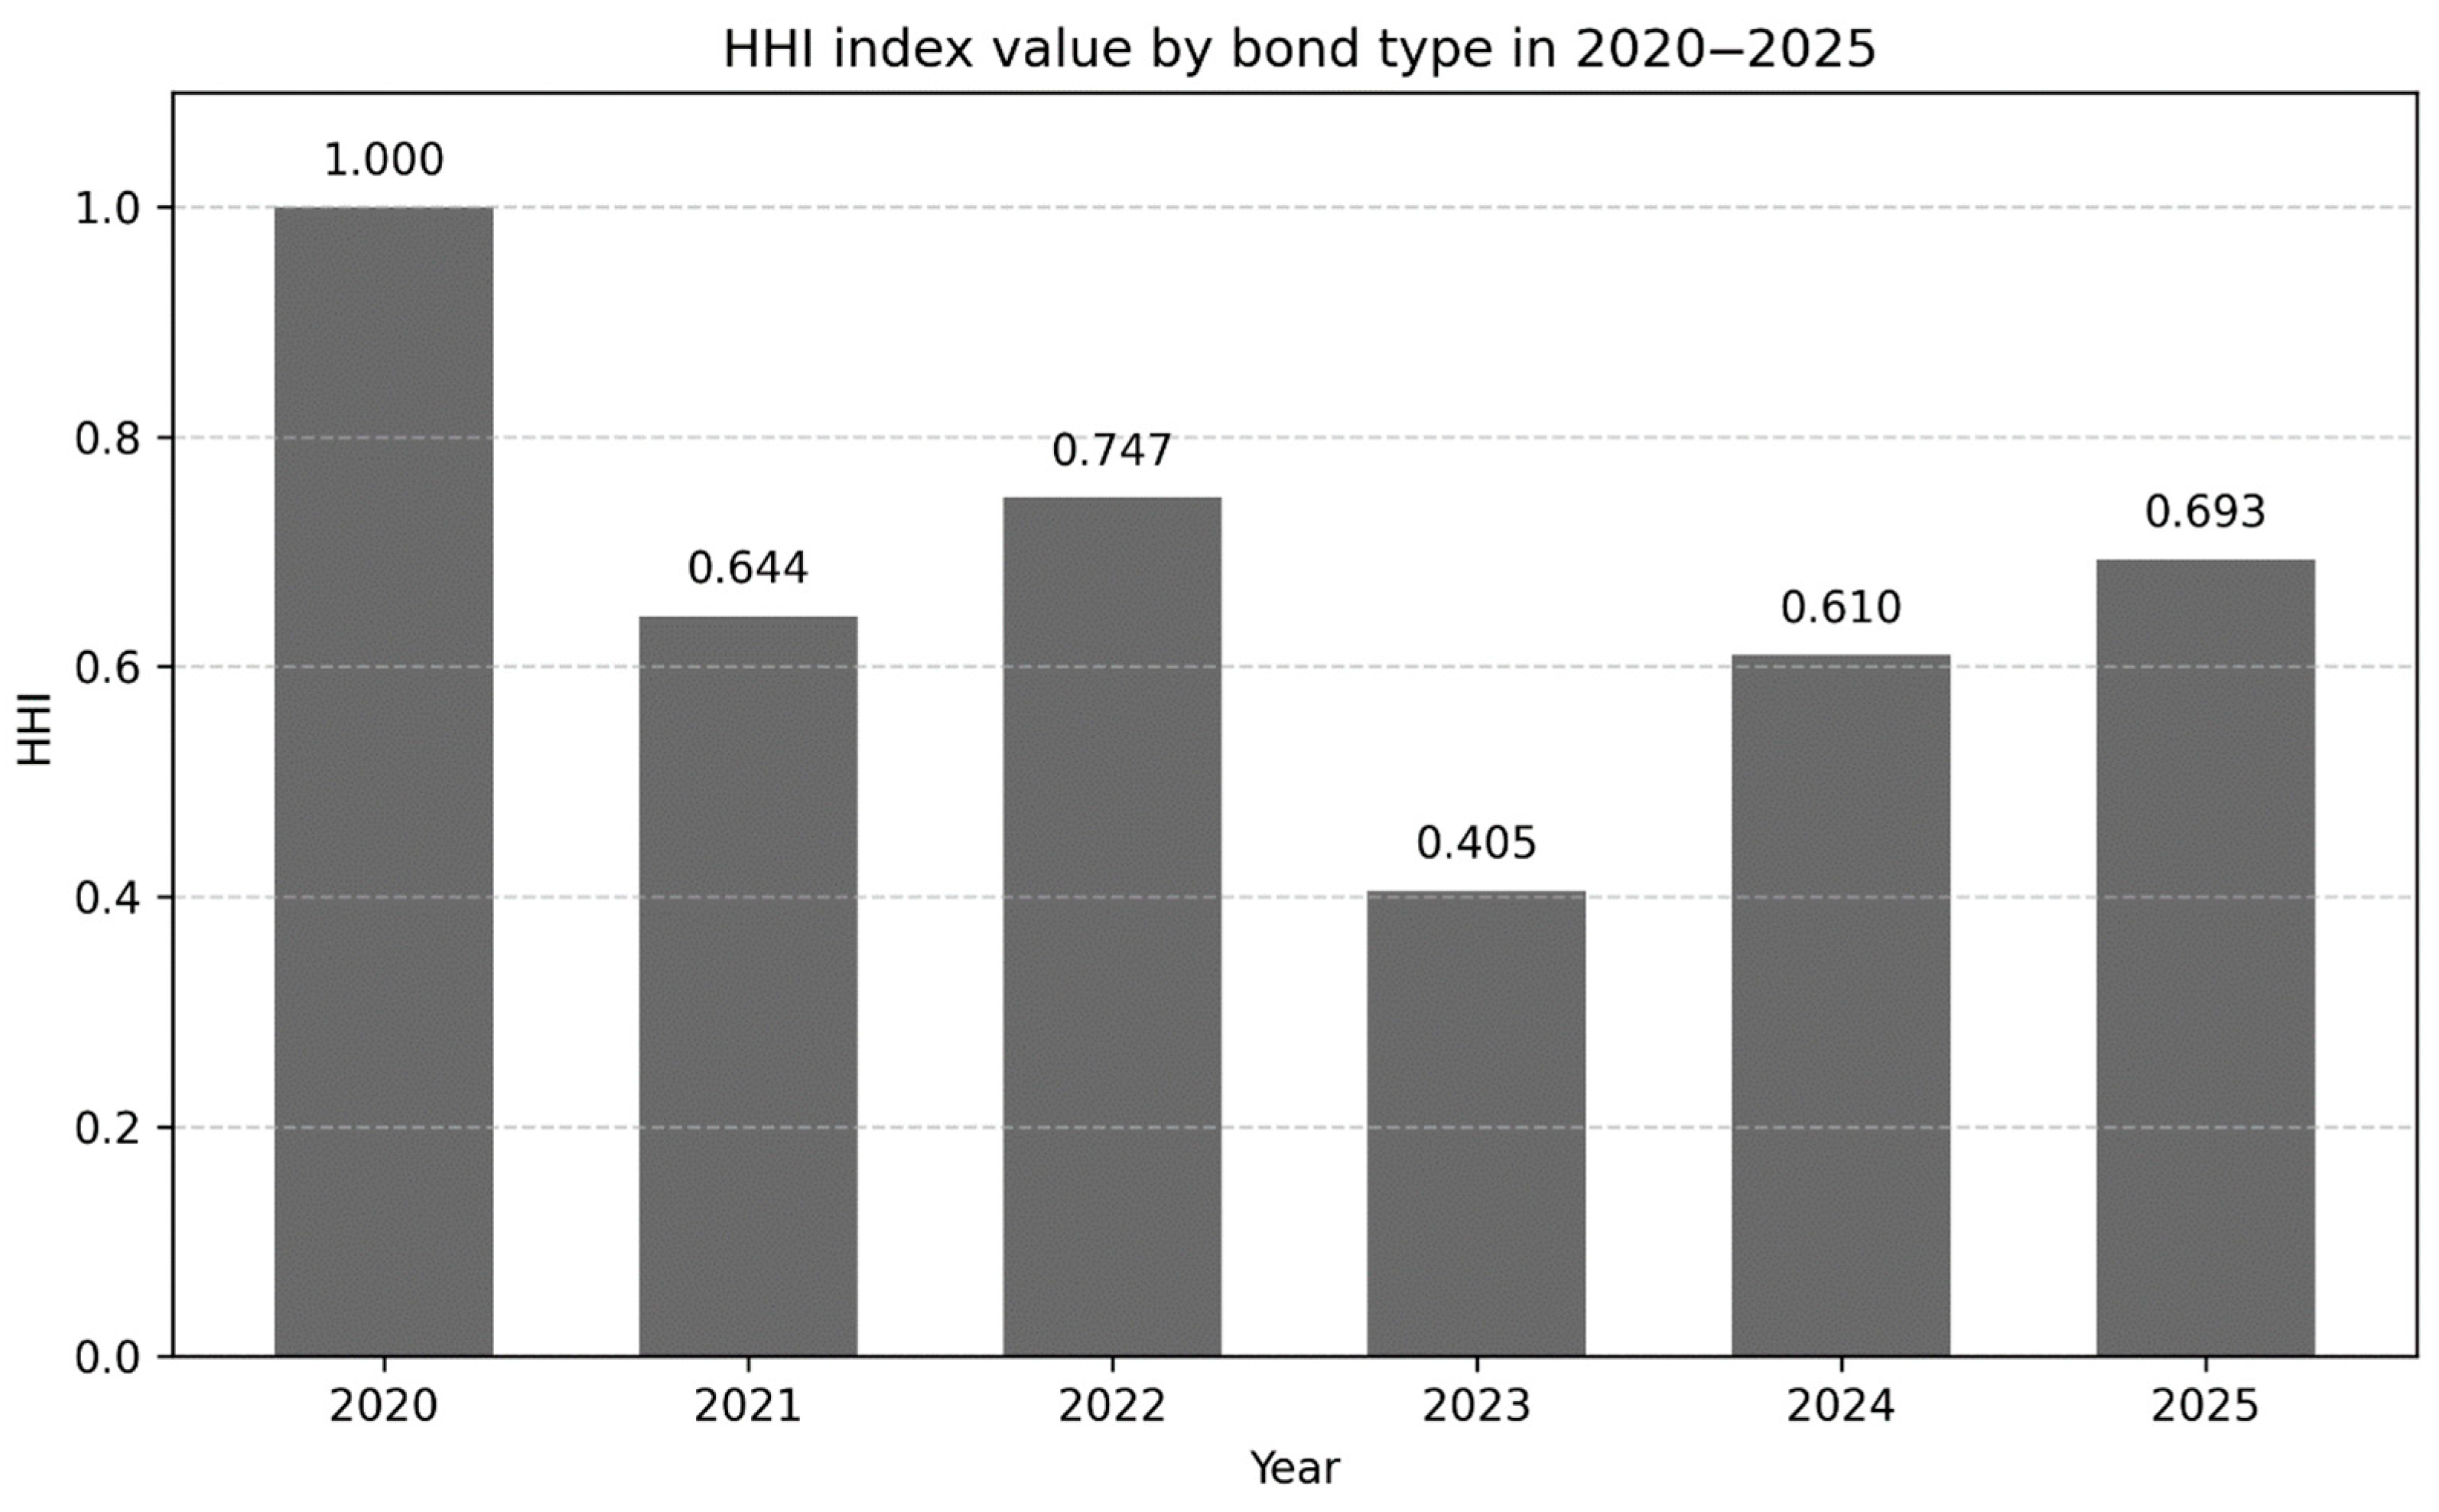
The second dimension of the analysis concerns the concentration of the ESG bond market in CEE countries by instrument type, i.e., green bonds, sustainability bonds, sustainability-linked bonds, and social bonds. The level of concentration was assessed using the Herfindahl–Hirschman Index, interpreted in accordance with the thresholds adopted in the earlier parts of the analysis. In the period 2020–2025, HHI values in this dimension ranged from 0.405 to 1.000 indicating that the market throughout the entire study period was characterized by very high or quasi-monopolistic product concentration. The highest level of concentration was observed in 2020 (HHI = 1.000), while the lowest occurred in 2023 (HHI = 0.405) (Figure 2). This implies that, despite the gradual expansion of the ESG instrument offering, the market structure remained strongly dominated by green bonds.
In 2020, the HHI value amounted to 1.000, indicating complete market concentration. As shown in Table 8, all issuances in this year were green bonds, with a total issuance value of 5395.81 million USD across 14 transactions. These issuances were primarily concentrated in Hungary (2237.83 million USD; six issuances), the Czech Republic (1234.38 million USD; two issuances), Romania (1034.14 million USD; two issuances), and Poland (781.31 million USD; three issuances) while Lithuania recorded one issuance with significantly lower values. No other types of instruments were present. This indicates that at the beginning of the analyzed period, the market had a completely homogeneous product structure and showed no signs of diversification.
In the following year (2021), concentration declined to an HHI level of 0.644; however, it still indicated a quasi-monopolistic market structure. According to the data presented in Table 9, green bonds maintained their dominant position, with a total value of 7714.47 million USD across 39 issuances. In addition, sustainability bonds emerged with a value of 1871.70 million USD and two issuances, as well as sustainability-linked bonds with a value of 310.06 million USD and two issuances, while social bonds were still absent from the market. The decline in the HHI relative to 2020 therefore resulted from the emergence of new instrument categories; however, their importance remained clearly secondary compared to green bonds, which continued to dominate both in terms of issuance volume and value.
In 2022, the HHI increased to 0.747 indicating a renewed intensification of product concentration. As shown in Table 10, green bonds reached a value of 7366.46 million USD across 52 issuances, while sustainability bonds accounted for only 438.84 million USD and four issuances, and sustainability-linked bonds for 783.53 million USD and three issuances. Social bonds did not appear in the market structure. This means that, despite the presence of three instrument types, the market shifted again toward a stronger dominance of green bonds.
In 2023, the number of issuances was as follows: green bonds—29, sustainability bonds—four, sustainability-linked bonds—three, and social bonds—one (Table 11). In value terms, green bonds reached 5862.47 million USD, sustainability bonds 2369.43 million USD, sustainability-linked bonds 1140.01 million USD, and social bonds 801.90 million USD. The HHI declined to 0.405, which still indicates very high concentration but simultaneously represents the lowest concentration level in the entire analyzed period. The decline in concentration resulted from a more balanced distribution of issuance values across instrument types and from the increasing importance of sustainability bonds, sustainability-linked bonds, and social bonds within the market structure. This indicates that 2023 was the period of the greatest product diversification in the ESG bond market in CEE countries.
In 2024, the number of issuances was as follows: green bonds increased to 46, sustainability bonds amounted to three, sustainability-linked bonds to four, and social bonds to two (Table 12). In value terms, green bonds reached 12,618.70 million USD, sustainability bonds 1822.52 million USD, sustainability-linked bonds 1690.40 million USD, and social bonds 342.46 million USD. The HHI rose to 0.610, indicating a quasi-monopolistic market structure. The increase in concentration resulted from the very strong dominance of green bonds in the issuance value structure, despite the presence of all four analyzed instrument types. This indicates that the increase in the number of issuances did not translate into a sustained reduction in product concentration, as the market remained clearly dominated by a single core segment.
In 2025, the HHI increased to 0.693, confirming the persistence of very strong product concentration in the market. According to the data presented in Table 13, green bonds reached 13,192.69 million USD across 32 issuances, indicating their clear dominance in both value and number of issuances. Significantly lower importance was observed for sustainability-linked bonds, with a value of 2286.00 million USD and two issuances, as well as social bonds, which amounted to 970.73 million USD across three issuances. The lowest share was recorded for sustainability bonds, which reached 345.90 million USD with one issuance. Despite the presence of all four analyzed instrument types, the market structure remained clearly dominated by green bonds. The high HHI value therefore indicates that, in the final phase of the analyzed period, there was no sustained shift toward a more balanced product structure, and market development continued to concentrate around a single core segment.
In summary, the analysis of ESG bond issuance concentration by instrument type indicates that the CEE market remained highly concentrated throughout the entire study period. The highest level of concentration occurred in 2020, when all issuance activity was based exclusively on green bonds, while the lowest was recorded in 2023, when the importance of sustainability bonds, sustainability-linked bonds, and social bonds increased. However, across the entire period, green bonds remained the core instrument driving market development, dominating both in terms of issuance volume and value. This implies that product diversification progressed more slowly than the overall growth in issuance activity, and that market development was largely selective in nature, concentrated around a single dominant segment.

3.3. Concentration of ESG Bond Issuance by Issuer Type in CEE Countries in the Period 2020–2025

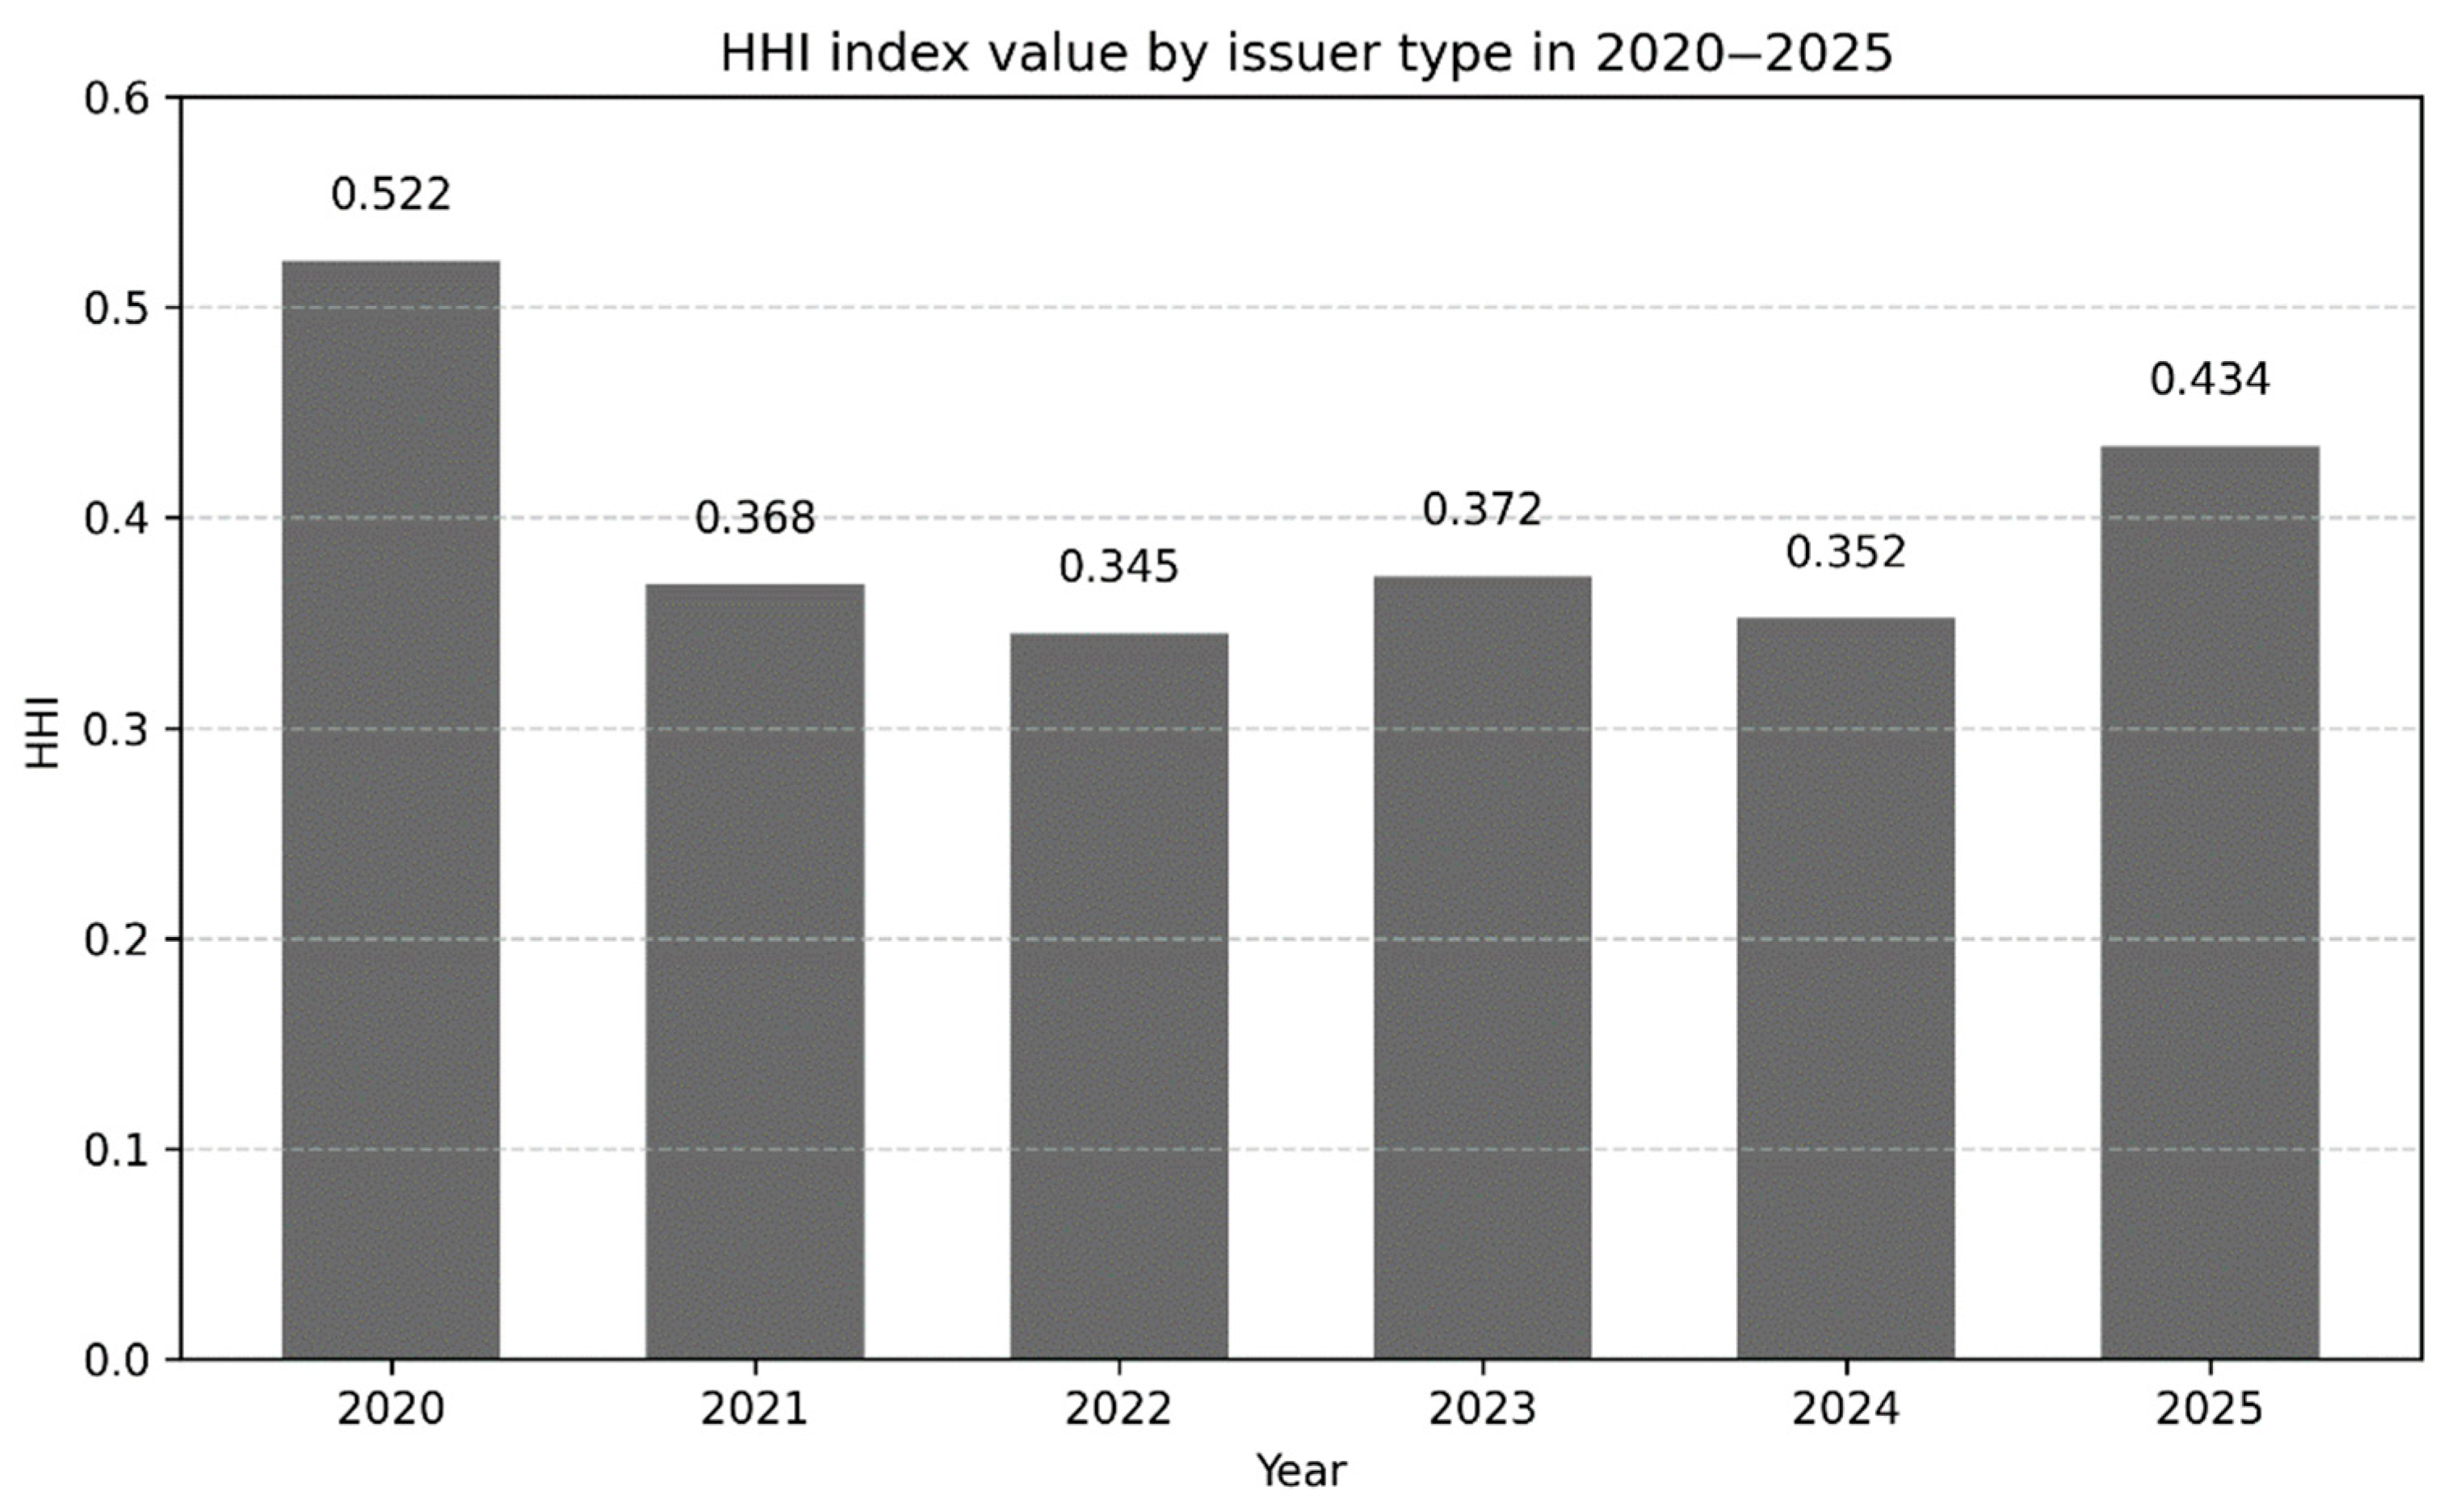
The third dimension of the analysis concerns the structure of the ESG bond market in CEE countries by issuer type, i.e., agencies, corporates, financial institutions, municipalities, sovereigns, and supranationals. The level of concentration was assessed using the Herfindahl–Hirschman Index, interpreted in accordance with the thresholds adopted in the earlier parts of the analysis. In the period 2020–2025, HHI values in this dimension ranged from 0.345 to 0.522, indicating that the market throughout the entire study period was characterized by very high to extremely high concentration by issuer type. The highest level of concentration was observed in 2020 (HHI = 0.522), while the lowest occurred in 2022 (HHI = 0.345) (Figure 3).
In 2020, ESG bond issuances were carried out exclusively by corporate and sovereign entities. As shown in Table 14, corporate issuers accounted for 3267.77 million USD and nine issuances, while sovereign issuers accounted for 2128.04 million USD and five issuances. The remaining issuer categories were not present in the market. An HHI value of 0.522 therefore indicates extremely high concentration, resulting from the restriction of the market structure to only two issuer segments. This implies that the market in that year was strongly polarized and practically devoid of institutional diversification.
The index value declined to 0.368 in 2021; however, it still indicated a very high level of concentration. As shown in Table 15, corporate issuers accounted for the largest issuance value, reaching 4805.62 million USD across 21 issuances. Financial institutions also played an important role, with issuances amounting to 2608.23 million USD across 13 issuances, followed by sovereign issuers with a value of 2482.38 million USD across nine issuances. The agency, municipal, and supranational categories remained absent. The decline in the HHI compared to 2020 indicates that the market structure became more balanced, although it was still concentrated around three main issuer segments.
In 2022, there was a further expansion of the market structure by issuer type. The data presented in Table 16 show that the highest issuance value was recorded by corporate entities (3494.40 million USD; 18 issuances) and sovereign issuers (2899.53 million USD; 25 issuances), while financial institutions also retained a significant role (2194.91 million USD; 16 issuances). The remaining issuer categories were not represented. An HHI value of 0.345 still indicates very high concentration; however, it was simultaneously the lowest value of the index in the entire analyzed period. This implies that the relative decrease in concentration resulted from a more balanced distribution of issuance values across the three main issuer segments.
In 2023, the market structure was more diversified than in previous years, yet it remained highly concentrated. As shown in Table 17, the highest issuance value was recorded by financial institutions (5076.44 million USD; 17 issuances), followed by corporates (3163.31 million USD; 10 issuances) and sovereign issuers (2899.53 million USD; nine issuances). Municipal issuances also appeared in the market, with a value of 331.64 million USD and one issuance, while the agency and supranational categories remained absent. An HHI value of 0.372 indicates very high concentration, suggesting that despite a formal broadening of the issuer spectrum, the vast majority of market activity remained concentrated within three dominant segments.
In 2024, concentration declined to an HHI level of 0.352 which still corresponds to very high concentration but indicates a slightly greater market dispersion than in 2023. According to the data presented in Table 18, the highest issuance value was recorded by corporate issuers (7309.75 million USD; 28 issuances), followed by sovereign issuers (4663.77 million USD; 14 issuances) and financial institutions (4500.57 million USD; 13 issuances). The remaining issuer categories were not present in the market. Compared to the earlier period, the market continued to rely on the same three main segments; however, their shares were more balanced, which is reflected in the slightly lower HHI value.
A renewed increase in concentration was observed in 2025. As shown in Table 19, corporate issuers held a dominant position, with a total issuance value of 9176.89 million USD across 24 issuances. Sovereign issuers also maintained a significant share (4630.63 million USD; six issuances), as did financial institutions (2105.40 million USD; eight issuances), while municipal issuances were marginal (22.40 million USD; one issuance). The agency and supranational categories remained unrepresented. An HHI value of 0.434 indicates extremely high concentration, primarily driven by the clear dominance of the corporate segment in the structure of issuance value.
In summary, the analysis of ESG bond issuance concentration by issuer type indicates that the CEE market remained highly concentrated throughout the entire study period. The highest level of concentration occurred in 2020, when the market structure was limited to two issuer categories, while the lowest was recorded in 2022, when the distribution of issuance value across corporates, sovereigns, and financial institutions was the most balanced. In subsequent years, despite a gradual expansion of the issuer spectrum, the market continued to concentrate around a few dominant segments, primarily corporates, sovereigns, and, in selected years, financial institutions. This implies that institutional diversification progressed more slowly than the overall growth in issuance activity.

3.4. Concentration of ESG Bond Issuance by Issuer Sector in CEE Countries in the Period 2020–2025

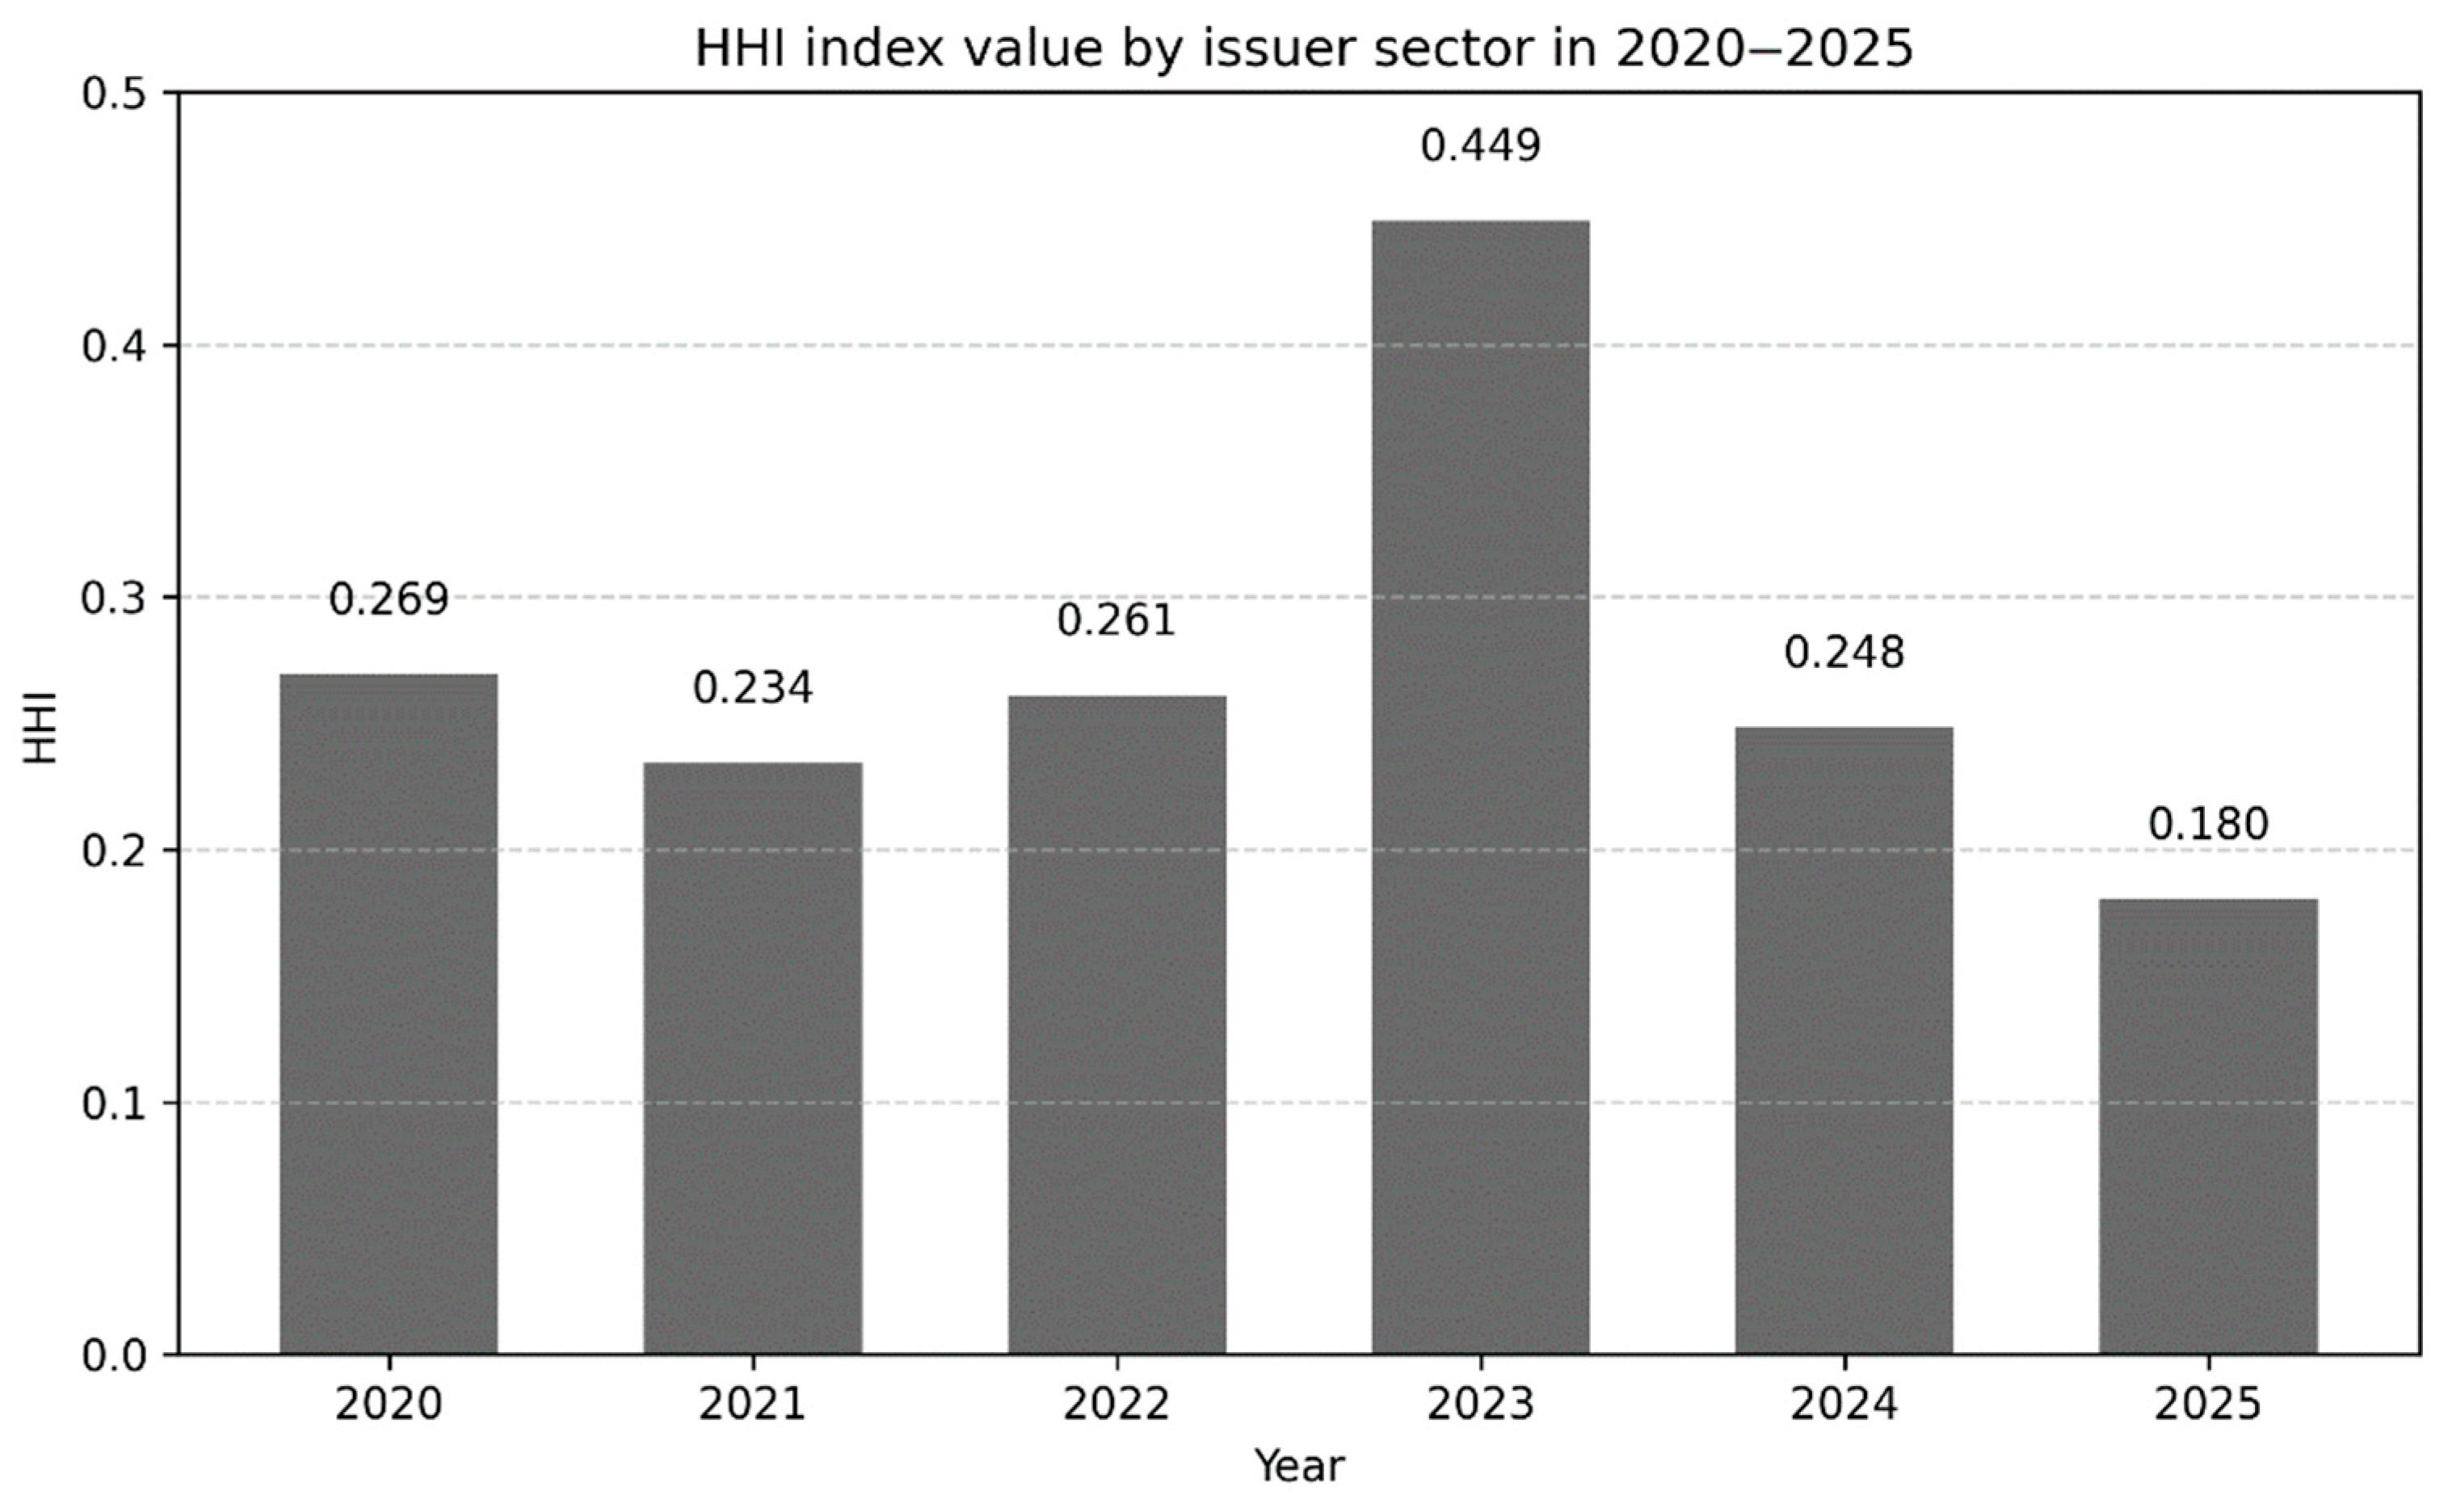
The analysis of ESG bond issuance concentration in Central and Eastern European countries in the period 2020–2025, by issuer sector, indicates that the market structure underwent noticeable changes; however, for most of the analyzed period it remained concentrated. The Herfindahl–Hirschman Index values (Figure 4) show that in 2020, 2022, and 2023 the market exhibited high concentration by issuer sector, whereas in 2021, 2024, and 2025 the market was moderately concentrated, with the lowest concentration level observed in 2025 across the entire study period.
An HHI value of 0.269 in 2020 indicates high market concentration. The data presented in Table 20 show that the issuance structure was based on a limited number of sectors, with the government sector playing the most important role, reaching 2128.04 million USD across five issuances. A high share was also recorded in the real estate—development and management sector (1252.08 million USD; four issuances) and logistics—warehousing (1234.38 million USD; two issuances), while the telecommunications (255.37 million USD; one issuance), utilities (252.60 million USD, one issuance) and oil and gas (273.35 million USD, one issuance) sectors represented a marginal share. This indicates that already at the beginning of the analyzed period the market was clearly dominated by a few sectors, and its structure remained weakly diversified.
In 2021, concentration declined to an HHI level of 0.234, indicating moderate concentration and a greater dispersion of issuances across sectors. According to the data presented in Table 21, the highest issuance values were recorded in the logistics—warehousing sector (2961.20 million USD; five issuances), the financial sector (2653.85 million USD; 15 issuances), and the government sector (2482.38 million USD; nine issuances). At the same time, other sectors also appeared in the market structure, including oil and gas, utilities, food and beverages, and mining/metal. The decline in the HHI compared to 2020 resulted from greater sectoral diversification, although the three main sectors still accounted for the majority of market value. The “other” category includes issuances in the following sectors: paper and packaging (one issuance in Hungary; issuance value of 33.05 million USD), energy—renewable (one issuance in Latvia; issuance value of 60.19 million USD), and automotive (one issuance in Romania; issuance value of 54.40 million USD).
In 2022, the index increased to 0.261, indicating a return to high concentration. As shown in Table 22, two sectors played a dominant role in this year: the financial sector, with issuances valued at 3003.79 million USD across 22 issuances, and the government sector, with a value of 2899.53 million USD across 25 issuances. The remaining sectors were significantly smaller in scale, including energy—non-renewable (908.53 million USD; three issuances), logistics—warehousing (793.67 million USD; 1 issuance), and public transportation (486.80 million USD; one issuance). The resulting HHI value therefore indicates that, despite the presence of several sectors, the market was effectively dominated by two main segments in terms of both issuance volume and total value. The “other” sector includes one issuance in Croatia (other sector, issuance value of 40.70 million USD) and one issuance in Hungary (food and beverages sector, issuance value of 38.04 million USD).
The highest level of concentration was recorded in 2023, when the HHI reached a value of 0.449. This indicates very high concentration and a clear dominance of a single sector. The data presented in Table 23 show unequivocally that this was the financial sector, with a total issuance value of 6440.80 million USD across 20 issuances. By comparison, the government sector reached 1934.05 million USD and 10 issuances, while the remaining sectors played only a supplementary role: telecommunications (791.87 million USD; 1 issuance), utilities (750.00 million USD; 1 issuance), real estate—development and management (186.88 million USD; 3 issuances), energy—renewable (53.69 million USD; 1 issuance), and oil and gas (16.50 million USD; 1 issuance in Poland). This high index value confirms that in 2023 the market structure was strongly asymmetric, with the financial sector serving as the primary pillar of ESG bond issuance in CEE countries.
In 2024, concentration declined to an HHI level of 0.248, indicating moderate market concentration. As shown in Table 24, the dominant position was still held by the financial sector (5832.93 million USD; 16 issuances) and the government sector (4663.77 million USD; 14 issuances), although the importance of other sectors increased significantly, particularly energy—non-renewable (2722.58 million USD; five issuances), logistics—warehousing (1419.88 million USD; three issuances), and real estate—development and management (1377.89 million USD; 12 issuances). This indicates that, despite sustained high activity in the two largest sectors, the market structure became more diversified than in the previous year, which is reflected in the lower HHI value. The “other” sector includes one issuance each in the following countries: Croatia in the health sector (63.05 million USD), Slovakia in the mining/metal sector (32.80 million USD), and Romania in the automotive sector (31.46 million USD).
The lowest level of concentration in the entire analyzed period occurred in 2025, when the index value reached 0.180. This result indicates the highest degree of sectoral diversification across all analyzed years. As shown in Table 25, although the highest issuance value was still recorded in the government sector (4653.03 million USD; seven issuances), significant importance was also held by the financial sector (3031.17 million USD; 10 issuances), utilities (2149.19 million USD; four issuances), logistics—warehousing (1830.64 million USD; six issuances), energy—non-renewable (1371.14 million USD; two issuances), and real estate—development and management (1251.27 million USD; five issuances). In addition, the market structure included the energy—renewable, food and beverages, oil and gas, and telecommunications sectors. This distribution of issuance volume and value across a larger number of sectors confirms that in 2025 the market reached its highest level of maturity in terms of sectoral diversification.

4. Discussion

Despite the dynamic growth of the ESG bond market in Central and Eastern European countries, its structure remains highly concentrated. The obtained results indicate that issuance expansion takes place within existing structures, despite a partial broadening of the issuer base. This finding provides an important contribution to the literature, which is largely based on the experience of developed markets [2,5,14].
In the geographical dimension, the sustained level of concentration (HHI 0.208–0.298) indicates the dominance of a limited group of countries, alongside variability in their shares over time. This finding is consistent with the observations of [8,9], who identify Poland, the Czech Republic and Hungary as key issuers in the region. Empirical data also point to the significant role of Romania in selected years. In contrast to the findings of [5,6] regarding the dominance of Western European countries, no single stable leader has emerged in the CEE region; instead, a pattern of rotational dominance among several major issuers can be observed. This pattern suggests that concentration is regional in nature but is not associated with a persistent advantage of a single economy.
In the product dimension, the obtained results indicate a significantly higher level of concentration than that observed globally. The complete dominance of green bonds in 2020 (HHI = 1.000) and the persistently high concentration in subsequent years deviate from the findings of [12], which report approximately a 50% share of this segment in the global market. In the analyzed countries, the results point to an early stage of market development in the CEE region. The relative decline in concentration observed in 2023 (HHI = 0.405) is consistent with the trend identified by [13]; however its lack of persistence suggests a different development dynamic in the region. Previous studies on CEE indicated the marginal role of social and sustainability bonds [3,16], whereas the obtained results confirm their presence, albeit with a limited share. This indicates that the market is entering a phase of instrument diversification, although this process has not yet led to a structural transformation.
The analysis by issuer type indicates persistently high concentration (HHI 0.345–0.522), with a market structure that deviates from the pattern observed in developed markets. The dominant role of corporate issuers, described by [19,21], is in the CEE region shared with sovereign issuers. These findings are also confirmed by [24]. At the same time, the limited presence of supranational issuers during the analyzed period, despite their important role in earlier stages of market development highlighted by [20], may suggest the existence of structural barriers. The results indicate a development model based on domestic public entities and large corporations, with a limited involvement of international institutions and municipalities.
In the sectoral dimension, the lack of a stable trend in concentration changes indicates that the process of market diversification is not systematic and proceeds in a rather irregular manner. The issuance structure remains broadly consistent with the pattern identified by [25,26], where the financial, energy, and real estate sectors dominate. At the same time, fluctuations in HHI levels over consecutive years suggest that issuance activity is episodic and depends on the implementation of specific investment projects. In contrast to [14], who identify a gradual sectoral diversification in developed markets, the CEE region exhibits a more limited and irregular pattern of this process.
Particularly important is the absence of a stable relationship between the growth in issuance value and a decline in concentration. Although a decrease in concentration is observed in the product dimension (by issuer type) over the period 2020–2023, it is not sustained in subsequent years. This finding does not confirm the conclusions of [2,13], who point to a link between the development of the ESG market and its progressive diversification. In the case of the CEE region, market growth occurs within existing structures, suggesting a strong dependence on the activity of a limited group of issuers and dominant instrument categories.
The obtained results therefore indicate a different mechanism of ESG bond market development in CEE countries, in which growth in scale does not automatically lead to a reduction in concentration. The observed pattern may be interpreted as a feature of an early stage of market development; however, its persistence in subsequent years suggests that the diversification process faces structural barriers that are not present to the same extent in developed markets.

5. Conclusions

The conducted analysis allows for the formulation of several key conclusions regarding the structure and dynamics of the ESG bond market in CEE countries in the period 2020–2025. First, the ESG bond market in CEE countries was characterized by a persistent and relatively high level of concentration in the geographical dimension. HHI values throughout the entire period remained within the range indicating high concentration, and issuance activity was concentrated in a limited number of countries. The dominant role was played primarily by the Czech Republic, Poland, and Hungary, although their relative importance changed over time. The results indicate that in 2020–2025, the increase in the number of issuances and in total issuance value did not automatically lead to market diversification and allow for the positive verification of hypothesis H1. The market therefore developed in an uneven manner and was driven by the activity of a small number of regional leaders. Second, the product-level analysis revealed a very high level of concentration, often reaching quasi-monopolistic levels. Throughout the entire analyzed period, green bonds remained the dominant instrument and the core pillar of the ESG market in the region. Despite the emergence of other instruments, such as sustainability bonds, sustainability-linked bonds, and social bonds, their share remained limited and unstable over time. These findings confirm hypothesis H2, indicating that green bonds constitute the most concentrated and dominant segment of the ESG market in CEE. Third, the analysis by issuer type shows very high concentration, with a dominant role played by corporate and sovereign issuers. In the initial period, public sector activity was particularly important, while in subsequent years the importance of the private sector increased, especially financial institutions and large corporations. Nevertheless, the market remained concentrated around a limited number of issuer types. The obtained results allow for the positive verification of hypothesis H3, indicating that corporate and sovereign issuers play the key role in the CEE ESG bond market. Fourth, the sectoral analysis indicates that ESG bond issuances were concentrated in selected economic sectors such as financial services, energy, real estate, and infrastructure. This structure remained relatively stable over time. The results suggest that market development was not even but was linked to specific areas of economic activity. Contrary to hypothesis H4, it cannot be unequivocally stated that market development followed a linear path; observed changes were rather stepwise in nature and depended on the activity of individual large issuances as well as macroeconomic conditions.
These findings demonstrate that the ESG bond market in CEE countries is still in a development phase, characterized by high concentration across geographical, product, and sectoral dimensions. Despite dynamic growth in issuance value and a gradual broadening of market structure, no lasting diversification of its core segments has been achieved. This implies that further market development will largely depend on an increase in the number of active issuers, an expansion in the range of financial instruments used, and greater participation from countries that have so far remained marginal. The results also point to important implications for public policy and market practice. A high level of concentration may limit market competitiveness and its resilience to shocks; therefore, regulatory efforts should focus on supporting diversification and reducing barriers to entry for new issuers. At the same time, for investors, this implies the need to treat concentration as a significant portfolio risk factor.
The findings of this study should be interpreted in light of several limitations. It should be noted that the analysis is based on the aggregated value of bond issuance across the respective categories rather than on the classification of individual issuances according to their size. Consequently, the study does not distinguish between small, occasional issuances and large benchmark issuances. However, since the HHI was calculated based on issuance values rather than solely on the number of issuances, the impact of small issuances on the concentration results is limited and proportional to their share in the total market value. Therefore, the findings should be interpreted as a measure of the concentration of issuance value rather than as a comprehensive analysis of the distribution of individual issuance sizes.
The data used in this study were obtained from Environmental Finance Data (EFData), a specialized database covering labelled sustainable bond issuances. Although the database provides broad market coverage, the findings should be interpreted as relating to issuances that are publicly identifiable as ESG. Consequently, the possibility that some issuances were not captured cannot be entirely excluded. This limitation is particularly relevant for 2025, as the data for the final year included in the analysis may still have been subject to ongoing completion and revision at the time of data collection.
The scope of this study did not explicitly include perspectives related to carbon emission markets, which could provide additional context for discussing the regional ESG debt market. Likewise, differences in public policies supporting sustainable finance across Central and Eastern European countries were beyond the scope of the analysis. As these factors may influence the development of ESG bond markets, they represent valuable directions for future research.
Furthermore, the conducted study reveals additional research gaps, particularly regarding the detailed structure of the use of proceeds and the sub-sectoral analysis of projects financed by ESG bonds. Addressing these issues may contribute to a more comprehensive understanding of the mechanisms driving the development of sustainable financial markets in the CEE region.


Author Contributions

Conceptualization, D.R., B.P., M.C., M.M. and J.C.; Methodology, D.R.; Software, M.M. and D.R.; Validation, D.R., B.P., M.C., M.M. and J.C.; Formal analysis, D.R.; Investigation, D.R., B.P., M.C., M.M. and J.C.; Resources, M.M.; Data curation, D.R.; Writing—original draft preparation, B.P., D.R. and M.C.; Writing—review and editing, D.R., B.P., M.C., M.M. and J.C.; Visualization, D.R.; Supervision, B.P.; Project administration, M.C.; Funding acquisition, D.R., B.P., M.C., M.M. and J.C. All authors have read and agreed to the published version of the manuscript.

Funding

This work was funded by the Minister of Science and Higher Education under the Regional Initiative of Excellence (RID) programme.

Institutional Review Board Statement

Not applicable.

Informed Consent Statement

Not applicable.

Data Availability Statement

The datasets presented in this article are not readily available due to technical and financial limitations.

Conflicts of Interest

The authors declare no conflicts of interest.

References

  1. CBI. Sustainable Debt Global State of the Market 2025. Available online: https://www.climatebonds.net/data-insights/publications/sustainable-debt-global-state-market-2025 (accessed on 17 March 2026).
  2. de Mariz, F. The Promise of Sustainable Finance: Lessons From Brazil. Georget. J. Int. Aff. 2022, 23, 185–190. [Google Scholar] [CrossRef]
  3. Kosztowniak, A. Global and European trends in the sustainable bond markets. Cent. Eur. Rev. Econ. Financ. 2023, 45, 49–65. [Google Scholar] [CrossRef]
  4. Mutarindwa, S.; Schäfer, D.; Stephan, A. Certification against greenwashing in nascent bond markets: Lessons from African ESG bonds. Eurasian Econ. Rev. 2024, 14, 149–173. [Google Scholar] [CrossRef]
  5. Dan, A.; Tiron-Tudor, A. The Determinants of Green Bond Issuance in the European Union. J. Risk Financ. Manag. 2021, 14, 446. [Google Scholar] [CrossRef]
  6. Cicchiello, A.F.; Cotugno, M.; Monferrà, S.; Perdichizzi, S. Which are the factors influencing green bonds issuance? Evidence from the European bonds market. Fin. Res. Lett. 2022, 50, 103190. [Google Scholar] [CrossRef]
  7. Regulation (EU) 2020/852 of the European Parliament and of the Council of 18 June 2020 on the Establishment of a Framework to Facilitate Sustainable Investment, and Amending Regulation (EU) 2019/2088. Available online: https://eur-lex.europa.eu/eli/reg/2020/852/oj/eng (accessed on 17 March 2026).
  8. Lewandowski, W.; Smoleńska, A. Member States Sovereign Green Bond Issuance and the Development of Local Green Bond Markets in the EU. In Green Bonds: An European Endevour; Ramos Muñoz, D., Smoleńska, A., Eds.; Springer: Cham, Switzerland, 2023. [Google Scholar] [CrossRef]
  9. Czech, M.; Hadaś-Dyduch, M.; Puszer, B. Effectiveness of Green Bonds in Selected CEE Countries: Analysis of Similarities. Risks 2023, 11, 214. [Google Scholar] [CrossRef]
  10. Kiertowicz, S.; Węgrzyn, P.; Zaremba-Janukowicz, S. Finansowanie Zrównoważonego Rozwoju—Podstawowe Zagadnienia i Aspekty Regulacyjne; Urząd Komisji Nadzoru Finansowego: Warszawa, Poland, 2025. [Google Scholar]
  11. ICMA. The Principles&Related Guidance. 2025. Available online: https://www.icmagroup.org/sustainable-finance/the-principles-guidelines-and-handbooks/ (accessed on 10 April 2026).
  12. Dembele, F.; Schwarz, R.; Horrocks, P. Scaling up Green, Social, Sustainability and Sustainability-linked Bond Issuances in Developing Countries; OECD Development Perspectives; OECD Publishing: Paris, France, 2021. [Google Scholar] [CrossRef]
  13. Machado, C.H.; Sousa, M.; Branco, M.C. Sustainability-Linked Bonds Research: A Bibliometric and Content Analysis Review. Int. J. Financial Stud. 2025, 13, 62. [Google Scholar] [CrossRef]
  14. Becker, A.; Fatica, S.; Rancan, M. Not only green: Sustainability and debt capital markets. J. Int. Money Financ. 2025, 154, 103319. [Google Scholar] [CrossRef] [PubMed]
  15. Ibrić, M.; Kozarević, E.; Mešković, A. The Rise of Green Bonds: Global Context and European Insights. J. Econ. Law Soc. 2024, 1, 55–71. [Google Scholar] [CrossRef]
  16. Sobik, B. Green bonds–financial innovation for sustainability financing: The case of the Polish green bonds market and their development barriers. Cent. Eur. Econ. J. 2023, 10, 287–303. [Google Scholar] [CrossRef]
  17. Grabowski, M.; Kotecki, L. Zielone obligacje w Polsce. Przewodnik dla Emitenta; Centrum Myśli Strategicznych: Warszawa, Poland, 2020. [Google Scholar]
  18. Versal, N.; Sholoiko, A. Green bonds of supranational financial institutions: On the road to sustainable development. Invest. Manag. Financ. Innov. 2022, 19, 91–105. [Google Scholar] [CrossRef] [PubMed]
  19. Lindner, P.; Chung, K. Sovereign ESG Bond Issuance: A Guidance Note for Sovereign Debt Managers; IMF Working Papers 2023/058; International Monetary Fund: Washington, DC, USA, 2023. [Google Scholar] [CrossRef]
  20. Liberati, D.; Marinelli, G. Everything You Always Wanted to Know about Green Bonds (But Were Afraid to Ask); Occasional Papers 654; Bank of Italy: Rome, Italy, 2021. [Google Scholar] [CrossRef]
  21. Mathew, S.; Sivaprasad, S. An empirical analysis of corporate sustainability bonds. Bus. Strat. Environ. 2024, 33, 3299–3316. [Google Scholar] [CrossRef]
  22. Cheng, G.; Ehlers, T.; Packer, F.; Xiao, Y. Sovereign Green Bonds: A Catalyst for Sustainable Debt Market Development? IMF Working Papers 2014/120; Bank for International Settlements: Basel, Switzerland, 2024. [Google Scholar] [CrossRef]
  23. Darmouni, O.; Papoutsi, M. The Rise of Bond Financing in Europe: Five Facts about New and Small Issuers; European Central Bank: Frankfurt am Main, Germany, 2023. [Google Scholar] [CrossRef]
  24. Hadaś-Dyduch, M.; Puszer, B.; Czech, M.; Cichy, J. Green Bonds as an Instrument for Financing Ecological Investments in the V4 Countries. Sustainability 2022, 14, 12188. [Google Scholar] [CrossRef]
  25. Frydrych, S. Objectives of the ESG bonds issues. Ekon. i Prawo Econ. Law 2023, 22, 517–529. [Google Scholar] [CrossRef]
  26. Ballester, L.; González-Urteaga, A.; Shen, L. Green bond issuance and credit risk: International evidence. J. Int. Financ. Mark. Inst. Money 2024, 94, 102013. [Google Scholar] [CrossRef]
  27. Becsi, A.; Varga, M.; Loga, M.; Kolozsi, P.P. First steps—The nascent green bond ecosystem in Hungary. Cogn. Sustain. 2022, 1, 34–43. [Google Scholar] [CrossRef]
  28. Climate Action Network Europe: The Hidden Costs of Europe’s Decrepit Buildings. 2021. Available online: https://caneurope.org/publications/decrepit-renovated-buildings-europe/ (accessed on 22 March 2026).
  29. Kozma, D.E.; Veres, T.; Torok, L. Divergent Paths, Shared Goals: Green Finance Development in the V4 Countries. Eurasia Proc. Educ. Soc. Sci. 2025, 44, 98–111. [Google Scholar] [CrossRef]
  30. Bikker, J.A.; Haaf, K. Competition, concentration and their relationship: An empirical analysis of the banking industry. J. Bank. Financ. 2002, 26, 2191–2214. [Google Scholar] [CrossRef]
  31. OECD. Market Concentration; OECD Publishing: Paris, France, 2018; Available online: https://www.oecd.org/en/publications/market-concentration_7231c298-en.html (accessed on 10 April 2026).
  32. Rhoades, S.A. The Herfindahl–Hirschman Index. Fed. Reserve Bull. 1993, 79, 188–189. [Google Scholar]
  33. Herfindahl, O.C. Concentration in the U.S. Steel Industry. Ph.D. Dissertation, Columbia University, New York, NY, USA, 1950. [Google Scholar]
  34. Hirschman, A.O. The paternity of an index. Am. Econ. Rev. 1964, 54, 761–762. [Google Scholar]
  35. Horizontal Merger Guidelines; U.S. Department of Justice & Federal Trade Commission: Washington, DC, USA, 2010. Available online: https://www.justice.gov/atr/horizontal-merger-guidelines-08192010 (accessed on 10 April 2026).
  36. Merger Guidelines; U.S. Department of Justice & Federal Trade Commission: Washington, DC, USA, 2023. Available online: https://www.justice.gov/atr/merger-guidelines (accessed on 10 April 2026).
  37. Scherer, F.M.; Ross, D. Industrial Market Structure and Economic Performance, 3rd ed.; Houghton Mifflin: Boston, MA, USA, 1990. [Google Scholar]
Figure 1. HHI values for the issuance value of ESG bonds in CEE countries in the period 2020–2025. Source: Own calculation based on data from https://efdata.org/.
Sustainability 18 07113 g001
Figure 2. HHI values for ESG bond issuance value by instrument type in CEE countries in the period 2020–2025. Source: Own calculation based on data from https://efdata.org/.
Sustainability 18 07113 g002
Figure 3. HHI values for ESG bond issuance value by issuer type in CEE countries in the period 2020–2025. Source: Own calculation based on data from https://efdata.org/.
Sustainability 18 07113 g003
Figure 4. HHI values for ESG bond issuance value by issuer sector in CEE countries in the period 2020–2025. Source: Own calculation based on data from https://efdata.org/.
Sustainability 18 07113 g004
Table 1. Interpretation of HHI values.
HHIInterpretation
0.00 ≤ HHI < 0.10low concentration (dispersed market)
0.10 ≤ HHI < 0.20moderate concentration
0.20 ≤ HHI < 0.30high concentration
0.30 ≤ HHI < 0.40very high concentration (oligopoly)
0.40 ≤ HHI < 0.60extremely high concentration
HHI ≥ 0.60quasi-monopoly/monopoly
Source: Own elaboration based on [30,32,35,36,37].
Table 2. Number and value of ESG-related bond issuances in the CEE countries in 2020 (USD million).
CountryNumber of IssuancesValueShare (%)
Croatia00.000.00%
Czechia21234.3822.88%
Estonia00.000.00%
Hungary62237.8341.47%
Latvia00.000.00%
Lithuania1108.152.00%
Poland3781.3114.48%
Romania21034.1419.17%
Slovakia00.000.00%
Slovenia00.000.00%
Total145395.81100%
Source: Own calculation based on https://efdata.org/.
Table 3. Number and value of ESG-related bond issuances in the CEE countries in 2021 (USD million).
CountryNumber of IssuancesValueShare (%)
Croatia00.000.00%
Czechia63554.7635.92%
Estonia00.000.00%
Hungary201620.2816.37%
Latvia3853.948.63%
Lithuania139.500.40%
Poland41554.4915.71%
Romania5561.665.68%
Slovakia3518.205.24%
Slovenia11193.4012.06%
Total439896.23100%
Source: Own calculation based on https://efdata.org/.
Table 4. Number and value of ESG-related bond issuances in the CEE countries in 2022 (USD million).
CountryNumber of IssuancesValueShare (%)
Croatia2233.062.71%
Czechia31943.3022.58%
Estonia1165.701.93%
Hungary384106.1247.72%
Latvia1105.911.23%
Lithuania195.691.11%
Poland2584.796.80%
Romania5508.885.91%
Slovakia6861.0710.01%
Slovenia00.000.00%
Total598604.52100%
Source: Own calculation based on https://efdata.org/.
Table 5. Number and value of ESG-related bond issuances in the CEE countries in 2023 (USD million).
CountryNumber of IssuancesValueShare (%)
Croatia1331.643.26%
Czechia21085.6610.67%
Estonia00.000.00%
Hungary151205.0511.84%
Latvia153.690.53%
Lithuania114.120.14%
Poland93580.2235.19%
Romania31329.1913.06%
Slovakia2637.896.27%
Slovenia31936.3419.03%
Total3710,173.80100%
Source: Own calculation based on https://efdata.org/.
Table 6. Number and value of ESG-related bond issuances in the CEE countries in 2024 (USD million).
CountryNumber of IssuancesValueShare (%)
Croatia2497.843.02%
Czechia104425.5026.86%
Estonia2440.102.67%
Hungary143724.2022.61%
Latvia00.000.00%
Lithuania00.000.00%
Poland112676.6716.25%
Romania83865.0323.46%
Slovakia5448.992.73%
Slovenia3395.782.40%
Total5516,474.09100%
Source: own calculation based on https://efdata.org/.
Table 7. Number and value of ESG-related bond issuances in the CEE countries in 2025 (USD million).
CountryNumber of IssuancesValueShare (%)
Croatia00.000.00%
Czechia125708.9433.99%
Estonia00.000.00%
Hungary51339.597.98%
Latvia2484.792.89%
Lithuania1389.872.32%
Poland135129.1030.54%
Romania31519.979.05%
Slovakia1869.805.18%
Slovenia21353.268.06%
Total3916,795.32100%
Source: Own calculation based on https://efdata.org/.
Table 8. Value (USD million) and volume of ESG-related bond issuances by instrument type in the CEE countries in 2020.
Green BondSustainability BondSustainability-Linked BondSocial Bonds
CountryValueVolumeValueVolumeValueVolumeValueVolume
Croatia0.0000.0000.0000.000
Czechia1234.3820.0000.0000.000
Estonia0.0000.0000.0000.000
Hungary2237.8360.0000.0000.000
Latvia0.0000.0000.0000.000
Lithuania108.1510.0000.0000.000
Poland781.3130.0000.0000.000
Romania1034.1420.0000.0000.000
Slovakia0.0000.0000.0000.000
Slovenia0.0000.0000.0000.000
Total5395.81140.0000.0000.000
Source: own calculation based on https://efdata.org/.
Table 9. Value (USD million) and volume of ESG-related bond issuances by instrument type in the CEE countries in 2021.
Green BondSustainability BondSustainability-Linked BondSocial Bonds
CountryValueVolumeValueVolumeValueVolumeValueVolume
Croatia0.0000.0000.0000.000
Czechia3554.7660.0000.0000.000
Estonia0.0000.0000.0000.000
Hungary1620.28200.0000.0000.000
Latvia175.642678.3010.0000.000
Lithuania39.5010.0000.0000.000
Poland1298.8330.000255.6610.000
Romania507.2640.00054.4010.000
Slovakia518.2030.0000.0000.000
Slovenia0.0001193.4010.0000.000
Total7714.47391871.702310.0620.000
Source: Own calculation based on https://efdata.org/.
Table 10. Value (USD million) and volume of ESG-related bond issuances by instrument type in the CEE countries in 2022.
Green BondSustainability BondSustainability-Linked BondSocial Bonds
CountryValueVolumeValueVolumeValueVolumeValueVolume
Croatia0.000192.36140.7010.000
Czechia1280.4720.000662.8310.000
Estonia165.7010.0000.0000.000
Hungary4106.12380.0000.0000.000
Latvia105.9110.0000.0000.000
Lithuania0.0000.00080.0010.000
Poland584.7920.0000.0000.000
Romania262.402246.4830.0000.000
Slovakia861.0760.0000.0000.000
Slovenia0.0000.0000.0000.000
Total7366.4652438.844783.5330.000
Source: Own calculation based on https://efdata.org/.
Table 11. Value (USD million) and volume of ESG-related bond issuances by instrument type in the CEE countries in 2023.
Green BondSustainability BondSustainability-Linked BondSocial Bonds
CountryValueVolumeValueVolumeValueVolumeValueVolume
Croatia0.0000.000331.6410.000
Czechia1085.6620.0000.0000.000
Estonia0.0000.0000.0000.000
Hungary1205.05150.0000.0000.000
Latvia53.6910.0000.0000.000
Lithuania14.1210.0000.0000.000
Poland1539.315430.641808.372801.901
Romania780.842548.3510.0000.000
Slovakia637.8920.0000.0000.000
Slovenia545.9011390.4420.0000.000
Total5862.47292369.4341140.013801.901
Source: Own calculation based on https://efdata.org/.
Table 12. Value (USD million) and volume of ESG-related bond issuances by instrument type in the CEE countries in 2024.
Green BondSustainability BondSustainability-Linked BondSocial Bonds
CountryValueVolumeValueVolumeValueVolumeValueVolume
Croatia434.7910.00063.0510.000
Czechia2286.137543.4811595.8920.000
Estonia440.1020.0000.0000.000
Hungary3224.2013500.0010.0000.000
Latvia0.0000.0000.0000.000
Lithuania0.0000.0000.0000.000
Poland2676.67110.0000.0000.000
Romania3054.526779.04131.4610.000
Slovakia448.9950.0000.0000.000
Slovenia53.3210.0000.000342.462
Total12,618.70461822.5231690.404342.462
Source: Own calculation based on https://efdata.org/.
Table 13. Value (USD million) and volume of ESG-related bond issuances by instrument type in the CEE countries in 2025.
Green BondSustainability BondSustainability-Linked BondSocial Bonds
CountryValueVolumeValueVolumeValueVolumeValueVolume
Croatia0.0000.0000.0000.000
Czechia4079.4790.000860.001769.472
Estonia0.0000.0000.0000.000
Hungary1339.5950.0000.0000.000
Latvia484.7920.0000.0000.000
Lithuania389.8710.0000.0000.000
Poland4855.10120.000274.0010.000
Romania1174.072345.9010.0000.000
Slovakia869.8010.0000.0000.000
Slovenia0.0000.0001152.001201.261
Total13,192.6932345.9012286.003970.733
Source: Own calculation based on https://efdata.org/.
Table 14. Value (USD million) and volume of ESG-related bond issuances by issuer type in the CEE countries in 2020.
AgencyCorporateFinancial InstitutionMunicipalSovereignSupranational
CountryValueVolumeValueVolumeValueVolumeValueVolumeValueVolumeValueVolume
Croatia0.0000.0000.0000.0000.0000.000
Czechia0.0001234.3820.0000.0000.0000.000
Estonia0.0000.0000.0000.0000.0000.000
Hungary0.000217.9420.0000.0002019.8940.000
Latvia0.0000.0000.0000.0000.0000.000
Lithuania0.0000.0000.0000.000108.1510.000
Poland0.000781.3130.0000.0000.0000.000
Romania0.0001034.1420.0000.0000.0000.000
Slovakia0.0000.0000.0000.0000.0000.000
Slovenia0.0000.0000.0000.0000.0000.000
Total0.0003267.7790.0000.0002128.0450.000
Source: Own calculation based on https://efdata.org/.
Table 15. Value (USD million) and volume of ESG-related bond issuances by issuer type in the CEE countries in 2021.
AgencyCorporateFinancial InstitutionMunicipalSovereignSupranational
CountryValueVolumeValueVolumeValueVolumeValueVolumeValueVolumeValueVolume
Croatia0.0000.0000.0000.0000.0000.000
Czechia0.0002961.205593.5610.0000.0000.000
Estonia0.0000.0000.0000.0000.0000.000
Hungary0.000609.998399.6150.000610.6870.000
Latvia0.000175.6420.0000.000678.3010.000
Lithuania0.00039.5010.0000.0000.0000.000
Poland0.000963.843590.6510.0000.0000.000
Romania0.00055.452506.2130.0000.0000.000
Slovakia0.0000.000518.2030.0000.0000.000
Slovenia0.0000.0000.0000.0001193.4010.000
Total0.0004805.62212608.23130.0002482.3890.000
Source: Own calculation based on https://efdata.org/.
Table 16. Value (USD million) and volume of ESG-related bond issuances by issuer type in the CEE countries in 2022.
AgencyCorporateFinancial InstitutionMunicipalSovereignSupranational
CountryValueVolumeValueVolumeValueVolumeValueVolumeValueVolumeValueVolume
Croatia0.00040.701192.3610.0000.0000.000
Czechia0.0001943.3030.0000.0000.0000.000
Estonia0.000165.7010.0000.0000.0000.000
Hungary0.000592.815613.7880.0002899.53250.000
Latvia0.000105.9110.0000.0000.0000.000
Lithuania0.00080.0010.0000.0000.0000.000
Poland0.00057.101527.6910.0000.0000.000
Romania0.000508.8850.0000.0000.0000.000
Slovakia0.0000.000861.0760.0000.0000.000
Slovenia0.0000.0000.0000.0000.0000.000
Total0.0003494.40182194.91160.0002899.53250.000
Source: Own calculation based on https://efdata.org/.
Table 17. Value (USD million) and volume of ESG-related bond issuances by issuer type in the CEE countries in 2023.
AgencyCorporateFinancial InstitutionMunicipalSovereignSupranational
CountryValueVolumeValueVolumeValueVolumeValueVolumeValueVolumeValueVolume
Croatia0.0000000331.6410.0000.000
Czechia0.000001085.6620.0000.0000.000
Estonia0.00000000.0000.0000.000
Hungary0.000750.001243.0770.0002899.5370.000
Latvia0.00053.6910.0000.0000.0000.000
Lithuania0.00014.1210.0000.0000.0000.000
Poland0.0001797.1561783.0730.0000.0000.000
Romania0.000548.351780.8420.0000.0000.000
Slovakia0.0000.000637.8920.0000.0000.000
Slovenia0.0000.000545.910.0000.0020.000
Total0.0003163.31105076.4417331.6412899.5390.000
Source: own calculation based on https://efdata.org/.
Table 18. Value (USD million) and volume of ESG-related bond issuances by issuer type in the CEE countries in 2024.
AgencyCorporateFinancial InstitutionMunicipalSovereignSupranational
CountryValueVolumeValueVolumeValueVolumeValueVolumeValueVolumeValueVolume
Croatia0.00063.051434.7910.0000.0000.000
Czechia0.0003882.029543.4810.0000.0000.000
Estonia0.000440.1020.0000.0000.0000.000
Hungary0.000609.3821161.3040.0001953.5180.000
Latvia0.0000.0000.0000.0000.0000.000
Lithuania0.0000.0000.0000.0000.0000.000
Poland0.000731.8681944.8130.0000.0000.000
Romania0.0001497.2340.0000.0002367.8040.000
Slovakia0.00032.801416.1940.0000.0000.000
Slovenia0.00053.3210.0000.000342.4620.000
Total0.0007309.75284500.57130.0004663.77140.000
Source: Own calculation based on https://efdata.org/.
Table 19. Value (USD million) and volume of ESG-related bond issuances by issuer type in the CEE countries in 2025.
AgencyCorporateFinancial InstitutionMunicipalSovereignSupranational
CountryValueVolumeValueVolumeValueVolumeValueVolumeValueVolumeValueVolume
Croatia0.0000.0000.0000.0000.0000.000
Czechia0.0004079.4790.0000.000769.4720.000
Estonia0.0000.0000.0000.0000.0000.000
Hungary0.0000.000303.6940.0001035.9010.000
Latvia0.000462.4010.00022.4010.0000.000
Lithuania0.000389.8710.0000.0000.0000.000
Poland0.0001855.3981801.7140.0001472.0010.000
Romania0.0001519.9730.0000.0000.0000.000
Slovakia0.000869.8020.0000.0000.0000.000
Slovenia0.0000.0000.0000.0001353.2620.000
Total0.0009176.89242105.40822.4014630.6360.000
Source: Own calculation based on https://efdata.org/.
Table 20. Value (USD million) and volume of ESG-related bond issuances by issuer sector in the CEE countries in 2020.
GovernmentLogistics—WarehousingReal Estate—Development and ManagementTelecommunication
CountryValueVolumeValueVolumeValueVolumeValueVolume
Croatia0.0000.0000.0000.000
Czechia0.0001234.3820.0000.000
Estonia0.0000.0000.0000.000
Hungary2019.8940.000217.9420.000
Latvia0.0000.0000.0000.000
Lithuania108.1510.0000.0000.000
Poland0.0000.0000.000255.371
Romania0.0000.0001034.1420.000
Slovakia0.0000.0000.0000.000
Slovenia0.0000.0000.0000.000
Total2128.0451234.3821252.084255.371
UtilitiesOil and Gas
CountryValueVolumeValueVolume
Croatia0.0000.000
Czechia0.0000.000
Estonia0.0000.000
Hungary0.0000.001
Latvia0.0000.000
Lithuania0.0000.000
Poland252.601273.350
Romania0.0000.000
Slovakia0.0000.000
Slovenia0.0000.000
Total252.601273.351
Source: Own calculation based on https://efdata.org/.
Table 21. Value (USD million) and volume of ESG-related bond issuances by issuer sector in the CEE countries in 2021.
FinancialGovernmentLogistics—WarehousingReal Estate—Development and Management
CountryValueVolumeValueVolumeValueVolumeValueVolume
Croatia0.0000.0000.0000.000
Czechia593.5610.0002961.2050.000
Estonia0.0000.0000.0000.000
Hungary405.736610.6870.000352.175
Latvia0.000678.3010.0000.000
Lithuania39.5010.0000.0000.000
Poland590.6510.0000.0000.000
Romania506.2130.0000.0000.000
Slovakia518.2030.0000.0000.000
Slovenia0.00 1193.4010.0000.000
Total2653.85152482.3892961.205352.175
UtilitiesFood and BeveragesMining/MetalOil and Gas
CountryValueVolumeValueVolumeValueVolumeValueVolume
Croatia0.0000.0000.0000.000
Czechia0.0000.0000.0000.000
Estonia0.0000.0000.0000.000
Hungary0.000218.6610.0000.000
Latvia115.4510.0000.0000.000
Lithuania0.0000.0000.0000.000
Poland0.0000.000100.881862.961
Romania0.0000.0000.0000.000
Slovakia0.0000.0000.0000.000
Slovenia0.0000.0000.0000.000
Total115.451218.661100.881862.961
Other
CountryValueVolume
Croatia0.000
Czechia0.000
Estonia0.000
Hungary33.051
Latvia60.191
Lithuania0.000
Poland0.000
Romania54.401
Slovakia0.000
Slovenia0.000
Total147.643
Source: Own calculation based on https://efdata.org/.
Table 22. Value (USD million) and volume of ESG-related bond issuances by issuer sector in the CEE countries in 2022.
FinancialGovernmentLogistics—WarehousingReal Estate—Development and Management
CountryValueVolumeValueVolumeValueVolumeValueVolume
Croatia192.3610.00000.0000.000
Czechia0.0000.0000793.6710.000
Estonia0.0000.00000.0000.000
Hungary913.7892899.53250.00057.832
Latvia0.0000.0000.0000.000
Lithuania0.0000.0000.0000.000
Poland527.6910.0000.0000.000
Romania508.8850.0000.0000.000
Slovakia861.0760.0000.0000.000
Slovenia0.0000.0000.0000.000
Total3003.79222899.5325793.67157.832
Energy—Non-RenewableEnergy—RenewablePublic TransportationOther
CountryValueVolumeValueVolumeValueVolumeValueVolume
Croatia0.0000.0000.00040.701
Czechia662.8310.000486.8010.001
Estonia165.7010.0000.0000.000
Hungary0.000196.9410.00038.041
Latvia0.000105.9110.0000.000
Lithuania80.0010.0000.0000.000
Poland0.00057.1010.0000.000
Romania0.0000.0000.0000.000
Slovakia0.0000.0000.0000.000
Slovenia0.0000.0000.0000.000
Total908.533359.953486.80178.743
Source: Own calculation based on https://efdata.org/.
Table 23. Value (USD million) and volume of ESG-related bond issuances by issuer sector in the CEE countries in 2023.
FinancialGovernmentReal Estate—Development and ManagementEnergy—Renewable
CountryValueVolumeValueVolumeValueVolumeValueVolume
Croatia0.000331.6410.0000.000
Czechia1085.6620.0000.0000.000
Estonia0.0000.0000.0000.000
Hungary243.077211.9870.0000.000
Latvia0.0000.0000.00053.691
Lithuania14.1210.0000.0000.000
Poland2584.9740.000186.8830.000
Romania1329.1930.0000.0000.000
Slovakia637.8920.0000.0000.000
Slovenia545.9011390.4420.0000.000
Total6440.80201934.0510186.88353.691
UtilitiesTelecommunicationOther
CountryValueVolumeValueVolumeValueVolume
Croatia0.0000.0000.000
Czechia0.0000.0000.000
Estonia0.0000.0000.000
Hungary750.0010.0000.000
Latvia0.0000.0000.000
Lithuania0.0000.0000.000
Poland0.000791.87116.501
Romania0.0000.0000.000
Slovakia0.0000.0000.000
Slovenia0.0000.0000.000
Total750.001791.87116.501
Source: Own calculation based on https://efdata.org/.
Table 24. Value (USD million) and volume of ESG-related bond issuances by issuer sector in the CEE countries in 2024.
FinancialGovernmentLogistics—WarehousingReal Estate—Development and Management
CountryValueVolumeValueVolumeValueVolumeValueVolume
Croatia434.7910.0000.0000.000
Czechia543.4810.0001419.883172.922
Estonia0.0000.0000.0006.731
Hungary1661.3051953.5180.000109.381
Latvia0.0000.0000.0000.000
Lithuania0.0000.0000.0000.000
Poland1944.8130.0000.000402.146
Romania779.0412367.8040.000686.722
Slovakia416.1940.0000.0000.000
Slovenia53.321342.4620.0000.000
Total5832.93164663.77141419.8831377.8912
Energy—Non-RenewableEnergy—RenewableOther
CountryValueVolumeValueVolumeValueVolume
Croatia0.0000.00063.01
Czechia2289.2140.0000.00
Estonia433.3710.0000.00
Hungary0.0000.0000.00
Latvia0.0000.0000.00
Lithuania0.0000.0000.00
Poland0.000329.7220.00
Romania0.0000.00031.51
Slovakia0.0000.00032.81
Slovenia0.0000.0000.00
Total2722.585329.722127.313
Source: Own calculation based on https://efdata.org/.
Table 25. Value (USD million) and volume of ESG-related bond issuances by issuer sector in the CEE countries in 2025.
FinancialGovernmentLogistics—WarehousingReal Estate—Development and Management
CountryValueVolumeValueVolumeValueVolumeValueVolume
Croatia0.0000.0000.0000.00
Czechia0.000769.4721741.603273.03
Estonia0.0000.0000.0000.00
Hungary303.6941035.9010.0000.00
Latvia0.00022.4010.0000.00
Lithuania0.0000.0000.000389.91
Poland2381.5851472.00189.0430.00
Romania345.9010.0000.000588.41
Slovakia0.0000.0000.0000.00
Slovenia0.0001353.2620.0000.00
Total3031.17104653.0371830.6461251.275
Energy—Non-RenewableEnergy—RenewableUtilitiesFood and Beverages
CountryValueVolumeValueVolumeValueVolumeValueVolume
Croatia0.0000.0000.0000.000
Czechia1371.1420.000693.7310.000
Estonia0.0000.0000.0000.000
Hungary0.0000.0000.0000.000
Latvia0.000462.4010.0000.000
Lithuania0.0000.0000.0000.000
Poland0.00035.2010.000274.001
Romania0.0000.000585.6710.000
Slovakia0.0000.000869.8020.000
Slovenia0.0000.0000.0000.000
Total1371.142497.6022149.194274.001
Oil and GasTelecommunication
CountryValueVolumeValueVolume
Croatia0.0000.000
Czechia0.0000.000
Estonia0.0000.000
Hungary0.0000.000
Latvia0.0000.000
Lithuania0.0000.000
Poland702.001175.292
Romania0.0000.000
Slovakia0.0000.000
Slovenia0.0000.000
Total702.001175.292
Source: Own calculation based on https://efdata.org/.
Disclaimer/Publisher’s Note: The statements, opinions and data contained in all publications are solely those of the individual author(s) and contributor(s) and not of MDPI and/or the editor(s). MDPI and/or the editor(s) disclaim responsibility for any injury to people or property resulting from any ideas, methods, instructions or products referred to in the content.