A Coupled MIKE SHE–MIKE 11 Framework for Simulating Surface–Groundwater Connectivity and Water Quality to Support Sustainable Water Management in the Cau River Basin

 , and
, and
Abstract
1. Introduction
2. Materials and Methods
2.1. Description of the Study Area
2.2. Establishing the MIKE 11 and MIKE SHE Models
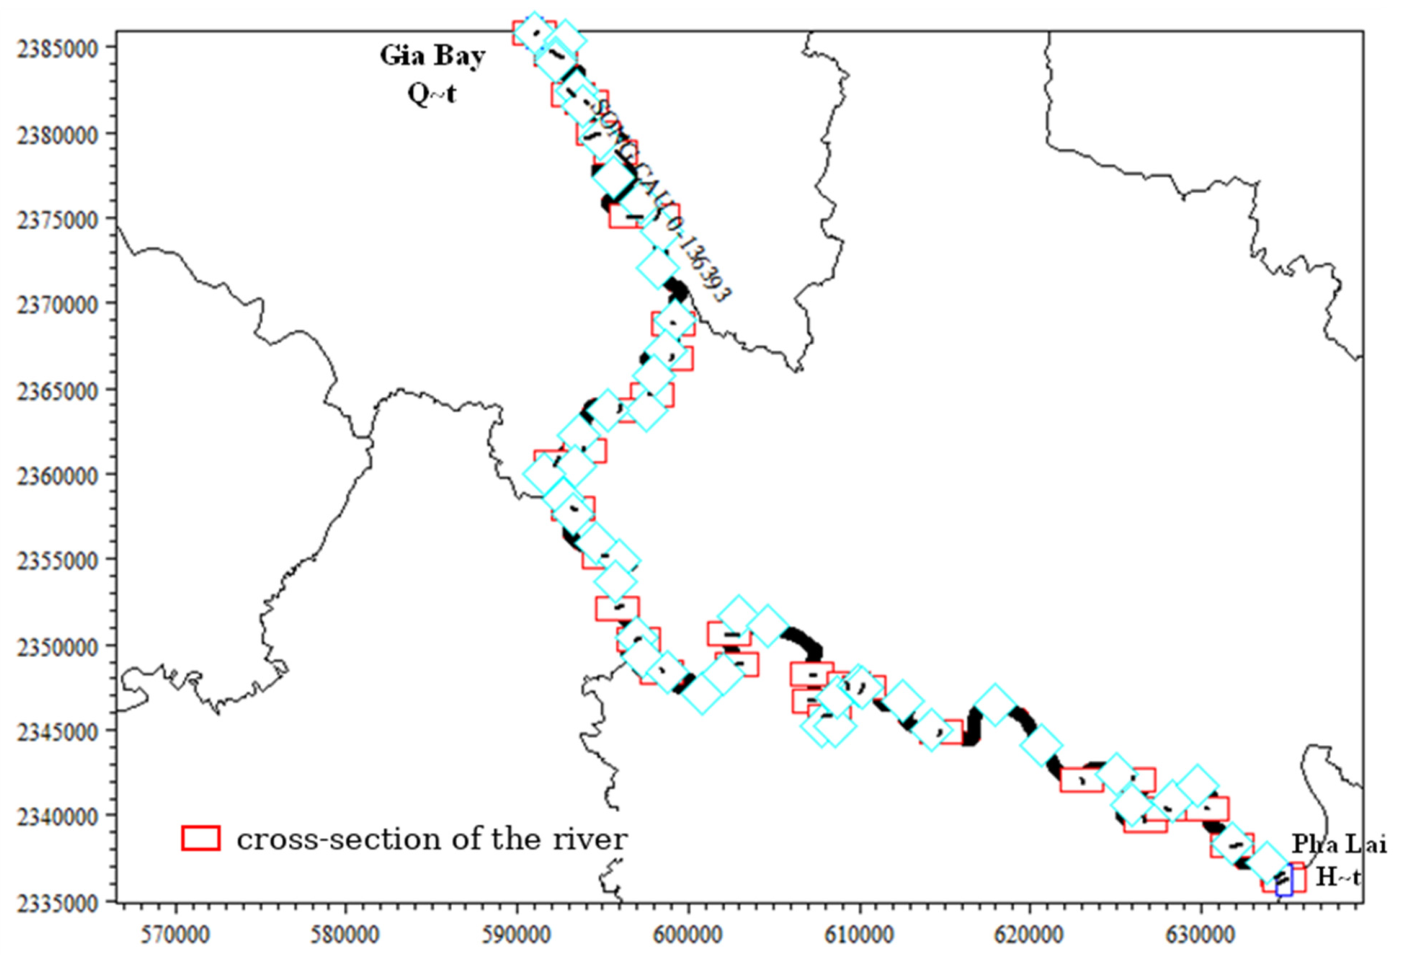
2.2.1. Establishment of the MIKE 11 Model
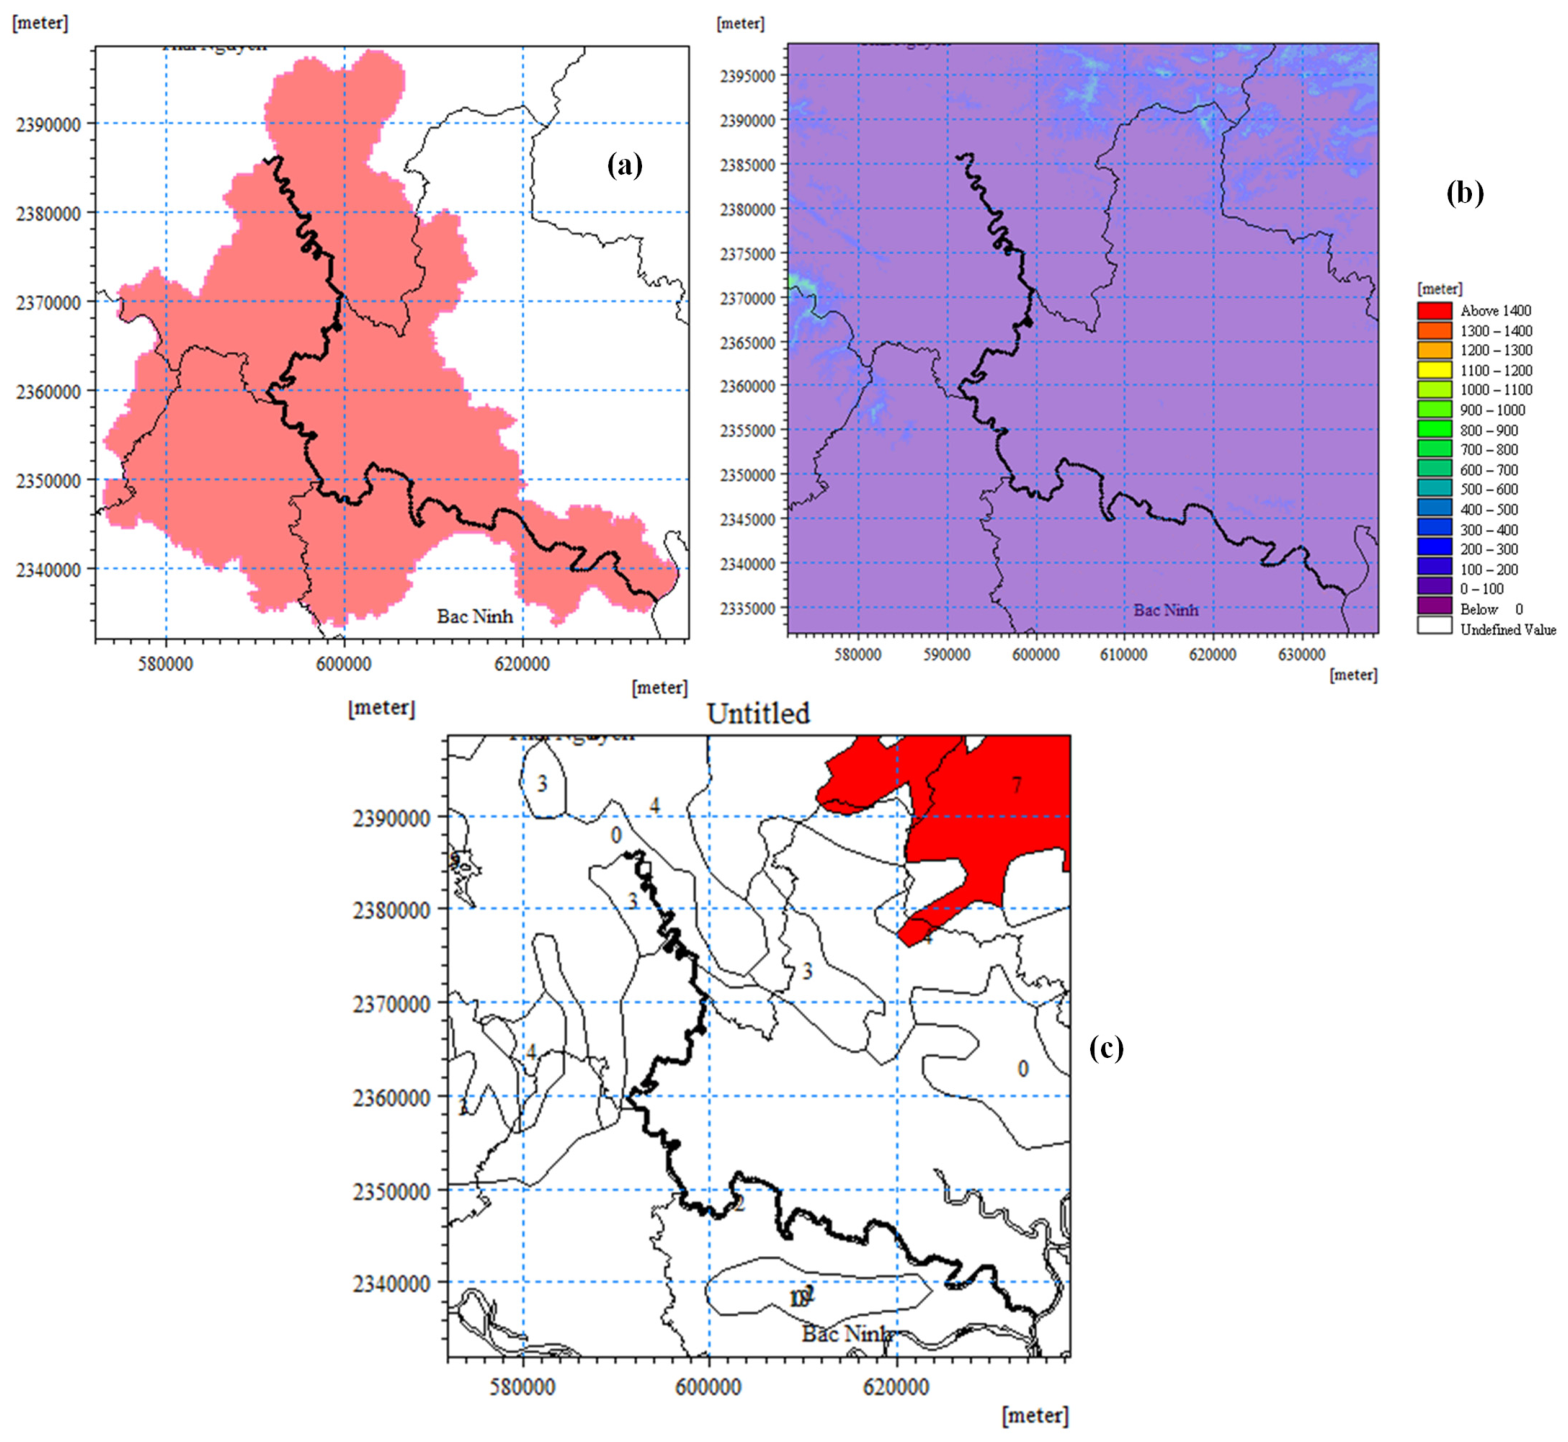
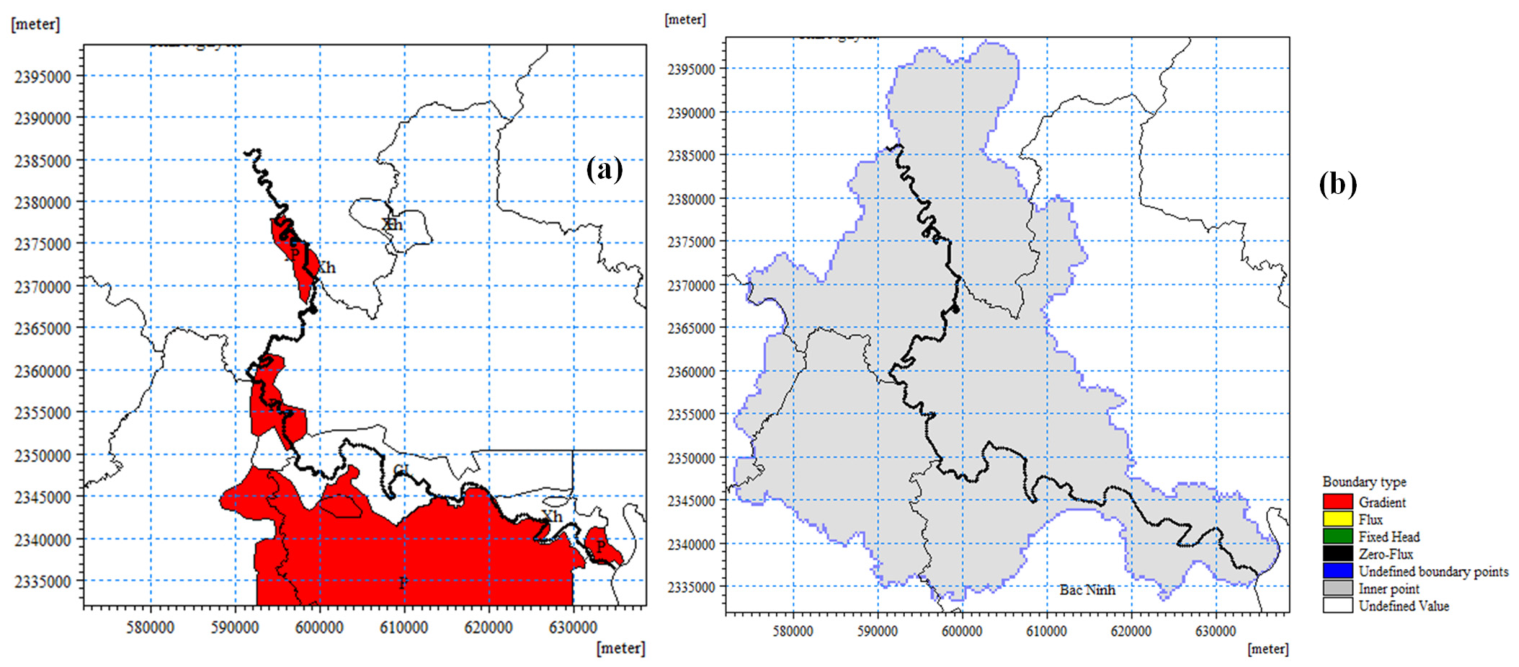
2.2.2. Establishment of the MIKE SHE Model
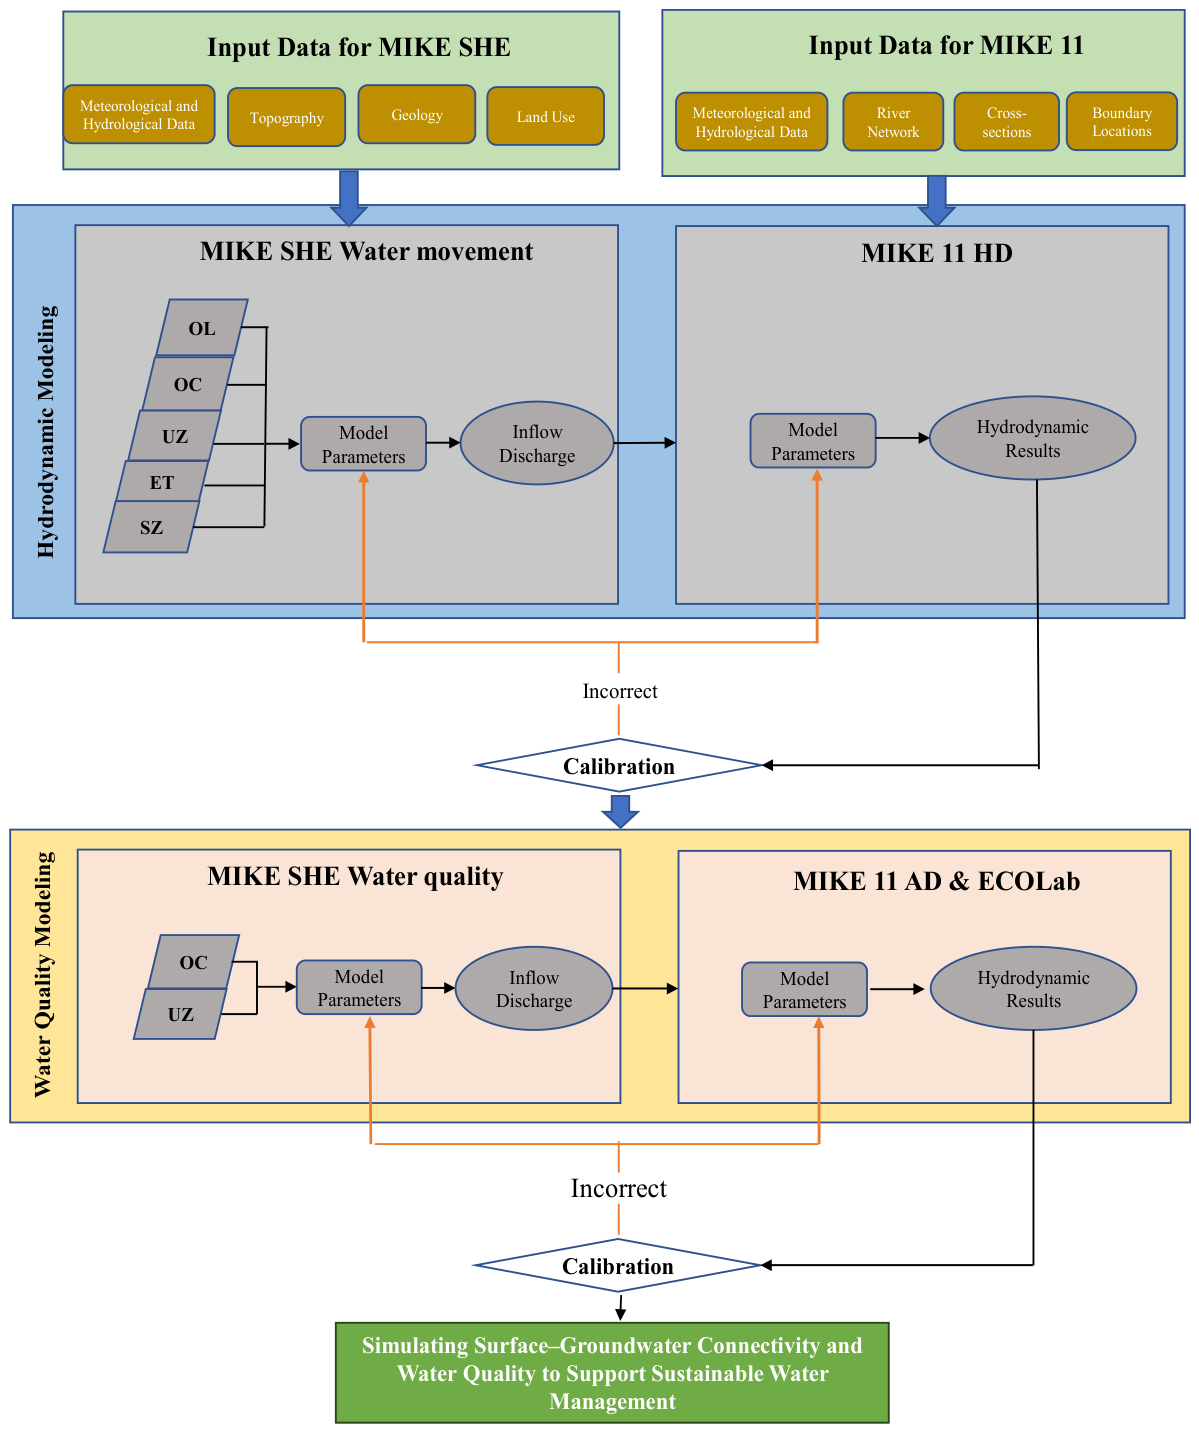
2.2.3. Model Coupling Between MIKE SHE and MIKE 11
2.2.4. Evaluation of Model Calibration and Testing Results
2.3. Data Collection
- -
- Calibration and testing of the integrated MIKE SHE–MIKE 11 framework were performed using hydrometeorological observations covering January 2023 to December 2024. The dataset was divided into two subsets, with the 2023 data used for model calibration and the 2024 data reserved for independent testing.
- -
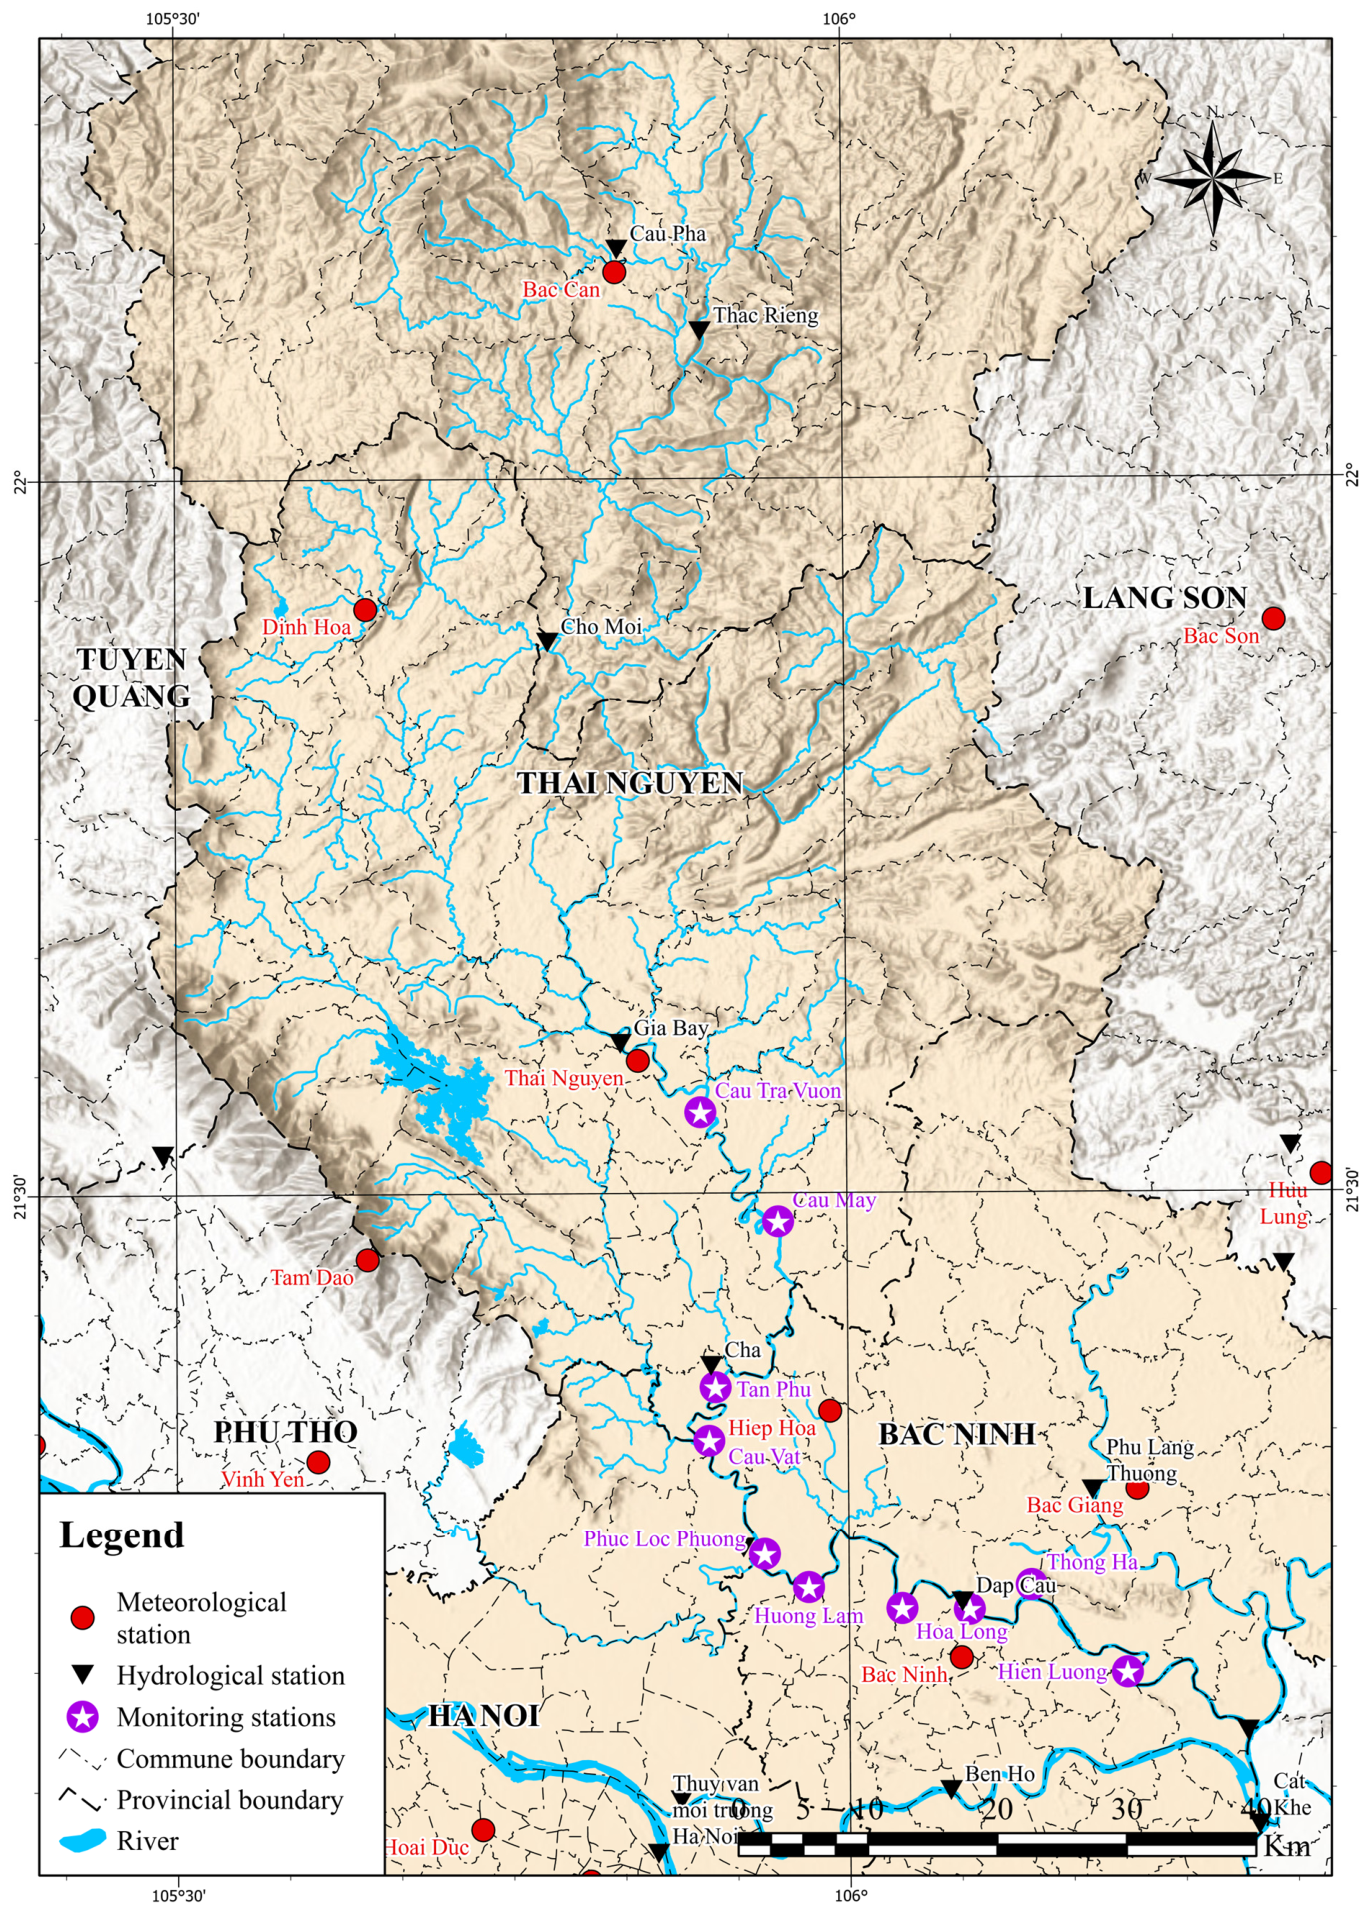
- Meteorological forcing data consisted of daily rainfall, evaporation, and air temperature measurements. Precipitation was obtained from six meteorological stations located within and around the Cau river basin (Bac Giang, Bac Ninh, Hiep Hoa, Huu Lung, Tam Dao, and Thai Nguyen), providing adequate spatial coverage of precipitation variability. Corresponding evaporation and temperature observations from these stations were used to parameterize evapotranspiration processes in the MIKE SHE model.
- -
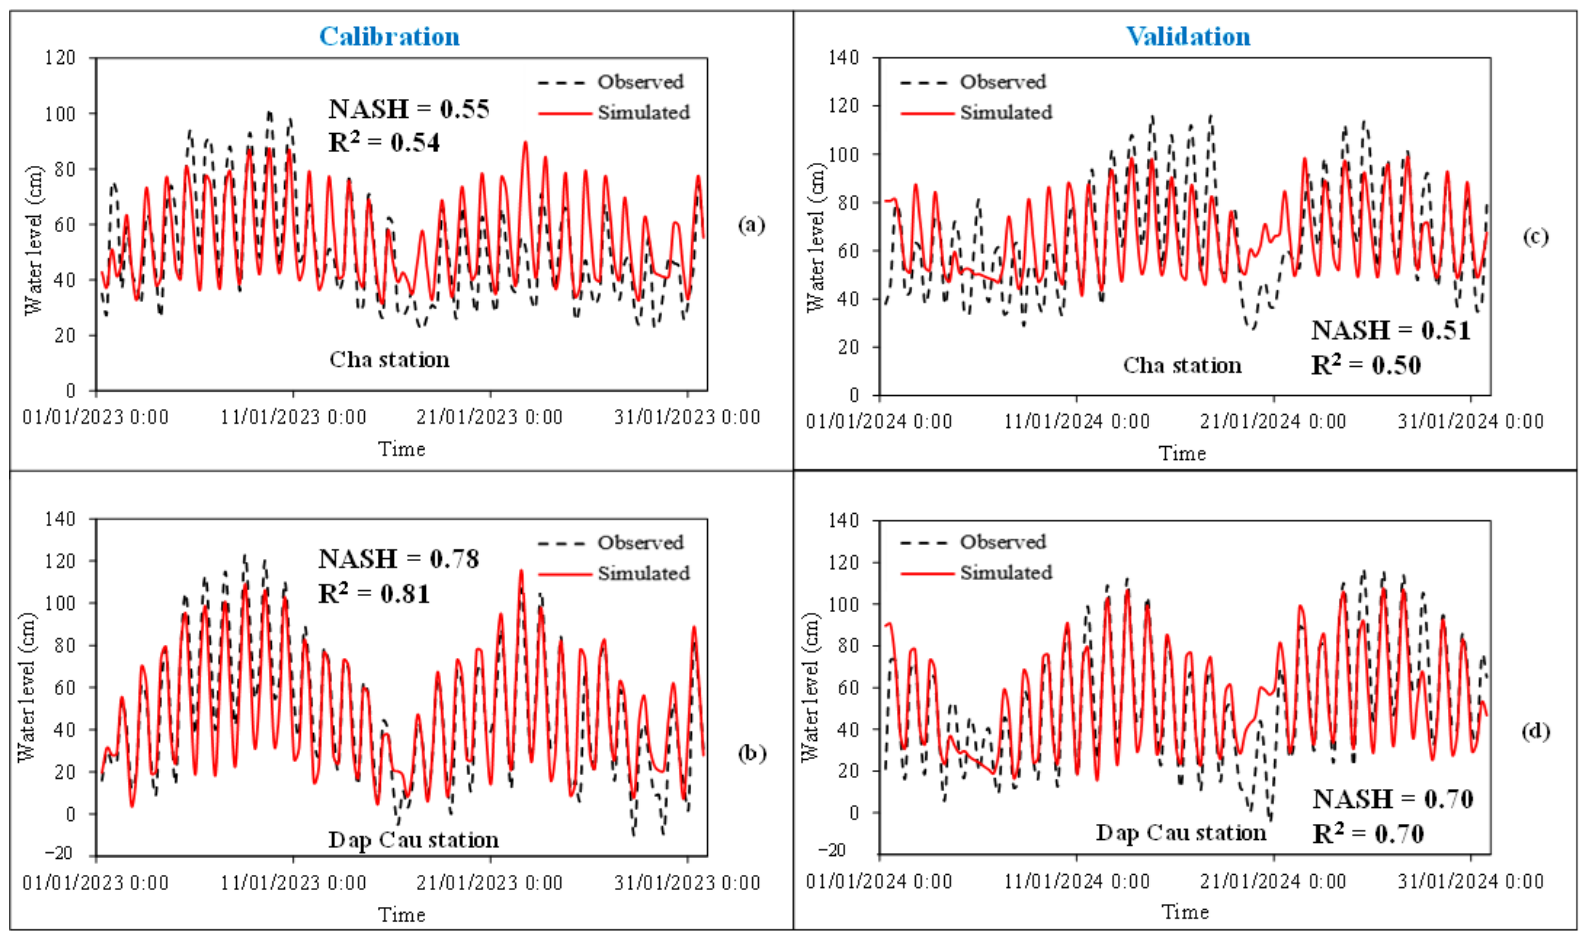
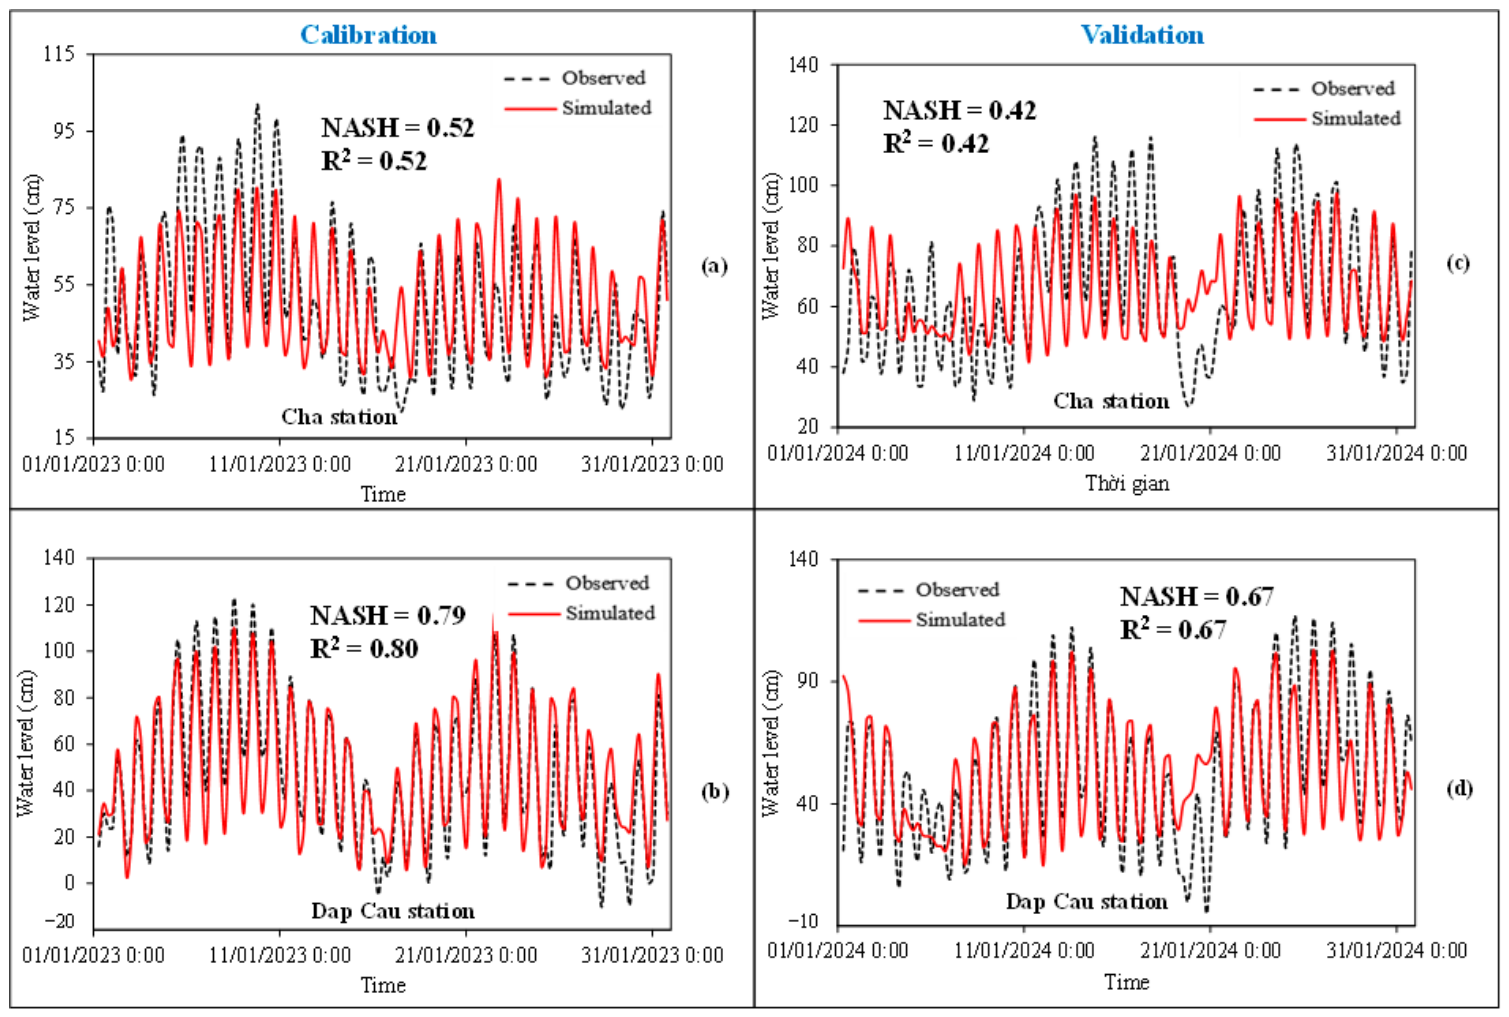
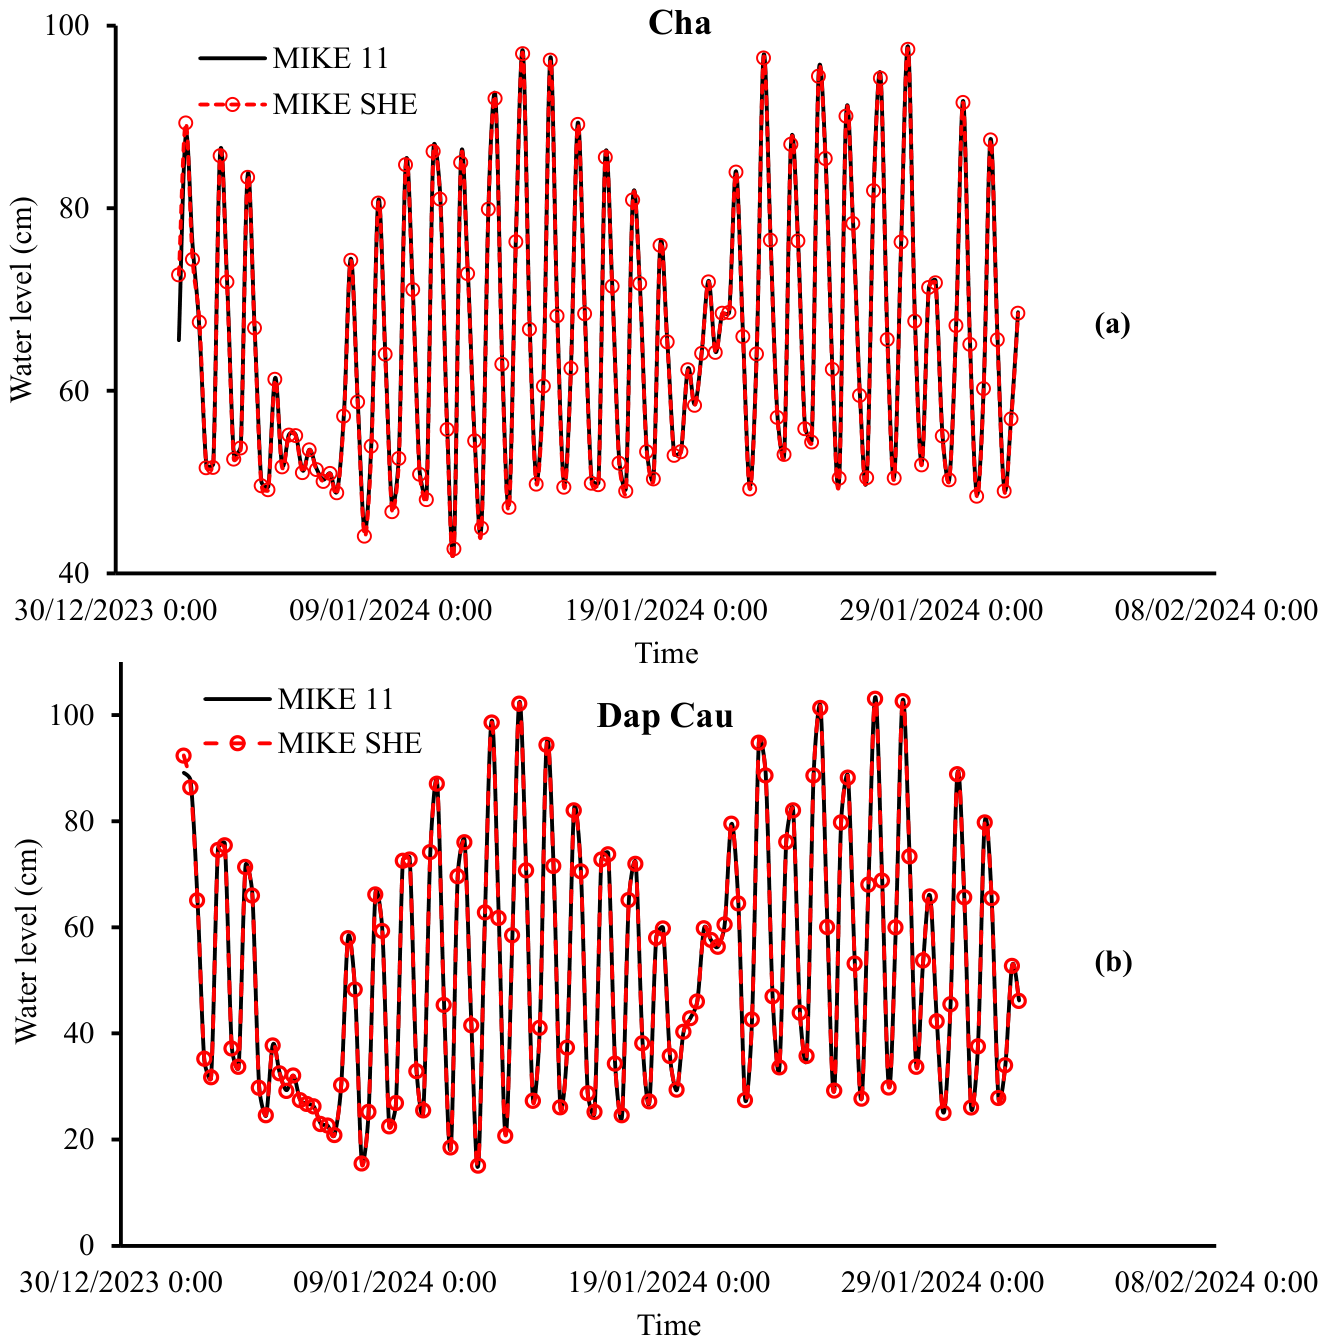
- Hydrological boundary and calibration data consisted of river discharge and water level observations from selected stations along the Cau river. Discharge data at Gia Bay station were specified as the upstream boundary condition for MIKE 11, while water level observations at Cha, Dap Cau, and Phu Lang Thuong stations were used for the calibration and testing of the coupled MIKE 11–MIKE SHE system and for performance evaluation.
- -
- All hydrometeorological inputs were obtained from the Viet Nam Meteorological and Hydrological Administration (VNMHA) and underwent consistency checks and quality-control procedures to ensure their reliability for subsequent hydrological and hydraulic simulation.
- -
- Pollutant loads were estimated using an integrated approach combining monitoring data, reported discharge information, and the spatial distribution of pollution sources across the basin. Point-source loads, including those from industrial zones, hospitals, and craft villages, were estimated based on available discharge volumes and measured pollutant concentrations derived from environmental monitoring reports provided by the Northern Environmental Monitoring Center. These loads were incorporated into the MIKE 11 model as lateral inflows or discrete point inputs at corresponding river reaches.
- -
- Non-point-source inputs were estimated indirectly using land use-based loading coefficients combined with surface runoff processes simulated by the MIKE SHE model. Representative pollutant generation rates were assigned to different land-use categories, including agricultural land, residential areas, and aquaculture zones, based on the published literature and regional environmental characteristics. These diffuse-source loads were dynamically linked to rainfall runoff processes, allowing temporal variations in pollutant transport to be represented under both wet- and dry-season conditions.
- -
- Initial pollutant concentrations within the river network were defined from observed water quality data at monitoring stations, while upstream boundary conditions were specified based on measured concentrations. During calibration, external loading estimates and key transformation parameters within the ECOLab module were iteratively adjusted to minimize discrepancies between simulated and observed concentrations of BOD5, COD, NH4+, TN, and TP. This calibration strategy ensures a consistent representation of both external pollutant inputs and in-stream biogeochemical processes throughout the modeling framework.
- -
- Water quality monitoring data, focusing on organic matter and nutrient parameters representative of the dominant pollution conditions in the Cau river basin, were used to calibrate and validate the MIKE 11 ECOLab and MIKE SHE water quality modules. The datasets were provided by the Northern Environmental Monitoring Center of the Department of Pollution Control, Ministry of Natural Resources and Environment (MoNRE), currently reorganized as the Ministry of Agriculture and Environment, Vietnam.
- -
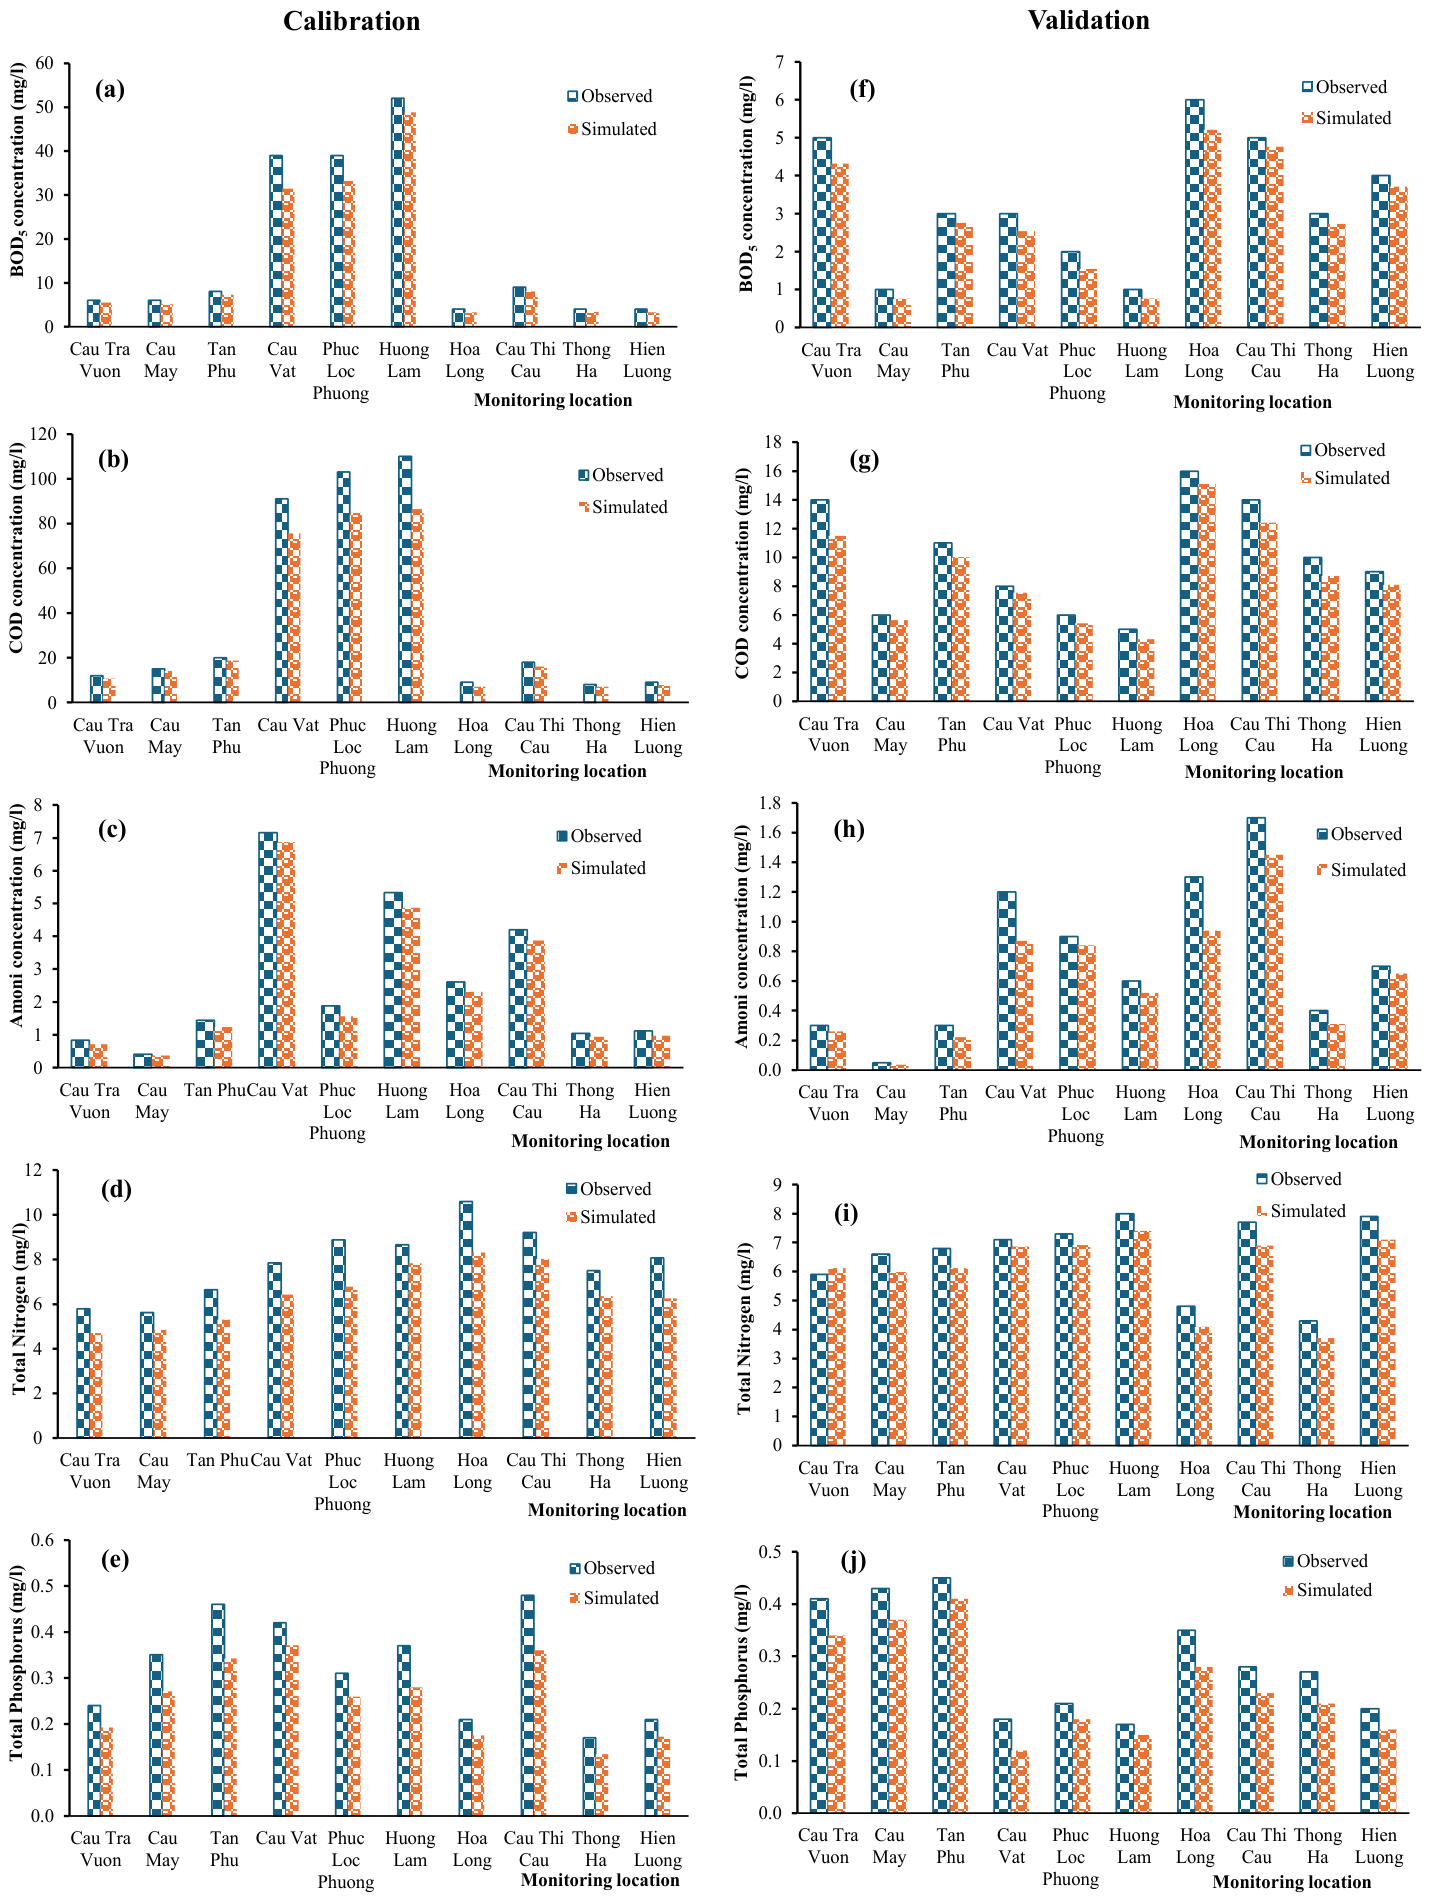
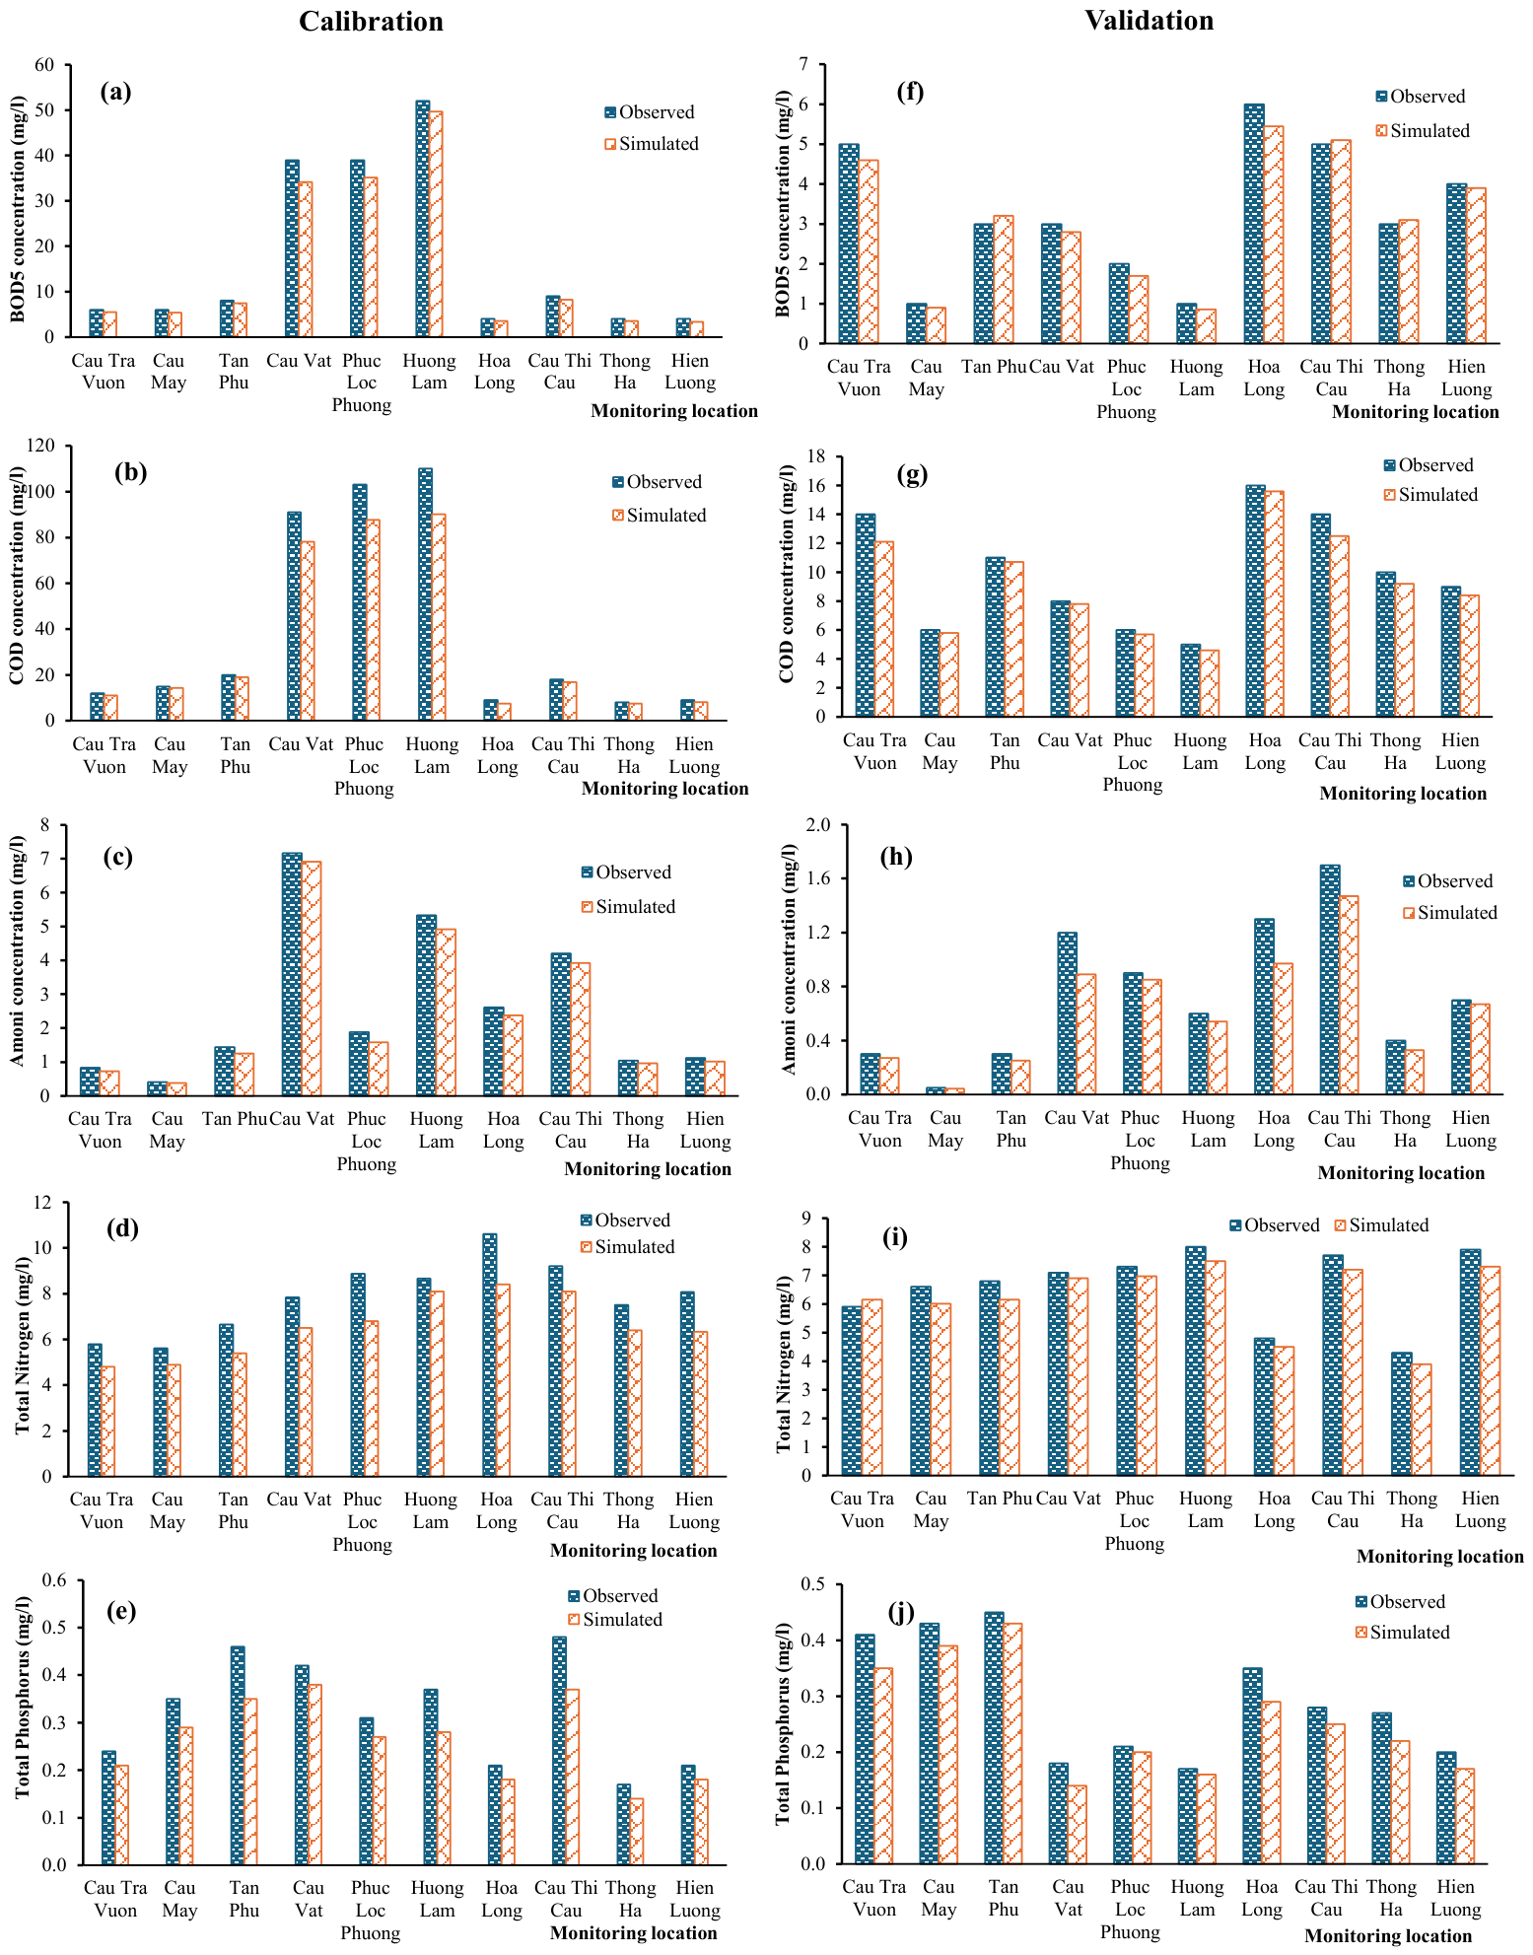
- In 2024, two intensive monitoring campaigns (20 March–3 April and 8–23 April) were conducted to capture representative dry-season conditions, during which pollutant accumulation and surface–subsurface exchange processes are most pronounced. Water quality samples were collected from ten sites along the Cau river main stem, covering upstream to downstream sections and encompassing major tributary confluences as well as urban and industrial zones.
- -
- The monitored parameters included BOD5, COD, NH4+, TN, and TP, representing key indicators of organic pollution and nutrient enrichment that correspond directly to state variables within the MIKE 11 ECOLab framework. All sampling and laboratory analyses were performed in accordance with Vietnamese national standards and established QA/QC procedures to ensure data consistency and reliability.
- -
- For calibration and testing, the 2024 dataset was divided according to the two monitoring campaigns. Simulated concentrations were systematically compared with observations at individual stations, and key ECOLab parameters governing biogeochemical transformation processes were iteratively adjusted. The resulting optimized parameter set was considered representative of prevailing water quality conditions and provides a robust basin for subsequent scenario analysis and management-oriented application in the Cau river basin.
3. Results
3.1. Results of Calibration and Testing MIKE 11 and MIKE SHE Models
3.1.1. Results of MIKE 11 Model Calibration and Testing
3.1.2. Results of MIKE SHE Model Calibration and Testing
3.2. Results of Calibration and Testing MIKE 11 ECOLab and MIKE SHE Models
3.2.1. Results of Calibration and Testing MIKE 11 ECOLab Model
- -
- Tra Vuon Bridge: Assesses the water quality of the Cau river as it flows through the Thai Nguyen Iron and Steel Complex area.
- -
- Cau May Bridge: Evaluates the water quality of the Cau river section passing through Thai Nguyen City.
- -
- Tan Phu: Monitors water quality before the Cau river joins the Cong river; this is also the final point of the Cau river within Thai Nguyen Province before entering Bac Ninh Province.
- -
- Cau Vat Bridge: Evaluates the water quality of the Cau river after the confluence with the Cong river.
- -
- Phuc Loc Phuong: Monitors the water quality at the confluence of the Ca Lo river and the Cau river.
- -
- Huong Lam: Assesses the water quality of the Cau river within Hiep Hoa District.
- -
- Hoa Long: Evaluates water quality after the Cau river joins the Ngu Huyen Khe river.
- -
- Thi Cau Bridge: Monitors the water quality of the Cau river within Bac Ninh City.
- -
- Thong Ha: Assesses the water quality of the Cau river before it flows past the Que Vo Industrial Park.
- -
- Hien Luong: Evaluates the water quality of the Cau river after passing the Que Vo Industrial Park.
3.2.2. Results of Calibration and Testing MIKE SHE Water Quality Model
3.3. Analysis of Surface–Groundwater Hydraulic Interaction in the Study Area
- -
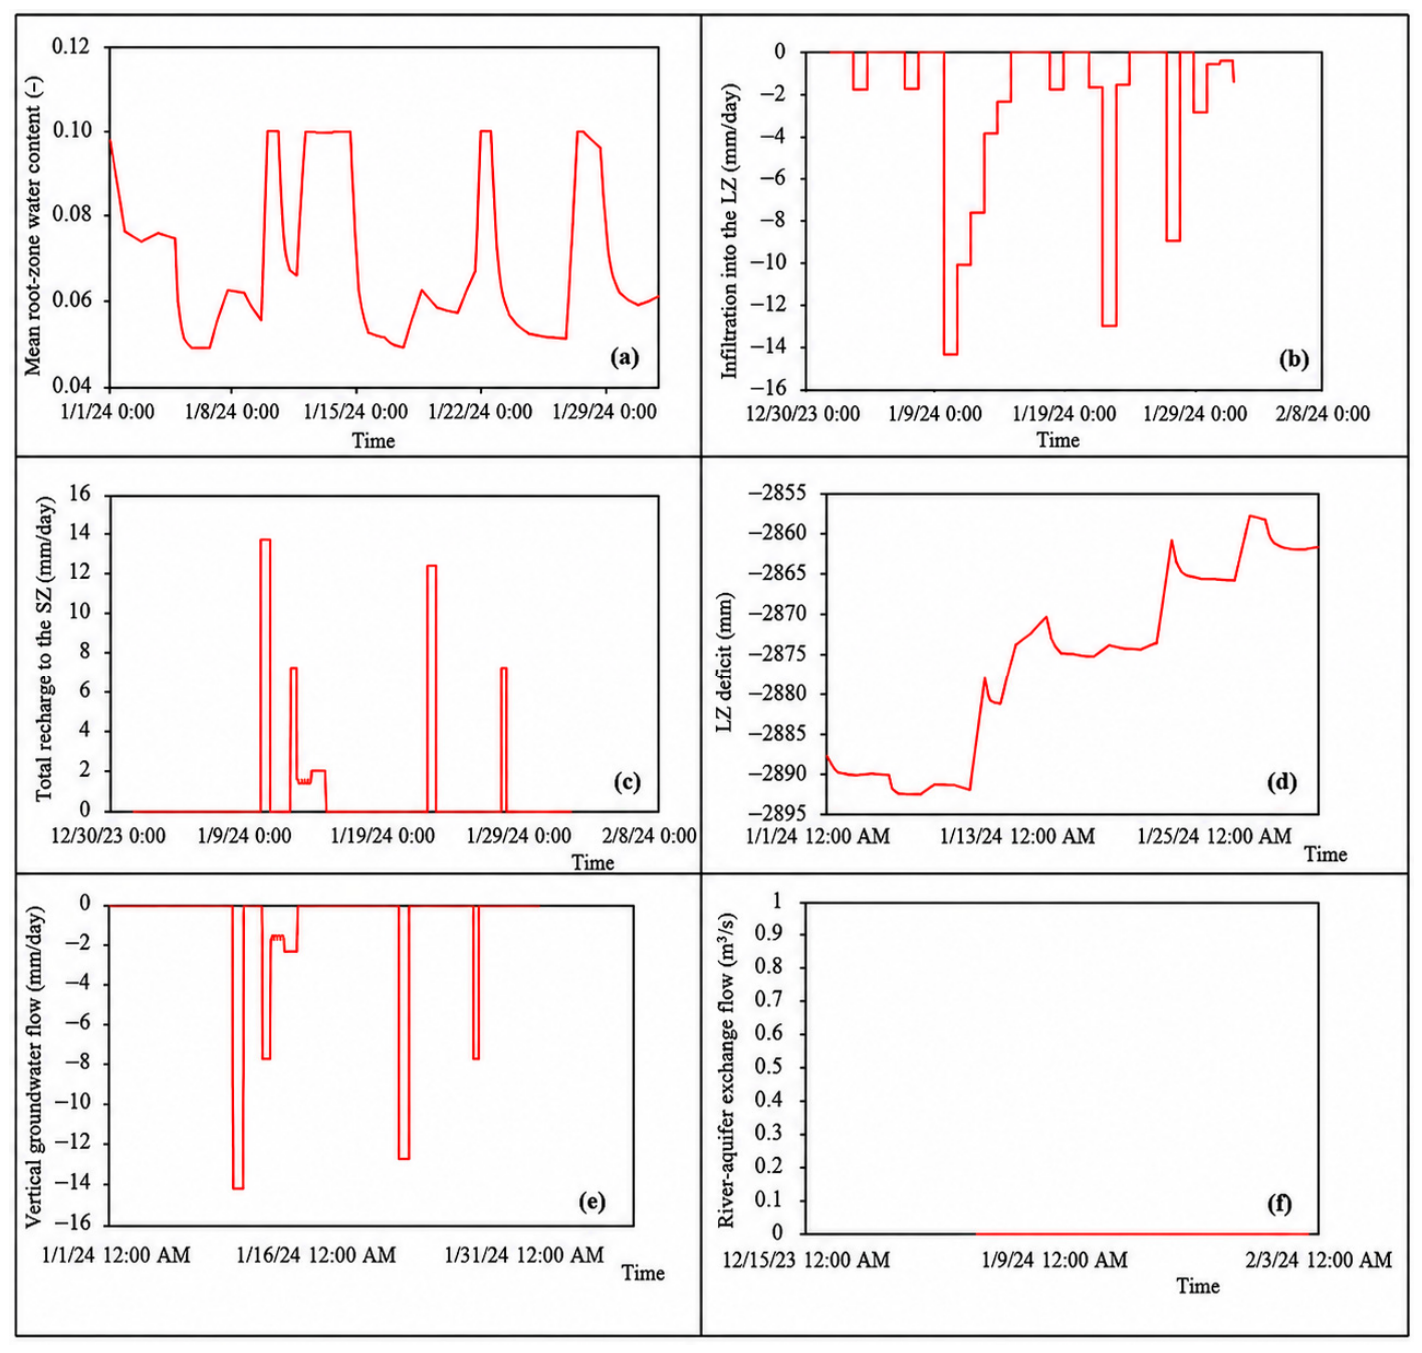
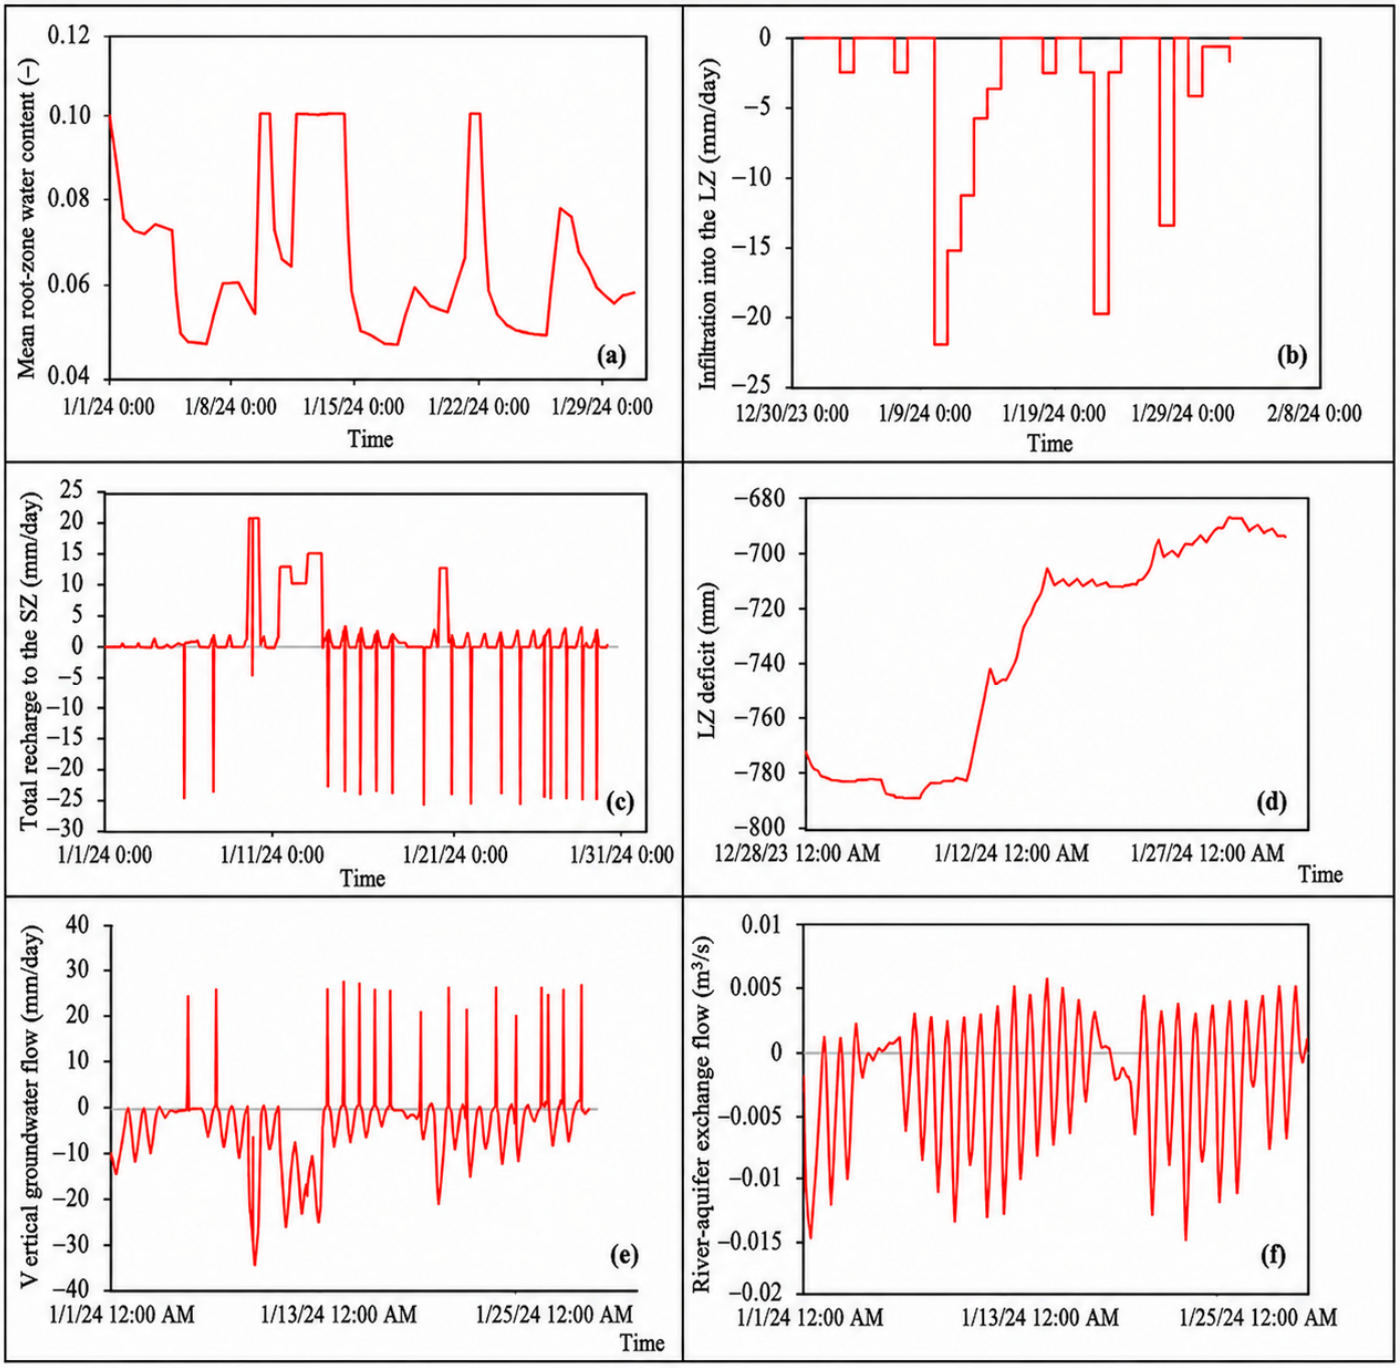
- Root-zone moisture content: Simulation results at Cha (upstream) and Dap Cau (downstream) show that the root-zone moisture content fluctuated between 0.04 and 0.12 (volumetric moisture fraction). The temporal variations were broadly consistent at both stations, indicating relatively stable soil moisture conditions during the study period. These values suggest that water availability for vegetation was generally maintained; however, during short-term dry periods, moisture content decreased to approximately 0.04, indicating a potential risk of water stress for crops.
- -
- Infiltration into the unsaturated zone (UZ): Surface infiltration into the UZ differed between the two stations. At Cha, the maximum infiltration reaches approximately 15 mm/day, whereas, at Dap Cau, it reached up to 20 mm/day. This difference reflects the combined influence of topography, soil hydraulic properties, rainfall variability, and local hydrological conditions. The higher infiltration rate at Dap Cau suggests greater local recharge potential in the downstream area, possibly associated with more permeable alluvial deposits and stronger river–floodplain connectivity.
- -
- Recharge to the saturated-zone (SZ) and unsaturated-zone deficit: At Cha station, recharge to the SZ occurred almost continuously throughout the simulation period, highlighting the role of the upstream area in sustaining groundwater storage. In contrast, recharge at Dap Cau was more variable. During 10–14 January 2024, downward recharge dominated, whereas, at other times, upward water movement from the SZ to the UZ was simulated, reflecting strong fluctuations in groundwater level fluctuations influenced by river stage and flow variability. The larger UZ water deficits at Dap Cau further indicate a greater sensitivity of the downstream area to rapid changes in recharge and river–aquifer exchange conditions.
- -
- Vertical groundwater flow (z-direction): Vertical groundwater flow at Cha is predominantly positive throughout the simulation period, indicating downward water movement and recharge to the SZ. This pattern is consistent with the upstream characteristic, where hydraulic gradients generally favor downward percolation and groundwater replenishment. At Dap Cau, vertical flow fluctuates between positive (downward recharge) and negative (upward discharge), indicating complex river–groundwater interactions. This pattern indicates more complex surface water–groundwater interactions in the lower Cau river and provides evidence of dynamic vertical exchange between the unsaturated and saturated zones.
- -
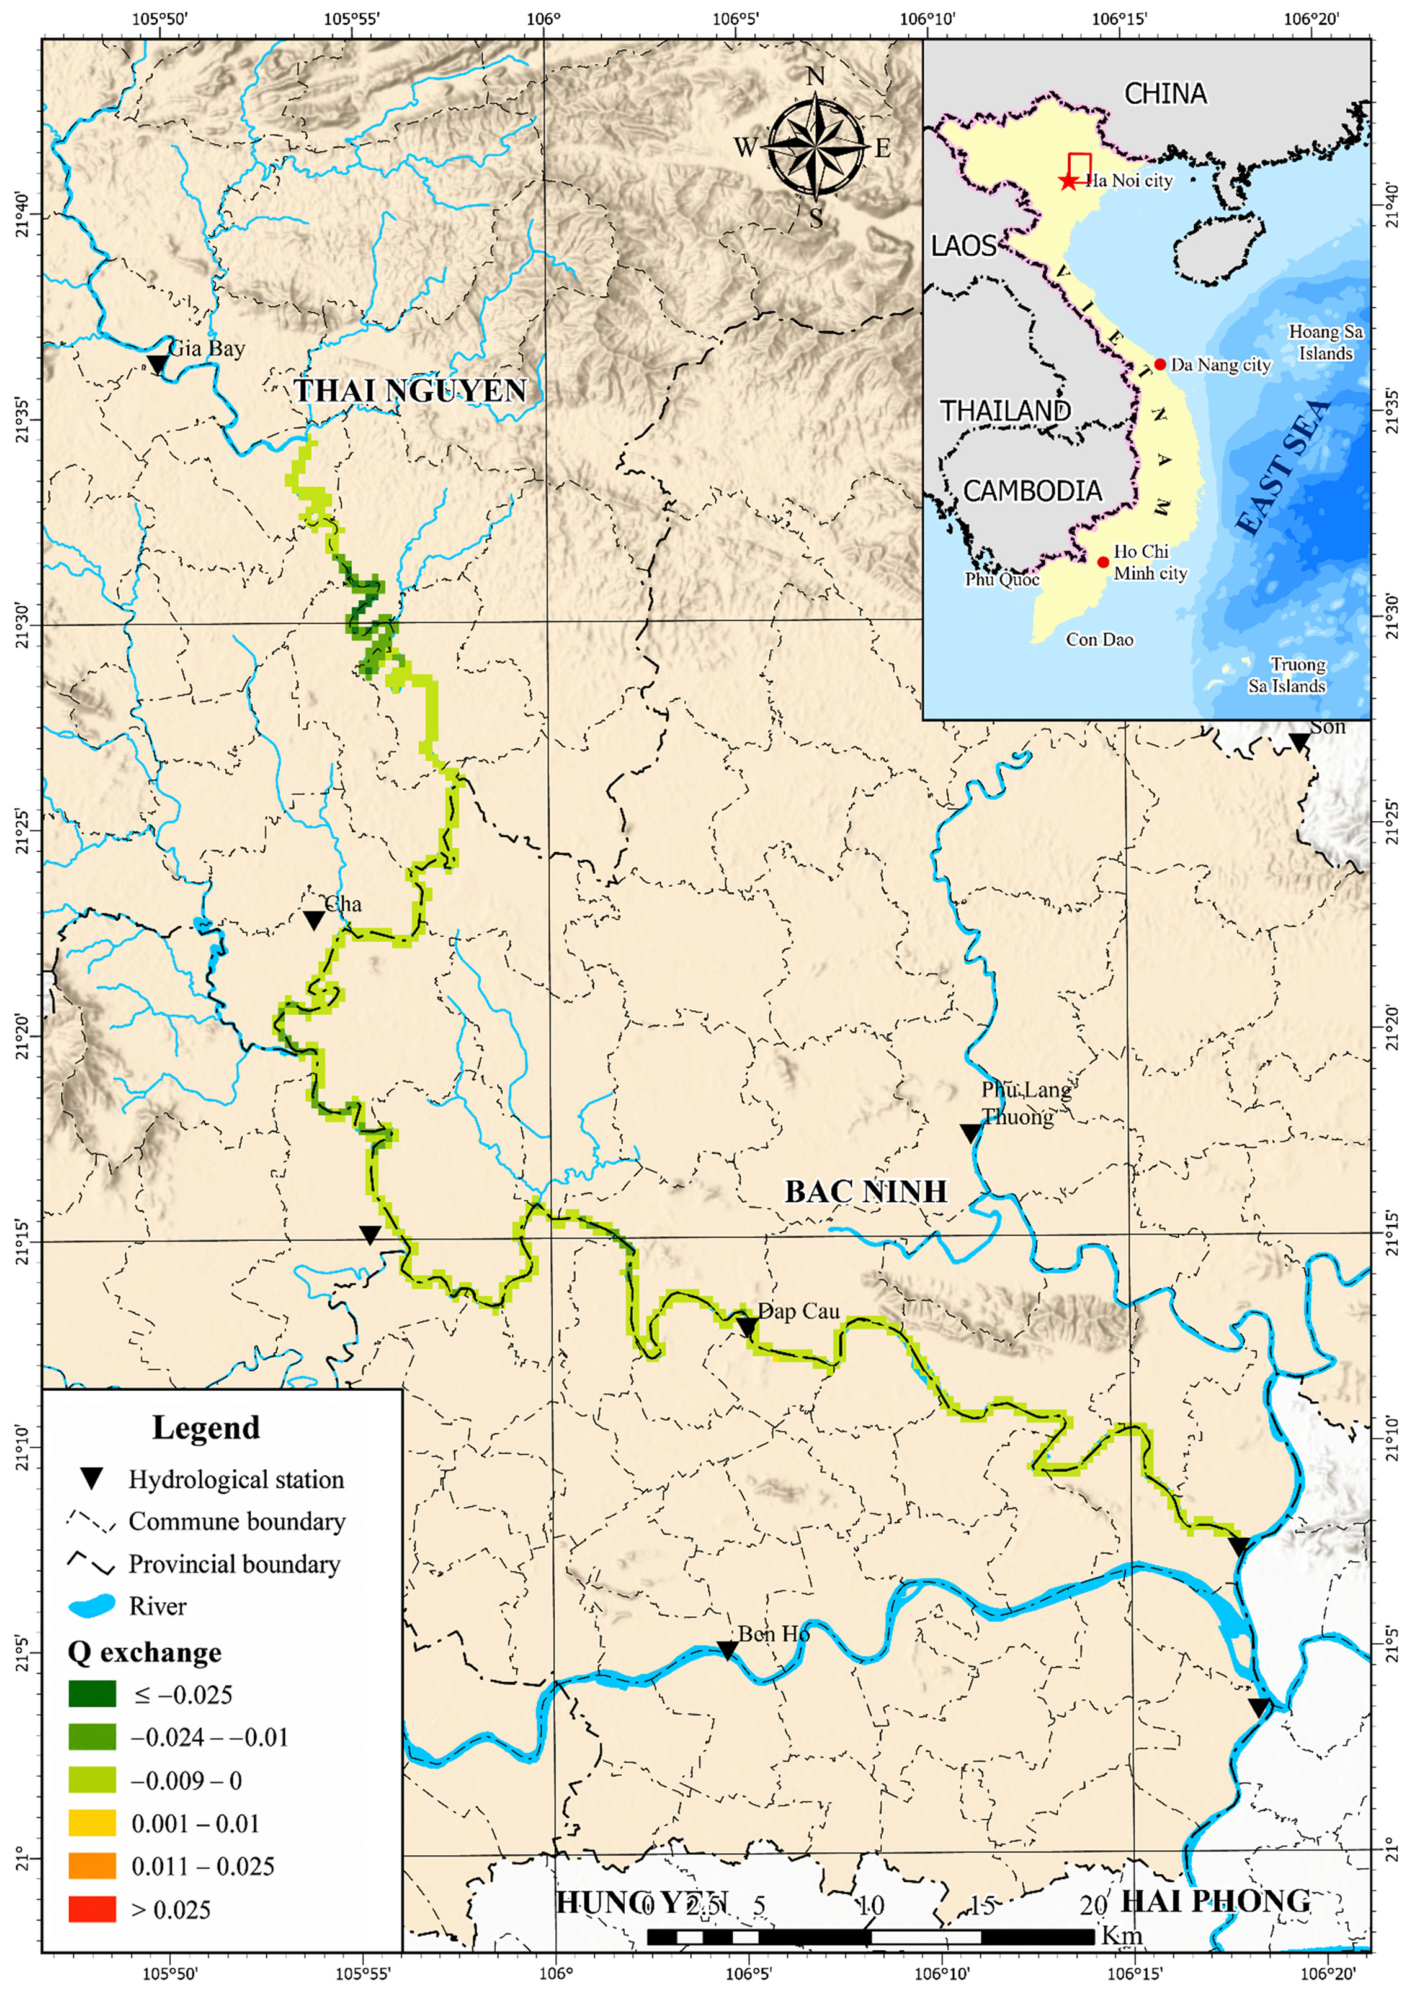
- Groundwater–river exchange: The simulated river–aquifer exchange fluxes further highlights spatial differences in surface water–groundwater interactions. At Cha, upward from the aquifer to the river was negligible, and water predominantly moved from the river into the groundwater system, indicating losing-river conditions. At Dap Cau, continuous bidirectional exchange was observed: when river levels increased, river water infiltrated the aquifer, whereas, during lower river stages, groundwater discharged back into the river. This exchange mechanism helps to regulate river-stage fluctuations and sustains low flows, while also increasing the sensitivity of the shallow aquifer to changes in river hydraulic conditions.
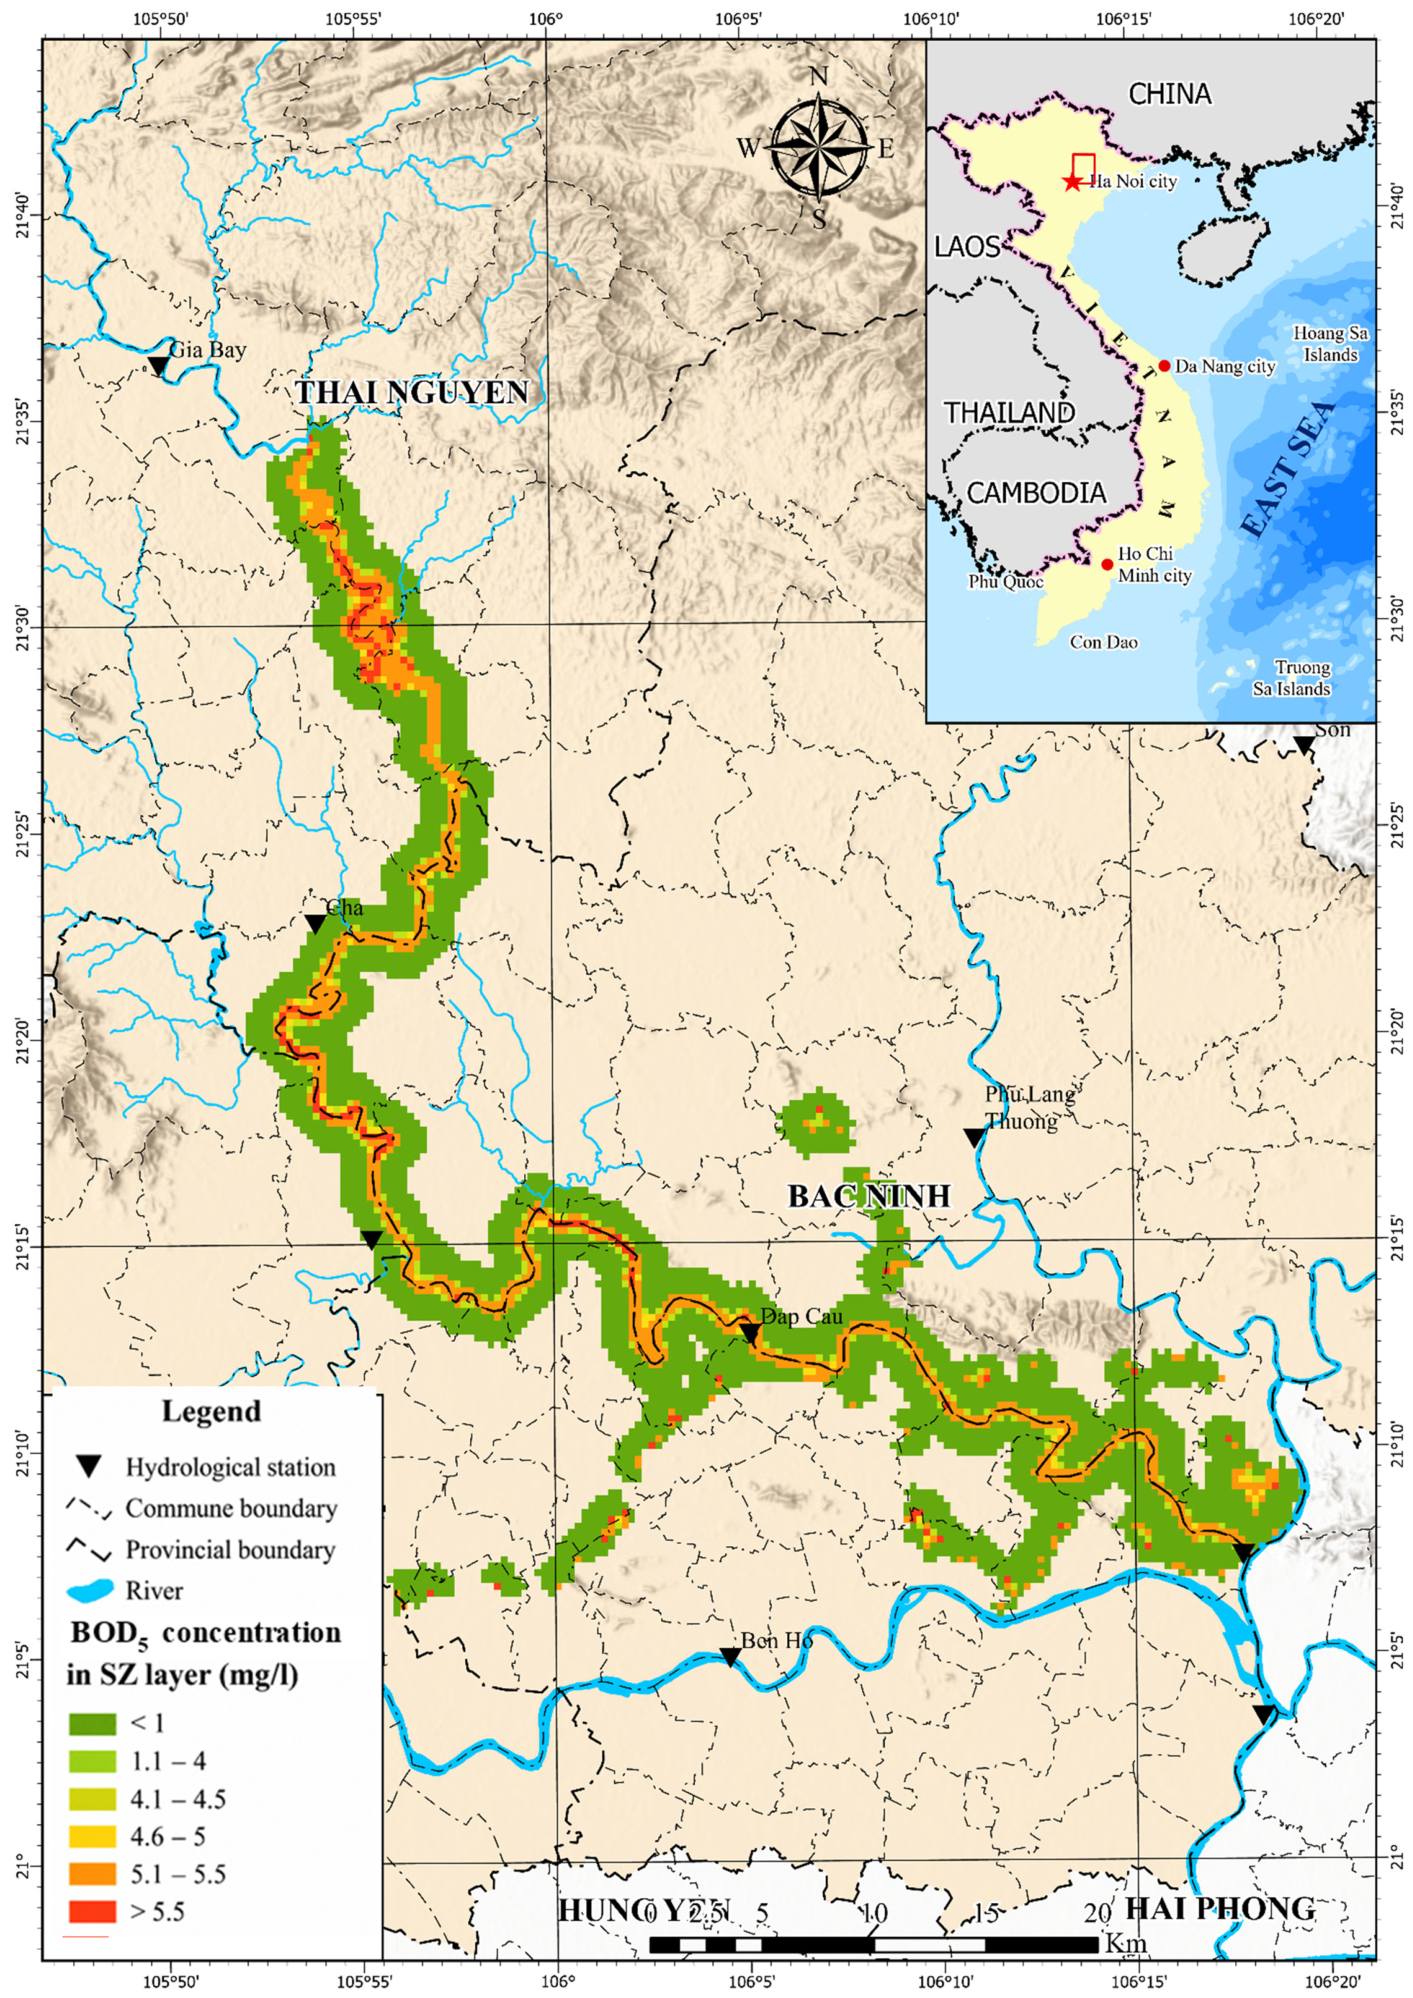
3.4. Impact of Surface–Groundwater Interaction on Water Quality
4. Discussion
5. Conclusions
- (1)
- A coupled MIKE SHE–MIKE 11 model was implemented for the Cau river basin and calibrated using hydrometeorological and water quality observations collected during 2023–2024 at Cha, Phuc Loc Phuong, and Dap Cau stations. The model achieved NSE values ranging from 0.55 to 0.79, indicating satisfactory simulation performance under data-limited conditions. Compared with the stand-alone MIKE 11 configuration, the coupled approach provided an improved representation of basin-scale hydrological processes and hydraulic connectivity between surface water and groundwater systems. These results suggest that integrated surface–subsurface modeling can enhance the reliability of hydrological and water quality assessments in complex river basins.
- (2)
- The simulations identified spatially heterogeneous river–aquifer interaction patterns along the Cau river. Upstream reaches were identified as persistent recharge zones, while middle and downstream reaches exhibited dynamically alternating losing and gaining conditions in response to seasonal flow regimes and hydraulic gradients. In particular, the Dap Cau section showed clear recharge–discharge switching that may contribute to sustaining river baseflow during dry periods. These findings provide some quantitative evidence of dynamic river–groundwater connectivity in the Cau river basin and complement previous regional assessments of hydrological exchange processes.
- (3)
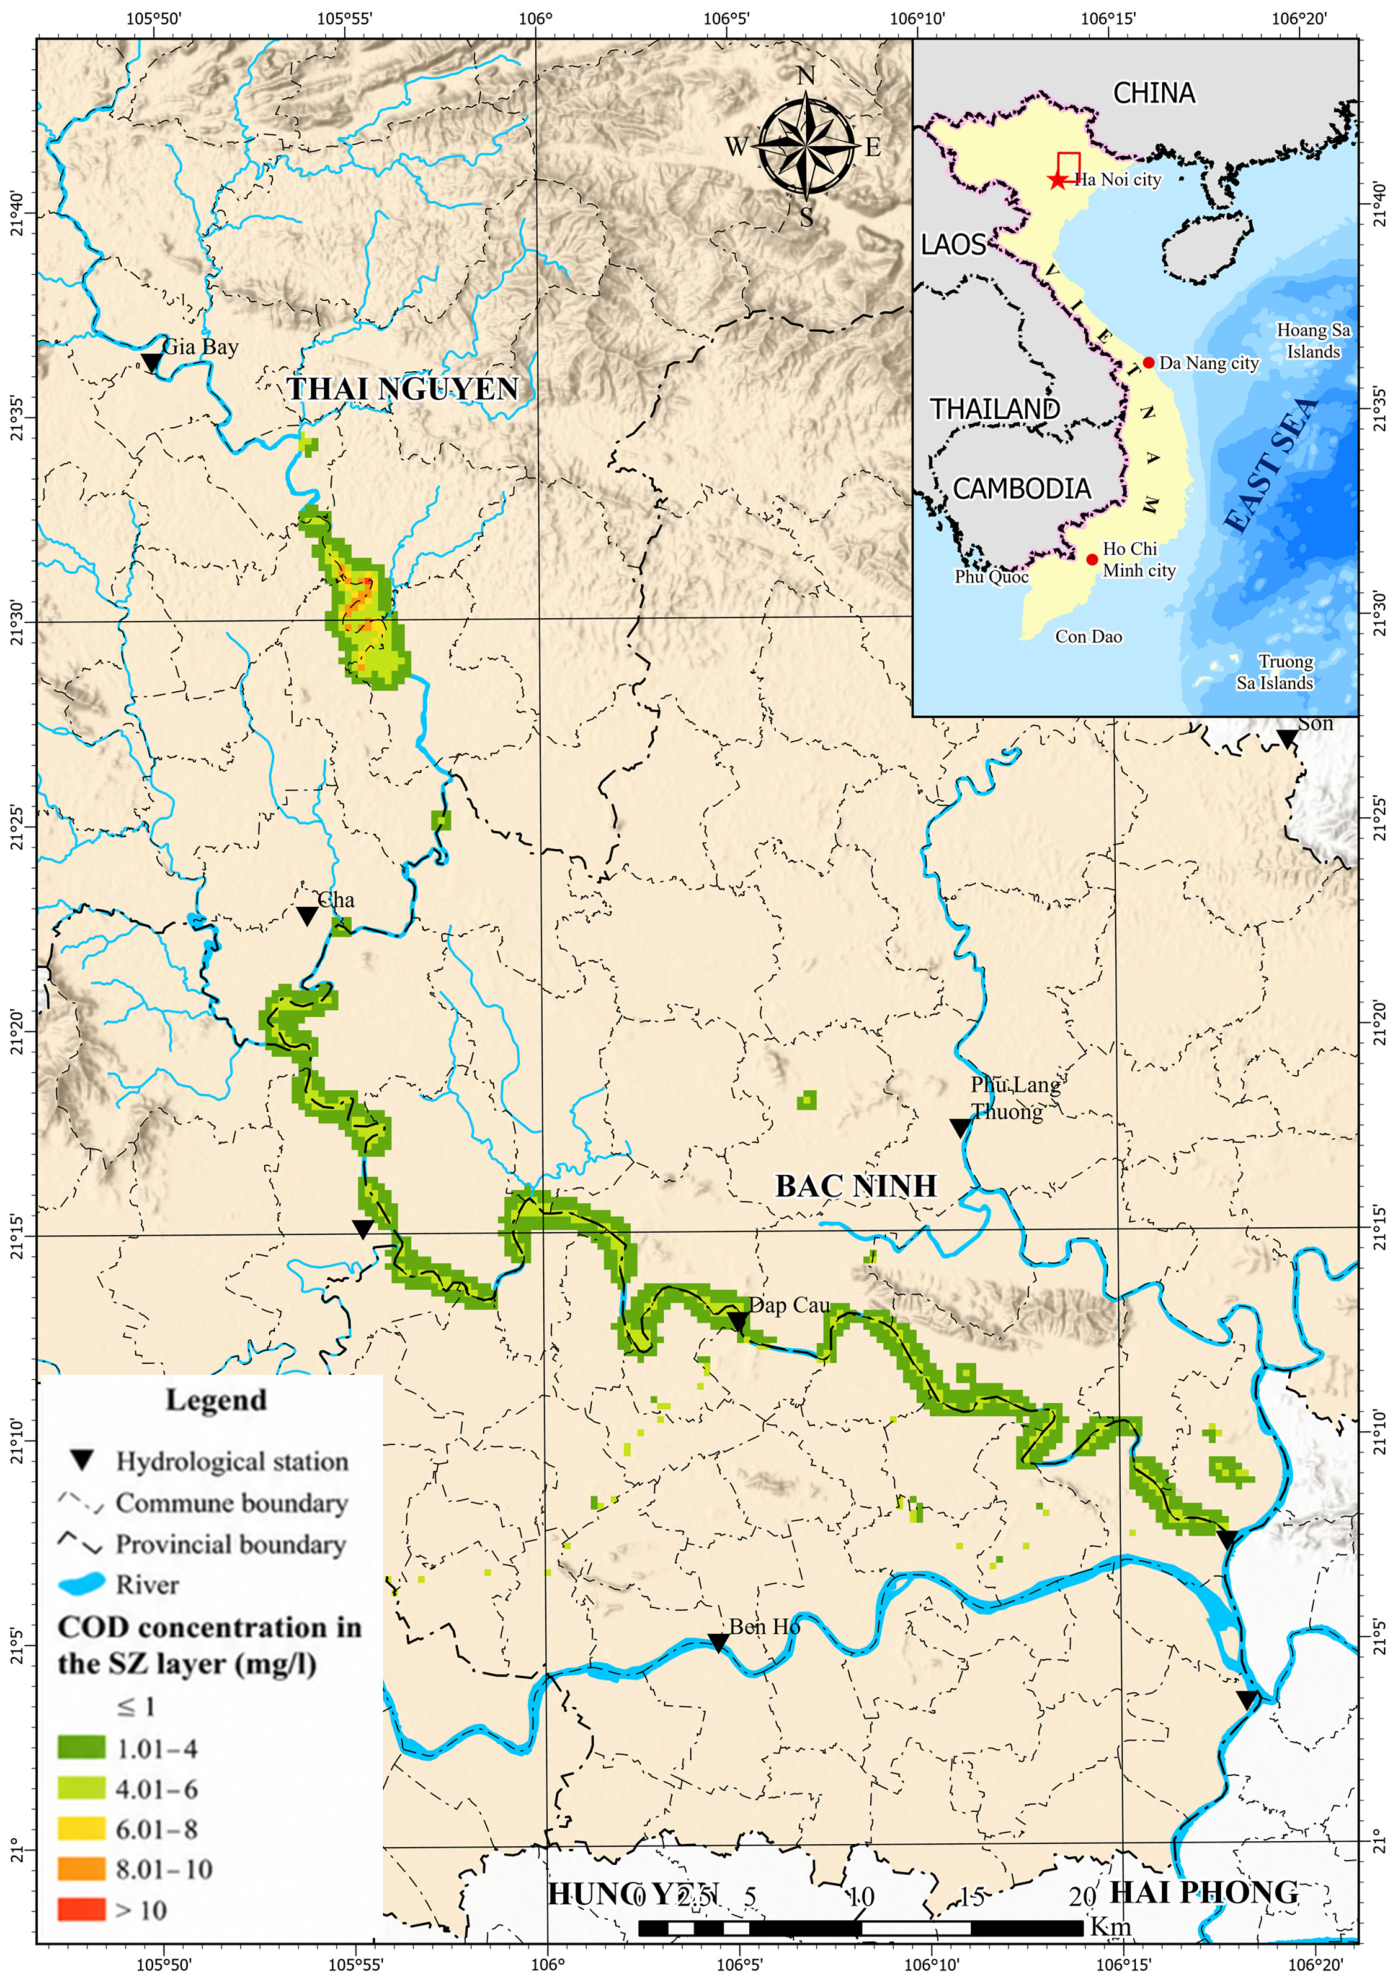
- The coupled simulations further indicated that surface–subsurface interactions amplify BOD5, COD, NH4+, total nitrogen, and total phosphorus concentrations compared to stand-alone MIKE 11. The model results also suggest that infiltration from industrial and domestic wastewater sources may contribute to pollutant migration within shallow aquifers, with simulated lateral transport distances reaching approximately 1.5 km in some areas. These findings highlight the importance of considering groundwater exchange processes in basin-scale water quality assessments, as neglecting such interactions may underestimate pollutant persistence and transport pathways within river systems.
Author Contributions
Funding
Institutional Review Board Statement
Informed Consent Statement
Data Availability Statement
Conflicts of Interest
References
- Li, B.; Yang, L.; Song, X.; Diamantopoulos, E. Identifying surface water and groundwater interactions using multiple experimental methods in the riparian zone of the polluted and disturbed Shaying River, China. Sci. Total Environ. 2023, 875, 162616. [Google Scholar] [CrossRef] [PubMed]
- Irvine, D.J.; Singha, K.; Kurylyk, B.L.; Briggs, M.A.; Sebastian, Y.; Tait, D.R.; Helton, A.M. Groundwater-Surface water interactions research: Past trends and future directions. J. Hydrol. 2024, 644, 132061. [Google Scholar] [CrossRef]
- Hayouni, W.; Pistre, S.; Zouari, K. Contaminants of emerging concern (CECs) as indicators of pollution and hydrological processes in an anthropized mediterranean water basin: Case of the Kasserine Basin (Central Tunisia). Sci. Total Environ. 2025, 984, 1799744. [Google Scholar] [CrossRef] [PubMed]
- Refsgaard, J.C.; Storm, B. MIKE SHE. In Computer Models of Watershed Hydrology; Singh, V.P., Ed.; Water Resources Publications: Lone Tree, CO, USA, 1995; pp. 809–846. [Google Scholar]
- Graham, D.N.; Butts, M.B. Flexible, integrated watershed modelling with MIKE SHE. In Watershed Models; Singh, V.P., Frevert, D.K., Eds.; CRC Press: Boca Raton, FL, USA, 2005; pp. 245–272. [Google Scholar]
- Harbaugh, A.W. MODFLOW-2005, U.S. Geological Survey Modular Ground-Water Model—The Groundwater Flow Process; U.S. Geological Survey Techniques and Methods 6-A16; The U.S. Geological Survey (USGS): Reston, VA, USA, 2005; p. 253. [Google Scholar]
- Hoffmann, J.; Leake, S.A.; Galloway, D.L.; Wilson, A.M. MODFLOW-2000 Ground-Water Model—User Guide to the Subsidence and Aquifer-System Compaction (SUB) Package; U.S. Geological Survey Open-File Report OFR03-233; The U.S. Geological Survey (USGS): Reston, VA, USA, 2003; pp. 1–39. [Google Scholar]
- Bizhanimanz, M.; Leconte, A.; Nuth, M. Modelling of shallow water table dynamics using conceptual and physically based integrated surface-water–groundwater hydrologic models. Hydrol. Earth Syst. Sci. 2019, 23, 2245–2260. [Google Scholar] [CrossRef]
- Jimenez, M.; Velásquez, N.; Jimenez, J.E.; Barco, J.; Blessent, D.; López-Sánchez, J.; Castrillón, S.C.; Valenzuela, C.; Therrien, R.; Boico, V.F.; et al. Sequential surface and subsurface flow modeling in a tropical aquifer under different rainfall scenarios. Environ. Modell. Softw. 2022, 149, 105328. [Google Scholar] [CrossRef]
- Zhao, H.; Zhang, J.; James, R.T.; Laing, J. Application of MIKE SHE/MIKE 11 Model to Structural BMPs in S191 Basin, Florida. J. Environ. Inf. 2012, 19, 10–19. [Google Scholar] [CrossRef]
- Prucha, B.; Graham, D.; Watson, M.; Avenant, M.; Esterhuyse, S.; Joubert, A.; Kemp, M.; King, J.; Le Roux, P.; Redelinghuys, N.; et al. MIKE-SHE integrated groundwater and surface water model used to simulate scenario hydrology for input to DRIFT-ARID: The Mokolo River case study. Water SA 2016, 42, 384–398. [Google Scholar] [CrossRef]
- Waseem, M.; Kachholz, F.; Klehr, W.; Tränckner, J. Suitability of a coupled hydrologic and hydraulic model to simulate surface water and groundwater hydrology in a typical North-Eastern Germany lowland catchment. Appl. Sci. 2020, 10, 1281. [Google Scholar] [CrossRef]
- Yang, Y.; Yuan, Y.; Xiong, G.; Yin, Z.; Guo, Y.; Song, J.; Zhu, X.; Wu, J.; Wang, J.; Wu, J. Patterns of nitrate load variability under surface water-groundwater interactions in agriculturally intensive valley watersheds. Water Res. 2024, 267, 122474. [Google Scholar] [CrossRef] [PubMed]
- Arheimer, B.; Olsson, J. Integration and Coupling of Hydrological Models with Water Quality Models: Applications in Europe; Swedish Meteorological and Hydrological Institute (SMHI): Norrköping, Sweden, 2003; pp. 1–49. [Google Scholar]
- Waseem, M.; Schilling, J.; Kachholz, F.; Tränckner, J. Improved Representation of flow and water quality in a North-Eastern German lowland catchment by combining low-frequency monitored data with hydrological modelling. Sustainability 2020, 12, 4812. [Google Scholar] [CrossRef]
- Bailey, R.T.; Tasdighi, A.; Park, S.; Tavakoli-kivi, S.; Abitew, T.; Jeong, J.; Green, C.H.M.; Worqlul, A.W. APEX-MODFLOW: A New integrated model to simulate hydrological processes in watershed systems. Environ. Modell. Softw. 2021, 143, 105093. [Google Scholar] [CrossRef]
- Chunn, D.; Faramarzi, M.; Smerdon, B.; Alessi, D.S. Application of an integrated SWAT–MODFLOW model to evaluate potential impacts of climate change and water withdrawals on groundwater–surface water interactions in West-Central Alberta. Water 2019, 11, 110. [Google Scholar] [CrossRef]
- The, T.H.; Tri, D.Q.; Tuyet, Q.T.T.; Nhat, N.V.; Duc, P.T. Research on applying MIKE 11 model to assess the quality of wastewater receiving sources from industrial parks to Cam Giang River, Hai Duong. J. Hyro-Meteorol. 2022, 744, 67–80. [Google Scholar] [CrossRef]
- Doan, Q.T.; Nguyen, T.M.L.; Quach, T.T.T.; Tran, A.P.; Nguyen, C.D. Assessment of water quality in coastal establishments under the impact of an industrial zone in Hai Phong, Vietnam. Phys. Chem. Earth. A/B/C 2019, 113, 100–114. [Google Scholar] [CrossRef]
- Doan, Q.T.; Nguyen, T.M.L.; Tran, H.T.; Kandasamy, J. Application of 1D-2D coupled modeling in water quality assessment: A case study in Ca Mau Peninsula, Vietnam. Phys. Chem. Earth. A/B/C 2019, 113, 83–99. [Google Scholar] [CrossRef]
- Vo, N.D.; Gourbesville, P. Application of deterministic distributed hydrological model for large catchment: A case study at Vu Gia Thu Bon catchment, Vietnam. J. Hydroinf. 2016, 18, 885–904. [Google Scholar] [CrossRef]
- Lee, S.K.; Dang, T.A.; Tran, T.H. Combining rainfall–runoff and hydrodynamic models for simulating flow under the impact of climate change to the lower Sai Gon-Dong Nai River basin. Paddy Water Environ. 2018, 16, 457–465. [Google Scholar] [CrossRef]
- Son, C.T.; Giang, N.T.H.; Thao, T.P.; Nui, N.H.; Lam, N.T.; Cong, V.H. Assessment of Cau River water quality assessment using a combination of water quality and pollution indices. J. Water Supply Res. Technol. AQUA 2020, 69, 160–172. [Google Scholar] [CrossRef]
- Tran, V.B.; Ishidaira, H.; Nakamura, T.; Do, T.N.; Nishida, K. Estimation of nitrogen load with multi-pollution sources using the SWAT Model: A case study in the Cau River Basin in Northern Vietnam. J. Water Environ. Technol. 2017, 15, 106–119. [Google Scholar] [CrossRef]
- Chinh, L.V.; Hiramatsu, K.; Harada, M.; Cuu, N.T.; Lan, T.T. Estimation of water environment capacity in the Cau River Basin, Vietnam using the Streeter–Phelps Model. J. Fac. Agric. Kyushu Univ. 2017, 62, 163–169. [Google Scholar] [CrossRef] [PubMed]
- Vietnamese Ministry of Natural Resources and Environment (MONRE). Vietnam National Environmental Report 2006: Status of Three Water Basin: Cau River, Nhue—Day River and Dong Nai River. 2006, p. 74. Available online: http://documents.worldbank.org/curated/en/637281468308963359/pdf/404180VN0Env0M19190001PUBLIC1optmzd.pdf (accessed on 2 May 2026).
- Ministry of Natural Resources and Environment (MoNRE). Report on the Assessment of Surface Water Quality in the Cau River Basin Based on Results Obtained During the Period 2010–2012; Ministry of Natural Resources and Environment: Beijing, China, 2012. [Google Scholar]
- Department of Environment, Ministry of Agriculture and Environment. Report on Air and Water Environmental Quality in Northern Vietnam, First Monitoring Campaign of 2024. 2024. Available online: https://vea.mae.gov.vn/quan-trac-moi-truong-dinh-ky/10707/bao-cao-chat-luong-moi-truong-khong-khi-va-nuoc-khu-vuc-mien-bac-dot-1-nam-2024?utm_source=chatgpt.com (accessed on 25 April 2024).
- Kelliher, F.M.; Leuning, R.; Schulze, E.D. Evaporation and canopy characteristics of coniferous forests and grasslands. Oecologia 1993, 95, 153–163. [Google Scholar] [CrossRef] [PubMed]
- DHI. MIKE SHE User Manual; DHI Water & Environment: Hørsholm, Denmark, 2014. [Google Scholar]
- DHI. MIKE_11_Short_Introduction-Tutorial; DHI Water & Environment: Hørsholm, Denmark, 2014. [Google Scholar]








| Parameter | Perennial Crops | Rivers | Annual Crops | Paddy Fields | Rural Residential Land | Non-Agricultural Land | Aquaculture Areas |
|---|---|---|---|---|---|---|---|
| LAIa,b,c | 6 | 0 | 1.5 | 2 | 1 | 0.8 | 0.8 |
| RDa,b,c (m) | 800 | 0 | 200 | 200 | 100 | 100 | 100 |
| Kca,b,c | 1 | 1 | 1 | 0.4 | 1 | 1.2 | 1.2 |
| Parameter | Unit | Optimal Value |
|---|---|---|
| Riverbed roughness—Strickler coefficient | ||
| Upper Cau river | m1/3/s | 18 |
| Connecting branch | m1/3/s | 30 |
| Lower Cau river | m1/3/s | 40 |
| Overland flow—Strickler coefficient | ||
| Alluvial soil | m1/3/s | 25 |
| Grey feralit soil | m1/3/s | 18 |
| Sandy soil | m1/3/s | 16 |
| Yellow-red soil | m1/3/s | 18 |
| Degraded grey soil | m1/3/s | 18 |
| Rural residential land | m1/3/s | 25 |
| Non-agricultural land | m1/3/s | 22 |
| Perennial crops | m1/3/s | 20 |
| Annual crops | m1/3/s | 18 |
| Wet rice | m1/3/s | 27 |
| Water surface | m1/3/s | 33 |
| Unsaturated zone—Soil porosity | ||
| Kuz-Clay | m/s | 1.2 × 10⁻⁸ |
| Kuz-Silty clay | m/s | 2.45 × 10⁻⁶ |
| Kuz-Sandy loam | m/s | 8.5 × 10⁻⁶ |
| Kuz-Plastic clay | m/s | 2.085 × 10⁻⁴ |
| Kuz-Sand | m/s | 2.89 × 10⁻⁴ |
| Saturated zone | ||
| Kh-Horizontal hydraulic conductivity | m/s | 6.7 × 10⁻⁵ |
| No | Monitoring Site | Pollutant Parameters | ||||
|---|---|---|---|---|---|---|
| BOD5 | COD | Ammonium | Total N | Total P | ||
| 1 | Cau Tra Vuon | −9% | −11% | −14% | −19% | −20% |
| 2 | Cau May | −14% | −7% | −12% | −14% | −23% |
| 3 | Tan Phu | −9% | −6% | −15% | −20% | −26% |
| 4 | Cau Vat | −19% | −17% | −4% | −18% | −12% |
| 5 | Phuc Loc Phuong | −15% | −18% | −17% | −24% | −16% |
| 6 | Huong Lam | −6% | −21% | −9% | −10% | −24% |
| 7 | Hoa Long | −17% | −22% | −11% | −22% | −17% |
| 8 | Cau Thi Cau | −11% | −11% | −8% | −13% | −25% |
| 9 | Thong Ha | −16% | −12% | −10% | −15% | −21% |
| 10 | Hien Luong | −18% | −13% | −13% | −22% | −18% |
| No | Monitoring Site | Pollutant Parameters | ||||
|---|---|---|---|---|---|---|
| BOD5 | COD | Ammonium | Total N | Total P | ||
| 1 | Cau Tra Vuon | −14% | −18% | −13% | 4% | −17% |
| 2 | Cau May | −25% | −6% | −28% | −9% | −14% |
| 3 | Tan Phu | −8% | −9% | −26% | −10% | −9% |
| 4 | Cau Vat | −15% | −6% | −28% | −3% | −33% |
| 5 | Phuc Loc Phuong | −23% | −10% | −7% | −5% | −14% |
| 6 | Huong Lam | −24% | −14% | −13% | −7% | −12% |
| 7 | Hoa Long | −13% | −6% | −28% | −15% | −20% |
| 8 | Cau Thi Cau | −5% | −11% | −15% | −10% | −18% |
| 9 | Thong Ha | −9% | −13% | −23% | −14% | −22% |
| 10 | Hien Luong | −7% | −10% | −7% | −10% | −20% |
| No | Monitoring Site | Monitoring Site | ||||
|---|---|---|---|---|---|---|
| BOD5 | COD | Ammonium | Total N | Total P | ||
| 1 | Cau Tra Vuon | 8% | 8% | 12% | 17% | 13% |
| 2 | Cau May | 11% | 5% | 7% | 13% | 17% |
| 3 | Tan Phu | 7% | 5% | 13% | 19% | 24% |
| 4 | Cau Vat | 12% | 14% | 3% | 17% | 10% |
| 5 | Phuc Loc Phuong | 10% | 15% | 16% | 23% | 13% |
| 6 | Huong Lam | 4% | 18% | 8% | 6% | 23% |
| 7 | Hoa Long | 11% | 16% | 9% | 21% | 14% |
| 8 | Cau Thi Cau | 9% | 6% | 7% | 12% | 23% |
| 9 | Thong Ha | 12% | 6% | 8% | 15% | 18% |
| 10 | Hien Luong | 16% | 10% | 10% | 21% | 14% |
| Monitoring Site | Monitoring Site | ||||
|---|---|---|---|---|---|
| BOD5 | COD | Ammonium | Total N | Total P | |
| Cau Tra Vuon | 8% | 14% | 10% | 4% | 15% |
| Cau May | 10% | 3% | 14% | 9% | 9% |
| Tan Phu | 7% | 4% | 17% | 10% | 4% |
| Cau Vat | 7% | 5% | 26% | 3% | 22% |
| Phuc Loc Phuong | 15% | 5% | 6% | 5% | 5% |
| Huong Lam | 14% | 8% | 10% | 6% | 6% |
| Hoa Long | 9% | 3% | 23% | 7% | 17% |
| Cau Thi Cau | 2% | 11% | 14% | 6% | 11% |
| Thong Ha | 5% | 8% | 18% | 9% | 19% |
| Hien Luong | 4% | 7% | 4% | 8% | 15% |
Disclaimer/Publisher’s Note: The statements, opinions and data contained in all publications are solely those of the individual author(s) and contributor(s) and not of MDPI and/or the editor(s). MDPI and/or the editor(s) disclaim responsibility for any injury to people or property resulting from any ideas, methods, instructions or products referred to in the content. |
© 2026 by the authors. Licensee MDPI, Basel, Switzerland. This article is an open access article distributed under the terms and conditions of the Creative Commons Attribution (CC BY) license.
Share and Cite
Dung, T.T.; Thai, T.H.; Tri, D.Q.; Hong, N.V.; Minh, N.H. A Coupled MIKE SHE–MIKE 11 Framework for Simulating Surface–Groundwater Connectivity and Water Quality to Support Sustainable Water Management in the Cau River Basin. Sustainability 2026, 18, 7089. https://doi.org/10.3390/su18147089
Dung TT, Thai TH, Tri DQ, Hong NV, Minh NH. A Coupled MIKE SHE–MIKE 11 Framework for Simulating Surface–Groundwater Connectivity and Water Quality to Support Sustainable Water Management in the Cau River Basin. Sustainability. 2026; 18(14):7089. https://doi.org/10.3390/su18147089
Chicago/Turabian StyleDung, Tran Tien, Tran Hong Thai, Doan Quang Tri, Nguyen Van Hong, and Nguyen Hoang Minh. 2026. "A Coupled MIKE SHE–MIKE 11 Framework for Simulating Surface–Groundwater Connectivity and Water Quality to Support Sustainable Water Management in the Cau River Basin" Sustainability 18, no. 14: 7089. https://doi.org/10.3390/su18147089
APA StyleDung, T. T., Thai, T. H., Tri, D. Q., Hong, N. V., & Minh, N. H. (2026). A Coupled MIKE SHE–MIKE 11 Framework for Simulating Surface–Groundwater Connectivity and Water Quality to Support Sustainable Water Management in the Cau River Basin. Sustainability, 18(14), 7089. https://doi.org/10.3390/su18147089