Article

Impact of Sustainability, Production, Energy Consumption and Wage Burden of Industrial Enterprises on HoReCa and MRO Sectors Using PLSc-SEM Modelling

by
Małgorzata Sztorc
1,* and
Medard Makrenek
2
1
Department of Management and Organization, Faculty of Management and Computer Modelling, Kielce University of Technology, al. Tysiąclecia Państwa Polskiego 7, 25-314 Kielce, Poland
2
Department of Mathematics and Physics, Faculty of Management and Computer Modelling, Kielce University of Technology, al. Tysiąclecia Państwa Polskiego 7, 25-314 Kielce, Poland
*
Author to whom correspondence should be addressed.
Sustainability 2026, 18(14), 7084; https://doi.org/10.3390/su18147084
Submission received: 20 June 2026 / Revised: 7 July 2026 / Accepted: 8 July 2026 / Published: 10 July 2026
(This article belongs to the Section Economic and Business Aspects of Sustainability)

Abstract

Sustainable development views energy as a determinant of the interdependence between economic growth and ecosystem protection, which influences the specificity of energy-production relationships in the hospitality and catering sectors (HoReCa) and the Maintenance, Repair, and Operations (MRO) sector. The primary goal of this study is to identify and assess the structural relationships between environmental, fiscal, production, and energy factors in industrial enterprises and their impact on production and resource potential within the intersectoral network of the HoReCa and MRO sectors, taking into account emission burdens and fiscal instruments. The research procedure utilized partial least squares coherent structural equation modeling (PLSc-SEM). The model was built using Eurostat data from 2008 to 2020 for companies in 23 countries of the European Union. The analysis showed that the energy consumption of the hospitality and catering establishments (HoReCa) is the strongest predictor of MRO sector activity (β = 0.910), whereas the emission intensity of MROs exerts a comparatively minor effect. The results document the dominance of scale over emission intensity in shaping environmental burdens. Furthermore, they confirm the negative impact of environmental taxes on the remuneration fund of highly qualified specialists. The full mediation of operational scale was also demonstrated in the relationships between energy demand, emissions levels, and labor costs. The results of the study clearly indicate the need to integrate building energy policy with the decarbonization of technical services. From a macroeconomic perspective, this approach supports the achievement of sustainable development goals. Implementing predictive maintenance demonstrates a dual synergistic effect, combining maximized resource productivity with a simultaneous reduction in carbon footprint.

1. Introduction

The contemporary model of sustainable development (SD) treats energy as a key element that determines the integrated interdependence between economic growth, the protection of natural ecosystems, and social well-being [1]. Therefore, pro-ecological activity (Eco) plays a crucial role in industrial transformation. Its effectiveness can be assessed by examining the ratio between total environmental protection activities (E3) and market activities (E1). This ratio also influences how enterprises rationalize their management of material resources [2]. This type of efficiency is permanently linked to the market activity of enterprises, in which the ratio of the environmental sector and services (E2) to the total environmental protection activity (E3) becomes a criterion of the degree of environmental development of market structures [3].
At the same time, industrial activity (Work), measured by industry turnover (G1), labor input in industry (G2), hours worked by employees (G3), and wages and salaries (G4), is considered the productive pillar of the economy. Therefore, it should transform towards a “Genuine Savings” model that takes into account human capital and natural resources [4].
The effectiveness of the process of transforming enterprises towards sustainable development is also supported by fiscal instruments in the form of environmental taxes (Poll). In this sense, the configuration of taxes on energy (V1), pollution (V2), and transport favors the integration of unfavorable externalities and supports technological innovation [5].
Despite the growing debate surrounding the transition to green and renewable energy, the contemporary literature still reveals a fundamental research gap. This gap concerns a comprehensive presentation of the interdependencies between the structure of industrial production, the human resource management system, and genuine environmental performance. Interpretive concepts used to date are largely incomplete and typically focus on single macroeconomic indicators. Furthermore, existing research consistently fails to consider the synergistic effects of fiscal instruments and work-related obligations on the potential for achieving enterprises’ Sustainable Development Goals (SDGs) [4]. Therefore, there is a need to create an integrated model that would enable forecasting the dynamics and impact of regulatory burdens and operating costs on interdependent sectors of the economy, especially with regard to the implementation of the SDGs included in the 2030 Agenda [6,7].
In the advanced Consistent Partial Least Squares Structural Equation Modeling (PLSc-SEM) model, the identified industrial determinants (pro-environmental activity, environmental taxes, energy, and fiscal burdens) create a multifaceted network of relationships that directly impacts service sectors. The nature of these changes has a particularly significant impact on the hospitality and catering sector (HoReCa), which is considered a sensitive consumer of energy and services characterized by high demand elasticity. Furthermore, these transformations also impact the Maintenance, Repair, and Operations (MRO) sector, which in the PLSc-SEM model is a strategic pillar for the regularity of ongoing production processes and the resource efficiency of the entire system [8]. The consolidation of these areas enables a comprehensive presentation of the mechanisms that coordinate the modern industrial economy aimed at implementing the SD strategy in accordance with the 2030 Agenda.
Therefore, this article focuses on the analysis of a previously unexplored research area. This reflects the lack of integrated quantitative models that simultaneously define the links between environmental tax obligations, greenhouse gas emission reductions, energy, and the remuneration system, taking into account the mechanisms of technological consolidation in the MRO and accommodation/food service sectors. Current models typically consider energy efficiency without considering fiscal and remuneration regulations. As a result, this type of approach limits the full interpretation of the economic factors that determine greenhouse gas emission reduction processes. Therefore, the key premise of this research is to answer the research questions outlined below.
RQ1: To what extent is environmental activity associated with the level of energy consumption in industrial enterprises compared to the HoReCa and MRO sectors?
RQ2: To what extent is energy consumption in industrial enterprises associated with cross-sectoral relationships between environmental activity, labor intensity, and environmental tax burdens in the HoReCa and MRO sectors?
RQ3: Does environmental activity influence the relationship between energy consumption in industrial enterprises and the production and resource potential of the HoReCa and MRO sectors?
The primary objective of this study is to identify and assess the structural relationships between pro-environmental, fiscal, production, and energy factors in industrial enterprises and their impact on the production and resource potential in the network of intersectoral connections between HoReCa and MRO, taking into account emission burdens and fiscal instruments.
Within the framework of the research problem and study objective defined above, statistical data obtained from the Statistical Office of the European Communities (Eurostat) according to the NACE Rev. 2 classification for the Accommodation and Food Service activities (NACE I) and Maintenance, Repair, and Overhaul (NACE C33) sectors for the years 2008–2020 were analyzed. Due to the multidimensional nature of the energy management process and the lack of consistent and comprehensive analytical models for the relationships considered, an advanced quantitative approach was used to achieve the objective. Therefore, the research procedure was conducted using structural equation modeling (SEM) in accordance with the Consistent Partial Least Squares Structural Equation Modeling (PLSc-SEM) variant. This approach involves estimating SEM models while retaining the advantages of the PLS approach. However, it modifies the estimates for models with reflective constructs to increase consistency with the classical concept of latent variables.
The following sections of this article will present a review of the literature related to energy management in the HoReCa and MRO sectors. Next, the PLSc-SEM method will be thoroughly characterized, and the research sample will be analyzed. The next section will present the results of structural equation modeling. Finally, the final section will present conclusions and implications for energy management practice and theory in the sectors analyzed. These conclusions are the result of an analysis conducted to assess the structural relationships involved in energy cost optimization. The analysis also covered fiscal tools designed to increase operational efficiency while reducing the carbon footprint in cross-industry supply chains.
In the previous article, entitled “Assessing the Interdependencies Between the Production, Environmental and Fiscal Activities of European Union Industrial Enterprises Using Structural Equation Modeling”, the authors attempted to construct a theoretical model of sustainable development, including three latent variables: Work, Eco, and Poll, for industrial enterprises from 24 European Union countries [9]. This study expands on this concept by including an additional variable, energy, in the model and extending the analysis to the HoReCa and MRO sectors.

2. Literature Review

2.1. Relationships Between Production, Energy, and Environmental and Fiscal Conditions in Industrial Enterprises from a Sustainable Development Perspective

Today, the industrial sector is operating in the midst of intense energy and ecological transformation. This implies the need to achieve complete climate neutrality [10,11,12,13,14]. Such actions stem from global decarbonization strategies, which include implementing the “Net-Zero” policy by 2050 [15,16,17,18]. It obliges businesses to regularly reduce their carbon footprint at every level of the production process. The operational management process in industrial enterprises is focused on implementing complex environmental strategies. Their goal is to reduce resource consumption while simultaneously increasing energy efficiency [19,20,21,22,23].
The structure of the relationships between production levels and energy demand indicates an interdisciplinary structure. It is determined by the ongoing technological changes introduced as part of the Fourth Industrial Revolution [2,24]. A key component of the endogenous mechanisms of production activity is the emerging fiscal instruments, in particular ecological taxes, emission fees, and the Emissions Trading System (ETS) [25,26]. They impose on the management level the burden of entities with the costs of external effects [27].
Environmental taxes are considered an effective financial instrument that motivates enterprises to implement pro-environmental technologies and improve the processes of fossil fuel consumption [28]. In addition, industrial activity causes high social costs, which are reflected in the deterioration of the health of the population [29,30]. They oblige the use of an integrated approach to ensuring the well-being of the population living in areas with a high concentration of industry.
The established assumptions for sustainable development (SD) require a redefinition of traditional production process strategies by consolidating financial goals with the environmental and social performance of companies. Therefore, rationalizing environmental impact costs is recognized as an essential component in creating a competitive advantage. It is based on the synergy between value creation and sustainable management of natural resources [31]. In turn, managing the redistribution of the added value generated implies the need to take into account the needs of a wide range of stakeholders using a transparent and effective process of settling fiscal, wage, and environmental obligations [32].
Therefore, effective transformation of enterprises implies the need to precisely and dynamically shape the relationships between energy flows, economic value, and greenhouse gas emissions in sustainable supply chain systems [33]. Improving production processes in a situation of increasing ecological restrictions is considered a key premise to ensure long-term economic sustainability and continuity of energy supplies for modern economic entities [34,35,36].
Energy supply security is a strategic issue for the economies of individual countries in the European Union (EU). Their stable operation depends on the continuous generation and distribution of electricity. This process is particularly important for the hotel and catering (HoReCa) and maintenance, repair, and operations (MRO) industries. Due to the growing number of hotels and catering establishments, the demand for energy and technical maintenance of such facilities is systematically increasing. This situation results in an increased demand for energy resources and a rationalization of energy consumption. In turn, the EU’s energy strategy is characterized by a strong dependence on established climate policy. It is focused on energy transformation, which involves decarbonization, the development of renewable energy sources, and the reduction in greenhouse gas emissions in accordance with the European Green Deal (EGD).
A significant energy intensity characterizes the contemporary hotel and catering sector. It should be noted that operating costs rank second in the operating expenses of such facilities. This structure of financial outlays dictates the need to strongly integrate the technical condition of the infrastructure with its energy efficiency [37]. The key link in this process is a data-driven management model. Building infrastructure control systems consolidate decentralized installations, including heating, ventilation, air conditioning (HVAC), lighting, and thermal energy supply systems, into an integrated functional system [38,39]. From this perspective, it should be concluded that MRO processes are not solely reactive activities aimed at eliminating faults. Instead, they serve as tools for dynamically implemented energy optimization using closed-loop maintenance [40,41]. This system provides continuous verification of the technical reliability of the infrastructure. This identifies potentially destabilizing irregularities that can lead to inefficient energy use in the phase preceding a failure [37,42,43,44,45].
Automated repair request generation using performance diagnostics enables maintenance staff to perform targeted interventions. These interventions minimize energy deficiencies resulting from the improper design or operation of infrastructure components. This combination is supported by advanced Building Information Modeling (BIM) and machine learning algorithms that determine predictive energy load management [38,46]. Using retrospective data and energy simulations, hotels and catering sector facilities can dynamically adapt their air conditioning and heating systems to actual needs. This solution is crucial to meeting the EU guidelines on decarbonization and CO2 reduction [47].
This interdependence also takes into account the business aspect of accommodation facilities as a result of the integration of technical infrastructure with reservation management systems and databases of the hotel and catering sector (solutions such as the Property Management System (PMS) [38,39,48,49,50]), ensuring that installations automatically switch to energy-saving mode immediately after guest check-out. This technology reduces wasteful resource use in inactive spaces while maintaining a professional standard of customer service during guests’ stay [51,52,53].
In relation to EDG, the integrated concept presented is a key paradigm for intelligent facility management in the hotel and catering sector [54,55,56]. Consequently, it enables hotels and restaurants to both reduce operating costs and adapt to new environmental taxes resulting from carbon fees, compliance costs included in Fit for 55 (Ff55), and Environmental, Social, and Governance (ESG) reporting requirements [57]. Therefore, effective coordination of maintenance (MRO) projects with energy requirements ensures optimization of the infrastructure lifecycle and improved quality of the facility’s internal environmental parameters. In the long term, this integration of the system determines the competitive advantage of the company in the market [58].
Due to the ongoing climate and energy crisis and the ambitious goals set by the Paris Agreement, the EU is consistently implementing the provisions of the Green Deal and FF55, with the aim of achieving climate neutrality by 2050. This type of transformation requires a fundamental reduction in the carbon footprint in all sectors of the economy. It should be emphasized that the construction sector plays a key role in this regard, generating nearly 40% of energy consumption in EU countries [59,60]. In this respect, the hotel and catering industry, which is considered a service sector characterized by exceptionally high energy consumption, is obliged to implement advanced energy management systems.
For this reason, this article examines the interdependencies between the hotel and restaurant sector and MRO processes in the maintenance and repair of energy-intensive installations, such as HVAC systems, refrigeration equipment, heating systems, and electrical systems. Taking into account the above conditions, it should be noted that ensuring operational continuity and optimal efficiency of the technical infrastructure is the basis for energy efficiency and optimizing the life cycle of buildings [38]. This type of cooperation ensures a shift from a reactive repair model to data-driven management that implies climate neutrality.
The research conducted to date highlights the decisive impact of environmental regulations on corporate financial results. The EU Emissions Trading Scheme (EU ETS) and the intended extension of emissions fees to include, among others, developed real estate (ETS 2) impose additional financial burdens on accommodation businesses and MRO sector entities [61]. This establishes low emissions as a competitiveness factor. At the same time, existing analyses of labor costs and wages have focused primarily on the threat of job losses in mature sectors of the economy or the need to acquire new qualifications. In turn, sporadic empirical studies synthesize fiscal variables related to environmental taxes with the motivational impact of the remuneration system aimed at intensifying energy innovation in the HoReCa sector [62].
It should be concluded that the production activity of an industrial sector is determined by the intensity of energy use. An advanced strategic perspective implies the need to replace typical methods of removing pollution with advanced technologies that address the source of its generation. Furthermore, the distribution of value generated by the company in the form of remuneration constitutes a fundamental component of the social dimension of SD. Staff remuneration includes gross wages and benefit packages, which directly impact the degree to which the subsistence needs of employees and their families are met. Sales volume, in turn, is a criterion for determining the value of the pollutant emission indicator, proportional to the scale of operations.
Therefore, industrial enterprises are focused on generating higher revenues while simultaneously reducing the amount of pollutants emitted per unit of sales. The coordination of economic, social, and energy goals determines the need for an effective distribution of added value between employees, the state budget, and corporate expenditures on modern technologies that reduce greenhouse gas emissions.

2.2. Systemic Links Between Industry, MRO, and the HORECA Sector in Terms of Sustainable Energy Use, Material Production, and Labor Costs

Contemporary models of economic organization generate the need for direct consolidation of industrial and service processes, as well as infrastructure maintenance projects, to rationalize the exploitation of resources [63]. The diagnosis of structural relationships between the industry, the operation of machinery and equipment (MRO), and the hotel and catering services sector (HoReCa) conducted to date has shown the existence of significant cause-and-effect links [64]. The observed relationships determine the effectiveness of resource management in modern market systems. Implementing SD strategies requires companies to achieve economic, environmental, and social goals according to the Triple Bottom Line (TBL) concept, within the framework of the full life cycle of technical infrastructure [65].
The TBL strategy provides the foundation for implementing energy-efficient, environmentally friendly solutions in service and production systems. In this way, it generates an ecological advantage for companies by reducing greenhouse gas emissions. From an economic perspective, it contributes to the rationalization of operating costs. An integral component of SD is the actions taken by companies to improve energy efficiency (EE), reduce energy demand, and optimize energy consumption [63]. These procedural solutions lead to the emergence of an energy efficiency gap. This gap is characterized by above-average energy use in companies, exceeding their actual needs and technological capabilities [66].
The HoReCa sector is considered to be a particularly energy-intensive area of service activity, which generates an exceptionally intense level of demand for energy carriers [67]. Hotel and restaurant facilities use three to six times more energy than commercial buildings. HVAC systems are responsible for approximately 50–75% of total energy consumption in hotels and restaurants [68,69]. However, the percentage of such installations varies depending on the location of the facility and the prevailing weather conditions in a given region. It is estimated that up to 38% of total energy consumption is attributed to such facilities located in, for example, London, which primarily use heating [70]. However, in tropical climate conditions or during high summer temperatures in Southern Europe, air conditioning is primarily used [71].
The high level of energy demand for HVAC systems indicates their key role in maintaining operational efficiency. Therefore, the high level of operational activity of the installations analyzed determines the demand structure for MRO services [65]. Technical maintenance, repairs, and overhauls are fundamental components in maintaining process operational continuity and energy efficiency of the system. These interdependencies determine the need for intensive cooperation with the MRO sector [72]. It should be noted that any irregularity or reduction in the efficiency of HVAC installation results in a significant increase in energy costs and reduces the comfort of guests in hotels and restaurants [73]. Therefore, it should be noted that energy management systems in HoReCa facilities focus primarily on the management of the HVAC system. These installations have the highest environmental impact and generate the highest financial costs [69,74].
Based on the literature review, the following research hypotheses were formulated:
H1. 
The increase in the scale of MRO services in industrial enterprises increases the level of pollutant emissions related to energy processes, increasing the environmental burden of these enterprises’ operations. MRO → Eco.
H2. 
The higher intensity of pollutant release into the environment associated with MRO services translates into the systematic use of statutory tax exemptions and deductions supporting pro-environmental investments, resulting in an effective reduction in costs associated with environmental taxation. MRO → Poll.
H3. 
Increasing the scope of MRO services focused on energy infrastructure generates an increase in the share of wages of employees with high technical qualifications in the total labor costs of industrial enterprises. MRO → Work.
H4. 
The emission intensity of industrial and MRO processes contributes to absolute greenhouse gas emissions independently of the scale of operations, consistent with the Kaya decomposition identity. Energy → Eco.
H5. 
A higher intensity of pollutant emissions resulting from MRO sector activity translates into a lower effective level of environmental tax burden due to the widespread use of tax deductions and financial support mechanisms for pro-ecological investments, consistent with the double-dividend hypothesis. Energy → Poll.
H6. 
High intensity of emissions and energy consumption in MRO operational activity increases the share of wages among employees with specialized technical qualifications, reflecting the higher capital intensity and technological complexity of high-carbon repair processes. Energy → Work.
H7. 
The growth in the scale of operations of HoReCa sector enterprises increases the demand for MRO services in the area of energy infrastructure, intensifying environmental and cost linkages with the industrial sector. Hotel → MRO.
H8. 
The intensification of environmental tax burdens on the MRO sector is associated with compression of the sector’s wage fund, reflecting the transfer of fiscal costs to production factors under conditions of limited price elasticity of demand for repair services. Poll → Work.
In addition to the eight hypothesized paths, the structural model includes two additional paths (Eco → Poll and Eco → Work). These paths were retained to preserve a fully recursive model specification and to avoid omitted-variable bias when estimating the remaining relationships [75,76,77,78,79,80]. These are not formulated as separate research hypotheses and are discussed in Section 5.5.
There are significant gaps in the literature on the mechanisms of energy efficiency interaction between the MRO sector and its target customers in the HoReCa sector [81,82,83,84]. Most of the studies conducted that take into account the specificity of MRO services focus on the aviation and defense sectors [74,85,86]. Furthermore, knowledge about the impact of such activities on the natural environment, especially in this sector, is limited. Therefore, the research conducted to date does not include an analysis of the entire area of maintenance, repair, and operation activities across sectors.
Relatively few studies focus on the analysis of the impact of the behavior of guests and employees in the HoReCa sector on the economic benefits resulting from the implementation of innovations and pro-environmental technologies in this type of facility [87,88]. Therefore, it is necessary to recognize attitudes and assess their impact on the effectiveness of energy efficiency improvement systems. It should also be noted that most publications focus on developed markets, failing to consider the specificities of developing countries in relation to the implementation of the SDG [84,89].
Previous studies most often used standard DEA and CB-SEM methods, omitting the advantages of the PLSc estimator used to analyze the structural heterogeneity of enterprises from the 27 EU countries (EU-27) with different emission intensities [90,91,92]. Therefore, the use of the PLSc-SEM model in this article contributes to the development of this research area and the current state of knowledge by integrating the technological, economic and social areas into a coherent analytical framework. This research approach enables the identification of key constraints in the mechanisms of transfer of energy efficiency between industry and services based on modern technologies. Additionally, it provides a conceptual foundation for the process of designing more effective decarbonization strategies for the EU economies.
Verifying the structural relationships presented using the PLSc-SEM model enables a precise mapping of the structure of the impact paths between the HoReCa and MRO sectors, as well as labor and energy costs. This facilitates a deeper understanding of the systemic patterns of interdependence and the role of the MRO sector as a mediator in the transition to a low-carbon economy. These interdependencies exist between infrastructure investments, maintenance strategies in relation to labor costs, and sustainable resource use.
Future research should focus on developing decision-making models tailored to the specific nature of emerging markets, dynamically changing consumer behavior, and focusing on achieving further sustainable development goals.

2.3. Theoretical Contribution and Positioning of the Study

The existing literature on sustainable industrial development, energy economics, and intersectoral relationships is characterized by a persistent theoretical fragmentation: scale-composition-technique decomposition frameworks (e.g., the Kaya identity) have been applied primarily within single-sector emissions accounting, double-dividend and polluter-pays fiscal theories have been developed largely independently of production-scale mechanisms, and Triple Bottom Line frameworks rarely specify the transmission channels through which demand in one sector propagates environmental and labor market outcomes in another. Furthermore, as noted in Section 2.2, existing MRO research has concentrated on single-sector applications (notably aviation and defense), leaving the theoretical status of MRO as a general-purpose intersectoral transmission mechanism underdeveloped.
The literature on sustainable industrial development, energy economics, and intersectoral relationships remains theoretically fragmented. Scale-composition-technique decomposition frameworks (e.g., the Y. Kaya identity) have been used primarily to explain emissions within individual sectors, whereas fiscal approaches based on the double-dividend and polluter-pays principles have generally evolved independently of production-scale mechanisms. Similarly, Triple Bottom Line frameworks rarely identify the channels through which demand originating in one sector influences environmental and labor market outcomes in other sectors. Moreover, as discussed in Section 2.2, previous MRO research has focused predominantly on single-sector applications, particularly in the aviation and defense industries, leaving its role as a general intersectoral transmission mechanism largely unexplored.
This study addresses this fragmentation by proposing and empirically testing an integrated demand-transmission framework, in which service-sector energy demand (HoReCa) is theorized as an upstream driver that propagates through an intermediary maintenance sector (MRO) to generate downstream environmental (Eco), fiscal (Poll), and labor market (Work) outcomes. In doing so, the study extends the Kaya decomposition logic beyond its conventional single-sector emissions application to a cross-sectoral demand-transmission context, links this scale-intensity decomposition explicitly to double-dividend and polluter-pays fiscal mechanisms, and situates both within a labor market lens sensitive to the distributional consequences of environmental fiscal policy. The theoretical contribution of this study therefore lies not in any single theoretical strand in isolation, but in the explicit integration of these strands into a testable structural framework—operationalized here via PLSc-SEM—capable of tracing how a single upstream demand shock (energy consumption in HoReCa) is transmitted through an intersectoral mechanism (MRO) to shape environmental, fiscal, and labor outcomes simultaneously.
This study addresses this theoretical fragmentation by proposing and empirically testing an integrated model of demand transmission. It conceptualizes service-sector energy demand in the HoReCa sector as an upstream driver that propagates through the maintenance, repair, and overhaul (MRO) sector, shaping environmental (Eco), fiscal (Poll), and labor market (Work) outcomes. In doing so, the study extends the logic of the Kaya decomposition beyond its traditional application to single-sector emissions by applying it to cross-sectoral demand transmission. It also links this perspective with the double-dividend and polluter-pays principles while incorporating a labor market perspective that highlights the distributional effects of environmental fiscal policy. The main theoretical contribution lies in integrating these complementary perspectives into a coherent structural model that can be empirically tested using PLSc-SEM. This approach makes it possible to examine how changes in upstream energy demand in the HoReCa sector are transmitted through the MRO sector and jointly influence environmental, fiscal, and labor market outcomes.


3. Materials and Methods

3.1. Data Sources and Characteristics of the Research Sample

The empirical analysis is based on data obtained from Eurostat databases. These data cover the economic, environmental, fiscal, energy, and cross-sectoral activities of industrial, HoReCa, and MRO enterprises. The collected variables are fully harmonized with the European System of National and Regional Accounts (ESA 2010) and the System of Economic and Environmental Accounts (SEEA-CF 2012), ensuring their comparability across 64 activity classes according to the NACE Rev. 2 classification [93,94].
The studied MRO sector (NACE C33) was described using three variables from the Structural Business Statistics database: production value (EUR million), number of employees (thousands of people), and gross investment in fixed assets (EUR million) [95]. Additionally, data on greenhouse gas emission intensity were collected for the indicated sector. These data are measured by the ratio of direct GHG emissions to the gross value added at constant 2020 prices, expressed in grams of equivalent CO2 per euro [94]. In addition, variables related to total GHG and CO2 emissions are taken from the air emissions accounts database [94].
In turn, information on environmental and energy tax revenues attributed to the MRO sector (EUR million) was obtained from the environmental taxes database by economic activity [94]. The compensation of the sector’s employees (EUR million, current prices) was obtained from the national accounts database according to ESA 2010 [93]. Data on energy consumption by the accommodation and catering sector (NACE I) were taken from the physical energy flow accounts database [94].
The economic link between NACE I and the C33 sectors was then established, documented using national supply and use tables. These tables record, among other things, the value of the HoReCa sector’s intermediate input into MRO services. Between 2010 and 2023, the NACE I sector purchased MRO services worth an average of EUR 55.5 million per year [96]. This type of situation confirms the economic link between the energy infrastructure in the HoReCa sector and the MRO services.
For this study, data from companies in 27 EU countries were initially considered for the period 2008–2020. Due to unavailable data for at least one required indicator across the full study period, Cyprus, Luxembourg, Malta, and Greece were excluded from the analysis, yielding a final sample of 23 countries. The resulting panel is unbalanced: while most countries (n = 18) provide complete annual observations (13 years), five countries (Czech Republic, France, Ireland, Netherlands, Slovenia) have incomplete year coverage due to missing values in one or more constituent indicators, subject to listwise deletion. This yields a final estimation sample of N = 282 country-year observations (18 × 13 + 6 + 11 + 7 + 12 + 12 = 282).
Furthermore, due to limited access to source data on energy consumption in the HoReCa sector before 2014 for some companies in EU countries, backward linear extrapolation was performed for the years 2008–2013 [97]. To assess the validity of this procedure, the extrapolated values of h1 for 2008–2013 were cross-validated against an independent proxy of tourism sector activity—total nights spent at tourist accommodation establishments, residents and non-residents combined (Eurostat, dataset tour_occ_ninat). The two series exhibit a strong and statistically significant positive correlation (r = 0.878, p < 0.001, n = 128, 95% CI [0.830; 0.912]), supporting the reliability of the extrapolated values. It should be noted that this validation dataset covers accommodation services (NACE I55) and does not include food service activities (NACE I56), which form part of the broader NACE I sector represented by h1; the correlation should therefore be interpreted as validating the accommodation-related component of the extrapolated series. In turn, based on the average intensity of GHG emissions for the MRO sector, two groups of enterprises from countries were distinguished: high intensity (WIE) and low intensity (NIE). This type of action allowed for the reflection of the known heterogeneity of energy efficiency in the EU.
All nominal variables are expressed in EURos million (current prices). The intensity of emissions is expressed in constant prices for 2020. During the pre-estimation phase, all variables were standardized using the Z-score method to ensure comparability.

3.2. Operationalization of Variables and Specification of Constructs

The PLSc-SEM model is built on six latent constructs, operationalized using ten observable indicators derived from the Eurostat databases described in Section 2.1. All constructs are specified as reflective measurement models. Therefore, indicators are treated as manifestations of a latent variable, with the direction of causality running from the construct to the indicators [98].
Three constructs were measured with a single indicator (single-item specification), and another three with two or three indicators. The use of single-item constructs is justified by the lack of alternative indicators with comparable geographic and temporal scope. Additionally, the indicated constructs are operationalized using objective administrative variables rather than subjective perceptual scales [97,98].
The MRO construct (exogenous, 3-indicator) reflects the scale of activity in the machinery repair and installation sector (NACE C33). It is characterized by the following indicators: production value, employment, and gross investment. These indicators are strongly correlated and have high external loadings, confirming their common representation of the construct. In turn, the Energy category (exogenous, single-item) measures the intensity of greenhouse gas emissions from the MRO sector as the ratio of GHG emissions to gross value added (g CO2 per EUR). The single-element specification of this construct comes from the limitations of the data and the specificity of the variable. The latent variable Hotel (exogenous, single-element) represents the total energy consumption of the hotel sector (NACE I) and is expressed in terajoules. Furthermore, it constitutes an exogenous demand factor for MRO services in the model. The next level of analysis is the latent variable Eco (endogenous mediator, two-indicator). It operationalizes the absolute GHG and CO2 emissions of the MRO sector and distinguishes their environmental dimension in terms of the scale of operations and emission intensity. These indicators follow the System of Environmental-Economic Accounting (SEEA) framework, which reports emissions on a territorial/production basis; they do not distinguish emissions by organizational source (e.g., direct fuel combustion versus purchased electricity) in the manner of the GHG Protocol’s Scope 1/Scope 2 classification, a data limitation discussed further in Section 5.6. These indicators follow the System of Environmental-Economic Accounting (SEEA) framework, which reports emissions on a territorial (production-based) basis. As such, they do not distinguish between organizational sources of emissions, such as direct fuel combustion and purchased electricity, as in the GHG Protocol Scope 1/Scope 2 classification. This represents a data limitation, which is discussed in further detail in Section 5.6. The next dimension, classified as Poll (endogenous mediator, 2-indicator), reflects the fiscal burden on the MRO sector resulting from environmental and energy taxes. The final construct, Work (endogenous outcome, single-item), characterizes the economic performance of the MRO sector in relation to employee compensation costs.
The summary of the structures, indicators, and source data is presented in Table 1.

3.3. Specification of the PLSc-SEM Model

In the measurement model, all latent constructs are specified as reflective models, and each observable indicator is treated as an effect, not a cause, of the underlying construct. The value of the indicator x i j measured for the i-th instrument of the j-th construct is expressed by the formula:
x i j   =   λ i j   × ξ j + ε i j
where λ i j is a factor loading that determines how strongly the indicator reflects the construct ξ j . However ε i j   is a component of measurement error specific to a given indicator, uncorrelated with other indicators and with the construct [97,98]. As the factor loading value increases λ, the explanatory power of the indicator in relation to the latent variable is strengthened. In turn, its acceptability threshold is λ ≥ 0.70 [99].
In contrast, the structural model describes the directional causal relationships between constructs. Each endogenous construct ηk is explained by other constructs in the model described by the equation:
  η k   =   Σ j β k j   ×   ξ j   +   Σ l k β k l   ×   η l   +   ζ k
where the first component of the equation aggregates the influences of exogenous constructs ξj (Hotel, Energy) on ηk. The second predictor concerns the influence of the remaining endogenous constructs ηl (np. Eco na Poll). β coefficients are standardized and directly comparable regardless of the units of measurement. In turn, the component ζk represents the unexplained part of the variance. The degree of fit of the model to the empirical data is verified using the coefficient of determination according to the formula below:
  R k 2   =   1     V a r ( ζ k ) V a r ( η k )
where Var(ζ_k) is the variance of the residual component (ζ_k) for the k-th constructor, and Var(η_k) is the total variance of the endogenous latent variable η_k (i.e., the k-th constructor) in the model.
It takes values from 0 (no explanation) to 1 (full explanation of the variance of the construct by its antecedents in the model).
Standard PLS-SEM estimates construct scores as weighted linear combinations of indicators. This approach is robust to normality violations because it systematically underestimates the correlations between constructs. Therefore, the attenuation bias is determined by the structural specificity of PLS composites, which absorb measurement error that distorts the true relationships between latent variables [100,101]. In turn, the probabilistic limit of the correlation between two PLS composites is the following.
p l i m ( r ^ j k P L S )   =   φ j k ρ A , j   ·   ρ A , k
where φjk denotes the theoretical correlation between latent constructs, while ρA,j represents the coefficient of consistency reliability (Dijkstra–Henseler) of the construct j-th.
The property ρA,j ≤ 1 indicates that the denominator is always less than one. Therefore, PLS systematically underestimates the correlations between constructs and consequently distorts the path coefficients. This limitation has been overcome in a consistent variant of the algorithm (PLSc) by Dijkstra and Henseler, in which bias elimination occurs according to a mathematical correction of the correlations between latent variables [100,101]. Therefore, the following correction equation was obtained:
φ ^ j k P L S c   =   r ^ j k P L S ρ ^ A , j   ·   ρ ^ A , k
where r ^ j k P L S is the uncorrected estimate of the correlation coefficient between constructs j and k obtained by the standard PLS method, ρ ^ A , j is the reliability index of the reflective construct j, measuring the consistency and reliability of the measurement of this construct, and ρ ^ A , k is the reliability index of the reflective construct k.
Thus, the above correction procedure involves scaling the observed PLS correlation by the square root of the product of the reliability coefficients of both constructs. The value of the reliability estimate ρ ^ A,j is determined using the formula:
ρ ^ A , j   =   W ^ T Σ j   W ^ j ( W ^ T   ·   1 ) 2
where W ^ j is the vector of external weights of the construct j, and Σj is the covariance matrix of its indicators.
Intuitively, this type of relationship indicates that the numerator reflects the total empirical variance of the PLS composite. The denominator, on the other hand, represents the theoretical variance of the optimal (error-free) saturation of factor loadings.
Simulation studies conducted to date confirm that the PLSc estimators are asymptotically consistent and exhibit bias comparable to that of the CB-SEM method. This consistency is particularly evident under normal distribution conditions and while maintaining robustness to violations of this assumption [100,101]. This methodological feature is particularly important in the case of panel data for companies from 23 EU countries, where there is a clear asymmetry in the distribution of emission and fiscal indicators. A characteristic feature of this approach is the high stability and robustness of the parameters even when this assumption is violated.
In the PLSc-SEM model, the internal consistency of each multi-indicator construct is assessed using Dijkstra’s coefficient of consistent reliability (ρA) [100] and the composite reliability measure (ρC), whose values should exceed the critical threshold of 0,70 [99]. Convergent validity is verified on the basis of the Average Variance Extracted (AVE). An AVE value > 0.50 indicates that the variance explained by a given construct exceeds the variance of the measurement error [99]. The evaluation of discriminant validity is based on the HTMT coefficient (heterotrait-monotrait ratio of correlations), which was proposed by J. Henseler, C.M. Ringle, and M. Sarstedt, taking into account the rigorous criterion of HTMT < 0.85 [102]. In the case of single-element variables, reliability measures and the AVE index are not applicable, assuming a tautological value of one [97,98].
For this study, statistical inference was performed in the PLSc-SEM model using the BCa (bias-corrected and accelerated) bootstrap procedure. The confidence intervals were constructed based on 10,000 replications generated by random sampling with replacement from the initial dataset [103].
According to the literature, the path coefficient is considered statistically significant at the 5% level if the given 95% BCa interval does not contain zero. Verification of the significance of indirect effects is based on the path product method using an analogous bootstrap procedure [104].

3.4. Estimation Procedure

The estimation process of the PLSc-SEM model was performed using the SEMinR package (version 2.3.4) for the R environment [105]. The research was conducted using the RStudio software version 2023.06.0 Build 421. The software used is based on the consistent PLS algorithm (PLSc) according to the assumptions of T.K. Dijkstra and J. Henseler [100,106]. A path weighting scheme was used for internal model estimation. This optimizes internal weights by taking into account the directionality of structural relationships and is the recommended choice for models with directional hypotheses [99]. The computational procedure was preceded by standardizing all variables to a distribution with mean zero and standard deviation one [107]. In the model structure, the multi-indicator variables (MRO, Eco, Poll) were assigned the status of reflective models (reflective function), which enabled the use of attenuation correction by the PLSc estimator. In the case of single-item constructs (Energy, Hotel, Work) introduced by the single_item() function, reliability and AVE are conventionally set to unity, as these coefficients are computationally undefined for a single indicator rather than empirically demonstrated [97,106]. This is a modeling convention rather than evidence of measurement quality, and single-item operationalization is best understood as a composite proxy for the underlying construct rather than a fully validated latent measurement; we discuss the resulting limitations in Section 5.6.
The statistical significance of path coefficients, external loadings, and indirect effects was verified using the BCa bootstrap procedure. The confidence intervals were constructed based on 10,000 replications drawn from the analytical sample of 282 observations [103]. In turn, the path coefficient is considered statistically significant at the 5% level if the corresponding BCa (95%) interval does not contain zero. Cases meeting the more stringent criteria of significance at the 1% and 0.1% levels are reported additionally.
The quality of the measurement model is determined by four key criteria: external loadings λ > 0.70, reliability coefficients ρA and ρC > 0.70, AVE > 0.50, and HTMT < 0.85 [98,101,106]. The explanatory power of a structural model is determined by the R2 coefficients and the adjusted R2. The latter measure adjusts for the number of predictors and sample size. This eliminates artificially inflated fit due to overparameterization. The analysis is complemented by Cohen’s f2 effect size statistic [99].
The analytical procedure is complemented by the estimation of indirect effects, carried out using the product of path coefficients method based on bootstrap BCa intervals [103,105]. Therefore, full mediation is inferred. This process occurs most often when the direct effect of the independent variable on the outcome variable becomes statistically insignificant after the introduction of the mediator, while the indirect effect itself remains significant.
Moreover, within the PLSc-SEM approach, the standardized path coefficients can mathematically exceed the value of 1.0. This situation is a direct consequence of implementing an attenuation correction in the correlations between the constructs, inducing a suppression effect in the structure of the model relationships [98,106]. The basis for the interpretation of the Energy → Eco path is the emission decomposition identity:
absolute emissions = scale of activity × emission intensity.
This kind of formulation is directly rooted in the analytical concept of Kay [108].

4. Results

4.1. Evaluation of the Measurement Model

The results of the evaluation of the PLSc-SEM measurement model are presented in Table 2. All latent constructs meet the key reliability and validity criteria. The composite reliability (ρA) and composite reliability (ρC) coefficients exceed the minimum threshold of 0.70 and range from 0.962 (MRO) to 1.000 (Hotel, Energy, Work). However, the average extracted variance (AVE) exceeds 0.50, confirming the convergent validity of the measurement model [99]. In the case of single-item constructs (Energy, Hotel, Work), the indicated values are 1 and are in line with established research practice [98].
In turn, all external loadings exceed the recommended value of 0.70, ensuring a strong and reliable representation of the latent constructs in the model’s measurement structure. Individual loading values and their bootstrap confidence intervals are presented in Table 2.
All latent constructs in Table 2 demonstrate very high reliability and measurement validity, as confirmed by the values of the ρA, ρC and AVE that exceed the recommended thresholds. Furthermore, high external loadings (λ) along with narrow confidence intervals indicate a strong and stable representation of the indices in the PLSc-SEM measurement model.
For the purpose of evaluating the validity of the discriminant, the HTMT index was used, the detailed level of which is presented in Table 3.
It should be noted that all values are below the conservative threshold of 0.85. However, the Work–MRO construct pair (0.928) is an exception, as it is above the maximum allowable limit of 0.90. However, it is acceptable due to the strong economic correlation between the scale of MRO sector activity and wage levels. This relationship is well-established in the literature and is theoretically consistent [99]. The remaining HTMT index values range from 0.086 to 0.910. This result confirms their full consistency on theoretical grounds and with empirical research conducted to date [108,109,110].
To further verify discriminant validity, we report the Fornell–Larcker criterion (Table 4) and indicator cross-loadings (Table 5). Both confirm discriminant validity across all construct pairs: the square root of AVE for each construct exceeds its correlations with all other constructs, and every indicator loads most strongly on its assigned construct. We note that the external loading of x9 (environmental tax revenues) marginally exceeds the theoretical ceiling of 1.0 in the bootstrapped estimation (Table 2), a phenomenon attributable to the near-perfect correlation between the two Poll indicators (x9, x10: r = 0.991) interacting with the PLSc attenuation-correction algorithm. This is analogous to, though marginally more pronounced than, the comparably high correlation observed between the Eco indicators (x7, x8: r = 0.994), and is a documented characteristic of the PLSc estimator under near-collinear reflective indicators [100,101] rather than evidence of an improper solution. We retain both indicators for theoretical completeness (environmental and energy tax revenues are conceptually distinct fiscal instruments), while acknowledging this measurement limitation in Section 5.6. To further assess discriminant validity, we report the Fornell–Larcker criterion (Table 4) and indicator cross-loadings (Table 5). Both approaches support discriminant validity across all construct pairs, as the square roots of AVE exceed the inter-construct correlations and each indicator loads highest on its intended construct.
Both indicators are retained for theoretical completeness, as environmental and energy tax revenues represent conceptually distinct fiscal instruments. The associated measurement limitation is discussed in Section 5.6.

4.2. Results of the Structural Model

The estimation of the PLSc-SEM structural model for the surveyed enterprises is presented in Table 6.
Paths Eco → Poll and Eco → Work were included in the structural model to preserve its fully recursive specification (avoiding omitted-variable bias in the estimation of the remaining paths) but were not formulated as separate research hypotheses; they are discussed in Section 5.5 in relation to the interpretation of H2. Variance Inflation Factors for all structural antecedents are reported in Table 7 to assess potential collinearity, particularly for the Work construct.
VIF values above the conservative threshold of 3.0 (Hair et al. [99]) are observed for several antecedents of Poll and Work, most notably Eco as a predictor of Work (VIF = 8.090), consistent with the elevated HTMT (Work, MRO) = 0.928 reported in Table 3. A sensitivity analysis confirms that the H3 coefficient (MRO → Work) changes by only 7.3% when the non-significant Eco → Work path is excluded from the model, indicating that the finding is not primarily an artifact of collinearity.
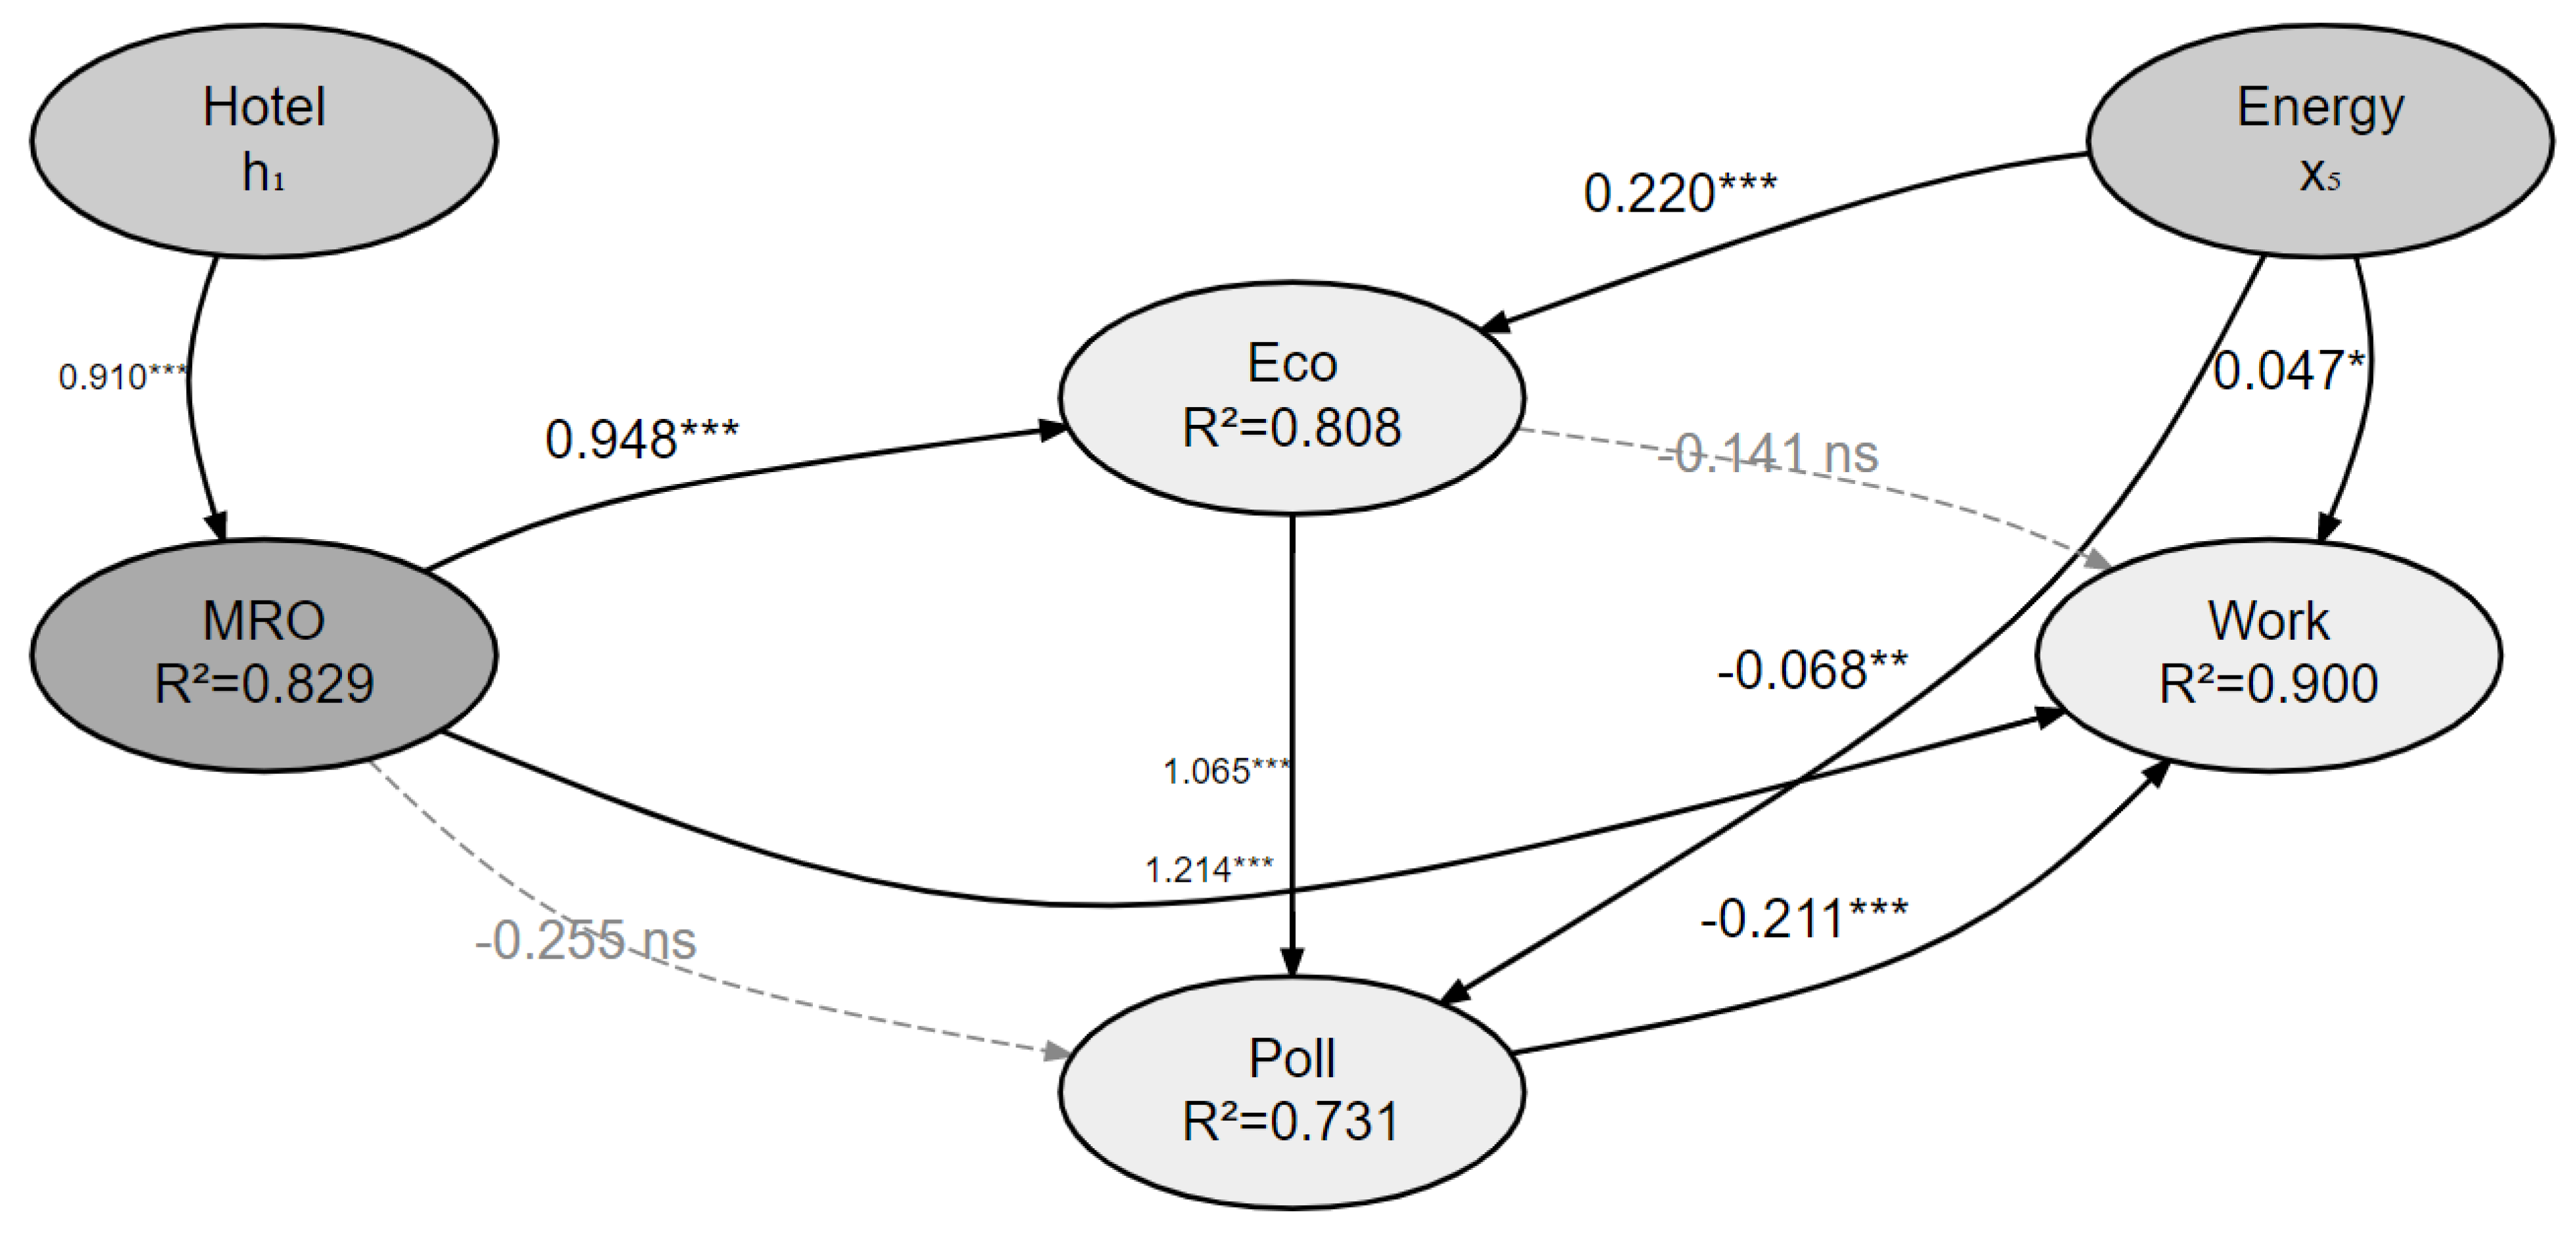
Seven of the eight hypotheses received empirical support, whereas H2 was not supported. Therefore, it can be concluded that the model explains the variability of endogenous variables well, with R2 of 0.829 for MRO, 0.808 for Eco, 0.731 for Poll, and 0.900 for Work (Table 8). Therefore, the classification by Hair et al. allows us to qualify the indicated values as evidence of moderate, and in some cases strong, predictive ability of the model [99].
Verification of the hypothesis H7 (Hotel → MRO) indicates that the Hotel variable is the strongest predictor in the PLSc-SEM model. The value of the path coefficient for this relationship turned out to be the highest and was β = 0.910 (T = 64.650, p < 0.001). This result clearly indicates a significant impact of the hotel sector’s demand on the scale of the MRO sector’s operations. The predictive ability of the model with respect to this construct is high. The result obtained from R2 = 0.829 means that it covers up to 82.9% of its total variance. Thus, the study confirms the assumption of the key importance of the HoReCa sector from the perspective of the main source of demand for entities from the MRO services sector.
The data collected allowed for unambiguous confirmation of hypotheses H1 (MRO → Eco) and H3 (MRO → Work). In contrast, the lack of significance of path H2 indicates a potentially indirect effect of the MRO sector’s scale on tax burdens. This mechanism was further verified in the section devoted to mediation analysis.
The research conducted shows that the path coefficients indicate a significant and positive relationship between the Energy factor and the Eco and Work variables (hypotheses H4 and H6). At the same time, a significant and negative impact of this factor on the Poll variable was observed (hypothesis H5). This pattern of relationships is consistent with the concept of the double fiscal dividend effect, which is promoted by the established European Union policy [111]. Hypothesis H8 posited a negative effect of Poll on Work, which is supported by the model results (β = −0.211, p < 0.001). This finding suggests that higher environmental tax burdens are associated with a contraction of the wage fund in the MRO sector. In addition to the eight hypothesized paths, the structural model includes two additional relationships (Eco → Poll and Eco → Work), which were retained to ensure a fully recursive specification. Their results are reported in Table 6 and discussed in Section 5.5.

4.3. Indirect Effects and Mediation Analysis

An integral part of the evaluation of the developed PLSc-SEM model is the analysis of indirect effects. The results of these calculations, performed using the product-of-coefficients method using 10,000 bootstrap replications with BCa correction, are systematized and presented in Table 9.
The empirical analysis showed full mediation for the following structural paths:
Hotel → MRO → Eco (β = 0.863, p < 0.001).
Hotel → MRO → Work (β = 1.105, p < 0.001).
Additionally, the mediation analysis provides evidence of full mediation along the MRO → Eco → Poll pathway (β = 1.008, p < 0.001; BCa 95% CI [0.761; 1.270]), thereby formally supporting the interpretation of Hypothesis H2 presented in Section 5.5.
This situation indicates that impulses from the hotel sector are transformed into changes in emissions and wages primarily through the growth of the MRO sector’s operational scale. In the case of the Hotel → MRO → Poll path, the indirect effect did not reach statistical significance (β = −0.232, p = 0.079). This result ultimately confirms that the MRO sector does not mediate the relationship between the activity of the HoReCa sector and emissions. Thus, it confirms the previous rejection of hypothesis H2, indicating a lack of direct influence of this path.
The structure of the mediation effects analyzed is illustrated in Figure 1. This diagram illustrates the most important structural relationships and their significant parameters.
The developed structural model synthetically illustrates the most important relationships between the variables analyzed. The presented results not only provide a basis for further inference, but also define new research perspectives, described in subsequent chapters.

5. Discussion

5.1. New Empirical Conditions Regarding Demand Links Between the HoReCa Sector and MRO Services

The key result of the conducted research is the positive verification of hypothesis H7 (Hotel → MRO, β = 0.910, T = 64.650, p < 0.001, BCa 95% CI: [0.881; 0.936]). The obtained parameters allow us to identify aggregate energy consumption by HoReCa companies as the dominant structural predictor for the scale of MRO sector activity in European Union countries. This result directly addresses the research gap identified by J.H.K. Lai, providing the first macroeconomic confirmation of this relationship [112]. In his study of 30 hotels in Hong Kong, he found no significant correlation between energy consumption and maintenance costs at the microeconomic level. He then described this relationship as a “missing link,” suggesting the need for analyses at higher levels of data aggregation. The empirical analysis confirms the existence of this link and its high structural significance at the aggregate level for the sample of 23 EU countries (Cyprus, Luxembourg, Malta, and Greece were excluded due to unavailable data for at least one required indicator). This phenomenon shows that relationships that are undetectable at the microeconomic level are revealed at the macroeconomic level. This type of connection directly confirms the assumptions of the aggregation theory in panel econometrics [113].
In turn, the strength of the Hotel → MRO structural effect (β = 0.910) shows a unique character compared to the previous literature using PLSc-SEM models for environmental analyses. For comparison, in the study by M. Sztorc and M. Makrenek, which concerned enterprises of the entire industrial sector of the EU-27, the strongest structural relations reached β values ranging from 0.60 to 0.75 [9]. The result presented β = 0.910, indicating a deep and complementary structural connection between the energy demand of the HoReCa sector enterprises and the size of MRO services activity. Istnienie wskazanej relacji uwiarygodnia spójny potrójny układ dowodowy. The first key element is Eurostat data on intermediate input flows, which generate an average value of EUR 55.5 million per year in the EU-27 area in the years 2010–2023 [96]. Further indicators are the preliminary Pearson correlation coefficients (r(h1,x1) = 0.903, p < 0.001, n = 282) together with the findings of the meta-analysis conducted by Arenhart et al. [113]. The authors demonstrated a proportional relationship between the degree of operational involvement of hotels and their final energy consumption (r = 0.71 in relation to the number of overnight stays). The indicated convergence of these three independent pieces of evidence strengthens the external validity of the result and minimizes the risk of statistical artifact.
We view formal comparative testing of these explanations as a valuable direction for future research. To address the possibility that the Hotel → MRO relationship reflects country size or economic development rather than a genuine demand-transmission mechanism, we re-estimated the model while including GDP per capita (Eurostat, nama_10_pc, constant 2020 prices) as an additional predictor of MRO. GDP per capita exhibits a statistically significant but substantively small effect (β = 0.040, p < 0.05), while the Hotel → MRO coefficient remains virtually unchanged (β = 0.910 vs. 0.899, representing a 1.2% difference). The variance inflation factor (VIF = 1.09) further indicates that multicollinearity between the two predictors is negligible. Overall, these results suggest that the identified relationship is not driven by country-level economic scale.
The magnitude of the Hotel → MRO effect is more directly comparable to sector-specific demand-transmission studies than to broader industrial models such as Sztorc and Makrenek [9]. This difference is likely attributable to three factors. First, sectoral scope: the present model isolates a clearly defined bilateral demand–supply linkage, whereas aggregate industrial models encompass heterogeneous intersectoral relationships, which may attenuate structural coefficients. Second, measurement properties: both the Hotel construct and the MRO construct are characterized by high-quality measurement (single well-defined indicator and a tightly specified composite with loadings exceeding 0.93, respectively), which reduces attenuation from measurement error. Third, both studies rely on the PLSc estimator, which corrects for attenuation bias relative to standard PLS-SEM; hence, differences in magnitude are unlikely to be methodological in origin. Instead, they more plausibly reflect the tighter sectoral coupling captured in the present specification. The formal comparative assessment of these mechanisms remains an important avenue for future research.
From the perspective of the EU’s decarbonization strategies, this result indicates that HoReCa companies generate a dual carbon footprint. The first, referred to as direct, results from their own energy consumption. The second, called indirect, results from generating demand for energy-intensive MRO services. Therefore, energy efficiency programs targeted at entities in the HoReCa sector, with particular emphasis on the Energy Performance of Buildings Directive (EPBD) and the Energy Efficiency Directive (EED), generate significant externalities for the MRO industry. To date, consequences of this kind have not been considered in official regulatory impact assessments (RIAs). Therefore, the structural parameters obtained under H7 suggest that the convergence of energy strategies for the service sector and industrial decarbonization programs can generate synergistic benefits. However, these effects remain unattainable when using separate, purely sectoral regulatory instruments.

5.2. Implications of MRO Sector Emission Decomposition for Decarbonization Strategies

The results of the PLSc-SEM structural model confirm that the absolute GHG and CO2 emissions of the MRO sector are jointly explained by two independent and complementary mechanisms, consistent with the Y. Kaya decomposition identity [108]. The first one is the scale mechanism (H1: MRO → Eco, β = 0.948, p < 0.001), while the second one is the emission intensity mechanism (H4: Energy → Eco, β = 0.220, p < 0.001). The clear dominance of the scale mechanism is visible in the comparison of the obtained coefficients, among which the value of β = 0.948 drastically exceeds the level β = 0.220. This result indicates that, in the current technological structure of the MRO sector, the increase in the volume of repair services is a much stronger predictor of emissions than the emission intensity of the implemented production processes. This relationship is fully consistent with the findings of G.A. Swastanto and M.E. Johnson in the area of the aviation MRO sector [114]. The analysis conducted by the authors shows that the operational scale of service activities is the primary determinant of ecological burden.
In terms of the EU’s decarbonization policy, the conclusions drawn indicate the need for a two-pronged approach to reducing emissions in the MRO sector. The first approach involves reducing scale through systemic demand reduction. This approach ensures lower emissions but remains economically suboptimal due to strong, positive scale effects on wages (β = 1.214, p < 0.001) and employment (H3). The second direction focuses on reducing carbon intensity through investments in low-emission technologies. Although it generates a more modest direct impact on decarbonization (β = 0.220), it does not burden the labor market and supports the long-term objectives of the European Green Deal. Therefore, climate policy should prioritize instruments aimed at reducing the emission intensity of the MRO sector. From this perspective, subsidies for machinery modernization and stringent emission standards for repair processes are crucial. Support for laser welding and electrochemical machining technologies as low-emission alternatives to traditional methods is also crucial.
In turn, the results obtained for the indirect effect Hotel → MRO → Eco (β = 0.863, p < 0.001) indicate the existence of a strong intersectoral relationship. Decarbonization of HoReCa companies automatically stimulates the reduction in industrial emissions in the MRO sector. This process is implemented directly through the demand channel. Therefore, pro-ecological actions undertaken by hotel and restaurant operators include thermal modernization of buildings, modernization of HVAC systems, and the transition to renewable energy sources. The conducted research shows that these factors limit the scale of the sector’s operational activity, consistent with the assumptions of hypothesis H1. Consequently, they generate lower demand for maintenance services, which contributes to a decrease in direct emissions in the repair sector. This relationship, resulting from the external mechanism, has previously been overlooked in modeling the MRO sector’s emissions intensity. The presented approach constitutes a key and original empirical contribution to the conducted research.

5.3. The Double Dividend Mechanism

In turn, the empirical verification of hypothesis H5 (β = −0.068, p = 0.003) provides important arguments from the perspective of double dividend theory in the dynamic approach [111]. The identified negative relationship between the MRO sector’s emission intensity and the effective ecological tax rate reflects the operation of a structural compensation mechanism. The results obtained suggest that MRO sector entities with a relatively higher emission profile of remediation processes demonstrate increased responsiveness to fiscal incentives. This is reflected in the intensification of capital expenditures on advanced decarbonization technologies. This type of strategy results in the activation of preferential tax deductions and exemptions sanctioned by EU law [115].
Moreover, the analyzed market mechanism allows the simultaneous achievement of two strategic benefits. The first, the environmental dividend, materializes as a result of reducing the intensity of the emission of remedial processes. The fiscal dividend, in turn, involves a systematic reduction in the effective tax rate. Nevertheless, despite the relatively low impact of this parameter (β = −0.068), the level of statistical significance (p = 0.003) obtained for the sample N = 282 confirms the precision of the estimation. This allows for the rejection of the hypothesis regarding the random nature of the identified relationship.
However, structural estimates for hypothesis H8 (β = −0.211, p < 0.001) confirm that the intensification of environmental tax burdens is associated with compression of the wage fund in the MRO sector. This result reflects the classic mechanism of transferring the burden of environmental taxes to production factors. In the literature, this type of event is interpreted as a barrier to the full implementation of a strong double dividend. Research also shows that an increase in environmental taxes generates an increase in the operating costs of MRO companies. Given the limited price elasticity of demand for repair services, this type of impact is associated with an asymmetric reduction in labor costs to defend the operating margin.
The identified relationship indicates the existence of a direct distributional effect of fiscal instruments, which influences the employment structure in the MRO sector. The analyzed mechanism of transferring environmental costs to human capital generates significant implications for socio-economic policy. This process should be a permanent element of the impact assessment of regulations in the area of just energy transition. Taking into account the asymmetry of employee burdens enables the proper design of protective mechanisms in the EU decarbonization system.
To provide a policy-relevant illustration of these findings, we calculated the elasticity of MRO sector wages with respect to environmental tax revenues implied by the estimated Poll → Work path (β = −0.211), yielding an elasticity of approximately −0.197. Applying this elasticity to a stylized 50–100% increase in environmental tax revenues—broadly consistent with European Commission projections of a roughly seven-fold increase in EU carbon pricing revenues by 2030 (from approximately €14 billion in 2019 to over €100 billion) under the Fit for 55 package—would imply an approximate 10–20% reduction in MRO sector wage costs, ceteris paribus.
This exercise is intended as a stylized, partial-equilibrium illustration of magnitudes rather than a forecast. It is based on historically estimated elasticities and does not account for general-equilibrium feedback effects, revenue recycling mechanisms (e.g., the Social Climate Fund), technological adjustment, or compensatory labor market policies. A comprehensive assessment of the employment implications of Fit for 55 for the MRO sector would require a complete computable general equilibrium framework and remains an important avenue for future research.

5.4. The Impact of Environmental Taxes on Labor Costs in the MRO Sector

According to the research conducted, it was found that the scale of the operational activity of the MRO sector has the strongest impact on the level of labor costs. Therefore, the structural parameters identified for hypothesis H3 (β = 1.214, p < 0.001, BCa 95% CI: [1.012; 1.455]) confirm the dominant nature of this relationship. In turn, the value of the path coefficient (β > 1) higher than one reflects the nonlinear impact of the sector’s scale on wage costs [100,101]. This trend stems from the overlap of two complementary structural mechanisms. The first factor is the high labor intensity of repair and maintenance services. This underlies the direct relationship between the growth of production scale and labor demand. The second element, in turn, is related to the specific human capital in the MRO sector, represented by certified welders, HVAC technicians, and industrial electricians. The stringent qualification requirements of these professional groups generate a strong wage premium amidst growing market demand for specialized technical services [116]. Moreover, the determined parameter β > 1 remains mathematically correct in the PLSc-SEM procedure. It reflects the overproportional effect that results from the attenuation correction [99].
However, structural mediation analysis for the Hotel → MRO → Work relationship (β = 1.105, p < 0.001, BCa 95% CI: [0.913; 1.344]) indicates that the energy demand of the hotel sector is a significant structural factor associated with labor market performance in the MRO sector. An increase in energy consumption in hotel and catering establishments by one standardized unit increases wage costs in MRO service companies (by 1.105 standard deviations). The high value of this parameter confirms its fundamental economic importance. From the perspective of employment stability, this situation implies the need to review EU protective programs. Achieving climate goals related to the decarbonization of hotel and catering establishments through thermal modernization of facilities and the use of heat pumps and renewable energy sources will reduce the traditional demand for maintenance services. It should be concluded that such a situation may be linked to a negative income impulse for personnel employed in the MRO sector. Therefore, taking into account these side effects is a necessary condition for maintaining the coherence of the EPBD with the regional transition strategies (NECPs) in the EU’s just transition plans [117,118].
At the same time, the statistical significance of the hypothesis (Energy → Work, β = 0.047, p = 0.028) suggests the presence of a positive but moderate relationship between the intensity of the emission of the MRO processes and the level of wages. The economic dimension of this relationship reflects the higher capital intensity and technological complexity of traditional repair procedures. High-carbon processes such as arc welding, heat treatment, and sandblasting require advanced skills and generate higher wages than low-carbon technologies. Consequently, the technological modernization policy of the MRO sector should integrate environmental goals with employee retraining mechanisms to maintain an appropriate level of remuneration after ecological transformation.

5.5. Mediational Interpretation of Statistically Insignificant Relationships

In connection with the conducted research, empirical verification of two model assumptions showed no basis for rejecting the null hypothesis at the conservative significance threshold of 5%. This type of situation indicates the correct specification of the system of intermediary variables and does not constitute an error in the conceptualization of economic dependencies [119]. In the case of hypothesis H2 (MRO → Poll, β = −0.255, p = 0.076), the size of the MRO sector does not directly predict the scale of pro-environmental fiscal burdens. This pattern is consistent with full mediation through the Eco construct: as reported in Table 6, the Eco → Poll path is strong and highly significant (β = 1.065, p < 0.001), and the total effect of scale on taxation is realized within the chain MRO → Eco → Poll (β = 0.948 × 1.065 = 1.010). Thus, generated emission streams—captured by the Eco construct—constitute the operative basis for calculating environmental tax obligations, while production potential alone is not the primary associated factor. This result reflects the paradigm of EU environmental policy, in which tax instruments respond to quantitative pollution signals and remain largely neutral with respect to entities’ financial turnover.
These findings suggest that it is not production scale per se that determines environmental taxation, but rather the associated emission flows captured by the Eco construct. In this sense, environmental tax liabilities are primarily driven by observable pollution outcomes rather than sectoral economic size. This is consistent with the design logic of EU environmental fiscal policy, in which tax instruments are linked to quantified emissions rather than financial turnover or production capacity.
It should be noted that the direct impact tested of the variable concerning total emissions (Eco) on the employee remuneration construct (Work) turned out to be statistically insignificant (β = −0.141, p = 0.354). The negative result of the presented verification reveals the actual vector of structural dependencies. Therefore, it should be concluded that environmental pressure modifies labor market outcomes in the MRO sector solely through tax instruments [111]. This phenomenon indicates the key role of the Poll and Eco mediators in the model’s structure. The presented mechanism provides empirical evidence of the methodological completeness of the analyzed variable system.

5.6. Research Limitations

The presented study is characterized by several methodological limitations. The first area is related to the incomplete temporal structure of data for enterprises from thirteen EU Member States. Energy consumption statistics for the HoReCa sector (variable h1) in the Physical Energy Flow Accounts—Supply, Transformation and Consumption database were only available from 2014. Therefore, the values for the years 2008–2013 were supplemented using backward linear extrapolation. This procedure, although commonly used in analyses of structural indicators, generates additional measurement uncertainty for these observations. Therefore, this effect remains impossible to fully quantify within the PLSc-SEM algorithm.
The second factor is the exclusion of Cyprus, Luxembourg, Malta, and Greece due to the lack of data continuity for at least one required indicator. Consequently, this decision limited the potential for generalizing conclusions to the full EU-27 population. The resulting sample bias particularly affects small island economies with a specific service structure.
The third limitation stems from the presence of strong external disturbances in the analyzed time period of 2008–2020. The financial crisis and the COVID-19 pandemic were associated with drastic limitations in the operational activity of HoReCa enterprises in all EU countries. These disturbances could have distorted the stability of the estimated structural parameters over time, especially for the Hotel → MRO relationship. Analysis of the stability of parameters in subperiods (rolling window estimation) is a key direction for future research.
The final, fourth element is related to the specificity of the PLSc-SEM estimator. This method does not explicitly take into account cross-sectional dependence. However, this mechanism is common in multi-country panel databases, where common macroeconomic shocks correlate residuals across countries [120]. Future studies should use bias-corrected panel SEM models or factorial techniques to separate common from idiosyncratic effects.
Relatedly, the current PLSc-SEM specification does not incorporate year fixed effects, which explicitly control for common temporal shocks such as the 2008 financial crisis or the COVID-19 pandemic (as discussed above). While PLSc-SEM does not estimate structural paths via single-equation regression—and therefore does not suffer from the specific pooled-OLS omitted-variable bias—the possibility that unobserved time-specific shocks affect the stability of the estimated path coefficients cannot be fully ruled out within the present cross-sectional-panel specification. Future extensions of this framework should explore bias-corrected panel SEM approaches capable of incorporating time-fixed-effects structures. An additional limitation concerns the granularity of the emissions data underlying the Eco construct. The Eurostat Air Emission Accounts used in this study (env_ac_ainah_r2) report emissions on a territorial, production-based accounting standard (SEEA), which does not permit disaggregation into Scope 1 (direct) and Scope 2 (indirect, purchased-energy) categories as defined by the GHG Protocol. Consequently, the present study cannot distinguish whether the scale effect identified for the MRO sector (H1: MRO → Eco) reflects growth in on-site process emissions, increased electricity consumption, or both. Future research employing facility-level or GHG Protocol-based emissions inventories would be well positioned to disentangle these mechanisms.
A related limitation concerns the use of single-item operationalization for three constructs (Hotel, Energy, Work). While justified by the absence of comparable alternative indicators with matching geographic and temporal coverage (Section 3.2), single-item measures do not permit empirical assessment of internal consistency reliability, and their reported reliability and AVE values of 1.0 reflect a computational convention rather than validated measurement quality. To the extent that these indicators contain unmodeled measurement error, the affected structural paths (Hotel → MRO, Energy → Eco/Poll/Work, and all paths terminating in Work) would be attenuated rather than inflated, suggesting that the reported coefficients are, if anything, conservative estimates of the true relationships. Future research should seek to identify additional Eurostat indicators—for instance, alternative measures of hotel sector energy use or sector-specific labor cost components—to enable multi-item operationalization and formal reliability assessment of these constructs.
Beyond the limitations discussed above, several broader caveats affect inference. The extrapolated h1 values (2008–2013), though externally validated (Section 3.1) and shown not to materially affect the study’s central finding, remain estimates rather than direct observations. Eurostat data themselves carry measurement error from heterogeneous national reporting practices, which is not explicitly modeled within the PLSc-SEM framework. The exclusion of Cyprus, Luxembourg, Malta and Greece limits generalizability to small island economies with distinctive tourism-to-GDP structures. Finally, as with any model estimated on observational macroeconomic data, omitted-variable bias and residual endogeneity (e.g., possible reverse influence of MRO capacity on HoReCa investment) cannot be fully excluded; addressing this would require quasi-experimental or instrumental-variable extensions, which we identify as a priority for future research.
An additional limitation concerns the granularity of the emissions data underlying the Eco construct. The Eurostat Air Emission Accounts (env_ac_ainah_r2) follow a territorial, production-based accounting framework (SEEA), which does not allow for the separation of emissions into Scope 1 (direct) and Scope 2 (indirect, purchased energy) categories as defined by the GHG Protocol. As a result, the present study cannot disentangle whether the observed scale effect for the MRO sector (H1: MRO → Eco) is driven by on-site process emissions, electricity consumption, or a combination of both. Future research using facility-level datasets or GHG Protocol–compliant inventories would be better positioned to identify these channels.
A further limitation relates to the single-item operationalization of three constructs (Hotel, Energy, Work). While this approach is justified by the lack of comparable indicators with consistent temporal and cross-country coverage (Section 3.2), single-item measures do not permit empirical assessment of internal consistency reliability, and the resulting reliability and AVE values of 1.0 reflect a modeling convention rather than empirically validated measurement quality. To the extent that measurement error is present but unobserved, the affected structural paths (Hotel → MRO, Energy → Eco/Poll/Work, and all paths ending in Work) are likely attenuated, implying that the reported coefficients may be conservative. Future research should seek to incorporate additional Eurostat indicators—such as alternative measures of hotel sector energy intensity or sectoral labor cost proxies—to enable multi-item specification and formal reliability assessment.
Beyond these issues, several broader caveats should be acknowledged. The extrapolated h1 values for 2008–2013, although externally validated (Section 3.1) and shown not to materially affect the main results, remain model-based estimates rather than observed data. In addition, Eurostat data are subject to measurement error stemming from heterogeneous national reporting practices, which is not explicitly modeled in the PLSc-SEM framework. The exclusion of Cyprus, Luxembourg, Malta, and Greece further limits generalizability to small and highly tourism-dependent economies. Finally, as with any observational macro-panel model, residual endogeneity and omitted-variable bias—such as potential reverse effects of MRO capacity on HoReCa investment—cannot be fully ruled out, motivating future work using quasi-experimental or instrumental-variable approaches.

5.7. Directions for Future Research

The results presented in this study enable further development of the research problem, which covers four complementary areas. The first direction concerns the application of multi-group structural analysis (MGA) to compare economies with high (HEI) and low (LEI) emission intensity. The appropriate methodological framework was implemented in a proprietary R script, which constitutes an integral part of the research project. The MGA will enable the identification of potential differences in the Hotel → MRO path between companies representing the old and new member states of the EU. Preliminary analyses of the Pearson correlation coefficient indicate a stronger relationship in the LEI group (r = 0.883) than in the HEI group (r = 0.618). This numerical disparity likely reflects the higher level of market integration and the maturity of sectoral specialization in Western European structures. We deliberately defer formal multi-group analyses, covariance-based SEM benchmarking, and tests for COVID-related structural breaks to dedicated follow-up studies. Each of these extensions warrants a focused investigation rather than inclusion in a compressed robustness section that could dilute the exploratory contribution of the present study.
Another research perspective is the proposal to extend the model to include other energy-intensive service sectors, such as transportation (NACE H), healthcare (NACE Q), and education (NACE P). Introducing these variables as additional exogenous constructs will provide a basis for assessing the uniqueness and specificity of the relationships between the HoReCa and MRO sectors. However, this procedure will require expanding the current measurement model and ensuring full data availability in the Physical Energy Flow Accounts—Supply, Transformation, and Consumption.
The third proposed research area may involve a potential change in the time frame to a quarterly approach. However, this is contingent on Eurostat publishing the relevant series. Increasing the temporal resolution of the data will enable a precise identification of short-term dynamics and typical seasonal effects of tourism. This type of analysis could address the issue of the immediate nature of demand transmission or the existence of structural lags that shape human resources and investment planning in the MRO sector.
The fourth element would analyze the stability of parameters over time using the PLSc-SEM rolling window algorithm. This study would verify the sensitivity of path coefficients (especially the relationships in H7) to structural shocks caused by the COVID-19 pandemic and the energy crisis. This result could inform the model’s long-term forecasting capability, which is essential for formulating regulatory proposals and EU strategic goals regarding SD.
Finally, future research should complement the PLSc-SEM framework with panel Granger causality approaches, such as the [8] test, to formally assess the directionality of the Hotel → MRO relationship within a VAR-based panel setting. Although methodologically distinct from the structural equation modeling approach adopted in this study, such analyses would provide useful convergent evidence regarding the causal ordering of the demand-side mechanism identified herein.

6. Conclusions

This study provides the first macroeconomic evidence linking energy demand in the HoReCa sector with the activity of the MRO sector, environmental burdens and labor costs across the European Union. Three main findings emerge. First, the demand for HoReCa energy is the strongest predictor of the scale of MROs (H7: β = 0.910), extending what was previously observed mainly at the microeconomic level. Second, the environmental burden of the MRO sector is driven predominantly by operational scale rather than emission intensity (H1 vs. H4), highlighting demand-side decarbonization alongside technological improvements as a strategic priority. Third, while increasing environmental taxes compress wages in the MRO sector (H8), the growing demand for specialized technical workers exerts upward pressure on wages (H3, H6), revealing a distributional tension not currently addressed by existing double-dividend policies.
These findings suggest two specific policy actions: expanding energy efficiency programs, such as the Energy Performance of Buildings Directive (EPBD) and the Energy Efficiency Directive (EED), to explicitly consider their downstream effects on MRO demand; and allocating a portion of environmental tax revenues from the MRO sector toward reskilling technicians to mitigate the identified wage compression. Given the observational nature of the data and the limitations discussed in Section 5.6, further analyses—such as panel Granger-causality testing and multi-group structural comparisons (Section 5.7)—constitute promising next steps to enhance causal understanding in this research domain.
This study provides what is, to our knowledge, the first macroeconomic evidence linking energy demand in the HoReCa sector to MRO sector activity, environmental pressures, and labor costs across European Union member states. Three main findings emerge. First, HoReCa energy demand is the strongest predictor of MRO sector scale (H7: β = 0.910), extending patterns previously documented primarily at the microeconomic level. Second, environmental burdens in the MRO sector are driven more by operational scale than by emission intensity (H1 vs. H4), underscoring the importance of demand-side dynamics alongside technological change in decarbonization strategies. Third, while environmental taxation exerts downward pressure on wages in the MRO sector (H8), rising demand for specialized technical labor simultaneously increases wage levels (H3, H6), revealing a distributional tension that is not explicitly addressed within existing double-dividend policy designs.
These results point to two policy-relevant implications. First, energy efficiency initiatives such as the Energy Performance of Buildings Directive (EPBD) and the Energy Efficiency Directive (EED) may benefit from explicitly accounting for their downstream effects on MRO sector demand. Second, a portion of environmental tax revenues generated within the MRO sector could be directed toward targeted reskilling programs for technical workers, thereby mitigating potential wage compression effects.
Given the observational nature of the data and the limitations discussed in Section 5.6, future research should extend this analysis through panel Granger causality testing and multi-group structural comparisons (Section 5.7), which would provide additional insight into causal ordering and structural heterogeneity within the proposed demand-transmission mechanism.

Author Contributions

Conceptualization, M.M. and M.S.; methodology, M.M.; software, M.M.; validation, M.S.; formal analysis, M.M. and M.S.; investigation, M.S. and M.M.; resources, M.S. and M.M.; data curation, M.M.; writing—original draft preparation, M.S.; writing—review and editing, M.M. and M.S.; visualization, M.M.; supervision, M.S.; project administration, M.M.; funding acquisition, M.S. All authors have read and agreed to the published version of the manuscript.

Funding

This research received no external funding.

Institutional Review Board Statement

Not applicable.

Informed Consent Statement

Not applicable.

Data Availability Statement

The data presented in this study are available on reasonable request from the corresponding author.

Conflicts of Interest

The authors declare no conflicts of interest.

References

  1. Ibrahim, R.L.; Adebayo, T.S.; Awosusi, A.A.K.; Ajide, B.; Adewuyi, A.O.; Bolarinwa, F.O. Investigating the asymmetric effects of renewable energy-carbon neutrality nexus: Can technological innovation, trade openness, and transport services deliver the target for Germany? Energy Environ. 2024, 35, 185–206. [Google Scholar] [CrossRef]
  2. Richnák, P.; Fidlerová, H. Impact and Potential of Sustainable Development Goals in Dimension of the Technological Revolution Industry 4.0 within the Analysis of Industrial Enterprises. Energies 2022, 15, 3697. [Google Scholar] [CrossRef]
  3. Pociovălișteanu, D.M.; Novo-Corti, I.; Aceleanu, M.I.; Șerban, A.C.; Grecu, E. Employment Policies for a Green Economy at the European Union Level. Sustainability 2015, 7, 9231–9250. [Google Scholar] [CrossRef]
  4. Dradra, Z. Do energy transition and environmental taxation contribute to sustainable development? Evidence from OECD countries. Arab Gulf J. 2024, 42, 1814–1831. [Google Scholar] [CrossRef]
  5. Kotlán, I.; Němec, D.; Kotlánová, E.; Skalka, P.; Macek, R.; Machová, Z. European Green Deal: Environmental Taxation and Its Sustainability in Conditions of High Levels of Corruption. Sustainability 2021, 13, 1981. [Google Scholar] [CrossRef]
  6. Huh, T.; Kim, Y. Triangular Trajectory of Sustainable Development: Panel Analysis of the OECD Countries. Int. J. Environ. Res. Public Health 2021, 18, 2374. [Google Scholar] [CrossRef] [PubMed]
  7. Prokhorova, V.; Bozhanova, O.; Putro, A.; Dalyk, V.; Yukhman, Y.; Azizova, K. Methodological aspects of assessing the sustainable development of energy companies. IOP Conf. Ser. Earth Environ. Sci. 2021, 628, 012011. [Google Scholar] [CrossRef]
  8. Dumitrescu, E.I.; Hurlin, C. Testing for Granger non-causality in heterogeneous panels. Econ. Model. 2012, 29, 1450–1460. [Google Scholar] [CrossRef]
  9. Sztorc, M.; Makrenek, M. Assessing the Interdependencies Between the Production Environmental and Fiscal Activities of European Union Industrial Enterprises Using Structural Equation Modeling. Sustainability 2025, 17, 9982. [Google Scholar] [CrossRef]
  10. Everard, M.; Kass, G.; Longhurst, J.; Zu Ermgassen, S.; Girardet, H.; Stewart-Evans, J.; Wentworth, J.; Austin, K.; Dwyer, C.; Fish, R.; et al. Reconnecting society with its ecological roots. Environ. Sci. Policy 2021, 116, 8–19. [Google Scholar] [CrossRef]
  11. Tsoumplekas, G.; Li, V.; Siniosoglou, I.; Argyriou, V.; Goudos, S.K.; Moscholios, I.D.; Radoglou-Grammatikis, P.; Sarigiannidis, P. Evaluating the Energy Efficiency of Few-Shot Learning for Object Detection in Industrial Settings. In 2024 IEEE 3rd Real-Time and Intelligent Edge Computing Workshop (RAGE); IEEE: Piscataway, NJ, USA, 2024; pp. 1–6. [Google Scholar] [CrossRef]
  12. Horvath, A.; Papp, A.T.; Molnar, L.; Liptak, K.; Musinszki, Z.; Markovics, K.S. Climate and Energy Issues of Energy-Intensive Sectors. Amfiteatru Econ. J. 2023, 25, 813–829. [Google Scholar] [CrossRef]
  13. Nagovnak, P.; Rahnama Mobarakeh, M.; Diendorfer, C.; Thenius, G.; Böhm, H.; Kienberger, T. Cost-Driven Assessment of Technologies’ Potential to Reach Climate Neutrality in Energy-Intensive Industries. Energies 2024, 17, 1058. [Google Scholar] [CrossRef]
  14. Nilsson, L.J.; Bauer, F.; Åhman, M.; Andersson, F.N.G.; Bataille, C.; de la Rue du Can, S.; Ericsson, K.; Hansen, T.; Johansson, B.; Lechtenböhmer, S.; et al. An industrial policy framework for transforming energy and emissions intensive industries towards zero emissions. Clim. Policy 2021, 21, 1053–1065. [Google Scholar] [CrossRef]
  15. Liu, W.; Ma, C.; Gou, H.; Zhang, R.; Huang, W.; Guo, K. Impacts of net-zero emission target on the power sector: A systematic review from an integrated energy-environment-economy perspective. Renew. Sustain. Energy Rev. 2026, 236, 116987. [Google Scholar] [CrossRef]
  16. Sutthichaimethee, P.; Sutthichaimethee, J.; Luo, J.; Ukumphan, S.; Sa-Ngiamvibool, W.; Wattana, B.; Wattana, S. A strategic energy consumption management model: Performance evaluation of policy scenarios under sustainable development toward net zero emissions. Energy Strateg. Rev. 2026, 65, 102268. [Google Scholar] [CrossRef]
  17. Rissman, J.; Bataille, C.; Masanet, E.; Aden, N.; Morrow, W.R.; Zhou, N.; Elliott, N.; Dell, R.; Heeren, N.; Huckestein, B.; et al. Technologies and policies to decarbonize global industry: Review and assessment of mitigation drivers through 2070. Appl. Energy 2020, 266, 114848. [Google Scholar] [CrossRef]
  18. Finkbeiner, M.; Bach, V. Life cycle assessment of decarbonization options—Towards scientifically robust carbon neutrality. Int. J. Life Cycle Assess. 2021, 26, 635–639. [Google Scholar] [CrossRef]
  19. Liu, J.; Zhao, Q. Mechanism testing of the empowerment of green transformation and upgrading of industry by the digital economy in China. Front. Environ. Sci. 2024, 11, 1292795. [Google Scholar] [CrossRef]
  20. Kulova, I.; Nikolova-Alexieva, V.; Pashev, S. Green entrepreneurship: A review of sustainable business practices in manufacturing and high-tech industries. BIO Web Conf. 2024, 130, 08001. [Google Scholar] [CrossRef]
  21. Taghavi, N. Sustainable Development of Operations: Actors’ Involvement in the Process of Energy Efficiency Improvements. Sustainability 2021, 13, 6121. [Google Scholar] [CrossRef]
  22. Zhu, X. Research on different modes of energy conservation and emission reduction: A differential game model based on carbon trading perspective. PLoS ONE 2024, 19, e0309968. [Google Scholar] [CrossRef] [PubMed]
  23. Yurtay, Y. Carbon Footprint Management with Industry 4.0 Technologies and Erp Systems in Sustainable Manufacturing. Appl. Sci. 2025, 15, 480. [Google Scholar] [CrossRef]
  24. Usubiaga-Liaño, A.; Ekins, P. Monitoring the environmental sustainability of countries through the strong environmental sustainability index. Ecol. Indic. 2021, 132, 108281. [Google Scholar] [CrossRef]
  25. Tokarcikova, E.; Kucharcikova, A.; Janosova, P. The Relationship between Environmental and Economic Aspects for Measuring the Sustainability of the Enterprise: A Case Study of Slovak Manufacturing Enterprises. Int. J. Environ. Res. Public Health 2022, 19, 7784. [Google Scholar] [CrossRef] [PubMed]
  26. Felsberger, A.; Qaiser, F.H.; Choudhary, A.; Reiner, G. The impact of Industry 4.0 on the reconciliation of dynamic capabilities: Evidence from the European manufacturing industries. Prod. Plan. Control 2022, 33, 277–300. [Google Scholar] [CrossRef]
  27. Annaufal, A.I.; Mariyana, A.L.D.; Priyono, A. Market-Based Instruments for Environmental Management: A Comparative Analysis. RSF Conf. Proc. Ser. Bus. Manag. Soc. Sci. 2023, 3, 19–23. [Google Scholar] [CrossRef]
  28. Borozan, D.; Borozan, L. Examining the Industrial Energy Consumption Determinants: A Panel Bayesian Model Averaging Approach. Energies 2020, 13, 70. [Google Scholar] [CrossRef]
  29. Włodarczyk, A.; Mesjasz-Lech, A. Ecological and Economic Context of Managing Enterprises That Are Particularly Harmful to the Environment and the Well-Being of Society. Energies 2021, 14, 2884. [Google Scholar] [CrossRef]
  30. Xu, X.; Wang, S.; Yu, Y. Consumer’s intention to purchase green furniture: Do health consciousness and environmental awareness matter? Sci. Total Environ. 2020, 704, 135275. [Google Scholar] [CrossRef] [PubMed]
  31. Luo, Z.; Lin, X.; Wu, Y.; Zhong, W. Role of energy value chain in carbon neutrality: A review. Clean. Energy Sci. Technol. 2024, 2, 192. [Google Scholar] [CrossRef]
  32. Lorenc, S.; Kustra, A. Distributing Enterprise Value to Stakeholders in the Range of Sustainable Development on the Basis of the Energy Industry in Poland. Sustainability 2021, 13, 2130. [Google Scholar] [CrossRef]
  33. Ghosh, P.; Jha, A.; Sharma, R. Managing carbon footprint for a sustainable supply chain: A systematic literature review. Mod. Supply Chain Res. Appl. 2020, 2, 123–141. [Google Scholar] [CrossRef]
  34. Li, D. Supply chain digitalization, corporate governance, and enterprise carbon emissions. Int. Rev. Financ. Anal. 2025, 102, 104115. [Google Scholar] [CrossRef]
  35. Jiang, L.; Cao, X.; Wang, Z.; Zhan, Y.; Zhang, J.; Chen, S. Promoting energy saving and emission reduction benefits in small and medium-sized enterprises supply chains through green finance–Evidence based on artificial intelligence intervention. IInt. Rev. Financ. Anal. 2025, 102, 104112. [Google Scholar] [CrossRef]
  36. Ning, J.; Xiong, L.; Shao, C. Dynamic evolution analysis of enterprises digital technology innovation strategies in energy supply chain collaboration: A bargaining theory perspective. Energy Econ. 2025, 151, 108958. [Google Scholar] [CrossRef]
  37. Yousef, A.; Chaer, I. Utilisation of IoT and Smart Meter for Energy Savings in the Hotel Sector. In Projects, Processes, Systems and Networks in the Digital Age–Proceedings of the 4th International Conference on the Leadership and Management of Projects in the Digital Age–ICLAMP 2025; Masri, H., Elkadhi, N., Abdellah, K., Aldulaimi, S., Eds.; Springer: Berlin/Heidelberg, Germany, 2025; Volume 1548, pp. 532–551. [Google Scholar] [CrossRef]
  38. Villani, L.; Casciola, M.; Astiaso Garcia, D. Integrated Technologies for Smart Building Energy Systems Refurbishment: A Case Study in Italy. Buildings 2025, 15, 1041. [Google Scholar] [CrossRef]
  39. Fayyaz, M. Role of centralized BMS in enhancing operational efficiency in Smart Malls and Hotels. Veredas Direito 2026, 23, e234852. [Google Scholar] [CrossRef]
  40. Gaffar, V.; Tjahjono, B.; Koeswandi, T.; Tjahjono, M.; Rofaida, R.; Sari, M. Transformative hospitality: Leveraging a human-centric circular economy framework for the hotel industry. Int. J. Contemp. Hosp. Manag. 2026, 38, 1296–1319. [Google Scholar] [CrossRef]
  41. Chen, Q.; Dehghanian, P.; Yang, D. Multi-objective closed-loop charging scheduling strategy for electric vehicles based on user profiling and spatial–temporal mapping. Energy Convers. Manag. 2026, 361, 121557. [Google Scholar] [CrossRef]
  42. Dhirasasna, N.; Sahin, O. A system dynamics model for renewable energy technology adoption of the hotel sector. Renew. Energy 2021, 163, 1994–2007. [Google Scholar] [CrossRef]
  43. Ali, Y.; Mustafa, M.; Al-Mashaqbah, S.; Mashal, K.; Mohsen, M. Potential of energy savings in the hotel sector in Jordan. Energy Convers. Manag. 2008, 49, 3391–3397. [Google Scholar] [CrossRef]
  44. Bianco, V.; Righi, D.; Scarpa, F.; Tagliafico, L.A. Modeling energy consumption and efficiency measures in the Italian hotel sector. Energy Build. 2017, 149, 329–338. [Google Scholar] [CrossRef]
  45. Švec, R.; Pícha, K.; Martinát, S.; Navrátil, J. Direct or indirect energy savings in food and beverage services? Visitors′ preferences in hotel restaurants. Heliyon 2023, 9, e17519. [Google Scholar] [CrossRef] [PubMed]
  46. Fonseca Arenas, N.; Shafique, M. Recent progress on BIM-based sustainable buildings: State of the art review. Dev. Built Environ. 2023, 15, 100176. [Google Scholar] [CrossRef]
  47. D’Agostino, D.; Congedo, P.M.; Albanese, P.M.; Rubino, A.; Baglivo, C. Impact of climate change on the energy performance of building envelopes and implications on energy regulations across Europe. Energy 2024, 288, 129886. [Google Scholar] [CrossRef]
  48. Shen, Y.; Liu, W.; Dinçer, H.; Yüksel, S. Hybrid molecular fuzzy recommender systems for impact of climate change on renewable energy performance. Renew. Energy 2025, 245, 122799. [Google Scholar] [CrossRef]
  49. Shahid, M.N.; Shahid, M.U.; Irfan, M. Advances in Building Energy Management: A Comprehensive Review. Buildings 2025, 15, 4237. [Google Scholar] [CrossRef]
  50. Qing, L.; Li, P.; Dagestani, A.A.; Woo, C.; Zhong, K. Does climate change exposure impact on corporate finance and energy performance? Unraveling the moderating role of CEOs’ green experience. J. Clean. Prod. 2024, 461, 142653. [Google Scholar] [CrossRef]
  51. Hosseini Dehshiri, S.S.; Hosseini Dehshiri, S.J.; Mostafaeipour, A. Waste heat recovery systems integrated in hotels: An uncertain and reliable planning. Appl. Therm. Eng. 2025, 281, 128653. [Google Scholar] [CrossRef]
  52. Ghorab, M.G.; Rosato, A. Innovative hybrid 4th generation geothermal system for zero-carbon hotel buildings in cold climate. Energy Build. 2025, 329, 115305. [Google Scholar] [CrossRef]
  53. Fasna, M.F.F.; Gunatilake, S. Roles and functions of stakeholders in implementing energy retrofits in the hotel sector. Int. J. Build. Pathol. Adapt. 2019, 38, 737–751. [Google Scholar] [CrossRef]
  54. Yu, J.; Chiriko, A.Y.; Kim, S.; Moon, H.G.; Choi, H.; Han, H. ESG management of hotel brands: A management strategy for benefits and performance. Int. J. Hosp. Manag. 2025, 125, 103998. [Google Scholar] [CrossRef]
  55. He, Y.; Qi, R.; So, K.K.F.; Li, Y. Which ESG dimensions matter in the hotel industry? Evidence from the cost of debt. Int. J. Hosp. Manag. 2024, 122, 103866. [Google Scholar] [CrossRef]
  56. Lombarts, A. ESG and CSRD in the Hospitality & Tourism Industry. Int. Encycl. Bus. Manag. 2026, 4, 420–422. [Google Scholar] [CrossRef]
  57. Angelico, C. The green transition and firms’ expectations on future prices: Survey evidence. J. Econ. Behav. Organ. 2024, 221, 519–543. [Google Scholar] [CrossRef]
  58. Siponen, M.; Haapasalo, H.; Harkonen, J. Maintenance, repair, and operations inventory reduction and operational development. Int. J. Ind. Syst. Eng. 2019, 32, 1–31. [Google Scholar] [CrossRef]
  59. Sáez-de-Guinoa, A.; Zambrana-Vasquez, D.; Fernández, V.; Bartolomé, C. Circular Economy in the European Construction Sector: A Review of Strategies for Implementation in Building Renovation. Energies 2022, 15, 4747. [Google Scholar] [CrossRef]
  60. Ahmad, M.W.; Mourshed, M.; Yuce, B.; Rezgui, Y. Computational intelligence techniques for HVAC systems: A review. Build. Simul. 2016, 9, 359–398. [Google Scholar] [CrossRef]
  61. Bolton, P.; Halem, Z.; Kacperczyk, M. The Financial Cost of Carbon. J. Appl. Corp. Financ. 2022, 34, 17–29. [Google Scholar] [CrossRef]
  62. Borys, T.; Bugdol, M.; Puciato, D.; Szromek, A.R.; Geryk, M. Motivations for hotels to undertake pro-ecological activities–opinions of hotel guests. Econ. Environ. 2023, 87, 673. [Google Scholar] [CrossRef]
  63. Gajdzik, B.; Sroka, W. Resource Intensity vs. Investment in Production Installations—The Case of the Steel Industry in Poland. Energies 2021, 14, 443. [Google Scholar] [CrossRef]
  64. Kleindorfer, P.R.; Singhal, K.; Van Wassenhove, L.N. Sustainable Operations Management. Prod. Oper. Manag. 2005, 14, 482–492. [Google Scholar] [CrossRef]
  65. Singh, A.B.; Mishra, Y.; Yadav, S. Toward Sustainability: Interventions for Implementing Energy-Efficient Systems into Hotel Buildings. Eng. Proc. 2024, 67, 80. [Google Scholar] [CrossRef]
  66. López-Bernabé, E.; Foudi, S.; Linares, P.; Galarraga, I. Factors affecting energy-efficiency investment in the hotel industry: Survey results from Spain. Energy Effic. 2021, 14, 34–41. [Google Scholar] [CrossRef] [PubMed]
  67. Tourkolias, C.; Kontogianni, A.; Damigos, D.; Skourtos, M. Exploring the factors influencing energy efficiency in the Greek hotel sector. Acta Innov. 2020, 37, 5–20. [Google Scholar] [CrossRef]
  68. Abdou, A.H.; Hassan, T.H.; El Dief, M.M. A Description of Green Hotel Practices and Their Role in Achieving Sustainable Development. Sustainability 2020, 12, 9624. [Google Scholar] [CrossRef]
  69. Orynycz, O.; Tucki, K. Total Productive Maintenance Approach to an Increase of the Energy Efficiency of a Hotel Facility and Mitigation of Water Consumption. Energies 2021, 14, 1706. [Google Scholar] [CrossRef]
  70. Rasta, M.; Suamir, N. Air Conditioning System Performance of a City Hotel Appraised for Energy Use Efficiency. J. Adv. Res. Fluid Mech. Therm. Sci. 2021, 83, 118–139. [Google Scholar] [CrossRef]
  71. Cunha, F.O.; Oliveira, A.C. Comparison of nZEB indicators for hotel renovations under different European climatic conditions. Int. J. Low Carbon Technol. 2021, 16, 246–257. [Google Scholar] [CrossRef]
  72. Uhlmann, E.; Bilz, M.; Baumgarten, J. MRO–Challenge and Chance for Sustainable Enterprises. Procedia CIRP 2013, 11, 239–244. [Google Scholar] [CrossRef]
  73. Herzallah, A.M.; Iriqat, R.A.M.; Hamed, M.H.; Zaki, K.; Elnagar, A.K. Green synergy in hospitality: Unveiling the nexus between environmentally sustainable practices and hotel green performance. Int. J. Hosp. Manag. 2025, 131, 104301. [Google Scholar] [CrossRef]
  74. Kellenbrink, C.; Nübel, N.; Schnabel, A.; Gilge, P.; Seume, J.R.; Denkena, B.; Helber, S. A regeneration process chain with an integrated decision support system for individual regeneration processes based on a virtual twin. Int. J. Prod. Res. 2022, 60, 4137–4158. [Google Scholar] [CrossRef]
  75. Hong-Guang, B.O.; Longlong, L.; Zhixiang, L. High-speed locomotive Xbom ontology modeling research supporting mro semantic knowledge representation. Int. J. Eng. Technol. Manag. Res. 2018, 5, 33–43. [Google Scholar] [CrossRef]
  76. Chava, S.V.K.; Dharmavaram, V.G. Al-Driven Predictive Maintenance in Shipyards: Enhancing Project Management Efficiency and Operational Cost Reduction through Statistical, Data-Driven Strategies for MRO Services. J. Inf. Syst. Eng. Manag. 2025, 10, 63–75. [Google Scholar] [CrossRef]
  77. Onolemhemhen, R.; Bello, S. Does carbon pricing policy improve energy efficiency? New evidence from Canadian provinces. Int. J. Green Energy 2024, 21, 3072–3083. [Google Scholar] [CrossRef]
  78. Benedetti, M.; Cesarotti, V.; Introna, V. Improving Energy Efficiency in Manufacturing Systems–Literature Review and Analysis of the Impact on the Energy Network of Consolidated Practices and Upcoming Opportunities. In Energy Efficiency Improvements in Smart Grid Components; Eissa, M.M., Ed.; IntechOpen: London, UK, 2015; pp. 41–68. [Google Scholar]
  79. Dziabas, T.; Deja, M.; Wiśniewska, A. A Strategy for Managing the Operation of Technical Infrastructure Based on the Analysis of ‘Bad Actors’—A Case Study of LOTOS Group S.A. Sustainability 2022, 14, 4477. [Google Scholar] [CrossRef]
  80. Tursunov, B. Analysis of Industrial Production Potential in Ensuring the Economic Security of the Regions. Rev. Gest. Inov. Tecnol. 2021, 11, 1411–1421. [Google Scholar] [CrossRef]
  81. Bassi, A.M.; Tan, Z.; Mbi, A. Estimating the impact of investing in a resource efficient, resilient global energy-intensive manufacturing industry. Technol. Forecast. Soc. Change 2012, 79, 69–84. [Google Scholar] [CrossRef]
  82. Lin, J.; Lin, B. How Much CO2 Emissions Can Be Reduced in China’s Heating Industry. Sustainability 2016, 8, 642. [Google Scholar] [CrossRef]
  83. Li, W.; Fan, Z.; Yao, D. The impact of industrial robot on green total factor energy efficiency under the ‘resource curse’ perspective: Evidence from cities in China. J. Environ. Manag. 2025, 385, 125641. [Google Scholar] [CrossRef] [PubMed]
  84. Borowski, P.F. Digitization, Digital Twins, Blockchain, and Industry 4.0 as Elements of Management Process in Enterprises in the Energy Sector. Energies 2021, 14, 1885. [Google Scholar] [CrossRef]
  85. Budiman, A.; Nurcahyo, R.; Ma’aram, A.; Habiburrahman, M. Factor analysis and cost calculation of solar energy implementation in Aviation Maintenance, Repair & Overhaul (MRO). J. Law Sustain. Dev. 2024, 12, e3487. [Google Scholar] [CrossRef]
  86. Lee, S. A Literary Survey on the Challenges of Adopting Lean in Aerospace Production and Aviation Maintenance. J. Aviat. Technol. Eng. 2023, 12, 52–63. [Google Scholar] [CrossRef]
  87. Cingoski, V.; Petrevska, B. Making hotels more energy efficient: The managerial perception. Econ. Res.-Ekon. Istraž. 2018, 31, 87–101. [Google Scholar] [CrossRef]
  88. Aslam, N.; Sahibzada, U.F.; Ahmad, M.S.; Stevenson, A. Green transformational leadership theory and practice in Italian luxury hotels: Toward environmental performance and green image. Int. J. Prod. Perform. Manag. 2025, 74, 2269–2300. [Google Scholar] [CrossRef]
  89. Anakobe, Y.; Kareem, B.; Akinnuli, B.O. Determination of Production System Effectiveness Based on Sustainable Global Standards. J. Eng. Adv. 2023, 4, 40–48. [Google Scholar] [CrossRef]
  90. Lin, S.W.; Lo, H.W.; Gul, M. An assessment model for national sustainable development based on the hybrid DEA and modified TOPSIS techniques. Complex Intell. Syst. 2023, 9, 5449–5466. [Google Scholar] [CrossRef]
  91. Li, S.; Diao, H.; Wang, L.; Li, C. Energy Efficiency Measurement: A VO TFEE Approach and Its Application. Sustainability 2021, 13, 1605. [Google Scholar] [CrossRef]
  92. Tao, F.; Li, L.; Xia, X.H. Industry efficiency and total factor productivity growth under resources and environmental constraint in China. Sci. World J. 2012, 2, 310407. [Google Scholar] [CrossRef] [PubMed]
  93. European Union. Regulation (EU) No 549/2013 of the European Parliament and of the Council of 21 May 2013 on the European system of national and regional accounts in the European Union Text with EEA relevance. Off. J. Eur. Union 2013, 174, 1–727. [Google Scholar] [CrossRef]
  94. European Union. Regulation (EU) No 691/2011 of the European Parliament and of the Council of 6 July 2011 on European Environmental Economic Accounts Text with EEA Relevance. Off. J. Eur. Union 2011, 192, 1–16. [Google Scholar]
  95. European Union. Regulation (EU) 2019/2152 of the European Parliament and of the Council of 27 November 2019 on European business statistics, Repealing 10 Legal Acts in the Field of Business Statistics (Text with EEA relevance). Off. J. Eur. Union 2019, 327, 1–35. [Google Scholar]
  96. Eurostat. National Supply, Use and Input-Output Tables (Naio_10_cp15); Statistical Office of the European Union: Luxembourg, 2024; Available online: https://ec.europa.eu/eurostat/web/esa-supply-use-input-tables (accessed on 23 April 2026).
  97. Hsiao, C. Analysis of Panel Data; Cambridge University Press: New York, NY, USA, 2014; pp. 43–98. [Google Scholar]
  98. Sarstedt, M.; Hair, J.F.; Ringle, C.M.; Thiele, K.O.; Gudergan, S.P. Estimation issues with PLS and CBSEM: Where the bias lies! J. Bus. Res. 2016, 69, 3998–4010. [Google Scholar] [CrossRef]
  99. Hair, J.F.; Hult, G.T.M.; Ringle, C.M.; Sarstedt, M. A Primer on Partial Least Squares Structural Equation Modeling (PLS-SEM); Sage Publishing: Washington, DC, USA, 2022; pp. 11–123. [Google Scholar]
  100. Dijkstra, T.K.; Henseler, J. Consistent and asymptotically normal PLS estimators for linear structural equations. Comput. Stat. Data Anal. 2015, 81, 10–23. [Google Scholar] [CrossRef]
  101. Dijkstra, T.K.; Henseler, J. Consistent Partial Least Squares Path Modeling. MIS Q. 2015, 39, 297–316. [Google Scholar] [CrossRef]
  102. Henseler, J.; Ringle, C.M.; Sarstedt, M. A new criterion for assessing discriminant validity in variance-based structural equation modeling. J. Acad. Mark. Sci. 2015, 43, 115–135. [Google Scholar] [CrossRef]
  103. Streukens, S.; Leroi-Werelds, S. Bootstrapping and PLS-SEM: A step-by-step guide to get more out of your bootstrap results. Eur. Manag. J. 2016, 34, 618–632. [Google Scholar] [CrossRef]
  104. Hayes, A.F. Introduction to Mediation, Moderation, and Conditional Process Analysis: A Regression-Based Approach; Guilford Press: New York, NY, USA, 2018; pp. 8–64. [Google Scholar]
  105. Ray, S.; Danks, N.; Calero Valdez, A. SEMinR: Domain-Specific Language for Building, Estimating, and Visualizing Structural Equation Models in R; SSRN: Rochester, NY, USA, 2021. [Google Scholar] [CrossRef]
  106. Lahti, L.; Huovari, J.; Kainu, M.; Biecek, P. Retrieval and Analysis of Eurostat Open Data with the eurostat Package. R J. 2017, 9, 385–392. [Google Scholar] [CrossRef]
  107. Baron, R.M.; Kenny, D.A. The moderator-mediator variable distinction in social psychological research: Conceptual, strategic, and statistical considerations. J. Pers. Soc. Psychol. 1986, 51, 1173–1182. [Google Scholar] [CrossRef] [PubMed]
  108. Kaya, Y.; Yokobori, K. Environment, Energy, and Economy: Strategies for Sustainability; UN University Press: New York, NY, USA, 1997. [Google Scholar]
  109. Henseler, J.; Ringle, C.M.; Sarstedt, M. Testing measurement invariance of composites using partial least squares. Int. Mark. Rev. 2016, 33, 405–431. [Google Scholar] [CrossRef]
  110. Henseler, J.; Hubona, G.; Ray, P.A. Using PLS path modeling in new technology research: Updated guidelines. Ind. Manag. Data Syst. 2016, 116, 2–20. [Google Scholar] [CrossRef]
  111. Bovenberg, A.L.; de Mooij, R.A. Environmental Levies and Distortionary Taxation. Am. Econ. Rev. 1994, 84, 1085–1089. [Google Scholar]
  112. Lai, J.H.K. Energy use and maintenance costs of upmarket hotels. Int. J. Hosp. Manag. 2016, 56, 33–43. [Google Scholar] [CrossRef]
  113. Arenhart, R.S.; Martins, T.; Ueda, R.M.; Souza, A.M.; Zanini, R.R. Energy use and its contributors in hotel buildings: A systematic review and meta-analysis. PLoS ONE 2024, 19, e0309745. [Google Scholar] [CrossRef] [PubMed]
  114. Swastanto, G.A.; Johnson, M.E. Exploratory Study of Sustainability Practices in Worldwide Major Aircraft Maintenance, Repair, and Overhaul Companies. Transp. Res. Rec. 2024, 2678, 1060–1078. [Google Scholar] [CrossRef]
  115. Pigou, A. The Economics of Welfare; Taylor & Francis Inc.: London, UK, 2017. [Google Scholar]
  116. IEA. World Energy Employment 2023; International Energy Agency: Paris, France, 2023; Available online: https://www.iea.org/reports/world-energy-employment-2023 (accessed on 26 April 2026).
  117. European Parliament and Council of the EU. Directive (EU) 2024/1275 of the European Parliament and of the Council of 24 April 2024 on the Energy Performance of Buildings (Recast). Off. J. Eur. Union 2024, OJ L 2024/1275. [Google Scholar]
  118. European Union. Job Creation–the Just Transition and Impact Investments. In Proceedings of the European Parliament Resolution of 23 November 2023 on Job Creation–the Just Transition and Impact Investments (2022/2170(INI)). Off. J. Eur. Union 2024, OJ C C/2024/4224. [Google Scholar]
  119. Leth-Steensen, C.; Gallitto, E. Testing Mediation in Structural Equation Modeling. Educ. Psychol. Meas. 2016, 76, 339–351. [Google Scholar] [CrossRef] [PubMed]
  120. Pesaran, M.H. A simple panel unit root test in the presence of cross-section dependence. J. Appl. Econom. 2007, 22, 265–312. [Google Scholar] [CrossRef]
Figure 1. Path diagram of the PLSc-SEM model with the estimation of β coefficients. where: Significance levels: *** p < 0.001; ** p < 0.01; * p < 0.05; ns—not significant.
Sustainability 18 07084 g001
Table 1. Quantification of research variables in the PLSc-SEM model.
ConstructType of Variable in the ModelObservable VariableDescriptionMeasurement ScaleData Source
MROExogenousx1—Production ValueTotal production value of sector NACE C33mln EURStructural Business Statistics [95]
x2—EmploymentNumber of employeesths. personsStructural Business Statistics [95]
x3—Gross InvestmentGross investment in fixed assetsmln EURStructural Business Statistics [95]
EnergyExogenousx5—Emission IntensityGHG emissions per unit of added valueg CO2 equiv./EUREmission Intensity Eurostat [94]
HotelExogenoush1—Energy Consumption (imputed for 2008–2013) aEnergy consumption of the hotel sectorTJEnergy Flow Accounts [94]
EcoEndogenousx7—GHG EmissionsGHG emissions of the sectorths. tons CO2 equiv.Air Emission Accounts [94]
Mediatorx8—CO2 EmissionsCO2 emissions of the sectorths. tons CO2Air Emission Accounts [94]
PollEndogenousx9—Environmental TaxesRevenues from environmental taxesmln EURTax Revenues by Activity [94]
Mediatorx10—Energy TaxesRevenues from energy taxesmln EURTax Revenues by Activity [94]
WorkEndogenousx11—WagesSector labor compensation costsmln EURNational Accounts [93]
Source: own study. Note: All nominal variables are expressed in millions of EUR at current prices, except for emission intensity (x5), which is expressed in constant 2020 prices. Data were obtained from Eurostat databases and processed using the eurostat package in the R environment [93,94,95,99]. Variable numbering (x1–x11) reflects the original set of candidate indicators considered during data preparation; x4 and x6 were excluded during variable selection due to incomplete Eurostat coverage across the study period and do not appear in the final model. (a) Values for 2008–2013 were obtained through backward linear extrapolation due to limited data availability in the Physical Energy Flow Accounts database prior to 2014 (see Section 3.1 and Section 5.6 for details and limitations).
Table 2. Validation results of the PLSc-SEM measurement model for the surveyed enterprises.
ConstructIndexLoad (λ)BCa 95% CIAρCAVEρA
MROx1 (production value)0.953[0.936; 0.970]0.9620.9620.8940.962
x2 (employment)0.948[0.922; 0.970]----
x3 (gross investment)0.936[0.912; 0.963]----
Energyx5 (GHG intensity/GVA)1.000-1.0001.0001.0001.000
Hotelh1 (NACE I energy consumption)1.000-1.0001.0001.0001.000
Ecox7 (GHG emissions)0.996[0.990; 1.001]0.9970.9970.9940.997
Pollx9 (environmental taxes)1.026[1.015; 1.035]0.9950.9960.9920.998
x10 (energy taxes)0.965[0.953; 0.979]----
Workx11 (D1 wages)1.000-1.0001.0001.0001.000
Source: own study.
Table 3. Verification of discriminant validity using the HTMT criterion.
ConstructHotelsMROEnergyEcoPollWork
Hotels-
MRO0.910-
Energy0.1980.334-
Eco0.8480.8750.097-
Poll0.6100.7000.0860.849-
Work0.7830.9280.3270.7380.515-
Source: own study.
Table 4. Fornell–Larcker criterion (square root of AVE on diagonal, construct correlations below diagonal).
ConstructHotelMROEnergyEcoPollWork
Hotel1.000.....
MRO0.8930.946....
Energy−0.198−0.3281.000...
Eco0.8460.857−0.0970.997..
Poll0.6090.685−0.0860.8460.996.
Work0.7830.911−0.3270.7370.5141.000
Source: own study. Note: The bold diagonal values represent the square root of AVE for each construct. For discriminant validity to hold, each diagonal value should exceed the off-diagonal correlations in its row and column.
Table 5. Cross-loadings.
IndicatorHotelMROEnergyEcoPollWork
x10.9030.976−0.3270.7960.6090.927
x20.8840.970−0.3590.8160.6910.848
x30.7950.946−0.2600.8660.6810.857
x5−0.198−0.3281.000−0.097−0.086−0.327
h11.0000.893−0.1980.8460.6090.783
x70.8420.853−0.0870.9990.8360.745
x80.8480.858−0.1060.9990.8540.728
x90.6180.702−0.0980.8610.9980.542
x100.5960.664−0.0730.8260.9970.482
x110.7830.911−0.3270.7370.5141.000
Source: own study. Note: Bold values indicate each indicator’s loading on its assigned construct. All indicators load most strongly on their assigned construct, confirming discriminant validity.
Table 6. Results of the structural model estimation: hypothesized paths (H1–H8) and additional structural controls.
Hyp.sPathβTBCa 95% CIpResult
H1MRO → Eco0.94862.586[0.919; 0.978]<0.001✓ ***
H2MRO → Poll−0.255−1.771[−0.529; 0.039]0.076✗ ns
H3MRO → Work1.21410.601[1.012; 1.455]<0.001✓ ***
H4Energy → Eco0.22010.281[0.177; 0.262]<0.001✓ ***
H5Energy → Poll−0.068−3.015[−0.114; −0.024]0.003✓ **
H6Energy → Work0.0472.203[0.009; 0.093]0.028✓ *
H7Hotel → MRO0.91064.650[0.881; 0.936]<0.001✓ ***
H8Poll → Work−0.211−4.089[−0.319; −0.116]<0.001✓ ***
Eco → Poll1.0658.262[0.810; 1.321]<0.001✓ ***
Eco → Work−0.141−0.927[−0.454; 0.135]0.354✗ ns
Significance levels: *** p < 0.001; ** p < 0.01; * p < 0.05; ns—not significant; *, **, ***—significance level; ✗—hypothesis statistically insignificant; ✓—statistically significant hypothesis. Source: own study.
Table 7. Variance Inflation Factors (VIF) for structural model antecedents.
Endogenous ConstructAntecedentVIF
EcoMRO1.120
EcoEnergy1.120
PollMRO4.864
PollEnergy1.306
PollEco4.383
WorkMRO5.007
WorkEnergy1.316
WorkEco8.090
WorkPoll3.624
Source: own study.
Table 8. The values of R2 and adjusted R2 in the PLSc-SEM model.
Endogenous ConstructR2Corrected R2Interpretation
MRO0.8290.828Strong (≥0.75)
Eco0.8080.807Strong (≥0.75)
Poll0.7310.728Moderate (≥0.50)
Work0.9000.898Strong (≥0.75)
Source: own study.
Table 9. Results of the analysis of indirect effects in the PLSc-SEM model.
The Middle PathMediatorβTBCa 95% CIpMediation
Hotel → MRO → EcoMRO0.86343.937[0.823; 0.900]<0.001full ✓
Hotel → MRO → WorkMRO1.1059.988[0.913; 1.344]<0.001full ✓
Hotel → MRO → PollMRO−0.232−1.755[−0.488; 0.035]0.079none ✗
MRO → Eco → PollEco1.0087.832[0.761; 1.270]<0.001full ✓
where: ✗–hypothesis statistically insignificant; ✓–statistically significant hypothesis Source: own study.
Disclaimer/Publisher’s Note: The statements, opinions and data contained in all publications are solely those of the individual author(s) and contributor(s) and not of MDPI and/or the editor(s). MDPI and/or the editor(s) disclaim responsibility for any injury to people or property resulting from any ideas, methods, instructions or products referred to in the content.