Article

Determining Marine Protected Area Zoning Under Multiple Objectives: Do Marine Managers’ Priorities Align?

1
CSIRO Environment, St Lucia 4067, Australia
2
QUT School of Economics and Finance, Brisbane 4000, Australia
3
QUT School of Biology and Environmental Science, Brisbane 4000, Australia
4
Natural Capital and Climate, Fortitude Valley 4006, Australia
*
Author to whom correspondence should be addressed.
Sustainability 2026, 18(14), 7035; https://doi.org/10.3390/su18147035
Submission received: 4 May 2026 / Revised: 30 June 2026 / Accepted: 1 July 2026 / Published: 9 July 2026

Abstract

Globally, marine protected areas (MPAs) have been designated with the aim of protecting marine biodiversity, primarily from extractive activities such as fishing. Most MPAs also include a range of zones with different fishing or other activities allowed in each, generally referred to as partially protected areas (PPAs). How these zones are implemented is often subject to disagreement between the impacted interest groups. Opposition to zoning may, in some cases, be the result of political lobbying or other interventions to stall or influence the process. In this study, we identify the key objectives considered by Australian MPA managers when planning uses in different areas of MPAs as well as their relative importance to decision-making. We also assess their relative importance from the perspective of fisheries managers, who are also responsible for the management of the primary users of the PPAs. We apply the modified analytic hierarchy process using data collected in a national survey of both groups. We find that both place the highest importance on achieving ecological objectives, but the importance of different economic and social objectives varies significantly between the groups. This may result in conflict not over the designation of conservation critical areas but over which activities are allowed in the PPAs.

1. Introduction

Marine ecosystems deliver a wide range of social, economic, and environmental benefits [1]. These enhance human wellbeing by supporting livelihoods through commercial activities (such as through improving fish stocks or tourism opportunities), contributing to climate regulation through carbon sequestration and storage, and providing food security in fishery-dependent communities. They also enable marine transport, offer recreational and aesthetic value, and hold cultural and spiritual significance for both nearby communities and people more broadly [1].
Many of these benefits are interconnected, resulting in trade-offs in potential outcomes. For example, intensive use of marine resources for commercial activities like fishing can increase short-term economic gains but may come at the cost of reduced long-term environmental sustainability and the continued delivery of ecosystem services to the broader community. Sustainable marine resource management requires balancing the use of marine environmental resources to meet current demands while ensuring their continued existence, acting as a cornerstone for environmental, economic, and social sustainability [2,3]. Sustainable Development Goal 14 (“Life Below Water”) recognises the need to balance the protection and the use of marine ecosystems to achieve these sustainability outcomes, with targets relating to each [4].
Internationally, the number of MPAs has increased exponentially over the past two decades, driven by a need to meet international obligations and targets for environmental protection [5]. For example, the Convention on Biological Diversity requires protecting and conserving at least 30% of the marine and coastal regions 2030 [6]. Zoning within most of these MPAs allows some areas with restricted marine resource extraction [5,7]. These areas are generally considered “partially protected areas” (PPAs) [8], with the areas that are closed to such activities considered “Fully protected areas” (FPAs). FPAs generally aim to achieve a narrower range of outcomes, such as ecological restoration, by restricting harvesting and other direct uses. In contrast, PPAs permit certain ongoing economic and social activities while still safeguarding important marine habitats and preserving non-use values. Different zoning may provide continued access for tourism and recreation (cultural ecosystem services) or commercial fishing (biomass provisioning services), subject to restrictions on how the species are caught [9].Through zoning, a combination of FPAs and PPAs can be established within a single marine ecosystem or habitat. These zoned areas, commonly referred to as Marine Parks, collectively form a network of protected areas across the ecosystem.
In 2021, approximately 69% of MPAs globally permitted some level of fishing activity [10]. In Australia, 61% of MPAs are classified as partially protected [11].
The extent and spatial allocation of FPAs and PPAs has implications for the ecological, economic and social benefits derived from the MPAs. Closure of areas in MPAs to fishing (commercial and/or recreational) has a direct negative impact on the area available to fish and, potentially, on the quantity of fish that may be extracted. However, there exists some evidence that MPAs may still provide fishery benefits that transfer into areas open to fishing under certain conditions (e.g., through species mobility, larval export, low external fishing pressure) [3,12,13,14]. MPAs and fisheries therefore have a complicated relationship. The net ecological, economic and social outcomes potentially depended on the existing fisheries’ activities being undertaken in the areas impacted, which in turn are dependent on fisheries management [15].
As a result, achieving ecological, social and economic benefits from MPAs requires an integrated approach to fisheries management and marine conservation [16,17]. While the key broad objectives that underpin management decisions may overlap (e.g., ecological, social and economic), the relative importance that fisheries and MPA managers place on these objectives may vary [18].
Conflicting core values about the importance of different management objectives are a primary source of many MPA governance challenges [19,20]. Effective integrated management will depend on the degree of alignment of values and visions by the different stakeholders with respect to these MPA objectives [21]. Studies elsewhere e.g., [22,23]) have found that these objectives and priorities may not align, particularly with regard to social and economic outcomes, resulting in potential conflicts in a stakeholder group (managers) that we would typically assume to be aligned.
Optimisation in spite of conflicting objectives is, in theory, achieved through all stakeholders inputting into the decision-making process to develop compromise, or so-called “middle ground”, solutions [19]. Co-design of MPAs has been undertaken in a number of cases internationally, often involving an iterative process of proposal development, consultation and revision e.g., [24]). Lack of transparency and shared understanding of the objectives of each stakeholder group have been key criticisms of such approaches [25]. Conversely, others have built on multicriteria approaches, in which stakeholder objectives and their relative importance are first established to ensure transparency, and the MPA plan is then developed accordingly e.g., [26,27]).
Within Australia, Phillips, et al. [11] identified the absence of clear and explicit objectives as a key obstacle to assessing the effectiveness of PPAs for marine conservation. In particular, there is a need for identification of measurable social and economic objectives relevant to improved MPA/PPA planning and assessment [11] and the importance of these to the key stakeholder groups. We aim to address this deficiency in this study, focusing on the objectives and the relative importance of these to the two key marine resource manager groups. In developing final zoning plans, MPA managers need to work with fisheries managers to ensure that complementary regulations are in place that best achieve the objectives of both groups [28]. As a first step, there is a need to first identify what objectives the MPA managers are aiming to achieve through the designation of different use zones and also to determine the relative importance that both MPA and fisheries managers give to these.
In this paper, we demonstrate and apply an approach for quantifying the relative importance of these objectives with the aim of increasing transparency in decision-making with regard to MPA zoning. First, we identify the key operational objectives underpinning the zoning within Australian MPAs through a series of stakeholder workshops. We quantitatively assess the relative importance of these objectives from the perspectives of both MPA and fisheries managers using the modified analytic hierarchy process (MAHP) approach [29]. We test for statistically significant differences between these two manager groups with respect to the mean importance weighting of these objectives.

2. Materials and Methods

The study involved a review of key policy documents, stakeholder engagement through two workshops to identify the potential operational management objectives, and an online survey to elicit the relative importance of these objectives.

2.1. Identifying Management Objectives

Key Australian policy documents relating to marine park management were reviewed to identify a potential set of common objectives. These were refined through a series of workshops held with MPA managers to identify the range of operational objectives, following Brooks, et al. [30] (see Supplementary Information for further information).
Workshops were undertaken with managers from State and Commonwealth (Federal) agencies responsible for marine park management. Queensland was chosen to represent State MPA managers as they were undertaking a review of the existing Moreton Bay Marine Park management plan and were developing a plan for the new Great Sandy Straits Marine Park, and hence defining and ratifying objectives were a key consideration. These are essentially inshore marine parks (within 3 nm of the coast) with multiple users, primarily commercial and recreational fishers but also other recreational and tourism activities, e.g., whale watching. Key guiding principles that support the objective development of MPAs and PPAs in Queensland have been developed [31] and were applied in previous planning for Moreton Bay.
Commonwealth-managed MPAs, located mostly offshore, similarly have multiple users, but in a different mix than the inshore MPAs (i.e., greater interaction with commercial fisheries and less with recreational users). The total number of users is also substantially lower than in State-managed MPAs due to their lower accessibility. Guiding principles for MPA design have also been developed by Parks Australia [32].
The workshops with the managers were held sequentially, roughly one month apart, with Queensland managers first and then Commonwealth managers. Working with the triple-bottom-line framework (i.e., ecological, economic and social objectives [33]), a candidate set of objectives were developed first with the State managers. This was developed as an iterative process, with individuals first proposing objectives on three whiteboards (one each for ecological, economic and social objectives). These were then discussed collectively, with a target of no more than around seven or eight objectives in each area. Similar objectives were combined, and those considered least important by the group were discarded.
These objectives were presented to the Commonwealth managers in the second workshop and modified as required to ensure their objectives were also captured. From this, a candidate final set of objectives was derived, which was then validated with both sets of managers through subsequent meetings with key senior individuals from each group (again, an iterative process until both were satisfied). In total, eight senior MPA managers were involved in the Queensland workshop and six in the Commonwealth workshop, covering policy development, zoning and operational responsibilities.

2.2. Elicitation of Objective Preference Weights

Preference weights were obtained through an online survey based on the modified Analytic Hierarchy Process (MAHP) [29]. Respondents rated each objective on a nine-point importance scale, analogous to a Likert scale, ranging from one (not very important) to nine (extremely important) (see Supplementary Information). This resulted in an “absolute” score ( a i ) ranging from 1 to 9 for each objective.
From this, a difference-based score given any two objectives, a i , j , was derived [29]:
a i , j = a i a j + 1 i f a i a j > 0 1 a i a j 1 i f a i a j 0
This provided a measure of the relative preference for each, which again ranged from 1 (if the two objectives were considered equal) to 9 if one objective was considered substantially more important than the other. This is analogous to scores produced by the bivariate measure in the traditional AHP [34]. As with traditional AHP, these preferences are assumed to be symmetrical, such that a j , i = 1 / a i , j .
Objectives are compared against each other as a group, so the first score can influence those that follow (i.e., an anchoring effect [35]). Because this starting point differs between people, using the difference between scores helps reduce its impact [36,37]. For example, (7,5) and (4,2) give the same result because the gap between the two objectives is the same in both cases [29].
The geometric mean method (GMM) [38,39] is used to derive the final weights for each objective ( ω i ), given by
ω i = j = 1 n a i , j 1 / n / j j = 1 n a i , j 1 / n
where n is the number of objectives being compared [29].
As with the traditional AHP approach, objectives are assessed separately at each level of the hierarchy. Higher-level objectives (e.g., ecological, economic and social objectives as a group) were first compared with each other to estimate their objective weight (e.g., ω 1 , ω 2 , , ω 5 , ω 6 ). The lower-level objectives (e.g., the more specific sub-objectives under each of the broader economic, social or ecological objectives) are then compared to estimate their relative weights within each separate higher-level objective group ( ω 1.1 , ω 1.2 , , ω 1 . n , then ω 2.1 , ω 2.2 , , ω 2 . n , etc.). The final weight of each individual sub-objective is then determined by the product of its weight ( ω i , j ) and the relevant higher-order objective weight ( ω i ) under the principle of hierarchic composition [40]. This is done for each respondent individually, such that the sub-objective weight is individual-specific.

2.3. Group Coherence

A common measure in AHP is group coherence, which shows how closely aligned or different people’s preferences are within a group [41]. A measure of group coherence,  ρ ¯ , can be given by [42]
ρ ¯ = v i v j i j
where vi and vj are vectors comprising the square roots of the importance weights of individuals i and j; and 〈 〉 indicates the average of the set of dot products [42]. Values of the coherence measure, ρ ¯ , closer to 1 indicate greater average agreement among the set of individuals examined. We adopted the criteria developed by Himes [41], which defined three levels of coherence: strong (0.93–1.00), good (0.90–0.93) and weak (<0.90) coherence. These criteria have also been adopted in other studies e.g., [43]). We considered the level of coherence within each manager group as well as the pooled sample (i.e., combining MPA and fisheries managers).

2.4. Comparison of Group Means

The significance of any apparent differences in the means of the objective scores between the two manager groups were examined in two ways. As the estimated weights are derived from essentially ordinal data, the non-parametric Wilcoxon–Mann–Whitney test was undertaken to test the significance of differences in the distributions of the two independent groups with respect to each objective. A Welch Two-Sample t-test was also undertaken to determine whether there is a significant difference between the means of the two independent groups for each objective. The Welch Two-Sample t-test does not assume that groups have equal variances, unlike the Student t-test.

2.5. Inconsistencies

Inconsistencies in survey-based AHP studies are a common problem with the traditional AHP method [34]. Consistency between preference ratings is a particularly important issue as the presence of inconsistencies may distort the resultant preference weights [44]. While the data collection and analysis process adopted should ensure that these are minimised [29], measurement of the levels of inconsistency were also undertaken to ensure the robustness of the results.
The level of inconsistency can be estimated using the Geometric Consistency Index (GCI), given by
G C I = 2 ( n 1 ) ( n 2 ) i < j log 2 a i , j w j / w i
where n is again the number of objectives being compared [45]. The critical value of the GCI depends on the number of objectives compared, with the critical values being given as 0.315 for n = 3, 0.353 when n = 4 and 0.370 for n > 4 [45].

2.6. Survey Sample and Response Rate

Invitations were sent by email to individuals identified by workshop participants as having an involvement in MPA management or in fisheries that interact with MPAs. Contact with key management agencies (both fisheries and MPAs) in each State was also made, and additional relevant individuals were identified for the survey (Surveys were also sent to conservation organisations as well as to commercial and recreational fishery organisations. Response rates from these groups were too low to include in the analysis (see Supporting Information and [1]).). The survey was implemented in Qualtrics.
A total of 105 invitations were sent via email (Table 1). In several instances, the invitation received an automatic rejection (e.g., the recipient no longer working there; incorrect email address; and in some cases, rejected as suspected spam). These were excluded in the estimation of the response rate.
In total, 41 complete responses were collected, with an overall effective response rate of 43%. This is roughly consistent with the average response rate (44%) found in a meta-analysis of online surveys [46]. Responses were received from each group from all jurisdictions except the Northern Territory. Characteristics of the respondents (in terms of geographic location, gender and experience) are presented in the Supplementary Information.

3. Results

3.1. Identification of Operational Objectives

The final set of operational objectives relating to marine park management are given in Figure 1. These are broadly classified into the standard triple-bottom-line categories of ecological, economic and social objectives. Further details on these objectives are also available in Coglan, et al. [1].

3.2. Objective Preferences

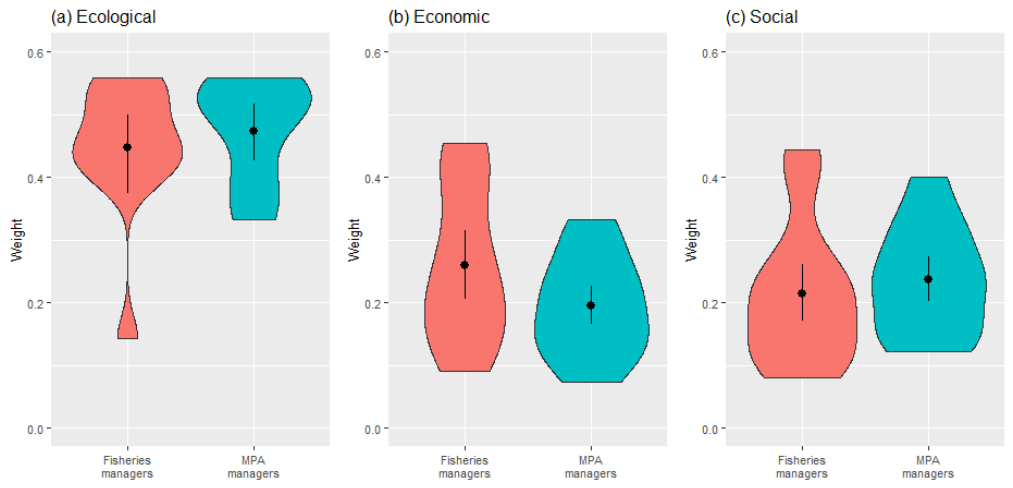
The distribution of the high-level triple-bottom-line (TBL) objective weights for each stakeholder group is shown in Figure 2. The vertical distribution of each of the violin plots depicts the range of objective weights for each group, while the width at any one point provides an indication of the relative frequency of the value within the distribution.
From Figure 2, respondents from both manager groups placed higher importance on ecological outcomes. This is not unexpected given that both have a primary role in environment management. The importances of economic and social factors were correspondingly lower for each management group, with fisheries managers tending to have a wider distribution of responses than MPA managers.
The relative importances of each sub-objective under each TBL category from Figure 1 were derived separately within each category (given in Tables S1–S3 in the Supplementary Information). These sub-objective importance weights were subsequently re-weighted by the respondents’ weight for each of the higher-level objectives. That is, the individual sub-objective weight is multiplied by the TBL category weight to allow for comparisons across TBL categories. The resultant means of the individual objective weights and their standard errors are given in Table 2 for each manager group. The probabilities associated with the null hypothesis of equal mean values from both the Wilcoxon–Mann–Whitney test and the Welch Two-Sample t-test are also presented in Table 2.
Protecting biodiversity (Obj 1.4) and protecting unique habitats (Obj 1.1) were rated as the most important ecological objectives by both groups (Table 2). This is unsurprising, as the protection of biodiversity and marine habitats is historically the principle reason for the implementation of MPAs [20]. Fishing is often seen as a major threatening process for habitats and biodiversity, and fisheries managers need to ensure that these impacts are minimised to allow continued access to the resources within the MPA. Overall, the mean scores of all ecological sub-objectives were not significantly different between the two groups.
Within the economic sub-objectives, fisheries managers had a significantly higher preference for ensuring that zoning minimised impact on fisheries (Obj 2.1) and improved resource conditions for commercial fisheries (Obj 2.2). If the MPAs can improve stock levels (e.g., with spillovers into the open areas), then this is of benefit to the fishing industry. The importance levels of other individual economic objectives were not significantly different between the two groups, although, overall, economic objectives were rated significantly higher by fisheries managers than MPA managers (but only at the 10 percent level).
Within the social sub-objectives, maximising social benefits to Traditional Owners (Obj 3.8) was weighted significantly higher by MPA managers, while ensuring seafood supply to local communities (Obj 3.6) was significantly (at the 10 percent level) more important to fisheries managers. Fisheries managers gave their highest weight to improving recreational fishing resources (Obj 3.2), significantly higher at the 10 percent level than the weight of this objective to MPA managers.

3.3. Coherence

Coherence reflects the degree to which individuals within a group agree or disagree about the relative importance of the overall set of objectives [41]. Based on the criteria of Himes [41], coherence in the objective preferences was strong for MPA managers both across the higher-level objectives (i.e., TBL) and across the sub-objectives within each domain (Table 3). In contrast, fisheries managers had strong coherency for the TBL level objectives, but only “good” coherence for the ecological and economic sub objectives (with the latter relatively borderline), and weak coherence for the social objectives. This implies that the respondents from the fisheries manager group generally agree on the overall importance of each of the TBL domains but have lower agreement as to what that looks like in terms of achieving different sub-objectives.
This is also reflected in the pooled sample, in which both MPA and fisheries managers were combined. At the higher objective level (i.e., TBL), coherence was strong across the groups, indicating agreement between the managers on the relative higher-level objective importance. The greatest agreement between the two groups was seen for the ecological objectives, although this was only considered “good”. Coherence of the pooled group in terms of the economic and social sub objectives was weak, indicating that the two groups have substantially differing perceptions about the importance of the different sub-objective components. Social sub-objective coherence was particularly weak.

3.4. Level of Inconsistencies

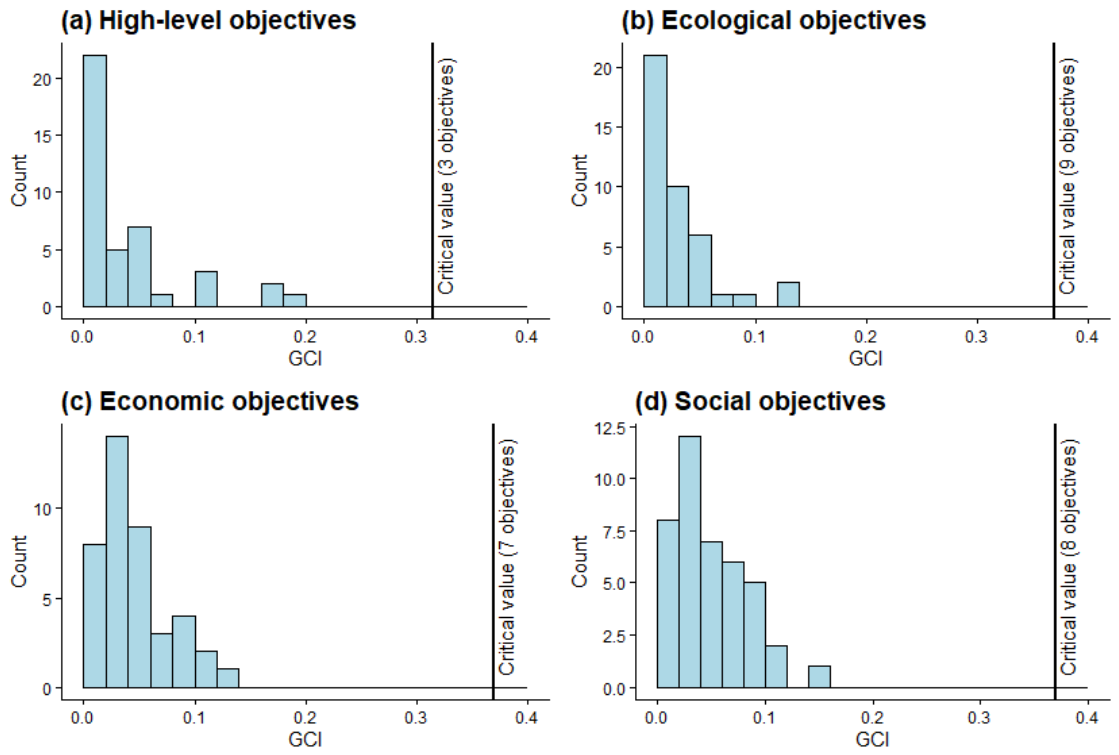
The survey instrument was designed in order to minimise, if not eliminate, inconsistencies in the responses by using the MAHP methodology [29]. As expected, all responses were within the acceptable range of inconsistency, with most well below the critical value of the Geometric Consistency Index (GCI) for each set of objectives (Figure 3). Consequently, inconsistency in responses is not considered a significant issue, ensuring the robustness of the final results.

4. Discussion

Australia has committed to protecting 30 percent of all ecosystems by 2030, including marine ecosystems [47]. Expansion of existing MPAs and development of new ones will place increasing pressure on fisheries, and hence a coordinated approach between MPA and fisheries managers will be essential to maximise conservation benefits while minimising costs to the existing users. Effectively designed MPAs can provide conservation benefits with minimal cost to fishing and, in some cases, may result in improvements [14,48,49,50,51]. Similarly, fisheries management may complement the conservation benefits of MPAs through fishing effort reduction or through spatial management of fishing effort [49].
The objectives identified in the workshops with MPA managers were largely consistent with those found in other studies of MPA management in Australia and elsewhere e.g., [11,52,53]). In most jurisdictions, these objectives have generally been only vaguely described at a high level, without operational objectives being more specifically defined [11]. The set of objectives considered in the study were only developed by MPA managers as this group is ultimately responsible for MPA development and implementation. Fisheries management objectives are generally not specific to MPAs, although these were also largely consistent with earlier studies on fisheries management objectives in Australia e.g., [54]).
The results of the survey to elicit importance weights for these objectives from both MPA and fisheries managers aligned with a priori expectations, with priorities closely reflecting the core responsibilities of each manager group. At the higher level (e.g., ecological, social and economic objectives), both groups placed greater importance on ecological objectives, consistent with previous studies on objective weightings in the marine environment in Australia [54,55] and elsewhere e.g., [56,57]). General agreement between objective importance was also seen for some sub-objectives. For example, biodiversity protection (Obj 1.4) was highly rated across both groups’ respondents.
In other cases, significant differences in objective importance weighting were observed. For example, economic objectives relating to commercial fisheries (Obj 2.1 and 2.2) were of greater importance to fisheries managers than to MPA managers. Opposition to MPAs by both commercial and recreational fishers often focuses on perceived negative economic impacts due to access restrictions and associated economic activity, resulting in regional economic and social losses [58]. The loss of seafood supply to local communities (Obj 3.6) is often noted by commercial fishers as an issue with MPAs [59] (Implicit in this is the assumption that aquaculture is unable to provide a suitable substitute to replace lost wild-caught catch, with a strong preference in regional communities for locally caught wild product [59].). Generally, objectives relating to key fisher concerns were given greater weight by fisheries managers than MPA managers, who seemed to place greater weight on other users of the MPAs (e.g., Obj 3.4). These differences are not unreconcilable, as both fishing and non-fishing activities can be accommodated in the MPA if appropriately zoned. Jones [60] notes that protection of the marine environment does not require the social and economic isolation of the fishing industry. Collaboration between MPA and fisheries managers, then, may result in benefits to a wider group of users than if MPA managers developed zoning independently of fisheries managers. Mast, et al. [61] found that MPAs with governance arrangements that include a broad set of stakeholders were substantially more likely to have a higher fish biomass than those managed by state agencies only.
Coherency within the higher-level objectives was strong, suggesting that differences in the overall ecological, economic and social objectives between the two groups were not substantial. Greater divergence in the preference weighting was observed at the sub-objective level, with coherency between respondents in regard to the social sub-objectives bordering on weak (i.e., less agreement within the groups as to the importance of these). This suggests that, overall, MPA and fisheries managers can broadly agree on the higher-level objectives, although what constitutes these objectives at a more detailed level differs. MPA managers generally had a higher level of coherency than fisheries managers. That is, MPA managers had a greater degree of agreement in terms of what was important to achieve with MPA zoning than fisheries managers, with the latter having greater diversity of views as to the relative importance of the different economic and social objectives. Coherence across the two manager groups and within the fisheries manager groups with respect to social objectives was particularly weak. Social objectives are often poorly specified in fisheries management, potentially as they are generally multi-dimensional, potentially case-specific and difficult to quantify, and require attention beyond the usual management focus of fisheries production and limits on catch and access [62]. The lower coherence of fisheries managers with respect to social objectives may reflect different and competing pressures on these managers by fishery and community stakeholders within the areas/fisheries being managed.
A key limitation of the study was that stakeholders other than managers were not included directly in the study. Attempts to survey conservation groups as well as commercial and recreational fishers were not successful (see Supplementary Information), with too few responses being received to produce meaningful results. We also assume that the responses received were representative of the views of the manager groups as a whole. The total population of marine resource managers in Australia is unknown. There are roughly 120 different fisheries across Commonwealth and State jurisdictions, although a single manager may be responsible for more than one fishery (and some fisheries may have more than one manager). Sixty-one managers were identified (either by the workshop participants or the management agencies who suggested who best to contact) as working with fisheries that interact with MPAs. The true number may be higher than this. Similarly, the number of individuals who may be considered as MPA managers is unknown. The total number of MPAs in Australia in 2024 was over 330 [63], although managers were likely responsible for multiple areas. As with any survey, there is the potential that the views of non-respondents may differ from those who responded. Further, as the individuals contacted were pre-identified (rather than randomly selected), there is the potential that their views may also be unrepresentative of the broader manager groups. Without readily available contact information for all marine resource managers, such problems are unavoidable.
A final limitation is that the set of objectives identified from the workshops are based on those of only two of the eight marine resource jurisdictions (i.e., Commonwealth and States). Managers in other jurisdictions included in the survey were given the opportunity to add additional objectives, but these were not assessed in the same manner. Only three MPA managers from the other jurisdictions provided additional objectives, and these were essentially variations of the objectives already included in the study.
The focus of this study has been on what key stakeholder groups hope to achieve through zoning in terms of ecological, economic and social outcomes. How these are to be realised once implemented will depend on the subsequent management plan and the incentives it creates. Again, there is a substantial role for stakeholder involvement in developing these subsequent management plans to ensure the set of incentives are appropriate and equitable [64].
While the results of this study are derived in an Australian context, they are consistent with results seen elsewhere e.g., [22]). The key advantage of the approach adopted for this study is that it helps identify the areas of most concern to these groups and the strengths of these preferences, allowing trade-offs (if any) to be examined and compromise proposals to be developed at an early stage.

5. Conclusions

The marine environment provides multiple direct and indirect benefits to users and associated communities. With multiple stakeholders, each with different levels of dependence and use of the marine environment, the designation and subsequent zoning of MPAs is ultimately a practical exercise in making trade-offs among the competing ecological, economic and social objectives of different stakeholder groups.
We have focused on the objectives of MPA and fisheries managers as key groups responsible for marine resource and environmental management, each representing the needs of differing stakeholder groups as well as the broader community. Our results suggest that, at the headline level, MPA managers and fisheries managers are not fundamentally at odds: both place the greatest weight on ecological outcomes, with similar, but lesser, importance on economic and social objectives at a broad level. The key challenge for MPA design therefore lies less in whether conservation should be prioritised and more in how conservation goals are operationalised through decisions about which activities are permitted where, particularly within PPAs, in which most contestation over use occurs.
By quantifying and comparing objective importance weights of key stakeholders, this study identifies where coordination is likely to succeed (e.g., broad agreement on ecological priorities) and where it is most likely to stall (e.g., divergent priorities across economic and, especially, social sub-objectives). This distinction matters because future expansion and reconfiguration of MPAs to meet international commitments such as those aligning with targets under the Kunming–Montreal Global Biodiversity Framework and Sustainable Development Goals will, over time, increasingly require negotiated zoning outcomes that remain implementable and acceptable by resource users and stakeholders. Making differences in priorities explicit early rather than leaving them implicit until zoning boundaries and allowable activities are implemented can improve transparency, focus negotiation on the specific points of divergence, and reduce the risk that conflict shifts to political lobbying late in the process.
More broadly, the approach used here provides a transferable, decision-relevant tool for MPA planning: it supports co-design by clarifying which trade-offs are acceptable to key management agencies, where compromise is most needed, and where complementary fisheries management measures may be required to achieve conservation outcomes at the least cost to users. In this way, preference elicitation is not merely descriptive; it is a mechanism for improving the efficiency, legitimacy and long-run effectiveness of multi-use MPA zoning.

Supplementary Materials

The following supporting information can be downloaded at https://www.mdpi.com/article/10.3390/su18147035/s1, Figure S1: Survey responses by jurisdiction and manager group; Figure S2: Experience in (a) current role and (b) total experience (years); Figure S3: Experience in marine management prior to current role; Figure S4: Example of multivariate comparison of objectives in the MAHP; Table S1: Response rates for the online survey—other groups; Table S2: Importance weights for each ecological sub-objective; Table S3: Importance weights for each economic sub-objective; Table S4: Importance weights for each social sub-objective.

Author Contributions

Conceptualisation, S.P. and L.C.; methodology, S.P.; software, S.P.; validation, T.C., E.D. and A.D.; formal analysis, S.P. and E.D.; investigation, S.P., L.C., E.D., T.C., N.A., A.D., I.H. and G.S.; resources, S.P., T.C. and I.H.; data curation, S.P.; writing—original draft preparation, S.P.; writing—review and editing, S.P., L.C., E.D., T.C., N.A., A.D., I.H. and G.S.; visualisation, S.P.; supervision, S.P. and L.C.; project administration, L.C.; funding acquisition, L.C. All authors have read and agreed to the published version of the manuscript.

Funding

The work was supported by the Fisheries Research and Development Corporation (FRDC) under Grant 2021-064.

Institutional Review Board Statement

Ethics approval for the survey and workshops was provided by the CSIRO Social Science and Human Research Ethics Committee (project 058/24) in accordance with the Australian National Statement on Ethical Conduct in Human Research.

Informed Consent Statement

Informed consent was obtained from all subjects involved in the study.

Data Availability Statement

The (anonymised) data are available from the corresponding author on request.

Acknowledgments

The project team would like to thank key individuals from the Queensland Department of Environment, Science and Innovation (QDESI) and Parks Australia for their participation in the workshops and broader assistance with the study. We would also like to thank the respondents to the survey, and the four anonymous reviewers who provided valuable comments on the earlier version of the paper. During the preparation of this manuscript, the authors used Microsoft 365 Copilot built on GPT-5 Chat for the purposes of summarising the paper and developing the main conclusion points. The authors have reviewed and edited this output and take full responsibility for the content of this publication.

Conflicts of Interest

AD and IH were employed by the company Natural Capital and Climate. The remaining authors declare that the research was conducted in the absence of any commercial or financial relationships that could be construed as a potential conflict of interest.

Abbreviations

The following abbreviations are used in this manuscript:
AHPAnalytic Hierarchy Process
GCIGeometric Consistency Index
FPAFully Protected Area
MAHPModified Analytic Hierarchy Process
MPAMarine Protected Area
PPAPartially Protected Area
TBLTripple Bottom Line
TEPThreatened, Endangered and Protected

References

  1. Coglan, L.; Dewilde, E.; Abeysiriwardena, N.; Doshi, A.; Haro, I.; Pascoe, S.; Cannard, T.; Roos, M.; Kenyon, R.; Dunstan, P. Trade-Offs and Co-Benefits Between Fishing and Conservation Through Area Closures and Partially Protected Areas; Fisheries Research and Development Corporation: Canberra, Australia, 2025. [Google Scholar]
  2. Qureshi, F. Sustainable Resource Management: Balancing Human Needs and Environmental Protection. Front. Environ. Sci. Sustain. 2024, 1, 1–19. [Google Scholar] [CrossRef]
  3. Rodríguez-Rodríguez, D.; Merkohasanaj, M.; López, I. Social and economic sustainability of multiple-use marine protected areas in Spain: A mixed methods, multi-scale study. Ocean Coast. Manag. 2019, 171, 47–55. [Google Scholar] [CrossRef]
  4. UN General Assembly. Transforming Our World: The 2030 Agenda for Sustainable Development, RES/70/1. Resolution Adopted by the General Assembly on 25 September 2015; United Nations: New York, NY, USA, 2015. [Google Scholar]
  5. Pike, E.P.; MacCarthy, J.M.C.; Hameed, S.O.; Harasta, N.; Grorud-Colvert, K.; Sullivan-Stack, J.; Claudet, J.; Horta e Costa, B.; Gonçalves, E.J.; Villagomez, A.; et al. Ocean protection quality is lagging behind quantity: Applying a scientific framework to assess real marine protected area progress against the 30 by 30 target. Conserv. Lett. 2024, 17, e13020. [Google Scholar] [CrossRef]
  6. Convention on Biological Diversity. Decision Adopted by the Conference of the Parties to the Convention on Biological Diversity 15/4. Kunming-Montreal Global Biodiversity Framework. In Proceedings of the Conference of the Parties to the Convention on Biological Diversity, Fifteenth Meeting—Part II, Montreal, QC, Canada, 7–19 December 2022. [Google Scholar]
  7. Day, J.; Dudley, N.; Hockings, M.; Holmes, G.; Laffoley, D.; Stolton, S.; Wells, S.; Wenzel, L. Guidelines for Applying the IUCN Protected Area Management Categories to Marine Protected Areas. Second Edition. 2019. Available online: https://portals.iucn.org/library/sites/library/files/documents/PAG-019-2nd%20ed.-En.pdf (accessed on 5 May 2025).
  8. Zupan, M.; Fragkopoulou, E.; Claudet, J.; Erzini, K.; Horta e Costa, B.; Gonçalves, E.J. Marine partially protected areas: Drivers of ecological effectiveness. Front. Ecol. Environ. 2018, 16, 381–387. [Google Scholar] [CrossRef]
  9. OECD. Marine Protected Areas: Economics, Management and Effective Policy Mixes; OECD: Paris, France, 2017. [Google Scholar]
  10. Turnbull, J.W.; Johnston, E.L.; Clark, G.F. Evaluating the social and ecological effectiveness of partially protected marine areas. Conserv. Biol. 2021, 35, 921–932. [Google Scholar] [CrossRef] [PubMed]
  11. Phillips, G.A.C.; Ogier, E.; Dutton, I.; Barrett, N.; Krueck, N.C.; Hartmann, K. The ambiguous role of partially protected marine protected areas in Australia: Results from a systematic literature review. PLoS ONE 2025, 20, e0307324. [Google Scholar] [CrossRef] [PubMed]
  12. Di Lorenzo, M.; Claudet, J.; Guidetti, P. Spillover from marine protected areas to adjacent fisheries has an ecological and a fishery component. J. Nat. Conserv. 2016, 32, 62–66. [Google Scholar] [CrossRef]
  13. Angulo-Valdés, J.A.; Hatcher, B.G. A new typology of benefits derived from marine protected areas. Mar. Policy 2010, 34, 635–644. [Google Scholar] [CrossRef]
  14. Pascoe, S.; Coglan, L.; Roos, M.; Cannard, T.; Scheufele, G.; Doshi, A.; Haro, I. Fisheries’ Economic Impacts from the Rezoning of the Multi-Use Moreton Bay Marine Park. Fishes 2025, 10, 192. [Google Scholar] [CrossRef]
  15. Erm, P.; Balmford, A.; Holden, M.H. The biodiversity benefits of marine protected areas in well-regulated fisheries. Biol. Conserv. 2023, 284, 110049. [Google Scholar] [CrossRef]
  16. Rees, S.E.; Ashley, M.; Evans, L.; Mangi, S.; Sheehan, E.V.; Mullier, T.; Rees, A.; Attrill, M.J. An evaluation of the social and economic impact of a Marine Protected Area on commercial fisheries. Fish. Res. 2021, 235, 105819. [Google Scholar] [CrossRef]
  17. Perea-Muñoz, J.M.; Miles, A.; Bayle-Sempere, J.T. Sharing goals by timely communication improves fishermen’s satisfaction with marine protected areas: A case study in the Mediterranean. Ambio 2022, 51, 1520–1534. [Google Scholar] [CrossRef] [PubMed]
  18. Jones, P. Governing Marine Protected Areas: Resilience Through Diversity; Routledge: Abingdon-on-Thames, UK, 2014. [Google Scholar]
  19. Jones, P.J.S. Marine protected area strategies: Issues, divergences and the search for middle ground. Rev. Fish Biol. Fish. 2002, 11, 197–216. [Google Scholar] [CrossRef]
  20. Jentoft, S.; Chuenpagdee, R.; Pascual-Fernandez, J.J. What are MPAs for: On goal formation and displacement. Ocean Coast. Manag. 2011, 54, 75–83. [Google Scholar] [CrossRef]
  21. Brooks, K.; Barclay, K.; Grafton, R.Q.; Gollan, N. Transforming coastal and marine management: Deliberative democracy and integrated management in New South Wales, Australia. Mar. Policy 2022, 139, 104053. [Google Scholar] [CrossRef]
  22. Li, Y.; Yin, J.; Sun, M.; Kleisner, K.; Litsinger, E.; Jud, S.; Tang, Y.; Chen, Y. Examining the discrepancy and synergy between marine protected areas and fisheries management in the Bohai Sea, China. Ocean Coast. Manag. 2024, 258, 107409. [Google Scholar] [CrossRef]
  23. Rice, J.; Moksness, E.; Attwood, C.; Brown, S.K.; Dahle, G.; Gjerde, K.M.; Grefsrud, E.S.; Kenchington, R.; Ring Kleiven, A.; McConney, P.; et al. The role of MPAs in reconciling fisheries management with conservation of biological diversity. Ocean Coast. Manag. 2012, 69, 217–230. [Google Scholar] [CrossRef]
  24. Horta e Costa, B.; Guimarães, M.H.; Rangel, M.; Ressurreição, A.; Monteiro, P.; Oliveira, F.; Bentes, L.; Sales Henriques, N.; Sousa, I.; Alexandre, S.; et al. Co-design of a marine protected area zoning and the lessons learned from it. Front. Mar. Sci. 2022, 9, 969234. [Google Scholar] [CrossRef]
  25. De Santo, E.M. Assessing public “participation” in environmental decision-making: Lessons learned from the UK Marine Conservation Zone (MCZ) site selection process. Mar. Policy 2016, 64, 91–101. [Google Scholar] [CrossRef]
  26. Mangubhai, S.; Wilson, J.R.; Rumetna, L.; Maturbongs, Y.; Purwanto. Explicitly incorporating socioeconomic criteria and data into marine protected area zoning. Ocean Coast. Manag. 2015, 116, 523–529. [Google Scholar] [CrossRef]
  27. Rangel, M.; Horta e Costa, B.; Guimarães, M.H.; Ressurreição, A.; Monteiro, P.; Oliveira, F.; Bentes, L.; Sales Henriques, N.; Sousa, I.; Alexandre, S.; et al. Engaging and legitimizing communities: Co-designing a community-based Marine Protected Area. Mar. Policy 2025, 178, 106695. [Google Scholar] [CrossRef]
  28. Green, A.L.; Fernandes, L.; Almany, G.; Abesamis, R.; McLeod, E.; Aliño, P.M.; White, A.T.; Salm, R.; Tanzer, J.; Pressey, R.L. Designing Marine Reserves for Fisheries Management, Biodiversity Conservation, and Climate Change Adaptation. Coast. Manag. 2014, 42, 143–159. [Google Scholar] [CrossRef]
  29. Pascoe, S.; Farmery, A.; Nichols, R.; Lothian, S.; Azmi, K. A Modified Analytic Hierarchy Process Suitable for Online Survey Preference Elicitation. Algorithms 2024, 17, 245. [Google Scholar] [CrossRef]
  30. Brooks, K.; Schirmer, J.; Pascoe, S.; Triantafillos, L.; Jebreen, E.; Cannard, T.; Dichmont, C.M. Selecting and assessing social objectives for Australian fisheries management. Mar. Policy 2015, 53, 111–122. [Google Scholar] [CrossRef]
  31. Queensland Government. Moreton Bay Marine Park—Scientific Guiding Principles, The State of Queensland (Department of Environment, Science and Innovation). Available online: https://parks.desi.qld.gov.au/parks/moreton-bay/zoning/zoning-plan-history/the_science_behind_the_zoning_plan/moreton_bay_marine_park__scientific_guiding_principles#:~:text=The%20Socio-economic%20Guiding%20Principles,ensure%20efficient%20management%20and%20enforcement. (accessed on 19 October 2023).
  32. Parks Australia. Goals and Principles for the Establishment of the National Representative System of Marine Protected Areas in Commonwealth Waters. Available online: https://parksaustralia.gov.au/marine/management/resources/scientific-publications/goals-and-principles-establishment-national-representative-system-marine-protected-areas/ (accessed on 8 June 2026).
  33. Elkington, J. Cannibals with Forks: The Triple Bottom Line of 21st Century Business; New Society Publishers: Stony Creek, CT, USA, 1998. [Google Scholar]
  34. Saaty, T.L. The Analytic Hierarchy Process; McGraw-Hill: New York, NY, USA, 1980. [Google Scholar]
  35. Tversky, A.; Kahneman, D. Judgment under Uncertainty: Heuristics and Biases. Science 1974, 185, 1124–1131. [Google Scholar] [CrossRef] [PubMed]
  36. Yang, Z.; Zhang, Z.-K.; Zhou, T. Anchoring bias in online voting. Europhys. Lett. 2012, 100, 68002. [Google Scholar] [CrossRef]
  37. Casper, W.C.; Edwards, B.D.; Wallace, J.C.; Landis, R.S.; Fife, D.A. Selecting response anchors with equal intervals for summated rating scales. J. Appl. Psychol. 2020, 105, 390–409. [Google Scholar] [CrossRef] [PubMed]
  38. Crawford, G.; Williams, C. A note on the analysis of subjective judgment matrices. J. Math. Psychol. 1985, 29, 387–405. [Google Scholar] [CrossRef]
  39. Crawford, G.B. The geometric mean procedure for estimating the scale of a judgement matrix. Math. Model. 1987, 9, 327–334. [Google Scholar] [CrossRef]
  40. Saaty, T.L. Axiomatic Foundation of the Analytic Hierarchy Process. Manag. Sci. 1986, 32, 841–855. [Google Scholar] [CrossRef]
  41. Himes, A.H. Performance indicator importance in MPA management using a multi-criteria approach. Coast. Manag. 2007, 35, 601–618. [Google Scholar] [CrossRef]
  42. Zahir, S. Clusters in a group: Decision making in the vector space formulation of the analytic hierarchy process. Eur. J. Oper. Res. 1999, 112, 620–634. [Google Scholar] [CrossRef]
  43. Pendred, S.; Fischer, A.; Fischer, S. Improved Management Effectiveness of a Marine Protected Area through Prioritizing Performance Indicators. Coast. Manag. 2016, 44, 93–115. [Google Scholar] [CrossRef]
  44. Escobar, M.T.; Aguarón, J.; Moreno-Jiménez, J.M.; Turón, A. A Decision Support System for Improving the Inconsistency in AHP. Int. J. Decis. Support Syst. Technol. (IJDSST) 2023, 15, 1–16. [Google Scholar] [CrossRef]
  45. Aguarón, J.; Moreno-Jiménez, J.M.A. The geometric consistency index: Approximated thresholds. Eur. J. Oper. Res. 2003, 147, 137–145. [Google Scholar] [CrossRef]
  46. Wu, M.-J.; Zhao, K.; Fils-Aime, F. Response rates of online surveys in published research: A meta-analysis. Comput. Hum. Behav. Rep. 2022, 7, 100206. [Google Scholar] [CrossRef]
  47. DCCEEW. Achieving 30 by 30 on Land: National Roadmap for Protecting and Conserving 30% of Australia’s Land by 2030; Department of Climate Change, Energy, the Environment and Water: Canberra, Australia, 2024. [Google Scholar]
  48. Pascoe, S.; Doshi, A.; Dell, Q.; Tonks, M.; Kenyon, R. Economic value of recreational fishing in Moreton Bay and the potential impact of the marine park rezoning. Tour. Manag. 2014, 41, 53–63. [Google Scholar] [CrossRef]
  49. Rassweiler, A.; Costello, C.; Siegel, D.A. Marine protected areas and the value of spatially optimized fishery management. Proc. Natl. Acad. Sci. USA 2012, 109, 11884–11889. [Google Scholar] [CrossRef] [PubMed]
  50. Lynch, T.P. Incorporation of Recreational Fishing Effort into Design of Marine Protected Areas. Conserv. Biol. 2006, 20, 1466–1476. [Google Scholar] [CrossRef] [PubMed]
  51. Gaines, S.D.; White, C.; Carr, M.H.; Palumbi, S.R. Designing marine reserve networks for both conservation and fisheries management. Proc. Natl. Acad. Sci. USA 2010, 107, 18286–18293. [Google Scholar] [CrossRef] [PubMed]
  52. Jones, P.J.S. A review and analysis of the objectives of marine nature reserves. Ocean Coast. Manag. 1994, 24, 149–178. [Google Scholar] [CrossRef]
  53. World Bank. Scaling Up Marine Management—The Role of Marine Protected Areas; World Bank: Washington, DC, USA, 2006. [Google Scholar]
  54. Pascoe, S.; Cannard, T.; Dowling, N.A.; Dichmont, C.M.; Breen, S.; Roberts, T.; Pears, R.J.; Leigh, G.M. Developing Harvest Strategies to Achieve Ecological, Economic and Social Sustainability in Multi-Sector Fisheries. Sustainability 2019, 11, 644. [Google Scholar] [CrossRef]
  55. Pascoe, S.; Dichmont, C.M.; Brooks, K.; Pears, R.; Jebreen, E. Management objectives of Queensland fisheries: Putting the horse before the cart. Mar. Policy 2013, 37, 115–122. [Google Scholar] [CrossRef]
  56. Clarke, B.; Thurstan, R.; Yates, K. Stakeholder Perceptions of a Coastal Marine Protected Area. J. Coast. Res. 2016, 75, 622–626. [Google Scholar] [CrossRef]
  57. Heck, N.; Dearden, P.; McDonald, A. Stakeholder Evaluation Priorities for Demonstrating Marine Protected Area Effectiveness at the Pacific Rim National Park Reserve, Canada. Coast. Manag. 2012, 40, 55–72. [Google Scholar] [CrossRef]
  58. McNeill, A.; Clifton, J.; Harvey, E.S. Attitudes to a marine protected area are associated with perceived social impacts. Mar. Policy 2018, 94, 106–118. [Google Scholar] [CrossRef]
  59. Paredes, S.; Pascoe, S.; Coglan, L.; Richards, C. Increasing Local Fish Consumption: A Bayesian Belief Network Analysis. J. Int. Food Agribus. Mark. 2021, 33, 104–121. [Google Scholar] [CrossRef]
  60. Jones, P.J.S. Equity, justice and power issues raised by no-take marine protected area proposals. Mar. Policy 2009, 33, 759–765. [Google Scholar] [CrossRef]
  61. Mast, A.; Gill, D.; Ahmadia, G.N.; Darling, E.S.; Andradi-Brown, D.A.; Geldman, J.; Epstein, G.; MacNeil, M.A. Shared governance increases marine protected area effectiveness. PLoS ONE 2025, 20, e0315896. [Google Scholar] [CrossRef] [PubMed]
  62. Garlock, T.; Anderson, J.L.; Asche, F.; Smith, M.D.; Camp, E.; Chu, J.; Lorenzen, K.; Vannuccini, S. Global insights on managing fishery systems for the three pillars of sustainability. Fish Fish. 2022, 23, 899–909. [Google Scholar] [CrossRef]
  63. DCCEEW. Collaborative Australian Protected Areas Database 2024. 2026. Available online: https://www.dcceew.gov.au/environment/land/nrs/science/capad/2024#toc_4 (accessed on 25 April 2026).
  64. Jones, P.J.S.; Stafford, R.; Hesse, I.; Khuu, D.T. Incentive diversity is key to the more effective and equitable governance of marine protected areas. Front. Mar. Sci. 2024, 11, 1412654. [Google Scholar] [CrossRef]
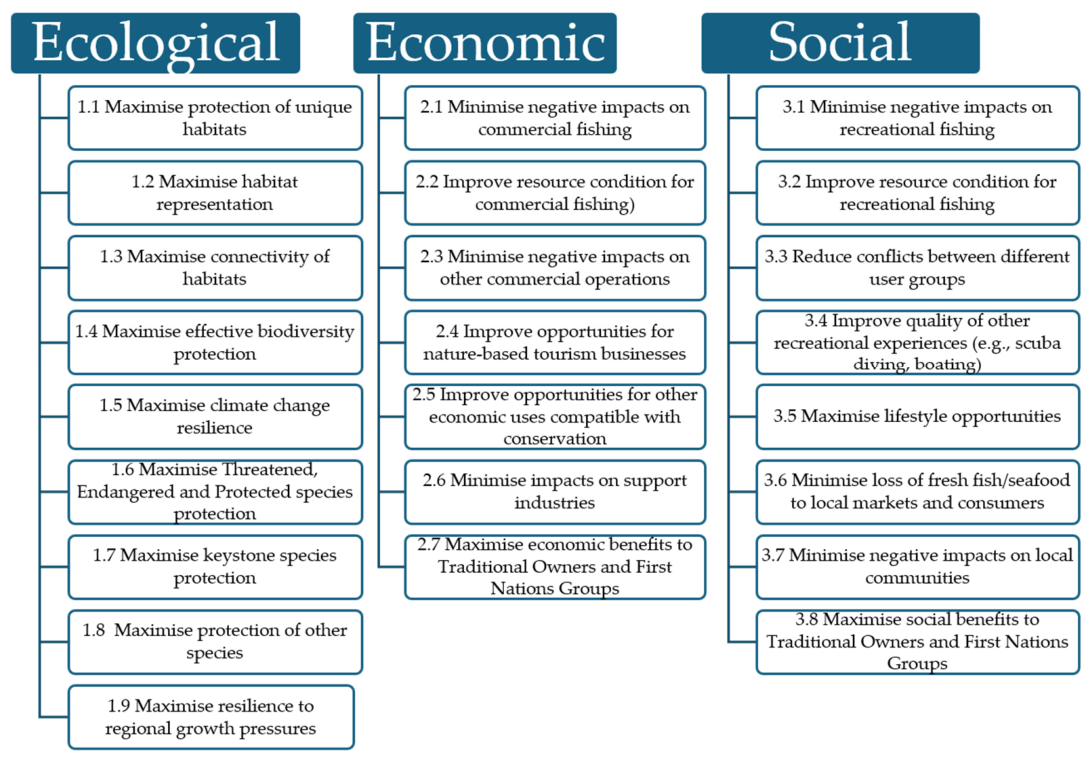
Figure 1. Ecological, economic and social objectives of marine protected areas. Adapted from Coglan, et al. [1]. Licenced under CC BY 4.0.
Sustainability 18 07035 g001
Figure 2. Distributions of high-level TBL objective weights for the two manager groups: (a) Ecological; (b) Economic; and (c) Social objectives.
Sustainability 18 07035 g002
Figure 3. Inconsistency measures for each objective set: (a) High-level objectives; (b) Ecological objectives; (c) Economic objectives; and (d) Social objectives.
Sustainability 18 07035 g003
Table 1. Response rates for the online survey.
GroupInvitationsResponses
(Complete)
Rejections (Automatic)Response Rate (%)
MPA managers4422252%
Fisheries managers6119836%
Total105411043%
Table 2. Overall relative importance weights for each sub-objective.
ObjectiveMPA ManagersFisheries ManagersProbability a
MeanStd ErrorMeanStd ErrorWilcoxon–Mann–Whitney Welch Two-Sample t-Test
Ecological0.5680.0280.5270.0320.4710.335
1.1Maximise protection of unique habitats0.0840.0120.0740.0100.7080.506
1.2Maximise habitat representation0.0760.0080.0580.0080.1210.119
1.3Maximise connectivity of habitats0.0600.0050.0500.0070.2270.277
1.4Maximise effective biodiversity protection0.0840.0070.0860.0120.7470.887
1.5Maximise climate change resilience0.0580.0060.0560.0100.4290.858
1.6Maximise Threatened, Endangered and Protected (TEP) species protection0.0580.0070.0650.0100.7270.550
1.7Maximise keystone species protection0.0580.0070.0510.0060.3310.416
1.8Maximise protection of other species0.0340.0050.0380.0060.5260.539
1.9Maximise resilience to regional growth pressures0.0560.0070.0490.0090.1980.498
Economic0.1950.0170.2590.0280.1220.056
2.1Minimise negative impacts on commercial fishing0.0250.0030.0600.0100.0040.002
2.2Improve resource condition for commercial fishing0.0260.0040.0550.0110.0450.027
2.3Minimise negative impacts on other commercial operations0.0200.0030.0190.0050.5430.905
2.4Improve opportunities for nature-based tourism businesses0.0350.0040.0330.0060.4440.767
2.5Improve opportunities for other economic uses0.0370.0050.0340.0040.9070.665
2.6Minimise impacts on support industries0.0140.0020.0210.0050.3710.205
2.7Maximise economic benefits to Traditional Owners and First Nations Groups0.0390.0050.0380.0070.5430.853
Social0.2370.0180.2140.0260.2440.472
3.1Minimise negative impacts on recreational fishing0.0220.0040.0220.0040.9900.998
3.2Improve resource condition for recreational fishing0.0270.0040.0370.0090.6320.349
3.3Reduce conflicts between different user groups0.0240.0030.0260.0050.6510.737
3.4Improve quality of other recreational experiences0.0340.0050.0240.0050.0730.133
3.5Maximise lifestyle opportunities0.0240.0040.0170.0040.1140.220
3.6Minimise loss of fresh fish/seafood to local markets and consumers0.0180.0030.0270.0050.1270.098
3.7Minimise negative impacts on local communities0.0350.0040.0260.0040.0920.114
3.8Maximise social benefits to Traditional Owners and First Nations Groups0.0530.0050.0370.0070.0240.065
a Green font indicates significance at 10% level; blue font indicates significance at 5% level. Adapted from Coglan, et al. [1]. Licenced under CC BY 4.0.
Table 3. Coherence within and across (pooled) MPA and fisheries managers’ objective weights.
Within GroupAcross Groups
MPA ManagersFisheries ManagersPooled
High level (TBL)0.976**0.960**0.944**
Ecological0.944**0.920*0.910*
Economic0.935**0.903*0.893-
Social0.937**0.897-0.719-
Notes: “**” strong (0.93–1.00); “*” good (0.90–0.93); “-“ weak (<0.90) [41].
Disclaimer/Publisher’s Note: The statements, opinions and data contained in all publications are solely those of the individual author(s) and contributor(s) and not of MDPI and/or the editor(s). MDPI and/or the editor(s) disclaim responsibility for any injury to people or property resulting from any ideas, methods, instructions or products referred to in the content.