1. Introduction
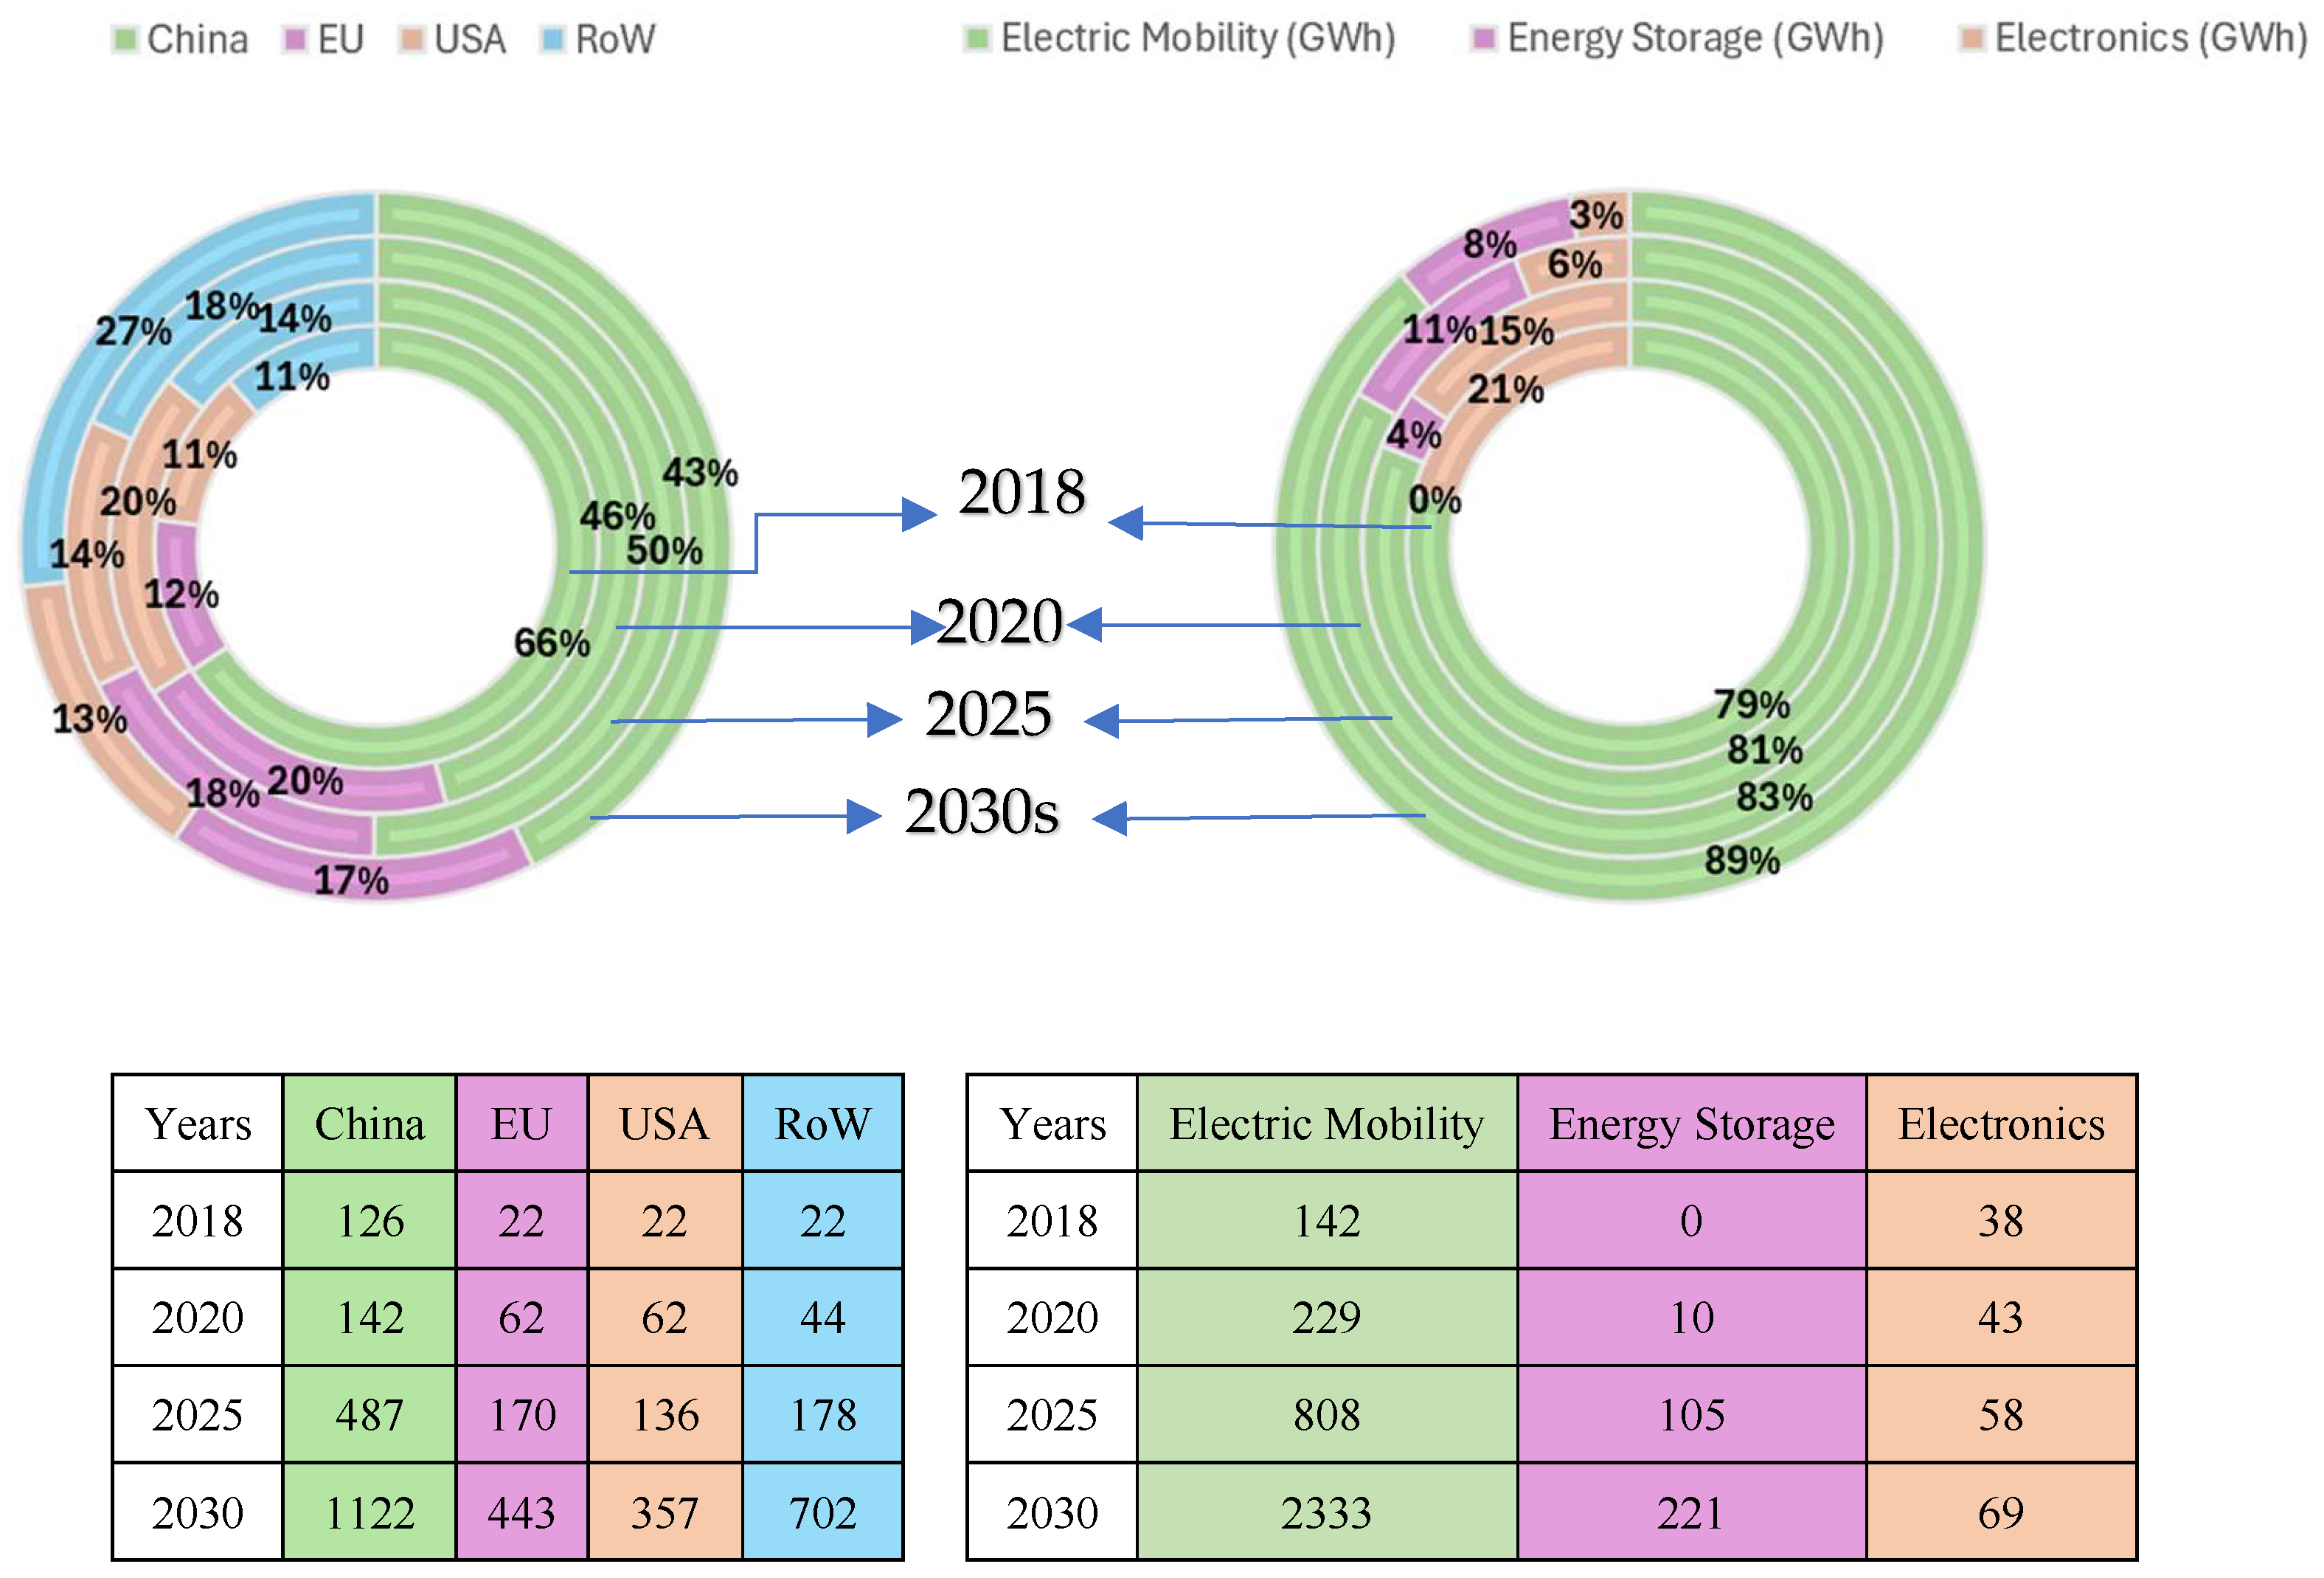
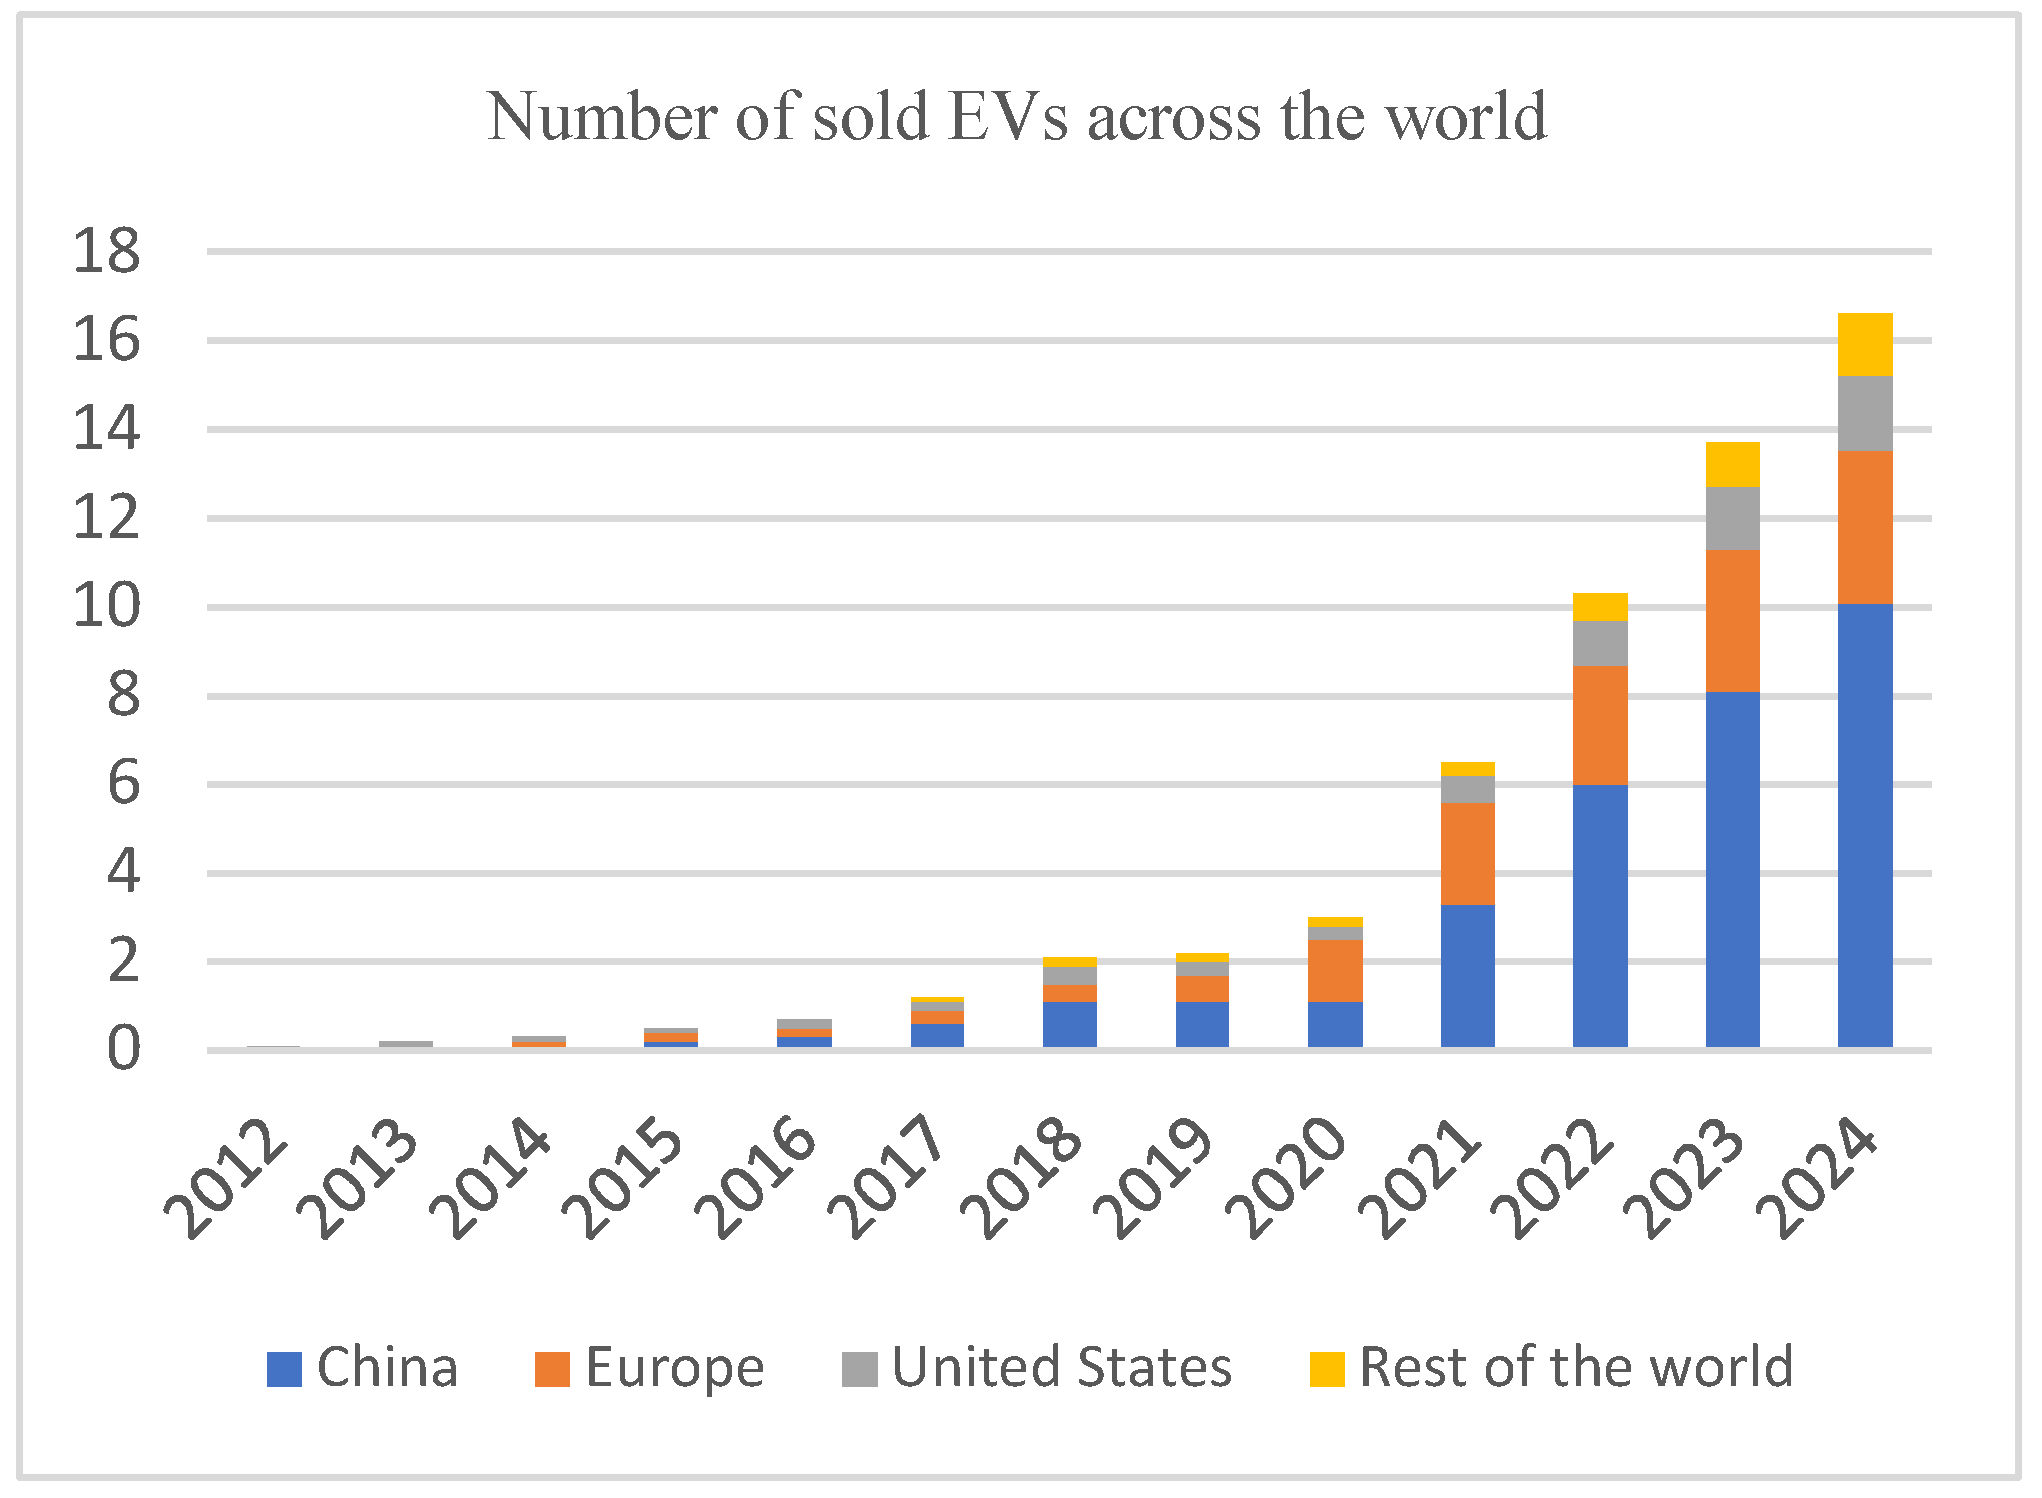
In recent years, there has been significant growth in battery technologies, driven largely by the rapid transition in the transportation sector from conventional internal combustion engines to EVs. This shift has had a notable impact on power flow distribution within national grids. As illustrated in
Figure 1, battery applications have increased substantially since 2018, with projections indicating an approximate 14-fold growth by 2030. Electric mobility is expected to account for approximately 89% of the total gigawatt hours (GWh) of battery demand, highlighting the central role of battery advancements in shaping the future of EVs. It is also important to note that a substantial share of global battery production currently takes place in China; however, this dominance is gradually declining as other countries increase their investments and capacities in battery manufacturing [
1]. Besides battery growth and electric mobility, smart city design represents the future of urban development, using technology and innovation to build a people-friendly environment and life, as shown in
Figure 1, where energy storage applications are mainly used. Smart infrastructure and sustainable energy are two of the most important features and keys to a smart city. In this context, EV charging infrastructure should be planned not only to satisfy transportation demand but also to support energy sustainability by coordinating charging with renewable generation, energy storage, and demand-side management. Such coordination can reduce peak demand, improve grid flexibility, and contribute to lower carbon emissions in future smart distribution networks. The large electrical energy flow of EVs has been presented in several previous studies, with the most common challenge being charging and discharging EVs. Interest in EV charging, which involves the grid-to-vehicle (G2V) process, is rapidly growing. On the other hand, the discharging process, vehicle-to-grid (V2G), is also recommended in order to present the optimum energy flow between EVs and the electrical grid.
The optimal planning on one side and the optimal operation on the other side of EVs in distribution networks are widely covered in the literature. The authors in [
2] presented an approach to mitigate the impact of increased EVs on the power grid; a case study was illustrated to explain the proposed strategy. In [
3], the authors performed a review of the literature on electric vehicle charging stations (EVCSs), addressing topics such as EVCS infrastructure, optimal location, and charging scheduling. Similarly, in [
4], the authors performed a comprehensive review of various EV charging optimization techniques. In [
5], the authors used genetic algorithms to identify the optimal EVCS placement to maximize profit, including the costs of installation, operation, and maintenance. Simulation results were introduced to verify the proposed approach. The authors in [
6] solved the optimization problem of finding the size and location of EVCSs for road networks, with the objective of minimizing the integrated cost of charging stations and consumers-related costs. The authors in [
7] proposed an optimization framework for optimal siting and sizing of EVCSs under load uncertainty and EV state of charge (SOC).
In [
8], the authors proposed a model that finds the optimal location of both EVCS and distributed energy generation (DER) systems in the same setup. EVCSs used the V2G function in the proposed model. The authors in [
9] proposed a globally optimal scheduling approach for EV charging and discharging, which was extended to be a local scheme. In [
10], the authors introduced an optimal charging strategy for EVs which utilizes the Markov Decision Process (MDP) to handle uncertainty of EV users’ behavior. In [
11], the authors proposed a method to determine the largest number of EVs that a distribution network can accommodate by using a Monte Carlo-based charging model and charging scheduling with both time-of-use (TOU) dispatch methods considered.
In [
12], the authors assessed the impact of increased EVs on distribution networks via a proposed bi-layer optimal scheduling model for EVs. The upper layer solves the dispatch plan using a load margin index based on the steady-state voltage security region, while the lower layer models each EV charging plan. In [
13], the authors proposed a coordinated EV charging scheme as two successive binary programs. The first design optimizes the aggregate load profile and the second design aims to optimize the on–off switching of all the EVs’ charging profiles. In [
14], particle swarm optimization was used to find the optimal location of the EV charging station. The MATLAB and OpenDSS simulation models were proposed to validate the idea. The case study of the National University of Sciences and Technology (NUST) Pakistan was used, where the cost was reduced from 3.55 million to 1.99 million, and daily loss from 787 kWh to 286 kWh. In the second residential feeder scenario, the results improved from
$2.52 to
$0.81 million for costs, and from 2167 kWh to 398 kWh for daily loss.
In [
15], the authors presented a Voronoi diagram model of the charging stations and distribution network to optimize the multi-objective of power flow and voltage stability. The system solved the design using an adaptive differential evolution optimization algorithm, where the case study was applied to the IEEE 33-bus system.
This paper extends and complements the existing body of literature in the field. Given that EVs rely on large-capacity battery systems deployed in significant numbers, research into efficient charging infrastructure has become increasingly essential. In this study, we propose an approach that simultaneously optimizes the size and the location of EV charging stations. This problem is formulated as a multi-objective optimization task solved using a genetic algorithm (GA). The authors in [
16] introduced an integrated approach for co-optimizing electric truck scheduling and microgrid management in freight logistics. The system uses a feedback loop where a microgrid control algorithm adapts to the constraints (e.g., arrival times, energy needs) provided by a heavy-duty truck route scheduler. The truck scheduling algorithm iteratively learns to charge during low-cost time-of-use (TOU) periods or when renewable energy is available. In [
17], the authors investigated the optimal sizing and siting of multi-type EVCSs (varying charging rates) in a real distribution system in Turkey. Using a mixed-integer linear programming (MILP) framework, the study aimed to minimize the total number of stations required to meet EV owners’ needs while adhering to system constraints and using linear approximations of branch losses. Ye and Ma in [
18] explored the multi-objective joint optimization of production scheduling and preventive maintenance planning within a flexible job-shop environment. Their model aimed to balance the conflicting goals of the production department (minimizing completion time) and the maintenance department (minimizing costs). Solved using a double-coded genetic algorithm, the study compared joint decision-making against traditional independent departmental planning. In [
19], the authors presented a bi-level optimization model for siting and sizing EV fast-charging stations (FCS) that explicitly takes into consideration the economic interaction between private investors and the distribution system operator (DSO). Their sensitivity analysis indicated that higher electricity prices charged to EV drivers lead to increased profitability and infrastructure expansion. In [
20], Zhou et al. developed a strategic-charging-behavior-aware model for the planning of fast-charging stations (FCS) within electrified transportation networks. Formulated as a bi-level mixed-integer programming problem, the model’s lower level uses a newly designed network equilibrium to predict how drivers react to a given FCS layout, while the upper level makes location and sizing decisions to minimize traffic time and investment costs. The authors in [
21] proposed a bi-level planning and operation framework for electric vehicle charging stations (EVCSs) to address peak load shaving and congestion in low-voltage distribution networks. The planning level identifies optimal EVCS locations to minimize voltage deviations and network losses using a particle swarm optimization (PSO) algorithm. In [
7], the authors proposed a robust optimization model (ROM) combined with a scenario-based methodology for the optimal sizing and siting of EVCSs in distribution networks under uncertainty. The model addresses uncertainties in electricity load and EV state of charge (SOC) by offering risk-averse, risk-neutral, and risk-seeking strategies. Results showed that ROM helps operators make stable decisions that capture the consequences of load fluctuations. Li and Li in [
22] established a bi-level planning model for distribution networks that integrates distributed wind turbines, photovoltaics, and energy storage systems (ESS). The model was solved using a mixed-integer particle swarm optimization (MIPSO) algorithm to determine the best locations and capacities for equipment. Simulations revealed that the combined integration of renewables and ESS significantly reduced annual costs, voltage deviations, and network losses.
In this paper, we propose combining this framework with the optimal scheduling of EV charging, considering the national grid, daily load flow, and tariffs. Furthermore, by examining the effects of station size and placement decisions on grid operation and charging schedules, this study addresses critical gaps in prior research. The application of GA-based optimization not only complements earlier optimization techniques but also offers practical insights for developers and policymakers to carefully study their designs. The outcomes have direct implications for national grid performance and consumer experience, thereby underscoring the significance of the proposed research direction [
14].
The main contributions of this paper can be summarized as follows: First, a framework is introduced that incorporates two steps: the first step utilizes a multi-objective GA to find the optimal location and size for EV charging stations at a given distribution system, while the second step solves an optimization problem to determine the optimal charge and discharge schedules of EVs for the stations selected in the first step. The framework examines the IEEE 33-bus and IEEE 123-bus distribution systems as test networks. The design and policy context specific to Jordan’s energy sector are incorporated, and the actual daily load curve for Jordan is analyzed and integrated into the study. Subsequently, a MATLAB-based simulation framework is developed, in which the test systems are coupled with a GA to optimize the proposed design under the defined case study conditions.
A case study is introduced to simultaneously address multiple objectives: minimizing power losses, enhancing the voltage stability of the distribution grid, and determining the optimal sizing and siting of EV charging stations. Importantly, this analysis explicitly accounts for the daily load profile characteristic of Jordan, providing practical insights relevant to real-world implementation.
The rest of the paper is structured as follows:
Section 2 outlines the growth in EV adoption and the evolving charging infrastructure.
Section 3 details the use of a GA to solve the optimization problem related to station size and location.
Section 4 develops and implements an optimal charging schedule for the proposed system.
Section 5 presents the simulation results used to validate and demonstrate the effectiveness of the proposed approach. Finally,
Section 6 draws the conclusion.
3. Optimal Location and Size of EV Charging Station Using GA
Distribution system operators (DSOs), if not sufficiently prepared for the large increase in EV adoption in the transportation sector, may suffer from significant drawbacks on the distribution networks, such as voltage stability issues, sudden overloads on lines that may cause tripping, and large operation and maintenance costs due to the overloading of equipment. DSOs can plan to curtail the impact of such an increase. Many strategies have been suggested, such as planning for the optimal location, size, or charging cost curve of a given charging station. In this paper, we find the optimal size and location of a given distribution system, then we apply an optimal scheduling strategy based on cost curves that are determined by the DSO, and finally we validate the solution.
First, we formulate the optimization problem of finding the optimal size and location of an EV charging station, where the location is the set of all the buses in the network, excluding the swing bus, and the size ranges between the max and min values allowed for that system. The following optimization problem is performed:
where
denotes the three objective functions:
to reduce branch losses,
to reduce bus voltage deviations, and
to increase the installed EVCS power on all selected buses.
denotes the first decision variable, i.e., bus ID.
denotes the second decision variable, i.e., bus size.
is a constraint to exclude a set of buses from the objective function. In this paper, we excluded the slack bus and its immediate neighbors, since we want to place the EVCSs on remote buses from the supply substation and near load geographic centers.
is a constraint that ensures the uniqueness of the selected buses, so that the same bus is not selected twice.
and
are constraints related to voltage limits per bus
b;
is the set of all buses.
and
are set to 1.05 and 0.95 p.u., respectively. In case of preexisting violations, this value is redefined based on the difference
and
.
is a constraint related to the branches’ thermal limits, and
,
is the set of all branches in the system.
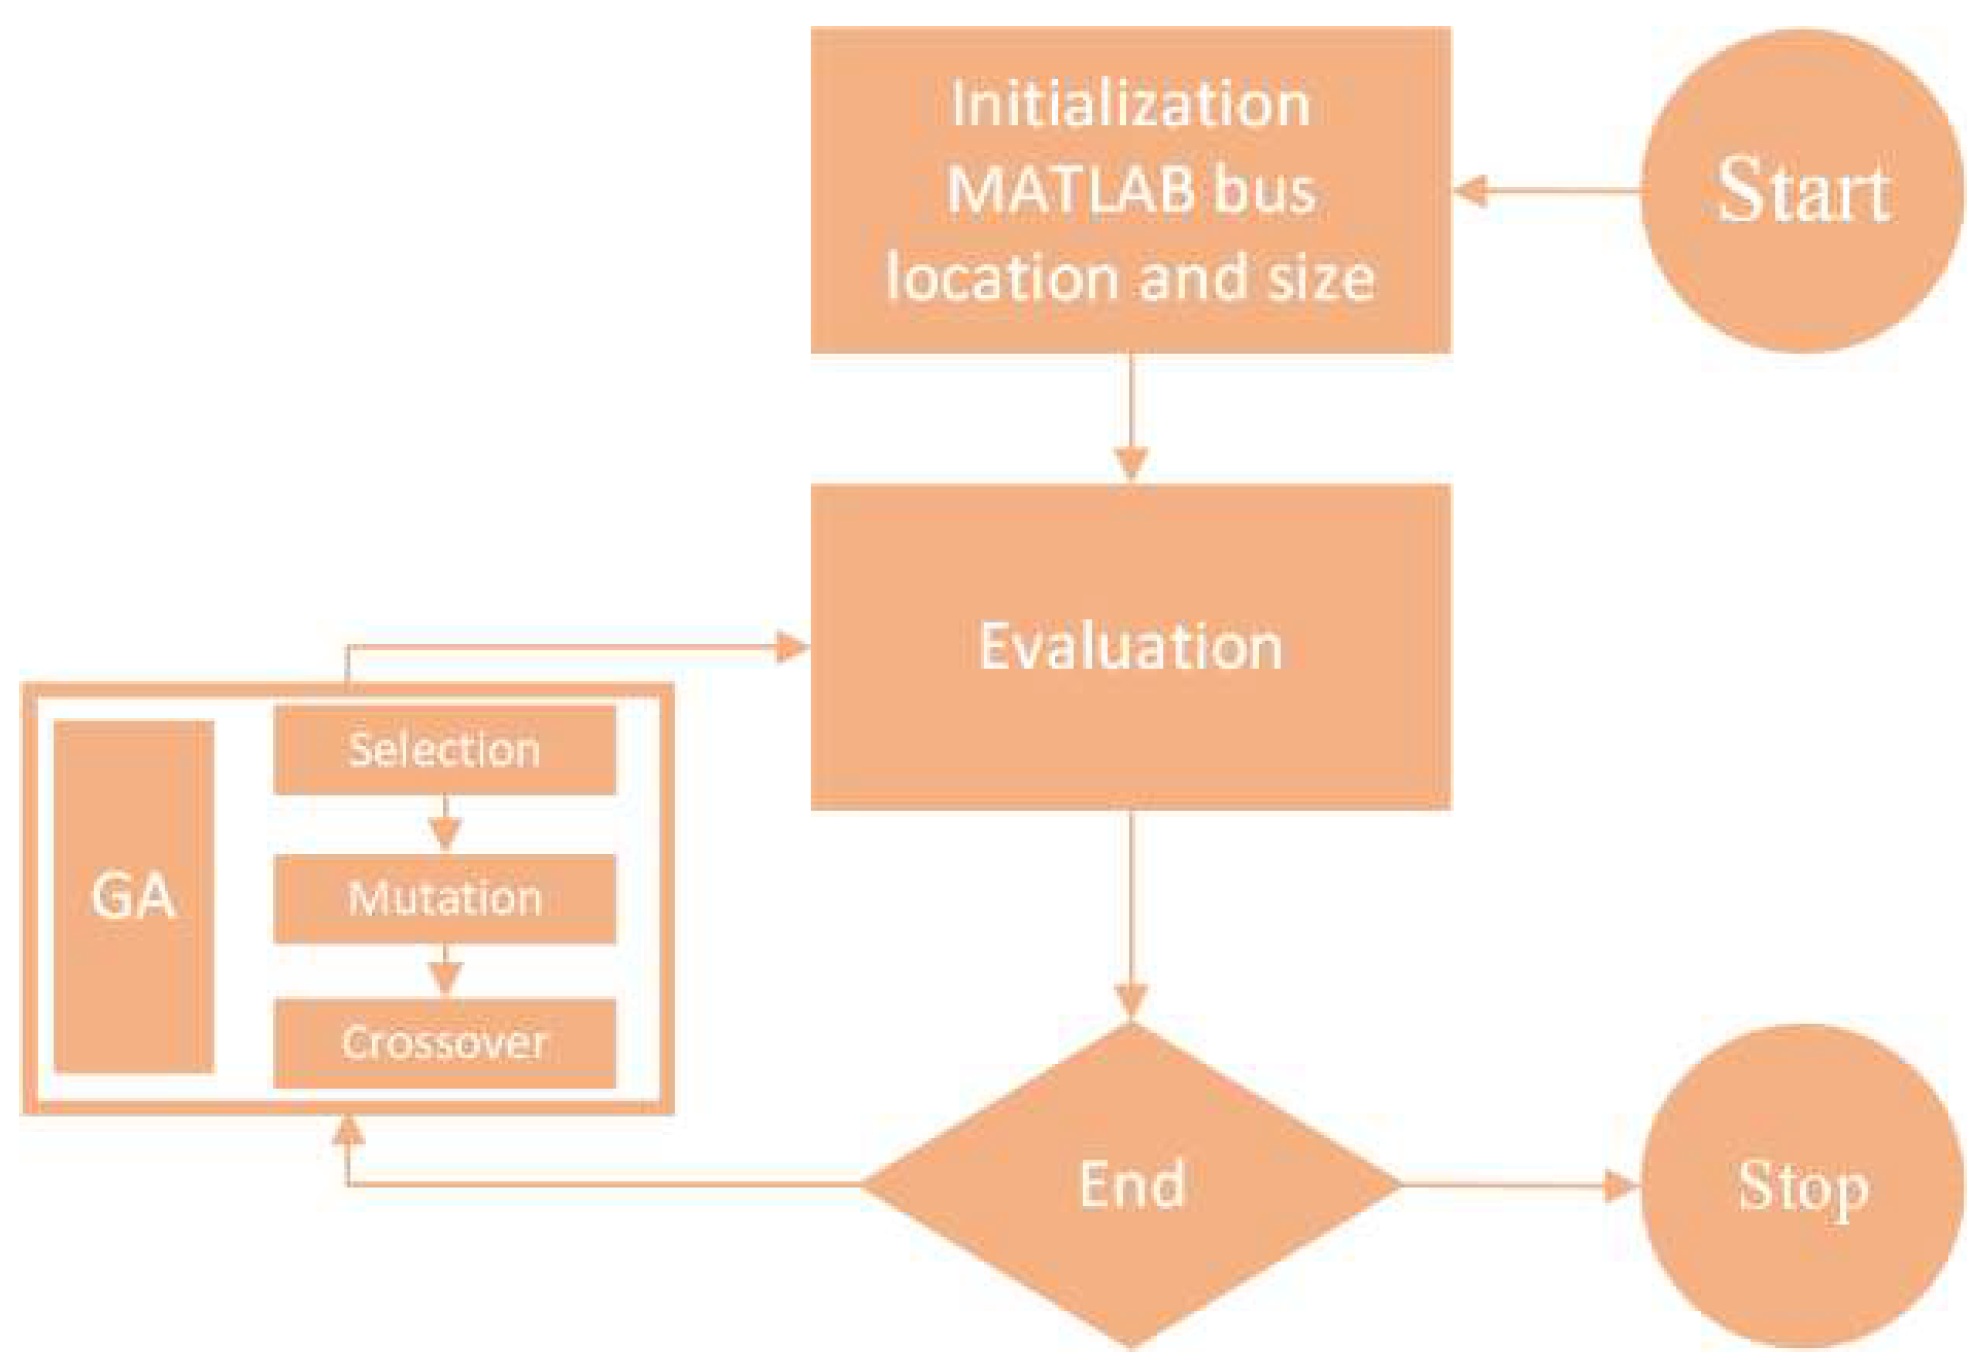
A GA is used to solve the problem; a multi-objective setting is used with one of the decision variables as a mixed integer and the other as the size. The GA flowchart is shown in
Figure 3.
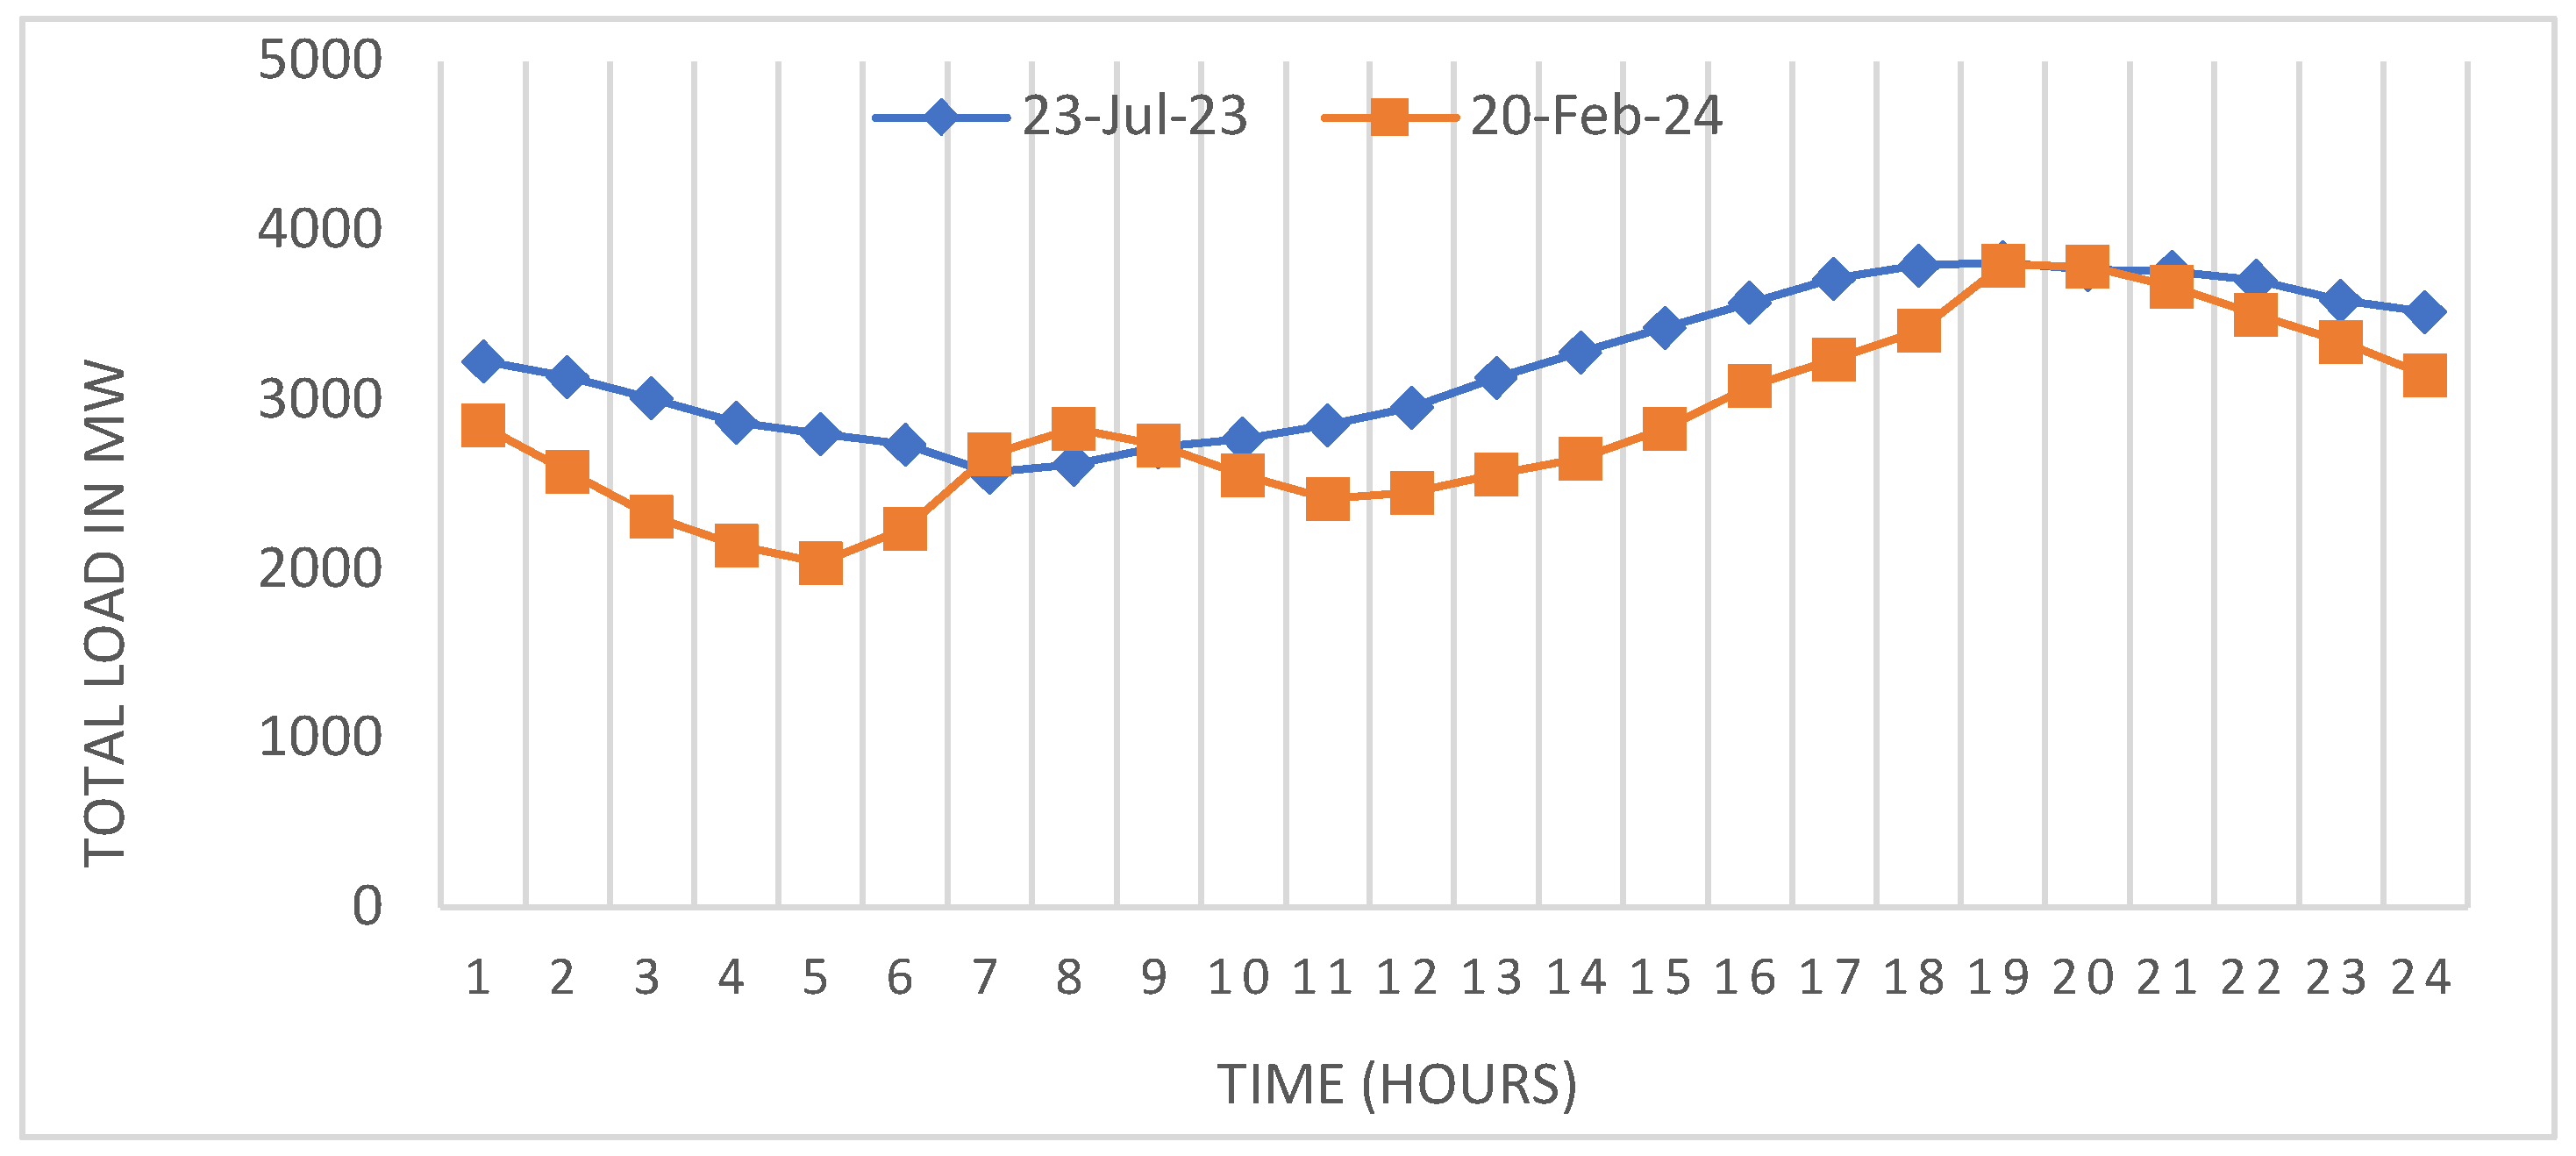
To conduct a realistic evaluation of a given optimal solution, the system’s uncertainties need to be considered. Three main uncertainties are considered in this paper: the variation in loads during the day, the change in tariffs for EV charging based on time of use (TOU), and the variations in the arrival and departure times of EVs to charging stations, along with the battery capacities of each EV. The variation in loads was considered based on Jordan’s daily load curve. Typical winter and summer daily load curves are shown in
Figure 4. Considering changes in load for the whole network is important since they affect the loading of lines and voltage profiles, including those at the selected charging-station bus.
4. Optimal Scheduling of Charging and Discharging
The framework in this paper is divided into two main steps. The first step concerns finding a given charging station’s optimal size and location, where a GA with multi-objective functions is used. Following the finding of the optimal location and size, the next step is to schedule the optimal charging schedule of the EVs at a given station. This step is important to avoid overloading the main transformer supplying the residential area, which may trigger overcurrent protection devices in the substation. Optimal scheduling is important to reduce charging costs and avoid charging during peak load hours, which may further contribute to overloading of lines and power transformers.
The objective function of the optimal scheduling used in this paper was chosen based on two modes: The first mode is related to fast charging with a rated power of 50 kW and was based on the electricity market in Jordan, which was adopted for EV charging stations [
25,
26]. The total cost is defined as the sum of charging costs over the interval set N. The second mode is for slow charging at the rated power of 7 kW, with a cost function that minimizes load concentration.
In this paper, we use a time-of-use (TOU) tariff aligned with Jordanian tariff policy for the objective function of the first mode; the parameters of the cost function are as follows [
25,
26].
Optimization is performed based on two modes: For Mode 1, the fast-charging mode, we apply TOU. In Mode 2, the slow-charging mode, we minimize the squared total load across all time slots. The following optimization problem is performed:
where the decision variable
denotes the power delivered or drawn from the EV
i during time slot
t.
denotes the maximum charging power.
denotes the charging-only EV set.
denotes the vehicle-to-grid (V2G) EV set, where there might be a set of EVs that are willing to discharge power to the grid; we set this set to 40% of the overall EVs for a given system.
denotes the EV set.
denotes a set of time slots.
denotes the charging power of the EV in interval
k for vehicle
i.
denotes the length of an interval.
denotes the initial energy of the EV
i.
denotes the usable battery capacity of vehicle
i,
(10% degradation reserve).
is the raw battery capacity of EV
i sampled from the EV information PMF.
denotes the element of the charging interval matrix
F defined by:
The total bus load .
In summary, the temporal boundary is based on a representative daily operating horizon that accounts for load variation, TOU tariff periods, and EV arrival/departure uncertainty. This choice allows the framework to capture the main daily operational interactions between EV charging demand and network constraints; however, it does not explicitly represent long-term seasonal variations or multi-year infrastructure expansion effects. After determining the optimal size and location for each system, we want to divide the newly installed capacity for each selected bus among the EVCSs. For each EVCS, we split the capacity between the fast- and slow-charging EVCS, with rated charging power at 50 kW and 7 kW, respectively. The split logic is based on the following four-step approach:
First, assuming an equal number of fast and slow chargers, so that their combined power does not exceed the optimal size for that bus, formally , which results in , and the power consumed by this base allocation is . The remaining unallocated power is , where is the optimal size determined by the first stage; is the fast-charging maximum power rate, which is 50 kW; is the slow-charging maximum power rate, which is 7 kW; is the number of fast-charging EVCSs; and is the number of slow-charging EVCSs.
The second step is to allocate the remaining power to at least one additional fast charger if possible.
After this step, the residual power satisfies the condition .
Third, if there is a reminder power, then it is packed into slow chargers.
After this step, the allocated power is .
For the fourth step, if the number of fast chargers is less than or equal to 2, convert those chargers to slow chargers, formally:
The fourth step is justified by not investing in fast-charging EVCS infrastructure for a small number of stations on a given bus.
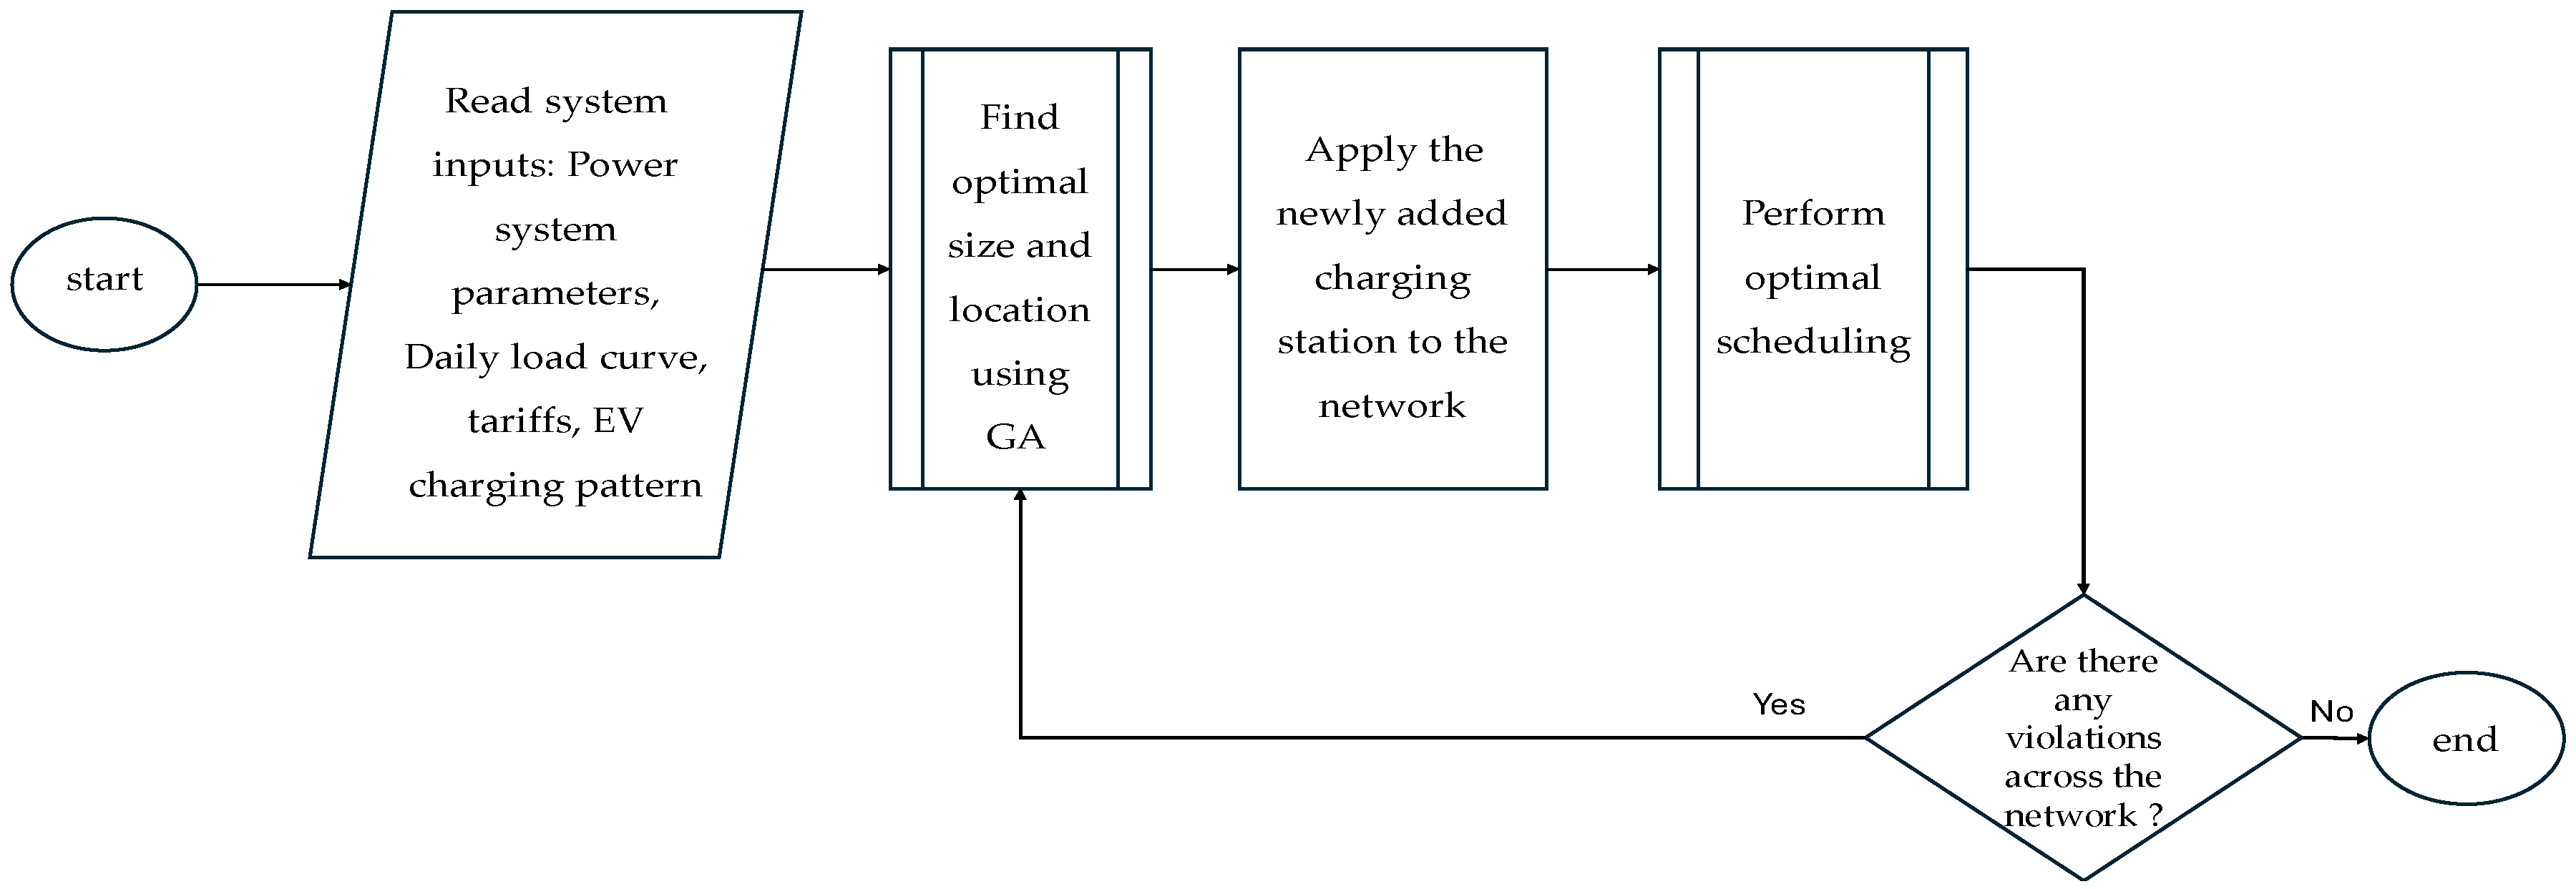
After combining the two frameworks introduced in this paper, the overall framework can be summarized using the flowchart shown in
Figure 5.
5. Simulation Results
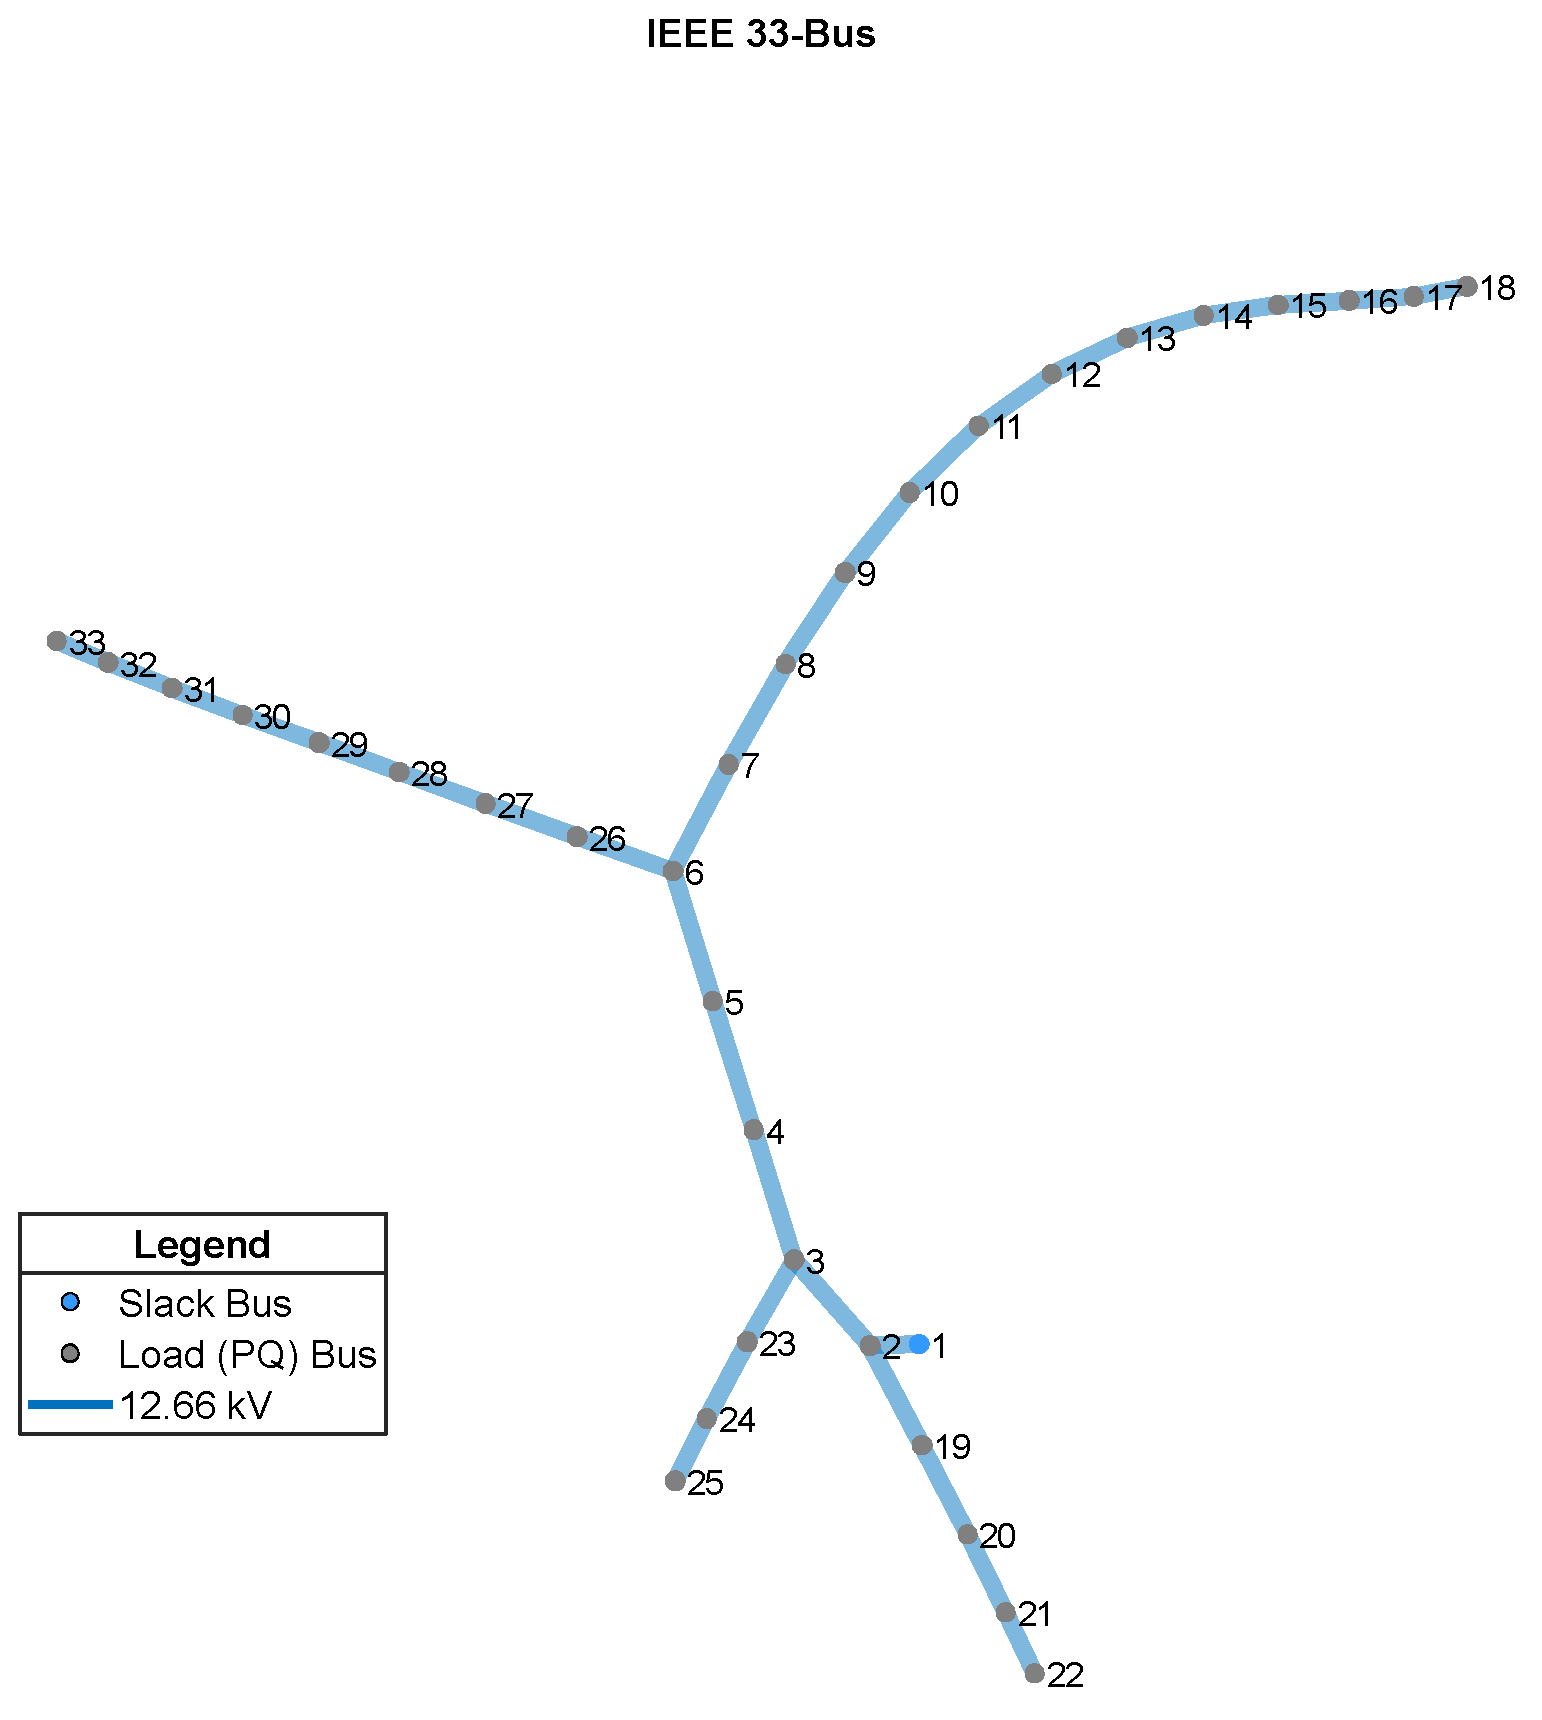
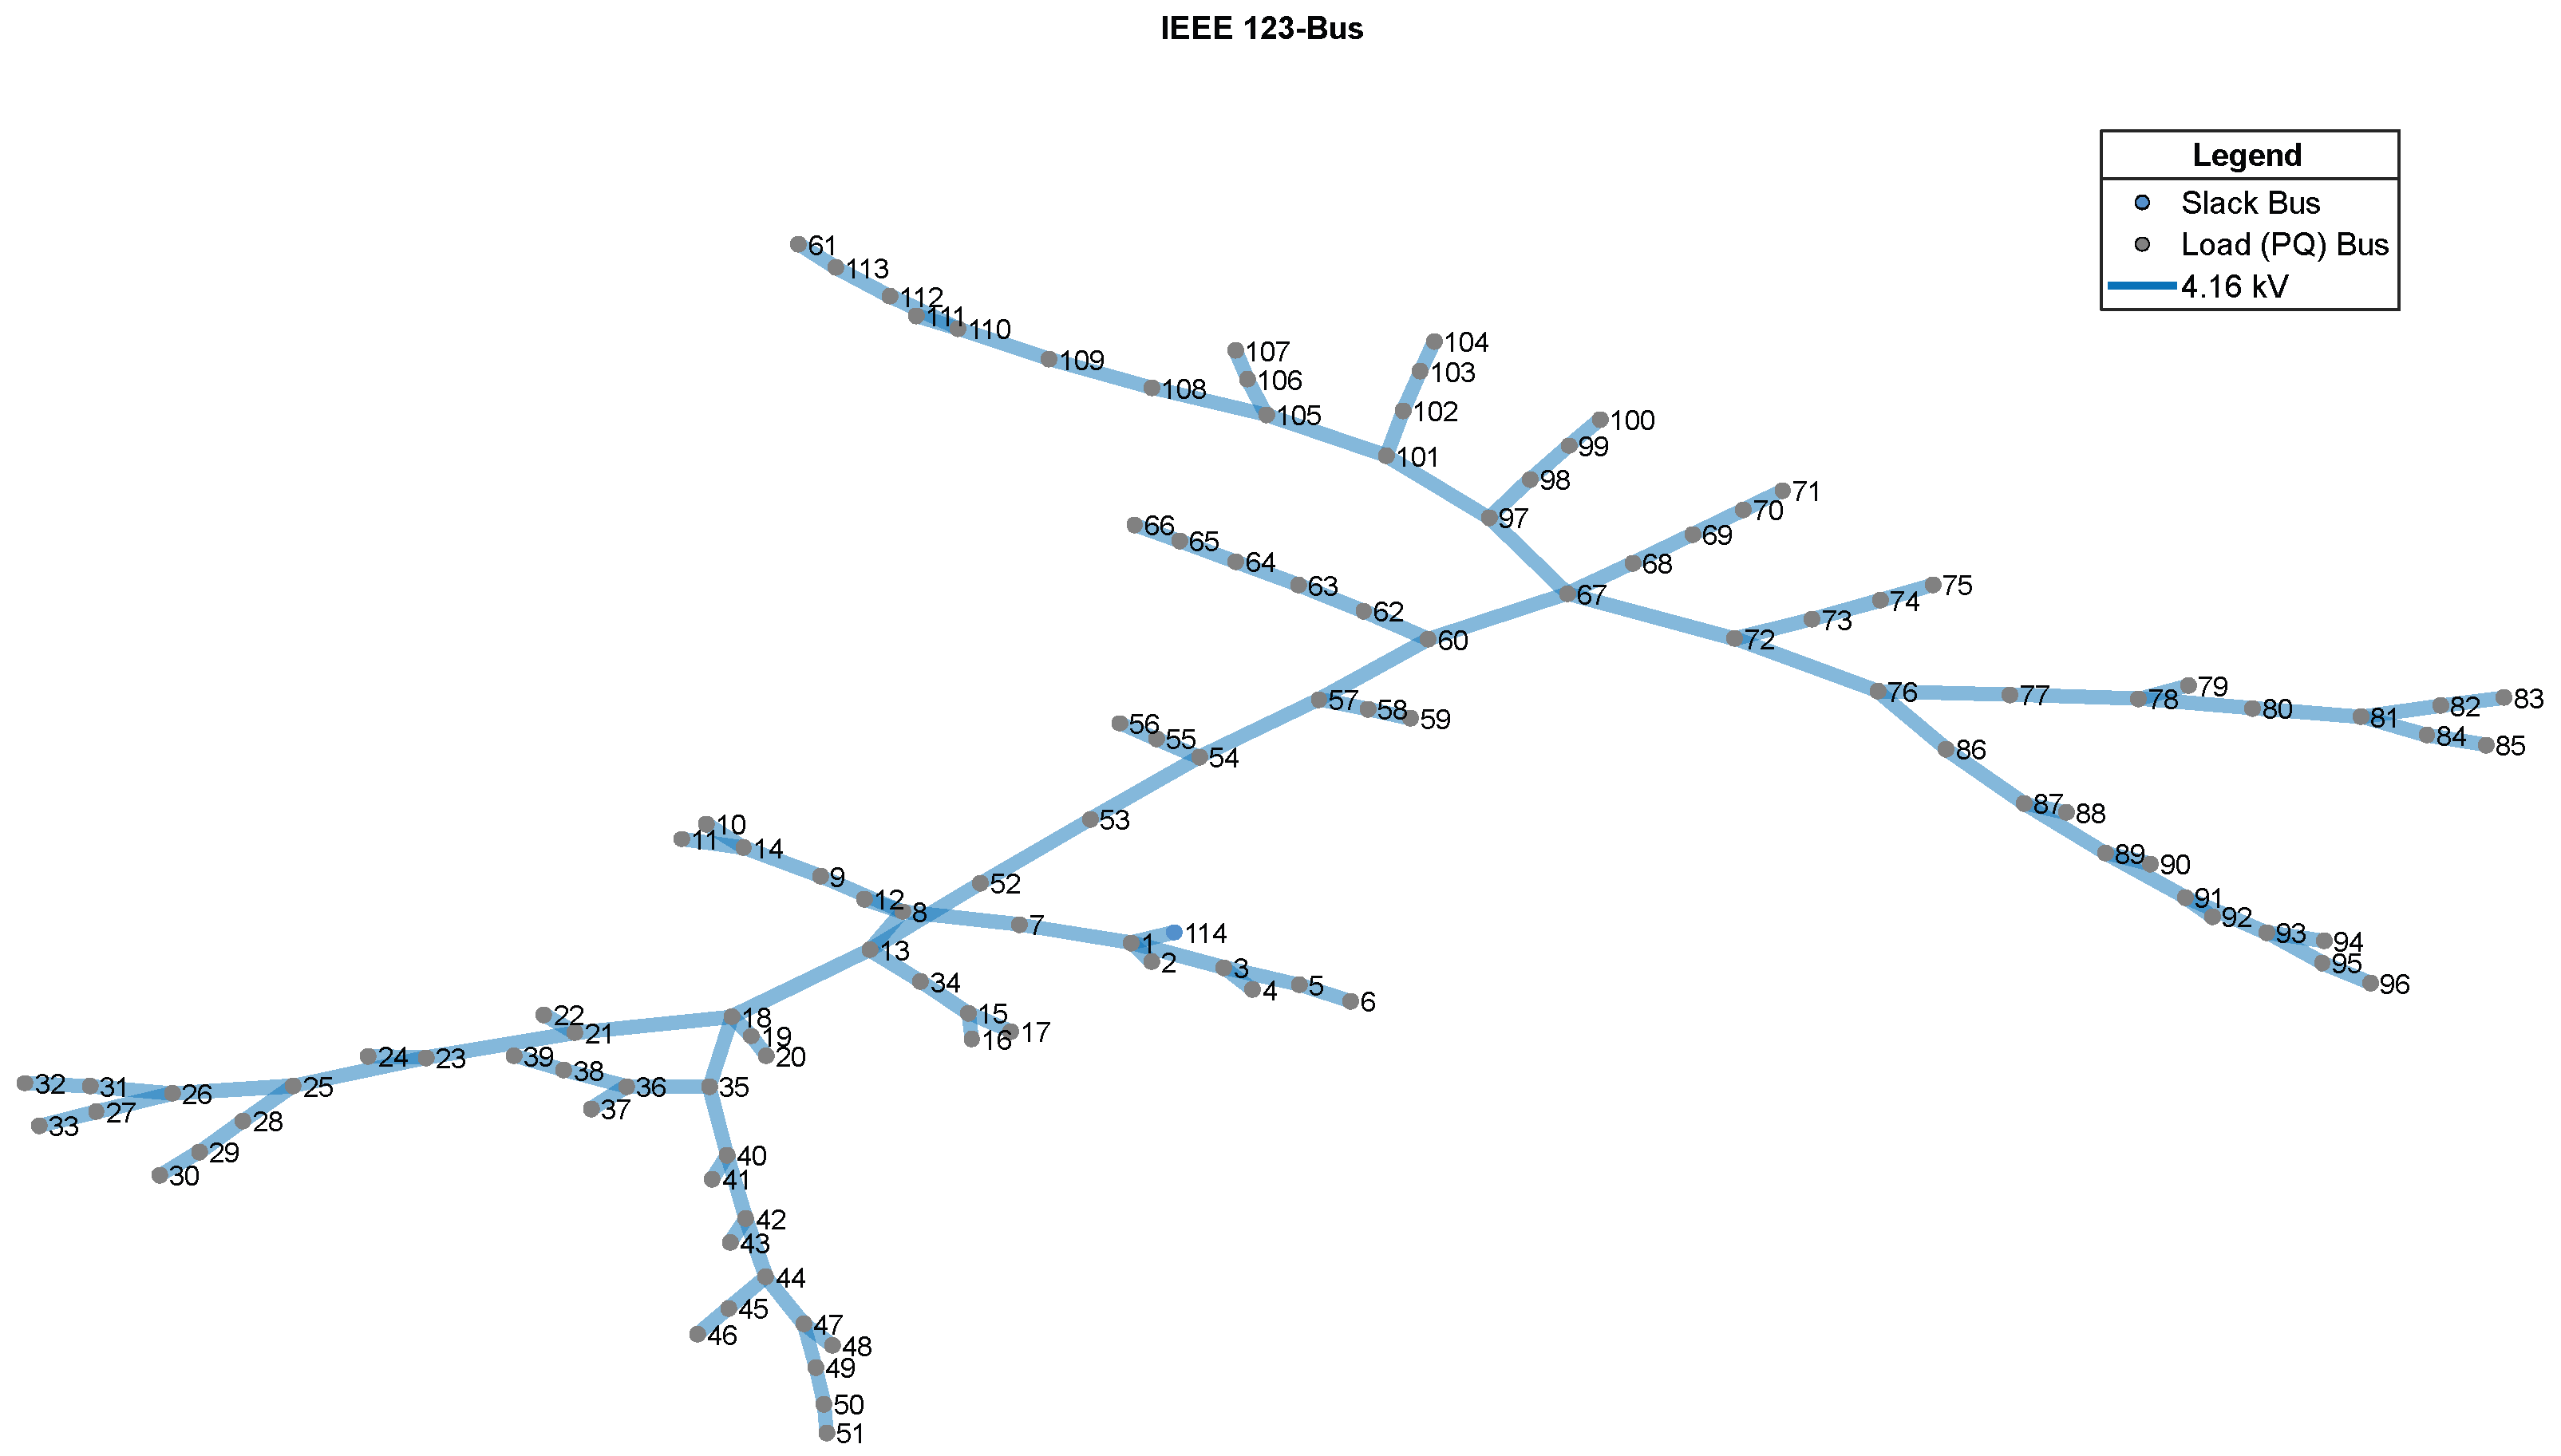
The two approaches explained in the previous sections were verified in a simulation setup using MATLAB. Two IEEE case studies were used in the simulations, namely the IEEE 33-bus and IEEE 123-bus systems, shown in
Figure 6 and
Figure 7, respectively. The work in [
27,
28] was used to obtain the data of the two case studies and verify the results. The two case studies are radial distribution networks. AC power flow was used in both stages to evaluate the results and obtain key performance metrics, including the daily load profile, bus voltage, and branch loading. These metrics are directly related to energy sustainability, as improved voltage profiles and reduced branch loading can support more efficient energy utilization and facilitate the accommodation of future low-carbon transportation demand. The adopted AC power flow formulation allows the network constraints to be represented more realistically than simplified linear approximations while still keeping the planning and scheduling framework computationally tractable. In this study, we assume balanced steady-state operation and do not explicitly capture fast electromagnetic transients, frequency dynamics, converter-level control dynamics, or short-term stability phenomena.
In this paper, two frameworks were used to plan and operate EV charging stations, which included planning the optimal size and location using a GA. Simulation studies were performed using the procedure described above using MATLAB (vR2024b) and MATPOWER (v8.1) [
29]. First, a GA was used based on the formulation in Equation (1) for the two case studies.
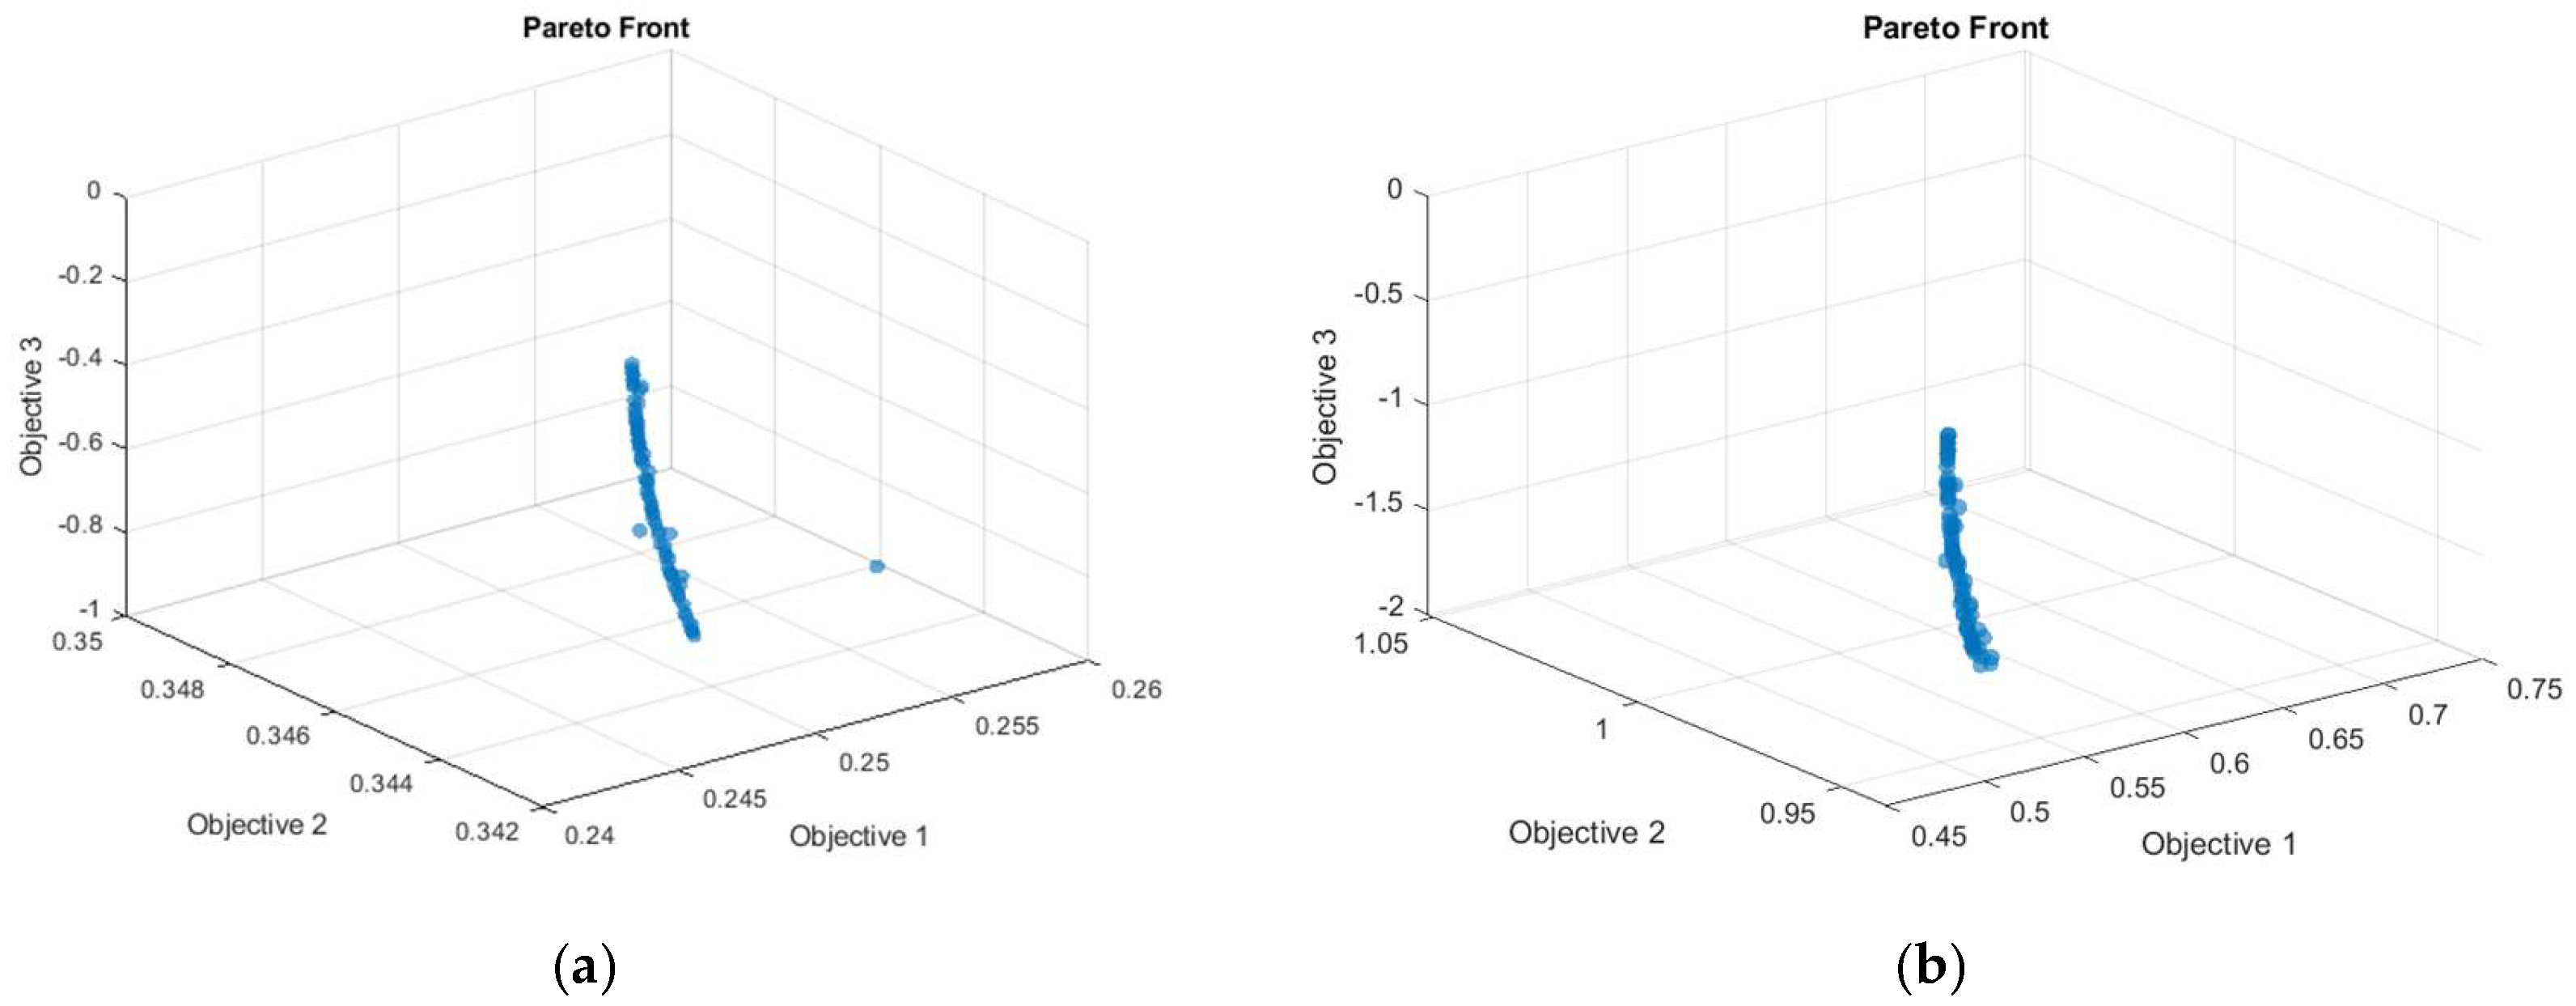
Figure 8 shows the Pareto front for the optimization problem. For the IEEE 33-bus system, the optimal sizes and locations are summarized in
Table 2. For the IEEE 123-bus system, the optimal sizes and locations are summarized in
Table 3.
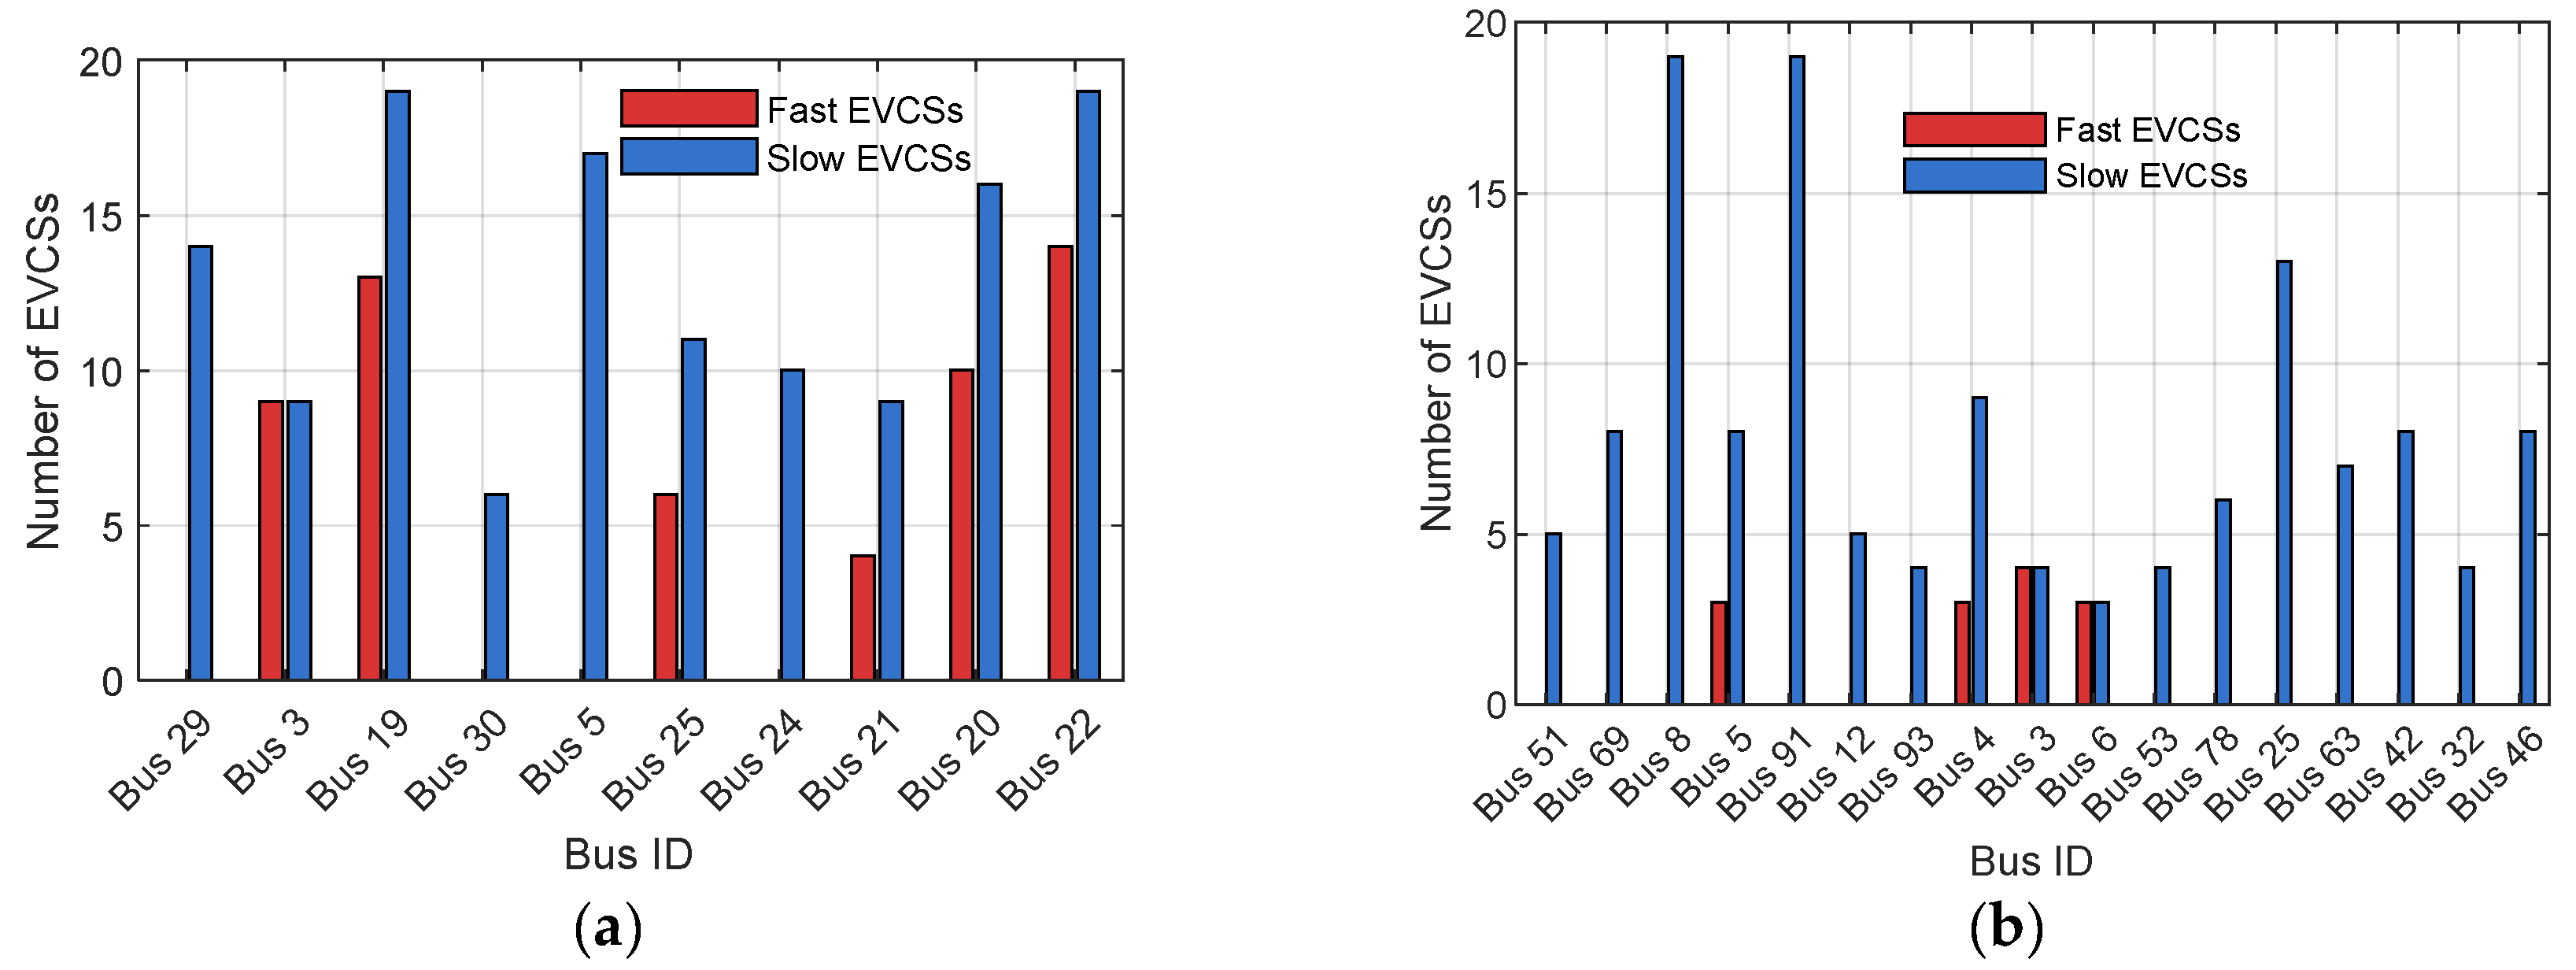
After determining the optimal location and size, it was desired to split. The four-step procedure described in the previous section was followed. The resulting split for the two systems is shown in
Figure 9, which shows the bus IDs and the number and type of each EVCS for each selected bus.
We compared the results obtained with other methods applied to the same IEEE 30-bus system.
Table 4 presents a comparison of optimal size and location, which shows comparable results. In the proposed approach, we favored slow chargers in the case of a low number of fast chargers, and we split the overall added power capacity across more buses in the system.
For the second step of the proposed framework, we applied the scheduling scheme to one of the optimal solutions that was solved using the GA in the previous section, namely, the solutions that are summarized in
Table 2 and
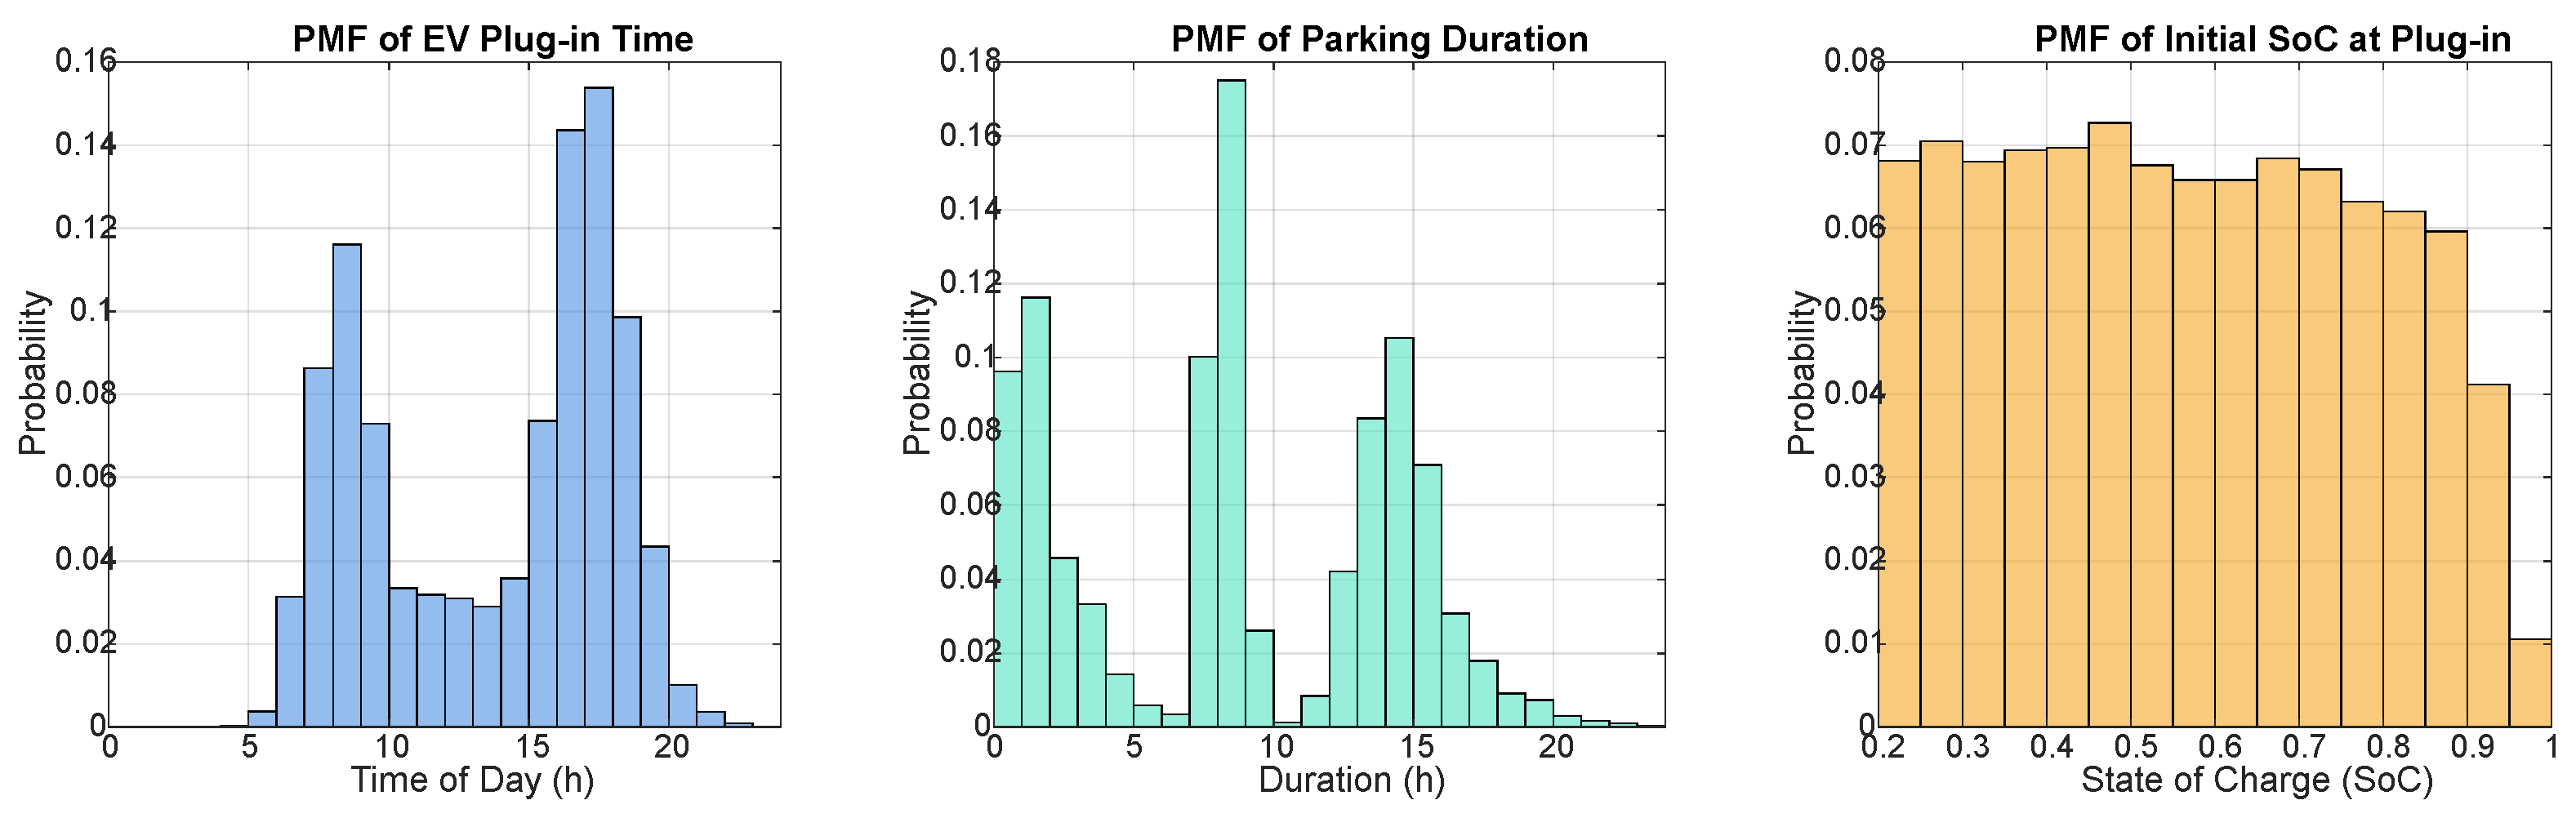
Table 3. An essential part of applying the scheduling algorithm is to determine three variables: the initial state of charge (SOC) at the moment of arrival; the arrival and departure times of the EVs; and the battery capacities of the EVs. This information was determined based on EV usage data along with the framework to determine probability mass functions (PMF) of the three mentioned variables from the work in [
31].
Table 5 shows the EV data used to generate the PMFs. The moment of arrival, the moment of departure, and the initial battery charge were generated randomly as shown in
Figure 10.
After determining the PMF of the three variables as shown in
Figure 10, and after determining the split between fast and slow-charging EVCSs for each bus in the given system, we apply the scheduling algorithm formulated in Equation (3). We used a daily load curve applied at load buses to account for load variations. Since the available load data had an hourly resolution and the scheduling and simulation framework required 15 min time steps, interpolation was used to estimate intermediate load values between consecutive hourly data points. This procedure allowed the load profile to be represented at the required temporal resolution while preserving the overall daily load trend. We started by applying the scheduling scheme to the IEEE 33-bus system.
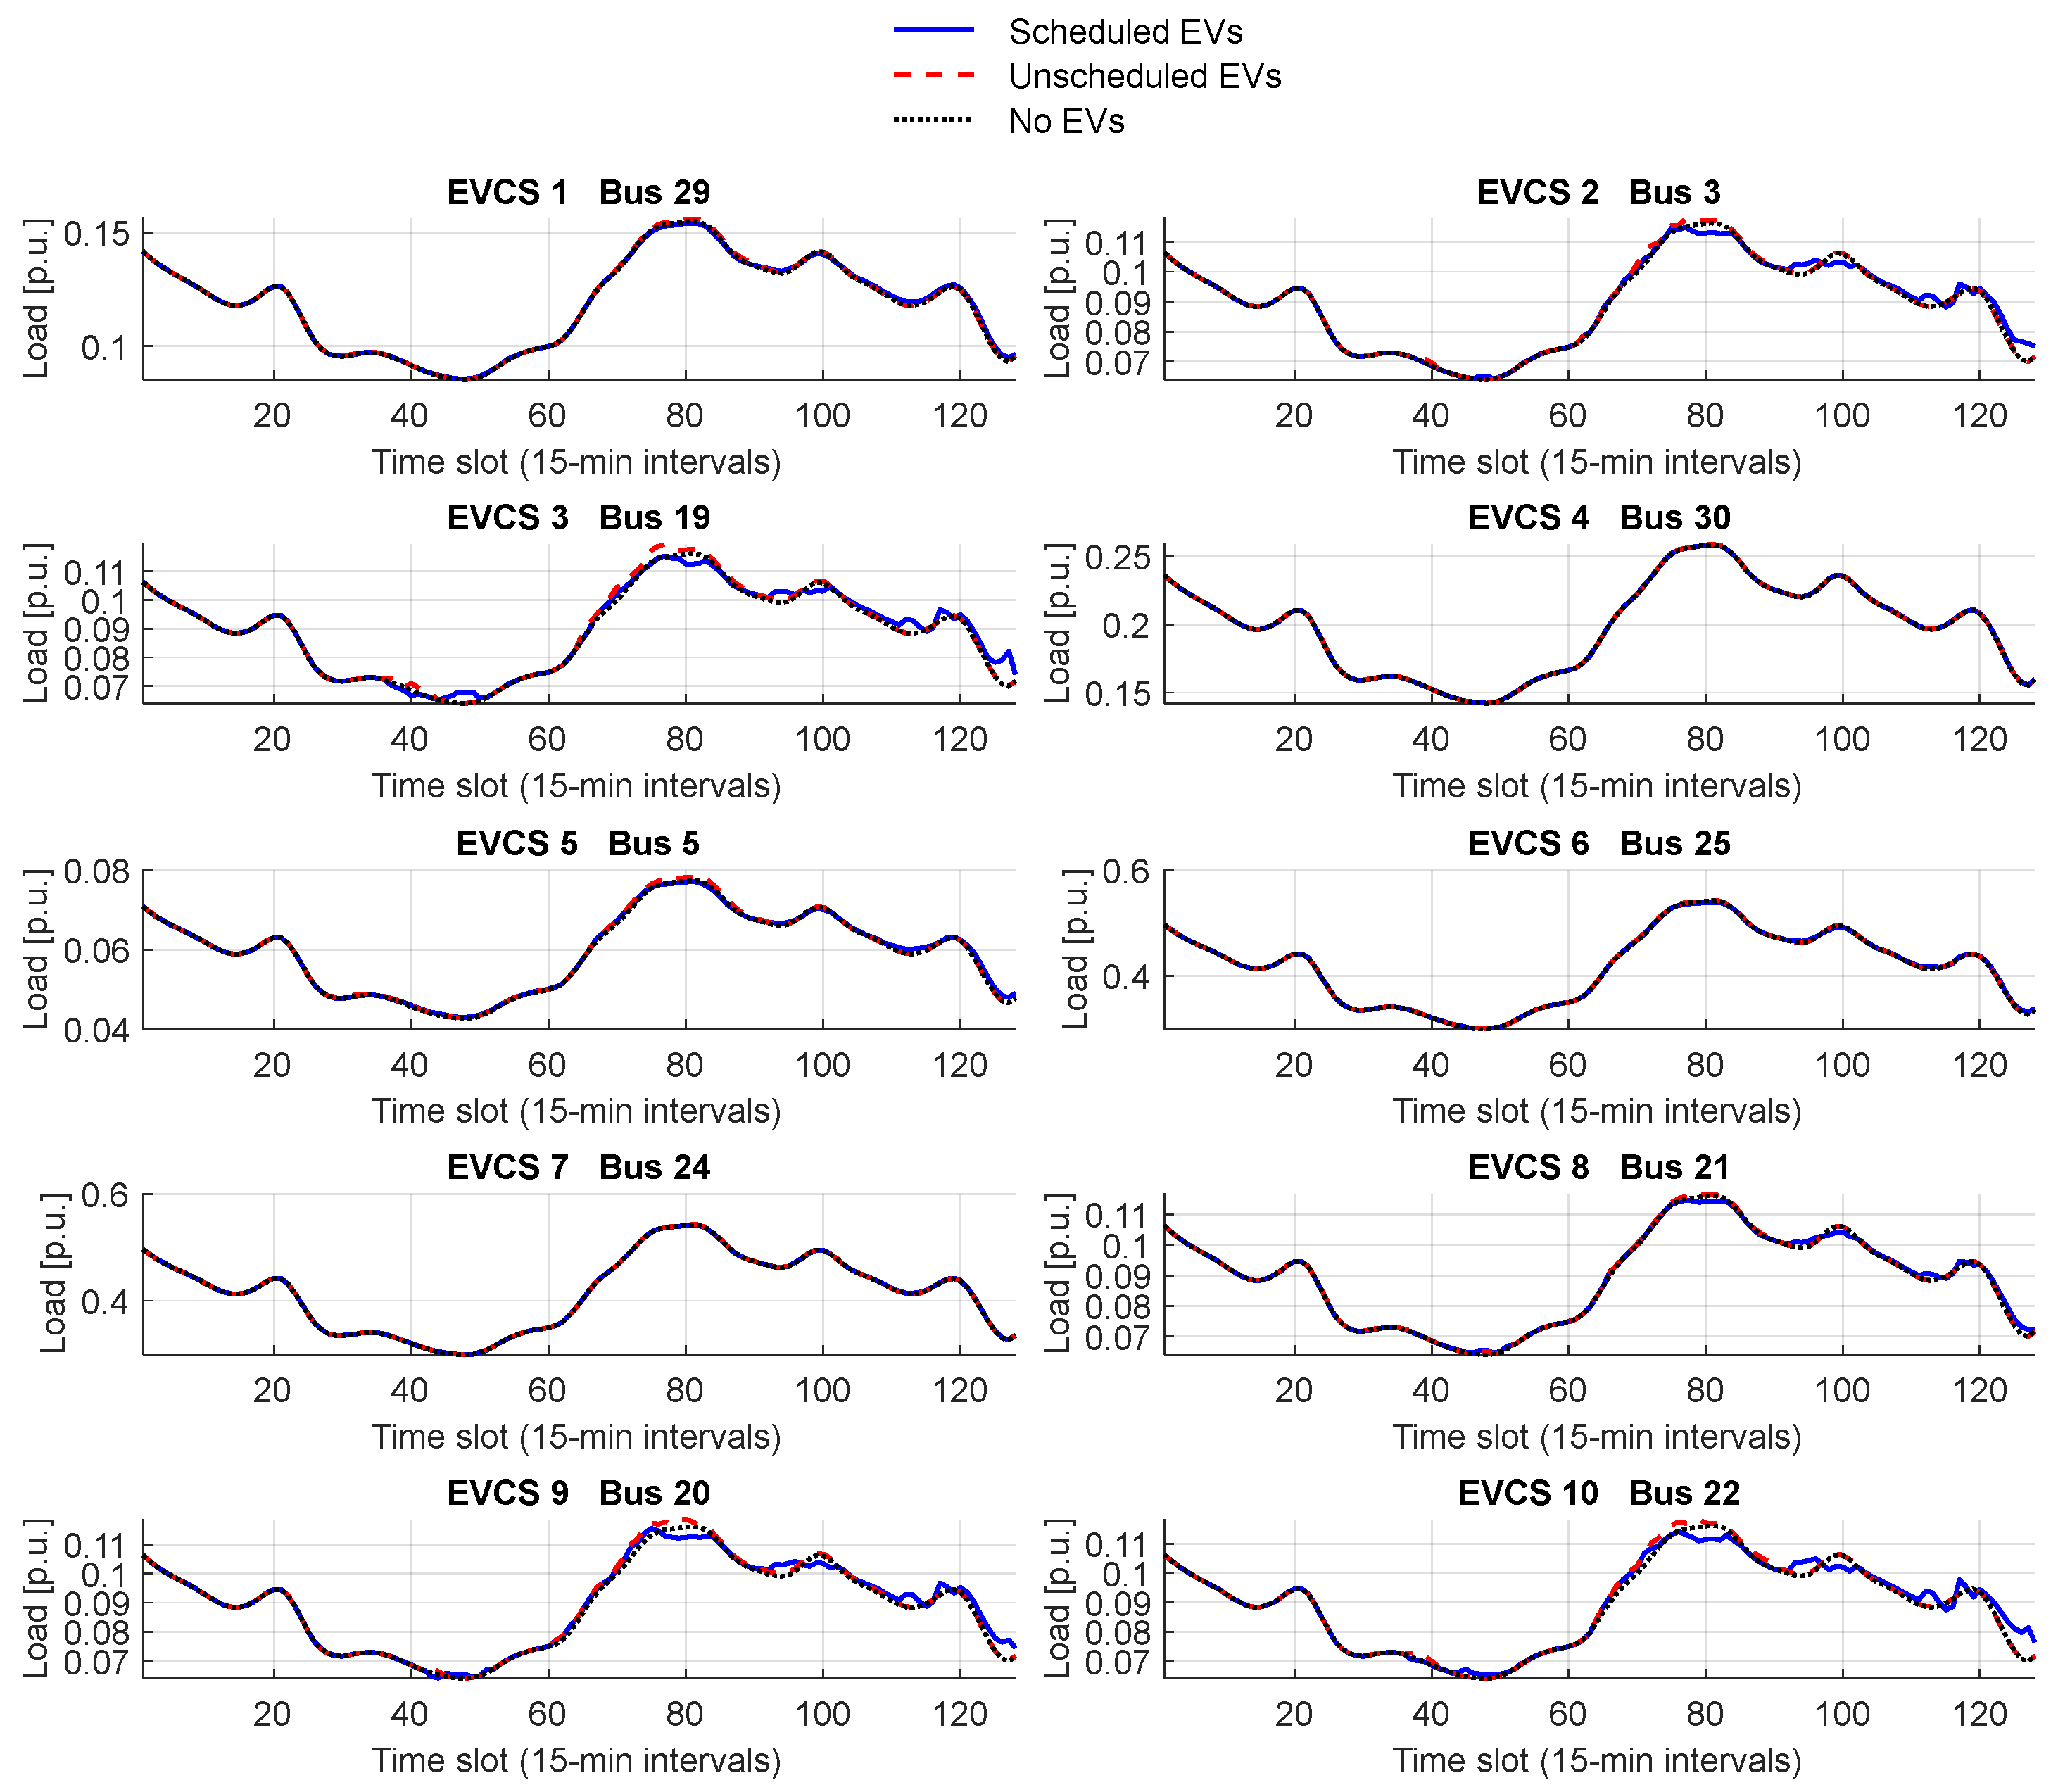
Figure 10 shows the simulation results of the daily load curves for each selected bus, as specified in
Table 2 and
Figure 9a. We applied AC power flow simulations to account for all the changes discussed above. MATLAB and MATPOWER [
29] were used for simulations.
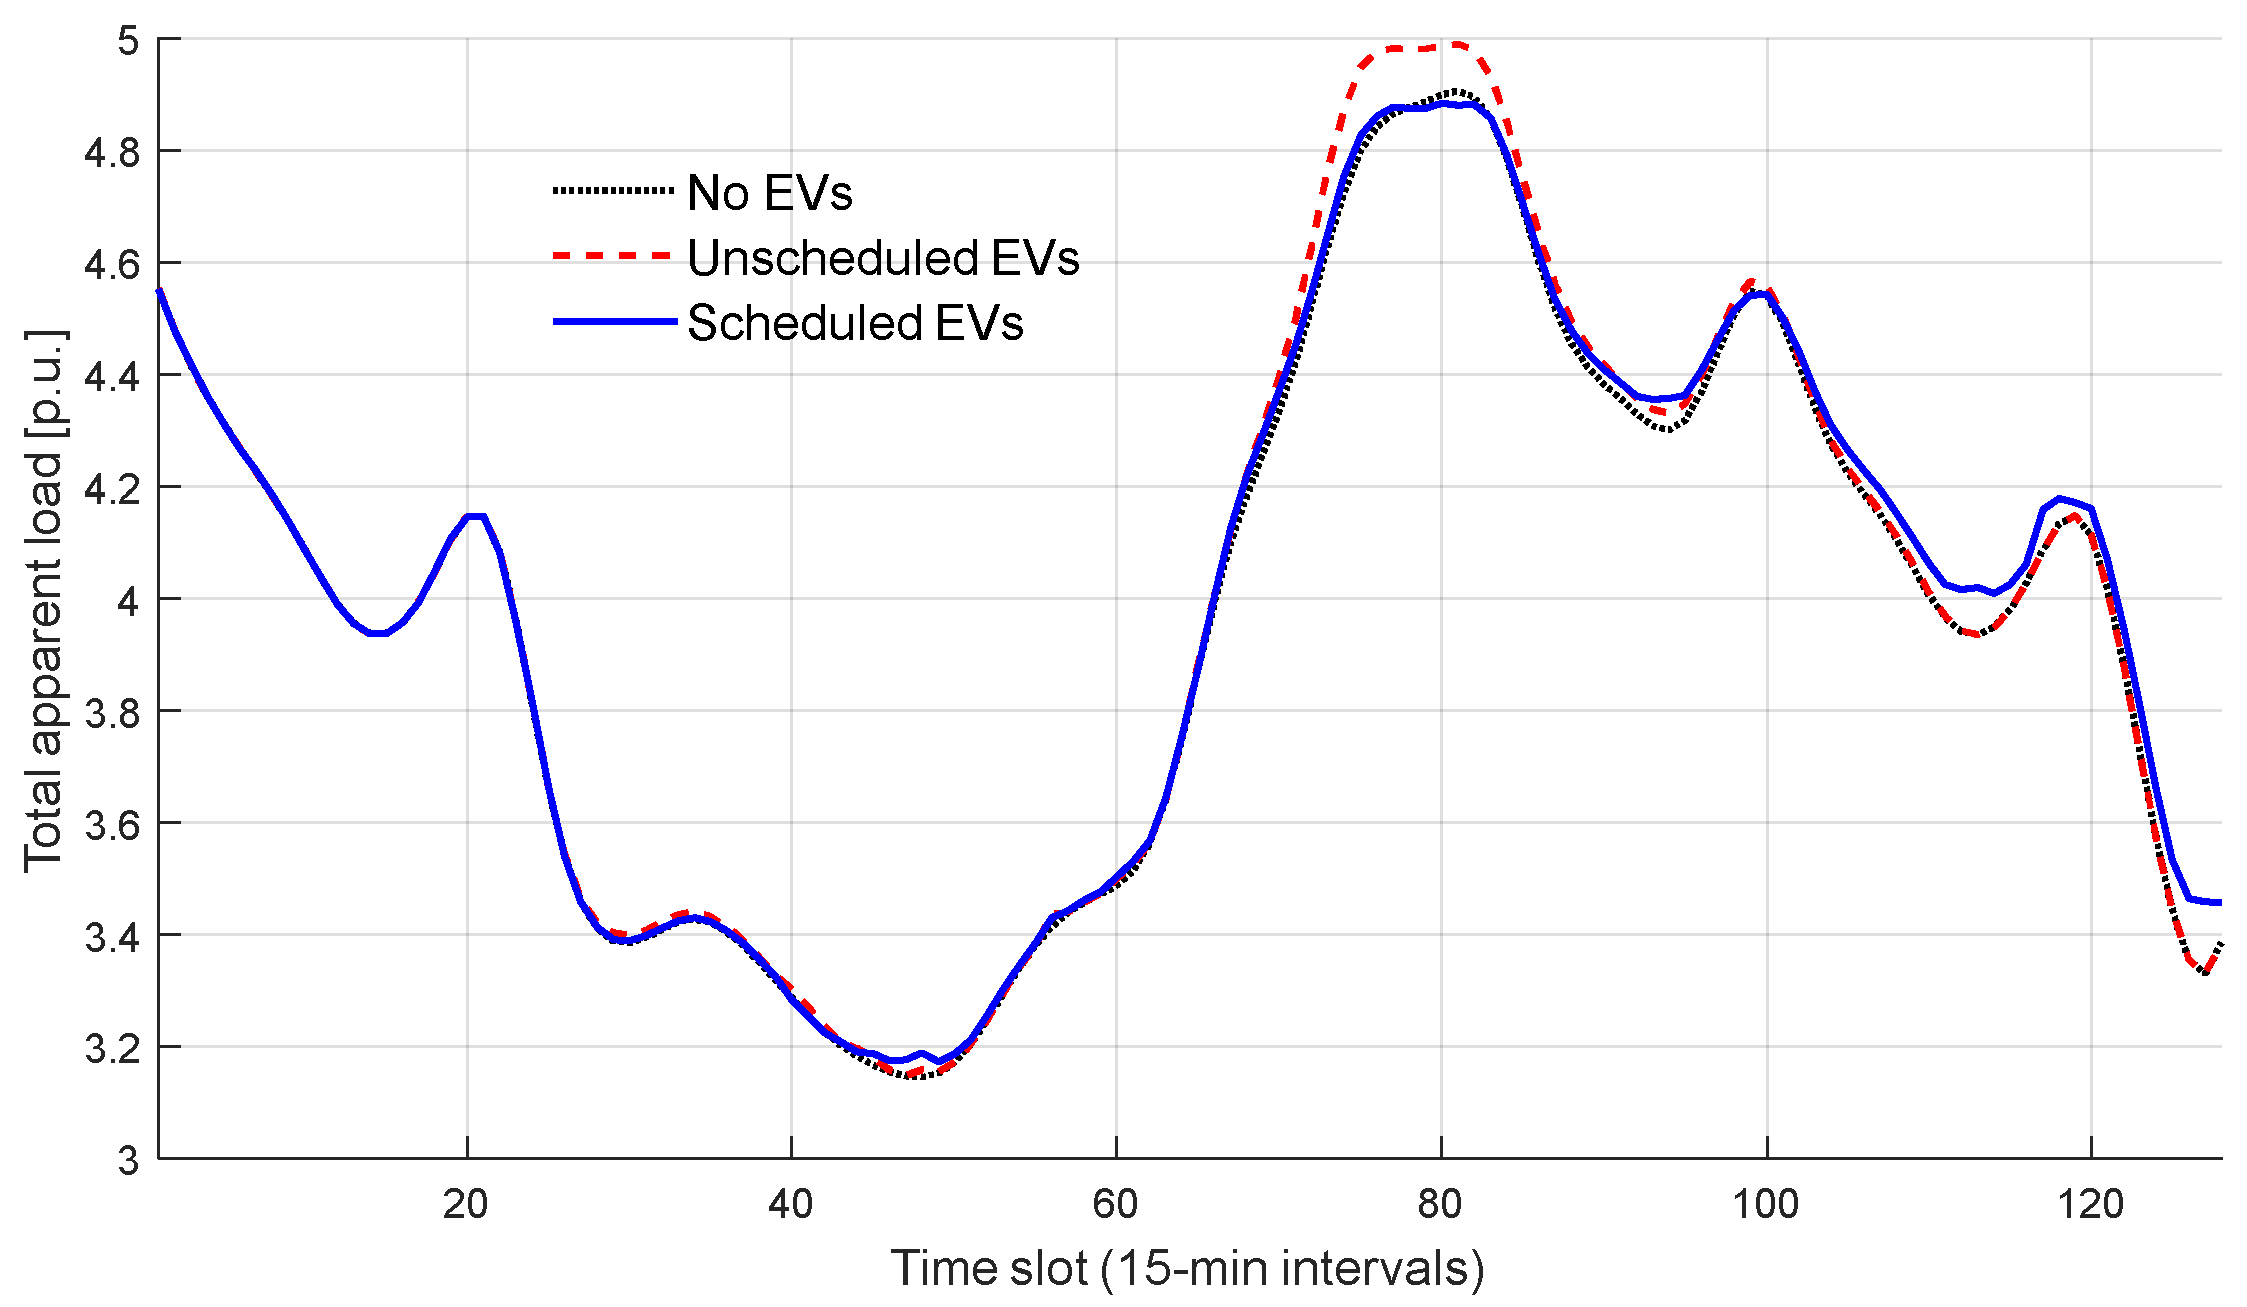
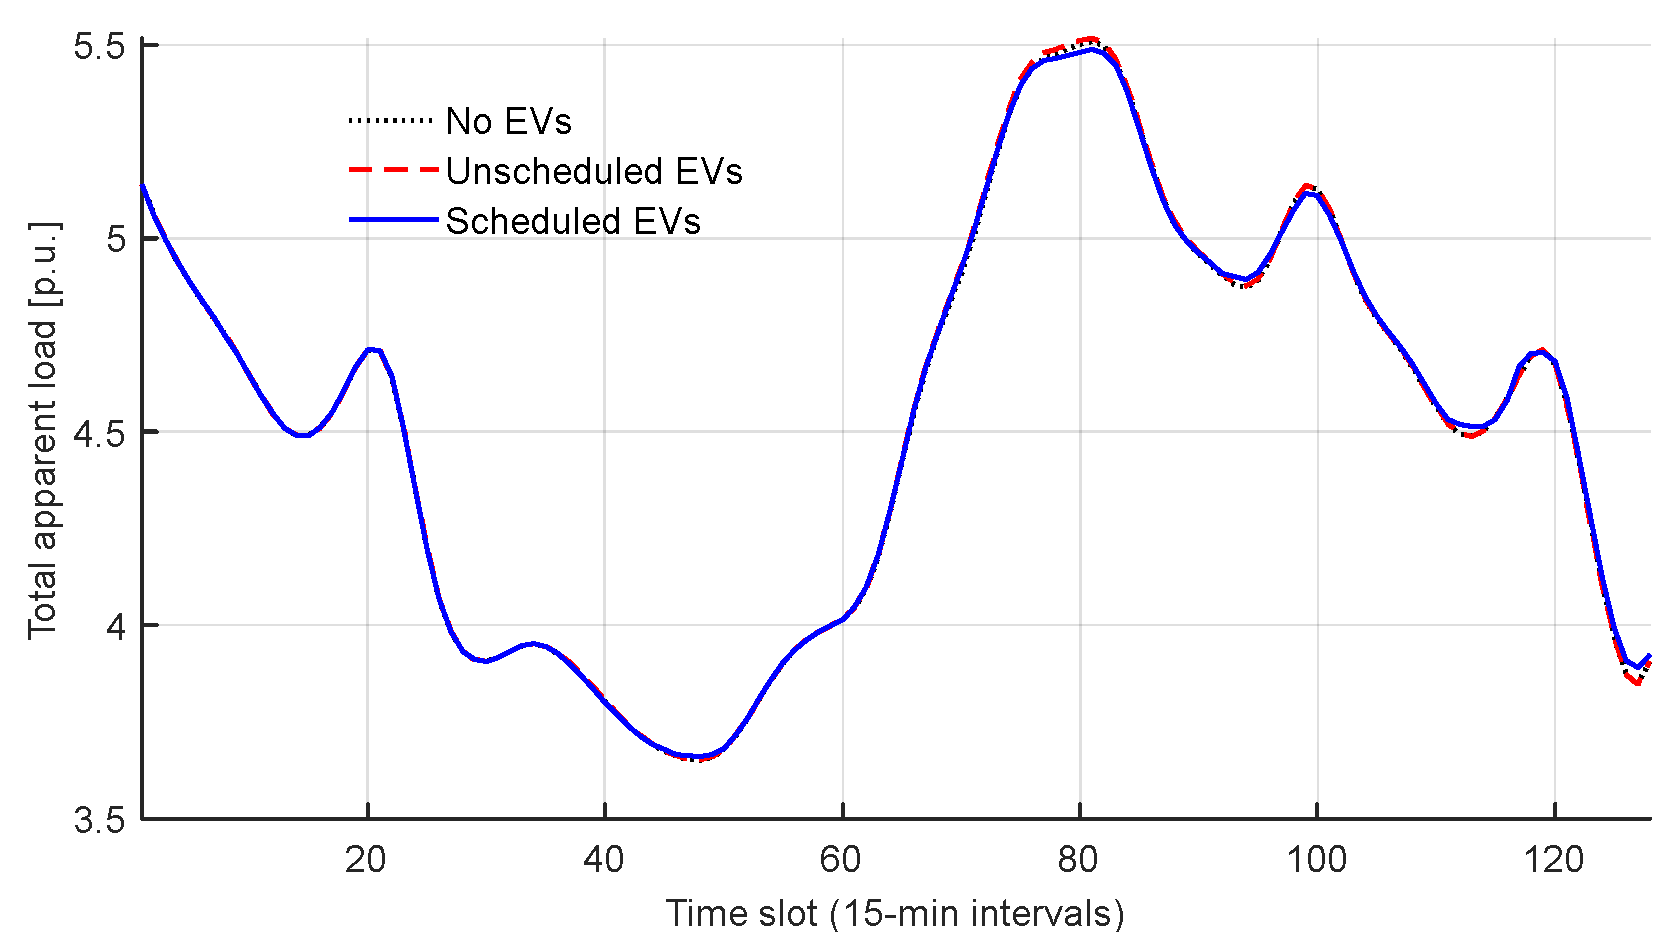
Figure 11 shows the results of the scheduling scheme and of installing the EVCSs without scheduling, along with the daily load curve of the base case prior to adding any EVCSs. The day was divided into 15 min periods so that we could consider a fast-charging option for some vehicles. We performed the simulations for 32 h to account for an extended period, so that the scheduling algorithm would show its full results, i.e., from 0 am to 8 am the next day. Results show that installing EVCSs did not affect the daily load curves for the selected buses, even when the scheduling algorithm was not applied, and it did not lead to any violations of branch thermal limits or bus voltage limits. While applying the scheduling algorithm reduces the impact of added loads and enhances grid metrics during charging, it may also increase grid reliability and performance during disturbances. The total daily load curve for the whole system is shown in
Figure 12.
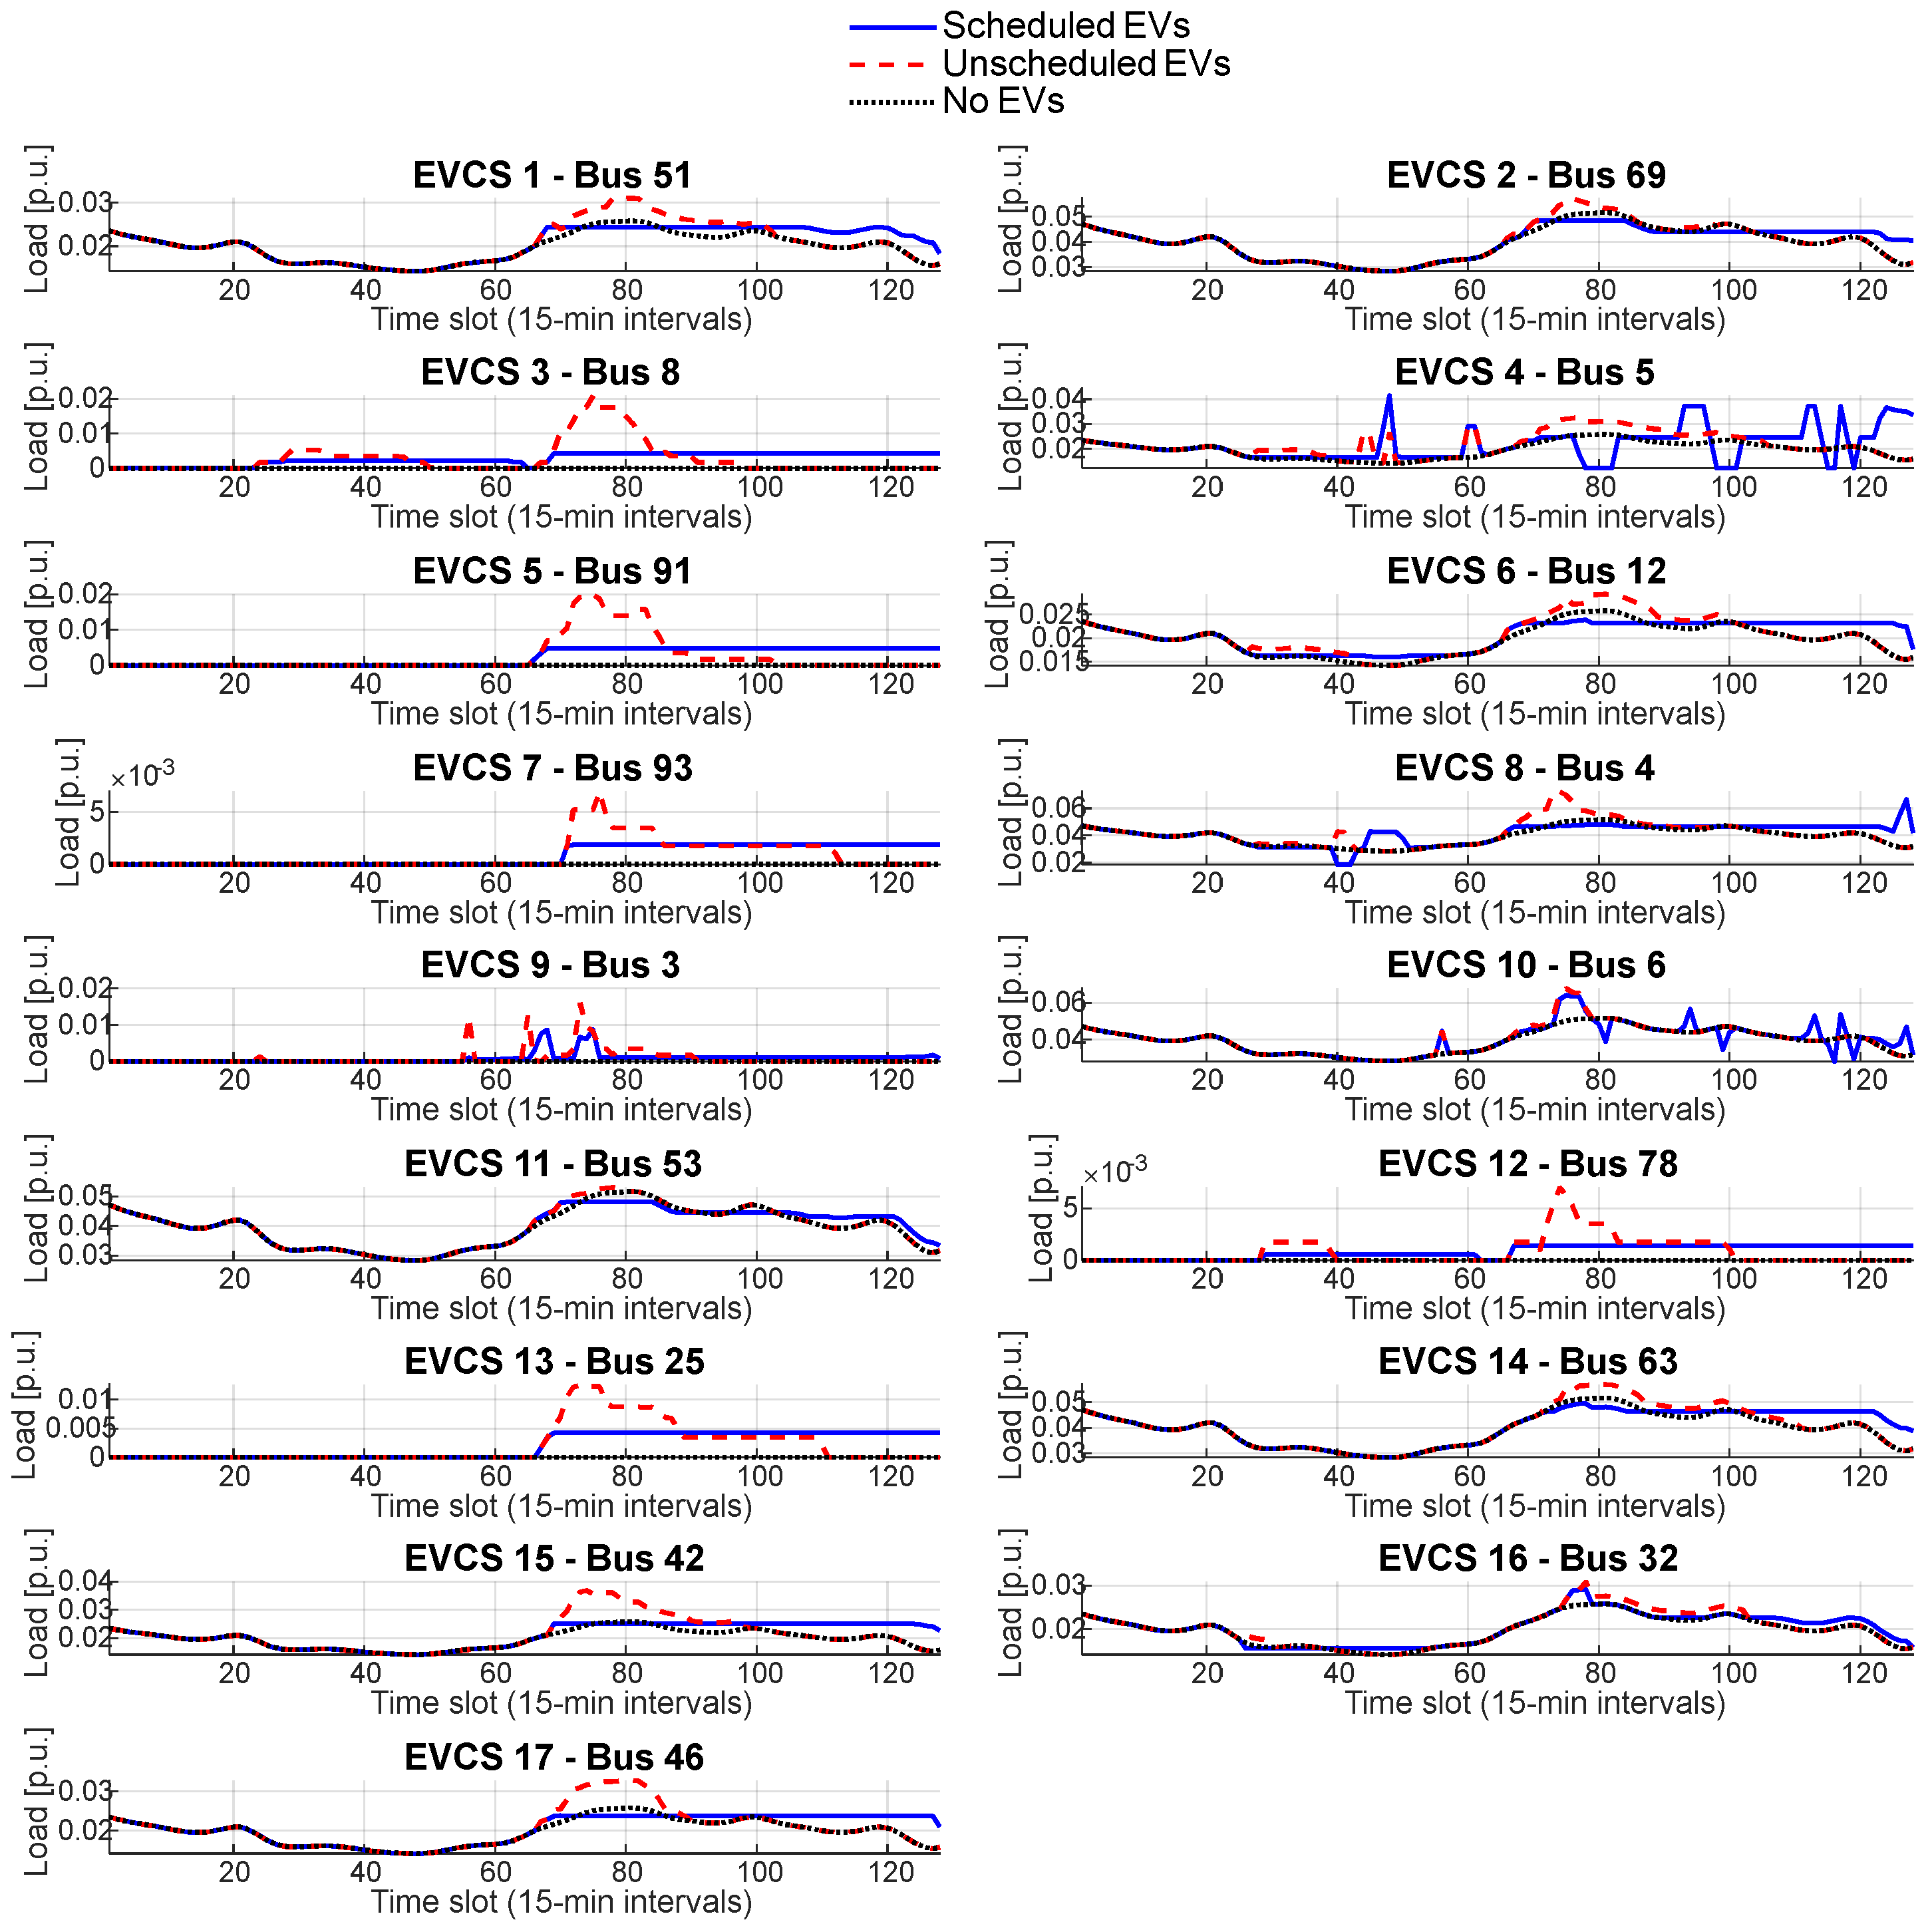
Figure 13 presents the simulation results for the daily load curves of selected buses in the IEEE 123-bus system as specified in
Table 4. Some buses had 0 p.u. as their base load, such as buses {8, 91, 93, 3, 25, 78}, which were equipped with EVCSs.
Figure 13 also shows several V2G discharge instances for some vehicles at specific buses, such as bus 5. Similarly,
Figure 14 shows the total daily load curve. In
Figure 13, the daily load curve maximum and minimum points—the peaks and valleys—are more aggressive in the case of not scheduling, although they do not violate the thermal and voltage limits of the system, while in the case of scheduling, they are much better handled and flattened across the whole period.
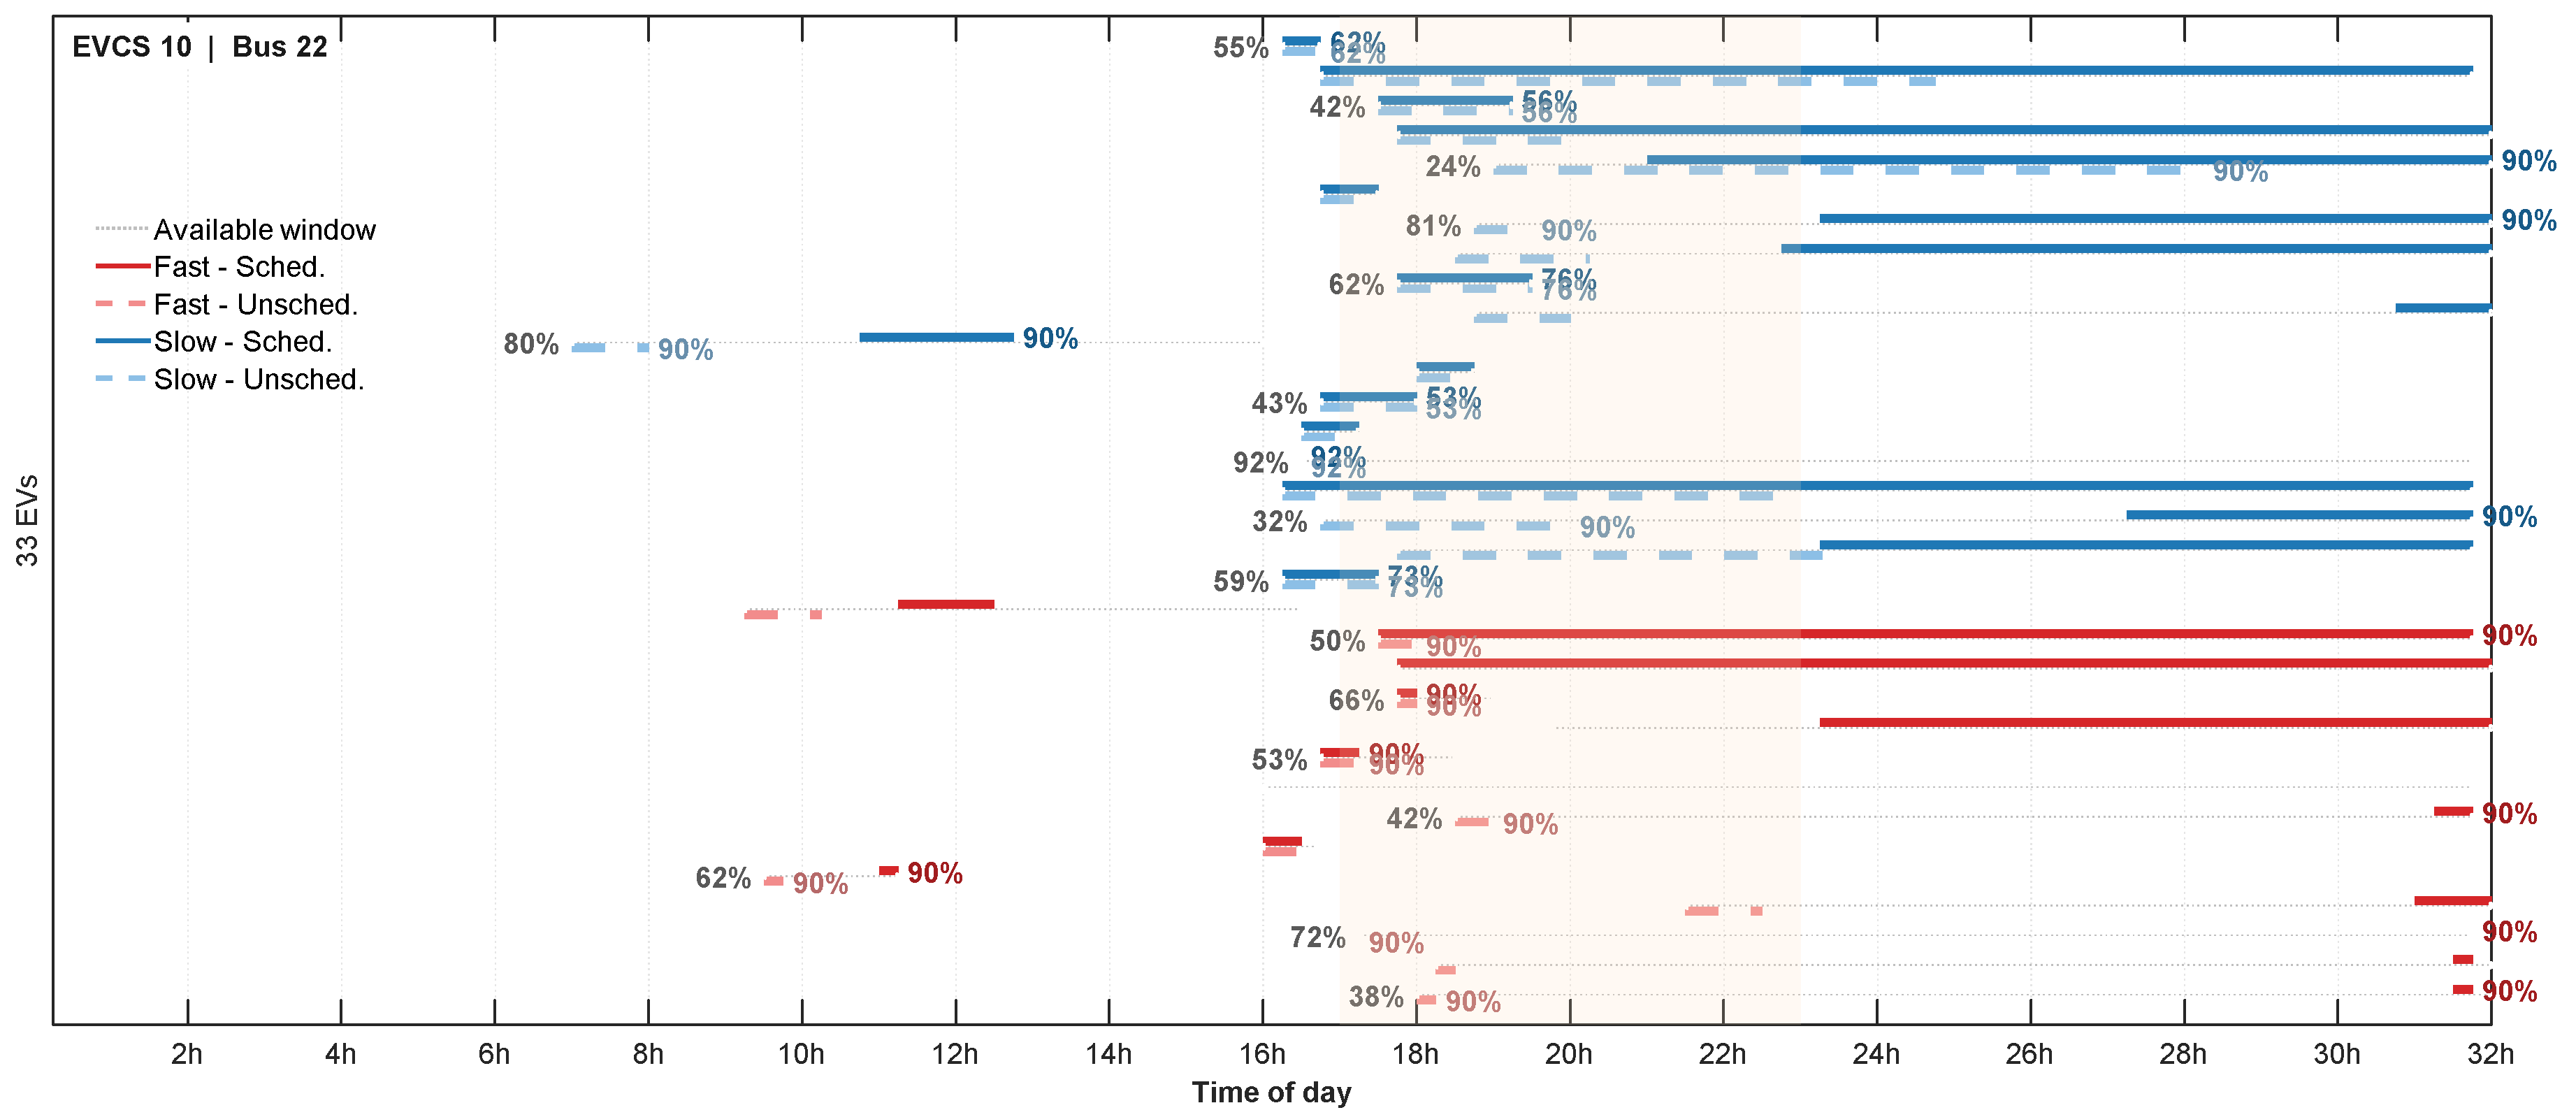
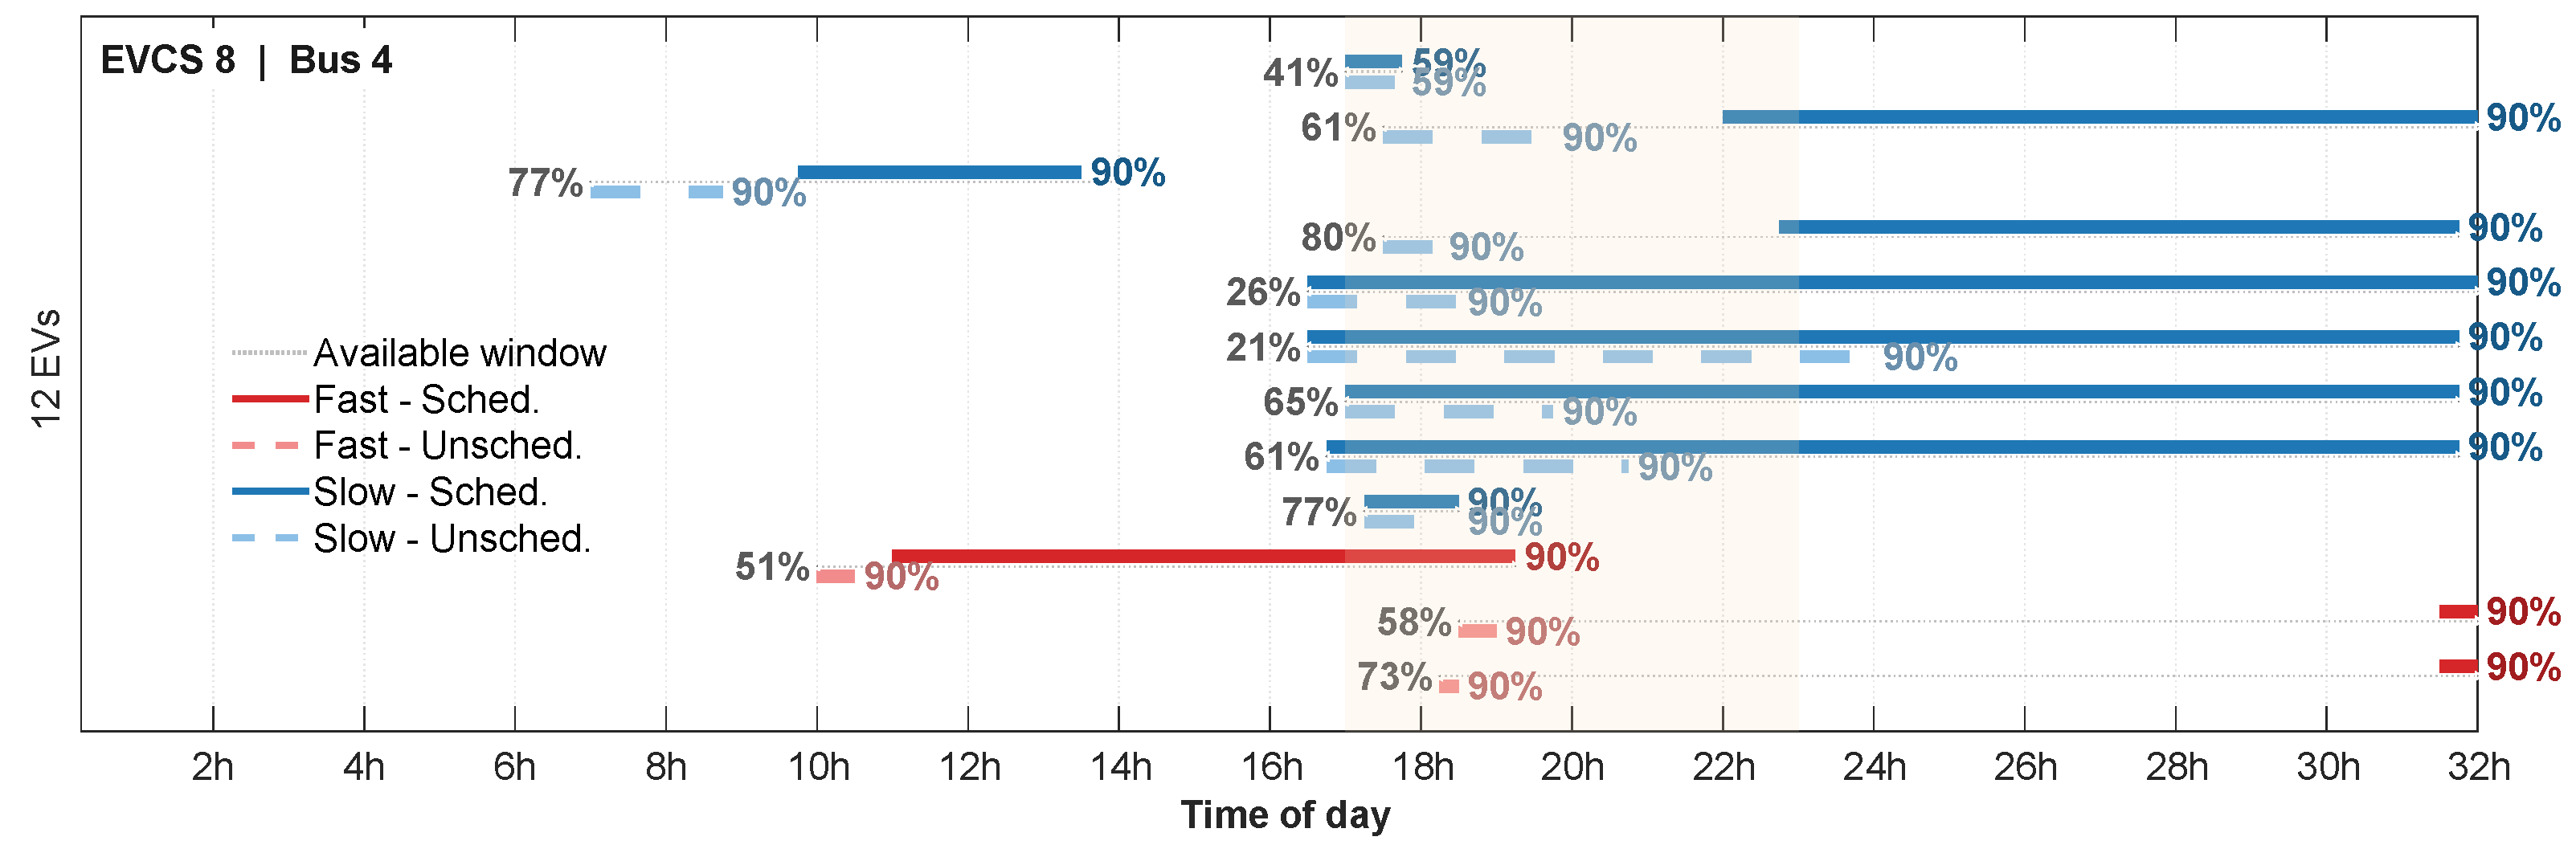
In addition to the previous results, the charging behavior over the entire simulation period was included for all buses with added EVCSs in both the 33-bbus system in
Figure 15 and the 123-bus system in
Figure 16. Results show charging for fast- and slow-charging periods, with starting SOC and final SOC. The cream shaded area in the two figures represents the evening peak between 17:00 and 23:00 pm, which aligns with the evening peak in the daily load curve and the plug-in time PMF. Such charts can be used effectively by distribution systems planners and operators.
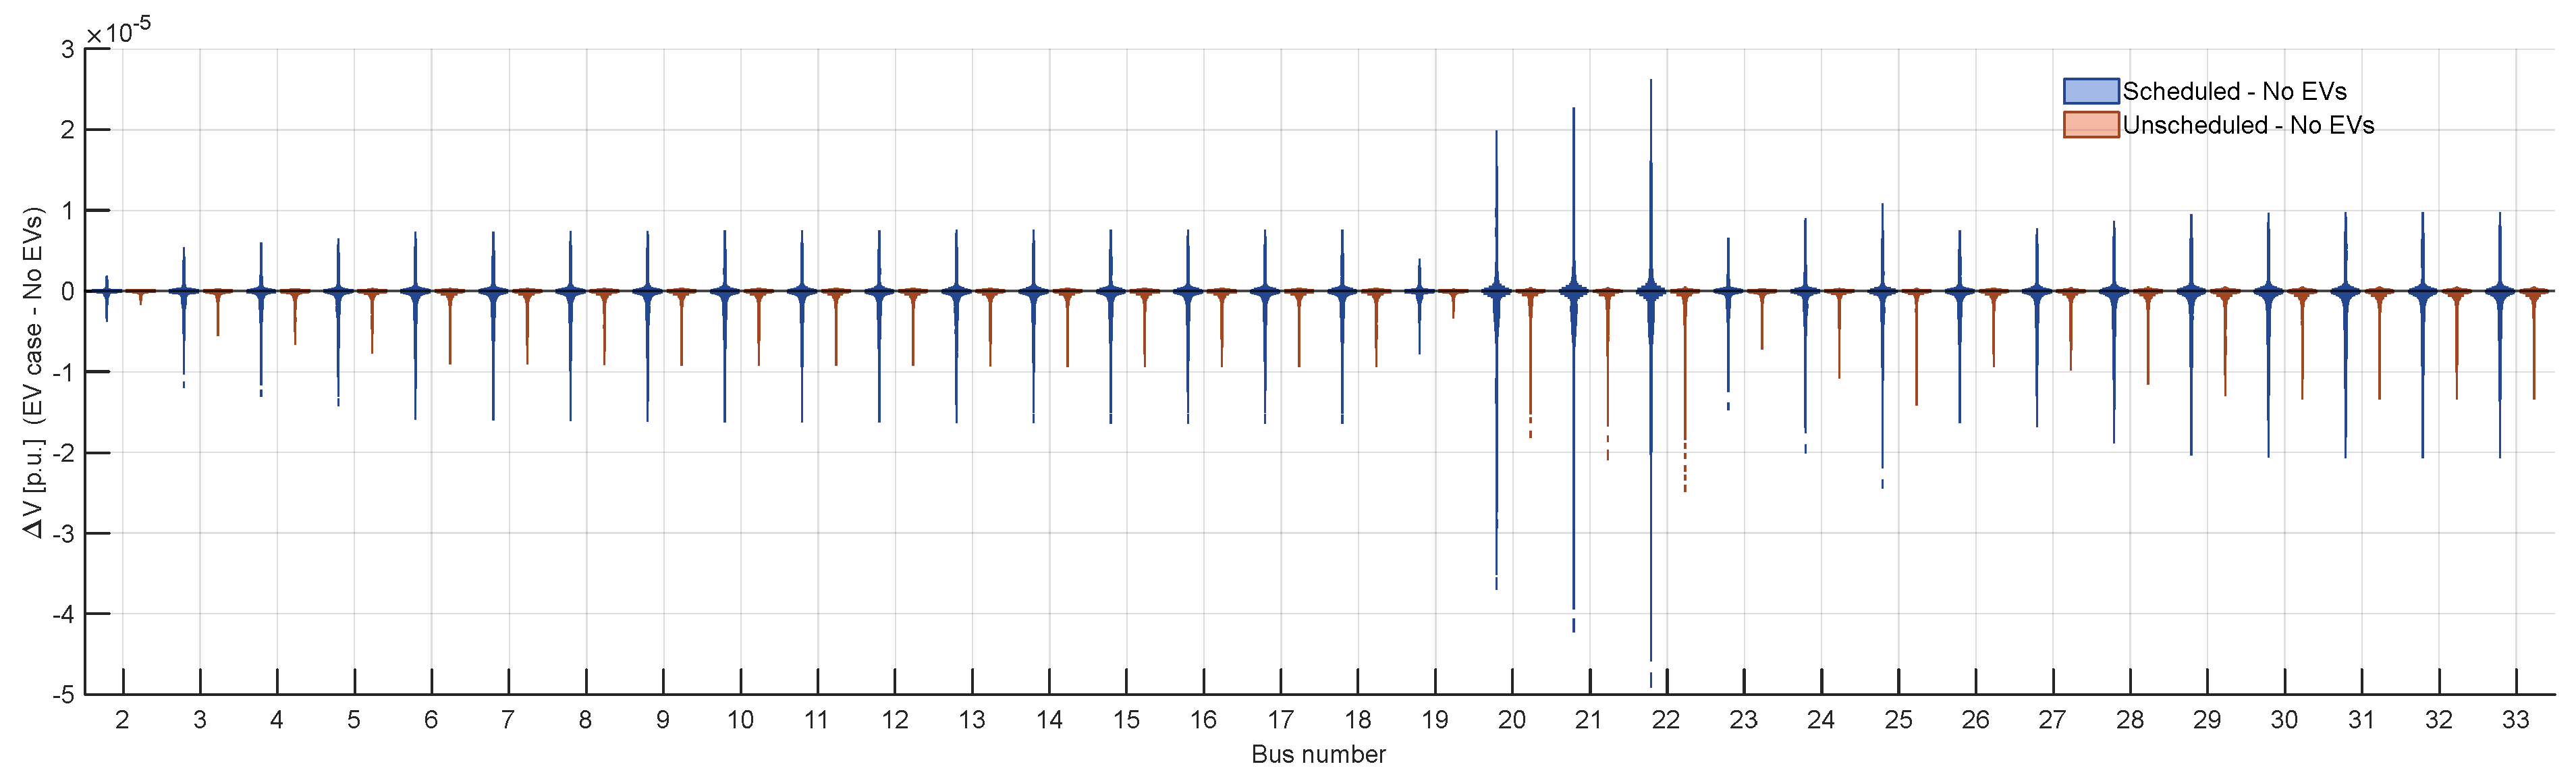
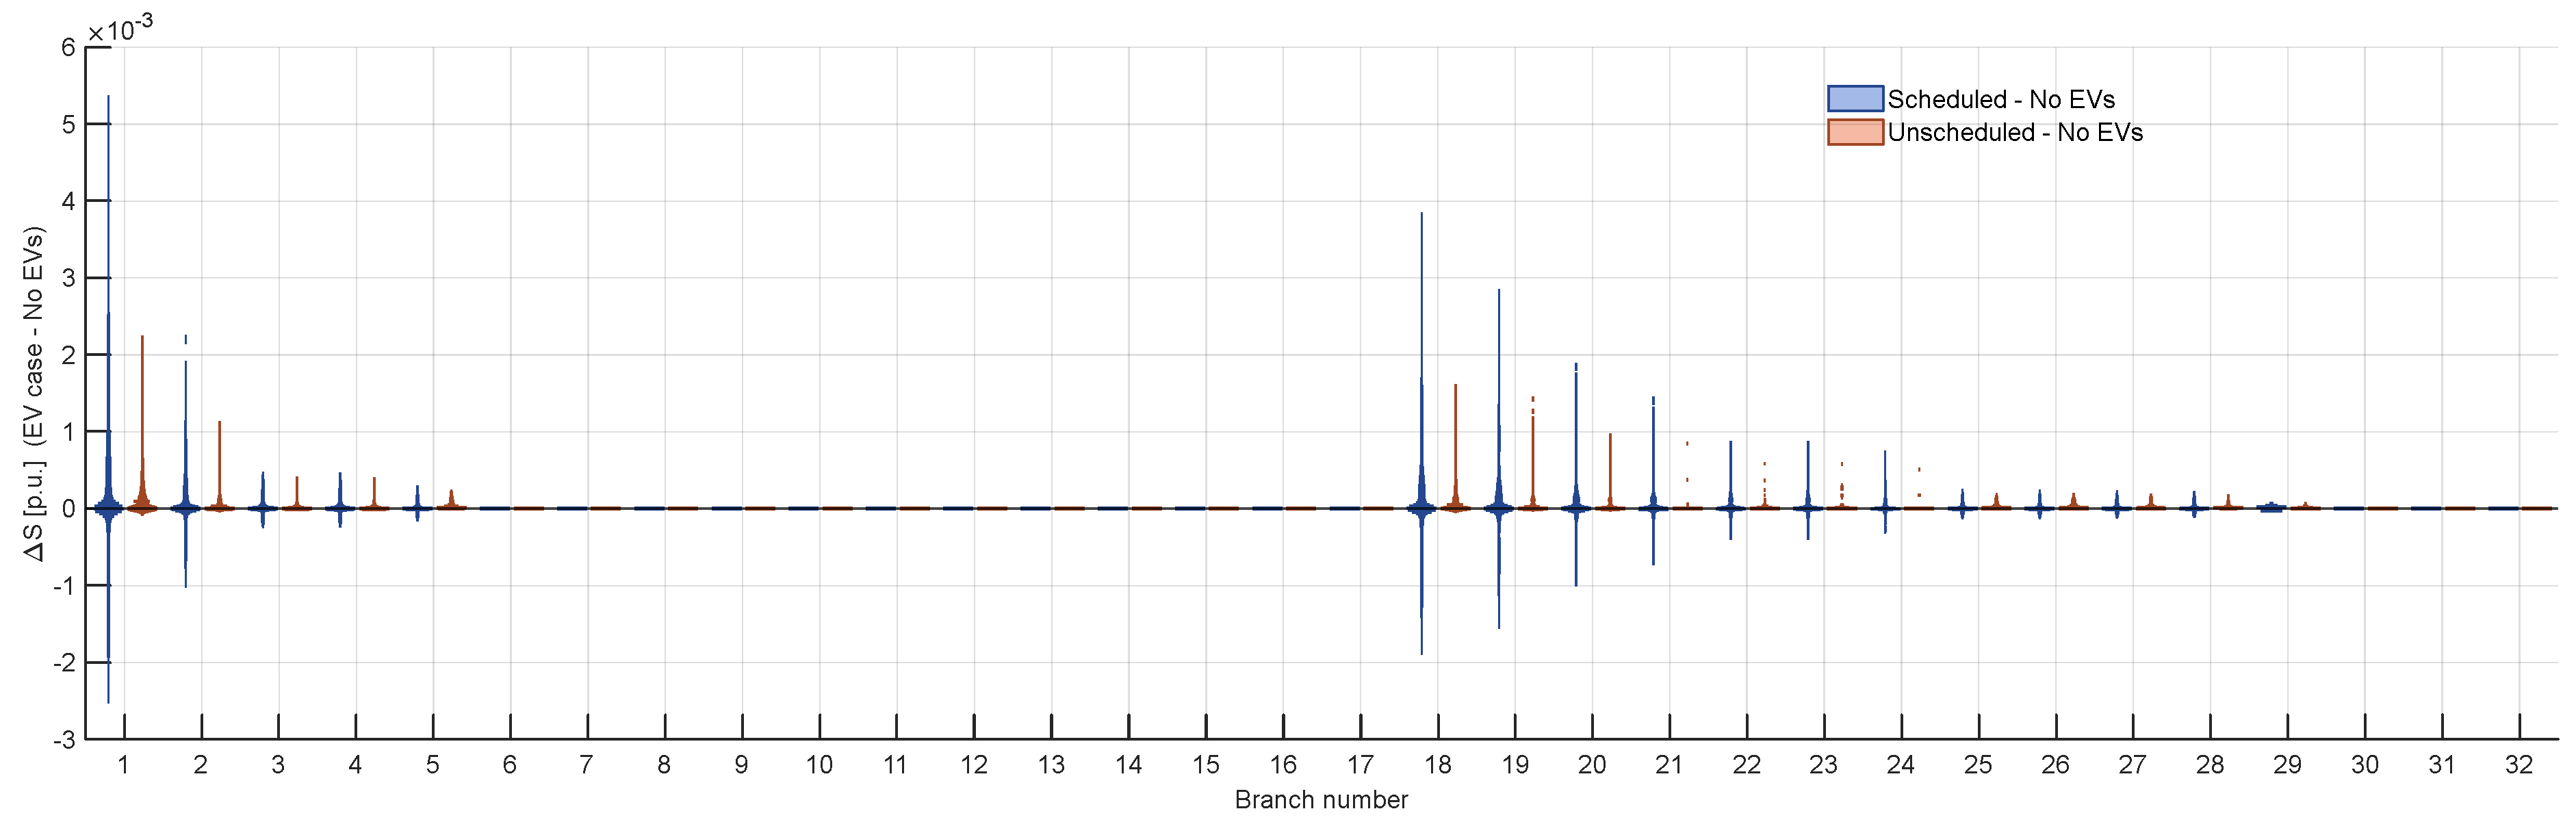
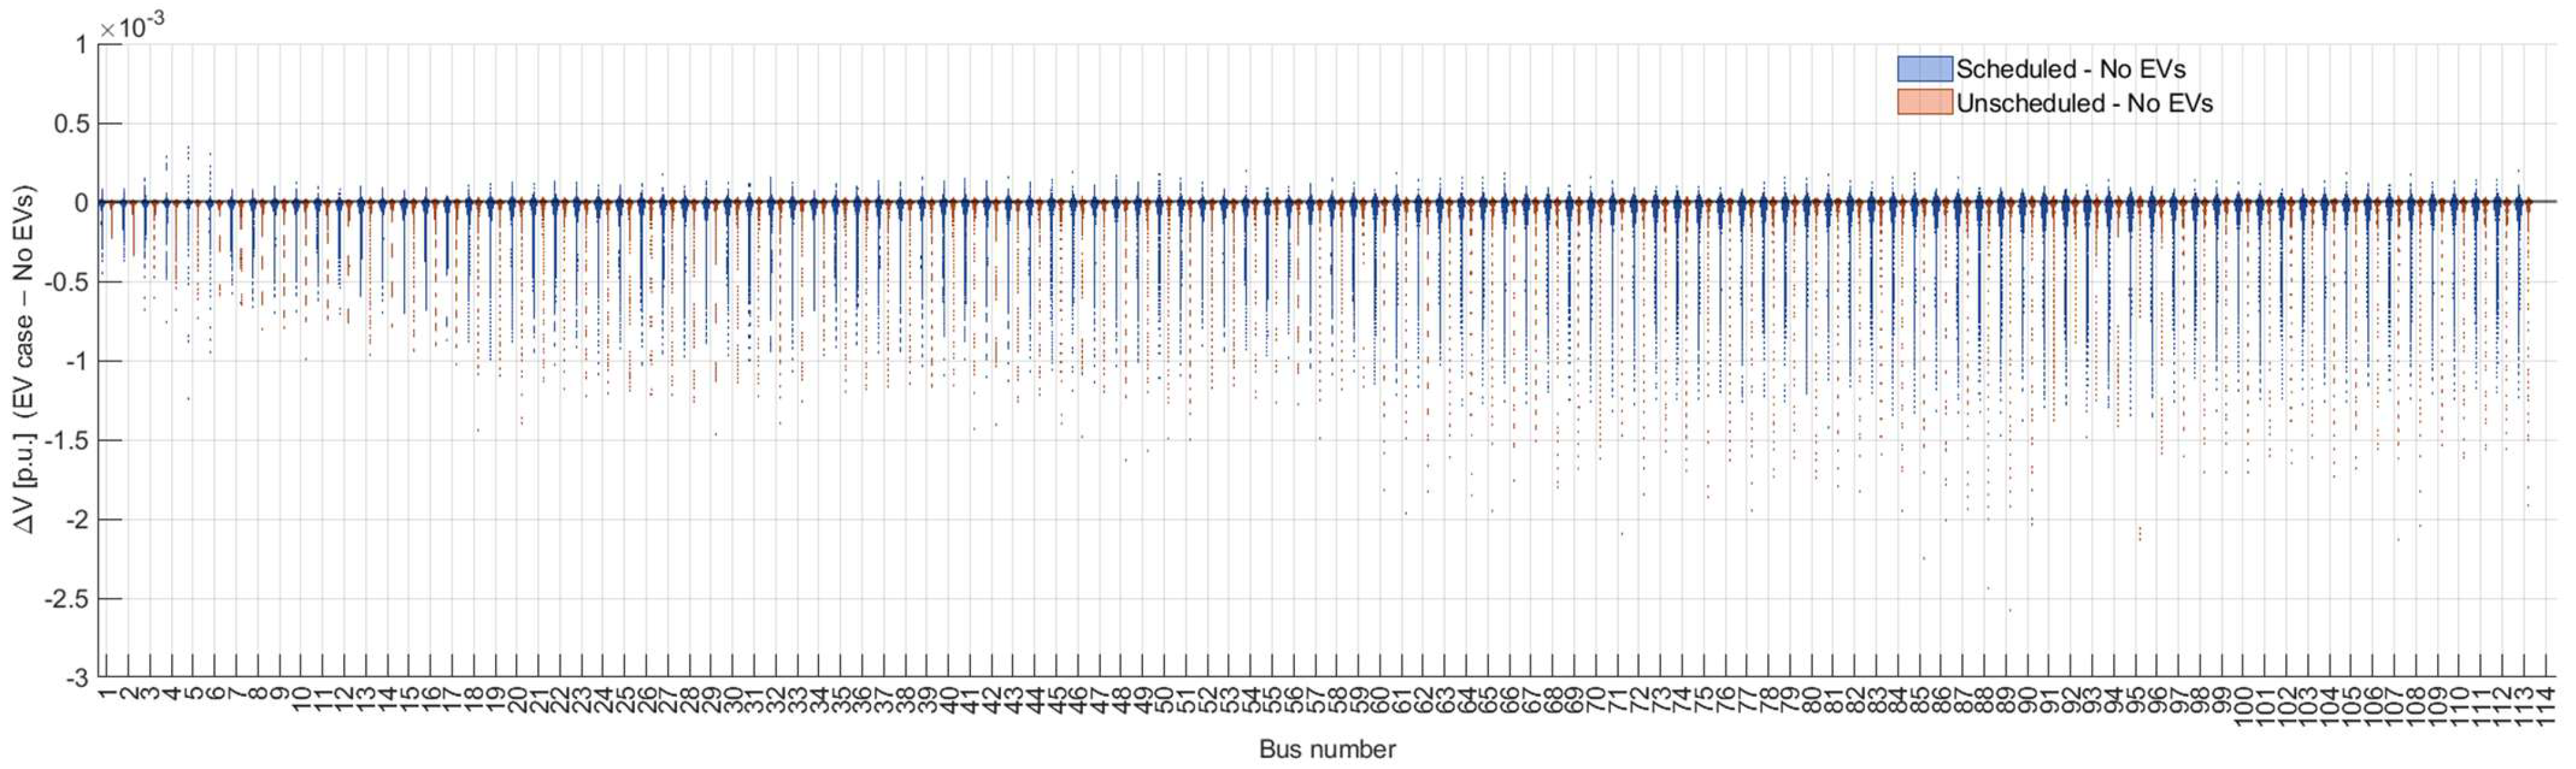
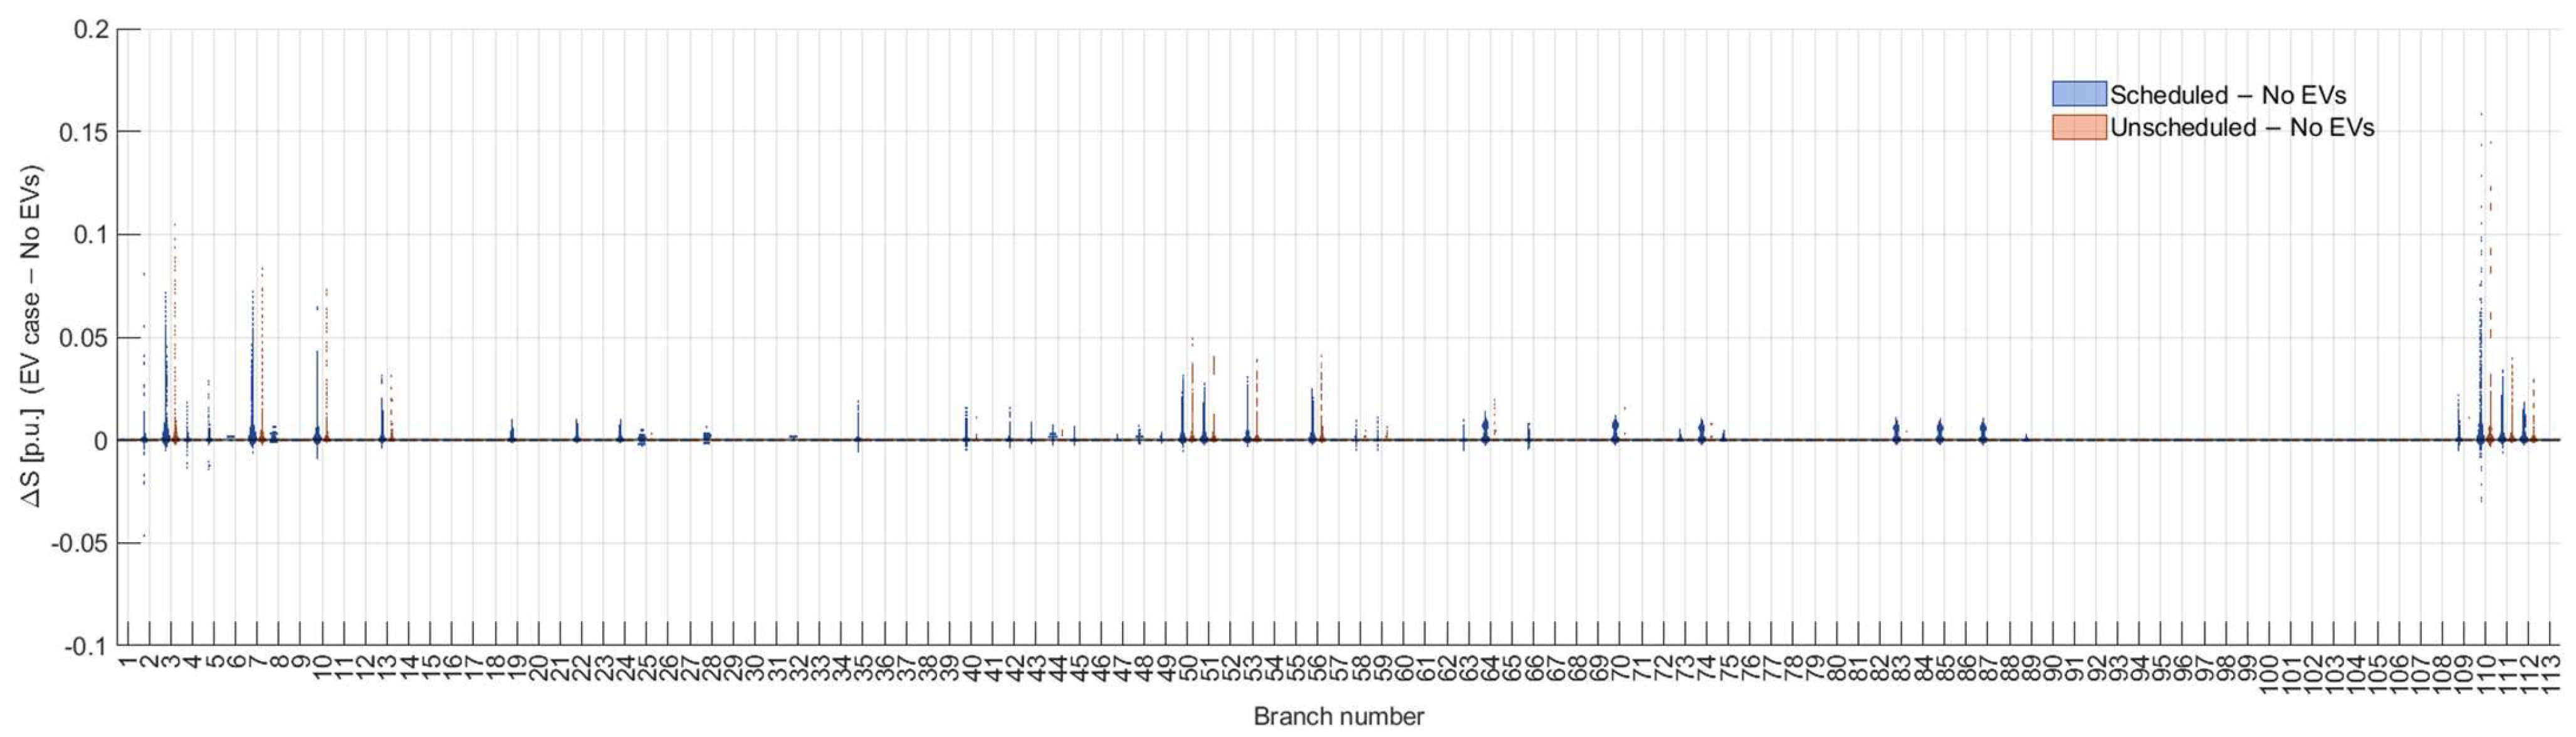
In addition to the previous analysis, we incorporated an uncertainty analysis through Monte Carlo simulations to check the robustness of the proposed approach. The Monte Carlo framework accounts for uncertainty in EV arrival and departure times at EV charging stations and in the initial SOC for each EV, with these stochastic variables modeled using the probability mass function discussed. A second source of uncertainty was also considered using the daily load curve, which was derived from the Jordanian power grid operating context. By combining these sources of uncertainty within the simulation framework, a reliable assessment of the proposed technique under varying EV behavior and load-demand conditions can be achieved. We excluded simulation data from AC power flow runs that did not converge during Monte Carlo simulations to ensure valid data points for bus voltages and branch flows were obtained. To illustrate the results of the Monte Carlo simulations, violin plots for both the IEEE 33- and 123-bus systems, showing bus voltage and branch flow deviations, are shown in
Figure 17,
Figure 18,
Figure 19 and
Figure 20. The deviation is measured relative to the case with no EVs added, comparing adding EVCSs with and without scheduling. Due to the first-stage application, the impact of EVCS loads on deviations is minimal in both cases. It is observed that the scheduling algorithm exhibits a positive tail in the voltage profile and a negative tail in the branch loading profile. This is due to the shift in EV load to off-peak periods, which can reduce branch loading below the No EV case in some hours and improve voltage. It is also observed that the impact of adding EVCSs is more significant on buses where EVCSs are added on the voltage profile, and adjacent branches in terms of branch loading, in addition to buses and branches upstream.
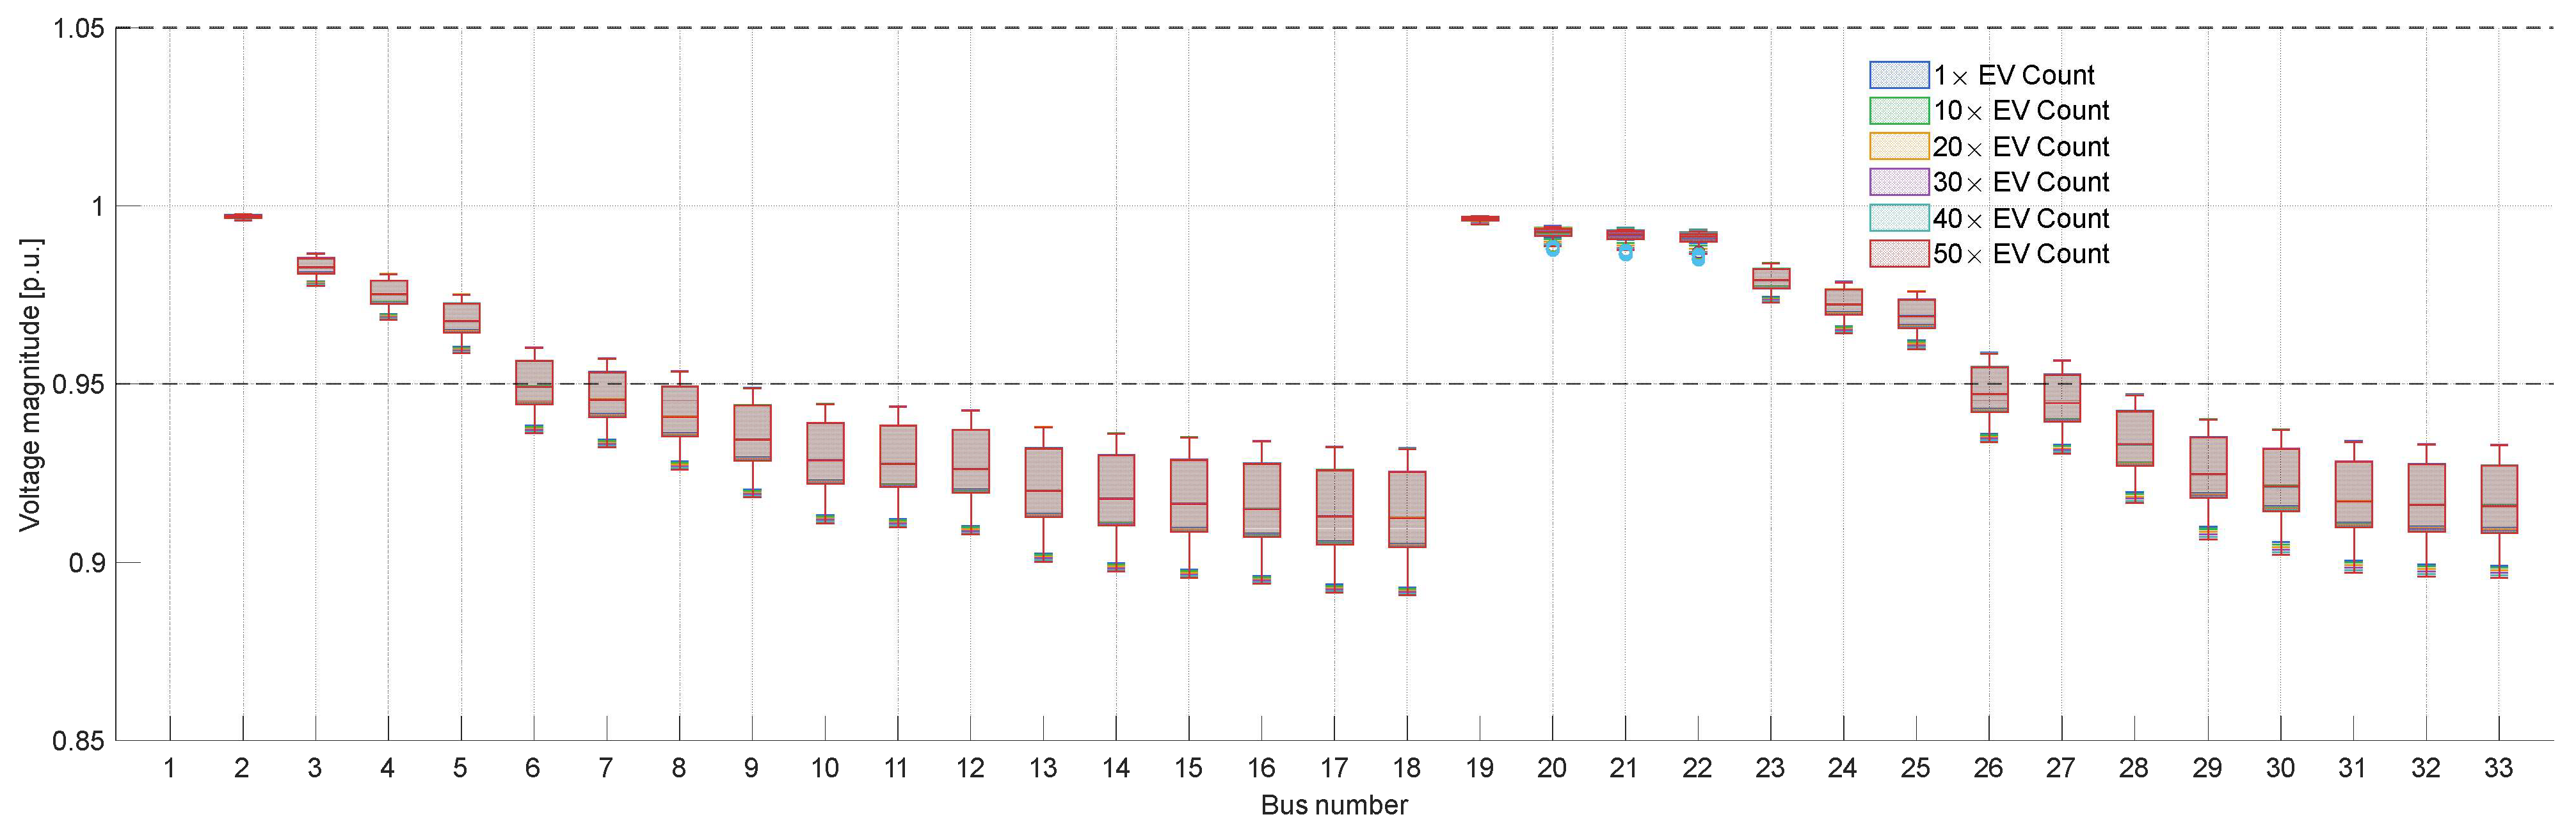
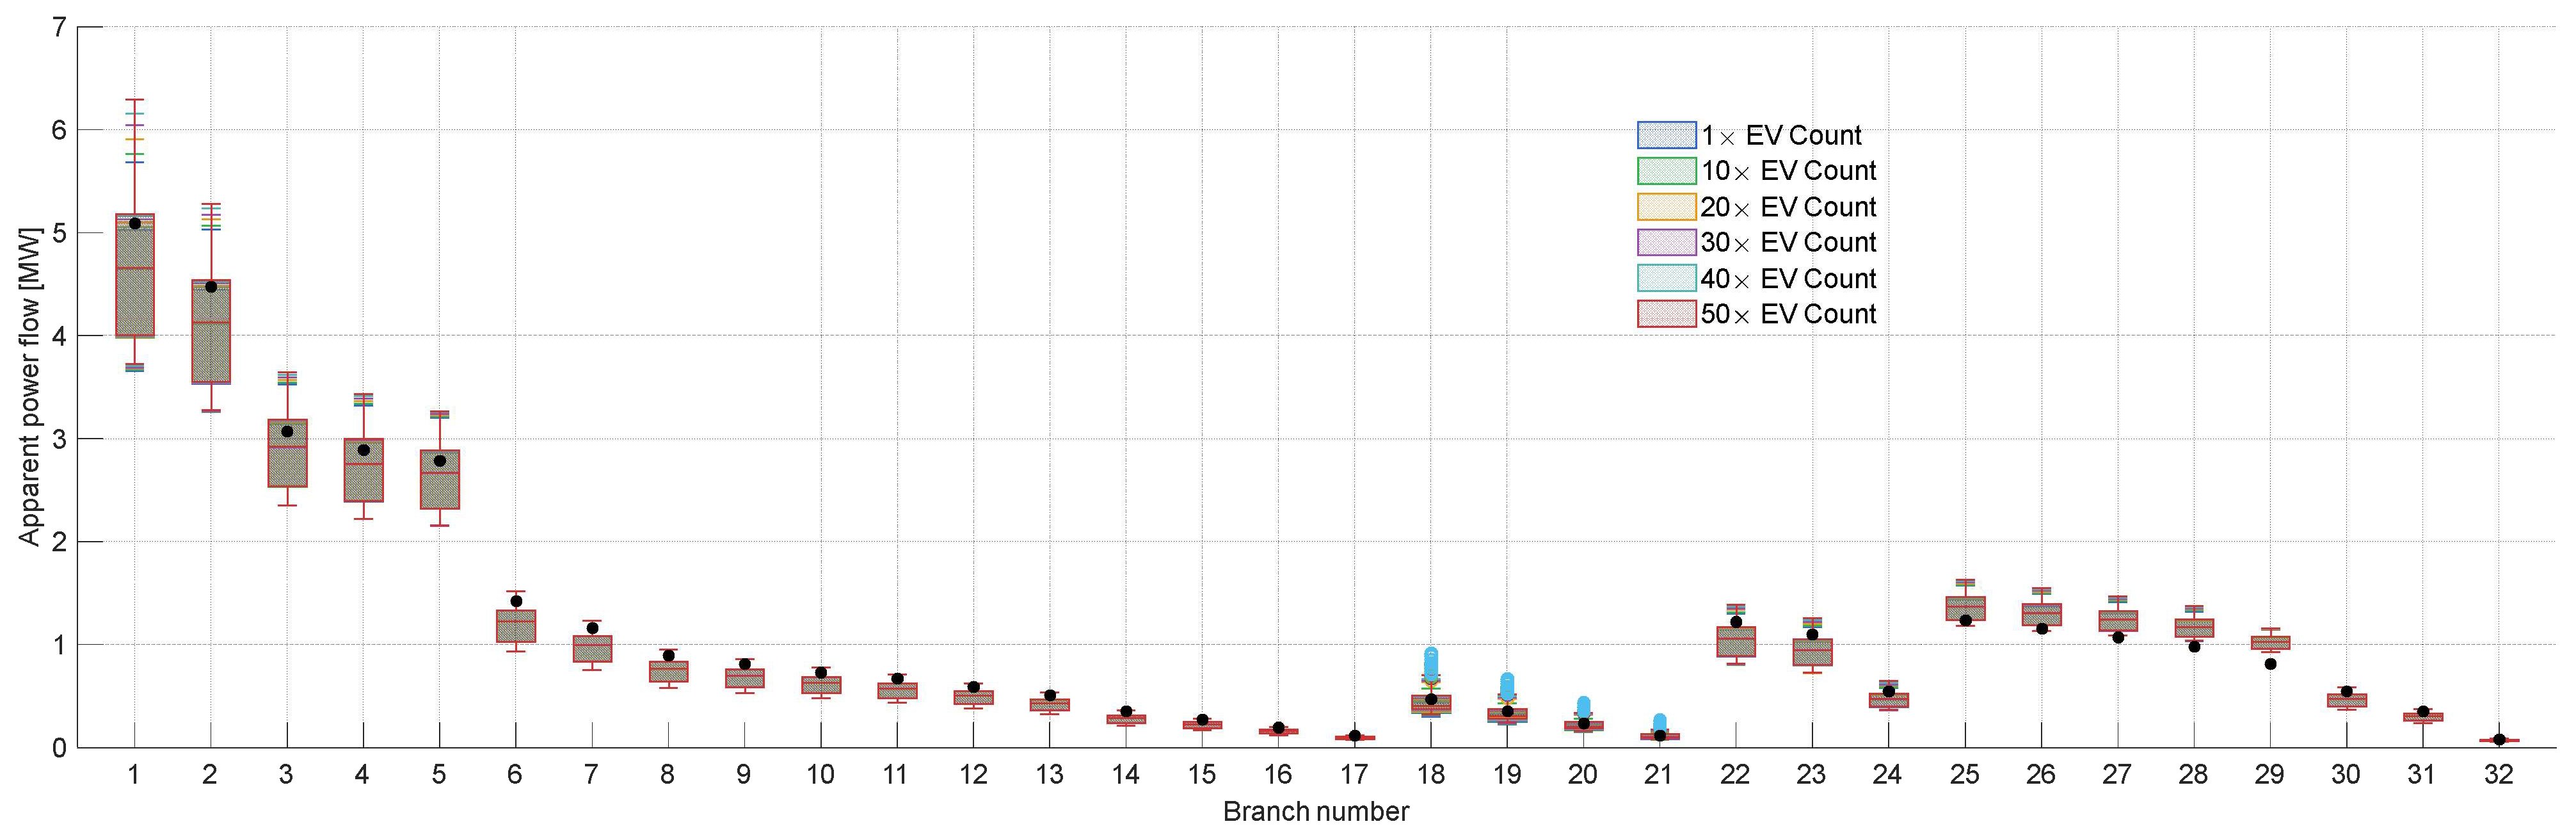
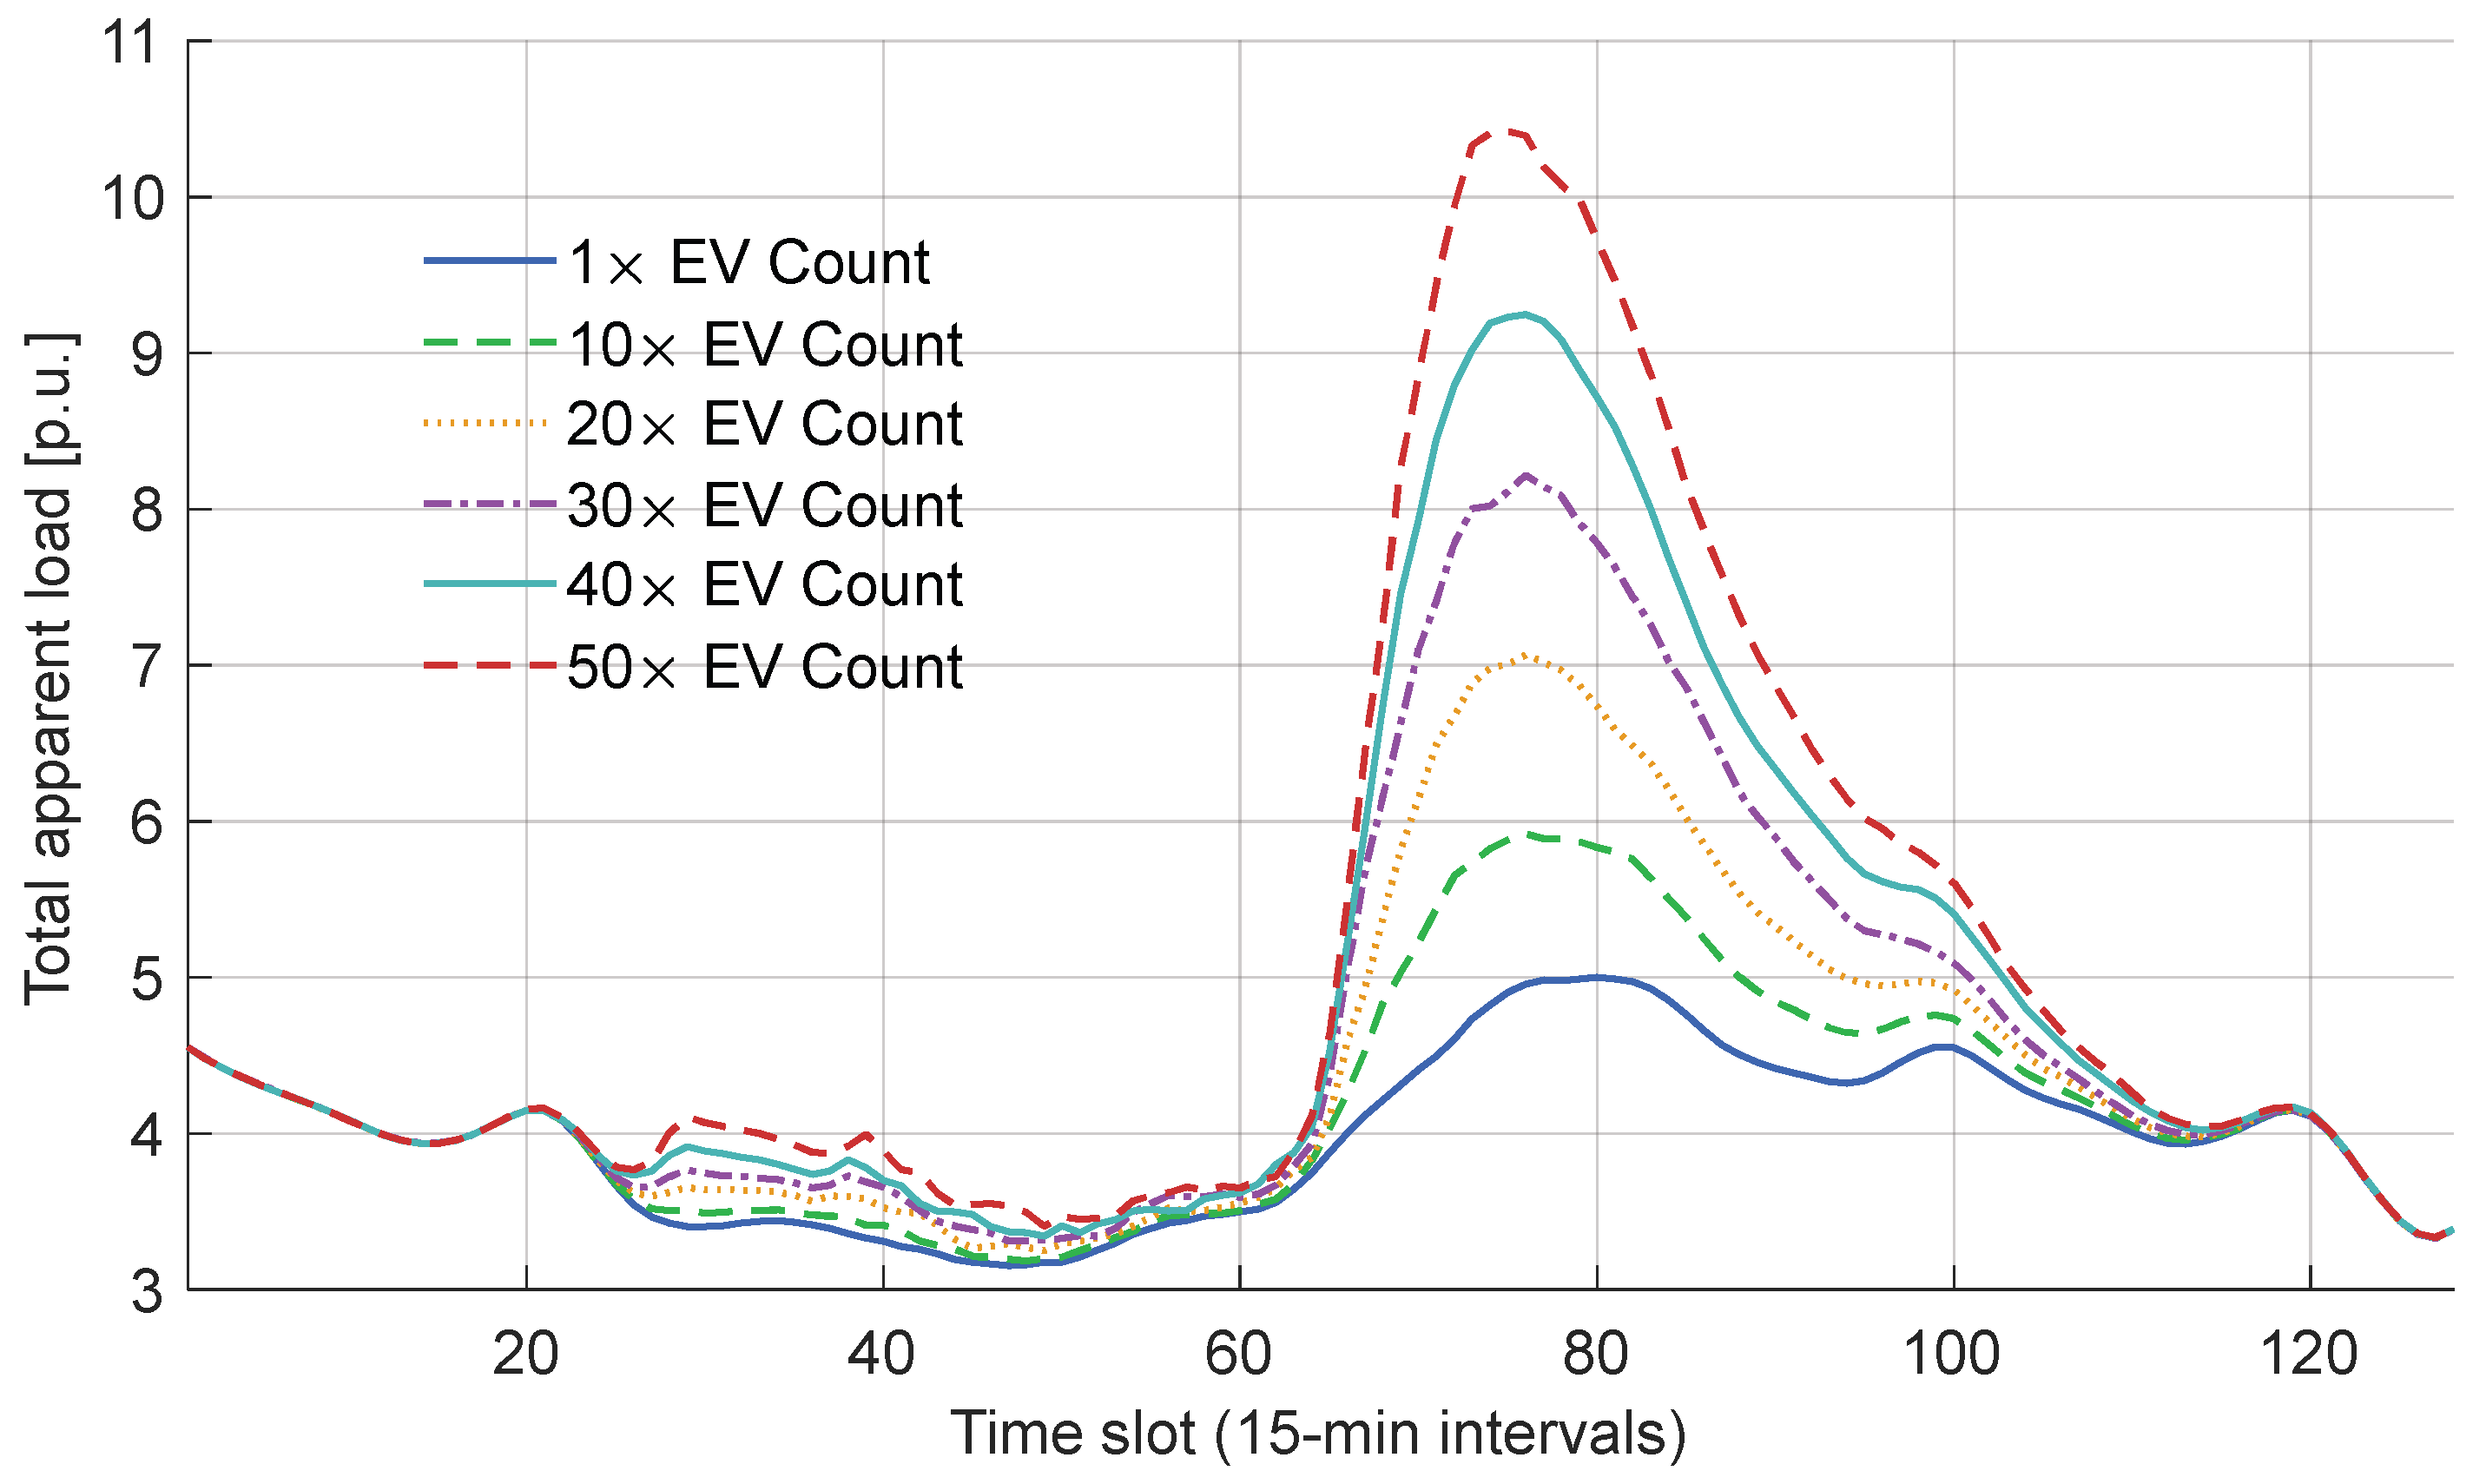
To further verify the effectiveness of the proposed approach, we conducted a sensitivity analysis by varying EV penetration levels using the data in
Table 6.
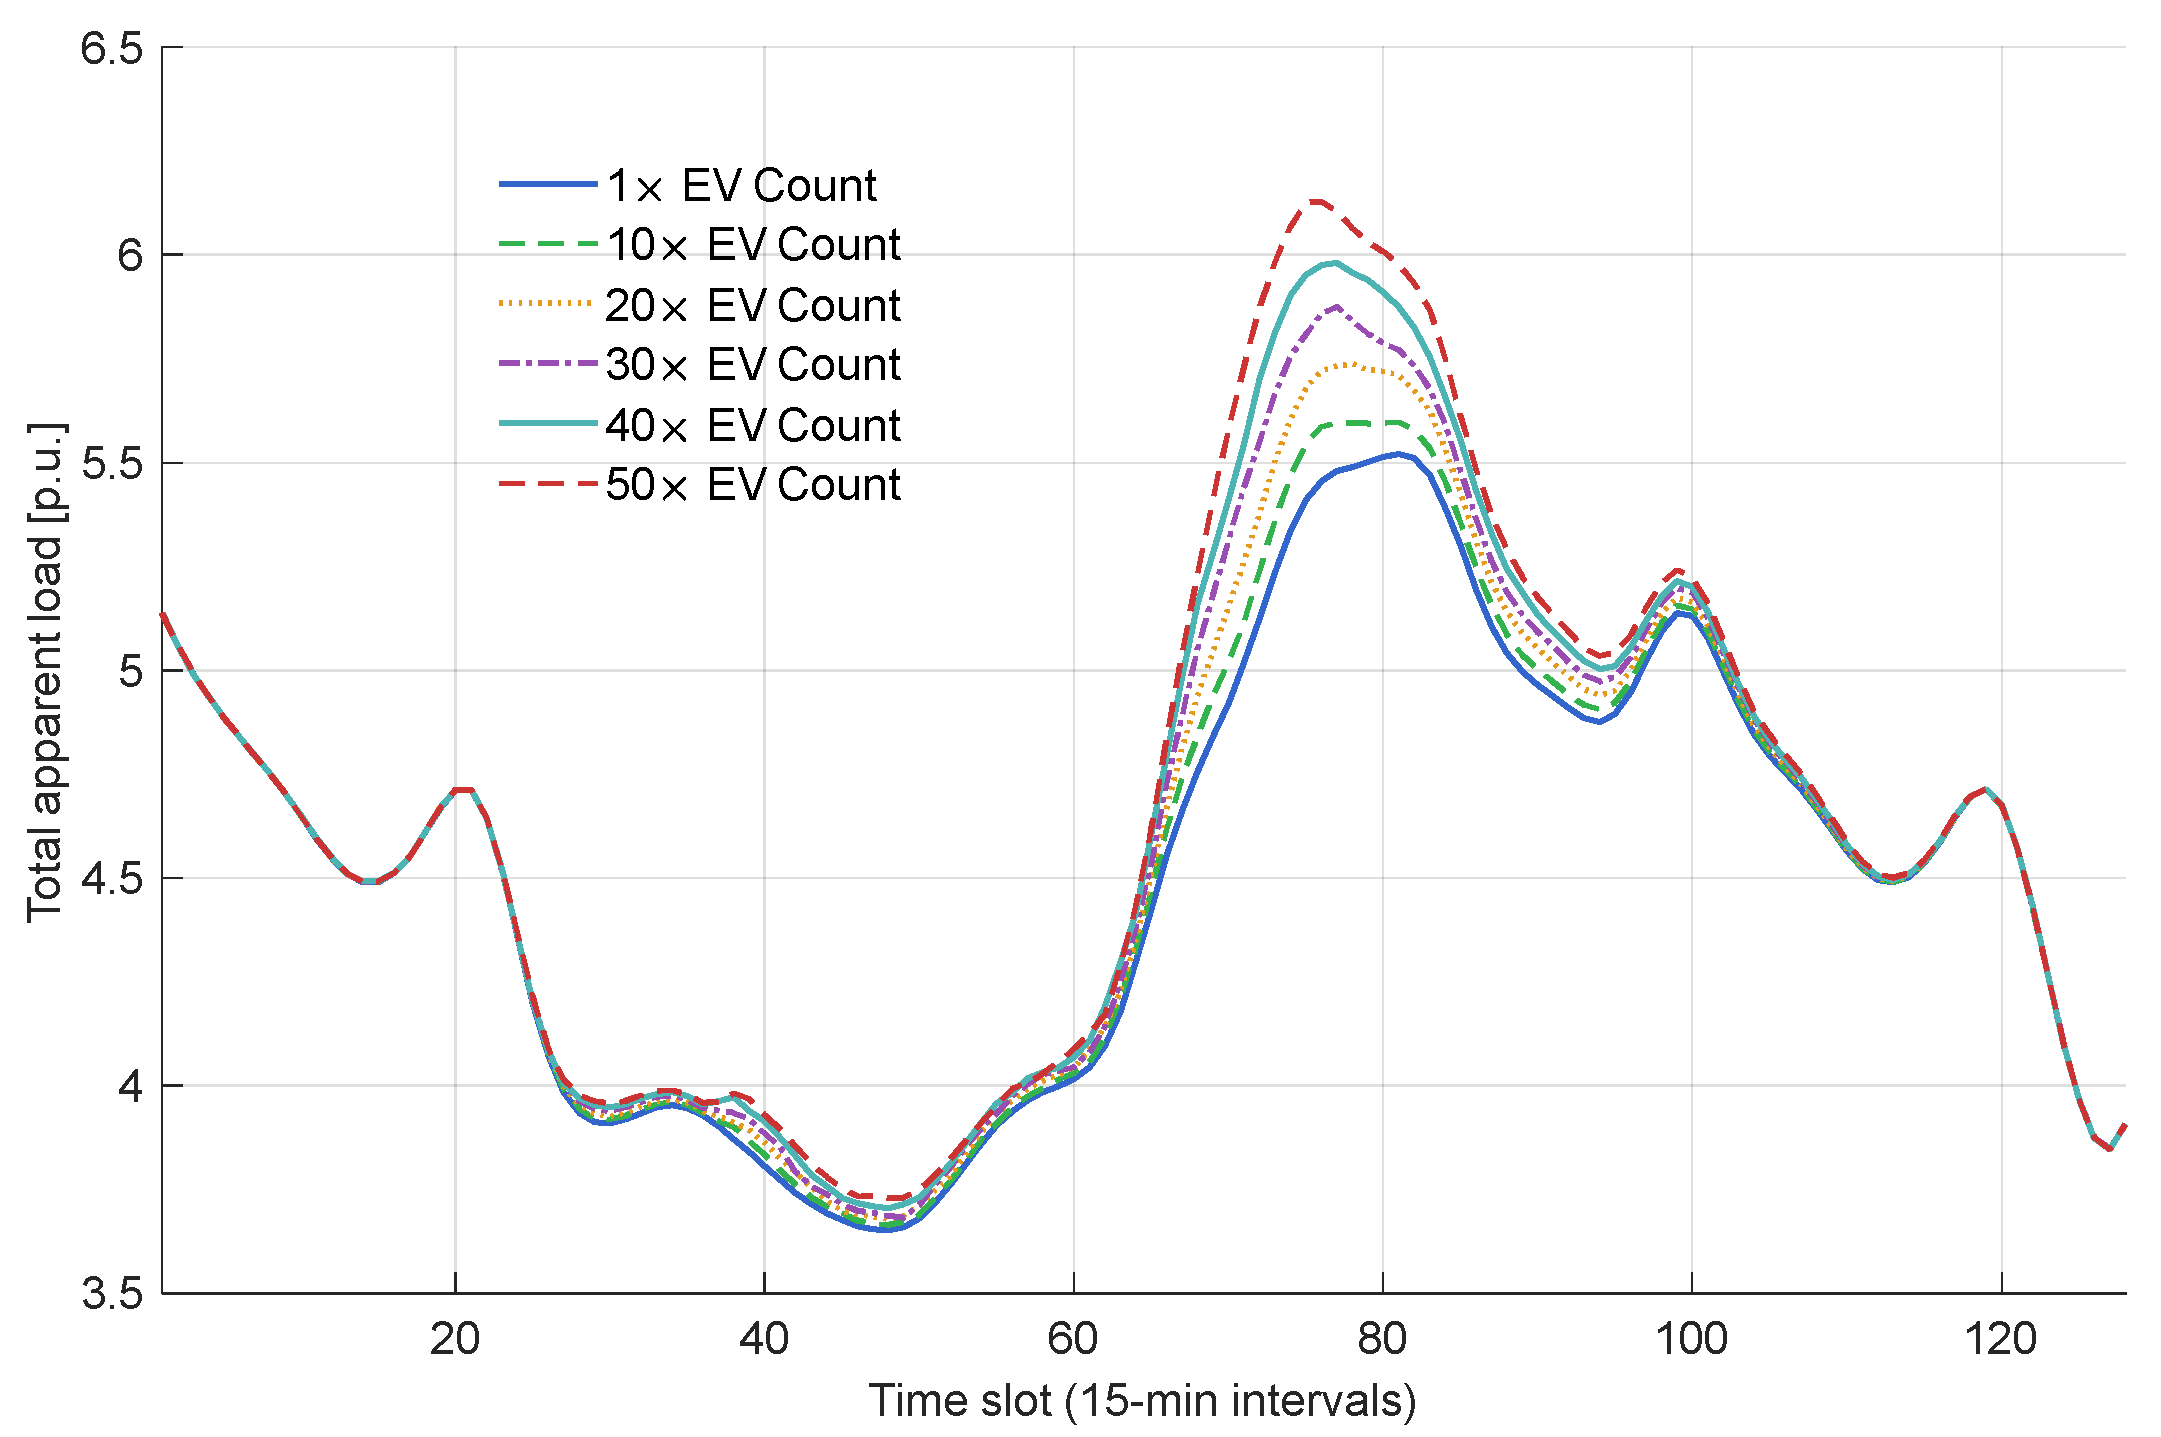
First, we applied the penetration levels to the IEEE 33-bus system; we applied the levels at the same optimal locations. The total daily load curve was analyzed, and results were obtained by simulating the whole system. We did not apply a scheduling algorithm for any of the cases. The results shown in
Figure 21 represent the penetration levels for the simulated 32 h period at 15 min resolution. Clearly, the impact is largely at the evening peak due to the arrival and departure times at EVCSs, which are derived from the PMF discussed earlier.
Similarly, bus voltage and branch power flow deviations are illustrated in
Figure 22 and
Figure 23 as box plots, respectively. Results show that voltage and power deviations remain within limits. This is because the IEEE 33-bus system’s total nominal power is relatively large compared to the added capacity. The black dots in
Figure 23 represent the branches’ thermal limits, set at 130% of the base power flow before adding any EVCSs.
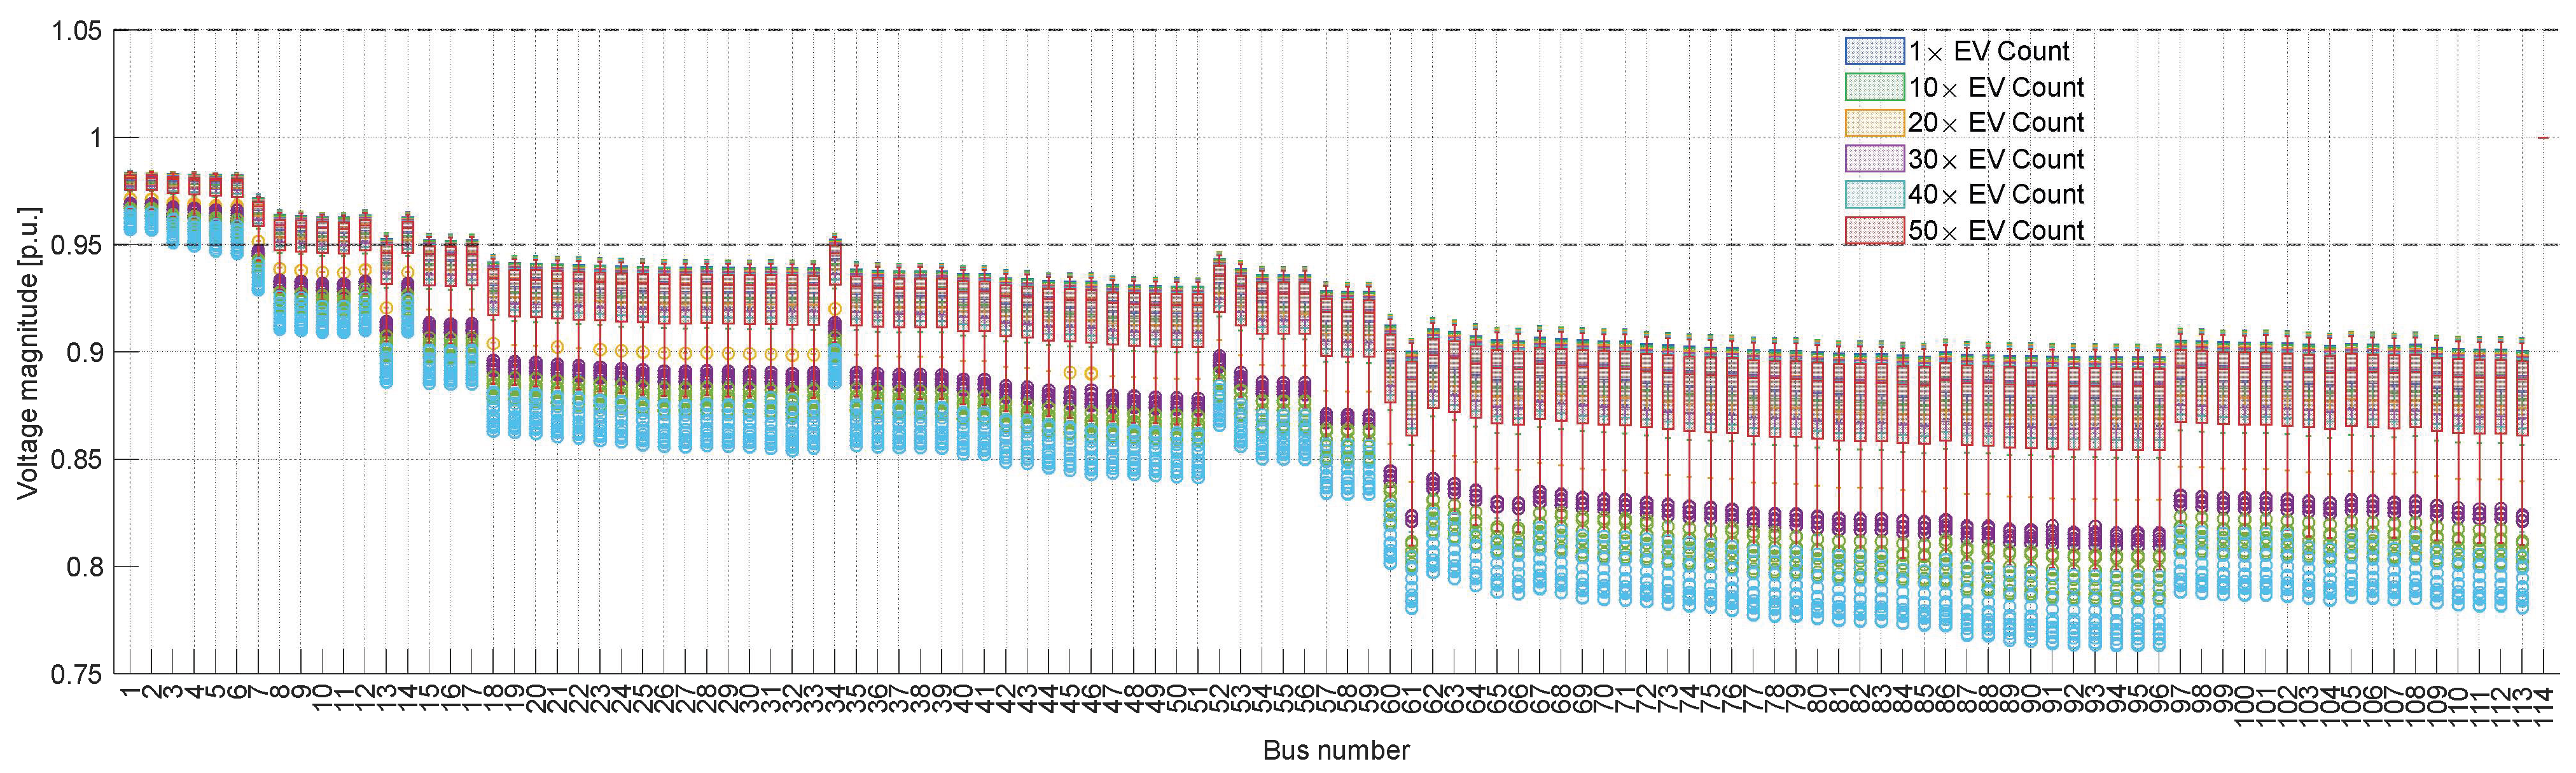
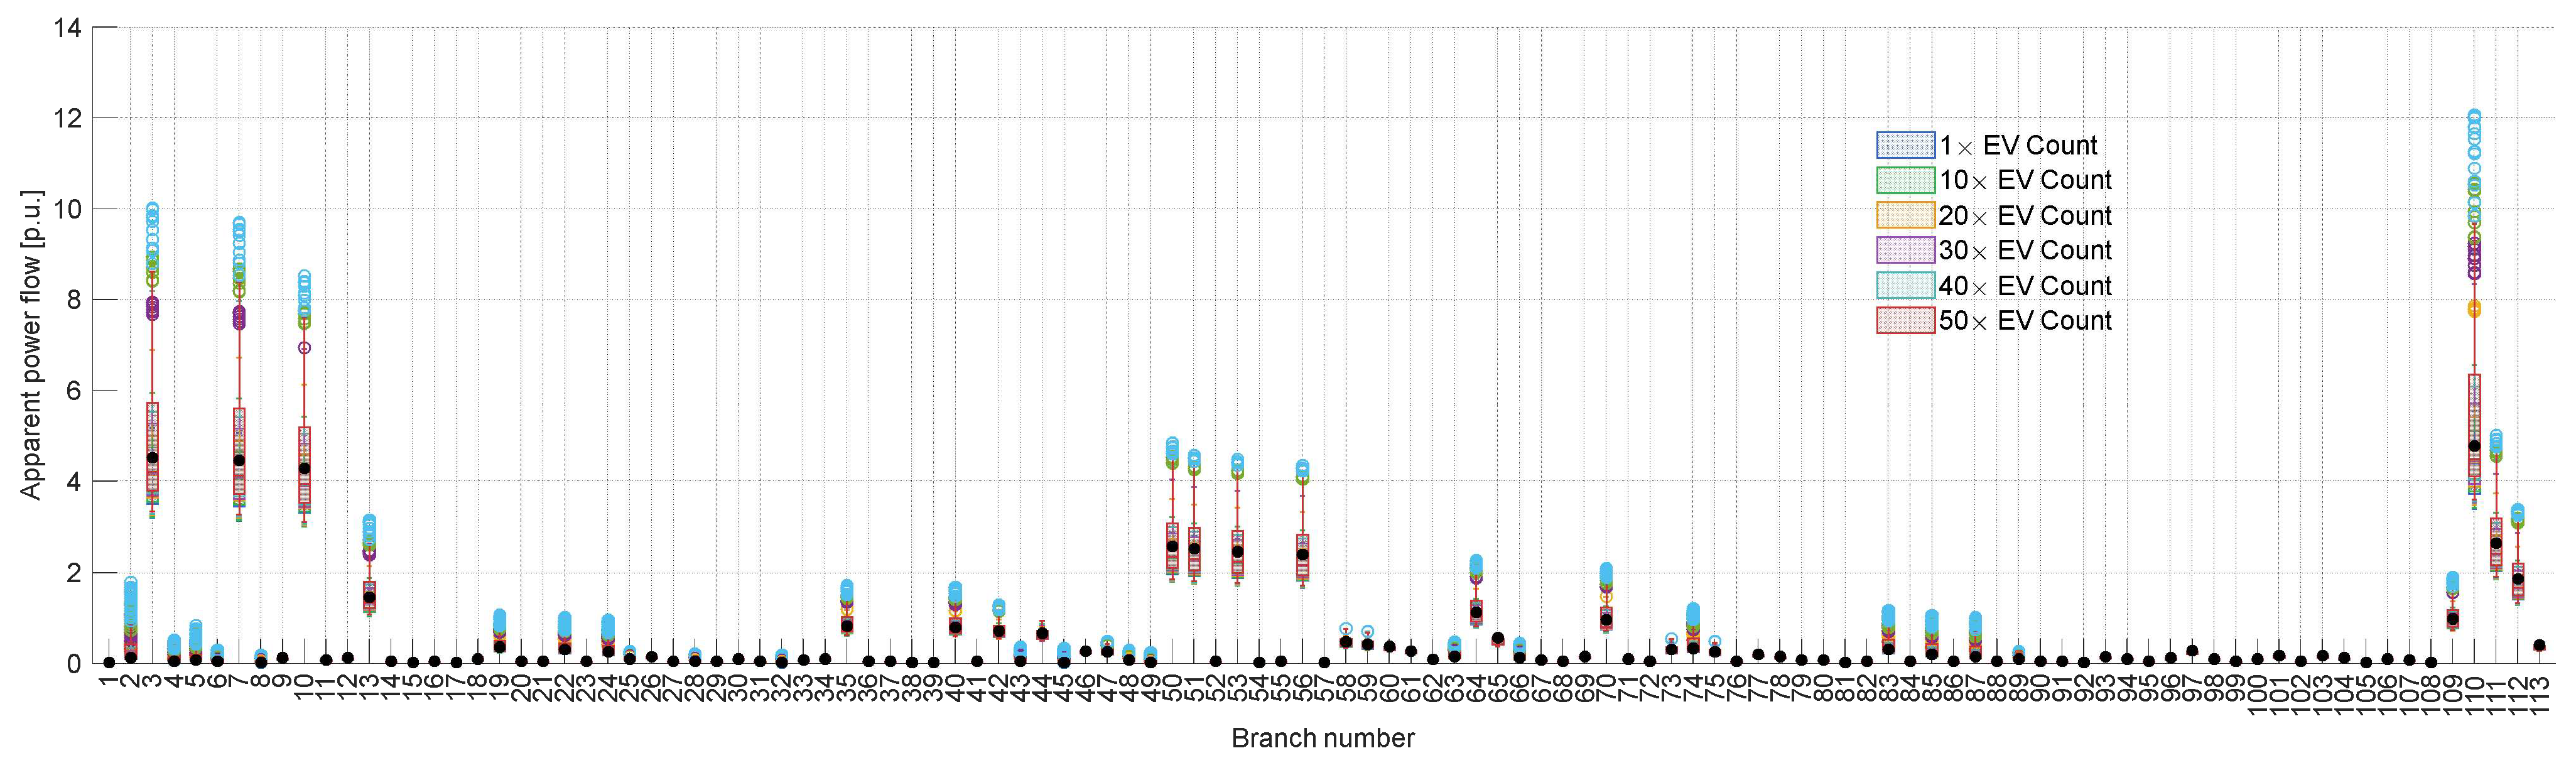
Similarly, for the IEEE 123 system, sensitivity analysis was performed using
Table 6. The daily load curve in
Figure 24 shows that the total added capacity for each case is significantly greater than the test case’s base power. This impact is clearly visible in
Figure 25 and
Figure 26, where, with each additional EVCS, the voltage deviations decrease significantly until they reach low levels relative to the 1 p.u. line shown in the figure. Similarly, for the branches’ power flow, as shown in
Figure 23, power flow deviations across all branches increase significantly as EVCS penetration level increases. Violating the thermal power limits shown in the figure may lead to sequential tripping of the lines if these penetration levels are applied.