1. Introduction
The interaction between demographic change, economic growth, energy use, and environmental pressure is a central issue in sustainable development analysis. Population dynamics influence labor supply, consumption patterns, public expenditure, savings, productivity, food demand, and long-term demand for energy and infrastructure [
1,
2,
3]. At the same time, economic growth may improve welfare and expand productive capacity, but it can also increase pressure on natural resources and carbon dioxide emissions when development remains coupled with fossil energy use, transport demand, industrial expansion, and carbon-intensive production systems [
4,
5]. Understanding these interactions is therefore essential for countries seeking to reconcile income growth with climate mitigation and long-term sustainability.
Colombia offers a relevant case for studying these coupled dynamics. Over recent decades, the country has experienced sustained demographic growth, changes in age structure, and a gradual aging process. These demographic transformations modify the relative size of the young population, the working-age population, and older adults, affecting the demographic dependency structure and the potential labor force. In parallel, Colombia faces the challenge of maintaining economic development while reducing the environmental pressure associated with CO
2 emissions. Although Colombia’s emissions per capita remain lower than those of many industrialized economies, national emissions remain sensitive to changes in economic activity, energy demand, transport, urbanization, industrial development, and production patterns [
6,
7]. This makes Colombia a suitable case for a compact country-level modeling framework that links demographic transition, economic growth, and emissions.
The relationship between population, affluence, technology, and environmental impact has been widely analyzed using the IPAT identity and its stochastic extension, STIRPAT. These approaches decompose environmental pressure into population, income, and technological components, providing a useful framework for evaluating the drivers of emissions [
8,
9,
10]. The Kaya identity has also been widely used to connect CO
2 emissions with population, GDP per capita, energy intensity, and carbon intensity [
11]. In this sense, STIRPAT and Kaya-type formulations provide a consistent basis for developing compact models in which emissions are represented as a function of demographic, economic, and technology-related variables. Recent studies have continued to apply and extend these frameworks to evaluate carbon neutrality, ecological footprint, public transport emissions, and environmental sustainability under different socioeconomic conditions [
12,
13]. Recent studies have also emphasized that carbon-emission dynamics may differ substantially across sectors and territories, particularly when emissions are evaluated from sector-specific and spatial perspectives [
14]. Empirical studies have also examined the relationship between economic growth, energy use, and CO
2 emissions in different national and regional contexts. These studies generally show that economic expansion is frequently associated with higher emissions when improvements in energy efficiency, renewable energy deployment, and decarbonization are insufficient [
4,
15,
16,
17]. However, the strength of this relationship varies across countries and depends on structural factors such as energy mix, productivity, technological change, industrial composition, renewable energy consumption, and policy interventions [
5,
18,
19]. Recent empirical evidence also suggests that technological innovation and renewable energy can moderate the environmental effects of economic activity, reinforcing the importance of combining growth-oriented policies with innovation, environmental regulation, and low-carbon energy transitions [
19]. This implies that emissions trajectories cannot be explained by economic growth alone; they also depend on the capacity of each country to reduce carbon intensity and transform its energy and production systems.
Demographic structure adds an additional layer of complexity to the population–economy–environment relationship. Population size alone does not fully explain economic or environmental trajectories, because the age composition of the population affects labor-force participation, dependency ratios, human capital formation, consumption profiles, health expenditure, and productivity. A growing share of the working-age population may support economic growth through a demographic dividend, while population aging may increase dependency pressures and modify the long-term path of income growth. In Latin America, demographic transition has created temporary windows of opportunity, but the benefits of these transitions depend on the capacity of countries to generate employment, improve education, increase productivity, and strengthen institutions [
20]. For Colombia, this issue is especially relevant because demographic change can simultaneously support economic expansion and increase emissions if growth remains carbon-intensive.
The recent literature has also shown that population aging can influence environmental outcomes. Some studies suggest that aging may modify energy demand, consumption patterns, public expenditure, and emissions through changes in household behavior, labor productivity, and economic structure [
21,
22]. Other works have analyzed the relationship between aging and sectoral carbon emissions, showing that demographic change may affect environmental pressure in different ways depending on production systems and regional characteristics [
23]. These findings support the need to include age structure explicitly when evaluating long-term sustainability pathways, rather than relying only on total population.
System dynamics provides a suitable methodological framework for studying these long-term interactions. This approach represents complex systems through stocks, flows, feedback loops, nonlinear relationships, and time delays, allowing the simulation of alternative trajectories under different assumptions and policy scenarios [
24,
25]. In sustainability and energy-policy research, system dynamics has been used to analyze renewable energy deployment, emissions reduction, energy transitions, transport systems, industrial decarbonization, and resource constraints [
26,
27,
28,
29,
30]. Its main advantage is that it makes explicit the causal structure connecting demographic, economic, technological, and environmental variables, while allowing the evaluation of long-term policy scenarios.
Integrated assessment and energy–economy–environment models have also emphasized the need to represent feedbacks between socioeconomic activity, biophysical constraints, energy availability, and emissions. The MEDEAS modeling framework, for example, integrates global biophysical and socioeconomic constraints to support the analysis of sustainable energy transitions [
31]. Related applications of MEDEAS have explored scenario analysis and sensitivity in the European energy–economy–environment system [
32]. These contributions show the relevance of dynamic and integrated modeling approaches for assessing sustainability pathways under uncertainty. However, many integrated assessment frameworks operate at global or regional scales, while country-level models remain necessary to evaluate national demographic, economic, and environmental trajectories.
In the Colombian context, previous studies have examined the relationship between CO
2 emissions, energy consumption, and GDP [
6], as well as the use of system dynamics to analyze emissions and energy-related scenarios [
33]. Recent studies have also addressed human capital and economic growth in Colombia [
34], smart rural communities and territorial development [
35], and the local nexus between human development and environmental sustainability [
7]. Other works have shown the usefulness of system dynamics for modeling industrial processes and complex socioeconomic systems [
36]. Nevertheless, there is still a need for a compact and empirically calibrated model that explicitly connects demographic age structure, GDP per capita, and CO
2 emissions in a single framework for Colombia. Such a model can help evaluate how demographic transition may affect economic growth and how different productivity and decarbonization assumptions may influence future emissions.
This study addresses that gap by developing a calibrated system dynamics model that integrates three modules: demographic structure, economic growth, and CO2 emissions. The demographic module divides the Colombian population into three age groups: young population aged 0–14, working-age population aged 15–64, and older population aged 65 and above. The economic module links age structure with GDP per capita dynamics, incorporating productivity assumptions and demographic contributions to growth. The environmental module estimates CO2 emissions as a function of population, GDP per capita, and a decarbonization factor based on a Kaya/STIRPAT-type structure. The model is calibrated using historical data for 2000–2023 and then projected to 2050 under five alternative scenarios: low growth, conservative, baseline, optimistic, and transformative.
The main contribution of this paper is threefold. First, it provides a calibrated and reproducible system dynamics framework for analyzing the interaction between demographic transition, economic growth, and CO2 emissions in Colombia. Second, it quantifies the historical fit of each module using standard validation metrics, including root mean square error, mean absolute percentage error, and the coefficient of determination. Third, it evaluates post-2023 scenarios that combine alternative economic-growth assumptions with different levels of decarbonization effort, allowing the identification of trade-offs between income growth and environmental sustainability.
The remainder of this article is organized as follows:
Section 2 describes the data sources, model structure, calibration procedure, and scenario design.
Section 3 presents the calibration results for the demographic, economic, and CO
2 modules, as well as the projections to 2050.
Section 4 discusses the policy implications of the results, including the role of demographic aging, productivity growth, and decarbonization. Finally,
Section 5 summarizes the main conclusions and outlines future research directions.
2. Materials and Methods
This study develops a calibrated system dynamics model to analyze the long-term interaction between demographic transition, economic growth, and CO
2 emissions in Colombia. The model follows an integrated assessment logic in which population dynamics determine the demographic structure, the demographic structure affects GDP per capita growth, and the resulting economic trajectory influences CO
2 emissions through a Kaya/STIRPAT-type formulation. The simulation period covers 2000–2050. Historical data from 2000 to 2023 were used for calibration, while the period 2024–2050 was used for scenario analysis. All simulations, parameter calibration, numerical optimization, and graphical analyses were performed in MATLAB R2024a (The MathWorks, Inc., Natick, MA, USA) (
File S1).
This study develops a calibrated system dynamics model to analyze the long-term interaction between demographic transition, economic growth, and CO2 emissions in Colombia. The model follows an integrated assessment logic in which population dynamics determine the demographic structure, the demographic structure affects GDP per capita growth, and the resulting economic trajectory influences CO2 emissions through a Kaya/STIRPAT-type formulation. The simulation period covers 2000–2050. Historical data from 2000 to 2023 were used for calibration, while the period 2024–2050 was used for scenario analysis.
2.1. Modeling Framework
The model is organized into three interconnected modules: a demographic module, an economic module, and an environmental module. This modular structure follows the logic of system dynamics modeling, where stocks, flows, feedbacks, and time-dependent relationships are used to represent complex socioeconomic and environmental systems [
24,
25,
37,
38]. In this type of model, structural consistency, behavioral reproduction, and validation are important for building confidence in the simulation results [
39,
40]. The environmental specification is also consistent with the IPAT/STIRPAT tradition, in which environmental pressure is represented as a function of population, affluence, and technology-related factors [
10].
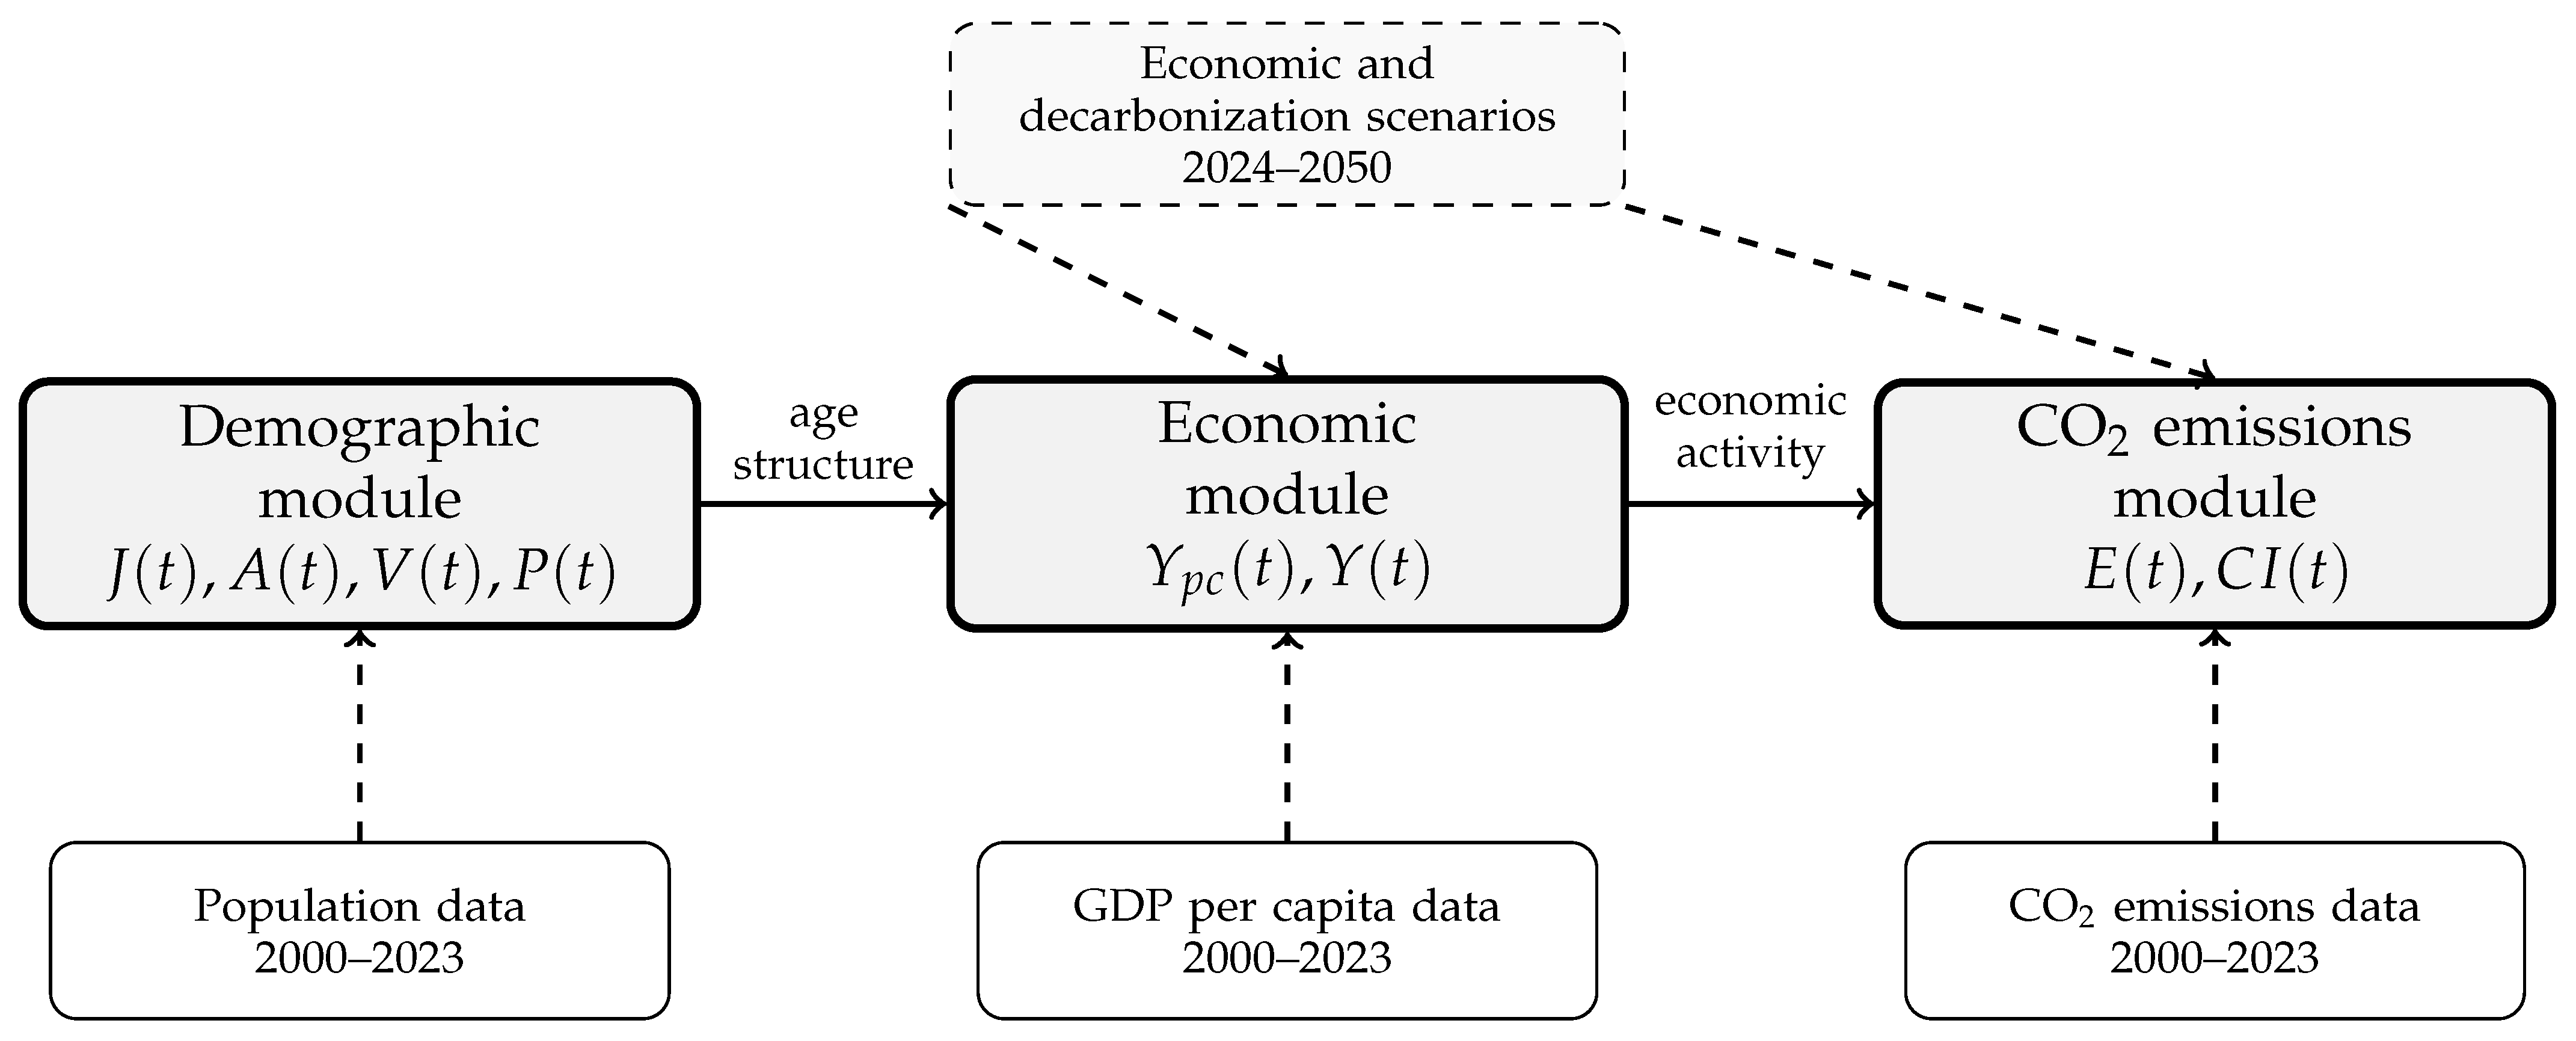
The demographic module estimates the evolution of the Colombian population by age group. The economic module uses the simulated demographic structure as an input to estimate GDP per capita and total GDP. The CO2 emissions module then uses population and GDP per capita to estimate national emissions and carbon intensity. This structure allows the model to evaluate how demographic change and alternative economic-growth pathways may affect future emissions.
The framework does not attempt to reproduce a full energy system but rather provides a compact, country-level integrated model linking demographic transition, income growth, and emissions. This modeling choice is consistent with integrated assessment approaches that connect socioeconomic activity, emissions, energy-transition challenges, and sustainability constraints, while maintaining sufficient transparency for scenario exploration [
31,
32,
41,
42]. Although large integrated assessment models are usually broader in scope, compact models can be useful when the objective is to represent a country-level causal structure and evaluate alternative policy-relevant pathways.
Figure 1 summarizes the conceptual structure of the proposed model.
2.2. Data Sources and Preprocessing
The model was calibrated using annual data for Colombia over the period 2000–2023. The demographic variables were obtained from World Bank indicators, including total population and the population shares aged 0–14, 15–64, and 65 and above [
43]. The economic variable was GDP per capita in constant 2010 US dollars, obtained from the World Bank through the Federal Reserve Economic Data database [
44]. The environmental variable was national CO
2 emissions, expressed in megatonnes, obtained from CountryEconomy/Datosmacro, which reports the World Bank as the original source for the indicator [
45]. Specifically, the series corresponds to the World Bank indicator EN.ATM.CO2E.KT, “CO
2 emissions (kt)”. This indicator measures carbon dioxide emissions from the burning of fossil fuels and the manufacture of cement, including emissions from solid, liquid, and gas fuels and gas flaring. Emissions from land-use change and forestry, such as deforestation-related emissions, are excluded from this indicator. The CO
2 series was also contrasted with publicly available emissions datasets such as Our World in Data/Global Carbon Budget for consistency [
46].
Three groups of variables were used. First, demographic data were organized into total population and three age groups: young population aged 0–14, working-age population aged 15–64, and older population aged 65 and above. Second, economic data were represented by GDP per capita in constant 2010 US dollars. Third, environmental data were represented by national CO
2 emissions in megatonnes. These variables were selected to provide a consistent link between population, income, and emissions.
Table 1 summarizes the data sources used for model calibration.
All time series were converted to annual frequency and aligned by year. Population shares were transformed into absolute age-group populations by multiplying each percentage share by total population. The demographic and economic modules were calibrated independently using historical data. The resulting demographic projections were then used as inputs for the economic module. Finally, the calibrated demographic and economic trajectories were used as inputs for the CO
2 emissions module. This sequential calibration strategy ensures that each module reproduces its corresponding historical variable before being used in long-term scenario simulations. The computational implementation was organized in reproducible scripts, following the broader practice of transparent system dynamics implementation and model reuse [
47].
The main variables included in the integrated model are summarized in
Table 2.
2.3. Demographic Module
The demographic module represents the population of Colombia through three age groups. Let
denote the young population aged 0–14,
the working-age population aged 15–64, and
the older population aged 65 and above. Total population is defined as
The dynamics of the three age groups are given by
where
represents births,
is the transition rate from the young group to the working-age group,
is the transition rate from the working-age group to the older group,
,
, and
are effective mortality rates, and
,
, and
are effective net migration terms for each age group.
Births are modeled as a function of the working-age population:
where
is the effective birth rate per working-age person, so that total births are obtained by multiplying
by the working-age population
. To represent the decline in fertility associated with demographic transition,
is expressed as
where
is the initial effective birth rate,
is the rate of decline, and
is the initial year of the calibration period.
To assess the robustness of the functional form adopted for the effective birth rate, three alternative specifications were compared during the calibration period 2000–2023: linear decline, exponential decline, and logistic decline. Each specification was calibrated using the same three-cohort demographic structure and the same objective function.
The comparison was performed using RMSE, MAPE,
, and AIC for the total population trajectory. As shown in
Table 3, the linear and exponential specifications produced very similar goodness-of-fit values, whereas the logistic specification showed a weaker fit and a higher AIC.
Although the linear form provided a slightly lower RMSE and AIC, the exponential function was retained because it ensures a positive and smooth effective birth rate over the projection horizon and is consistent with the gradual decline typically associated with demographic transition. Therefore, the exponential formulation was considered a parsimonious and structurally appropriate representation of the observed fertility decline in Colombia.
The calibrated demographic parameter vector is
The demographic module should be interpreted as an aggregated system dynamics representation rather than as a full cohort-component demographic model. The parameters in are effective rates calibrated to reproduce the historical behavior of three broad age groups, not detailed age-specific fertility, mortality, or migration schedules. This formulation was adopted to preserve a transparent link between demographic structure, GDP per capita, and CO2 emissions within a compact integrated model. Therefore, the demographic parameters are interpreted as aggregate transition, mortality, and net-migration effects rather than as fully mechanistic demographic estimates.
2.4. Economic Module
The economic module links demographic structure with GDP per capita growth. Let
denote GDP per capita and
total GDP. Total GDP is calculated as
GDP per capita evolves according to
where
is the GDP per capita growth rate. During the calibration period, the growth rate is represented as
In this equation,
is the long-term baseline growth component,
is an initial productivity component,
controls the rate at which the productivity component changes over time, and
,
, and
represent the demographic contributions of the working-age, young, and older population shares, respectively. The age-share terms are specified as deviations from the baseline demographic structure, rather than as independent long-run growth drivers. Therefore, their interpretation is structural and transitional: they capture how changes in the relative shares of young, working-age, and older populations modify the simulated GDP per capita growth path during the demographic transition. These terms should not be interpreted as permanent causal effects of age structure on growth after the demographic composition stabilizes. The term
represents a punctual shock associated with the year 2020:
The 2020 shock was represented as a one-year impulse rather than as a multi-year recovery function because the model was calibrated using observed GDP per capita data through 2023. Therefore, the macroeconomic effects that persisted during 2021–2023 are already incorporated in the historical calibration trajectory. A multi-year recovery function would introduce additional parameters that are difficult to identify robustly with the available annual sample and could increase overfitting. Consequently, the one-year impulse was used only to capture the abrupt discontinuity associated with 2020, while the subsequent recovery dynamics are reflected directly in the observed post-2020 data used for calibration.
In response to the need for greater transparency in the interpretation of the economic module, the calibrated parameters of Equation (
10) were also evaluated using approximate local standard errors. Since the parameters were obtained through nonlinear calibration rather than ordinary least squares, standard errors,
t-values, and 95% confidence intervals were computed from a numerical Jacobian of the simulated GDP per capita trajectory with respect to the estimated parameters. These values should therefore be interpreted as local sensitivity-based approximations rather than as conventional regression inference.
Table 4 reports the resulting estimates. The wide confidence intervals indicate that the individual demographic coefficients are not statistically distinguishable from zero when evaluated separately over the 2000–2023 calibration period. This result suggests that the age-structure terms should be interpreted primarily as structural components of the system dynamics formulation rather than as independently estimated causal effects. Nevertheless, the combined economic module reproduces the historical GDP per capita trajectory with satisfactory accuracy, as shown by the calibration metrics reported in
Section 3.
After calibration, the economic module was used to generate five scenarios for 2024–2050. These scenarios modify the future productivity-growth assumption while preserving the calibrated demographic structure and the estimated demographic contribution to growth.
2.5. CO2 Emissions Module
The environmental module estimates national CO
2 emissions using a Kaya/STIRPAT-type specification, following the idea that emissions can be decomposed into population, affluence, and technology or intensity-related components [
10,
11]. Let
denote CO
2 emissions in megatonnes. Emissions are modeled as
where
is the initial level of CO
2 emissions,
is the initial population,
is the initial GDP per capita,
is the population elasticity of emissions,
is the income elasticity of emissions, and
is the decarbonization or decoupling parameter. The calibrated CO
2 parameter vector is
Because the environmental module is specified as a compact Kaya/STIRPAT-type formulation, the separate identification of the population, income, and time-trend effects was explicitly assessed. In logarithmic form, the historical calibration can be interpreted as
This expression shows that the parameters , , and are estimated from three strongly trending historical regressors. Therefore, an identifiability diagnostic was added to evaluate whether these parameters can be interpreted separately over the 2000–2023 calibration period.
The identifiability diagnostics for the compact CO
2 module are summarized in
Table 5.
The high pairwise correlations and variance inflation factors indicate that the individual parameters of the compact CO
2 module are weakly identified in the historical sample. Consequently, the estimated values of
,
, and
should not be interpreted as independent causal elasticities, but as parameters of a compact aggregate emissions representation used for scenario exploration. Carbon intensity is calculated as
For the scenario period, the calibrated elasticities and are kept fixed, while alternative decarbonization assumptions are introduced through scenario-specific values of . These scenario-specific values of are not estimated parameters and should not be interpreted as forecasts. They are exploratory assumptions representing alternative levels of additional decoupling effort. Therefore, the emissions projections are conditional on the assumed values of .
2.6. Calibration Procedure and Goodness-of-Fit Metrics
The calibration procedure was carried out sequentially. First, the demographic module was calibrated using observed population data for 2000–2023. Second, the economic module was calibrated using GDP per capita data over the same period, with the calibrated demographic variables as inputs. Third, the CO2 emissions module was calibrated using historical emissions, population, and GDP per capita.
The calibration and validation strategy follows standard practices in system dynamics modeling, where model confidence is built through structural plausibility, dimensional consistency, historical behavior reproduction, and sensitivity to assumptions [
39,
40]. In this study, historical behavior reproduction was evaluated quantitatively using goodness-of-fit indicators, while the structural logic of the model was defined through the interaction between demographic, economic, and emissions modules.
For each module, the parameter vector was estimated by minimizing the discrepancy between observed and simulated values. The general objective function was defined as the root mean square error between observed and simulated series:
where
is the observed value,
is the simulated value obtained with parameter vector
, and
n is the number of historical observations.
Model performance was evaluated using the root mean square error (RMSE), the mean absolute percentage error (MAPE), and the coefficient of determination (
). These metrics are defined as
and
These metrics were used to assess the historical fit of the demographic, economic, and CO2 emissions modules before applying the model to the scenario period.
2.7. Scenario Design
After calibration, the model was projected from 2024 to 2050 under five alternative scenarios. Scenario analysis is commonly used in system dynamics and integrated assessment modeling to explore plausible future pathways rather than to predict a single deterministic future [
24,
31,
32,
41]. The scenarios were designed to represent different combinations of economic-growth assumptions and decarbonization efforts. The same demographic projection was used across all scenarios, while the economic and environmental assumptions varied by scenario.
The five scenarios were defined as follows: low growth, conservative, baseline, optimistic, and transformative. The low-growth scenario represents weak productivity performance and limited decarbonization. The conservative scenario assumes modest productivity improvements and moderate emissions reduction efforts. The baseline scenario represents an intermediate trajectory. The optimistic scenario assumes stronger productivity gains and more ambitious decarbonization. Finally, the transformative scenario represents a pathway with higher productivity growth and stronger decoupling between income and emissions.
The qualitative description of the post-2023 scenarios is presented in
Table 6. The scenario analysis does not aim to predict a single future trajectory. Instead, it explores how alternative assumptions regarding productivity and decarbonization modify GDP per capita, total GDP, CO
2 emissions, cumulative emissions, and carbon intensity by 2050.
3. Results
This section presents the calibration and scenario results of the integrated system dynamics model. The results are organized according to the three model components: demographic dynamics, economic growth, and CO2 emissions. First, the historical calibration performance is reported for each module. Second, the calibrated model is projected to 2050. Finally, the five post-2023 scenarios are compared in terms of GDP per capita, total GDP, CO2 emissions, cumulative emissions, and carbon intensity.
3.1. Historical Calibration Performance
Table 7 summarizes the calibration performance of the three model modules over the historical period 2000–2023. The demographic module achieved the strongest fit, particularly for total population and working-age population. The economic module also reproduced the historical GDP per capita trajectory with a satisfactory level of accuracy. The CO
2 emissions module presented a lower coefficient of determination than the demographic and economic modules, which is expected given the higher variability of national emissions and their dependence on additional factors not explicitly represented in the compact model, such as energy mix, transport structure, sectoral activity, and technological change.
The calibration results indicate that the model captures the main historical trends of Colombia’s demographic and economic trajectories. The total population calibration achieved a MAPE of 1.05% and an of 0.9772, while the working-age population presented the highest fit, with a MAPE of 0.60% and an of 0.9957. The older population showed a higher error, with a MAPE of 10.44%, reflecting the difficulty of representing accelerated aging with a compact three-cohort structure. The economic module achieved a MAPE of 3.06% and an of 0.9498 for GDP per capita. The CO2 module obtained a MAPE of 7.20% and an of 0.7410, which is acceptable for a national-level compact emissions model.
3.2. Demographic Calibration and Projection
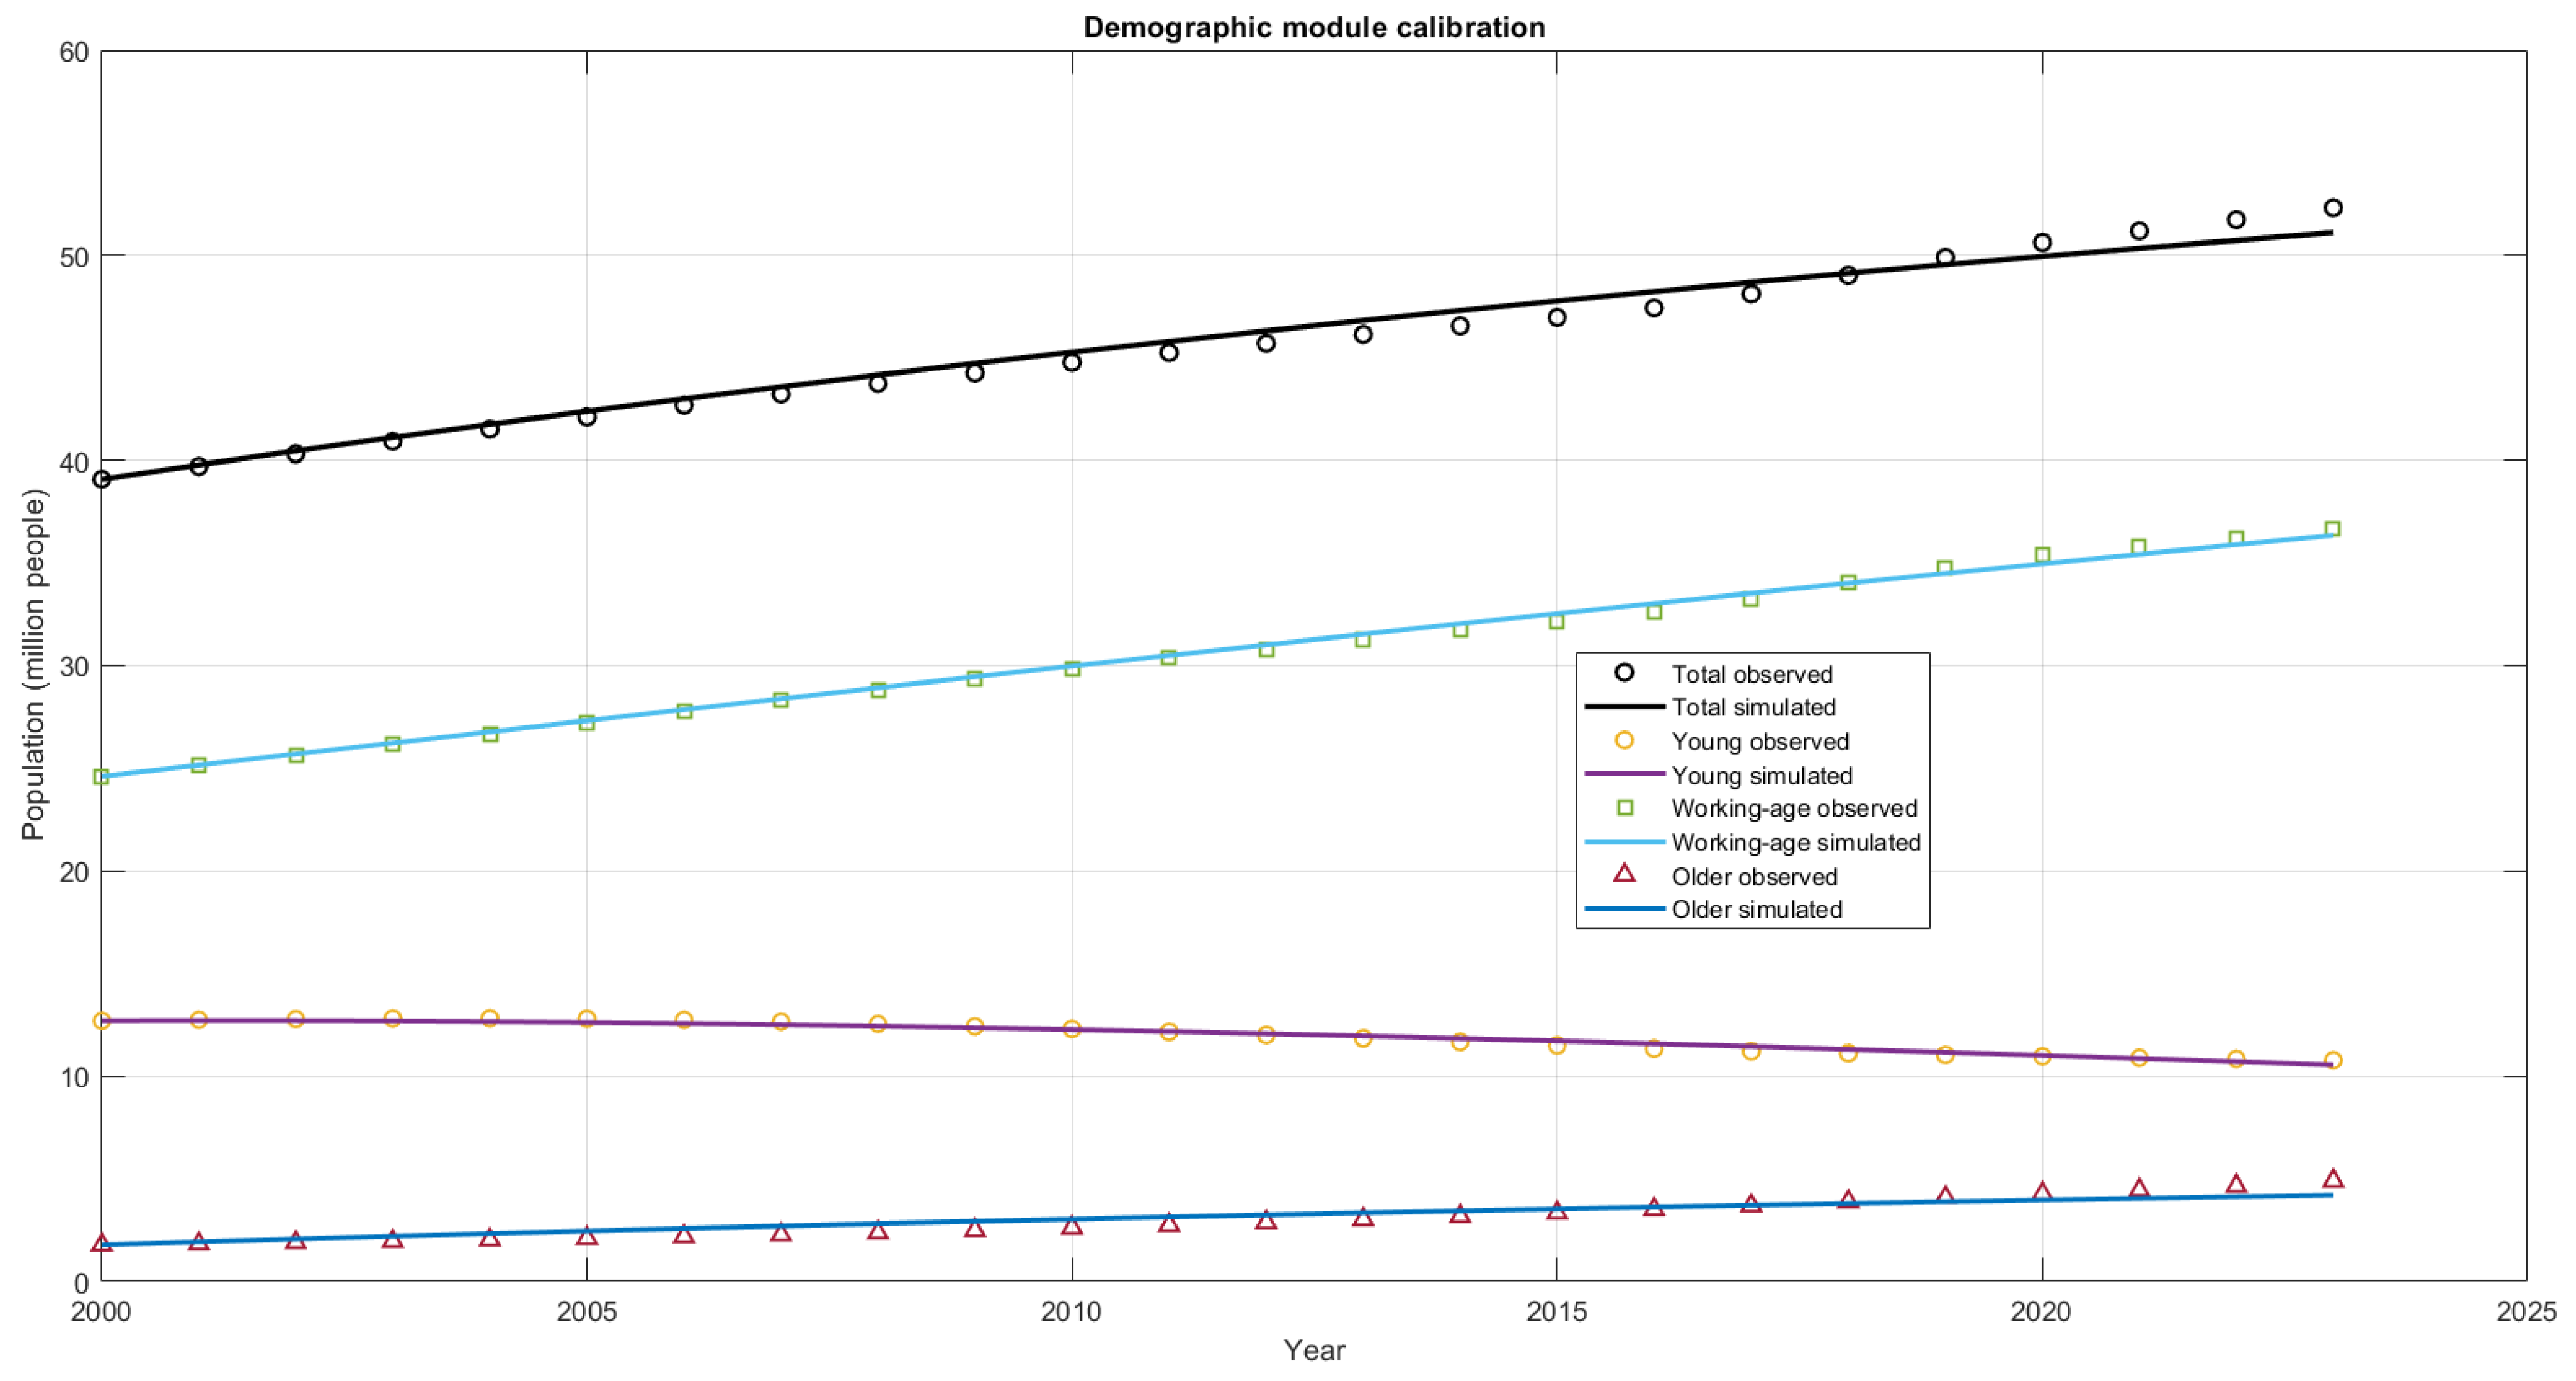
Figure 2 shows the observed and simulated demographic trajectories for Colombia during the calibration period. The model reproduces the total population and the working-age population with high accuracy. The young population follows the observed declining tendency, while the older population increases over time, reflecting the progressive aging process.
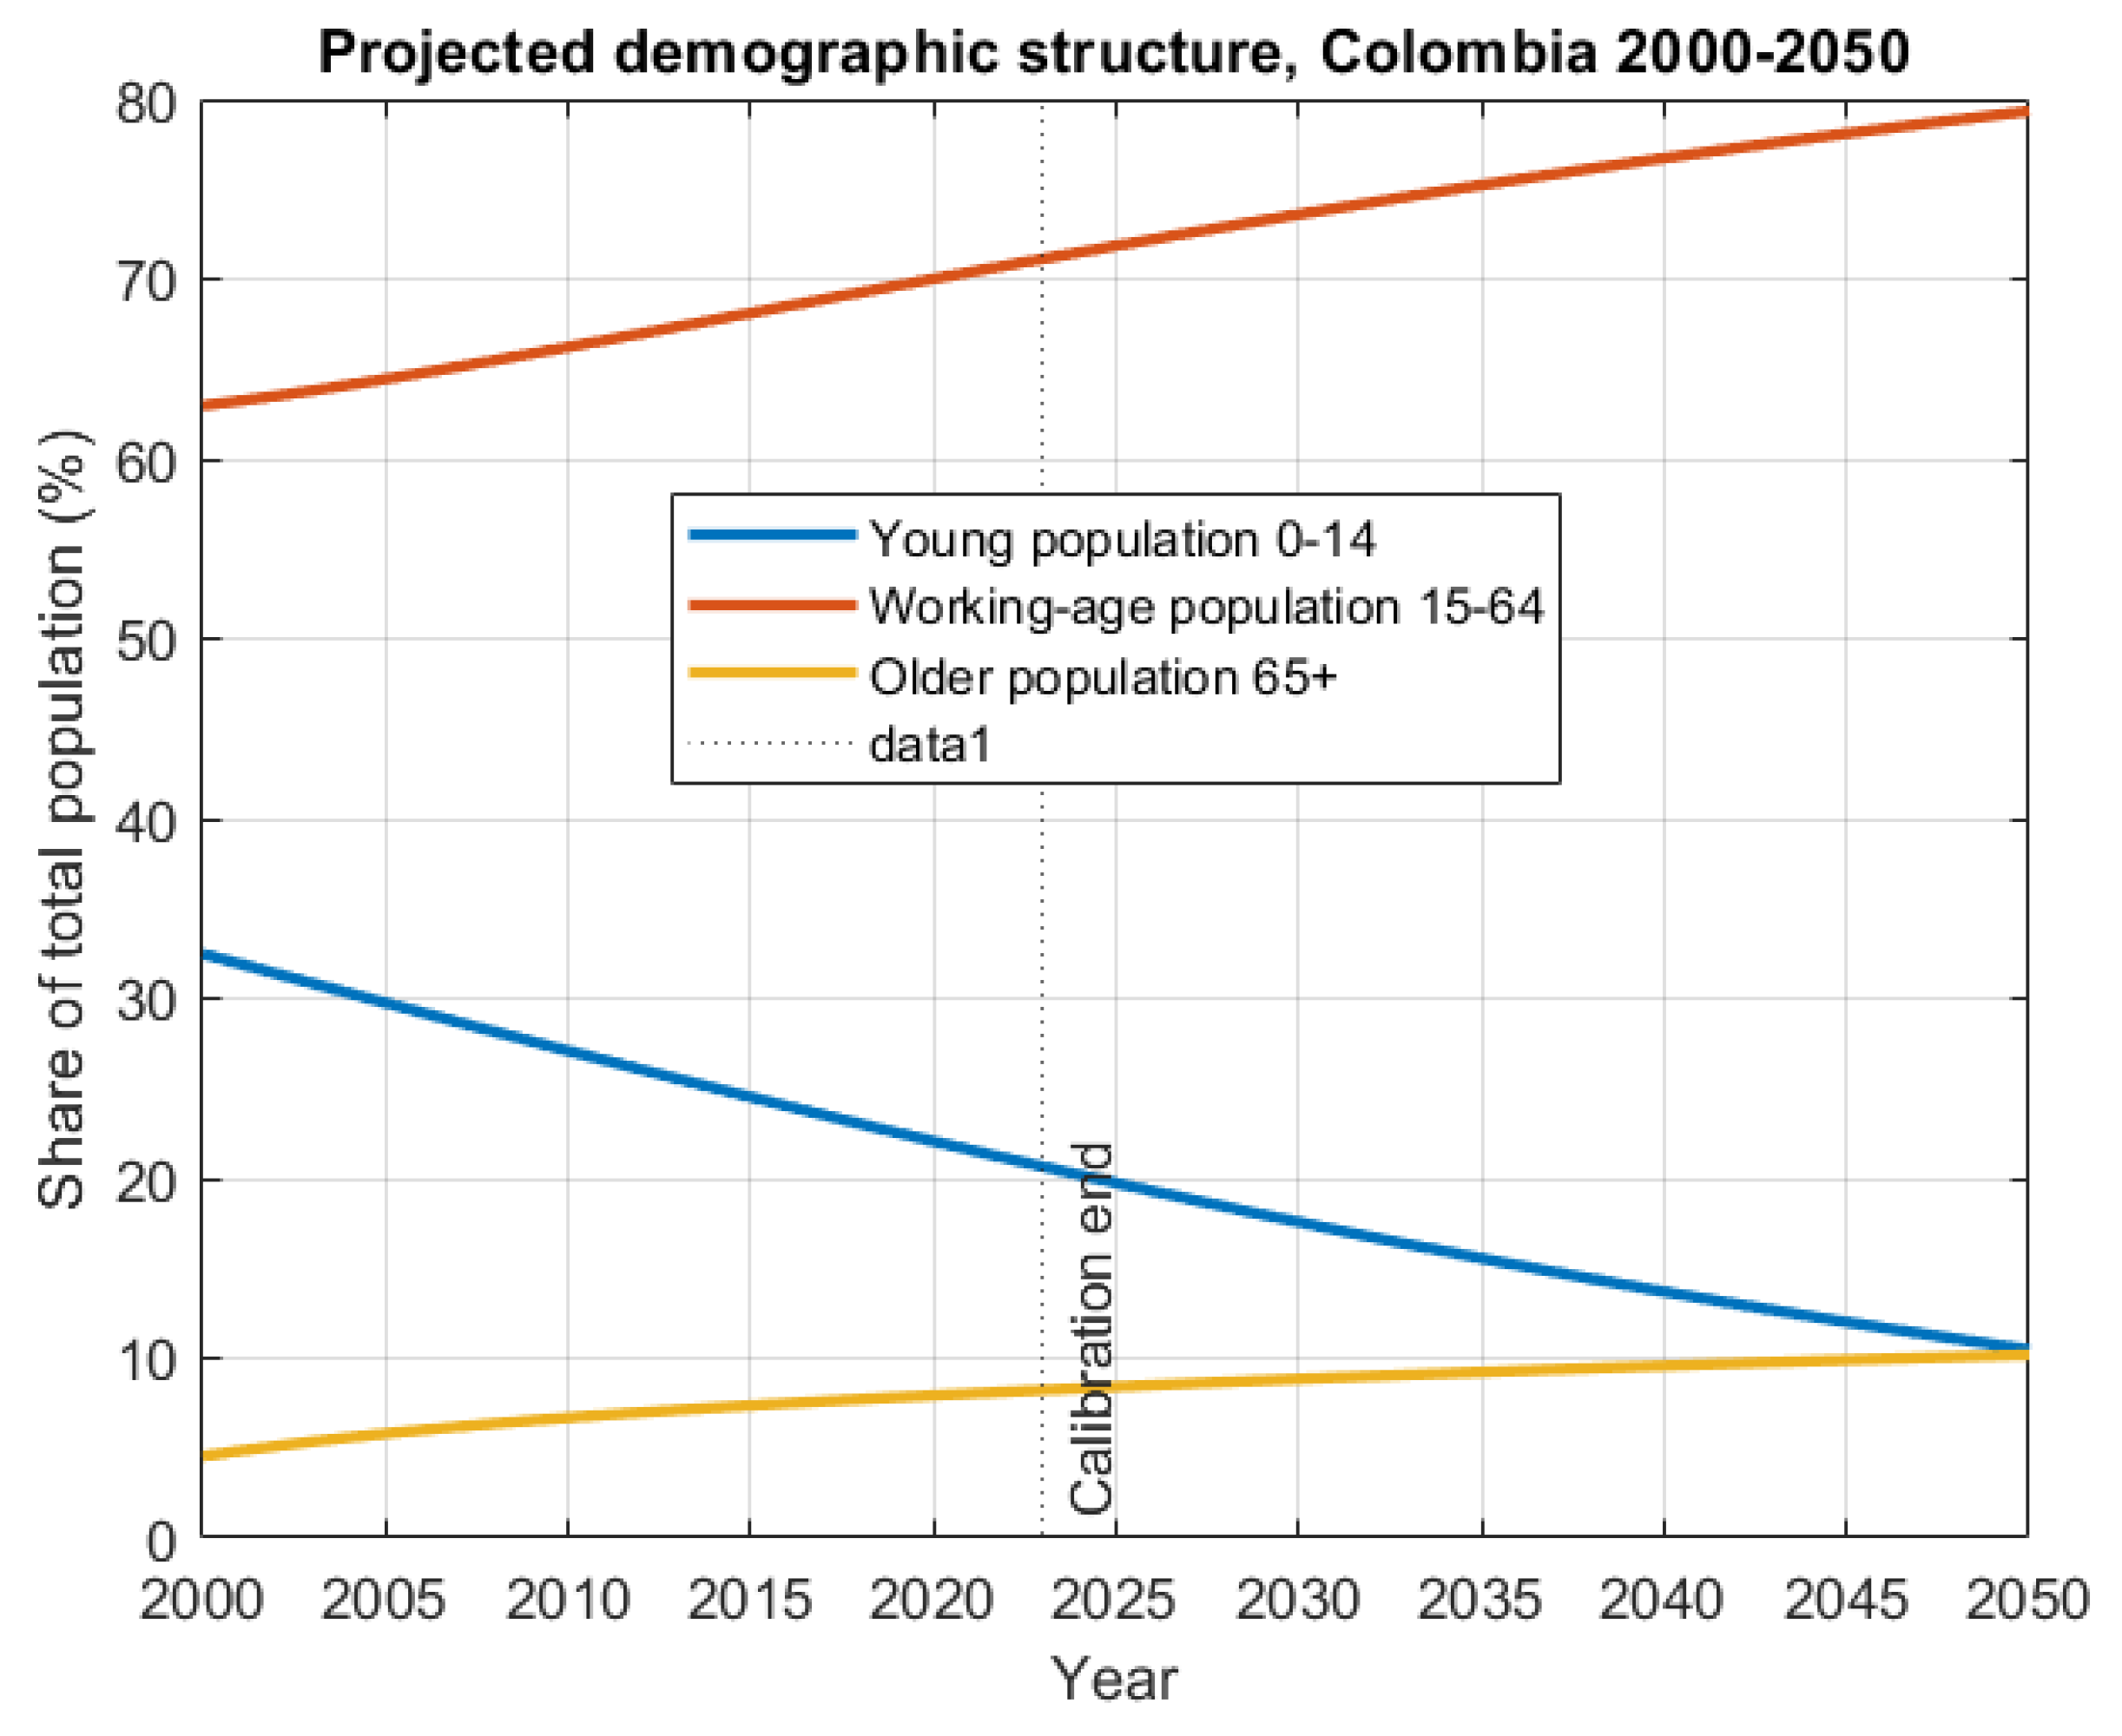
Using the calibrated demographic parameters, the model was simulated up to 2050. The baseline demographic projection for Colombia in 2050 is presented in
Table 8.
The results indicate that Colombia’s total population reaches 57.68 million people by 2050. The working-age population remains the largest group, with 45.75 million people, while the older population increases to 5.88 million people.
Figure 3 shows the observed, calibrated, and projected total population. The projection suggests a moderate demographic expansion between 2024 and 2050, accompanied by changes in age composition that become relevant for the economic module.
3.3. Economic Calibration and Scenario Results
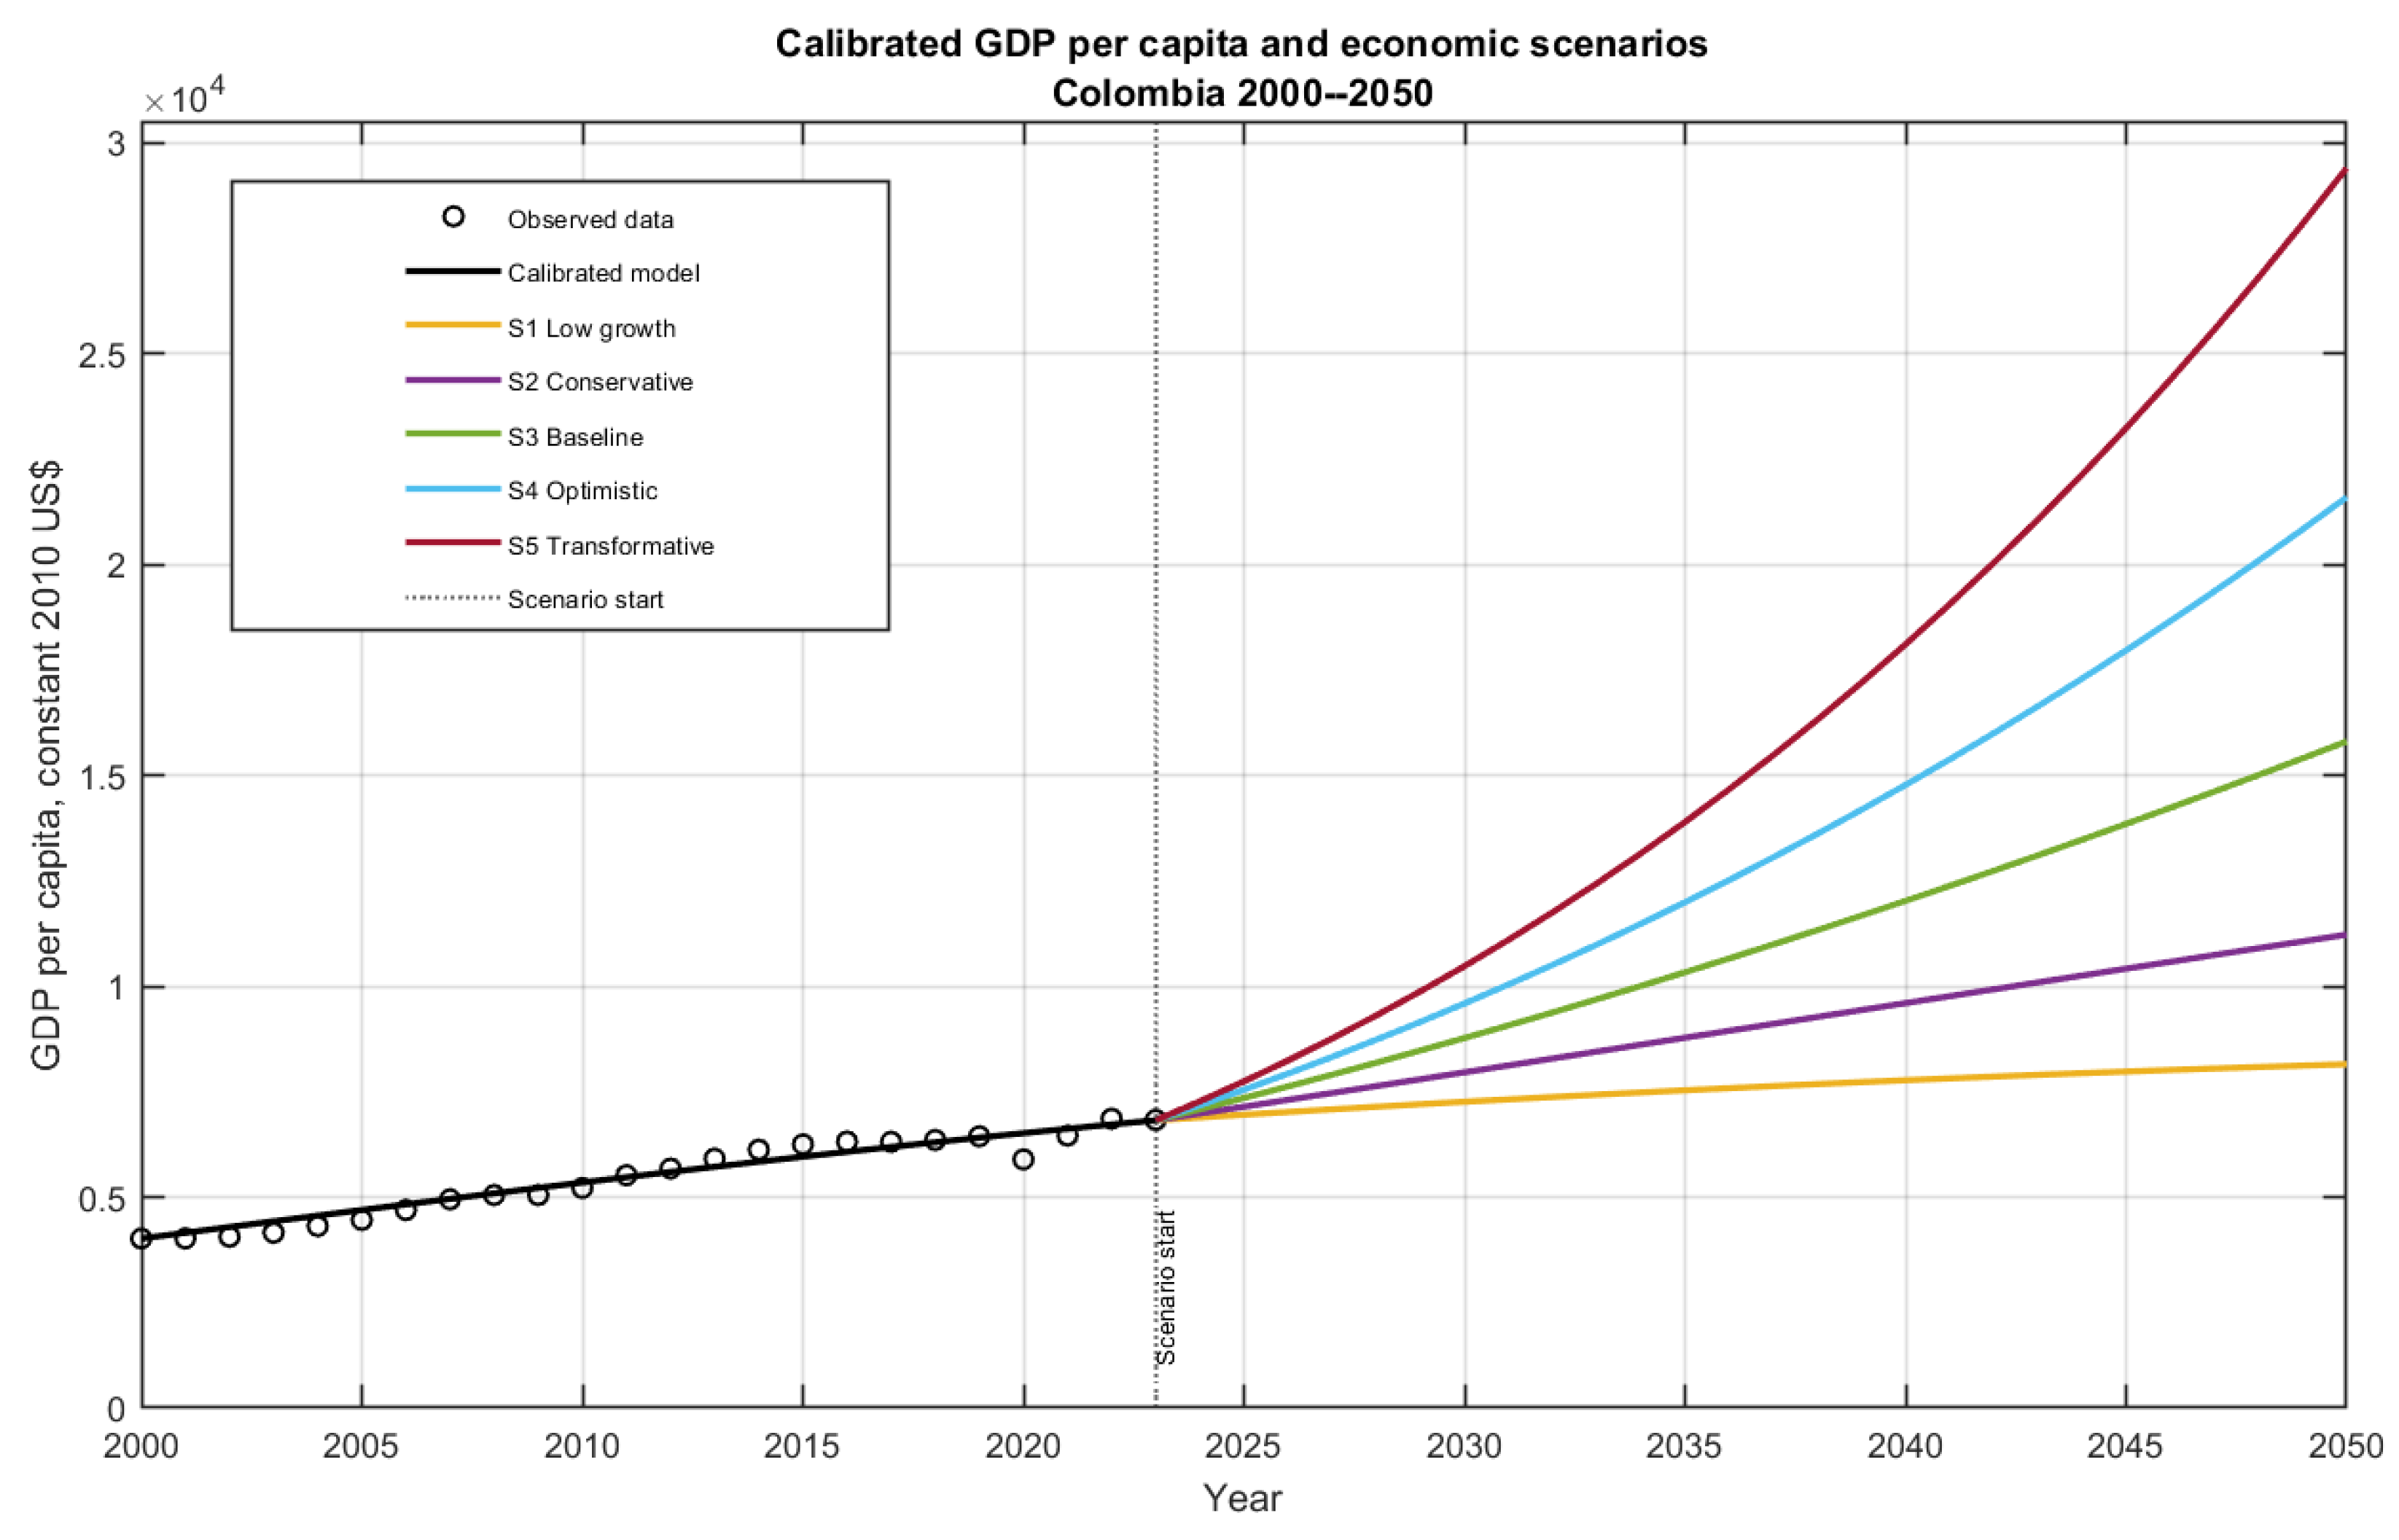
The economic module was calibrated using GDP per capita data over the period 2000–2023. The calibration achieved a MAPE of 3.06% and an of 0.9498, indicating that the model reproduces the historical trajectory of GDP per capita with satisfactory accuracy. After calibration, five economic scenarios were simulated for the period 2024–2050. These scenarios modify the future productivity-growth assumption while preserving the calibrated demographic structure.
Figure 4 presents the calibrated GDP per capita trajectory and the five post-2023 scenarios. The scenarios show a wide range of possible economic pathways. The low-growth scenario remains close to a slow-growth trajectory, while the transformative scenario reflects sustained productivity improvements. The baseline scenario represents an intermediate pathway between conservative and optimistic assumptions.
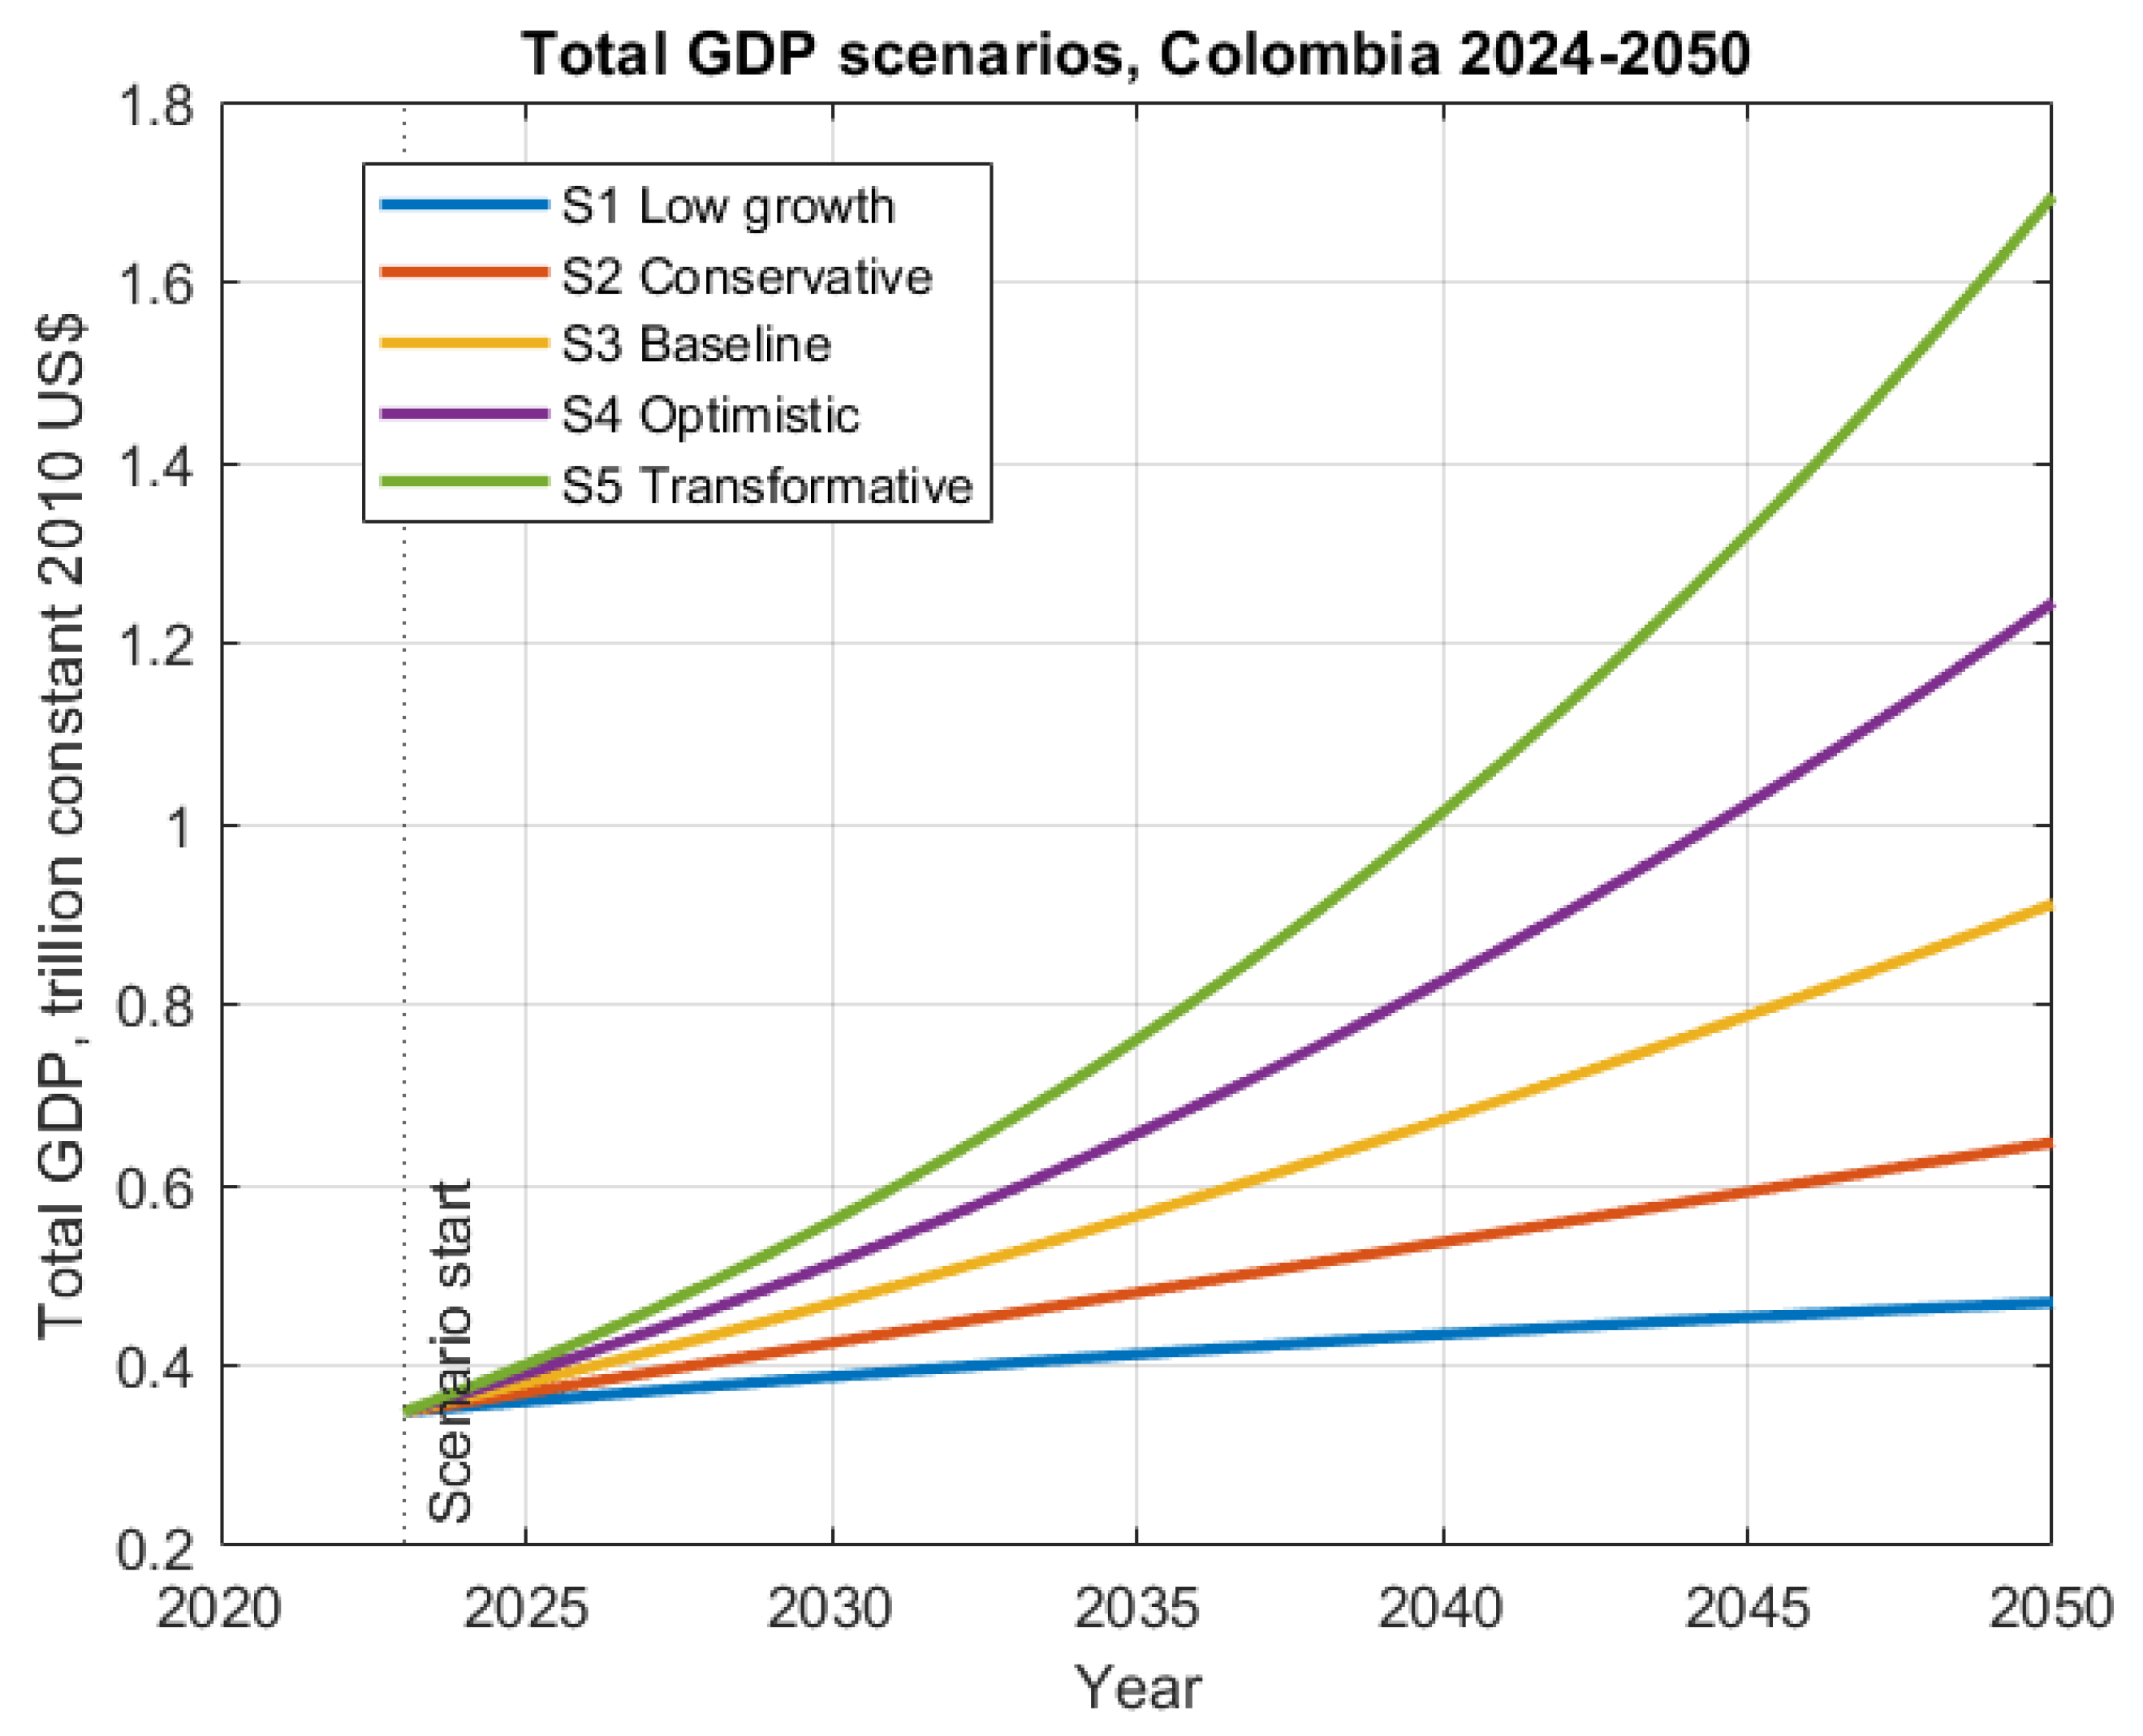
Table 9 summarizes the economic scenario results for 2050. GDP per capita ranges from 8148.2 constant 2010 US dollars in the low-growth scenario to 29392.0 constant 2010 US dollars in the transformative scenario. Total GDP ranges from 0.4699 to 1.6952 trillion constant 2010 US dollars. The demographic component in 2050 is negative across scenarios, indicating that population aging creates a modest downward pressure on GDP per capita growth. However, this effect is offset in higher-growth scenarios by stronger productivity assumptions.
Figure 5 shows the total GDP trajectories under the five scenarios. The divergence between scenarios becomes more pronounced after 2030 due to the cumulative effect of annual growth differences. This result highlights the importance of productivity assumptions for long-term economic projections.
3.4. CO2 Emissions Calibration and Scenario Results
The CO
2 emissions module was calibrated using observed national emissions for 2000–2023. The estimated parameters were
,
, and
. The boundary estimates obtained for
and
should be interpreted with caution. The identifiability diagnostics reported in
Table 5 show that population, GDP per capita, and the time trend are highly collinear during the 2000–2023 calibration period. Therefore, the result
does not imply that population is physically or economically irrelevant for emissions. Rather, it indicates that, within this compact specification and historical sample, the optimizer assigns most of the explainable variation to GDP per capita while the separate effects of population and autonomous decarbonization are weakly identified.
As an additional robustness check, an alternative specification based on total GDP was calibrated to reduce the forced separation between population and GDP per capita. The alternative total-GDP specification achieved a similar historical fit, with RMSE = 6.51, MAPE = 7.57%, and , compared with RMSE = 6.27, MAPE = 7.20%, and for the original compact Kaya/STIRPAT specification. This comparison supports the interpretation of the environmental module as a compact scenario-oriented representation rather than a fully identified causal decomposition of emissions drivers.
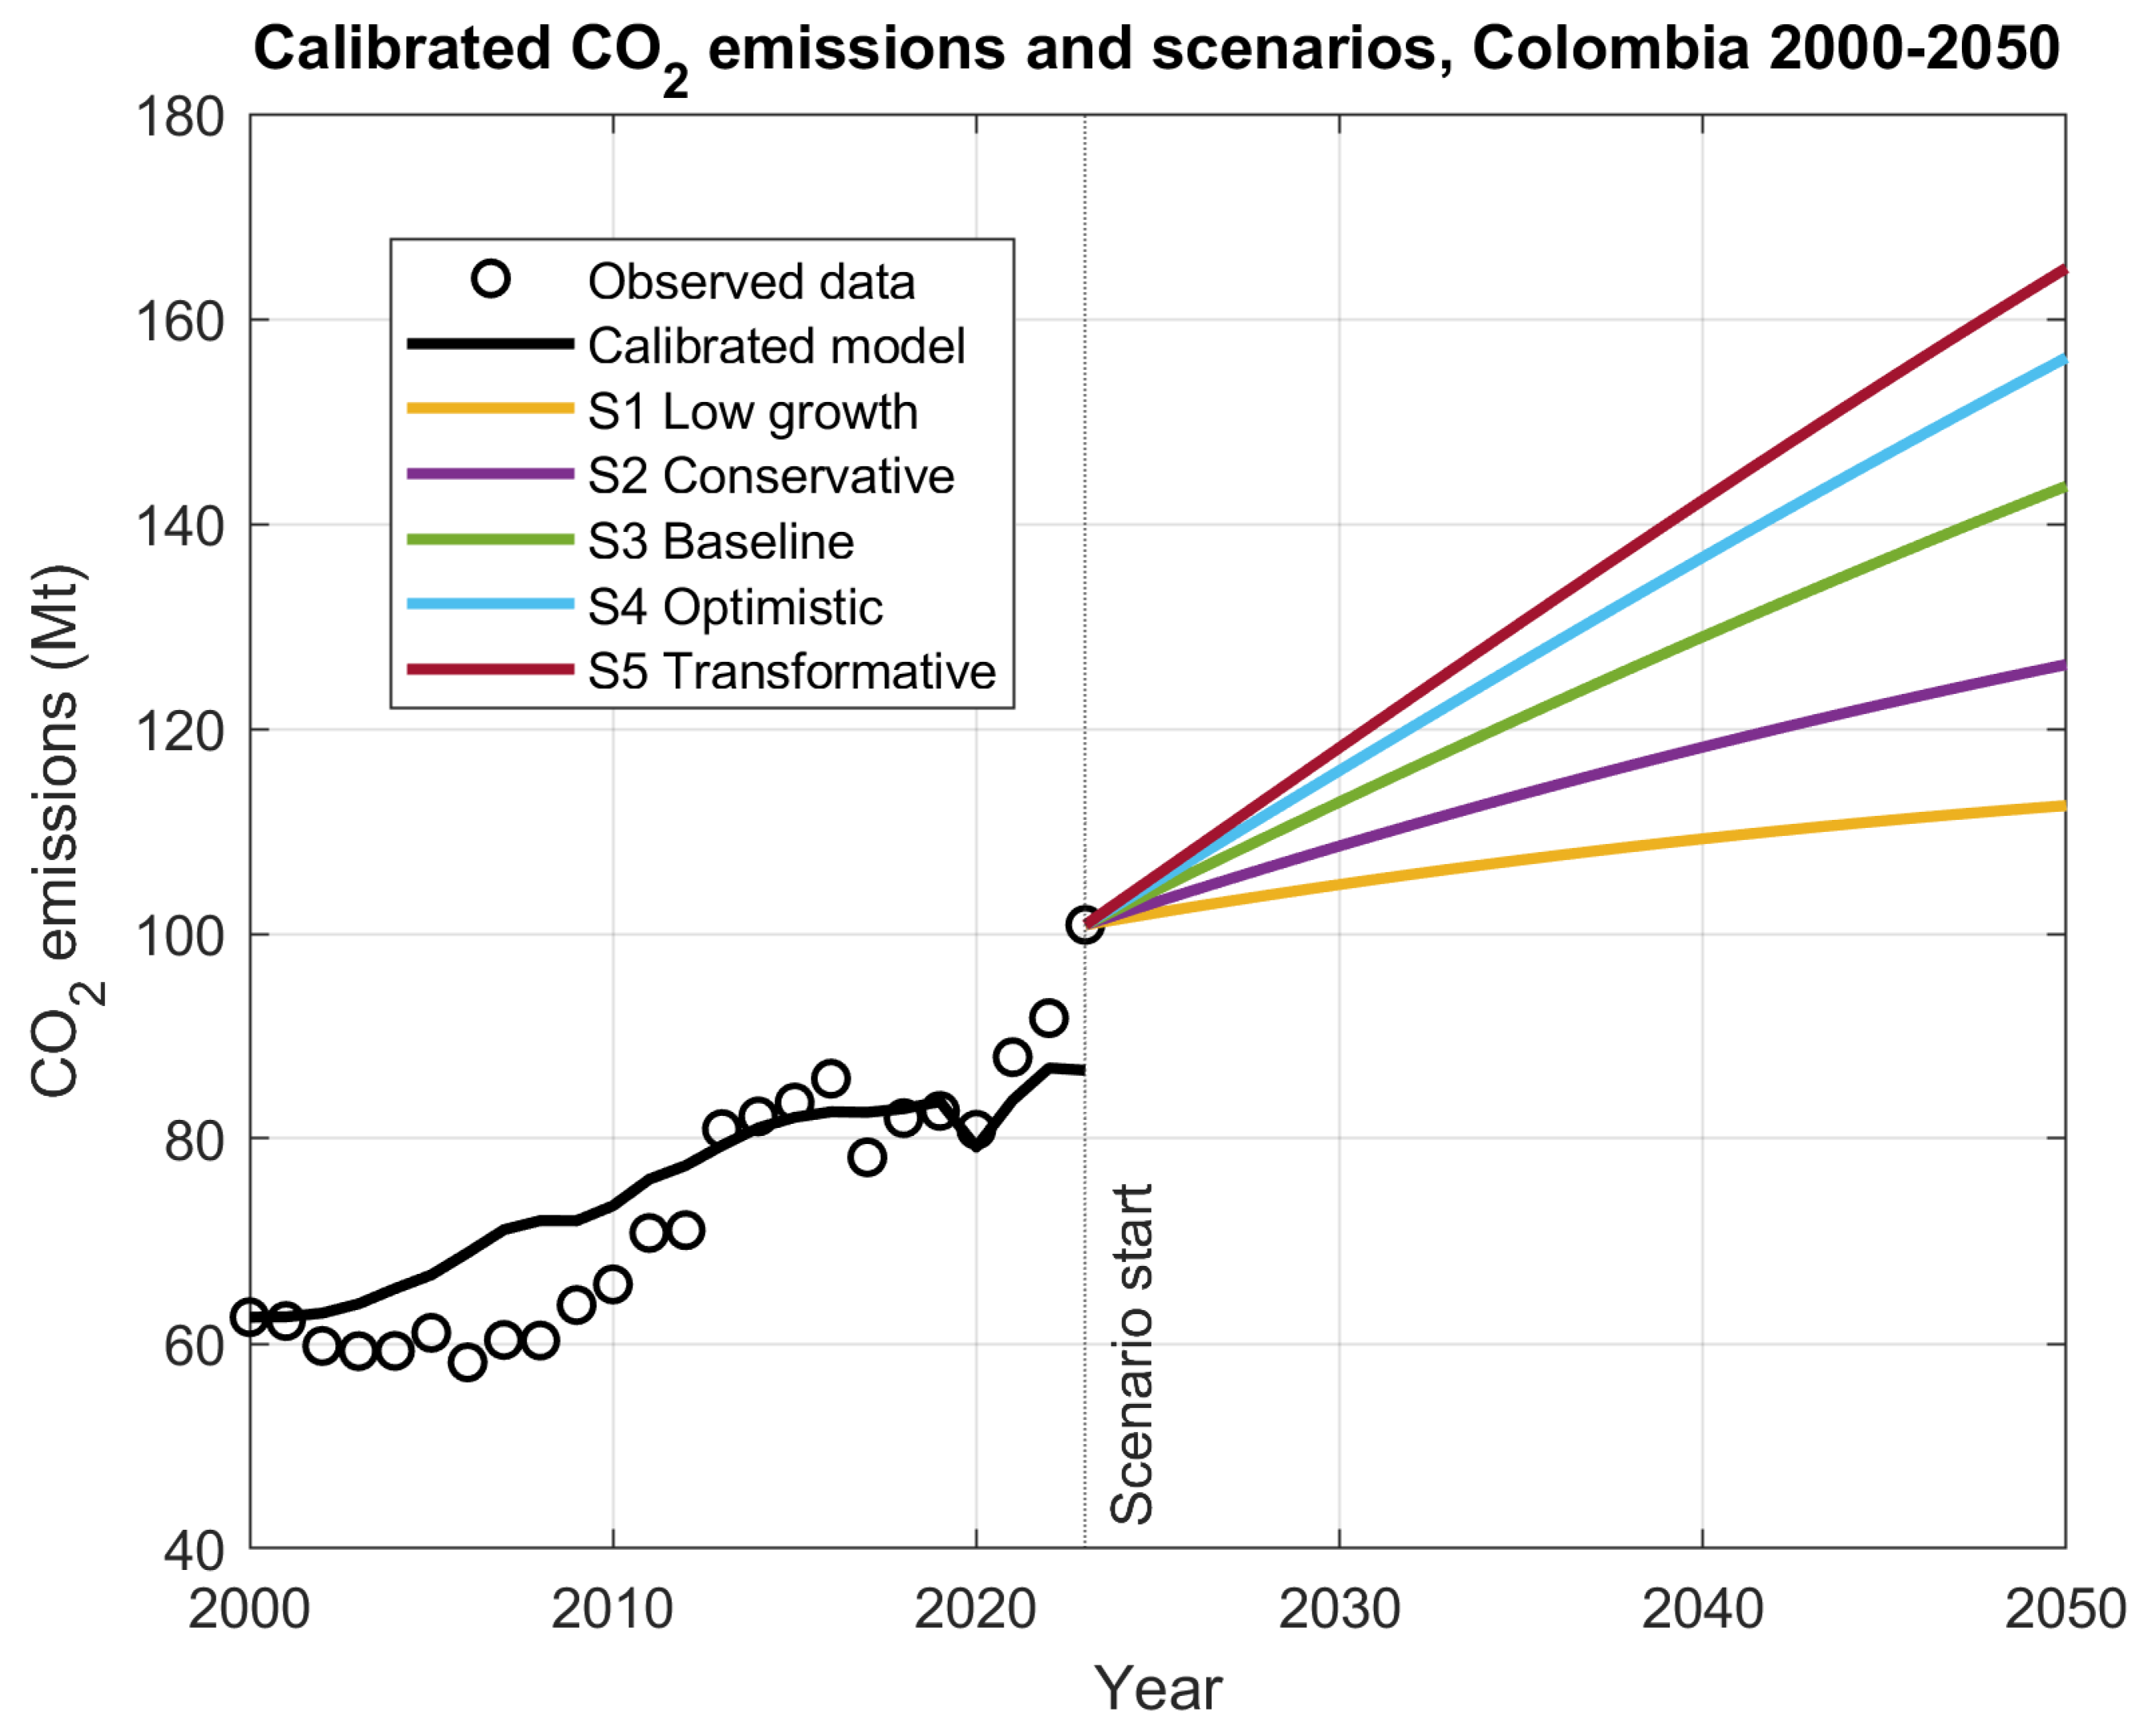
Figure 6 presents the observed and simulated emissions during the calibration period and the scenario projections up to 2050. The model reproduces the general upward tendency of emissions, although the fit is weaker than in the demographic and economic modules. This is consistent with the fact that national emissions are influenced by sectoral and energy-system dynamics not fully represented in this compact model.
The moderate value of for the CO2 emissions module reflects the greater interannual variability of national emissions compared with demographic and economic variables. In Colombia, annual CO2 emissions may be affected by short-term energy-system conditions, including hydrological variability, the relative participation of hydropower and thermal generation, fuel substitution, transport activity, and climate-related shocks such as El Niño events. These factors are not explicitly represented in the compact national-level formulation used in this study. Therefore, the CO2 module should be interpreted as a long-term scenario representation rather than as a model designed to reproduce all short-term annual fluctuations in emissions.
Table 10 summarizes the emissions results for 2050. CO
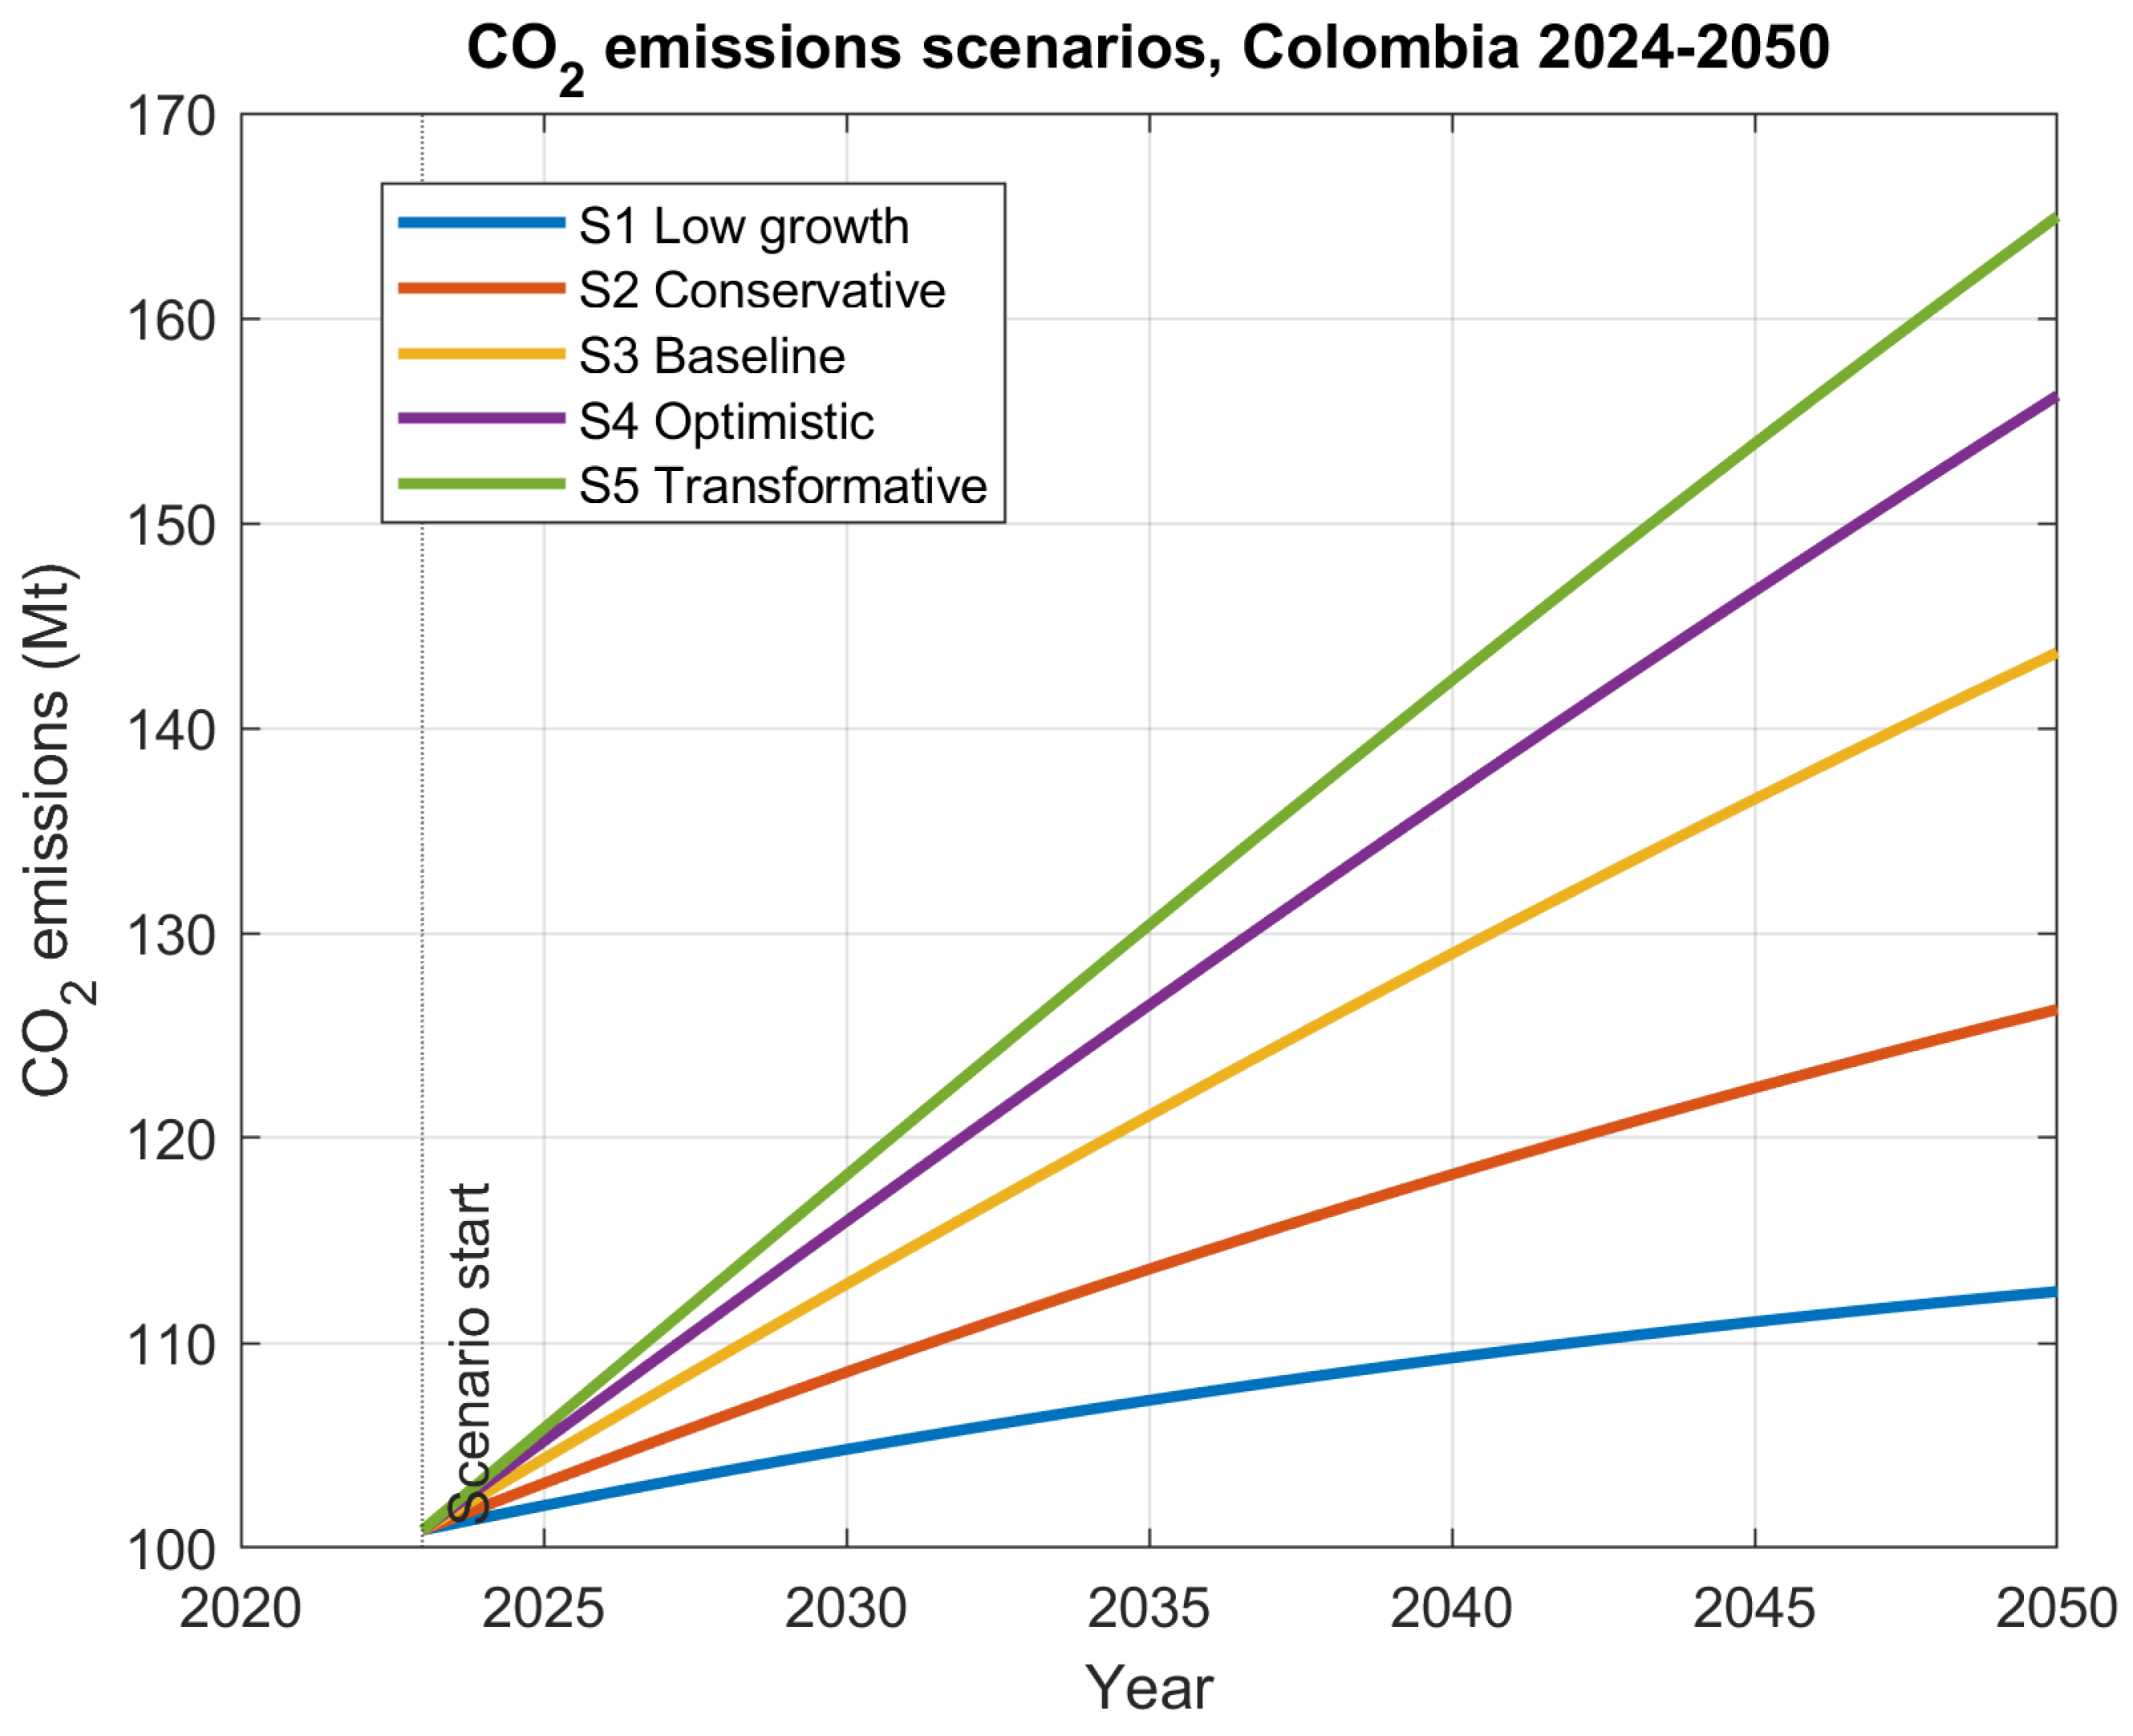
2 emissions increase across scenarios as economic activity grows, even when stronger decarbonization assumptions are introduced in the higher-growth scenarios. The low-growth scenario reaches 112.51 Mt CO
2 in 2050, while the transformative scenario reaches 164.97 Mt CO
2. However, carbon intensity decreases substantially in the higher-growth and higher-decarbonization scenarios, indicating a partial decoupling between GDP and emissions.
The scenario-specific values of
in
Table 10 represent exploratory decarbonization assumptions rather than estimated or externally forecasted parameters. To clarify the conditional nature of the emissions results, a threshold analysis was conducted to determine the value of
required to stabilize emissions at the 2023 level by 2050.
The decarbonization thresholds required to stabilize CO
2 emissions by 2050 are presented in
Table 11.
The threshold analysis shows that all assumed decarbonization rates are below the values required to stabilize emissions at the 2023 level by 2050. For example, in the transformative scenario the assumed value is , whereas the stabilization threshold is approximately . Thus, the increase in absolute emissions under high-growth scenarios is a conditional result under the assumed decarbonization rates, not an unconditional prediction.
Although a full Monte Carlo or bootstrap uncertainty propagation was beyond the scope of the present compact model, the revised analysis incorporates local parameter diagnostics, identifiability checks, robustness comparison with an alternative total-GDP specification, and a threshold-based sensitivity analysis for the decarbonization parameter . These additions provide a first assessment of parameter uncertainty and structural sensitivity. However, the long-term projections do not include full parameter uncertainty propagation or probabilistic scenario analysis. Therefore, the projected trajectories are not reported with confidence intervals and should not be interpreted as statistically bounded forecasts. Instead, they represent deterministic and exploratory scenario outcomes conditional on the assumed productivity and decarbonization parameters. Nevertheless, the long-term emissions projections should be interpreted as conditional scenario outcomes rather than precise forecasts.
The sensitivity of the emissions projections to the income elasticity parameter was also considered. Since controls the response of CO2 emissions to changes in GDP per capita, higher values of amplify the emissions effect of economic growth, whereas lower values reduce the scale effect of GDP per capita expansion. Therefore, the projected emissions trajectories are conditional not only on the assumed decarbonization rate , but also on the calibrated income elasticity of emissions. This reinforces the interpretation of the CO2 module as a scenario-oriented representation rather than a precise forecasting tool.
Figure 7 compares the CO
2 emissions trajectories across the five scenarios. The results show that higher economic growth produces higher absolute emissions by 2050, even under stronger decarbonization assumptions. This implies that productivity growth alone is insufficient to reduce emissions if it is not accompanied by deeper structural changes in energy use, transport, production systems, and carbon intensity.
3.5. Carbon Intensity and Cumulative Emissions
Carbon intensity provides additional information about the relationship between economic activity and emissions.
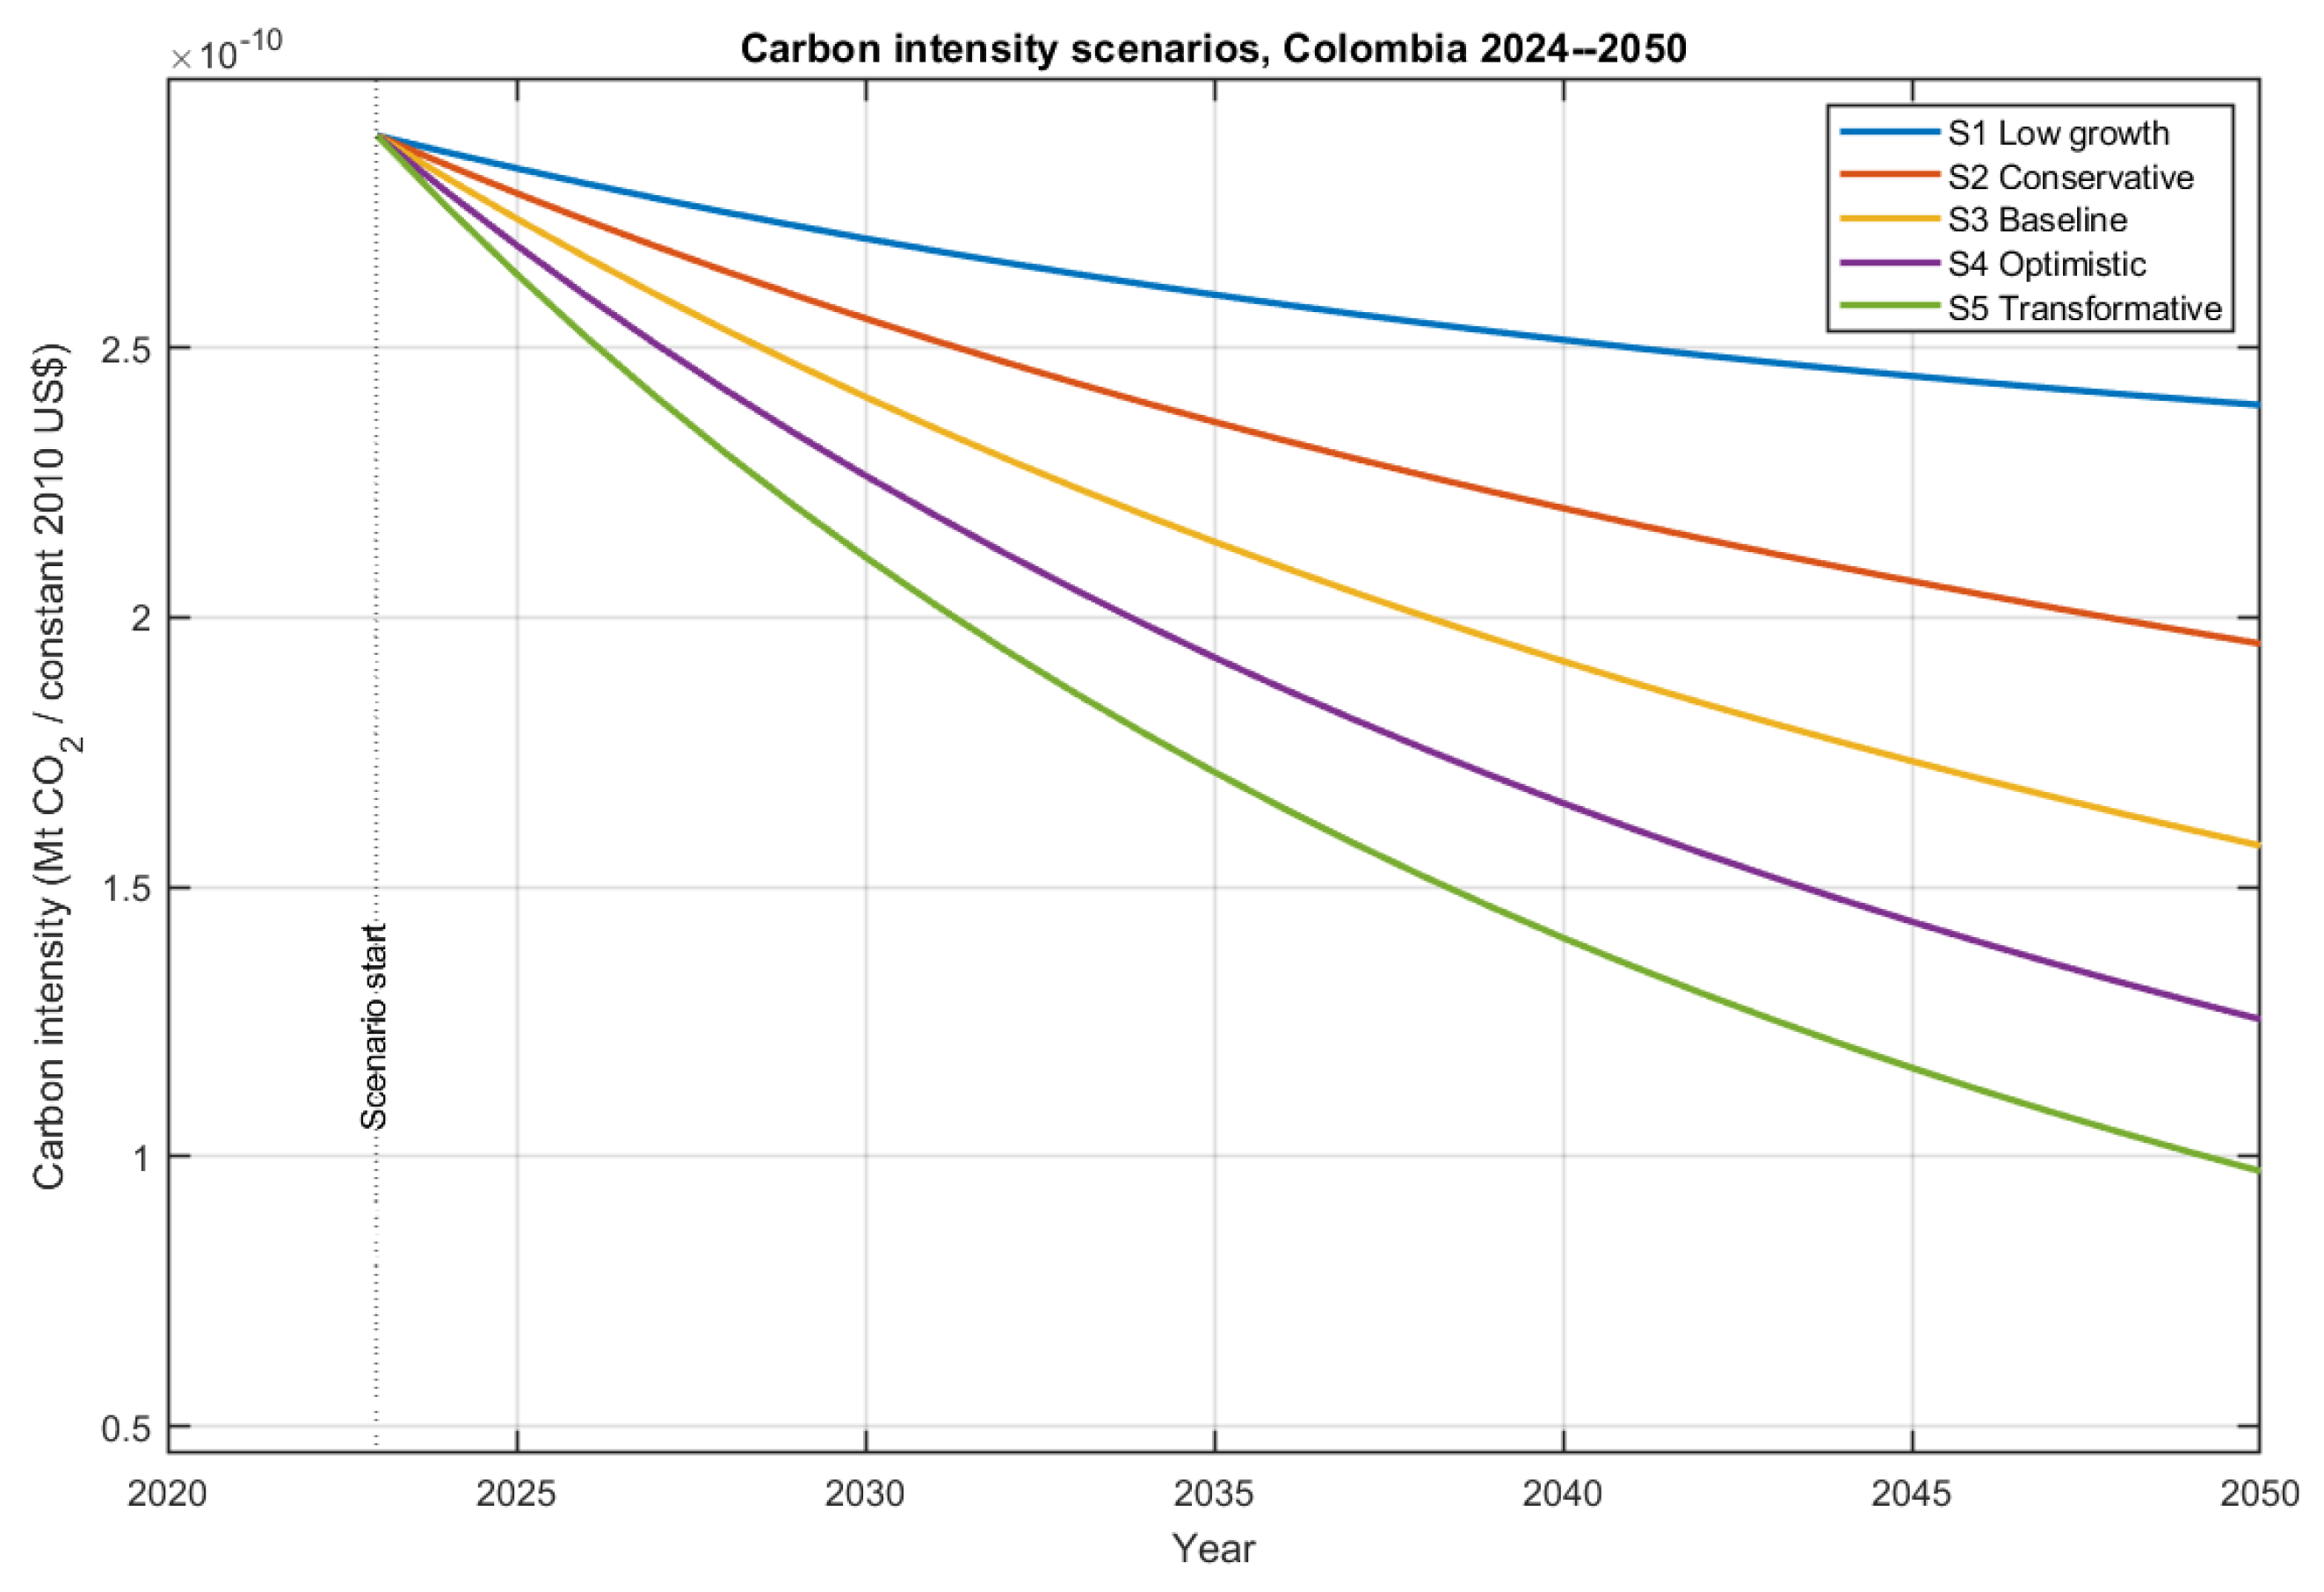
Figure 8 shows that carbon intensity decreases across all scenarios, with the strongest decline occurring in the transformative scenario. This means that although total emissions increase in high-growth pathways, the amount of CO
2 emitted per unit of GDP falls as decarbonization assumptions become more ambitious.
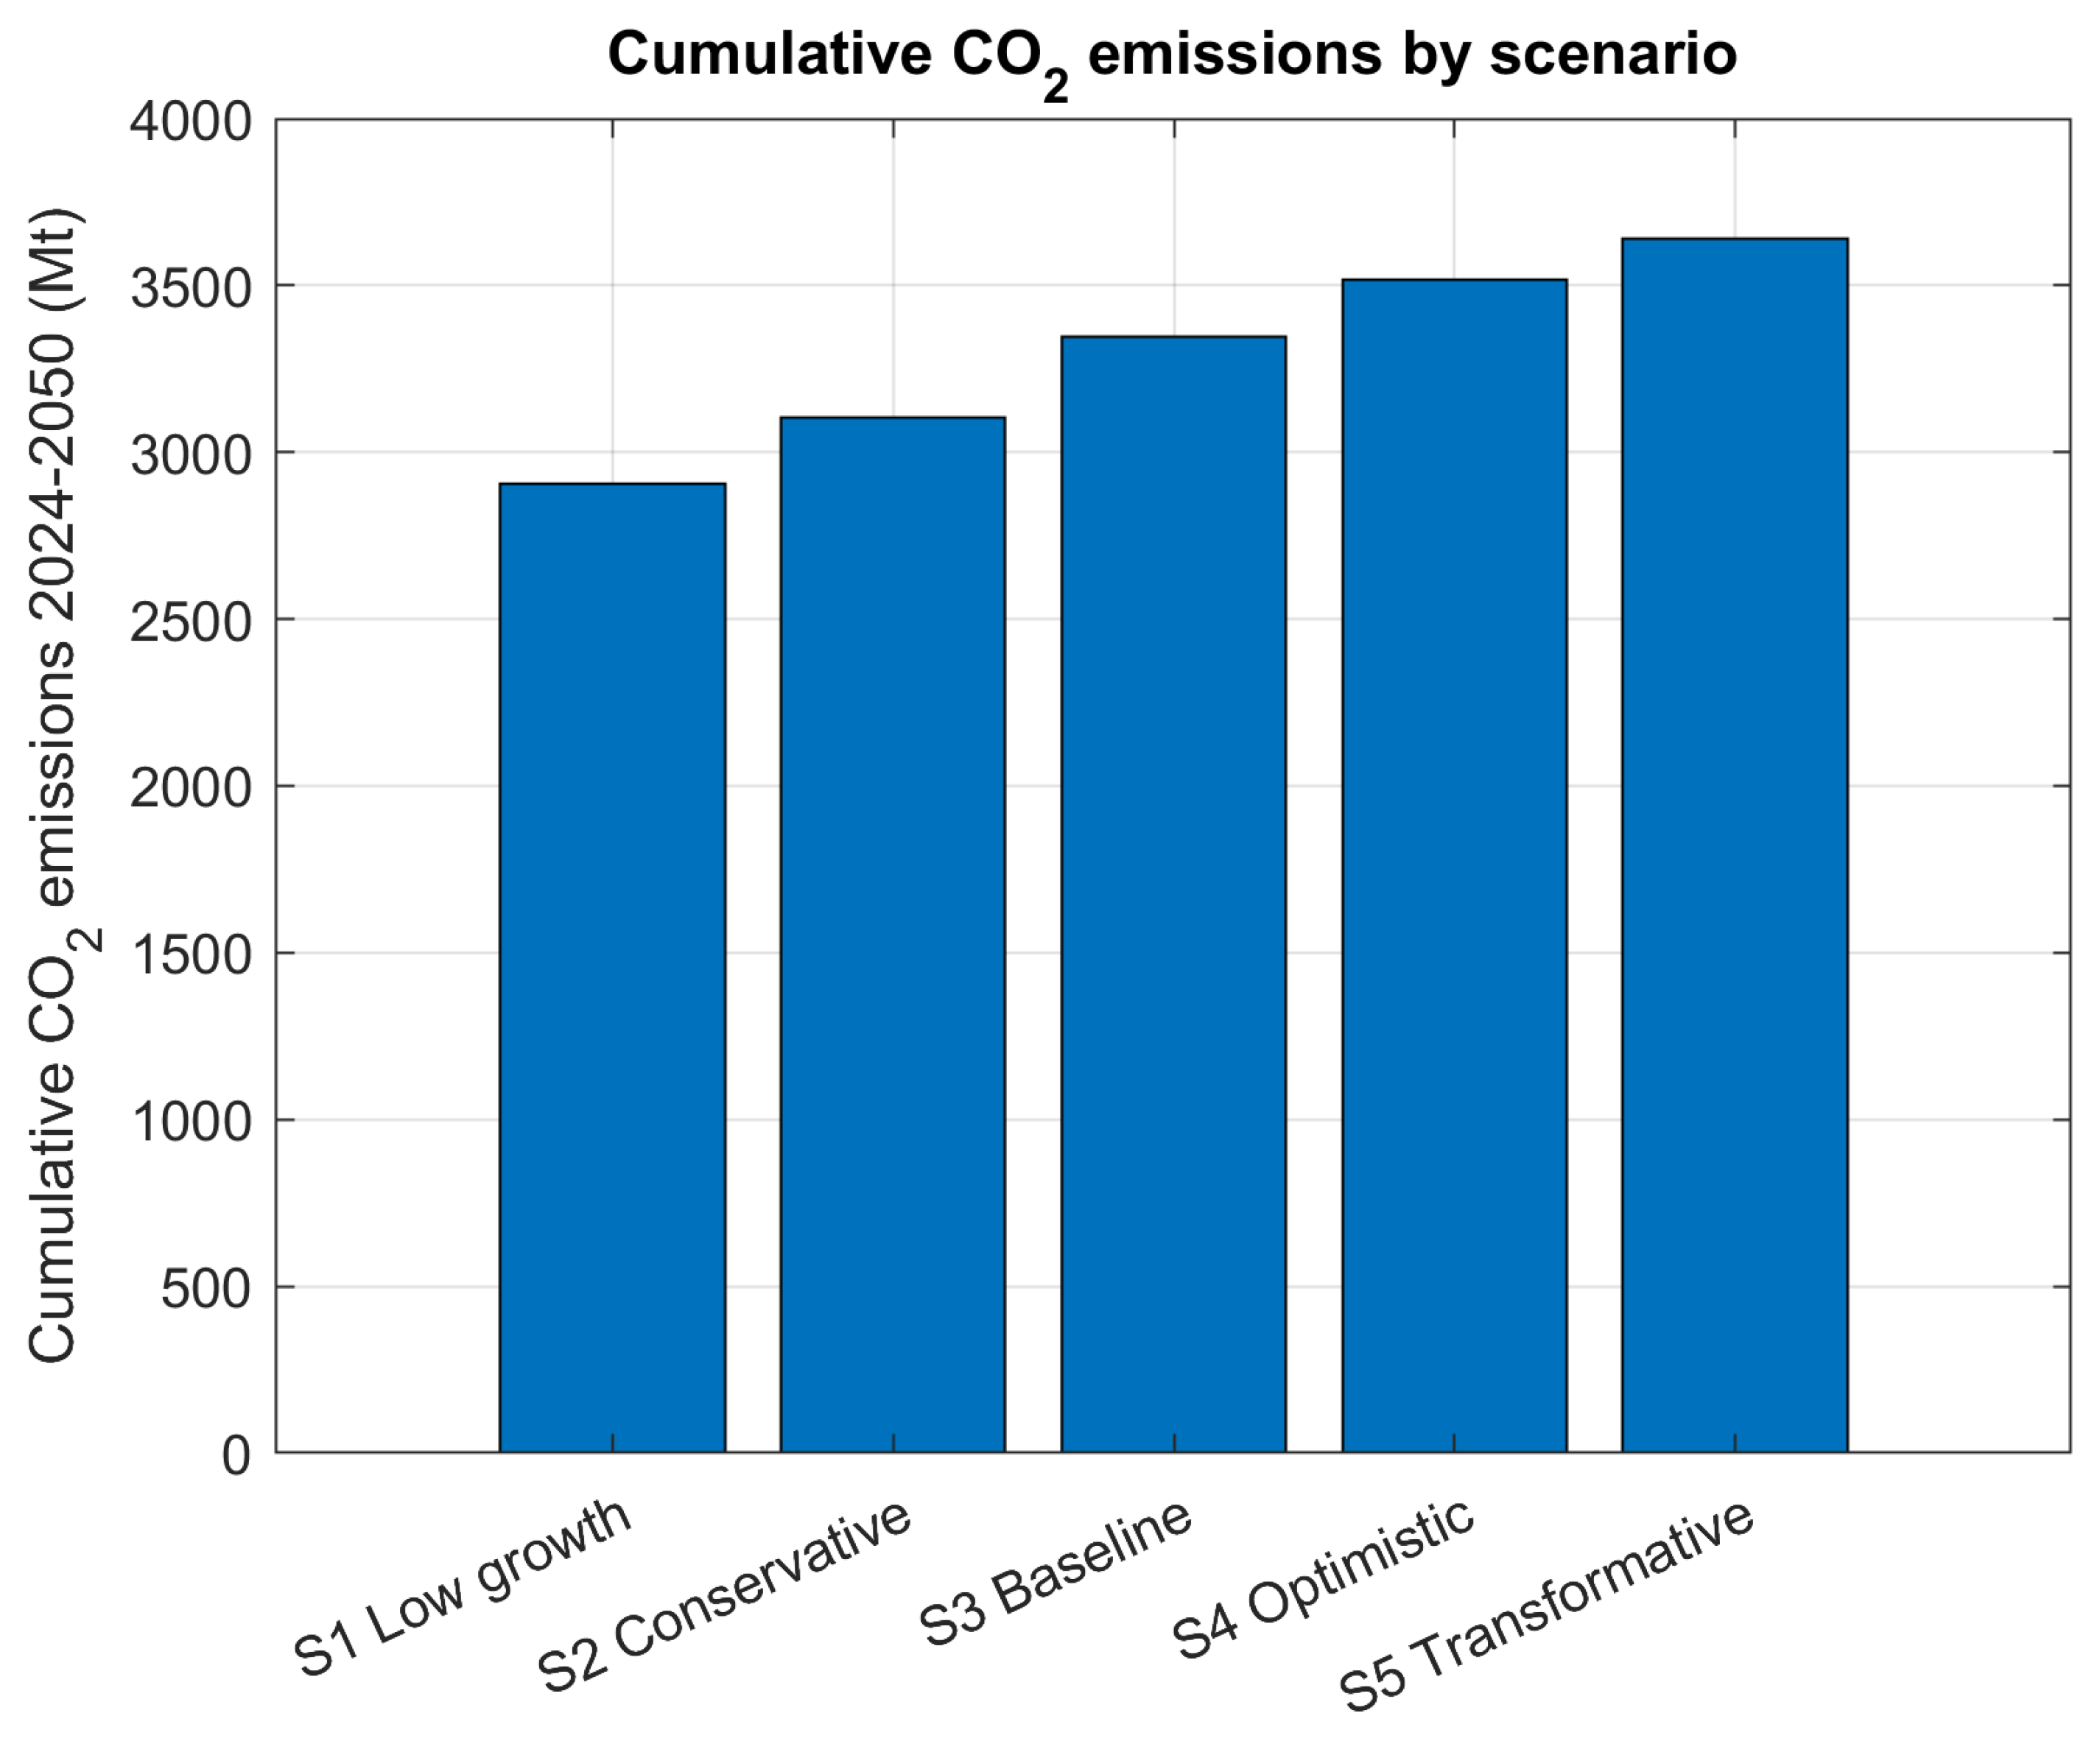
Figure 9 presents cumulative emissions for the period 2024–2050. Cumulative emissions range from 2907.3 Mt CO
2 in the low-growth scenario to 3640.2 Mt CO
2 in the transformative scenario. This result reveals an important sustainability trade-off: stronger economic growth improves income and total GDP, but it also increases cumulative emissions unless decarbonization is sufficiently strong to offset the scale effect of economic expansion.
3.6. Integrated Interpretation of Results
The integrated results show that Colombia’s demographic transition, economic growth, and CO2 emissions are dynamically connected. The demographic projection suggests moderate population growth and a progressive aging process. The economic module indicates that productivity assumptions dominate the long-term divergence between scenarios, while demographic aging creates a modest negative contribution to GDP per capita growth. The CO2 module shows that emissions remain positively associated with economic activity, and that decarbonization efforts reduce carbon intensity but do not fully offset the emissions increase associated with high-growth pathways.
Overall, the results suggest that Colombia faces a policy trade-off between income growth and emissions reduction. A low-growth pathway limits emissions growth but also produces lower income and GDP by 2050. Conversely, optimistic and transformative pathways generate substantially higher economic output but require much stronger decarbonization policies to prevent a large increase in cumulative emissions. Therefore, sustainable development requires not only productivity improvements but also structural decarbonization, energy efficiency, low-carbon transport, cleaner production systems, and long-term climate-oriented planning.
4. Discussion
The results of this study show that demographic transition, economic growth, and CO2 emissions in Colombia are dynamically connected. The calibrated system dynamics model reproduced the main historical trajectories of population, GDP per capita, and CO2 emissions during 2000–2023, and then allowed the exploration of five alternative pathways to 2050. The strongest calibration performance was obtained for the demographic module, followed by the economic module, while the CO2 emissions module showed a lower but still informative historical fit. This result is consistent with the fact that demographic variables tend to evolve gradually, whereas emissions are affected by additional short- and medium-term factors such as energy mix, transport activity, industrial structure, fuel prices, policy changes, and external economic shocks.
The demographic results indicate that Colombia will continue experiencing moderate population growth while undergoing a relevant change in age structure. The projected decline in the share of the young population and the increase in the share of older adults reflect the continuation of the demographic transition. At the same time, the working-age population remains the dominant group over the projection horizon. This result is important because the working-age population is a key determinant of labor supply, productivity potential, and economic activity. However, the results also suggest that population aging generates a negative demographic contribution to GDP per capita growth in the long term. This does not imply that aging automatically reduces economic performance, but rather that, under the model structure, a higher proportion of older adults increases dependency pressure unless it is compensated by productivity growth, labor-force participation, human capital, or institutional improvements.
From the economic perspective, the results show that productivity assumptions dominate the long-term divergence between scenarios. The low-growth scenario produces a slow increase in GDP per capita and total GDP, while the optimistic and transformative scenarios generate substantially higher income levels by 2050. This divergence is explained by the cumulative effect of annual growth differences. Even small differences in productivity growth produce large changes over a long horizon. Therefore, the scenario results emphasize that demographic structure alone is not sufficient to determine Colombia’s long-term economic trajectory. Productivity, technological change, education, formal employment, infrastructure, and institutional capacity remain essential determinants of sustainable growth.
The CO2 emissions results reveal a central sustainability trade-off, but this result should be interpreted conditionally. Under the assumed decarbonization rates used in the scenario design, higher economic growth increases absolute emissions, even when stronger carbon-intensity reductions are introduced. In the transformative scenario, carbon intensity decreases more strongly than in the other scenarios, indicating a partial decoupling between GDP and emissions. However, total emissions and cumulative emissions remain higher because the assumed decarbonization rate is not large enough to fully offset the scale effect of economic expansion. This finding should therefore be understood as a scenario-dependent outcome under specified decarbonization assumptions, rather than as an unconditional prediction.
The calibrated CO2 module assigned most of the explainable historical variation in emissions to GDP per capita, with a less-than-proportional income elasticity. However, the estimated population elasticity and autonomous decarbonization parameter converged to the lower boundary of the admissible parameter space. This result should not be interpreted as evidence that population has no physical or economic effect on emissions. Instead, the identifiability diagnostics show that population, GDP per capita, and the time trend are highly collinear over the 2000–2023 period, which weakens the separate estimation of , , and . Consequently, the CO2 module is interpreted as a compact scenario-oriented representation rather than as a fully causal decomposition of emissions drivers. This limitation is consistent with the compact national-level structure of the model, which does not explicitly represent sectoral energy consumption, transport demand, electricity generation, land-use change, industrial production, or fuel substitution.
To contextualize the projected emissions range, the 2050 values obtained in this study, from 112.51 to 164.97 Mt CO
2, were qualitatively compared with bottom-up energy modeling studies for Colombia. Previous LEAP-based analyses have projected national carbon emissions of approximately 140.1 Mt CO
2 under a positive scenario and 150.5 Mt CO
2 under a negative scenario by 2050, which falls within the envelope obtained by the present compact macro-demographic model [
48]. This comparison suggests that the proposed framework produces plausible aggregate emission levels when compared with sectorally detailed energy-demand modeling. However, the results are substantially higher than deep-decarbonization pathways considered in Colombia’s long-term energy and climate strategies, where strong mitigation, electrification, renewable-energy deployment, and sectoral transformation can reduce energy-related CO
2 emissions to much lower levels by 2050 [
49]. Therefore, the scenarios in this study should be interpreted as macroeconomic emissions pathways under stylized decarbonization assumptions, rather than as detailed mitigation roadmaps.
Therefore, the scenarios in this study should be interpreted as macroeconomic emissions pathways under stylized decarbonization assumptions, rather than as detailed mitigation roadmaps.
The results are consistent with the STIRPAT and Kaya-type interpretation of emissions, where environmental pressure depends on population, affluence, and technology or intensity-related factors. In this study, population affects emissions both directly through total population and indirectly through its influence on GDP per capita. Affluence is represented through GDP per capita and total GDP, while technology is represented through the decarbonization parameter and carbon intensity. The model, therefore, provides a transparent framework for evaluating how different socioeconomic pathways may modify future emissions.
For Colombia, the policy implications are significant. First, the demographic transition creates both opportunities and challenges. A large working-age population may support economic growth, but this potential depends on labor-market absorption, education, productivity, and formal employment. Second, population aging requires long-term planning in health, pensions, social protection, and productivity-enhancing policies. Third, economic growth pathways must be accompanied by strong decarbonization policies to avoid a sustained increase in cumulative emissions. Fourth, reductions in carbon intensity are necessary but may be insufficient if economic activity grows rapidly. Therefore, Colombia’s sustainable development strategy should combine productivity growth with energy efficiency, cleaner transport, renewable energy deployment, industrial modernization, and low-carbon infrastructure.
The scenario results should not be interpreted as deterministic forecasts. Rather, they represent internally consistent pathways based on alternative assumptions about productivity and decarbonization. The value of the model lies in its ability to compare plausible futures and identify structural trade-offs. In this sense, the results support a policy-oriented interpretation: Colombia can achieve higher income trajectories, but the environmental consequences depend on the strength and timing of decarbonization efforts.
Regarding scenario initialization, the post-2023 simulations start from the calibrated 2023 GDP per capita level. Since the historical calibration period includes the observed 2021–2023 recovery after the 2020 macroeconomic shock, the scenario trajectories are initialized after the short-term adjustment period. Thus, the one-year specification of does not impose a persistent artificial shock on the 2024–2050 projections.
This study has several limitations. First, the model uses a compact three-cohort demographic structure, which is useful for transparency but does not capture detailed age-specific fertility, mortality, and migration patterns. Second, the economic module represents GDP per capita through aggregate demographic and productivity components, without explicitly modeling capital accumulation, sectoral productivity, trade, investment, informality, or fiscal policy. Third, the CO2 module does not explicitly include energy consumption by sector, energy intensity, electricity mix, fuel substitution, or land-use emissions. Fourth, the calibration period includes structural shocks such as the COVID-19 pandemic, which may affect parameter estimation. Finally, the scenarios are exploratory and depend on assumptions about future productivity and decarbonization.
Future research should extend the current model in three directions. First, the demographic module could be expanded using more detailed age groups and official demographic projections. Second, the economic module could incorporate capital accumulation, labor-force participation, informality, sectoral productivity, and investment dynamics. Third, the environmental module should be expanded into a more detailed energy-emissions module, including energy intensity, final energy demand, electricity generation, fossil fuel consumption, renewable energy penetration, and sectoral emissions. This would allow the model to move from a compact sustainability framework toward a more detailed energy–economy–environment integrated assessment model.
4.1. Policy Implications
The results provide several policy implications for Colombia’s long-term sustainability strategy. First, the demographic transition suggests that economic policy should not rely only on population growth or the size of the working-age population. As population aging progresses, productivity growth, education, labor-market participation, and institutional capacity become central mechanisms for sustaining GDP per capita growth.
Second, the economic scenarios show that higher productivity growth can substantially improve income levels by 2050, but this growth also increases pressure on carbon dioxide emissions if it is not accompanied by structural decarbonization. Therefore, policies that promote productivity should be integrated with climate and energy policies, rather than treated as separate development agendas.
Third, the emissions results indicate that improvements in carbon intensity are necessary but may be insufficient under high-growth pathways. The threshold analysis shows that the assumed decarbonization rates are below the values required to stabilize emissions by 2050. This implies that Colombia would need deeper and sustained carbon-intensity reductions through renewable energy expansion, energy efficiency, cleaner transport, industrial modernization, and fuel substitution.
Finally, the scenario framework can support policy discussion by showing how demographic, economic, and environmental assumptions interact over time. The results do not prescribe a single optimal pathway, but they help identify the conditions under which economic growth may become compatible with emissions stabilization.
4.2. Limitations
This study has several limitations that should be considered when interpreting the results. First, the demographic module is an aggregated system dynamics representation based on three broad age groups, rather than a full cohort-component demographic model with detailed age-specific fertility, mortality, and migration schedules. Therefore, its parameters should be interpreted as effective aggregate transition rates rather than detailed demographic mechanisms. Second, the economic module uses age-structure terms as deviations from the baseline demographic composition to represent transitional effects on GDP per capita growth. These terms should not be interpreted as permanent causal effects of demographic structure on long-run growth after the age composition stabilizes.
Third, the CO2 emissions module is a compact Kaya/STIRPAT-type representation and does not explicitly model sectoral energy demand, electricity generation, transport, industrial production, fuel substitution, land-use change, or hydrological variability. As a result, the module captures the general long-term emissions tendency but cannot reproduce all short-term annual fluctuations associated with energy-system conditions or climate-related shocks such as El Niño events. Fourth, the environmental parameters are weakly identified because population, GDP per capita, and the time trend are highly collinear over the calibration period. Therefore, the estimated elasticities should not be interpreted as independent causal effects.
5. Conclusions
This study developed a calibrated system dynamics model to analyze the interaction between demographic transition, economic growth, and CO2 emissions in Colombia. The model integrates three modules: a demographic module based on three age groups, an economic module linking demographic structure and productivity assumptions with GDP per capita, and a CO2 emissions module based on a Kaya/STIRPAT-type formulation. The model was calibrated using historical data for 2000–2023 and projected to 2050 under five alternative scenarios.
The demographic module achieved a strong calibration performance, with a MAPE of 1.05% and an of 0.977 for total population. The economic module also reproduced the historical GDP per capita trajectory with satisfactory accuracy, obtaining a MAPE of 3.06% and an of 0.950. The CO2 emissions module presented a MAPE of 7.20% and an of 0.741, reflecting the greater complexity and variability of national emissions dynamics.
The demographic projection suggests that Colombia will continue experiencing moderate population growth and progressive aging by 2050. The working-age population remains dominant, but the increasing share of older adults creates a modest negative contribution to GDP per capita growth. This result highlights the importance of productivity, education, labor-market participation, and institutional capacity in transforming demographic structure into sustainable economic growth.
The economic scenarios show that productivity assumptions strongly shape long-term GDP per capita and total GDP trajectories. Higher-growth pathways generate substantially larger income levels by 2050, but they also increase pressure on CO2 emissions. The emissions scenarios show that decarbonization reduces carbon intensity, particularly in the optimistic and transformative pathways. However, under the assumed decarbonization rates, absolute and cumulative emissions remain higher in the strongest growth scenarios. This result should be interpreted as conditional on the scenario assumptions, since stronger decarbonization rates than those considered here would be required to stabilize or reduce emissions by 2050.
The main policy implication is that Colombia’s sustainable development pathway requires a simultaneous strategy of economic transformation and structural decarbonization. The results do not imply a deterministic emissions pathway; rather, they show that, under the modeled assumptions, productivity growth must be accompanied by sufficiently deep and sustained carbon-intensity reductions. Economic growth alone is not sufficient to ensure sustainability, and carbon intensity reductions alone may not be enough if economic activity expands rapidly. Policies aimed at productivity growth, energy efficiency, renewable energy, cleaner transport, industrial modernization, and long-term climate planning are therefore necessary to reconcile income growth with emissions reduction.
The proposed model provides a transparent and reproducible framework for evaluating long-term sustainability scenarios in Colombia. Although compact, it offers a useful basis for policy discussion and future extensions toward more detailed energy–economy–environment modeling.




 ,
,