Article

Optimizing Hurricane Evacuation Decisions Under Climate Change: Adaptation Limits and Implications for Sustainable Coastal Resilience


by
Yaodan Cui
1,2,3,4,
Haonan Xu
5,
Qinyu Wei
5,
Kaiyu Li
5,
Kairui Feng
1,2,3,4,*,
Yue Song
1,2,3,6 and
Jiazuo Hou
1,2,3
1
Shanghai Institute of Intelligent Science and Technology, Tongji University, Shanghai 201210, China
2
Shanghai Research Institute for Intelligent Autonomous Systems, Tongji University, Shanghai 201210, China
3
State Key Laboratory of Autonomous Intelligent Unmanned Systems, Tongji University, Shanghai 201210, China
4
Shanghai Innovation Institute, Shanghai 200230, China
5
Shanghai Aircraft Design and Research Institute, Commercial Aircraft Corporation of China, Ltd. (COMAC), Shanghai 201210, China
6
Department of Control Science and Engineering, Tongji University, Shanghai 201804, China
*
Author to whom correspondence should be addressed.
Sustainability 2026, 18(14), 7020; https://doi.org/10.3390/su18147020
Submission received: 14 November 2025 / Revised: 6 June 2026 / Accepted: 24 June 2026 / Published: 9 July 2026
(This article belongs to the Special Issue Resilient Cities Under Climate Changes)

Abstract

A central premise of climate adaptation is that better information and smarter decisions can keep escalating hazards within manageable bounds. We test this premise for one of the most information-sensitive decisions in disaster management—ordering a hurricane evacuation—and find that it has limits. Taking Hurricane Irma (2017), the storm behind Florida’s largest evacuation (6.5 million people, 4 million vehicles), as a reference event, we add Coupled Model Intercomparison Project Phase 6 (CMIP6) perturbations to the historical storm and use the Pangu-Weather artificial intelligence (AI) forecasting system to generate 20,000 ensemble members for present-day and future climates (Shared Socioeconomic Pathway (SSP) 2-4.5 and SSP5-8.5; 2050s and 2080s). As the climate warms, storm intensity rises by 15–20% and forecast uncertainty roughly doubles. A reinforcement learning (RL) framework that optimizes evacuation orders under these conditions then exposes a paradox: although RL’s advantage over fixed policies grows from 7% today to 17% under the 2080s SSP5-8.5, absolute evacuation performance still deteriorates by 44% despite optimization. The optimized future climate outcome (objective: 0.239) is in fact worse than that of suboptimal fixed policies today (0.178)—better decisions cannot compensate for a decision environment that has itself degraded. This is direct, scenario-specific evidence that optimization-based adaptation has a ceiling, with consequences for the long-term sustainability of hazard-exposed coastal regions: keeping such communities safe and livable will require coupling evacuation optimization with structural risk reduction, equitable access to decision-support technology, and aggressive greenhouse gas mitigation that holds future risk within adaptable—and therefore sustainable—bounds. The framework supplies quantitative support for sustainable disaster risk reduction and resilient infrastructure planning aligned with global sustainability goals.

1. Introduction

Much of climate adaptation rests on a single optimistic premise: that better information and smarter decision-making can hold mounting hazards within manageable limits. Hurricane evacuation is among the clearest tests of that premise, since it is a high-stakes decision taken almost entirely on the basis of forecasts. Climate change, however, influences evacuation from two directions at once. It intensifies the underlying hazard—warming oceans produce tropical cyclones (TCs) with higher peak winds, more destructive surge, and longer-lived inland impacts [1,2,3]—and, less obviously, it corrodes the very information on which the evacuation decision rests. This study asks how much the optimistic premise actually holds once both forces act together.
The informational side of the problem is the more insidious. As TCs increasingly behave outside the historical envelope—vaulting from tropical storm to major hurricane within 24 h, holding category-4 winds over land, or tracking in unprecedented directions—forecast models trained on past events lose skill [4]. The upshot is what we term the “climate evacuation paradox”: it is exactly when stronger storms make the evacuation decision most consequential that the forecasts that a decision depends on become least dependable [5,6]. Conventional planning, calibrated to historical storms, has no natural means of pricing in this widening uncertainty.
Hurricane Irma (2017) offers an apt reference point for isolating these climate effects. Irma set off the largest evacuation in Florida’s history—6.5 million people and 4 million vehicles on a highway network with little slack [7,8]—yet it unfolded under present-day conditions, where forecasts retained good skill and decisions could lean on familiar uncertainty bounds. Working from this well-characterized baseline, Cui et al. [9] showed that reinforcement learning (RL) could improve Irma’s evacuation orders by 8% over the actual government decisions through better timing and routing. The natural next question—and the one we pursue—is what becomes of such optimization once a storm like Irma is placed in a warmer climate.
To pose that question concretely, we project Irma forward in climate rather than in time. Adding climate-change signals from the Coupled Model Intercomparison Project Phase 6 (CMIP6) projections to Irma’s atmospheric environment yields physically consistent renderings of how a comparable storm would behave under 2050s and 2080s conditions. These renderings make the storm not only stronger—winds 15–20% higher and a surge 25–30% greater—but also harder to predict, since the forecast models must operate on atmospheric states they never encountered during training.
We characterize that loss of predictability with AI-based ensemble forecasting. Pangu-Weather [10] creates thousands of track ensembles within hours, where conventional numerical models would need days, letting us sample the enlarged uncertainty space directly. The same tool that performed well for present-day Irma in [9] degrades sharply under climate-perturbed initial conditions: track uncertainty nearly doubles and intensity errors grow by 75%, reshaping the decision problem that evacuation managers face.
Onto these perturbed scenarios we layer a reinforcement-learning controller, adapting the framework of Cui et al. [9] so that it perceives climate-amplified uncertainty through an enlarged state and a reward that penalizes action under high forecast variance. Trained on 20,000 climate-perturbed ensemble members spanning Shared Socioeconomic Pathway (SSP) scenarios (SSP2-4.5 and SSP5-8.5), the agent must trade off two failure modes: evacuating too early, at large social and economic cost, or waiting for a certainty that may never arrive before a rapid intensification.
The answer to our guiding question is sobering. The optimizer does keep gaining relative value as the climate worsens—RL’s edge over fixed policies widens from 7% today to 17% under the 2080s SSP5-8.5—but absolute performance collapses regardless. Even optimal future climate decisions (objective value of 0.239) trail today’s suboptimal fixed policies (0.178) by 34%. Smarter decisions, in short, cannot offset a decision environment that has itself deteriorated [11,12].
The contribution is therefore less of a better evacuation algorithm than a quantitative demarcation of where algorithmic adaptation stops working. By showing how degraded forecasts compound rising hazards to yield unacceptable outcomes even under optimal control, we give empirical substance to the notion of adaptation limits and to the trade-offs climate change forces onto evacuation [13,14]. Extending Cui et al. [9], we find that warming does not merely make evacuation harder; it transforms it into a problem with no good solution. Cast in sustainability terms, these results speak directly to the long-term viability of hazard-exposed coastal regions: keeping such communities safe and livable under intensifying tropical cyclones cannot be accomplished through smarter evacuation alone, but requires coupling decision optimization with sustainable land-use planning, resilient infrastructure, and climate mitigation—an agenda at the heart of sustainable disaster risk reduction and of the climate action and sustainable cities dimensions of the global sustainability agenda.
The principal novel contributions of this study are the following:
  • We build a climate-forward RL framework that embeds CMIP6 climate projections directly into the training data, allowing the agent to cope with non-stationary storm statistics and eroding forecast skill across the SSP2-4.5 and SSP5-8.5 warming scenarios.
  • We provide the first quantification of how AI-based ensemble forecast uncertainty scales with warming: 72 h track errors almost double (145 to 280 km) while intensity-forecast standard deviations climb from 12 to 21 m/s by the 2080s SSP5-8.5 horizon.
  • We empirically establish and formally define the climate evacuation paradox: RL’s relative gain over fixed policies climbs from 7.1% in the current climate to 16.8% under the 2080s SSP5-8.5, even as absolute evacuation performance worsens by 44%, surpassing what suboptimal policies incur today.
  • We supply quantitative evidence that adaptation limits genuinely arise in evacuation management, having a bearing on the wider debate over whether technological fixes are sufficient for climate adaptation [11,15,16].

2. Literature Review

2.1. Climate Change Impacts on Hurricane Evacuation

The deep uncertainties that climate change injects into hurricane evacuation planning have only begun to be addressed in the literature. Where early evacuation studies took historical storm patterns as their reference [17,18,19], recent scholarship increasingly accepts that climate-altered storm behavior voids many assumptions behind conventional evacuation models. Researchers have documented how warmer oceans drive rapid intensification [2,4], reshape storm tracks [1], and raise precipitation rates [3]—each complicating the timing and routing of evacuations. Recent studies further note that compound hazards—surge, riverine flooding, and high winds occurring together under climate change—enlarge the area subject to mandatory evacuation and overburden regional road capacity [20,21].
How households respond to evacuation orders depends not only on the storm threat itself but also on risk perception, past disaster experience, and trust in official warnings [22,23]. Because climate change pushes TC behavior beyond what many coastal residents have ever lived through, perceived risk can trail the true rise in hazard, dampening compliance precisely when it matters most [24]. Work on risk communication stresses the importance of conveying probabilistic forecast uncertainty in ways that prompt protective action without breeding warning fatigue [25]. These behavioral and communicative factors are essential complements to the technical optimization examined here.
A critical gap in the evacuation planning literature concerns how forecast reliability erodes under climate change. As storms behave in ever more unprecedented ways, models trained on historical data lose substantial skill [5,6]. This added forecast uncertainty compounds the evacuation problem: authorities must decide under wider confidence intervals and a shifted signal-to-noise ratio, in which the cost of issuing needless evacuation orders grows relative to the chance of a correct warning [5,25]. Cui et al. [9] achieved effective evacuation optimization in the current climate, improving system performance by 8%. Projected into future climates, however, the optimization problem changes character entirely because of amplified forecast uncertainty and extreme storm behavior.

2.2. Evolution of Evacuation Modeling Under Uncertainty

The shift from deterministic to probabilistic evacuation models mirrors a growing appreciation of uncertainty in evacuation planning. Classic macroscopic models [26,27] and microscopic models [28,29] were tailored to well-characterized storm behavior with comparatively predictable forecast errors. Hybrid schemes [30,31] sought a balance between computational cost and fidelity, yet still presumed that historical patterns would hold. More recent work has broadened these frameworks to capture behavioral heterogeneity—how socioeconomic status, vehicle access, and social networks shape evacuation demand [15,22].
A growing body of work frames evacuation as a stochastic optimization problem. Murray-Tuite and Wolshon [32] surveyed evacuation modeling comprehensively and singled out forecast uncertainty as a leading source of decision complexity. Later studies folded demand uncertainty, network disruptions, and staged-evacuation protocols into scenario-based optimization [33]. Yet these methods generally assume that future uncertainty follows historically calibrated distributions—an assumption that fails under climate change.
By introducing non-stationary storm behavior and forecast errors that breach historical limits, climate change unsettles these modeling paradigms. The evacuation model of Feng and Lin [8], later refined by Cui et al. [9], captures traffic flow at the aggregate level together with individual decision-making, providing a basis for climate-adapted modeling.

2.3. Decision-Making Under Deep Uncertainty

Climate change ushers in what decision scientists call “deep uncertainty”—conditions under which the probability distributions over future states are themselves unknown or unknowable [16]. Conventional evacuation planning instead assumes “shallow uncertainty,” where historical data bound forecast errors and storm behavior reasonably well. Moving into deep uncertainty reshapes the decision landscape and calls for frameworks able to accommodate non-stationary dynamics and fat-tailed risk distributions.
Info-gap decision theory and robust decision-making have both been advanced for climate-adaptation planning [16], but they typically demand exhaustive scenario enumeration that becomes computationally infeasible for real-time evacuation decisions. The surge in AI-based weather forecasting offers a way out by generating thousands of plausible futures quickly, though this very abundance poses a new difficulty: how to distill actionable guidance from huge ensemble sets once historical experience no longer calibrates them reliably. Dolan et al. [34] showed the value of adaptive-pathway frameworks for infrastructure planning under deep uncertainty—a notion akin to the adaptive evacuation strategies studied here, but operating at the timescale of individual storm events.

2.4. AI-Driven Approaches for Climate Adaptation

Recent advances in AI-based weather forecasting [10,35,36,37] can now generate storm scenarios by the thousand in near-real time, which reshapes the optimization landscape. As shown in Cui et al. [9], this capacity enables thorough exploration of uncertainty spaces. When turned to climate-perturbed scenarios, however, even sophisticated models such as Pangu-Weather lose accuracy, especially for extreme events lying outside the historical range.
This loss of skill arises through several channels. First, AI weather models are trained on historical reanalysis data that, by construction, contain no future climate states; when atmospheric conditions drift far from the training distribution—as they do under strong warming—skill falls off nonlinearly. Second, the physics governing TC intensification (for instance, potential intensity theory) shifts under climate change, so statistical patterns learned from the past no longer hold. Third, warming can switch on dynamical regimes that were rarely seen historically, such as storms retaining major hurricane strength far inland thanks to greater moisture availability.
Reinforcement learning is well suited to climate-adaptive evacuation planning because it can learn from scenarios with no precedent. Beyond evacuation, RL has succeeded across a spectrum of disaster-response and emergency-management tasks. Sadeghlou et al. [38] applied RL to traffic signal control for urban evacuation, whereas Chen and Tang [39] and Sharma et al. [40] used deep Q-networks for emergency resource allocation and building evacuation, respectively. Together these works confirm the viability of RL for real-time decision support under partial observability—structurally close to the forecast uncertainty setting examined here—while also exposing common difficulties of reward design and generalization to out-of-distribution events that our climate-forward training tackles head-on. Unlike conventional optimization that presupposes stable probability distributions, RL can track shifting climate patterns and declining forecast reliability. The RL framework of Cui et al. [9] bore this out in the current climate, gaining 8% in performance by adapting dynamically to forecast uncertainty.
Moving from the present to future climate, however, poses distinctive problems for RL systems. Reward functions must be recalibrated to altered risk profiles, the state space must grow to encode climate-driven uncertainties, and training must somehow ready the agent for conditions beyond the envelope of past experience. We meet these challenges by embedding climate projections directly into the training data, yielding what we call “climate-forward” reinforcement learning, which explicitly accounts for non-stationary storm statistics and eroding forecast skill.

2.5. The Adaptation Limits Hypothesis

A nascent line of climate-adaptation research asks whether technological and managerial gains can indefinitely counterbalance growing physical hazards. The “adaptation limits” hypothesis holds that past certain thresholds of warming, even optimal responses fare worse than suboptimal responses do today. The implications for coastal communities are profound, raising the prospect that some locations may become effectively unevacuable under extreme warming.
Earlier studies distinguish biophysical limits (e.g., infrastructure that cannot withstand a category-6-equivalent storm), economic limits (evacuation costs that outstrip community resources), and social limits (repeated evacuations that trigger permanent out-migration). Pinning these limits down, however, demands integrated assessments that join climate projections, hazard modeling, and behavioral response—exactly the integration this study supplies. Comparing evacuation performance under optimized decisions across climate scenarios lets us test empirically whether adaptation can hold outcomes as acceptable or whether fundamental limits surface.
We extend Cui et al. [9] by feeding climate projections straight into the RL training loop, producing evacuation strategies that remain robust across both present and future storm behavior. By training on climate-adjusted, forecast-degraded scenarios, the approach readies evacuation systems for a future in which historical precedent no longer guides reliably. Crucially, we measure not only relative improvements (RL versus fixed policies under future climate) but also absolute performance trajectories, which reveal whether technological adaptation can avert deteriorating outcomes or only soften them.

3. Methodology

This study builds on the reinforcement-learning framework of Cui et al. [9], folding in climate-change projections so that evacuation decisions can be evaluated under future storm conditions. We retain the validated evacuation and RL models of Cui et al. [9] and Feng and Lin [8], adding the climate-adjustment components essential to this analysis. The methodology comprises four parts: climate-adjusted hurricane simulation, evacuation traffic modeling, reinforcement learning under climate uncertainty, and training-data generation.

3.1. Study Area and Data

We center the analysis on Florida’s response to Hurricane Irma (2017), the storm that prompted the largest evacuation in the state’s history. The study area spans the whole Florida peninsula, covering roughly 6.5 million residents within evacuation zones and more than 4 million vehicles taking part in the evacuation.
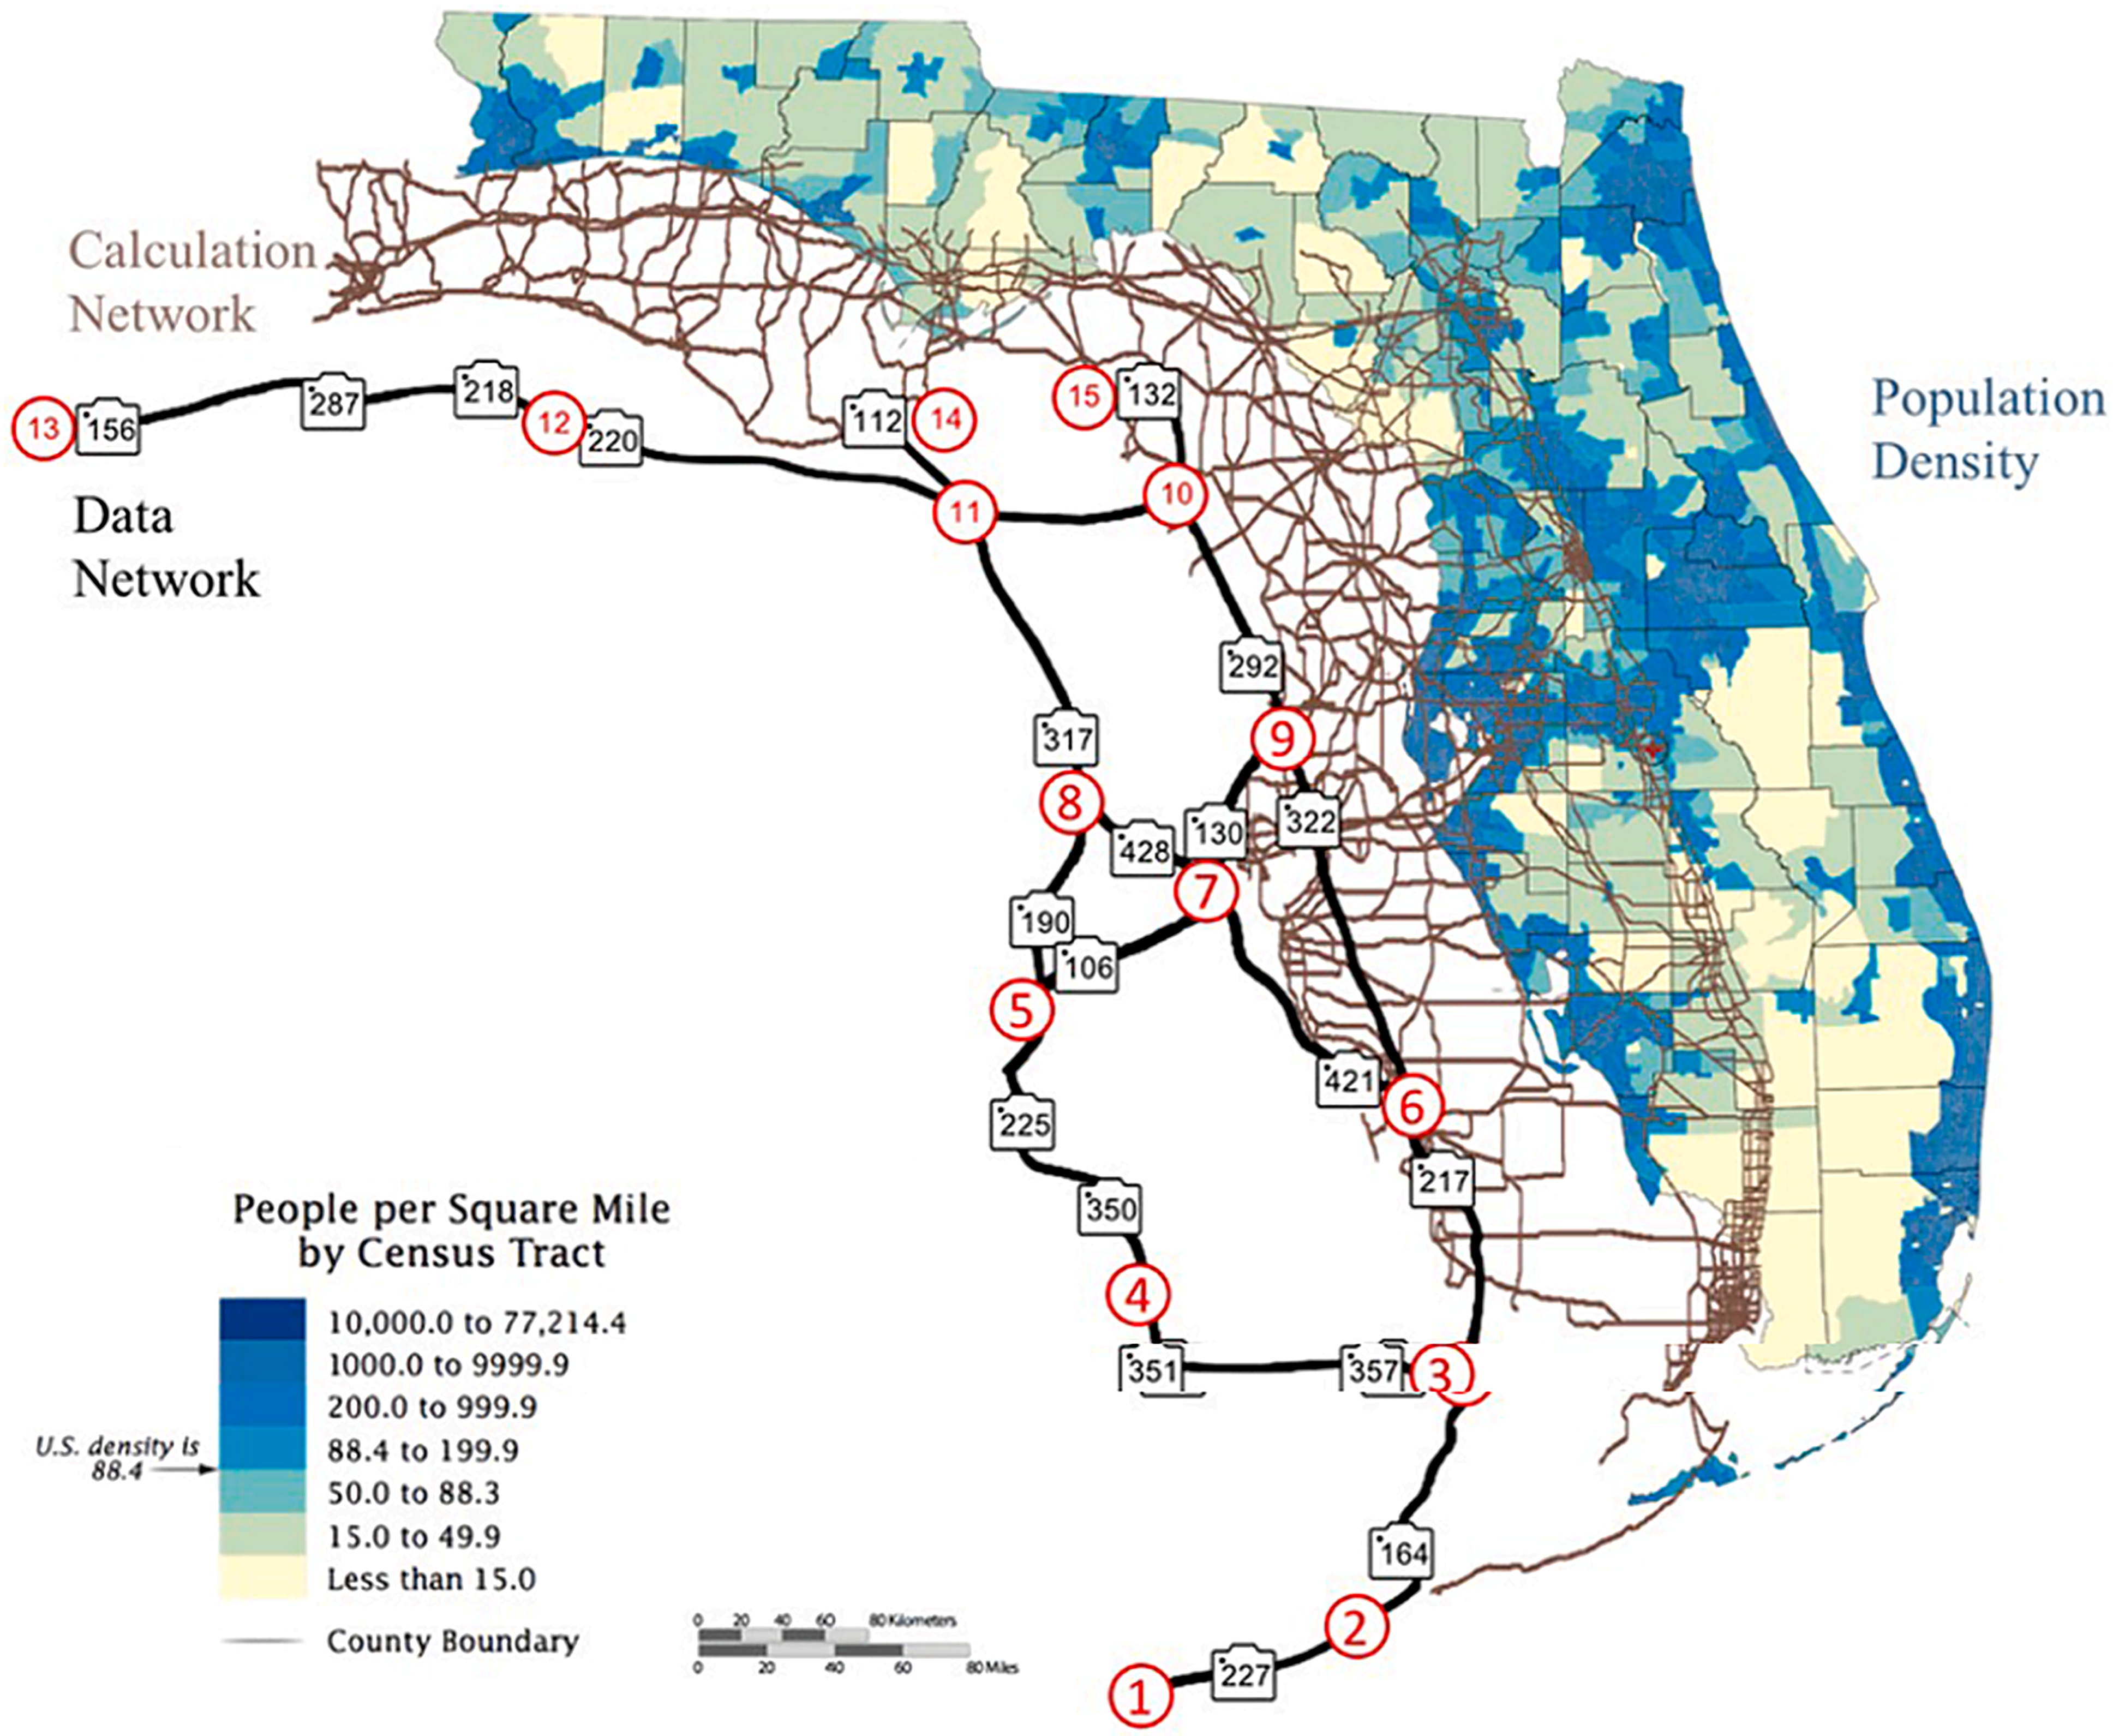
Figure 1 maps the study domain together with the population distribution and the transportation network used in the analysis. Following the Florida Division of Emergency Management’s zoning system, the state’s coastal counties fall into five evacuation zones defined by storm-surge risk and inland reach. Population is distributed very unevenly, concentrating in the Miami–Fort Lauderdale metropolitan area (Southeast Florida), Tampa–St. Petersburg (Southwest Florida), and Jacksonville (Northeast Florida).
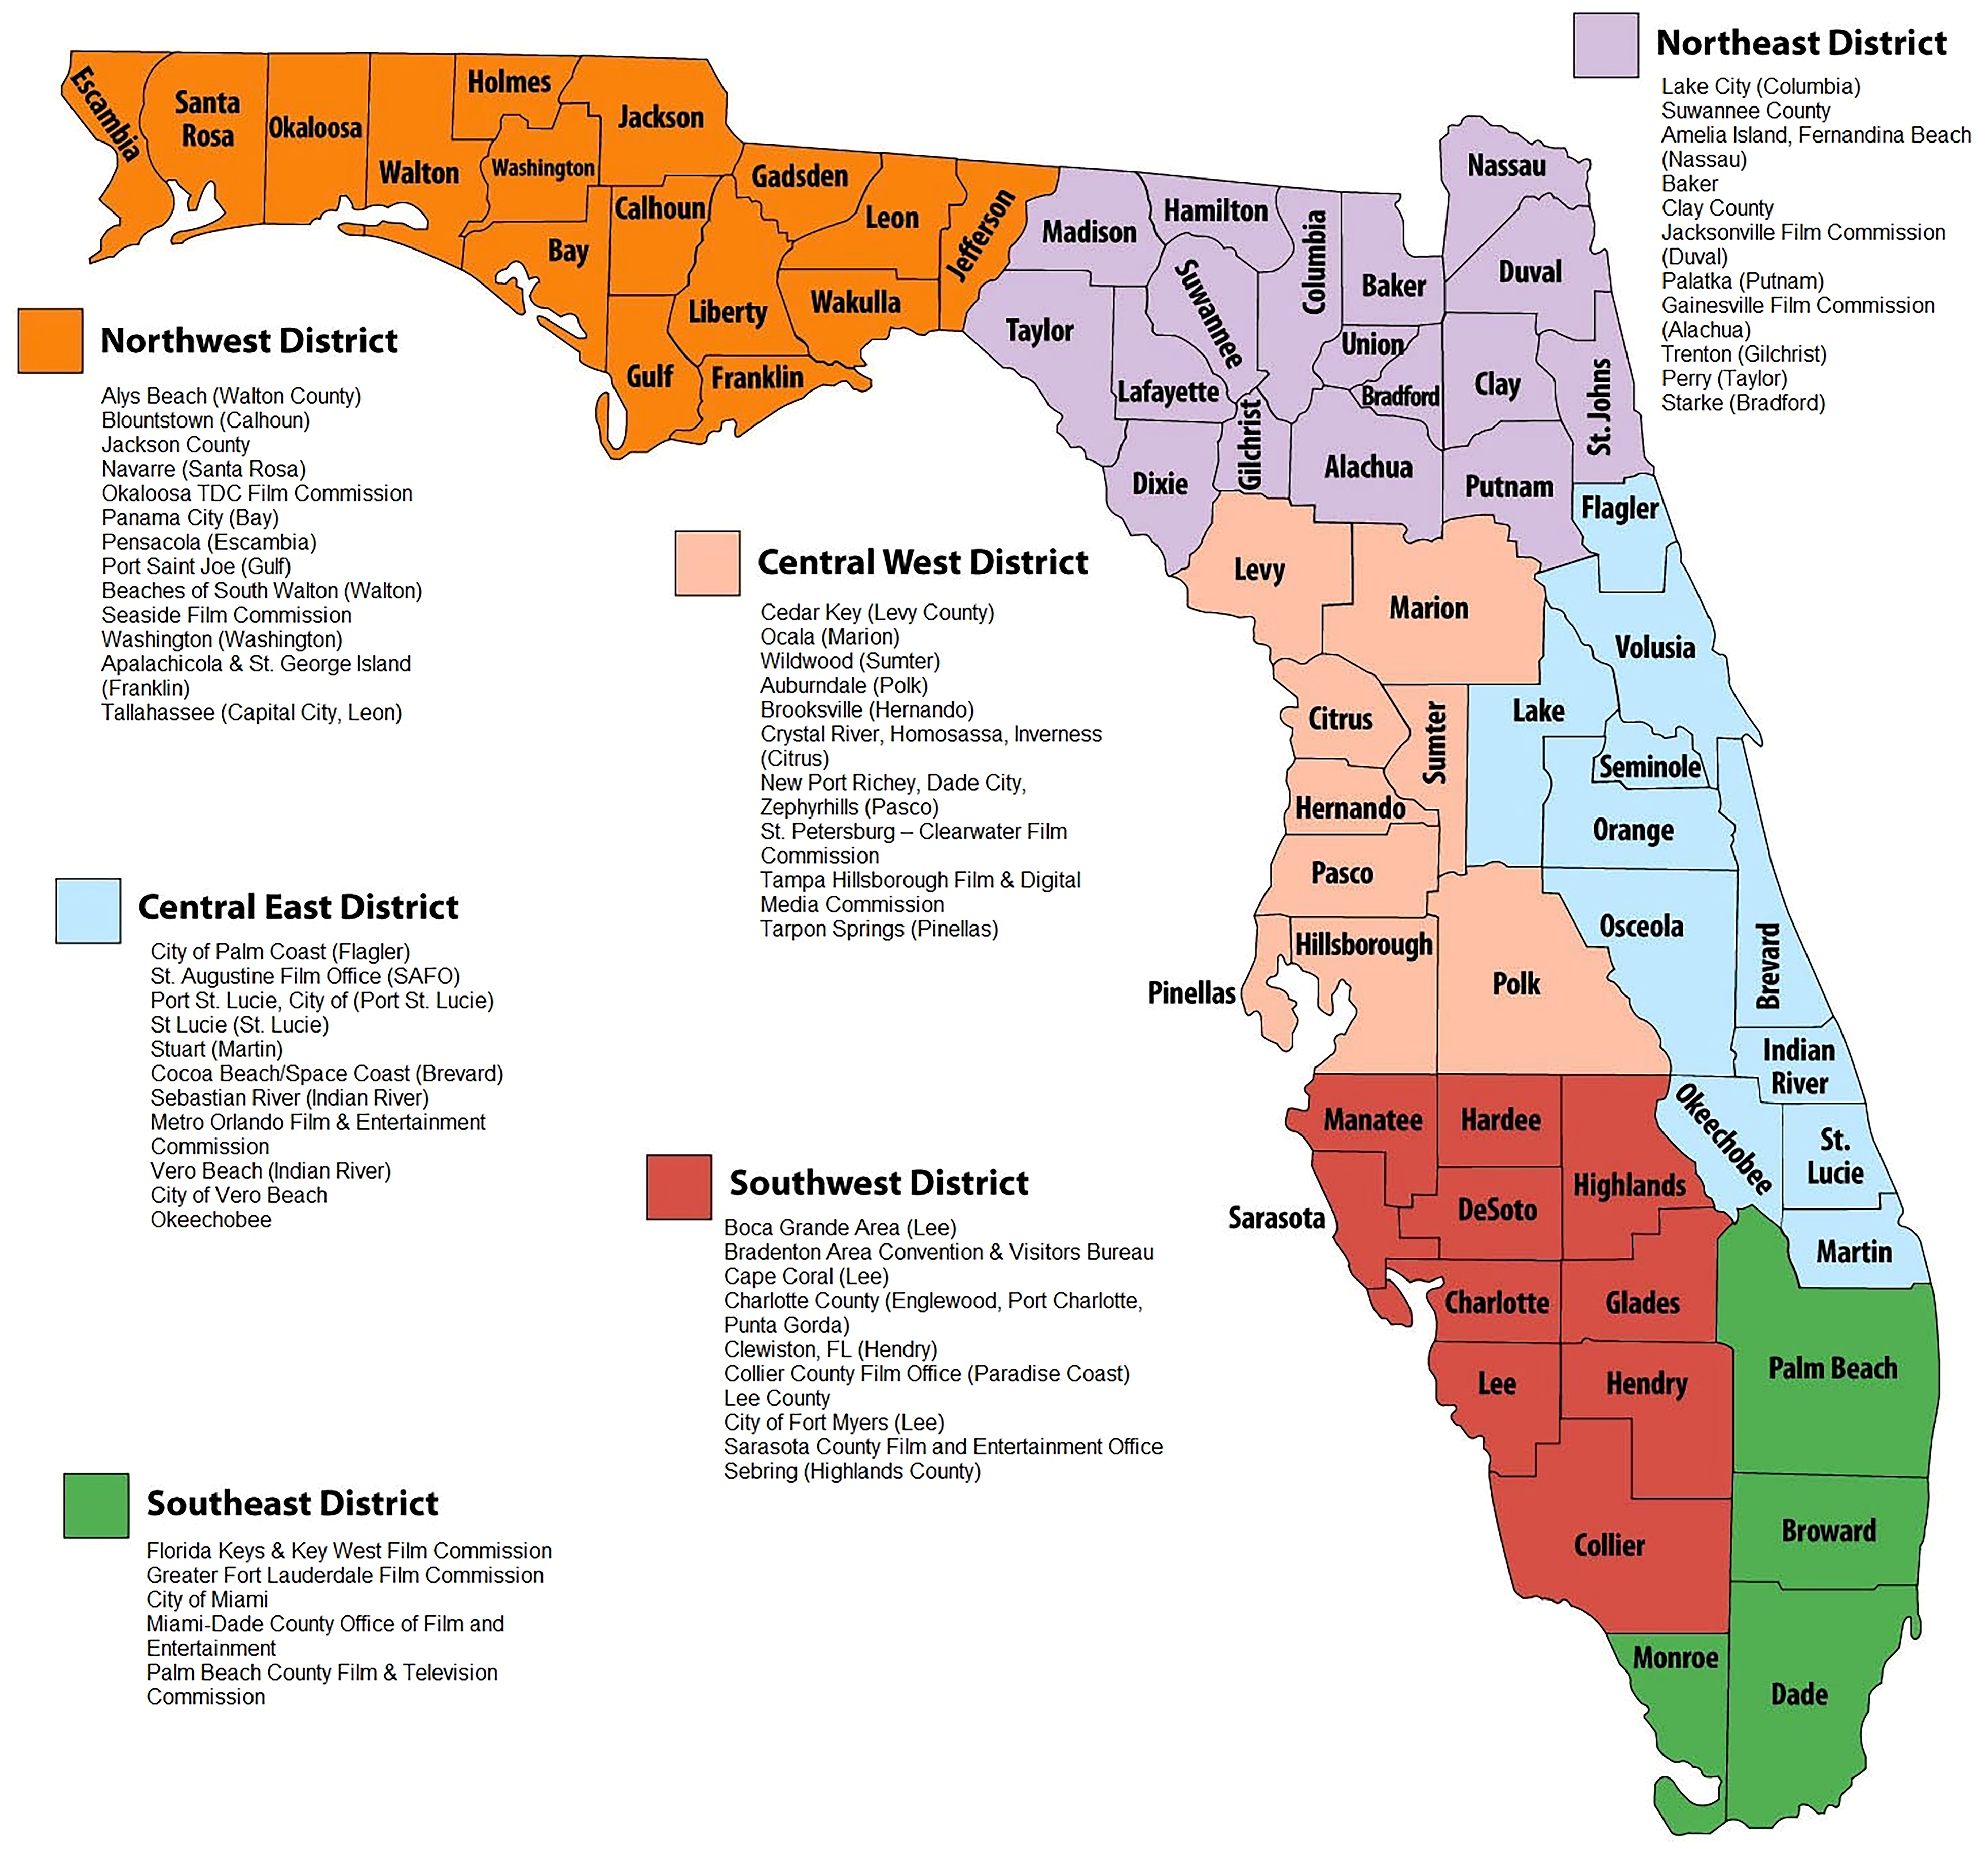
Figure 2 shows the detailed evacuation-zone classification employed by Florida’s County Area Coordinators (FACCs). Zones A and B, exposed to the greatest storm-surge risk, are normally ordered to leave first, whereas zones C–E are activated according to storm intensity and the predicted track.
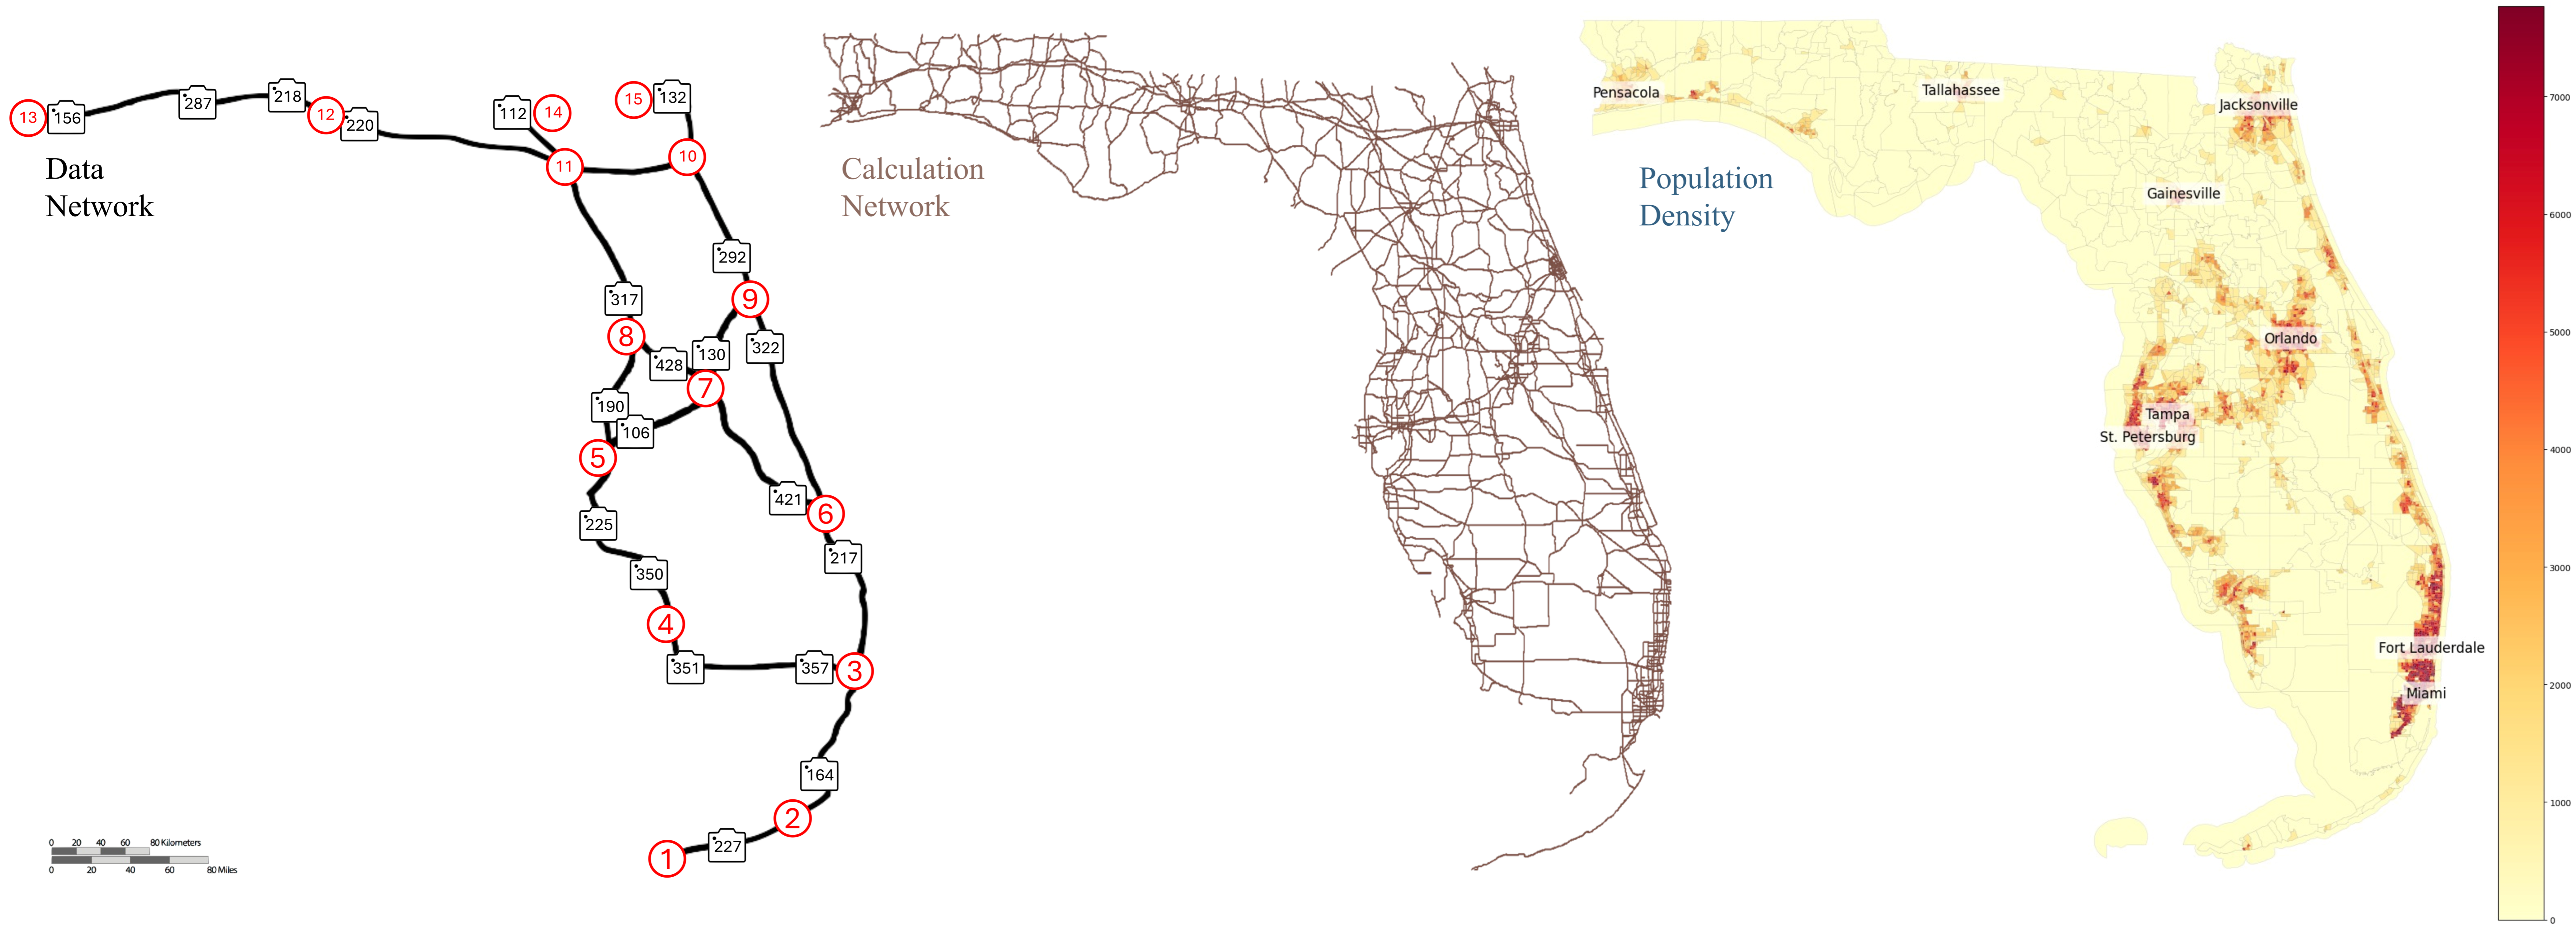
The transportation-network model in Figure 3 comprises 1247 nodes and 2856 directional links that stand for major highways, interstate routes, and principal arterials. Capacity constraints, the traffic patterns recorded during Hurricane Irma, and shelter locations are all incorporated from the validated traffic flow model of Feng and Lin [8].

3.2. Climate-Adjusted Hurricane Simulation Framework

3.2.1. Climate Projection Integration

Following established pseudo-warming methodology, we cast Irma into future climates by adding projected atmospheric and oceanic changes to the recorded 2017 storm. The climate-adjusted atmospheric state is written as:
Φ fut ( t ) = Φ 0 ( t ) + Δ Φ cc ( t )
where Φ collects the relevant fields—specific humidity, geopotential height, atmospheric temperature profiles, and sea-surface temperature (SST). We obtain the climate-change signal Δ Φ cc from CMIP6 ensemble means, taken across the 2050s and 2080s under the SSP2-4.5 and SSP5-8.5 pathways.
For SST adjustments specifically:
Θ fut = Θ 0 + Δ Θ reg · ( 1 + κ · d coast )
where Δ Θ reg spans 1.5–3.0 °C according to the scenario, with κ representing coastal amplification.

3.2.2. Ensemble Generation with Climate Perturbations

Using Pangu-Weather [10] with climate-adjusted initial conditions, we generate ensemble forecasts following the perturbation scheme from our recent work, modified here to reflect the greater variability expected under climate change:
Φ pert ( i ) = Φ fut + η ( i ) · ( 1 + ζ · Δ T glob )
where η ( i ) N ( 0 , Σ ) is the baseline perturbation and ζ scales its magnitude with global temperature change. The scheme lets us produce thousands of climate-perturbed TC scenarios that reproduce both the higher intensity and the greater forecast uncertainty typical of future climates.

3.3. Evacuation Traffic Modeling

We adopt the validated evacuation model of Feng and Lin [8], also used by Cui et al. [9], which combines an evacuation-demand model, an origin–destination model, and a route-choice model within a link-flow-based mean-field traffic framework. Its core components stay fixed across climate scenarios because they encode human behavioral responses that hold regardless of storm characteristics.

3.3.1. Evacuation Demand Model

Household evacuation choices are modeled with a sequential logit. The conditional probability that a household in zone i chooses to evacuate at time t, conditional on not having evacuated yet (i.e., still at home at the start of period t), is:
π t , i e = exp ( U t e ) exp ( U t e ) + exp ( U t s )
U t e = b 0 + b 1 · Order t , i + b 2 · Cat t + b 3 · Dist t , i + b 4 · Surge i
The cumulative evacuation probability becomes:
π t , i = π t , i e τ = 1 t 1 π τ , i s
Across climate scenarios, the behavioral parameters (b) are held constant, but the storm characteristics (Cat, Dist) reflect climate-enhanced intensity and altered tracks, which in turn yield different evacuation dynamics.

3.3.2. Traffic Flow Dynamics

Network flow evolves according to the dynamic model of Cui et al. [9] and Feng and Lin [8]. The Markov transition matrix R t encodes route-choice probabilities, and travel times obey the Bureau of Public Roads (BPR) function:
d q t in = R t · ρ t n t d t
τ ( t ) = τ 0 1 + a v t , k Q 0 · p
d q t out = 1 d d t τ ( t ) q t τ in d t
where R t represents routing decisions conditioned on observed traffic and TC forecasts, and the BPR function maps link flow to travel time.

3.4. Reinforcement Learning Under Climate Uncertainty

3.4.1. Modified State Space

To represent climate-amplified uncertainty, we enlarge the state from Cui et al. [9]:
s t = { T C l o n , t , T C l a t , t , T C c a t , t , σ t trk , σ t int , ϕ 1 , , ϕ 15 , w 1 , , w 5 , C , t }
where σ t trk and σ t int are ensemble-spread metrics that grow markedly under climate change and C { current ,   2050 s ,   2080 s } flags the climate scenario. With this addition, the RL agent can detect and respond to the weaker forecast reliability of future climates.

3.4.2. Objective Function

Following Cui et al. [9], the objective minimizes a weighted sum of four key evacuation metrics:
min w F ( w , T C ) = i c i · f i ( w , T C )
where the importance weights c i remain constant across all climate scenarios:
  • Travel-time term: c 1 = 0.2 ;
  • Home-distance term: c 2 = 0.4 ;
  • Travel-risk term: c 3 = 0.1 ;
  • Shelter-risk term: c 4 = 0.3 .
Importantly, the weights are kept fixed across all climate scenarios. Heightened evacuation risk under climate change enters through the storm characteristics themselves—more intense cyclones, broader wind fields, and poorer forecast accuracy—which alter the values of f i ( w , T C ) directly rather than through reweighted objectives. This keeps any observed deterioration attributable to genuine physical and predictive difficulty rather than to arbitrary changes in the weights.

3.4.3. LSTM Architecture for Climate Scenarios

The LSTM architecture follows Cui et al. [9], with two layers of 64 and 32 units, but its input dimension is enlarged to take in the uncertainty metrics:
h t = LSTM ( x t , h t 1 ; θ )
where x t R 27 now carries the extra uncertainty features ( σ trk , σ int , and the climate-scenario indicator), letting the network adjust its decisions according to forecast reliability.

3.4.4. Q-Learning with Climate-Dependent Rewards

Building on Cui et al. [9], the Q-learning update uses climate-adjusted rewards:
Q ( s t , a t ) ( 1 μ ) Q ( s t , a t ) + μ [ r t C + γ max a Q ( s t + 1 , a ) ]
in which the penalty term discourages decisions taken under high forecast variance:
r t C = F climate ( w , T C ) λ · σ t · I [ evacuation ordered ]
This term nudges the RL agent to weigh forecast uncertainty when timing evacuation orders and, where possible, to avoid acting amid extreme uncertainty.

3.5. Training Data Generation

We assemble training datasets that span the full range of climate scenarios:
  • Present-climate baseline: 10,000 Irma-like TC realizations driven by 2017 atmospheric conditions, following Cui et al. [9].
  • Mid-century projection: 10,000 realizations apiece under both SSP2-4.5 and SSP5-8.5 forcing, spanning 2040–2060.
  • Late-century projection: 10,000 realizations apiece for both SSP pathways over 2080–2100.
Within each scenario set the procedure is:
  • Draw perturbed ensembles from Pangu-Weather under climate-adjusted fields;
  • Derive optimal evacuation orders via the deterministic optimization of Cui et al. [9];
  • Pre-train the LSTM on partial-observation sequences;
  • Fine-tune with Q-learning under climate-dependent rewards.
Following Cui et al. [9], the agent is trained in two stages. Stage 1 (supervised pre-training) fits the LSTM by imitation learning on the deterministic optimal solutions available when the full TC trajectory is known, placing the weights in a region of policy space close to the oracle optimum. Stage 2 (Q-learning fine-tuning) then refines the pre-trained network with Q-learning under realistic partial observation, where at each step the agent sees only the ensemble forecast rather than the true TC state. Splitting training this way keeps the network from settling into the poor local optima that Q-learning from random initialization tends to find in this high-dimensional state space. The climate-adapted framework preserves this two-stage structure while adding the enlarged state (Equation (10)) and the climate-dependent reward (Equation (14)).

3.6. Performance Metrics Under Climate Change

Performance is assessed with the conventional metrics of Cui et al. [9] together with climate-specific indicators. The change in evacuation risk relative to the baseline is:
Δ Risk C = F climate R L F current R L F current R L × 100 %
To assess the robustness of RL decisions under increased uncertainty:
Robustness C = 1 Var [ F climate R L ] Var [ F climate fixed ]
Together these metrics quantify the rise in evacuation risk attributable to climate change, and the robustness gain that RL provides relative to non-adaptive fixed strategies.

3.7. Model Assumptions and Their Justification

The integrated modeling framework rests on several key assumptions; we set out their implications below.
(1)
Behavioral parameters are climate-invariant. The logit coefficients ( b 0 b 4 ) are calibrated to Hurricane Irma (2017) data [8] and held constant across scenarios. The rationale is that the decision drivers—official orders, storm category, distance to the coast, and surge zone—are stable social constructs whose statistical relationships do not shift over the decadal horizons considered [15,22]. What varies across scenarios is the realized value of these covariates (stronger storms, wider surge zones), not households’ sensitivity to them.
(2)
Compliance rates are constant. We assume full compliance with official orders within each designated zone. Real-world compliance, of course, varies with trust in authorities, prior experience, and socioeconomic constraints [23]. Because we compare the relative performance of policies within one behavioral model, this assumption does not bias the RL-versus-fixed comparison; it does mean, though, that the absolute values should be read as indicative upper bounds on compliance-weighted outcomes.
(3)
Route choice follows the validated BPR-based mean-field model. Drivers are taken to select routes per the Markov transition matrix calibrated to Irma traffic data [7], with individual route-learning and real-time navigation effects abstracted away. Standard in large-scale evacuation modeling [27], this simplification makes computation over 20,000 scenarios tractable.
(4)
Climate perturbations are additive. The superposition Φ fut = Φ 0 + Δ Φ cc presumes that the climate signal does not reshape the synoptic steering environment nonlinearly in ways incompatible with the 2017 large-scale pattern. Higher-order interactions are possible, but additive perturbation is a common, physically grounded technique in pseudo-global-warming experiments [1,2].
(5)
AI forecast-skill degradation is stationary within each scenario. We represent degradation through the larger ensemble spread produced by climate-perturbed initial conditions, and we do not credit future gains in AI model training or data assimilation. This is deliberately conservative: since forecasting systems will keep improving, our degradation estimates probably mark a worst-case bound rather than a central projection.

4. Results

4.1. Baseline Performance Under Current Climate

We begin by setting the baseline performance of the reinforcement-learning framework for Hurricane Irma under the current climate, drawing on the validated results of Cui et al. [9]. This baseline anchors the subsequent assessment of how climate change affects evacuation outcomes.
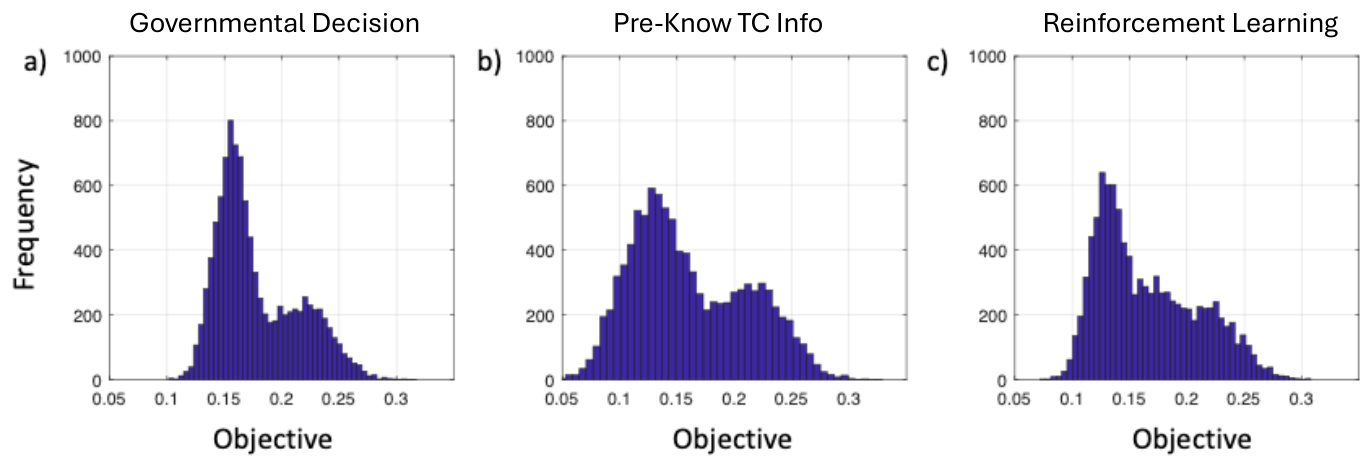
Figure 4 shows the distribution of the objective over 10,000 simulated TC scenarios for three policies. The evacuation objective aggregates four weighted terms: distance from home (0.4), sheltering at home risk (0.3), travel time (0.2), and travel risk (0.1). The original governmental orders give a mean objective of 0.1781 (standard deviation of 0.0358). With perfect TC information the theoretical optimum reaches 0.1606 at a larger spread (0.0502); the RL policy in turn attains 0.1654 (standard deviation of 0.0436), an 8% improvement on the historical decisions [9].
Table 1 disaggregates performance by metric, showing that under the current climate, RL delivers sizeable gains in travel time (a 20% reduction) and distance from home (a 14% reduction) while holding risk levels broadly comparable.

4.2. The Paradox of Enhanced RL Performance Under Climate Change

Projecting Hurricane Irma into future climate scenarios uncovers a striking paradox: RL’s relative advantage over fixed policies grows substantially, yet the absolute evacuation outcomes worsen markedly even under optimal decisions. Table 2 highlights this dual character of climate impacts on evacuation management.
The most arresting result is the steady rise in RL’s relative improvement as the climate worsens. RL beats fixed policies by 7.1% in the current climate, by 10.6% under 2050s SSP2-4.5, by 12.6% under the 2050s SSP5-8.5, and by 16.8% under the 2080s SSP5-8.5. This pattern arises because fixed policies grow ever more inadequate as uncertainty widens—they cannot accommodate the broader range of possible tracks and the rapid intensity swings of future climates. RL, in contrast, learns to hedge against this enlarged uncertainty through more flexible, spatially distributed evacuation strategies.
This stronger relative showing, however, conceals a troubling truth: absolute outcomes fall sharply no matter how good the decisions are. Under the 2080s SSP5-8.5, the RL-optimized evacuation reaches an objective of 0.2389—44% worse than RL under the current climate (0.1654) and, strikingly, 34% worse than even the suboptimal fixed government policy of today (0.1781). The decline persists despite RL making an objectively better choice among the options available under the future climate.
Explaining the paradox requires seeing how climate change reshapes the decision space. Today’s forecast uncertainties permit comparatively tight evacuation windows: at 72 h the track forecast carries a cross-track error of about 145 km, which supports targeted evacuations. Under the 2080s SSP5-8.5, that error swells to 280 km, compelling orders for populations that may face no threat at all. Likewise, intensity-forecast standard deviations rise from 12 m/s to 21 m/s, so that moderate storms needing limited evacuation cannot be told apart from major hurricanes requiring mass exodus until the storm is perilously near landfall.
The component metrics reveal which facets of the evacuation deteriorate under warming despite RL optimization. In absolute terms travel time degrades most, climbing from 0.1235 today to 0.2008 by the 2080s SSP5-8.5 case—a 63% rise despite RL’s best efforts. The cause is that the framework must launch evacuations earlier and over larger areas to preserve safety margins amid greater uncertainty. In effect it trades efficiency for robustness, accepting certain congestion to forestall catastrophe should the forecast prove wrong.
The shelter-risk metric is especially worrying. Even under RL optimization, shelter risk climbs from 0.2083 to 0.2954 by the 2080s (a 42% increase), driven by storms 15–20% more intense with surges 25–30% higher. RL reacts by evacuating more people from marginal-risk areas, but this cascades—more evacuees bring more congestion and longer travel times and, paradoxically, raise travel risk for those leaving genuinely high-risk zones.
RL’s rising value under climate change reflects its greater skill in negotiating these impossible trade-offs. Whereas fixed policies follow preset rules blind to changing conditions, RL adjusts the timing and spatial spread of evacuations as forecasts update. When ensembles disagree sharply on track direction, for example, RL begins partial evacuations across several candidate impact zones instead of waiting for a clarity that may never arrive. This adaptive capacity grows more valuable as uncertainty mounts, which is why RL’s relative improvement rises from 7.1% to 16.8% across the scenarios.
Yet this stronger relative performance should not mask the core difficulty: climate change makes evacuation management a no-win proposition. Under the future climate, RL must pick among poor options—early mass evacuations that lock in vast social and economic costs, or delayed targeted ones that risk catastrophe if a storm intensifies rapidly or veers suddenly. The framework grows ever more adept at these tragic choices even as the choices themselves deteriorate. The implication for coastal communities is sobering: even with flawless decision technology, warming will drive unavoidable growth in both evacuation burden and risk.

4.3. Forecast Uncertainty Scaling Under Climate Change

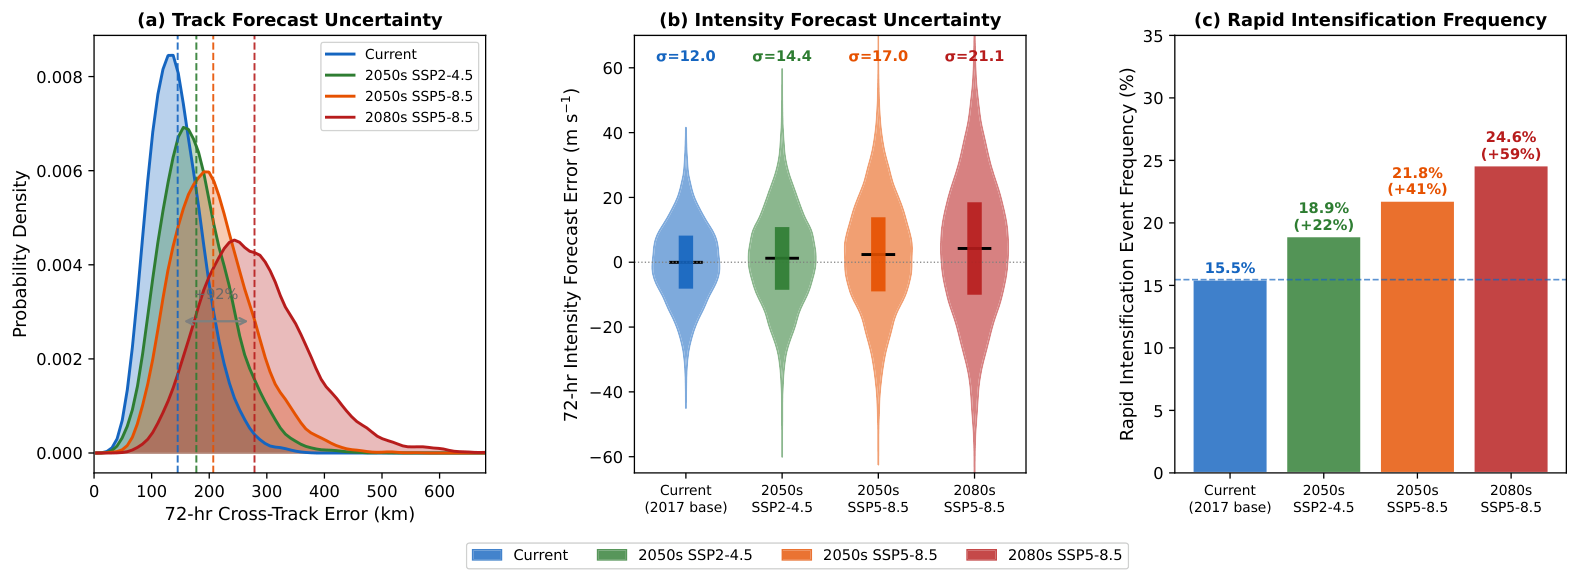
To explain why even optimized decisions fare poorly under future climate, we quantify how warming degrades ensemble forecast skill across all four scenarios. Figure 5 and Table 3 report the ensemble-spread metrics computed from our 10,000-member Pangu-Weather ensembles for each scenario.
Several mechanisms drive the large rise in track-forecast errors under climate change: Arctic amplification flattens meridional temperature gradients and so favors more persistent mid-latitude blocking, which lowers TC-steering predictability; TC–ocean coupling grows more intricate as subsurface ocean heat content becomes more heterogeneous; and rapid intensification turns both more common and less predictable as several thermodynamic thresholds are crossed at once under high-end warming [2,4]. The mean 72 h cross-track error rises from 145 km today to 178 km (+23%), 207 km (+43%), and 280 km (+93%) under the 2050s SSP2-4.5, 2050s SSP5-8.5, and 2080s SSP5-8.5, respectively (Table 3, Figure 5a). The 90th-percentile errors—which set worst-case evacuation-zone sizing—grow even faster, from 208 km to 399 km under the 2080s SSP5-8.5, a 92% jump.
Intensity forecasts degrade even more severely. The standard deviation of 72 h intensity errors rises from 12.0 m s−1 in the current climate to 21.1 m s−1 under the 2080s SSP5-8.5 (Table 3, Figure 5b), a 76% increase. The ensemble distributions also acquire a positive mean bias in the future climate (+4.3 m s−1 under the 2080s SSP5-8.5), indicating a systematic under-forecast of intensity as Pangu-Weather extrapolates beyond its historical training range. Such uncertainty erodes the reliability of category-based evacuation planning: authorities cannot tell a storm needing only limited coastal evacuations from one requiring a full regional exodus until it is dangerously near landfall.
Rapid intensification (RI) events—defined as ≥35 kt of intensification within 24 h—rise from 15.5% of ensemble members in the current climate to 24.6% under the 2080s SSP5-8.5, a 59% increase in line with projected changes in North Atlantic TC intensification rates (Figure 5c). This spread of RI is a key driver of the performance decline: it shrinks the effective decision window from 48–60 h today to under 36 h under the 2080s SSP5-8.5, since a storm may jump a full category after any order is issued.
These metrics supply the physical basis for the performance paradox of Section 4.2: to hold safety margins against a widening uncertainty envelope, the RL framework must issue ever earlier, broader, and less targeted orders, which directly inflate travel time, congestion, and shelter risk even under optimal decision-making.

5. Discussion

This study exposes a critical paradox in climate adaptation for coastal evacuation management. Although reinforcement learning’s relative advantage over fixed policies widens with climate severity—from 7.1% in the current climate to 16.8% under the 2080s SSP5-8.5—absolute outcomes deteriorate sharply, ending up 44% worse than current-climate RL performance. The quantitative comparisons in Table 2 support this directly, and it is in accordance with the adaptation limits hypothesis set out in the climate-resilience literature [16,34].
The decline traces back to compounding physical factors quantified in Table 3 and Figure 5: under the 2080s SSP5-8.5, 72 h track errors expand from 145 to 280 km (+93%), the intensity-forecast standard deviation from 12.0 m s−1 to 21.1 m s−1 (+76%), and RI frequency by 59%. Even AI-enhanced optimization cannot surmount this limit—optimal evacuation management under future climate matches the outcomes of today’s suboptimal approaches. This echoes Davidson et al. [11], who identified forecast uncertainty as the chief bottleneck in evacuation timing, and extended it by showing that climate change systematically deepens that bottleneck.
These results unsettle conventional adaptation thinking. Upgrading evacuation infrastructure (highways, contraflow lanes) yields diminishing returns when the binding constraint is irreducible forecast uncertainty [32]. Effective adaptation instead calls for a shift away from evacuation-centric measures toward resilient infrastructure (hardened construction, elevated first floors) and managed retreat from the most exposed areas, as the coastal-resilience literature increasingly urges [41,42]. Climate change also breeds adaptation inequity: as RL’s advantage grows from 7% to 17%, access to technology increasingly dictates outcomes. Advanced evacuation tools should therefore be treated as public goods with universal access rather than as competitive advantages for better-resourced jurisdictions [43].
Risk communication grows harder under the future climate. As shown here, the decision window narrows while forecast uncertainty widens, which calls for scenario-based messaging that acknowledges irreducible uncertainty yet still spurs protective action without causing warning fatigue [24,25]. Today’s categorical schemes (watch/warning/order) may not suit the distributed, dynamic evacuation strategies that climate uncertainty demands. Future systems should embed probabilistic ensemble information in formats accessible to diverse populations [23].
Several limitations merit note. First, the climate-perturbation approach superimposes mean climate signals additively on the 2017 storm environment, so higher-order synoptic interactions and changes in TC steering flow are not fully captured. Second, holding behavioral parameters constant across scenarios may understate shifts in public response as storm climatology moves beyond historical experience [15,22]. Third, the analysis is specific to Florida and Hurricane Irma; transferring it to regions with other network topologies, storm climatologies, and institutional settings needs further study. Fourth, the AI-forecast degradation estimates rest on ensemble spread under perturbed initial conditions and may miss some sources of skill loss. Future work should broaden the analysis to other regions, add behavioral adaptation via agent-based models [28], build integrated economic-loss frameworks, and examine compound hazards such as sea-level rise, concurrent rainfall, and infrastructure cascades.

6. Conclusions

This study makes three principal contributions to the literature on climate adaptation and evacuation management.
Empirical findings. From 20,000 climate-perturbed ensemble scenarios, we quantify how climate change systematically degrades both the physical and the informational conditions for hurricane evacuation (Table 3; Figure 5). Under the 2080s SSP5-8.5, the 72 h track-forecast error grows from 145 to 280 km (+93%); the intensity-forecast standard deviation widens from 12.0 m s−1 to 21.1 m s−1 (+76%), reflecting the breakdown of historically trained AI forecast models when faced with unprecedented storm behavior. Rapid-intensification frequency rises by 59%, compressing effective decision windows. Absolute evacuation performance—measured by a multi-component objective spanning travel time, distance from home, travel risk, and sheltering at home risk—falls by 44% relative to current-climate RL despite optimal decision-making (Table 2).
Conceptual contribution. We formally define and empirically demonstrate the climate evacuation paradox: the relative value of RL optimization climbs from 7.1% to 16.8% as climate severity rises, yet absolute outcomes under optimized future climate decisions (objective of 0.239) trail today’s suboptimal fixed policies (objective of 0.178). This is the first quantitative, scenario-specific evidence that adaptation limits in evacuation management are not merely theoretical but materialize at realistic mid-to-late-century warming.
Policy recommendations. The results show that leaning solely on better evacuation decision-making cannot stop outcomes from worsening under substantial climate change. Effective resilience must pair (i) sustained investment in RL and AI forecasting tools, whose relative value keeps rising, with (ii) structural measures—infrastructure hardening, land-use reform to cut coastal exposure, and, where absolute risk thresholds are breached, managed retreat [41,42]. Equitable access to advanced decision-support technology is likewise essential, since RL’s widening relative advantage means that communities without such tools will fare disproportionately worse in a warming world [43].
In a climate-changed world, optimal evacuation management will entail higher costs and risks than today’s suboptimal management. That sobering fact should increase both the urgency of adaptation investment and the case for greenhouse gas mitigation that keeps warming within limits where adaptation stays feasible. Ultimately, keeping coastal communities safe, equitable, and livable is possible only by treating evacuation optimization as one element of a wider sustainability strategy—one that joins technological adaptation with structural risk reduction and emissions mitigation to hold climate risks within bounds that remain both adaptable and sustainable.

Author Contributions

Conceptualization, K.F. and Y.C.; methodology, K.F. and Y.C.; software, Y.C.; validation, Y.C., Y.S. and J.H.; formal analysis, Y.C. and K.F.; investigation, Y.C.; resources, K.F.; data curation, Y.C.; writing—original draft preparation, Y.C. and K.F.; writing—review and editing, K.F., Y.S., J.H., H.X., Q.W. and K.L.; visualization, Y.C.; supervision, K.F.; project administration, K.F.; funding acquisition, K.F. All authors have read and agreed to the published version of the manuscript.

Funding

This research was supported by the Fundamental and Interdisciplinary Disciplines Breakthrough Plan of the Ministry of Education of China (Grant No. JYB2025XDXM908), The Explorers Program of Shanghai (Basic Research Funding; 24TS1401600), Xiaomi Foundation, and Shenzhen Science and Technology Program (Grant No. KJZD20240903104202004).

Institutional Review Board Statement

Not applicable.

Informed Consent Statement

Not applicable.

Data Availability Statement

The data and code that support the findings of this study are available from the corresponding author upon reasonable request.

Acknowledgments

We acknowledge the use of Pangu-Weather model for weather forecasting ensemble generation and CMIP6 climate projections for climate scenario development.

Conflicts of Interest

Authors Haonan Xu, Qinyu Wei, and Kaiyu Li were employed by the Shanghai Aircraft Design and Research Institute. The remaining authors declare that the research was conducted in the absence of any commercial or financial relationships that could be construed as a potential conflict of interest.

References

  1. Knutson, T.R.; McBride, J.L.; Chan, J.; Emanuel, K.; Holland, G.; Landsea, C.; Held, I.; Kossin, J.P.; Srivastava, A.; Sugi, M. Tropical cyclones and climate change. Nat. Geosci. 2010, 3, 157–163. [Google Scholar] [CrossRef]
  2. Emanuel, K.A. Downscaling CMIP5 climate models shows increased tropical cyclone activity over the 21st century. Proc. Natl. Acad. Sci. USA 2013, 110, 12219–12224. [Google Scholar] [CrossRef] [PubMed]
  3. Mendelsohn, R.; Emanuel, K.; Chonabayashi, S.; Bakkensen, L. The impact of climate change on global tropical cyclone damage. Nat. Clim. Change 2012, 2, 205–209. [Google Scholar] [CrossRef]
  4. Zhang, F.; Emanuel, K.A. Predictability and prediction of tropical cyclones on daily to seasonal time scales. Trop. Cyclone Res. Rev. 2019, 8, 123–146. [Google Scholar]
  5. Regnier, E. Public evacuation decisions and hurricane track uncertainty. Manag. Sci. 2008, 54, 16–28. [Google Scholar] [CrossRef]
  6. Regnier, E. Evacuation decision making and hurricane track uncertainty. Decis. Anal. 2009, 6, 187–205. [Google Scholar]
  7. Feng, K.; Lin, N. Reconstructing and analyzing the traffic flow during evacuation in Hurricane Irma (2017). Transp. Res. Part D Transp. Environ. 2021, 94, 102788. [Google Scholar] [CrossRef]
  8. Feng, K.; Lin, N. Modeling and analyzing the traffic flow during evacuation in Hurricane Irma (2017). Transp. Res. Part D Transp. Environ. 2022, 110, 103412. [Google Scholar] [CrossRef]
  9. Cui, Y.; Feng, K.; Ma, W.; He, B. Reinforcement learning for optimizing hurricane evacuation decisions: Hurricane Irma case study. Transp. Res. Part D Transp. Environ. 2025, 147, 104882. [Google Scholar]
  10. Bi, K.; Xie, L.; Zhang, H.; Chen, X.; Gu, X.; Tian, Q. Accurate medium-range global weather forecasting with 3D neural networks. Nature 2023, 619, 533–538. [Google Scholar] [CrossRef] [PubMed]
  11. Davidson, R.A.; Nozick, L.K.; Wachtendorf, T.; Blanton, B.; Colle, B.; Kolar, R.L.; Dresback, K.; Yi, W.; Yang, K.; Leonardo, N. Integrating forecast and observed uncertainties to estimate evacuation-related decision timing during extreme weather events. Int. J. Disaster Risk Reduct. 2020, 46, 101510. [Google Scholar]
  12. Sadri, A.M.; Ukkusuri, S.V.; Gladwin, H. Integrating social network analysis with analytic network process for identifying the critical evacuation paths. Transp. Res. Part A Policy Pract. 2018, 114, 38–60. [Google Scholar]
  13. Racherla, P.; Chinthala, J. Artificial Intelligence for Climate Change Adaptation: Opportunities and Challenges. Front. Artif. Intell. 2022, 5, 844425. [Google Scholar]
  14. Nateghi, R.; Mukherjee, S. A multi-paradigm framework to assess the impacts of climate change on end-use energy demand. PLoS ONE 2021, 16, e0258504. [Google Scholar] [CrossRef]
  15. Lindell, M.K. Hurricane evacuation studies: Methodological considerations, reliable findings, contradictory results, and unresolved issues. Clim. Res. 2021, 68, 141–163. [Google Scholar]
  16. Marchau, V.A.W.J.; Walker, W.E.; Bloemen, P.J.T.M.; Popper, S.W. (Eds.) Decision Making under Deep Uncertainty: From Theory to Practice; Springer: Cham, Switzerland, 2019. [Google Scholar]
  17. Urbanik, T. Evacuation time estimates for nuclear power plants. J. Hazard. Mater. 2000, 75, 165–180. [Google Scholar] [CrossRef] [PubMed]
  18. Lindell, M.K.; Prater, C.S. Critical behavioral assumptions in evacuation time estimate analysis for private vehicles: Examples from hurricane research and planning. J. Urban Plan. Dev. 2007, 133, 18–29. [Google Scholar] [CrossRef]
  19. Wolshon, B. Evacuation planning and engineering for Hurricane Katrina. Bridge 2006, 36, 27–34. [Google Scholar]
  20. Zscheischler, J.; Martius, O.; Westra, S.; Bevacqua, E.; Raymond, C.; Horton, R.M.; van den Hurk, B.; AghaKouchak, A.; Jézéquel, A.; Mahecha, M.D.; et al. A typology of compound weather and climate events. Nat. Rev. Earth Environ. 2020, 1, 333–347. [Google Scholar] [CrossRef]
  21. Couasnon, A.; Eilander, D.; Muis, S.; Veldkamp, T.I.E.; Haigh, I.D.; Wahl, T.; Winsemius, H.C.; Ward, P.J. Measuring compound flood potential from river discharge and storm surge extremes at the global scale. Nat. Hazards Earth Syst. Sci. 2020, 20, 489–504. [Google Scholar] [CrossRef]
  22. Huang, S.-K.; Lindell, M.K.; Prater, C.S. Who leaves and who stays? A review and statistical meta-analysis of hurricane evacuation studies. Environ. Behav. 2022, 48, 991–1029. [Google Scholar]
  23. Baker, E.J. Hurricane evacuation behavior. Int. J. Mass Emergencies Disasters 2021, 9, 287–310. [Google Scholar]
  24. Demuth, J.L. Explicating experience: Development of a valid scale of past hazard experience for tornadoes. Risk Anal. 2020, 40, 1921–1943. [Google Scholar]
  25. Morss, R.E.; Mulder, K.J.; Lazo, J.K.; Demuth, J.L. How do people perceive, understand, and anticipate responding to flash flood risks and warnings? Results from a public survey in Boulder, Colorado, USA. J. Hydrol. 2022, 508, 127–141. [Google Scholar]
  26. Chiu, Y.-C.; Zheng, H.; Villalobos, J.; Gautam, B. Modeling no-notice mass evacuation using a dynamic traffic flow optimization model. IIE Trans. 2007, 39, 83–94. [Google Scholar] [CrossRef]
  27. Pel, A.J.; Bliemer, M.C.; Hoogendoorn, S.P. A review on travel behaviour modelling in dynamic traffic simulation models for evacuations. Transportation 2012, 39, 97–123. [Google Scholar]
  28. Chen, X.; Zhan, F.B. Agent-based modelling and simulation of urban evacuation: Relative effectiveness of simultaneous and staged evacuation strategies. J. Oper. Res. Soc. 2008, 59, 25–33. [Google Scholar] [CrossRef]
  29. Lämmel, G.; Grether, D.; Nagel, K. The representation and implementation of time-dependent inundation in large-scale microscopic evacuation simulations. Transp. Res. Part C Emerg. Technol. 2010, 18, 84–98. [Google Scholar] [CrossRef]
  30. Ying, W.; Cheng, Y.; Ling, H.; Shi, Y. A hybrid model for simulating urban evacuation. Phys. A Stat. Mech. Its Appl. 2016, 451, 578–592. [Google Scholar]
  31. Ahmed, S.; Dey, K.; Fries, R. Evaluation of transportation network reliability during emergency evacuation. J. Transp. Saf. Secur. 2019, 11, 586–606. [Google Scholar]
  32. Murray-Tuite, P.; Wolshon, B. Evacuation transportation modeling: An overview of research, development, and practice. Transp. Res. Part C Emerg. Technol. 2013, 27, 25–45. [Google Scholar] [CrossRef]
  33. Ozbay, K.; Iloglu, S.; Morgul, E.F.; Mudigonda, S.; Iyer, S. Optimal evacuation planning under uncertainty. Transp. Res. Rec. 2023, 2677, 1–15. [Google Scholar]
  34. Dolan, F.; Lamontagne, J.; Link, R.; Hejazi, M.; Reed, P.; Edmonds, J. Evaluating the economic impacts of the 1.5 °C global warming target. Sci. Adv. 2021, 7, eabl4927. [Google Scholar]
  35. Reichstein, M.; Camps-Valls, G.; Stevens, B.; Jung, M.; Denzler, J.; Carvalhais, N.; Prabhat, F. Deep learning and process understanding for data-driven Earth system science. Nature 2019, 566, 195–204. [Google Scholar] [CrossRef] [PubMed]
  36. Lam, R.; Sanchez-Gonzalez, A.; Willson, M.; Wirnsberger, P.; Fortunato, M.; Alet, F.; Ravuri, S.; Ewalds, T.; Eaton-Rosen, Z.; Hu, W.; et al. Learning skillful medium-range global weather forecasting. Science 2023, 382, 1416–1421. [Google Scholar] [CrossRef] [PubMed]
  37. Price, I.; Sanchez-Gonzalez, A.; Alet, F.; Andersson, T.R.; El-Kadi, A.; Masters, D.; Ewalds, T.; Stott, J.; Mohamed, S.; Battaglia, P.; et al. Probabilistic weather forecasting with machine learning. Nature 2024, 637, 84–90. [Google Scholar] [CrossRef] [PubMed]
  38. Sadeghlou, T.; Galip Gok, S.; Gelenbe, E.; Gai, W. Adaptive evacuation management using reinforcement learning. ACM Trans. Auton. Adapt. Syst. (TAAS) 2020, 14, 1–23. [Google Scholar]
  39. Chen, Y.; Tang, J. Emergency resource allocation using reinforcement learning. Knowl.-Based Syst. 2020, 205, 106270. [Google Scholar]
  40. Sharma, J.; Andersen, P.-A.; Granmo, O.-C.; Goodwin, M. Deep Q-learning with Q-matrix transfer learning for novel fire evacuation environment. IEEE Trans. Syst. Man Cybern. Syst. 2020, 51, 7363–7381. [Google Scholar]
  41. Hino, M.; Field, C.B.; Burke, K.L. Managed retreat as a response to natural hazard risk. Nat. Clim. Change 2017, 7, 364–370. [Google Scholar] [CrossRef]
  42. Siders, A.R.; Hino, M.; Mach, K.J. The case for strategic and managed climate retreat. Science 2019, 365, 761–763. [Google Scholar] [CrossRef] [PubMed]
  43. Cutter, S.L.; Ash, K.D.; Emrich, C.T. The geographies of community disaster resilience. Glob. Environ. Change 2014, 29, 65–77. [Google Scholar] [CrossRef]
Figure 1. Spatial population density (people per square mile by census tract) across Florida, overlaid with the transportation network. Thin brown lines denote the full calculation network; bold black links with red-circled numbered nodes (1–15) denote the data network—locations with observed traffic-flow data used to calibrate the model. White shields mark highway route numbers (adapted from Cui et al. [9]).
Sustainability 18 07020 g001
Figure 2. County-level evacuation-zone classification for Florida (adapted from Cui et al. [9]).
Sustainability 18 07020 g002
Figure 3. Florida evacuation-simulation traffic network (adapted from Cui et al. [9]).
Sustainability 18 07020 g003
Figure 4. Distribution of the evacuation objective under three policies in the current climate: (a) original governmental orders, (b) perfect-information benchmark, (c) RL policy. Adapted from Cui et al. [9].
Sustainability 18 07020 g004
Figure 5. Scaling of forecast uncertainty with climate change, computed over 10,000 Pangu-Weather ensemble members per scenario. (a) Kernel-density estimates of 72 h cross-track position error, with scenario means marked by dashed vertical lines. (b) Violin plots of 72 h intensity-forecast error (m s−1); the box marks the interquartile range and σ the standard deviation, and the dotted horizontal line marks zero forecast error. (c) Frequency of rapid-intensification events (RI, ≥35 kt in 24 h), with the percentage rise over the current-climate baseline annotated above each bar; the dashed horizontal line marks the current-climate baseline frequency.
Sustainability 18 07020 g005
Table 1. Travel and risk metrics compared across policies in the current climate.
MethodTotal Travel
Time
Total Distance
from Home
Total Travel
Risk
Total Risk of Sheltering at Home
Original0.15430.20720.15370.2164
(0.1154, 0.2321)(0.1739, 0.2738)(0.1154, 0.2321)(0.1782, 0.2928)
TC-informed0.10110.17560.14290.2177
(0.0462, 0.2109)(0.1287, 0.2694)(0.0462, 0.2109)(0.1683, 0.3165)
RL0.12350.17730.15220.2083
(0.0750, 0.2205)(0.1371, 0.2577)(0.0750, 0.2205)(0.1614, 0.3021)
Note: Bold entries in the first column denote the evacuation policy compared.
Table 2. Evacuation performance across current and future climate scenarios.
Climate
Scenario
PolicyOverall
Objective
Travel
Time
Distance
from Home
Travel
Risk
Shelter
Risk
CurrentOriginal0.17810.15430.20720.15370.2164
RL0.16540.12350.17730.15220.2083
Improvement7.1%20.0%14.4%1.0%3.7%
2050s SSP2-4.5Original0.21340.18760.23180.19230.2651
RL0.19080.14620.19670.18340.2398
Improvement10.6%22.1%15.1%4.6%9.5%
2050s SSP5-8.5Original0.23650.21270.24720.22080.2945
RL0.20670.16710.21340.20650.2601
Improvement12.6%21.4%13.7%6.5%11.7%
2080s SSP5-8.5Original0.28710.26540.28490.27650.3428
RL0.23890.20080.23670.25180.2954
Improvement16.8%24.3%16.9%8.9%13.8%
Note: Bold entries in the first column denote the climate scenario; italicized “Improvement” rows report the relative percentage gain of RL over the Original policy within each scenario.
Table 3. Ensemble forecast-spread metrics by climate scenario (10,000 Pangu-Weather ensemble members per scenario). Track error denotes the 72 h cross-track position error (km); intensity error denotes the 72 h intensity-forecast error (m s−1, with positive values indicating under-forecast). Rapid intensification (RI) is taken as ≥35 kt (≈18 m s−1) of intensification over 24 h. Parenthetical figures give the 25th–75th percentile range.
Climate Scenario72 h Track Error (km)72 h Intensity Error (m s−1)
MeanSD90th pctMeanSD ( σ )
Current145 (111–174)48208−0.1 (−8 to +8)12.0
2050s SSP2-4.5178 (135–214)60258+1.3 (−8 to +11)14.4
2050s SSP5-8.5207 (157–248)69298+2.3 (−9 to +14)17.0
2080s SSP5-8.5280 (213–334)92399+4.3 (−10 to +19)21.1
Note: Bold entries in the first column denote the climate scenario.
Disclaimer/Publisher’s Note: The statements, opinions and data contained in all publications are solely those of the individual author(s) and contributor(s) and not of MDPI and/or the editor(s). MDPI and/or the editor(s) disclaim responsibility for any injury to people or property resulting from any ideas, methods, instructions or products referred to in the content.