Article

Assessing the Resilience of China’s Beef Cattle Industry: Measurement, Spatiotemporal Dynamics, and Obstacle Factors


College of Economics and Management, Hebei Agricultural University, Baoding 071000, China
*
Author to whom correspondence should be addressed.
Sustainability 2026, 18(14), 7014; https://doi.org/10.3390/su18147014
Submission received: 26 May 2026 / Revised: 30 June 2026 / Accepted: 6 July 2026 / Published: 9 July 2026

Abstract

In the context of increasing beef import dependence, global feed-market volatility, climate risks, and sustainability-oriented livestock transformation, strengthening the resilience of China’s beef cattle industry is essential for food security, rural livelihoods, and green livestock development. Using panel data from 31 Chinese provinces from 2012 to 2022, this study constructs a four-dimensional resilience evaluation system covering foundational, resistance, recovery, and sustainability capacities, and applies the entropy weight method, kernel density estimation, the Dagum Gini coefficient, spatial autocorrelation analysis, and an obstacle degree model. The results show that the national resilience index of China’s beef cattle industry increased from 0.105 in 2012 to 0.167 in 2022, although the overall level remained relatively low. Sustainability capacity exhibited a shallow U-shaped trajectory, while foundational, resistance, and recovery capacities improved more steadily. The average Dagum Gini coefficient was 0.277, indicating persistent regional imbalance in beef cattle industry resilience. Provincial disparities widened, positive spatial agglomeration weakened, and local spatial heterogeneity became more pronounced. The key constraints included insufficient forage supply, a low level of production scale, weak breeding infrastructure, and lagging innovation capacity, with clear spatial heterogeneity. This study develops a resilience evaluation framework for long-cycle livestock industries and provides empirical evidence and policy implications for the sustainable development of the beef cattle industry in China and other developing livestock systems.

1. Introduction

The report to the 20th National Congress of the Communist Party of China clearly proposed accelerating the building of an agricultural powerhouse. Enhancing industrial resilience is an important support for consolidating the foundation of agricultural modernization, strengthening agricultural risk-response capacity, and promoting sustainable agricultural development [1]. As a pillar sector of China’s specialized animal husbandry, the beef cattle industry is not only a livelihood-related industry that ensures the effective supply of high-quality livestock products and optimizes the dietary structure of urban and rural residents [2], but also an important support for revitalizing rural planting and breeding resources, expanding income channels for farmers and herders, advancing comprehensive rural revitalization, and promoting integrated urban-rural development. Therefore, strengthening the resilience of the beef cattle industry is of great strategic significance for safeguarding national food security, stabilizing the livestock product supply system, and promoting the green and low-carbon transformation of animal husbandry [3].
Against the background of global economic restructuring, frequent geopolitical conflicts, and intensifying climate change, China’s beef cattle industry is facing significantly increasing external uncertainty, and the stable operation of the entire industrial chain is being challenged by multiple shocks [4]. From the perspective of the external environment, imbalances in global agricultural trade patterns, sharp fluctuations in international bulk feed prices, and intensified competition in cross-border livestock-product circulation have not only increased the overall costs of domestic forage production, storage, transportation, and processing, but also continuously disturbed the stability of the upstream raw-material supply system of the beef cattle industry [5]. Meanwhile, the frequent occurrence of extreme climate events has further aggravated the instability of high-quality forage supply, increased the risk of animal disease transmission [6], and exerted persistent pressure on the risk resistance and production recovery capacity of the beef cattle breeding chain [7]. Domestically, the structural contradiction between supply and demand in China’s beef cattle market has become increasingly prominent in recent years [8]. The continuous decline in live cattle prices has compressed breeding profit margins, caused frequent losses among large-scale farms and small- and medium-sized farmers, directly reduced the stock of breeding cows, and weakened the domestic breeding capacity of the beef cattle industry [9]. At the same time, China’s beef cattle industry still faces structural constraints such as a low proportion of large-scale breeding, insufficient industrial organization, spatial mismatch between forage resources and breeding demand, and an incomplete animal disease prevention and control system. These internal and external shocks, together with structural weaknesses, are transmitted to the industrial system through supply, cost, circulation, prevention and control, and environmental channels. This indicates that the resilience evaluation of the beef cattle industry should not be limited to output growth, efficiency improvement, or policy effects, but should further focus on the industrial operating foundation, risk-buffering capacity, production recovery capacity, and long-term adaptive capacity.
A systematic review of the existing literature shows that resilience theory initially emphasized the ability of a system to return to its original state after external disturbances, and was later gradually extended to ecological systems, social-ecological systems, regional economic systems, urban systems, and industrial systems. Its connotation has also expanded from simple recovery to a comprehensive capacity involving shock resistance, function maintenance, adaptive adjustment, and structural transformation. Raza et al. examined the impacts of climate change on agricultural production and crop adaptation, pointing out that climate change threatens agricultural production and food security through rising temperatures, changing precipitation patterns, extreme weather events, pests and diseases, and ecosystem changes, while emphasizing the importance of developing climate-resilient agriculture [10]. Hirth et al. explored leverage points for improving agri-food supply chain resilience from the perspectives of civil food resilience and food sovereignty, arguing that short-term recovery alone is insufficient to cope with long-term pressures such as climate change, biodiversity loss, and economic crises, and that food-system resilience should pay greater attention to deeper systemic transformation [11]. Peng analyzed regional economic resilience in the context of the COVID-19 shock and argued that regional economic development is continuously exposed to external disturbances, making the enhancement of economic resilience and adaptive mechanisms an important pathway for sustainable regional development [12]. Du et al. assessed the economic and innovation resilience of regional city networks from a city-industry perspective and revealed the differentiated impacts of the 2008 financial crisis and the COVID-19 pandemic on different industrial sectors and urban networks [13]. These studies have broadened the application boundaries of resilience theory. However, most existing research remains concentrated on macro-regional systems, urban systems, or food supply chains, while relatively limited attention has been paid to the beef cattle sector. In addition, compared with pig and poultry industries, the beef cattle industry is characterized by a long biological production cycle, high capital investment, slow recovery of breeding cow inventories, and strong sensitivity to resource constraints. These attributes determine the particularity of its risk transmission process, production capacity recovery speed, and long-term adjustment path, and therefore require analysis based on its specific development characteristics.
Current research still has three main limitations. First, a specialized analytical framework that matches the development characteristics of the beef cattle industry has not yet been fully established for evaluating its resilience. Second, empirical evidence remains insufficient regarding the long-term spatiotemporal evolution and spatial association effects of beef cattle industry resilience at the provincial scale. Third, there is still a lack of systematic diagnosis of the core obstacle factors restricting resilience improvement. To address these research gaps, this study makes three main contributions. First, by integrating resilience theory, the resource-based view, and adaptive capacity theory, this study constructs a four-dimensional resilience evaluation framework covering foundational capacity, resistance capacity, recovery capacity, and sustainability capacity, thereby providing a theoretical basis for research on beef cattle industry resilience. Second, this study applies kernel density estimation, Dagum Gini coefficient decomposition, and spatial autocorrelation analysis to reveal the distribution dynamics, regional disparities, and spatial agglomeration characteristics of provincial beef cattle industry resilience in China from 2012 to 2022. Third, based on the obstacle degree model, this study identifies the key factors restricting resilience improvement in different regions and translates the empirical findings into operable and region-specific policy implications.

2. Literature Review

2.1. Research on Sustainable and High-Quality Development of Beef Cattle Industry

The sustainable and high-quality development of the beef cattle industry constitutes an important foundation for understanding industrial resilience. Existing studies have conducted relatively systematic discussions from the perspectives of development performance, resource allocation, efficiency improvement, and policy governance, providing the necessary theoretical basis and empirical references for further introducing a resilience perspective.
Regarding industrial competitiveness, Zhao et al. [14], guided by competitive advantage theory and the Porter diamond model, constructed a comprehensive evaluation index system for China’s beef cattle industry competitiveness from the dimensions of production factors, market demand, related supporting industries, firm strategy and competition, and the role of government. They further used principal component analysis to examine regional differences and temporal evolution characteristics at the provincial level. Their study suggested that strengthening grassland ecological protection, improving beef cattle breeding and breed improvement systems, developing high-quality forage resources, and promoting inter-regional industrial coordination are important pathways for enhancing the core competitiveness of the beef cattle industry. In terms of high-quality development, Zhang measured the high-quality development level of China’s beef cattle industry using the entropy weight method and identified its influencing factors through a two-way fixed effects model. The results showed that the high-quality development level of China’s beef cattle industry generally exhibited a slow and fluctuating upward trend, but with significant regional heterogeneity. Quality supervision capacity and the application of agricultural technological innovation were identified as key drivers of high-quality industrial development [15]. These studies reveal the basic conditions for beef cattle industry upgrading from the perspectives of development level and competitive capacity, but pay relatively insufficient attention to industrial stability and recovery capacity under shock scenarios.
Regarding sustainable development, Li constructed an evaluation system for the sustainable development of the beef cattle industry, analyzed its spatiotemporal differentiation characteristics, and further explored relevant influencing factors. The study showed that technological investment and the policy environment are important supports for improving the sustainable development capacity of the beef cattle industry [16]. Related international studies have also expanded discussions on livestock sustainability from the perspectives of farm system design, resource recycling, red meat supply, and production costs. Medic et al. [17], taking a farm in Vojvodina, Serbia, as a case study, examined the design of a sustainable farm complex and emphasized the supporting role of farm spatial layout, resource recycling, and environmentally friendly production models in the sustainable development of animal husbandry. Ghanem et al. [18] analyzed the impact of livestock development on local red meat production and food security in Saudi Arabia, arguing that enhancing local red meat supply capacity helps strengthen regional food security. Wang et al. [19], based on survey data from grass-fed organic milk production in the northeastern United States, found that forage supply, labor input, breeding costs, and market prices are important factors affecting the sustainable operation of grass-fed livestock farming. These studies indicate that the sustainable development of animal husbandry involves not only the improvement of production efficiency, but also resource allocation, environmental governance, cost control, and food security.
In terms of industrial efficiency and policy support, Li et al. [20] used a PVAR model to empirically analyze the dynamic impacts of agricultural mechanization, high-quality forage production, and large-scale breeding on the total factor productivity of the beef cattle industry. The results showed that total factor productivity in the beef cattle industry exhibited significant regional imbalance, and that different regions varied in resource endowments, production organization, and technological conditions, providing a new research perspective for the green and efficient development of the beef cattle industry. Liu et al. [21] employed a multivariate logistic model to evaluate the implementation effects of beef cattle-related subsidy policies and found that breeding cow subsidies could effectively stabilize the existing breeding scale, but had no significant effect on expanding breeding scale. This study provides empirical evidence for optimizing support policies for the beef cattle industry and improving policy precision and sustainability.
Overall, the above studies have deepened the understanding of the development foundation, efficiency improvement, and policy optimization of the beef cattle industry. However, most of them take development performance, efficiency changes, or policy effects as their main explanatory objects, while paying insufficient attention to function maintenance, risk absorption, supply recovery, and long-term adjustment under uncertain shocks. Therefore, it is necessary to further introduce an industrial resilience perspective on the basis of existing research on beef cattle industry development.

2.2. Research on Animal Husbandry Industry Resilience

Research on resilience in the field of animal husbandry is usually closely related to major animal diseases, input price fluctuations, tightening environmental constraints, and circulation bottlenecks. Among these areas, domestic research on pig industry resilience is relatively mature. Zheng et al. [22] constructed a pig industry resilience evaluation system covering resistance capacity and recovery capacity, and conducted empirical analysis using the obstacle degree model and coupling coordination model. Their results showed that high obstacle degrees in resistance capacity and recovery capacity were the main bottlenecks restricting the improvement of pig industry resilience. Ma measured the resilience of China’s pig feed industrial chain using the entropy weight method and analyzed its influencing factors with a two-way fixed effects model, verifying that economic development, technological innovation, financial development, and transportation accessibility can significantly enhance industrial chain resilience [23]. These studies indicate that livestock industry resilience depends not only on production capacity itself, but is also closely associated with forage supply, disease prevention and control, technological innovation, transportation and logistics, policy support, and industrial organization.
From a micro-level perspective, research on the anti-disturbance capacity of individual animals also provides a supplementary perspective for understanding livestock industry resilience. Wang et al. [24] used feed intake data and genome-wide association analysis to identify the genetic basis of porcine resilience traits. They noted that animal resilience usually refers to the ability of an individual animal to be less affected by disturbances or to rapidly return to its pre-disturbance state, thereby providing evidence for improving animal production performance and anti-disturbance capacity from the genetic level. However, individual-level animal resilience mainly focuses on the physiological response and recovery performance of biological organisms under disturbance, and cannot directly explain supply stability, chain coordination, and long-term adjustment of the industrial system under external shocks. Therefore, livestock industry resilience still needs to be comprehensively analyzed at the industrial system level by integrating micro-level anti-disturbance capacity with meso-level industrial organization, resource allocation, and market response.

3. Research Design

3.1. Construction of Evaluation Index System for Beef Cattle Industry Resilience

Industrial resilience refers to the capacity of an industrial system to maintain essential functions, absorb disturbances, restore production and circulation, and achieve sustainable development through adaptive adjustment under external shocks [25]. To clarify the theoretical foundation of the beef cattle industry resilience evaluation framework, this study integrates resilience theory, the resource-based view, adaptive capacity theory, and systems thinking. The resource-based view argues that resource endowments, production conditions, infrastructure, and organizational assets constitute important support for industrial stability and competitive advantage [26]. Adaptive capacity theory emphasizes the ability of an industry to enhance its continuous response capacity through structural adjustment, resource reconfiguration, and capability improvement under changing external environments [27]. Systems thinking further suggests that the beef cattle industry is not a single production link, but a complex industrial system composed of interconnected elements such as production foundations, factor supply, circulation networks, disease prevention and control, market demand, environmental constraints, and organizational coordination [28].
Based on the above theoretical logic, this study follows the dynamic process of “pre-shock foundational support—shock-period resistance and buffering—post-shock recovery and reconstruction—long-term sustainable transformation” and constructs a four-dimensional evaluation framework comprising foundational capacity, resistance capacity, recovery capacity, and sustainability capacity. Specifically, foundational capacity mainly reflects the resource endowments, production base, and infrastructure support emphasized by the resource-based view; resistance capacity reflects the shock-absorption and risk-buffering functions emphasized by resilience theory; recovery capacity reflects the resource reconfiguration, production restoration, and expectation-stabilizing processes emphasized by adaptive capacity theory; and sustainability capacity reflects the long-term adaptive transformation of the industrial system under resource, environmental, and market constraints, as highlighted by systems thinking and resilience transformation research [29]. This theoretical linkage provides a logical basis for subsequent indicator selection and empirical measurement.
Foundational capacity reflects the resource endowments, production base, and infrastructure conditions that support the normal operation of the beef cattle industry before shocks occur. Year-end beef cattle stock (C1), beef output (C2), and beef cattle industry output value (C3) are used to characterize current supply potential, actual production capacity, and economic scale, respectively. Among them, C1 refers to the total year-end beef cattle stock and mainly reflects the existing production scale and supply base of the industry; therefore, it is assigned to the foundational capacity dimension rather than the recovery capacity dimension. Highway freight turnover (C4) is used to measure regional logistics carrying capacity, because the cross-regional movement of live cattle, feed grain, forage, and slaughtered products relies heavily on the transportation system. Broadband access ports per 10,000 people (C5) are used as a proxy for regional digital infrastructure availability and network access capacity. Although C5 does not directly measure the digital application level of beef cattle farms, digital infrastructure provides basic support for information acquisition, production–marketing matching, remote technical services, online veterinary consultation, logistics coordination, market-risk monitoring, and early-warning information transmission.
Resistance capacity reflects the ability of the beef cattle industry to absorb, buffer, and respond to external disturbances before its core production and supply functions are seriously impaired. The number of township animal husbandry and veterinary stations (C6) reflects grassroots disease monitoring, immunization and prevention, technical services, and emergency response capacity, and is therefore an important indicator for measuring the industry’s ability to resist disease risks. Granted patent applications (C7) are used to characterize regional innovation capacity, especially technological reserves related to breed improvement, feeding management, disease prevention and control, manure treatment, and smart livestock farming. Annual soybean output (C8), annual corn output (C9), and forage sown area (C10) measure the supply capacity of protein feed, energy feed, and roughage, respectively. Corn is included not as an indicator of residents’ food consumption, but as an important energy-feed and concentrate-feed input in beef cattle fattening. Together, soybean, corn, and forage indicators reflect regional feed-security conditions. A stable feed supply helps enhance the buffering capacity of the industry when facing feed price fluctuations, transport disruptions, and external supply shocks.
Recovery capacity reflects the ability of the beef cattle industry to restore its breeding foundation, stabilize development expectations, and resume supply after shocks occur. Year-end breeding cattle stock (C11) is used to characterize the biological foundation for future supply recovery. Because beef cattle herd expansion is constrained by the biological production cycle and supply restoration depends heavily on the reproductive base, C11 differs conceptually from total year-end beef cattle stock (C1): C1 mainly reflects current production scale, whereas C11 more directly determines the potential for future supply restoration. Government support (C12), measured by fiscal expenditure on agriculture, forestry, and water affairs, reflects public support related to the improvement of agricultural production conditions, disaster relief, infrastructure construction, and livestock services. The proportion of farms raising more than 100 beef cattle annually (C13) reflects the level of standardized and large-scale operation, which helps improve capital turnover, management capacity, disease prevention and control, credit access, and post-shock recovery capacity.
Sustainability capacity reflects the ability of the beef cattle industry to maintain long-term competitiveness and achieve green transformation under resource and environmental constraints. Beef cattle carbon emissions (C14) and carbon-emission economic loss intensity (C15) are included as negative indicators to capture environmental pressure and the degree of carbon constraints in industrial development. Per capita beef consumption of urban and rural residents (C16) is used to characterize the stability of market demand, because stable consumption demand helps maintain industrial-chain operation and long-term development expectations. The number of beef cattle cooperatives (C17) reflects the level of industrial organization, production standardization, risk sharing, and benefit linkage. Cooperatives play an organizational and coordinating role in technology extension, centralized procurement, product sales, quality control, and risk sharing, and therefore constitute an important organizational support for enhancing the long-term adaptation and transformation capacity of the beef cattle industry.
Thus, the four-dimensional evaluation framework constructed in this study clarifies the theoretical basis of beef cattle industry resilience evaluation and forms an indicator-selection logic that extends from foundational support and risk buffering to supply restoration and sustainable transformation. The detailed indicator system is presented in Table 1.

3.2. Research Methods

3.2.1. Entropy Weight Method

Following the method proposed by Li Jieyi and Hu Jinglan [30], this study adopts the entropy weight method to determine the objective weights of the evaluation indicators and to calculate the comprehensive resilience score of the beef cattle industry. Compared with subjective weighting methods, the entropy weight method assigns weights according to the degree of variation and information contained in each indicator, thereby reducing the influence of subjective judgment.
To ensure temporal and cross-provincial comparability, all indicators are standardized based on the pooled province-year panel covering 31 provincial-level regions from 2012 to 2022, rather than being standardized separately by year. Let X ij denote the original value of indicator j for province-year observation i , and let X ij denote the standardized value. The standardization formulas are as follows.
For positive indicators:
X ij   =   X ij min ( X j ) max ( X j ) min ( X j )
For negative indicators:
X ij   =   max ( X j ) X ij max ( X j ) min ( X j )
where max ( X j ) and min ( X j ) represent the maximum and minimum values of indicator j in the full pooled sample, respectively. After standardization, all indicators are transformed into dimensionless values within the interval [0, 1], and a larger standardized value consistently indicates a more favorable condition for beef cattle industry resilience.
The proportion of province-year observation i under indicator j is calculated as:
P ij   =   X ij i = 1 N X ij
where N denotes the total number of province-year observations. In this study, N = 341 , corresponding to 31 provincial-level regions over 11 years. The entropy value of indicator j is calculated as:
e j   =   1 ln N i = 1 N P ij ln ( P ij )
When P ij = 0 , P ij ln ( P ij ) is treated as 0 according to the limiting rule. The difference coefficient of indicator j is calculated as:
d j   =   1 e j
Then, calculate the index weight w j .
w j = d j j = 1 m d j
where m denotes the number of evaluation indicators. In this study, m = 17 . Finally, the comprehensive resilience score of province-year observation i is calculated as:
R i   = j = 1 m X ij   ×   w j
where R i represents the comprehensive resilience score of province-year observation i. A higher value of R i indicates stronger beef cattle industry resilience.
To improve reproducibility, this study reports the attribute direction and entropy-derived weight of each indicator in Table 1. The raw data, standardized values, entropy weights, and calculated resilience scores were checked using the same pooled standardization benchmark and calculation procedure to ensure that the reported results can be reproduced.

3.2.2. Kernel Density Function

Following Liu Zhanwei [31], this study adopts the Gaussian kernel density function to analyze the distribution dynamics of beef cattle industry resilience. The Gaussian kernel is selected because the resilience index is a continuous variable after normalization and is suitable for non-parametric distribution estimation. To reduce the subjectivity of curve smoothing and ensure the comparability of the estimation results, the bandwidth h is selected using Silverman’s normal-reference rule commonly applied in Gaussian kernel density estimation, h = 1.06 σ N 1 5 , where σ denotes the standard deviation of the resilience scores and N denotes the number of observations. The kernel density estimator and Gaussian kernel are specified as follows:
f ( x )   =   1 Nh i = 1 N K ( X i x h )
K ( u ) = 1 2 π exp ( u 2 2 )
To avoid overinterpreting results that depend on a single smoothing parameter, the interpretation focuses on distributional features that remain stable when the bandwidth is moderately adjusted. In these formulas, f ( x ) denotes the density function of the beef cattle industry resilience index, N is the number of observations; X i is the observed value; x is the evaluation point; h is the bandwidth; u = ( X i x ) / h denotes the standardized distance between the observed value and the evaluation point; and K ( . ) is the Gaussian kernel. The kernel-density results are interpreted as distributional evidence rather than causal evidence.

3.2.3. Dagum Gini Coefficient and Its Decomposition Method

Following He Jiaxin and Li Haiyang [32], this study adopts the Dagum Gini coefficient and its decomposition method to examine regional disparities and the main sources of differences in beef cattle industry resilience. Compared with the traditional Gini coefficient, the Dagum Gini coefficient can decompose overall regional inequality into within-region disparity, net between-region disparity, and transvariation density, thereby providing a more detailed explanation of the sources of spatial imbalance.
The overall Dagum Gini coefficient is calculated as follows:
G   =   j = 1 k h = 1 k i = 1 n j r = 1 n h | y ji y hr | 2 n 2 y ¯
The decomposition form is:
G   =   G w   +   G nb   +   G t
where G denotes the overall Dagum Gini coefficient; k denotes the number of regions; n denotes the total number of provinces; n j and n h denote the number of provinces in regions j and h , respectively; y ji denotes the beef cattle industry resilience index of province i in region j ; y h r denotes the beef cattle industry resilience index of province r in region h ; and y ¯ denotes the average resilience index of all provinces. G w , G n b , and G t represent the within-region disparity component, net between-region disparity component, and transvariation density component, respectively.

3.2.4. Spatial Autocorrelation Estimation

Before estimating spatial autocorrelation, two spatial weight matrices are constructed to improve the robustness of the spatial analysis. The first is a binary queen-contiguity weight matrix, which captures direct geographical adjacency among provinces. If province i and province j share a common boundary or vertex, a i j = 1 ; otherwise, a i j = 0 . The diagonal elements are set as a i i = 0 . For provinces without direct contiguous neighbors, the corresponding row in the contiguity matrix is retained as zero rather than being assigned an artificial spatial link. This treatment avoids unsupported adjacency assumptions while keeping the provincial sample complete.
The second is an economic-geographic weight matrix, which incorporates both geographical adjacency and economic proximity. Compared with the pure contiguity matrix, the economic-geographic matrix can capture not only spatial associations caused by geographical adjacency, but also potential associations related to similarities in regional economic development conditions. In this study, the economic-geographic weight matrix is constructed by combining the binary queen-contiguity relationship with the economic distance between provinces. Its general form is as follows:
w i j e g = a i j × 1 | Y ¯ i Y ¯ j | + ε , i j
where w i j e g denotes the element of the economic-geographic weight matrix; a i j denotes the binary queen-contiguity element between provinces i and j ; Y ¯ i and Y ¯ j denote the average real per capita GDP of provinces i and j during the study period; and ε is a very small positive constant used to avoid a zero denominator. After construction, nonzero rows in both spatial weight matrices are row-standardized to reduce the influence of differences in the number of neighboring provinces and to ensure comparability across provinces. For zero-neighbor rows in the contiguity matrix, the corresponding row is retained as zero after standardization.
Based on the above two spatial weight matrices, this study calculates the global Moran’s I values of beef cattle industry resilience from 2012 to 2022 and reports the corresponding z-scores and p-values to test the statistical significance of spatial autocorrelation. If Moran’s I is positive and statistically significant, it indicates positive spatial autocorrelation, suggesting that provinces with similar resilience levels tend to be spatially clustered. If Moran’s I is negative and significant, it indicates spatial dispersion. If Moran’s I is insignificant, it suggests that there is no obvious global spatial correlation. The formula of the global Moran’s I index is presented as follows [33]:
I   =   n S 0 · i = 1 n j = 1 n w ij ( x i x ¯ ) ( x j x ¯ ) i = 1 n ( x i x ¯ ) 2
where I denotes the global Moran’s I index; n denotes the number of provincial-level regions; x i and x j represent the beef cattle industry resilience values of province i and province j , respectively; x ¯ represents the average beef cattle industry resilience value of all provinces; w ij denotes the element of the spatial weight matrix w ; and S 0 = i = 1 n j = 1 n w ij denotes the sum of all spatial weights. The local Moran’s I index is further used to identify the spatial association pattern of each province and to reveal local spatial agglomeration or spatial heterogeneity. Its calculation formula is as follows:
I i   =   n ( x i x ¯ ) j = 1 n w ij ( x j x ¯ ) k = 1 n ( x k x ¯ ) 2
In the formula, I i denotes the local Moran’s I index of province i , and the other variables have the same meanings as above.

3.2.5. Obstacle Degree Model

Following Yan Hua and Li Xinyue et al. [34], this study adopts the obstacle degree model as a descriptive diagnostic tool to identify the relative obstacle indicators associated with beef cattle industry resilience within the constructed evaluation system. Specifically, the entropy weight method is first used to determine the weights of the evaluation indicators. Then, the standardized deviation of each indicator from its ideal state is combined with its entropy-derived weight to calculate the obstacle degree of each indicator. A higher obstacle degree indicates that the corresponding indicator represents a more prominent relative obstacle to the improvement of the evaluated resilience level, whereas a lower obstacle degree indicates a less prominent relative obstacle. The specific calculation formulas are as follows:
Z ij   =   1 X ij
O ij = Z ij × f j j = 1 ( Z ij × f j )   ×   100 %
In the formulas, X ij represents the standardized index value; Z ij is the index deviation degree; O ij denotes the index obstacle degree; and f j stands for the contribution degree of obstacle factors, Negative indicators are first converted through reverse standardization before obstacle calculation so that a larger standardized value consistently represents a more favorable resilience condition.

3.3. Data Sources

This study selects 2012–2022 as the research period mainly for three reasons: policy background, data availability, and industrial shocks. First, 2012 was the first complete statistical year after the implementation of the 12th Five-Year Plan framework. During this period, livestock modernization, agricultural structural adjustment, and subsequent rural revitalization policies were gradually promoted, making 2012 an appropriate starting point for observing the long-term evolution of the beef cattle industry. Second, 2022 was the latest year for which the main indicators from various statistical yearbooks, livestock yearbooks, provincial statistical yearbooks, and relevant databases could be consistently matched when the provincial panel dataset was constructed. Extending the sample period to 2023 or later would lead to missing values or inconsistencies in the statistical coverage of some livestock-related and provincial indicators, which may weaken the comparability of the comprehensive evaluation results. Third, the period 2012–2022 covers important external shocks and market adjustment stages in China’s livestock sector. The African swine fever outbreak that began in 2018 had a significant impact on pig production capacity and pork prices in 2019. The contraction of pork supply and the rise in pork prices may have increased substitution demand for beef and other animal proteins. In 2020, the COVID-19 pandemic further disrupted logistics, market circulation, feed transportation, slaughtering and processing, and livestock-product consumption. Therefore, the period 2012–2022 not only reflects the long-term structural transformation of the beef cattle industry, but also covers a stage in which the industry’s resistance, recovery, and sustainable transformation capacities were tested under external shocks.
All indicator data are collected from the China Statistical Yearbook, the China Animal Husbandry and Veterinary Yearbook, the China Rural Management Annual Report, the China Rural Statistical Yearbook, provincial statistical yearbooks, and the CSMAR Database. Specifically, year-end beef cattle stock, broadband access ports, soybean output, corn output, forage sown area, and fiscal expenditure on agriculture, forestry, and water affairs are derived from the China Statistical Yearbook and provincial statistical year-books. Beef output, beef cattle industry output value, township animal husbandry and veterinary stations, and per capita beef consumption are sourced from the China Animal Husbandry and Veterinary Yearbook. Patent authorizations and highway freight turn-over are obtained from the CSMAR Database; breeding cattle stock and the proportion of large-scale beef cattle farms are collected from the China Rural Statistical Yearbook; and beef cattle cooperatives are obtained from the China Rural Management Annual Report.
Referring to Chen Weihong et al. [35], this study calculates beef cattle carbon emission equivalent and corresponding economic losses. Because the available inventory data are reported as year-end beef cattle stock, this study uses the average of the current and previous year-end beef cattle stock to represent the inventory scale in carbon emission accounting. The calculation formula for beef cattle carbon emission equivalents is as follows: C it   =   λ   ×   ( φ it   +   φ i ( t 1 ) ) / 2 , where C it refers to total beef cattle carbon emissions of region i in year t;   λ denotes the carbon emission coefficient of beef cattle; and φ it and φ i ( t 1 ) represent year-end beef cattle stock of region i in year t and year t − 1, respectively. The greenhouse gas emission coefficient of beef cattle follows the IPCC greenhouse gas emission guidelines.
The formula for economic losses caused by beef cattle carbon emissions is EL it   =   C it / AGDP it , where EL it stands for economic losses caused by beef cattle carbon emissions in region i in year t, and AGDP it is the total output value of animal husbandry at constant prices with 2012 set as the base year. In addition, individual missing observations were supplemented using linear interpolation only when the values for adjacent years were available. Specifically, for a missing value of indicator ( j ) in region ( i ) and year ( t ), the value was estimated based on the arithmetic mean of the corresponding values in years ( t 1 ) and ( t + 1 ). All interpolated data were checked against the original yearbook data before standardization to ensure the consistency and integrity of the balanced panel dataset.

4. Measurement Results and Spatiotemporal Characteristic Analysis of Beef Cattle Industry Resilience

4.1. Overall Measurement and Evaluation of Beef Cattle Industry Resilience

The entropy weight method was used to measure the resilience level of the beef cattle industry in 31 provincial-level regions of China from 2012 to 2022 (Table 2). Overall, the national mean resilience index increased from 0.105 in 2012 to 0.167 in 2022, with an average value of 0.135 during the study period. This indicates that the resilience of China’s beef cattle industry improved gradually, although the overall level remained relatively low. It should be noted that the years 2020–2022 coincided with the COVID-19 pandemic, during which beef cattle production, transportation, market circulation, feed supply, and recovery processes may have been affected by extraordinary external disturbances. Therefore, the upward trend observed during the full sample period should not be interpreted as a smooth development path unaffected by external shocks. Rather, it reflects the measured evolution of beef cattle industry resilience under both long-term development conditions and short-term shock exposure. The continued increase in the national mean resilience index after 2020 suggests that the industry maintained a certain degree of resilience under the pandemic shock, but the relatively low absolute level also indicates that its foundational support, risk-response capacity, and recovery system still need to be strengthened.
In terms of provincial spatial patterns, the top five provinces in the comprehensive ranking were Inner Mongolia, Heilongjiang, Shandong, Henan, and Hebei, respectively. These regions generally possess solid resource endowments and industrial foundations. Relying on superior grass–livestock resources and large-scale breeding advantages, Inner Mongolia, Heilongjiang, and other northern provinces can easily form a complete industrial supporting system, thus possessing stronger risk buffering and industrial recovery capacity [36]. By contrast, Shandong, Henan, and Hebei maintain high resilience levels due to huge market demand, mature processing and circulation systems, and sound industrial organization foundations.
On the contrary, the bottom five provinces were Chongqing, Ningxia, Fujian, Shanghai, and Hainan. Restricted by breeding resource endowments and spatial carrying capacity, these regions face insufficient forage supply, a low degree of large-scale operation and industrial organization, and weak coordination in slaughtering, processing, and cold chain logistics links, resulting in poor stable supply capacity and slow industrial recovery ability when facing external shocks.
Restricted by complex terrain, Chongqing and Fujian feature a scattered breeding layout and weak grass–livestock matching conditions, and insufficient industrial chain support further limits scale effect and risk-sharing capacity. Ningxia is constrained by water resource shortages and strict ecological governance requirements, leading to weak anti-risk capacity of the beef cattle industry. With a high urbanization level, tight land supply, and stringent environmental regulations, Shanghai mainly performs consumption and circulation functions rather than breeding and production links. Confined by island-type market characteristics and ecological redline policies, Hainan has a relatively short industrial chain and high external resource dependence, which further weakens its risk resistance and industrial resilience recovery capacity.

4.2. Multi-Dimensional Measurement and Evaluation of Beef Cattle Industry Resilience

Origin 2024b was used to visualize the evolutionary trends of each dimension. As shown in Figure 1, the overall resilience index of China’s beef cattle industry showed a continuous upward trend from 2012 to 2022, with accelerated growth after 2018. This indicates that industrial resilience continued to improve during the study period, although the growth patterns differed across dimensions.
The sustainability dimension followed a shallow U-shaped trajectory, declining first and then rising. In the early period (2012–2016), sustainability remained higher than the other dimensions and fluctuated only slightly. This may be associated with the relatively dispersed and less intensive production pattern of beef cattle farming at that stage. Under a lower-intensity production mode, the measured pressures on ecological resources, manure treatment, and carbon emissions were relatively limited, resulting in a higher sustainability score. However, this does not necessarily indicate that the industry had achieved an advanced level of green transformation during this period; rather, it mainly reflects lower environmental constraints under a less intensive production pattern. As the beef cattle industry gradually shifted toward scaled, standardized, and stall-feeding production systems, the expansion of breeding scale and the increase in production intensity placed higher requirements on manure treatment, resource recycling, carbon-emission control, and organizational support. When green supporting systems lagged behind production expansion, sustainability experienced a phased decline. In the later period (2018–2022), sustainability showed a slight rebound, which may be related to the gradual advancement of green production practices, crop–livestock integration, agro-pastoral circulation, and manure resource utilization. Therefore, the shallow U-shaped trajectory should be understood as a stage-specific adjustment between production expansion pressure and sustainability governance capacity in the beef cattle industry.
By contrast, foundational capacity, resistance, and recovery capacity improved more markedly. Starting from relatively low levels, these three dimensions increased steadily during the study period and accelerated after 2017, reaching approximately 0.85 by 2022. This trend is consistent with the broader policy environment following the 19th National Congress of the Communist Party of China, after which the rural revitalization strategy was continuously promoted as a major national strategy [37]. Improvements in rural and pastoral infrastructure, standardized barn renovation, forage reserve systems, breeding services, and epidemic-prevention mechanisms jointly strengthened the production foundation, risk-response capacity, and post-shock recovery ability of the beef cattle industry.
Overall, the dimensional evolution during the study period shifted from an early pattern mainly supported by sustainability to a later pattern more strongly driven by foundational capacity and resistance, together with the synchronous growth of recovery capacity. This multidimensional evolution jointly contributed to the continuous improvement of overall resilience.

4.3. Regional Differences in Beef Cattle Industry Resilience

4.3.1. Overall Regional Differences and Evolutionary Trends

As shown in Table 3, the average overall Gini coefficient of China’s beef cattle industry resilience stood at approximately 0.277 from 2012 to 2022, revealing prominent spatial disparities in industrial resilience during the research period. In terms of evolution, the overall Gini coefficient dropped from 0.290 in 2012 to 0.267 in 2016 and remained stable at this low level in 2017, before rebounding moderately to 0.282 in 2022. Generally, it followed an evolutionary path of initial convergence and subsequent slow fluctuating growth.

4.3.2. Characteristics of Intra-Regional Differences

In terms of intra-regional gaps, Northeast China consistently registered the highest intra-regional Gini coefficient with mild fluctuations, which indicates distinct and stable internal divergence in local industrial resilience. Eastern China had the smallest intra-regional disparity, with its coefficient fluctuating narrowly between 0.099 and 0.157, and Central and Western China presented obvious periodic fluctuations. The Gini coefficient of Central China climbed to 0.266 in 2017, declined to 0.122 in 2018, and stayed within 0.278–0.285 from 2019 to 2022. Western China’s coefficient hit a periodic peak of 0.287 in 2015, fell to 0.118 in 2017, rebounded to 0.271 in 2018, and finally leveled off between 0.112 and 0.121, showing a noticeable trend of phased convergence.

4.3.3. Inter-Regional Differences and Formative Causes

Significant hierarchical disparities existed across different regional combinations. The average Gini coefficient between Eastern and Northeast China reached 0.334, far higher than other groupings, which reflects long-standing and substantial imbalance in beef cattle industry resilience between the two regions. Such a gap originates from systematic differences in industrial development modes and factor endowments. Northeast China focuses on beef cattle breeding and forage supply, featuring large-scale farming and superior resource endowments, thus possessing strong foundational capacity and risk resistance at the production end. Restricted by land scarcity, environmental carrying pressure, and high urbanization rates, Eastern China lacks sufficient breeding scale and forage support, and its industry is mainly driven by processing, circulation, and market demand with a relatively weak production-end resilience foundation. Marked differences in resource endowments, industrial chain division, and resilience support mechanisms further widen their long-term resilience gap.
By contrast, the Central–Western China grouping had the lowest average value, implying similar industrial resilience levels and narrow inter-regional gaps between the two regions. In addition, the disparity between Eastern and Central China expanded continuously from 0.195 in 2016 to 0.311 in 2022. In the later stage, Eastern China relied on abundant capital and technological advantages to develop intelligent breeding and brand-based operation, enhancing its capacity to cope with market fluctuations. Nevertheless, Central China was still constrained by traditional factors such as environmental regulations and land resources, resulting in a widening gap in the improvement speed of industrial resilience.

4.3.4. Decomposition Results of Contribution Rates to Regional Differences

The decomposition results indicate that the overall regional differences are mainly driven by both inter-regional differences and hypervariable density contributions. The contribution rate of the former clearly fluctuated within the range of 26% to 37% during 2012–2022, presenting a trend of rising, sharply declining, and recovering. Specifically, the inter-regional contribution rate rose from 32.070% to 35.803% between 2012 and 2014, dropped to 30.928% in 2015, and surged to the peak of 37.236% in 2016, while the hypervariable density contribution decreased to 36.097%, suggesting weakened overlapping characteristics of cross-regional distribution.
From 2017 to 2018, the inter-regional contribution rate plunged to 26.5% and 26.251%, while the hypervariable density contribution increased to 45.632% and 45.718%, demonstrating that the cross-distribution of resilience levels among provinces in different regions became increasingly prominent, which weakened the influence of net inter-regional differences. The inter-regional contribution rate rebounded gradually and reached 32.850% in 2022, accompanied by eased cross-regional overlap and restored influence of inter-regional disparities, and remained relatively stable throughout the study period.

4.4. Temporal Evolution Analysis of Beef Cattle Industry Resilience

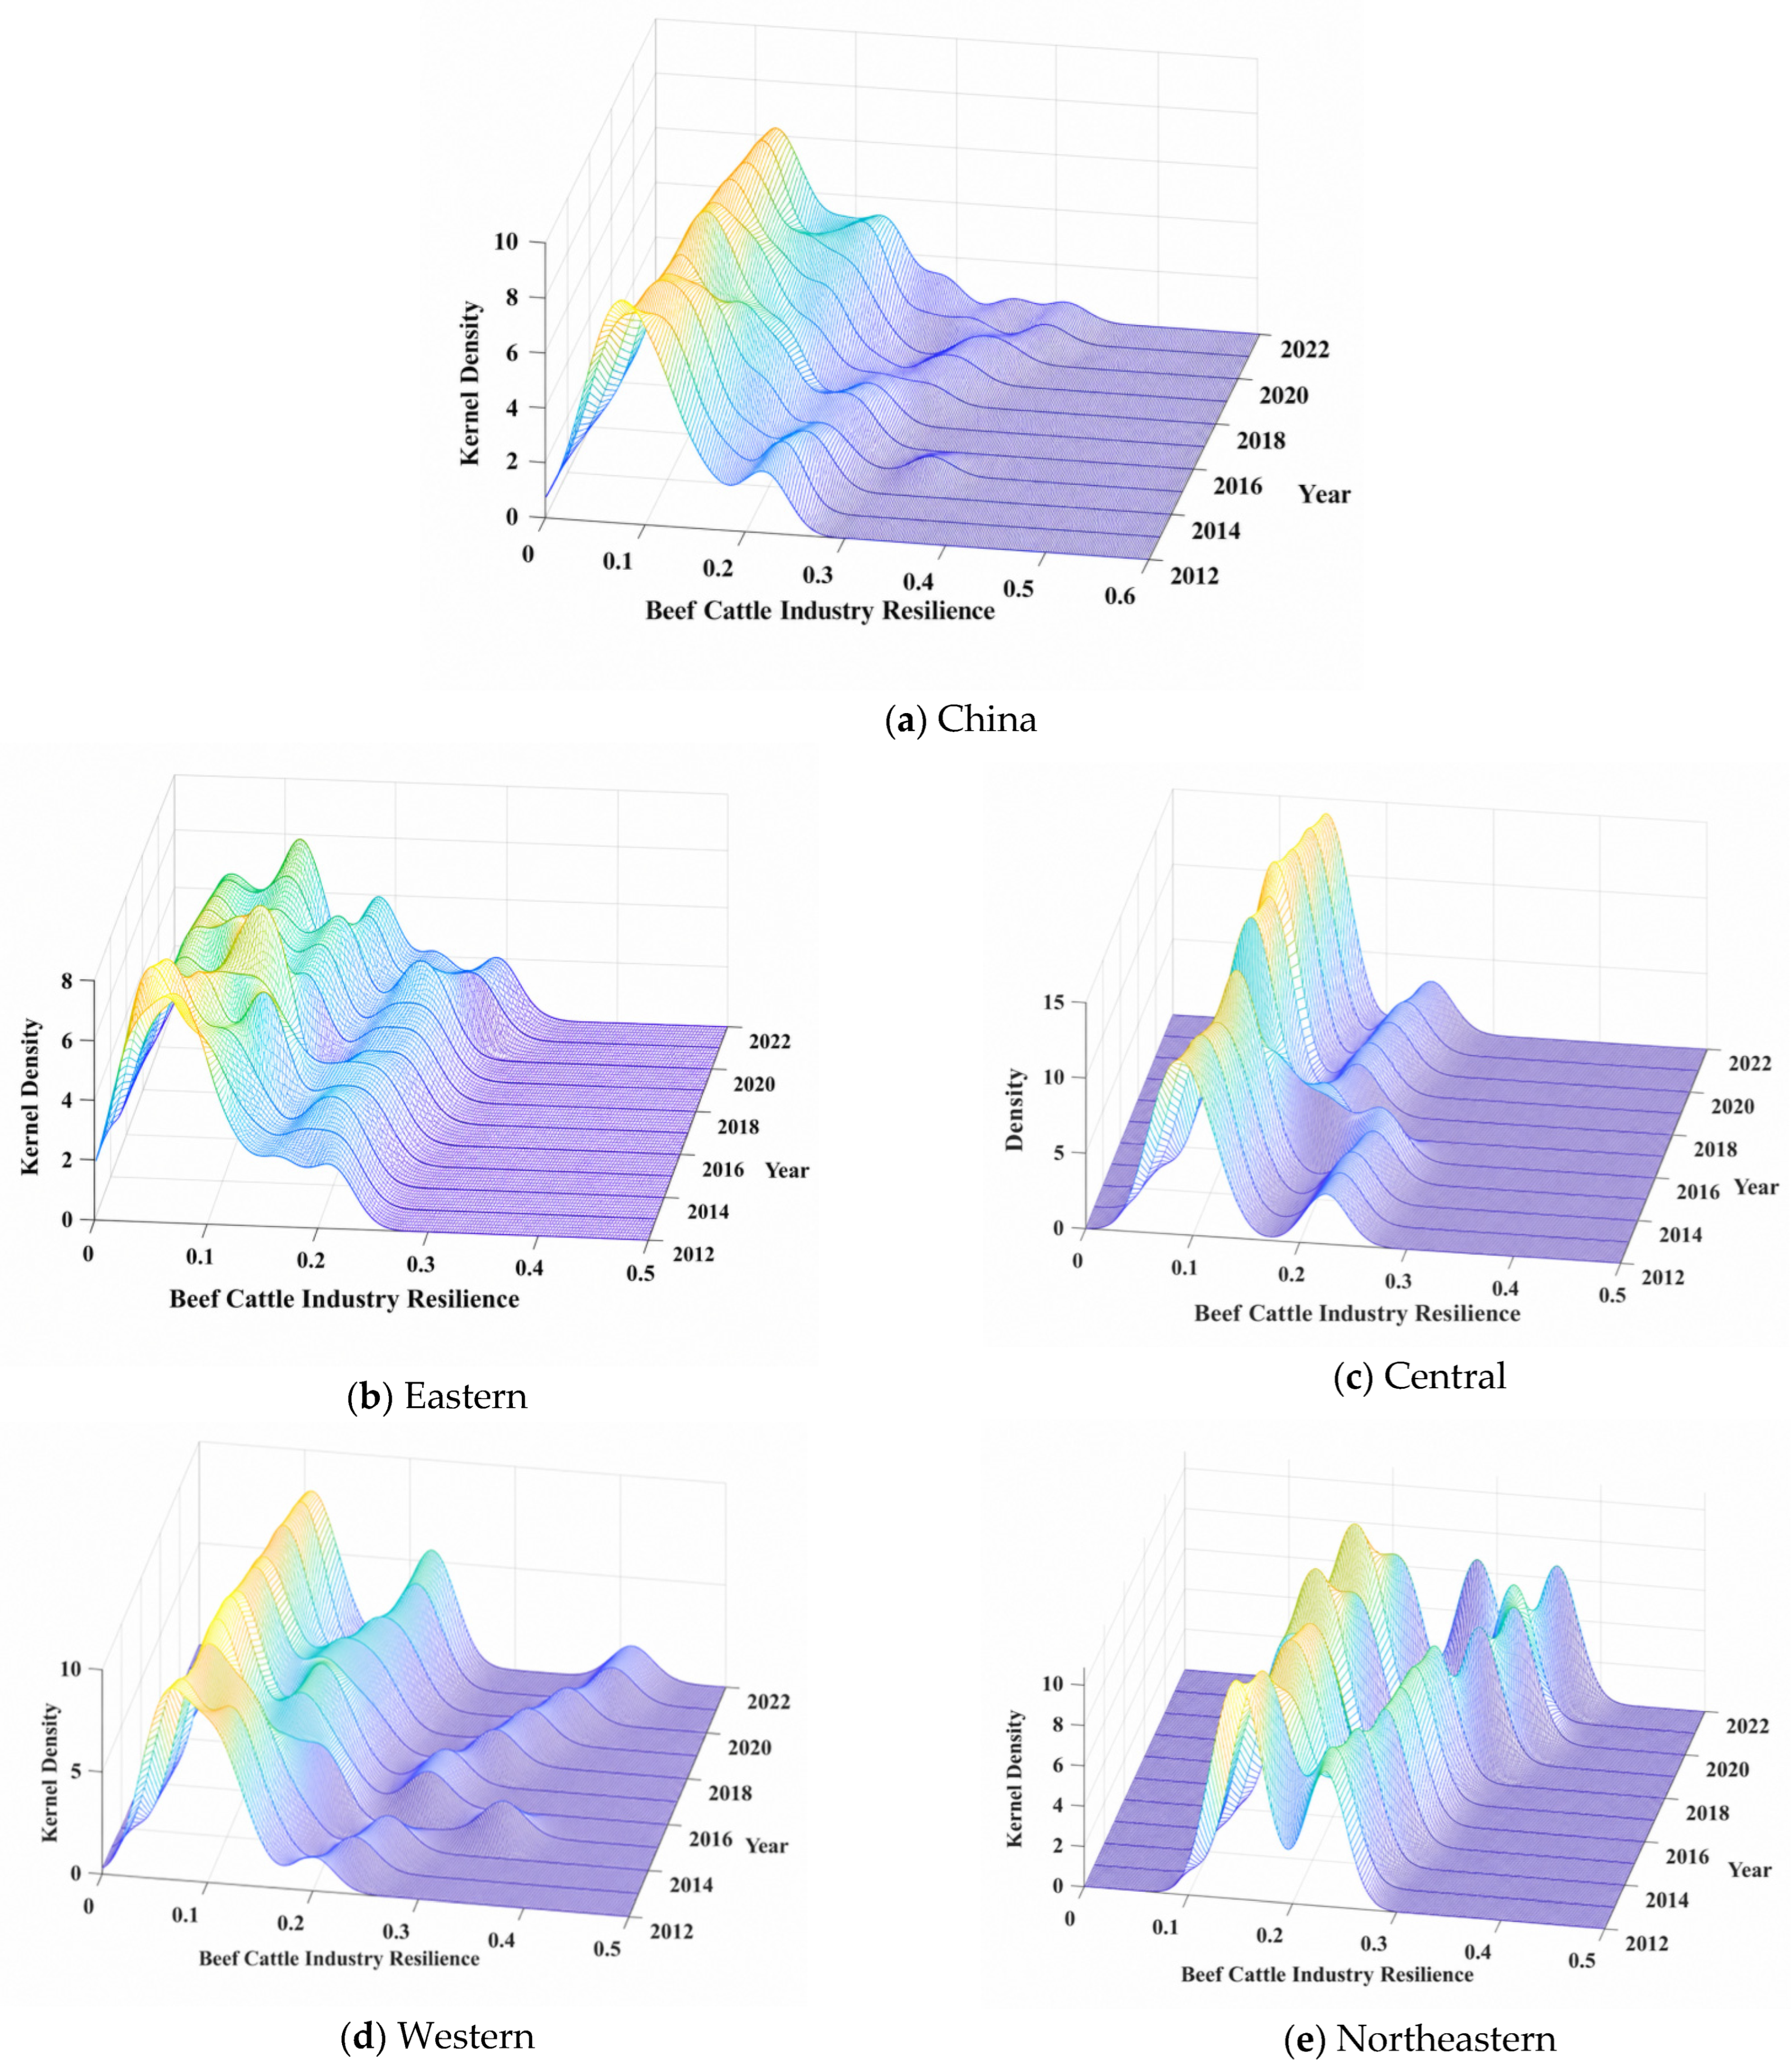
From a national perspective (Figure 2a), the main peak of the kernel density curve clearly shifted rightward from 2012 to 2022. This pattern is consistent with continuous improvement in the overall level of beef cattle industry resilience, a prominent upward trend that may be related to national policies advancing animal husbandry modernization. Meanwhile, the peak height declined, the tail extended, and the curve width widened slightly, which may be linked to gradually enlarged inter-regional resilience gaps; a plausible explanation for this pattern is the superposition of external shocks and uneven factor agglomeration.
From a sub-regional perspective, the peak of Eastern China (Figure 2b) moved rightward with gradually decreasing density in the low-value area on the left side, a feature consistent with relatively balanced internal development. This pattern may be associated with its solid industrial foundation, strong market demand, and mature cold chain logistics system [38]. Nevertheless, the right tail extended and the peak width expanded after 2019, a trend consistent with the observation that some provinces in Eastern China took the lead in industrial upgrading and internal regional disparities gradually widened.
For Central China (Figure 2c), the main peak steadily shifted rightward with rising peak height in the early stage, a feature consistent with overall growth and preliminary convergence of industrial resilience. After 2017, the curve expanded markedly and a secondary peak emerged, a pattern consistent with intensified internal divergence, whereby several advantaged provinces stepped into the medium-to-high resilience rank. A plausible explanation for this shift is the implementation of the Grain-for-Forage policy, which may be related to expanded high-quality forage supply and an optimized grass–livestock matching layout [39].
Western China (Figure 2d) presented a multi-peak kernel density structure with a declining peak height and widening distribution range, a characteristic consistent with the most prominent internal development disparities across all regions. In the middle and later periods, the peak value fell continuously, the distribution range further expanded, and a high-value tail appeared on the right; this pattern aligns with the observation that resilience improved in a few provinces while most regions saw slow progress.
Such divergence may be related to huge differences in natural geographical conditions and socioeconomic foundations within Western China. Pastoral grassland areas enjoy stable forage supply and mature breeding traditions, a feature consistent with the formation of clusters with medium and high industrial resilience. In contrast, high-altitude and remote areas are restricted by inconvenient transportation and underdeveloped market conditions, relying heavily on external forage supply. Weak circulation, processing, and cold chain support, together with imperfect industrial chain cooperation and a low organizational level, may be linked to the sustained low resilience of these regions. Improvements in transportation infrastructure and the new round of the Western Development Strategy launched in 2019 may be associated with optimized market connection capacity and industrial supporting systems in some provinces, a pattern consistent with rapid growth in industrial resilience within these areas.
The kernel density curve of Northeast China (Figure 2e) fluctuated noticeably, while its main peak shifted rapidly to the right, indicating a relatively prominent improvement in beef cattle industry resilience in this region. This may be associated with the region’s favorable resource base and industrial conditions. Heilongjiang, Jilin, Liaoning, and other northeastern provinces have strong corn production capacity and abundant straw resources, which provide a relatively stable foundation for energy feed and roughage supply in beef cattle farming. Meanwhile, Northeast China has favorable crop–livestock integration conditions and a certain development foundation for large-scale fattening and standardized breeding, which may help improve forage utilization efficiency, production organization capacity, and risk-buffering ability. In recent years, the continuous promotion of straw feed utilization, black soil protection, livestock structure adjustment, and support for large-scale breeding may also have improved regional ecological breeding conditions and industrial supporting capacity, which is consistent with the relatively rapid improvement in beef cattle industry resilience in this region. However, differences in resource conditions, industrial foundations, and organizational levels still exist within Northeast China; therefore, its kernel density curve also shows certain fluctuations and phased differentiation characteristics.

4.5. Spatial Evolution Characteristics of Beef Cattle Industry Resilience

4.5.1. Spatial Pattern Characteristics

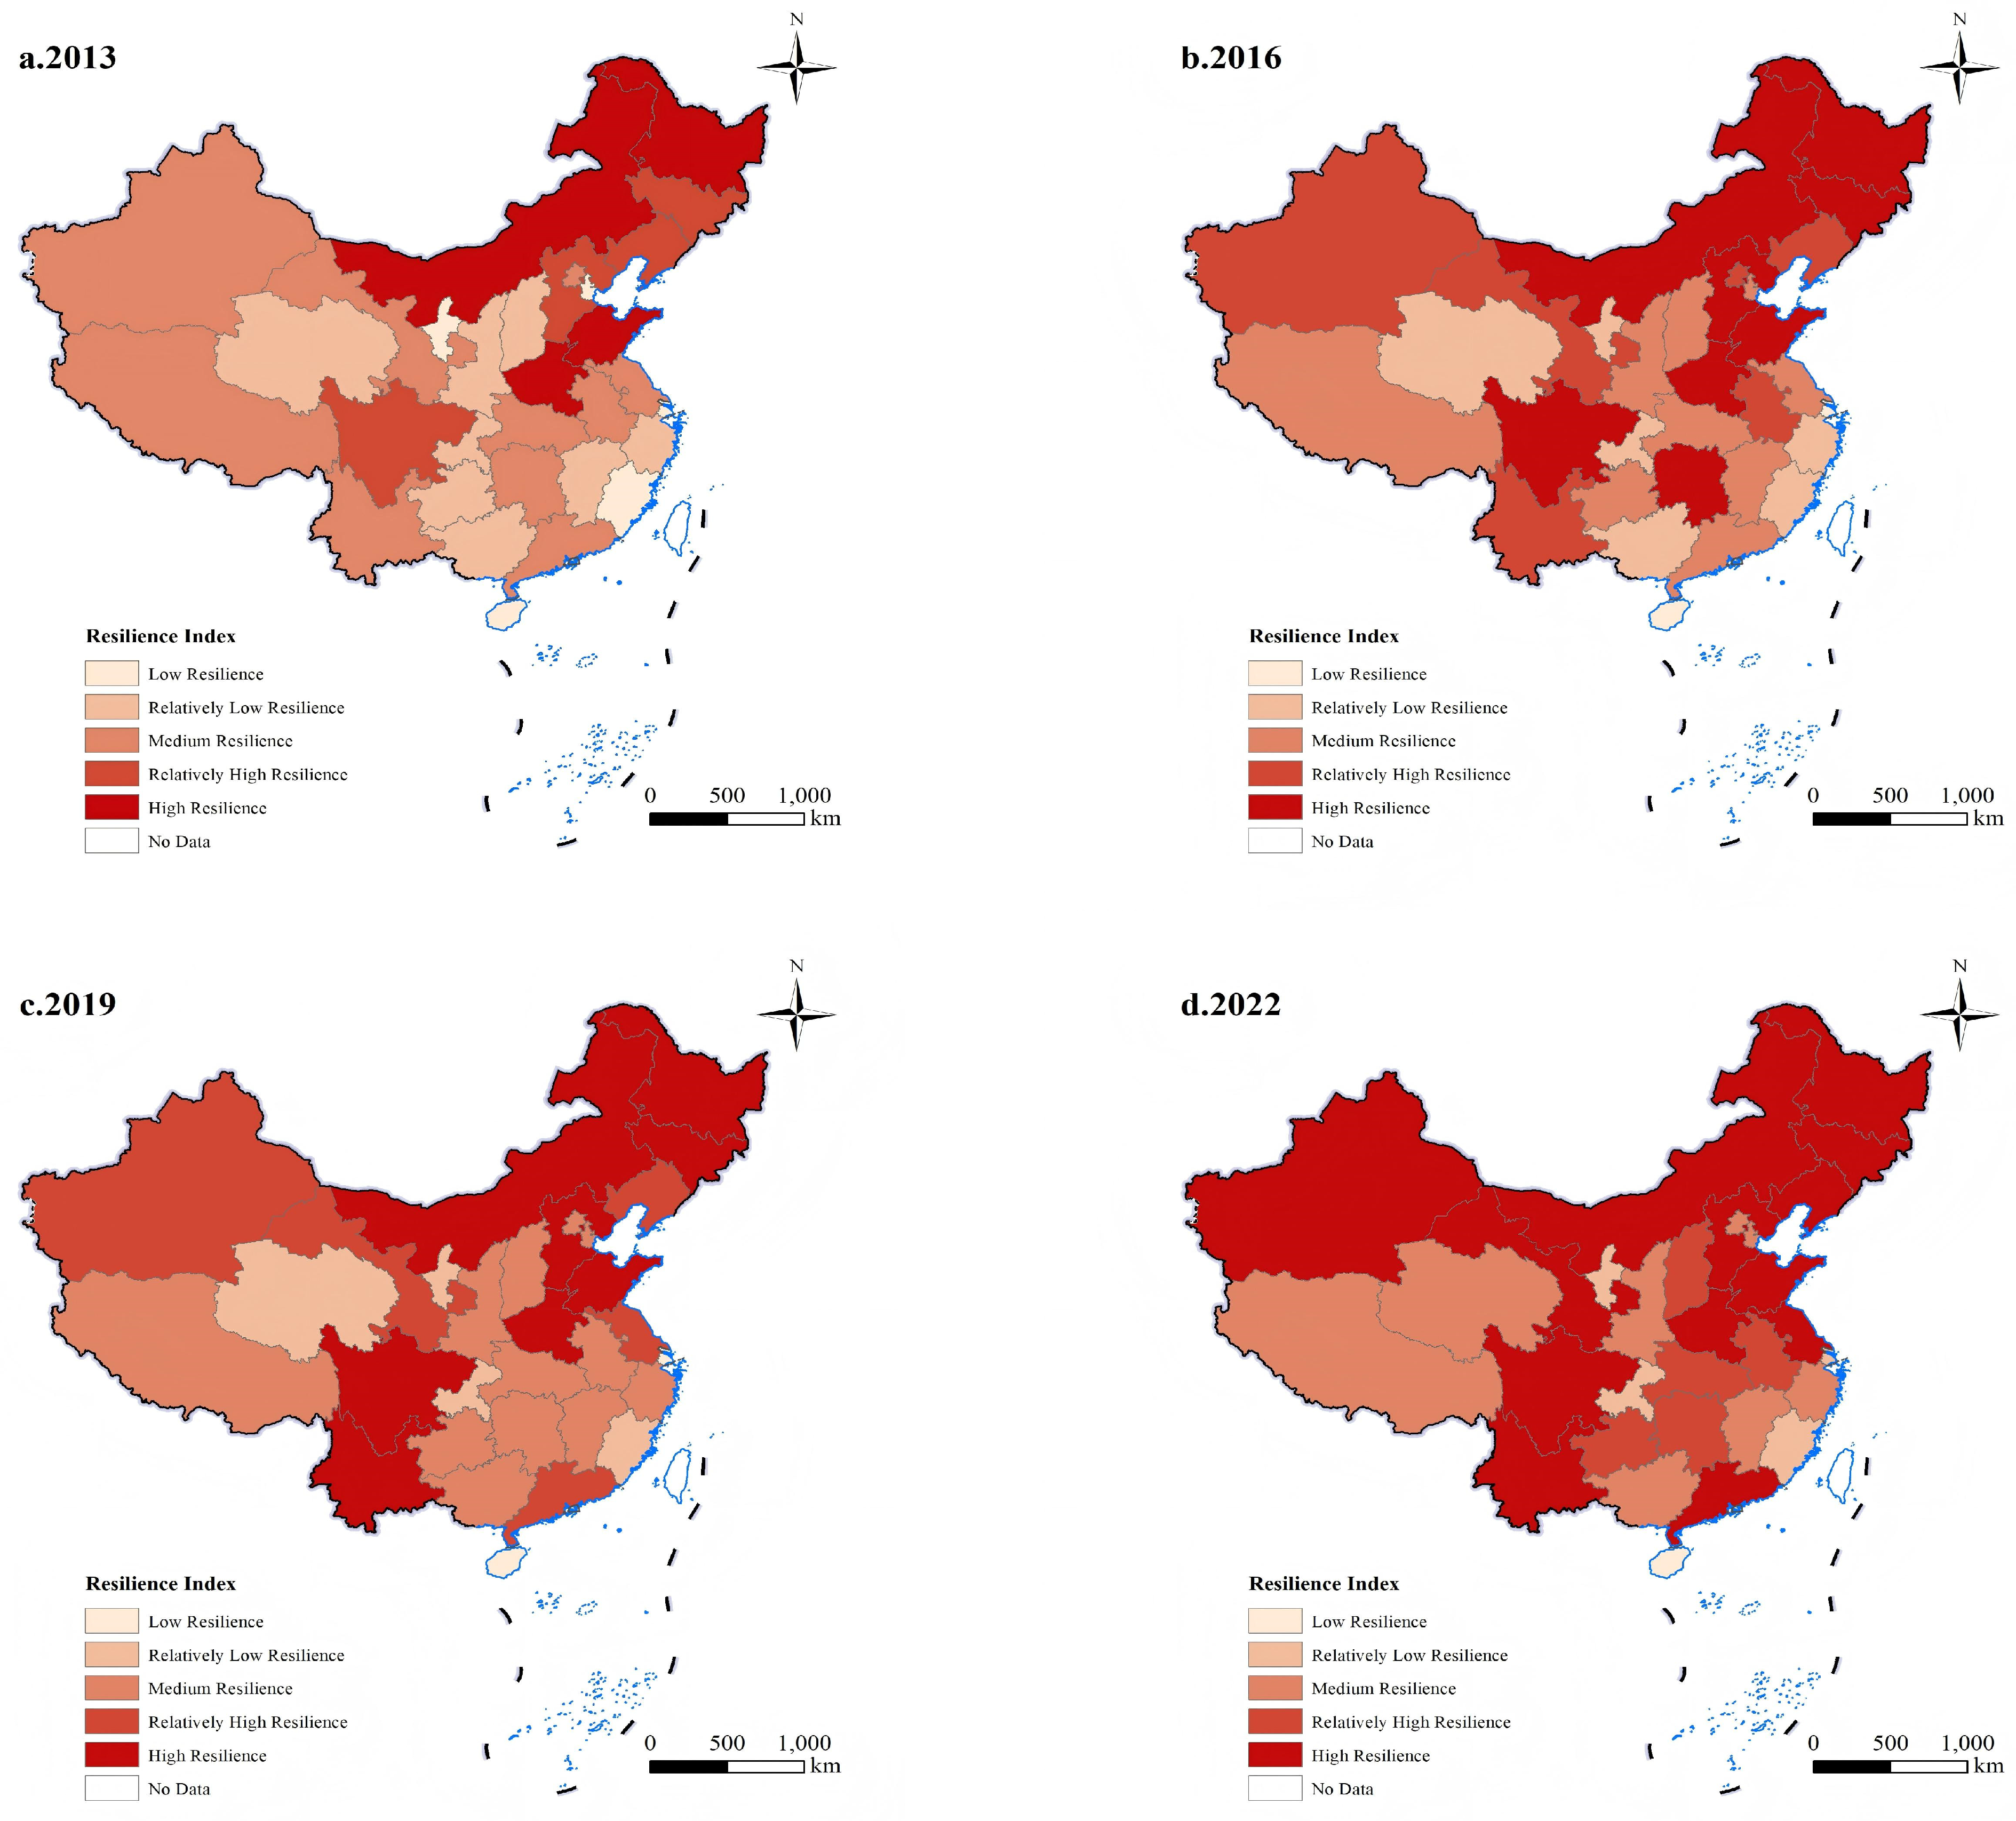
Using ArcGIS 10.5 software and adopting the natural breakpoint classification method, the beef cattle industry resilience levels of 31 provinces in China are divided into five grades [40]: low-resilience areas (0.023039–0.047738), relatively low-resilience areas (0.047739–0.083232), medium-resilience areas (0.083233–0.135078), relatively high-resilience areas (0.135079–0.178424), and high-resilience areas (0.178425–0.411417). In this study, 2013, 2016, 2019, and 2022 are selected as typical years to analyze the spatial distribution pattern of this resilience in China (Figure 3).
Overall, from 2013 to 2022, beef cattle industry resilience presented a distinct spatial pattern: northern pastoral areas, northeastern regions, and superior southwestern regions boasted relatively high resilience, while that of southeast coastal areas and Hainan Province remained at a low level. High-resilience areas showed zonal agglomeration in northern China and gradually diffused in a multi-polar manner; low-resilience areas kept shrinking, and relatively low-resilience areas remained stable along the southeast coast.
In 2013, high-resilience areas were mainly concentrated in Inner Mongolia, Heilongjiang, Shandong, and Henan. Liaoning, Jilin, Hebei, and Sichuan in southwest China belonged to relatively high-resilience areas. Medium-resilience areas covered nine provinces and municipalities including Xinjiang, Xizang, and Yunnan in Western China, as well as Anhui, Jiangsu, and Hubei in the middle and lower reaches of the Yangtze River. Eight provincial-level regions such as Shanxi and Shaanxi in central inland areas fell into relatively low-resilience areas, while Ningxia, Fujian, Shanghai, and Hainan were classified as low-resilience areas. Provinces with medium and relatively low resilience accounted for the largest proportion in this period.
In 2016, the scope of high-resilience areas expanded remarkably and included superior producing areas in northern and southwestern China. Hebei, Sichuan, and Jilin were upgraded from relatively high resilience to high resilience, and Hunan was promoted from medium resilience to high resilience, forming a contiguous high-value zone across northern China. Hubei, Anhui, Yunnan, Gansu, and Beijing rose from medium resilience to relatively high resilience, and the coverage of relatively low-resilience and low-resilience areas further narrowed, with only Shanghai and Hainan staying at the low-resilience level.
In 2019, the number of regions at each resilience grade tended to be stable. Yunnan was upgraded from relatively high resilience to high resilience, Hunan dropped from high resilience to medium resilience, and Guangdong and Jiangsu were elevated from medium resilience to relatively high resilience. A total of 10 provincial-level regions belonged to medium-resilience areas, taking up the largest proportion among all grades.
As shown in Table 4, in 2022, high-resilience areas further expanded towards northwest and southern China. Xinjiang, Gansu, Liaoning, Jiangsu, and Guangdong were promoted from relatively high resilience to high resilience; provincial-level regions in the middle and lower reaches of the Yangtze River including Anhui, Hunan, and Hubei also moved up from medium resilience to high resilience.
On the whole, the beef cattle industry resilience in China has achieved steady improvement accompanied by continuous optimization of spatial layout. Superior producing areas should fully exploit their advantages in large-scale breeding and industrial chain agglomeration, strengthen radiating and driving effects, and promote coordinated improvement in industrial resilience in surrounding regions.

4.5.2. Spatial Correlation Characteristics

In terms of the magnitude of Moran’s I, the values range from 0.187 to 0.331 under the contiguity weight matrix, whereas they are only between 0.066 and 0.120 under the economic-geographic weight matrix. This indicates that the spatial correlation of provincial beef cattle industry resilience is mainly reflected in limited clustering under direct geographic adjacency. When economic similarity is further incorporated into the spatial relationship, the overall degree of spatial dependence becomes weaker. The beef cattle industry is highly dependent on natural resources and regional production conditions, and its development is closely related to grassland resources, feed and forage supply, breeding foundations, epidemic prevention capacity, and transport distance. Therefore, neighboring provinces are more likely to exhibit certain similarities in resilience levels. By contrast, after economic similarity is incorporated into the economic-geographic weight matrix, the Moran’s I values decline markedly, suggesting that the spatial distribution of beef cattle industry resilience is not determined solely by economic similarity, but is more strongly shaped by differences in natural resource conditions, industrial foundations, and production functions.
From the perspective of temporal evolution, Moran’s I shows an overall fluctuating downward trend under both weight matrices. This suggests that although provinces with similar resilience levels still exhibit a certain degree of spatial association, the intensity of spatial clustering weakened during the study period.

4.5.3. Local Spatial Autocorrelation Test

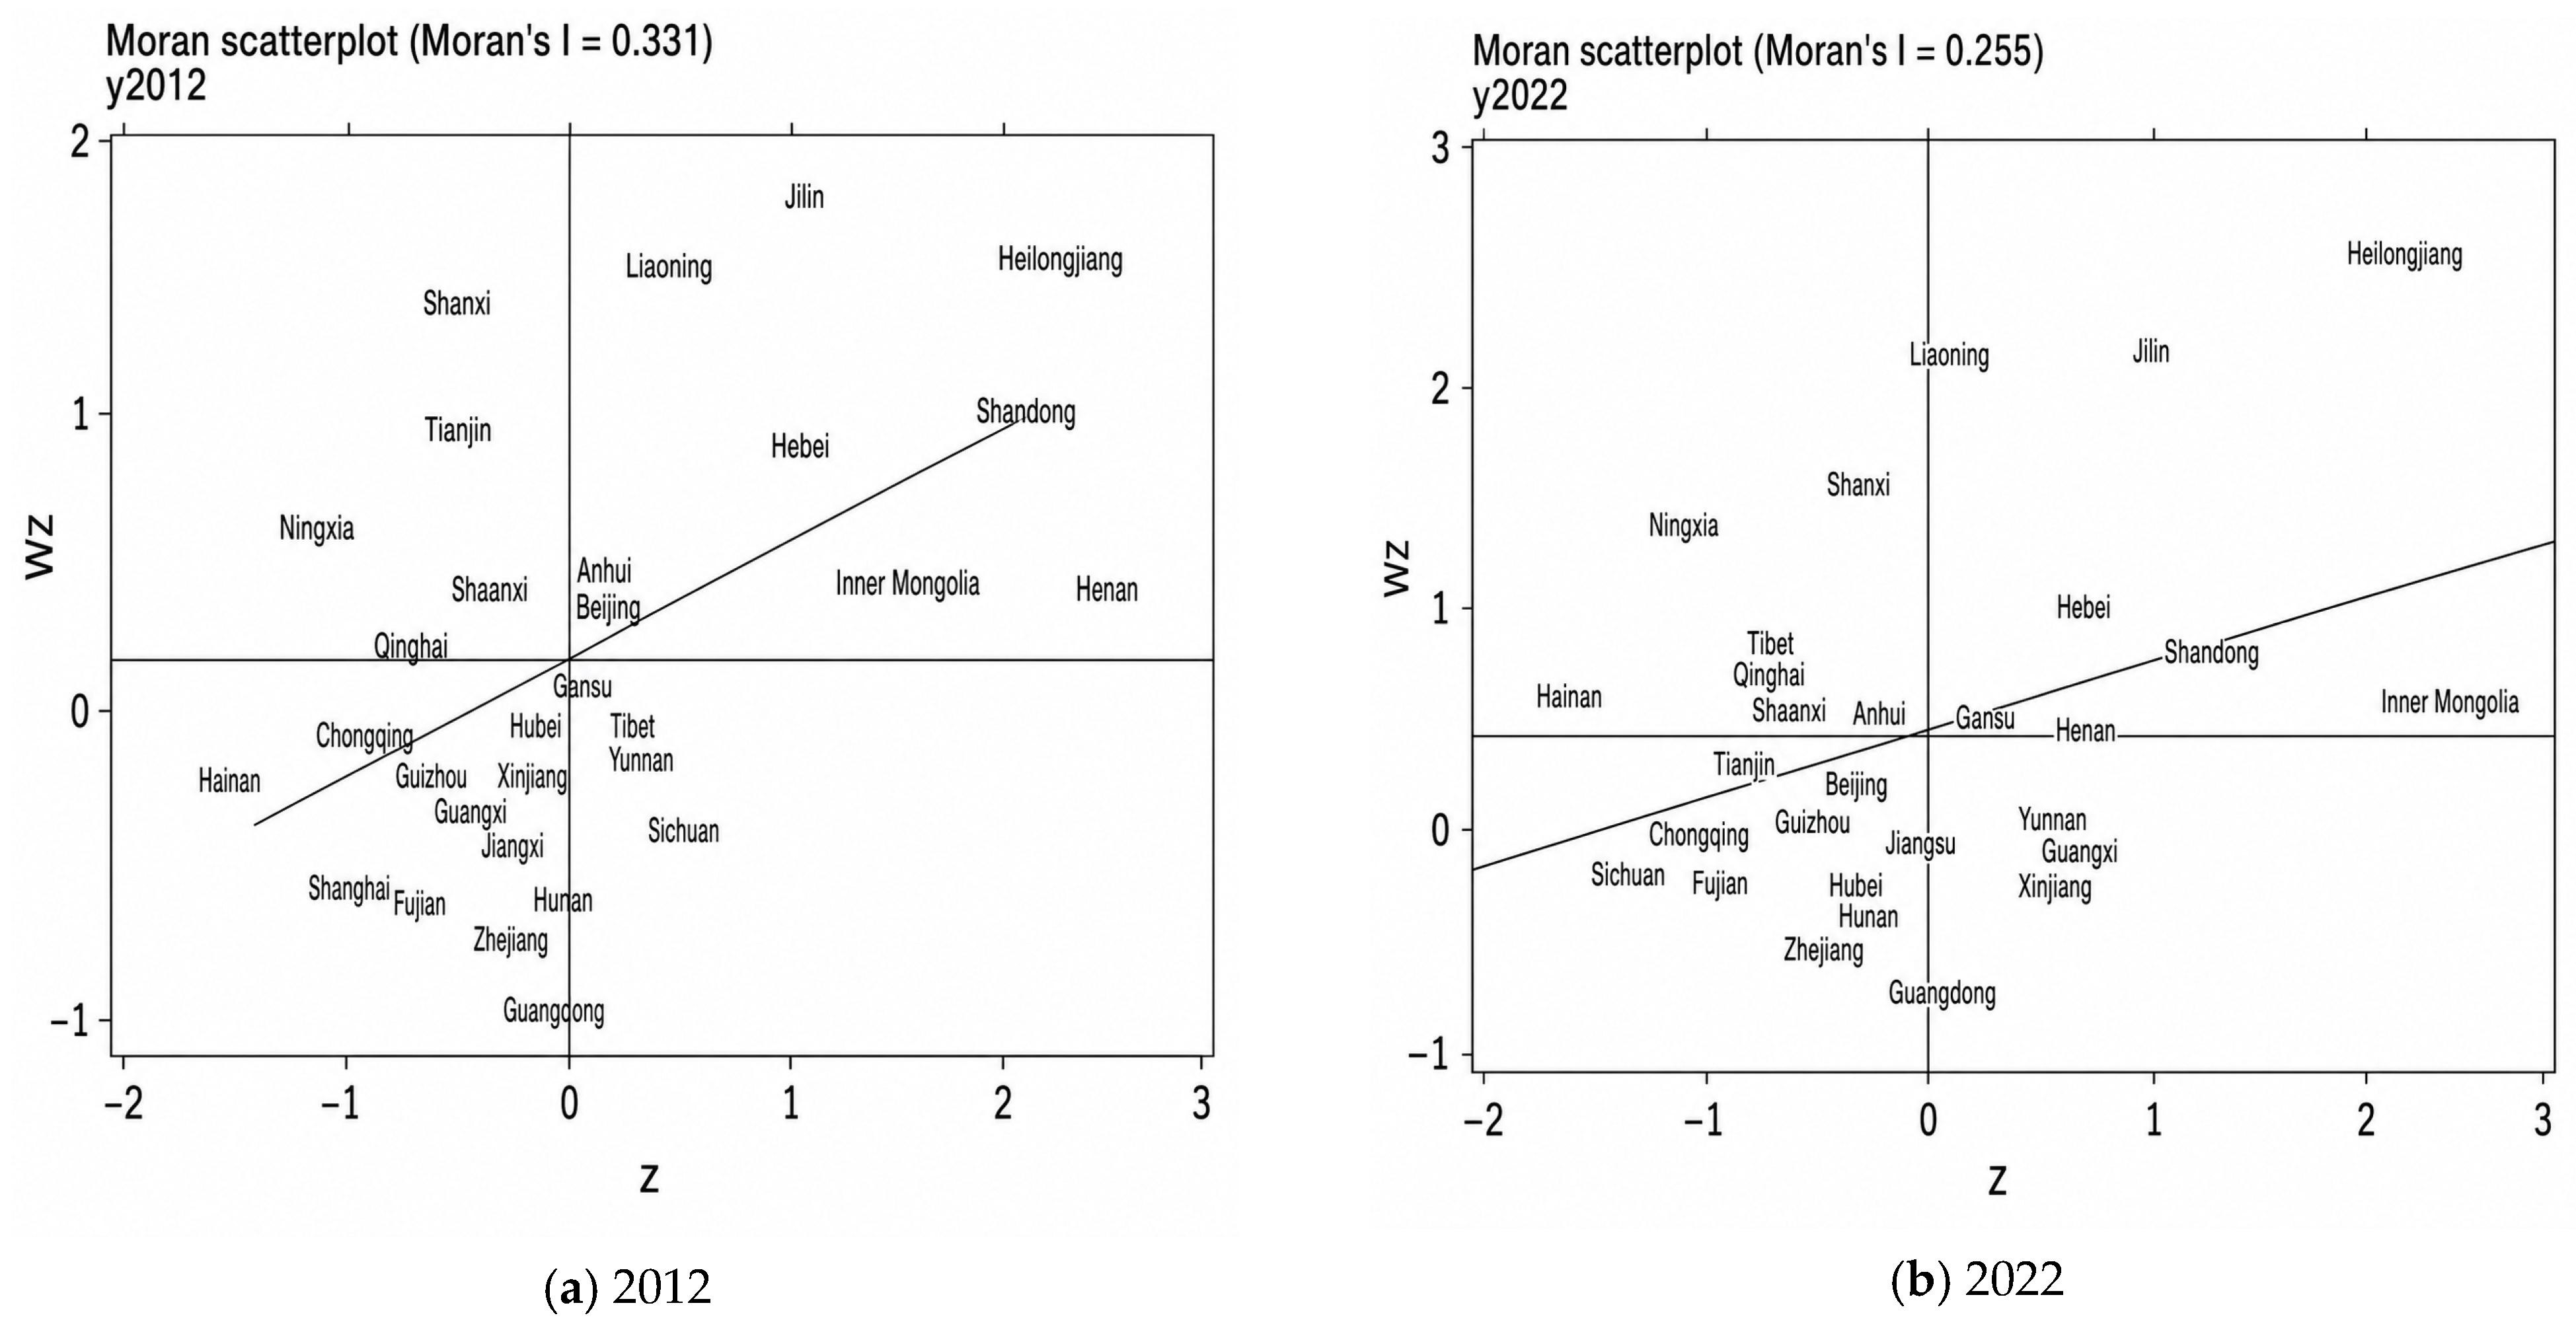
As shown in Figure 4, in terms of local spatial autocorrelation, the spatial pattern of China’s beef cattle industry resilience was mainly dominated by HH and LL agglomeration types from 2012 to 2022. As seen from the scatter distribution, more provinces converged towards the coordinate axes and the origin in 2022.
In 2012, HH-type high-value agglomeration areas were formed in Northeast and North China, with Heilongjiang, Jilin, and Liaoning acting as the core of high-value clusters; this pattern was generally maintained in 2022 and became more concentrated within Northeast China. LL-type low-value agglomerations were mainly distributed in the southeast coastal areas and parts of southwest China in both periods, forming a low-value belt covering Shanghai, Fujian, Zhejiang, Jiangxi, Chongqing, and other provincial-level regions.
Meanwhile, an increasing number of provinces belonging to LH and LL types clustered closer to the coordinate axes and the origin in 2022, which indicates that the intensity of spatial agglomeration has gradually declined, with more prominent local spatial heterogeneity and transitional characteristics emerging.

5. Diagnosis of Obstacle Factors Affecting Beef Cattle Industry Resilience

5.1. Analysis of Obstacle Factors at the National Level

As shown in Table 5, at the national level, the main obstacle factors restricting the improvement of China’s beef cattle industry resilience remained highly stable from 2012 to 2022. The top five obstacle factors were consistently concentrated in annual total corn output (C9), the degree of large-scale breeding (C13), forage sown area (C10), year-end breeding cow inventory (C11), and the number of authorized patents (C7).
Annual total corn output (C9) ranked as the primary obstacle factor, which is closely related to the cost structure and feeding characteristics of beef cattle production. Feed cost is one of the largest components of beef cattle farming costs. Public production surveys indicate that feed costs can account for more than 70% of total beef cattle farming costs, suggesting that fluctuations in feed supply and feed prices directly affect breeding profitability and operational stability [41]. Corn is an important energy feed in beef cattle fattening. In commonly used beef cattle fattening concentrate formulas, corn usually accounts for approximately 50–58% of the concentrate mixture; in stage-specific fattening rations, corn accounts for approximately 30–45% of the diet [42]. Therefore, corn output not only reflects regional feed-grain supply capacity, but also affects the stability of fattening costs, feed conversion efficiency, and risk resistance capacity. When corn supply is insufficient or its price fluctuates substantially, the shock can be rapidly transmitted to concentrate feed costs and fattening expenditures, thereby increasing uncertainty in breeding income and weakening beef cattle industry resilience.
The degree of large-scale breeding (C13) consistently ranked second from 2012 to 2022, with its obstacle degree increasing slowly from 12.408% to 12.939%. This result indicates that, under the established indicator system and weighting structure, the insufficient level of large-scale and standardized breeding remains an important weakness in improving the resilience of the beef cattle industry. Moderate-scale operation usually helps improve production efficiency, epidemic prevention capacity, technology adoption, and market bargaining power [43]. However, in practice, the expansion of large-scale breeding is still affected by factors such as land availability, financing constraints, environmental regulations, and investment in breeding facilities. Therefore, the persistently high obstacle degree of C13 reflects, to some extent, that the organizational and standardized production capacity of the beef cattle industry still has room for improvement.
Forage sown area (C10) and year-end breeding cow inventory (C11) alternated between the third and fourth positions, indicating that the relative importance of forage-resource constraints and breeding-foundation constraints varied across different periods. From 2012 to 2014, C10 ranked third, suggesting that insufficient forage supply exerted a strong constraint on the resilience of the beef cattle industry in the early stage of the study period. In 2015 and 2016, C11 rose to third place, while C10 dropped to fourth place, indicating that as forage-resource pressure was relatively alleviated, the shortage of cattle sources and weak breeding foundations became more prominent. After 2017, C10 returned to third place and remained relatively stable, with its obstacle degree increasing from 11.536% in 2017 to 12.026% in 2022. This change may be related to the expansion of breeding scale, the growth of fattening demand, and the increasing pressure on high-quality forage supply. Meanwhile, the obstacle degree of C11 declined to 10.979% in 2022, but it remained among the top four obstacle factors over the long term, indicating that breeding cow inventory and breeding foundations are still important factors related to industrial recovery capacity.
The number of granted patent applications (C7) remained in fifth place throughout the study period, with its obstacle degree ranging from 9.242% to 9.665%. This result indicates that technological innovation is not the most prominent obstacle factor, but its supporting role in improving the resilience of the beef cattle industry still needs to be further strengthened. The enhancement of beef cattle industry resilience depends not only on resource inputs and the expansion of breeding scale, but also on technological support in improved-breed breeding, feeding management, epidemic prevention and control, manure resource utilization, smart livestock farming, and carbon-emission reduction [44]. The long-term presence of C7 among the top five obstacle factors indicates that the transformation of technological innovation capacity into resilience improvement remains insufficient.
Overall, the obstacle factors are mainly characterized by a relatively prominent feed-grain supply constraint, the persistent weakness of large-scale operation, the stage-specific alternation between forage-resource constraints and breeding-foundation constraints, and the need to further strengthen technological innovation support.

5.2. Analysis of Obstacle Factors at Regional Level

As shown in Table 6, the regional ranking of obstacle factors further reveals clear heterogeneity in the constraints affecting beef cattle industry resilience. In Eastern China, annual total corn output (C9) ranked as the primary obstacle factor in all selected years, while forage sown area (C10) also remained highly ranked, ranking third in 2013 and second in 2016, 2019, and 2022. This indicates that constraints on feed-grain and forage supply are persistent bottlenecks for improving beef cattle industry resilience in Eastern China. This may be related to relatively limited land resources, high urbanization levels, and strong competition among grain crops, cash crops, and non-agricultural land uses in the region. Against this background, improving beef cattle industry resilience in Eastern China may depend more on the stability of external feed procurement, feed-use efficiency, and interregional supply-chain coordination.
In Central China, the leading obstacle factors shifted between the degree of large-scale breeding (C13) and annual total corn output (C9). In 2013, the degree of large-scale breeding (C13) ranked first, followed by annual total corn output (C9) and year-end breeding cow inventory (C11). In 2016 and 2022, annual total corn output (C9) rose to become the primary obstacle factor, while the degree of large-scale breeding (C13) ranked second. This change suggests that while Central China has improved breeding organization and large-scale operation through the construction of standardized farms, leading enterprises, and industrial alliances, the expansion of breeding and fattening activities may have increased pressure on feed-grain supply. Therefore, the main constraints in Central China are not only related to the expansion of breeding scale itself, but also to the coordination between scaled production and stable feed-grain supply.
In Western China, the ranking of obstacle factors shifted from being dominated by feed-grain constraints to being dominated by scale-operation constraints. In 2013 and 2016, annual total corn output (C9) ranked first, followed by the degree of large-scale breeding (C13) and forage sown area (C10). However, in 2019 and 2022, the degree of large-scale breeding (C13) rose to first place, while annual total corn output (C9) ranked second and forage sown area (C10) remained third. This indicates that insufficient large-scale and standardized breeding had become the most prominent constraint in Western China in the later stage of the study period. Although Western China has certain grassland resources and ecological breeding advantages, beef cattle production may still be affected by scattered farming entities, weak standardization, insufficient infrastructure, and limited industrial-chain coordination [45]. Under market fluctuations and external shocks, these weaknesses may reduce production efficiency, risk-sharing capacity, and the ability to transform resource advantages into stable industrial resilience.
In Northeastern China, the obstacle structure was relatively stable. The degree of large-scale breeding (C13) ranked first in all selected years, and forage sown area (C10) ranked second throughout 2013–2022. Year-end breeding cow inventory (C11) ranked third in 2013, 2016, and 2019, indicating that the breeding foundation was also an important constraint during most of the study period. By 2022, the number of authorized patents (C7) had risen to third place, suggesting that insufficient technological innovation and weak transformation of research achievements were emerging as new constraints.
Overall, the regional ranking of obstacle factors indicates that different regions face different combinations of bottlenecks. Eastern China is mainly constrained by feed-grain and forage supply; Central China faces dual pressures from breeding-scale expansion and increasing feed-grain demand; Western China is increasingly constrained by insufficient large-scale and standardized operation; and Northeastern China continues to face constraints in scale operation and forage supply, with technological innovation becoming more prominent in the later period. These results suggest that policies for improving beef cattle industry resilience should not adopt a uniform regional approach, but should instead be aligned with regional resource endowments, production-system characteristics, and industrial-chain functions. It should also be noted that the four-region classification is insufficient to fully capture internal heterogeneity and may mask differences among beef cattle production systems within the same region. Future research could further compare these results with classifications based on agro-ecological zones or production systems.

6. Conclusions and Promotion Paths

6.1. Main Research Conclusions

Based on panel data from 31 provincial-level administrative regions in China from 2012 to 2022, this study constructs a four-dimensional resilience evaluation framework for the beef cattle industry, covering foundational capacity, resistance capacity, recovery capacity, and sustainability capacity. By integrating the entropy weight method, kernel density estimation, Dagum Gini coefficient decomposition, spatial autocorrelation analysis, and an obstacle degree model, this study identifies the temporal evolution, regional disparities, spatial associations, and relative bottlenecks of beef cattle industry resilience. The main conclusions are as follows.
(1)
The comprehensive resilience index of China’s beef cattle industry increased from 0.105 in 2012 to 0.167 in 2022, but the overall level remained relatively low. Foundational capacity, resistance capacity, and recovery capacity improved steadily, whereas sustainability capacity exhibited a shallow U-shaped trajectory. This indicates that the short- and medium-term supporting and recovery conditions of the beef cattle industry have improved, but long-term green transformation remains a weak link.
(2)
Regional imbalance persisted during the study period. The average overall Dagum Gini coefficient was 0.277, showing an evolutionary pattern of initial convergence followed by renewed expansion. The difference between Eastern and Northeastern China was the largest, while the gaps between Eastern and Western China and between Northeastern and Western China were also evident. Therefore, national imbalance cannot be attributed to a single regional pair; rather, it reflects multiple gaps in resource endowments, production functions, technological conditions, and market organization.
(3)
The kernel density estimation results show that the national distribution curve shifted rightward while the distribution range widened, indicating that beef cattle industry resilience improved overall but became more differentiated. Eastern China improved relatively steadily, Central China showed hierarchical differentiation in the later period, Western China exhibited multi-polar differentiation, and Northeastern China improved rapidly but with stronger fluctuations.
(4)
The spatial autocorrelation results indicate that beef cattle industry resilience showed positive but relatively limited spatial association. High-resilience clusters were mainly distributed in northern pastoral areas, northeastern production-advantage areas, and some southwestern agro-pastoral ecotone areas, whereas several southeastern coastal and southern provinces remained low-resilience areas. The decline in Moran’s I suggests that local heterogeneity has become increasingly important.
(5)
From the perspective of obstacle constraints, insufficient feed and forage supply, a low level of large-scale and standardized breeding, an incomplete improved-breed breeding system, and lagging innovation in green breeding and smart livestock technologies are the core common obstacles restricting the steady improvement of beef cattle industry resilience. Meanwhile, the degree of influence and priority of these constraints vary significantly across Eastern, Central, Western, and Northeastern China. Different regions face distinct development bottlenecks, weak links, and upgrading difficulties, making unified and homogeneous industrial support policies less effective. Therefore, differentiated resilience improvement paths should be formulated according to regional resource endowments and industrial foundations.

6.2. Promotion Paths

First, corresponding to the weakness in sustainability capacity, a green, low-carbon, and circular breeding system should be accelerated. Priority should be given to crop–livestock integration, manure resource utilization, straw feed conversion, silage feed supply, and carbon-emission management. By improving resource recycling efficiency and environmental governance capacity, the beef cattle industry can enhance its adaptive capacity under long-term resource constraints and green transformation requirements.
Second, corresponding to persistent regional imbalance, differentiated policies should be designed according to regional resource endowments and industrial functions. Eastern China should focus on improving the stability of external feed procurement, processing and circulation efficiency, and technical service capacity. Central China should strengthen grain–feed coordination, slaughtering and processing, and cold-chain logistics systems. Western China should develop ecological grassland breeding and green brands under ecological constraints. Northeastern China should consolidate its foundation as a high-quality beef cattle production and breeding-stock base.
Third, corresponding to the widening inter-provincial differentiation revealed by kernel density estimation, a hierarchical and categorized resilience improvement mechanism should be established. For low-resilience provinces, priority should be given to improving basic production conditions, epidemic prevention and control, feed and forage security, and financial support, so as to prevent long-term low-level development. For medium-resilience provinces, efforts should focus on improving coordination among forage production, improved-breed breeding, large-scale farming, slaughtering and processing, and market circulation, so as to prevent further structural differentiation. For high-resilience provinces, their resource or scale advantages should be transformed into systematic advantages through technology diffusion, standard promotion, and industrial cooperation, thereby forming gradient improvement paths suited to different resilience levels.
Fourth, corresponding to the limited spatial association and increasing local heterogeneity, cross-regional industrial coordination should be strengthened to enhance the driving role of high-resilience regions. A more stable regional cooperation network should be built through cross-regional feed and forage allocation, breeding-stock supply, joint epidemic prevention and control, shared technical services, and cold-chain logistics connections. In particular, functional complementarity among major production areas, fattening areas, processing areas, and consumption areas should be strengthened to improve interregional industrial-chain coordination.
Fifth, corresponding to the core bottlenecks identified by the obstacle degree model, targeted improvements should be made in feed and forage supply, moderate-scale operation, breeding foundations, and technological innovation. On the one hand, the stability of feed and forage supply should be enhanced by promoting the Grain-for-Forage policy, constructing silage corn bases, utilizing straw as feed, and improving cross-regional feed and forage supply systems. On the other hand, moderate-scale operation supported by standardized barns, cooperatives, and leading enterprises should be encouraged, while breeding cow protection, improved-breed expansion, and basic cow herd development should be strengthened to enhance industrial recovery capacity. In addition, research, development, and extension of key technologies, including improved-breed breeding, smart livestock farming, epidemic prevention and control, manure resource utilization, and low-carbon breeding, should be strengthened to enhance the contribution of technological innovation to beef cattle industry resilience.

6.3. Research Limitations and Future Prospects

This study still has several limitations. First, the analysis is mainly based on provincial-level macro data, which makes it difficult to fully reveal the differences among farmers, cooperatives, leading enterprises, and other types of production and business entities. Second, some indicators, such as broadband access ports, patent authorizations, highway freight turnover, and fiscal support, are provincial-level proxy indicators rather than beef-cattle-specific indicators. Although their theoretical logic and proxy basis have been explained in this study, these indicators may still be insufficient to fully reflect the actual operating characteristics within the beef cattle industry. Third, the methods used in this study mainly focus on comprehensive evaluation, spatial association identification, and obstacle-factor diagnosis. They do not further distinguish the independent effects of policy shocks, market fluctuations, pandemic-related disturbances, and other factors through causal identification models. Fourth, unobserved institutional factors, local implementation capacity, and market organization may also affect industrial resilience, but these factors are difficult to measure consistently at the provincial scale.
Future research can be further extended in several directions. First, micro survey data and enterprise panel data can be incorporated to examine resilience differences among entities with different breeding scales, organizational forms, and business models. Second, fixed-effects models, difference-in-differences models, and spatial econometric methods such as the spatial Durbin model can be used to further identify the causal determinants and spatial transmission mechanisms of beef cattle industry resilience. Third, scenario simulation methods can be introduced to evaluate changes in beef cattle industry resilience under climate shocks, feed price increases, animal disease outbreaks, and trade disruptions. Fourth, more refined ecological production-zone classifications can be adopted and compared with the four-region economic classification used in this study, so as to improve the explanatory power of regional disparity analysis.
From the perspective of international applicability, the contribution of this study does not lie in proposing China-specific policy instruments that can be directly replicated by other countries. Rather, it provides a diagnostic approach for evaluating resilience and identifying bottlenecks in long-cycle livestock industries. For beef cattle-producing countries that also face feed price volatility, animal disease risks, ecological and environmental constraints, market uncertainty, and uneven regional development, this approach can help identify key weaknesses within the industrial system and provide comparative references for industrial adjustment under different development stages and resource endowment conditions.
It should be noted that the Chinese evidence is embedded in a specific institutional and industrial context. Provincial governance structures, fiscal support mechanisms, policy arrangements such as the Grain-for-Forage policy, regional economic differentiation, and the structure of beef cattle production and consumption may all affect the specific empirical results. Therefore, the conclusions of this study are more suitable as an analytical reference for international comparison. A more general implication is that resilience building in long-cycle livestock industries requires the coordination of resource supply, producer organization, market connections, technological support, and regional collaboration, as well as adaptive adjustment according to local resource conditions and development constraints. Specifically, for regions with abundant grassland resources but relatively weak market organization capacity, such as parts of South America, Central Asia, and Africa, resilience enhancement may focus on the coordinated development of grassland resource utilization, ecological breeding, disease prevention and control, and product branding. For regions with strong consumer markets but limited land resources and feed supply, such as parts of Southeast Asia and densely populated developing economies, greater attention should be paid to processing capacity, cold-chain logistics, financial services, digital market information, and cross-regional feed-security systems. In this sense, the Chinese case does not provide a single policy template, but offers a comparative diagnostic reference for optimizing resource allocation, strengthening regional coordination, and enhancing system adaptability in different livestock development contexts.

Author Contributions

Conceptualization, Y.G.; methodology, Z.Z.; software, Z.Z.; validation, Y.G. and C.G.; formal analysis, Z.Z.; investigation, Z.Z., C.G. and H.Z.; resources, C.G. and H.Z.; data curation, Z.Z. and H.Z.; writing—original draft preparation, Z.Z.; writing—review and editing, Y.G. and C.G.; visualization, Z.Z. and C.G.; supervision, Y.G. and C.G.; project administration, Y.G.; funding acquisition, H.Z. All authors have read and agreed to the published version of the manuscript.

Funding

This research was funded by the National Social Science Fund of China, grant number 23BGL187, and the Special Fund for the Construction of the Modern Agricultural Industrial Technology System in Hebei Province, Industrial Economic Post of Beef Cattle and Sheep Innovation Team in Hebei Modern Agricultural Industrial Technology System, grant number HBCT2024250301.

Institutional Review Board Statement

Not applicable.

Informed Consent Statement

Not applicable.

Data Availability Statement

The data presented in this study are available on request from the corresponding author.

Conflicts of Interest

The authors declare no conflicts of interest. The funders had no role in the design of the study; in the collection, analyses, or interpretation of data; in the writing of the manuscript; or in the decision to publish the results.

References

  1. Xi, J.P. Hold High the Great Banner of Socialism with Chinese Characteristics and Strive in Unity to Build a Modern Socialist Country in All Respects. In Proceedings of the Report to the 20th National Congress of the Communist Party of China; People’s Publishing House: Beijing, China, 2022. (In Chinese) [Google Scholar]
  2. Ma, A. Statistical measurement and improvement path of resilience level of China’s agricultural industry. Stat. Theory Pract. 2025, 7, 73–80. (In Chinese) [Google Scholar] [CrossRef]
  3. Zhu, M.D.; Cheng, G.Q. Realistic challenges, key issues and promotion strategies for high-quality development of China’s herbivorous animal husbandry. Soc. Sci. 2025, 16, 164–175. (In Chinese) [Google Scholar]
  4. Christopher, M.; Peck, H. Building the resilient supply chain. Int. J. Logist. Manag. 2004, 15, 1–14. [Google Scholar] [CrossRef]
  5. Cai, Y.; Tang, Z.; Zhuang, X.; Fu, Z.; Gan, C.; Dong, B. The impact of grain price regulation policies on U.S.–China price linkages. Systems 2026, 14, 193. [Google Scholar] [CrossRef]
  6. Thornton, P.K.; van de Steeg, J.; Notenbaert, A.; Herrero, M. The impacts of climate change on livestock and livestock systems in developing countries: A review of what we know and what we need to know. Agric. Syst. 2009, 101, 113–127. [Google Scholar] [CrossRef]
  7. Zhang, Y.M.; Long, W.J. Challenges and countermeasures for improving resilience of agricultural industry chains under the big food concept. Acad. J. Zhongzhou 2023, 4, 54–61. (In Chinese) [Google Scholar]
  8. Xiao, J.L.; Fang, Z.; Yan, C.H. Transmission between pork and beef price fluctuations: Evidence from a TVP-SV-VAR model. J. Agro-For. Econ. Manag. 2025, 24, 642–652. (In Chinese) [Google Scholar]
  9. Zhang, X.Q. Frequent warning signals in the beef market indicate that adjustment and upgrading of the beef cattle industry is imminent: An analysis of the reasons for the decline in China’s beef prices since 2023. Price Theory Pract. 2024, 2, 47–51. (In Chinese) [Google Scholar]
  10. Raza, A.; Razzaq, A.; Mehmood, S.S.; Zou, X.; Zhang, X.; Lv, Y.; Xu, J. Impact of climate change on crops adaptation and strategies to tackle its outcome: A review. Plants 2019, 8, 34. [Google Scholar] [CrossRef] [PubMed]
  11. Hirth, S.; Morgan, E.; dit Sourd, R.C.; Kaptan, G.; Tallontire, A.; Young, W. Leverage points to improve resilience in supply chains: Civil food resilience and food sovereignty. J. Rural Stud. 2025, 119, 103720. [Google Scholar] [CrossRef]
  12. Peng, A. Sustainable regional development from the perspective of economic resilience: Based on the impact of COVID-19. PLoS ONE 2025, 20, e0314663. [Google Scholar] [CrossRef] [PubMed]
  13. Du, W.; Zhai, G.; Lu, Y. Assessing regional city network resilience in economy and innovation from a city-industry perspective: A case study of the 2008 financial crisis and COVID-19. Cities 2026, 175, 107225. [Google Scholar] [CrossRef]
  14. Zhao, C.X.; Wang, M.L.; Yan, C.H. Regional gaps and temporal evolution of competitiveness of China’s beef cattle industry. Chin. J. Agric. Resour. Reg. Plan. 2025, 46, 167–177. (In Chinese) [Google Scholar]
  15. Zhang, R. Measurement of high-quality development level of China’s beef cattle industry and its influencing factors. Feed Res. 2024, 47, 176–180. (In Chinese) [Google Scholar]
  16. Li, R. Measurement of sustainable development of China’s beef cattle industry and its influencing factors. Feed Res. 2024, 47, 186–190. (In Chinese) [Google Scholar]
  17. Medic, K.C.; Ceh, A.; Milinkovic, A.; Vunjak, D. Design of sustainable farm complex: A case study of farm in Vojvodina, Republic of Serbia. Sustainability 2025, 17, 11356. [Google Scholar] [CrossRef]
  18. Ghanem, A.M.; Alnashwan, O.S.; Alqunaibet, M.H.; Alduwais, A.A.M.; Almodarra, S.F.; Alaagib, S.B. Measuring the impact of livestock development on local red meat production and food security in Saudi Arabia. Sustainability 2026, 18, 1883. [Google Scholar] [CrossRef]
  19. Wang, Q.; Ziegler, S.; Flack, S.; Unveren, H.; Anderson, A.; Darby, H. Production costs of grass-fed organic milk in the Northeastern United States: Empirical results from survey data and implications for sustainable development. Sustainability 2025, 17, 11324. [Google Scholar] [CrossRef]
  20. Li, J.R.; Wang, M.L.; Yang, C.; Shi, Z.Z. Regional differences and influencing factors of total factor productivity in China’s beef cattle industry: Panel data from 15 provinces and regions, 2013–2017. J. Hunan Agric. Univ. Soc. Sci. 2019, 6, 46–55. (In Chinese) [Google Scholar]
  21. Liu, J.J.; Sheng, S.T.; Wang, J. Effects of beef cattle subsidy policy on farmers’ scaled breeding. Chin. J. Anim. Sci. 2019, 1, 142–146. (In Chinese) [Google Scholar]
  22. Zheng, R.Q.; Zhang, Q.; Huang, H.; Zhai, Y. Measurement, influencing factors and improvement strategies of resilience level of China’s pig industry. Heilongjiang Anim. Sci. Vet. Med. 2024, 24, 9–15. (In Chinese) [Google Scholar]
  23. Ma, Z.H. Resilience status of China’s pig feed industry chain and its influencing factors. Feed Res. 2024, 47, 189–194. (In Chinese) [Google Scholar]
  24. Wang, Z.; Xin, W.; Li, M.; Duan, D.; Han, J.; Wang, M.; Zhou, S.; Li, X. Uncovering the genetic basis of porcine resilience through GWAS of feed intake data. Animals 2025, 15, 3269. [Google Scholar] [CrossRef] [PubMed]
  25. Holling, C.S. Resilience and stability of ecological systems. Annu. Rev. Ecol. Syst. 1973, 4, 1–23. [Google Scholar] [CrossRef]
  26. Barney, J. Firm resources and sustained competitive advantage. J. Manag. 1991, 17, 99–120. [Google Scholar] [CrossRef]
  27. Smit, B.; Wandel, J. Adaptation, adaptive capacity and vulnerability. Glob. Environ. Chang. 2006, 16, 282–292. [Google Scholar] [CrossRef]
  28. Meadows, D.H. Thinking in Systems: A Primer; Chelsea Green Publishing: White River Junction, VT, USA, 2008. [Google Scholar]
  29. Folke, C.; Carpenter, S.R.; Walker, B.; Scheffer, M.; Chapin, T.; Rockstrom, J. Resilience thinking: Integrating resilience, adaptability and transformability. Ecol. Soc. 2010, 15, 20. [Google Scholar] [CrossRef]
  30. Li, J.Y.; Hu, J.L. Digital inclusive finance, extension of agricultural industry chains and farmers’ income increase. Stat. Decis. 2024, 40, 81–85. (In Chinese) [Google Scholar]
  31. Liu, Z.W. Development level of digital agriculture, regional differences and spatiotemporal evolution characteristics. Stat. Decis. 2023, 20, 94–99. (In Chinese) [Google Scholar]
  32. He, J.X.; Li, H.Y. Regional differences, dynamic evolution and influencing factors of employment quality in China. Arid Land Geogr. 2026, 1–13. Available online: https://link.cnki.net/urlid/65.1103.X.20251202.1507.003 (accessed on 1 July 2026). [CrossRef]
  33. Ma, X.Y.; Pei, T. Regional economic disparities in Beijing based on exploratory spatial data analysis. Prog. Geogr. 2010, 29, 1555–1561. (In Chinese) [Google Scholar] [CrossRef]
  34. Yan, H.; Li, X.Y. Measurement, spatiotemporal evolution and trend prediction of agricultural ecological resilience in China. J. Sichuan Agric. Univ. 2025, 43, 1667–1676. (In Chinese) [Google Scholar]
  35. Chen, W.H.; Qian, H.H.; Yan, G.Y. Impacts of livestock industry agglomeration on livestock carbon emissions: Analysis based on the Kuznets curve and spatial indirect effects. Heilongjiang Anim. Sci. Vet. Med. 2023, 20, 10–21+28. (In Chinese) [Google Scholar]
  36. Gao, W.; Song, Q.; Zhang, H.; Wang, S.; Du, J. Analysis of changes in supply and demand of ecosystem services in the Sanjiangyuan Region and the main driving factors from 2000 to 2020. Land 2025, 14, 1427. [Google Scholar] [CrossRef]
  37. Xi, J.P. Secure a Decisive Victory in Building a Moderately Prosperous Society in All Respects and Strive for the Great Success of Socialism with Chinese Characteristics for a New Era. In Proceedings of the Report to the 19th National Congress of the Communist Party of China, 18 October 2017; People’s Publishing House: Beijing, China, 2017; p. 30. [Google Scholar]
  38. Zhou, M.; Han, Y.X. Spatiotemporal evolution, influencing factors and prediction of the coupling coordination between urban–rural integration and habitat quality. Environ. Sci. 2026, 1–17. (In Chinese) [Google Scholar] [CrossRef]
  39. Shi, Z.Z.; Hu, X.D. Impacts of cropping structure adjustment on feed grain supply-demand and livestock and poultry breeding in China. Resour. Sci. 2022, 44, 2567–2579. (In Chinese) [Google Scholar] [CrossRef]
  40. Zhao, Y.; Feng, Q. Identifying spatial and temporal dynamics and driving factors of cultivated land fragmentation in Shaanxi province. Agric. Syst. 2024, 217, 103948. [Google Scholar] [CrossRef]
  41. Barreto Riaño, H.; Escobar, J.W.; Linfati, R.; Ortiz-Araya, V. Disciplinary categorization of the cattle supply chain: A review and bibliometric analysis. Sustainability 2022, 14, 14275. [Google Scholar] [CrossRef]
  42. Jia, X.; Yu, C.; Mou, S. Livestock and poultry manure utilization incorporating carbon accounts: A perspective from small-world networks. Energy 2026, 345, 140070. [Google Scholar] [CrossRef]
  43. Wang, H.; Wang, Y.; Ding, X.; Tang, J.; Li, R.; Li, K. Spatio-temporal evolution and driving mechanisms of ecological resilience: The Guanzhong Plain Urban Agglomeration case. Environ. Sustain. Indic. 2026, 30, 101229. [Google Scholar] [CrossRef]
  44. Jiang, Y.; Cheng, Y.; Li, K.; Fu, X.; Feng, S.; Xu, B. Analysis of livestock manure utilization in planting and breeding supply chain with organic preference. Environ. Dev. Sustain. 2024, 26, 14295–14326. [Google Scholar] [CrossRef]
  45. Morchid, A.; Ismail, A.; Khalid, H.M.; Qjidaa, H.; El Alami, R. Blockchain and IoT technologies in smart farming to enhance the efficiency of the agri-food supply chain: A review of applications, benefits, and challenges. Internet Things 2025, 33, 101733. [Google Scholar] [CrossRef]
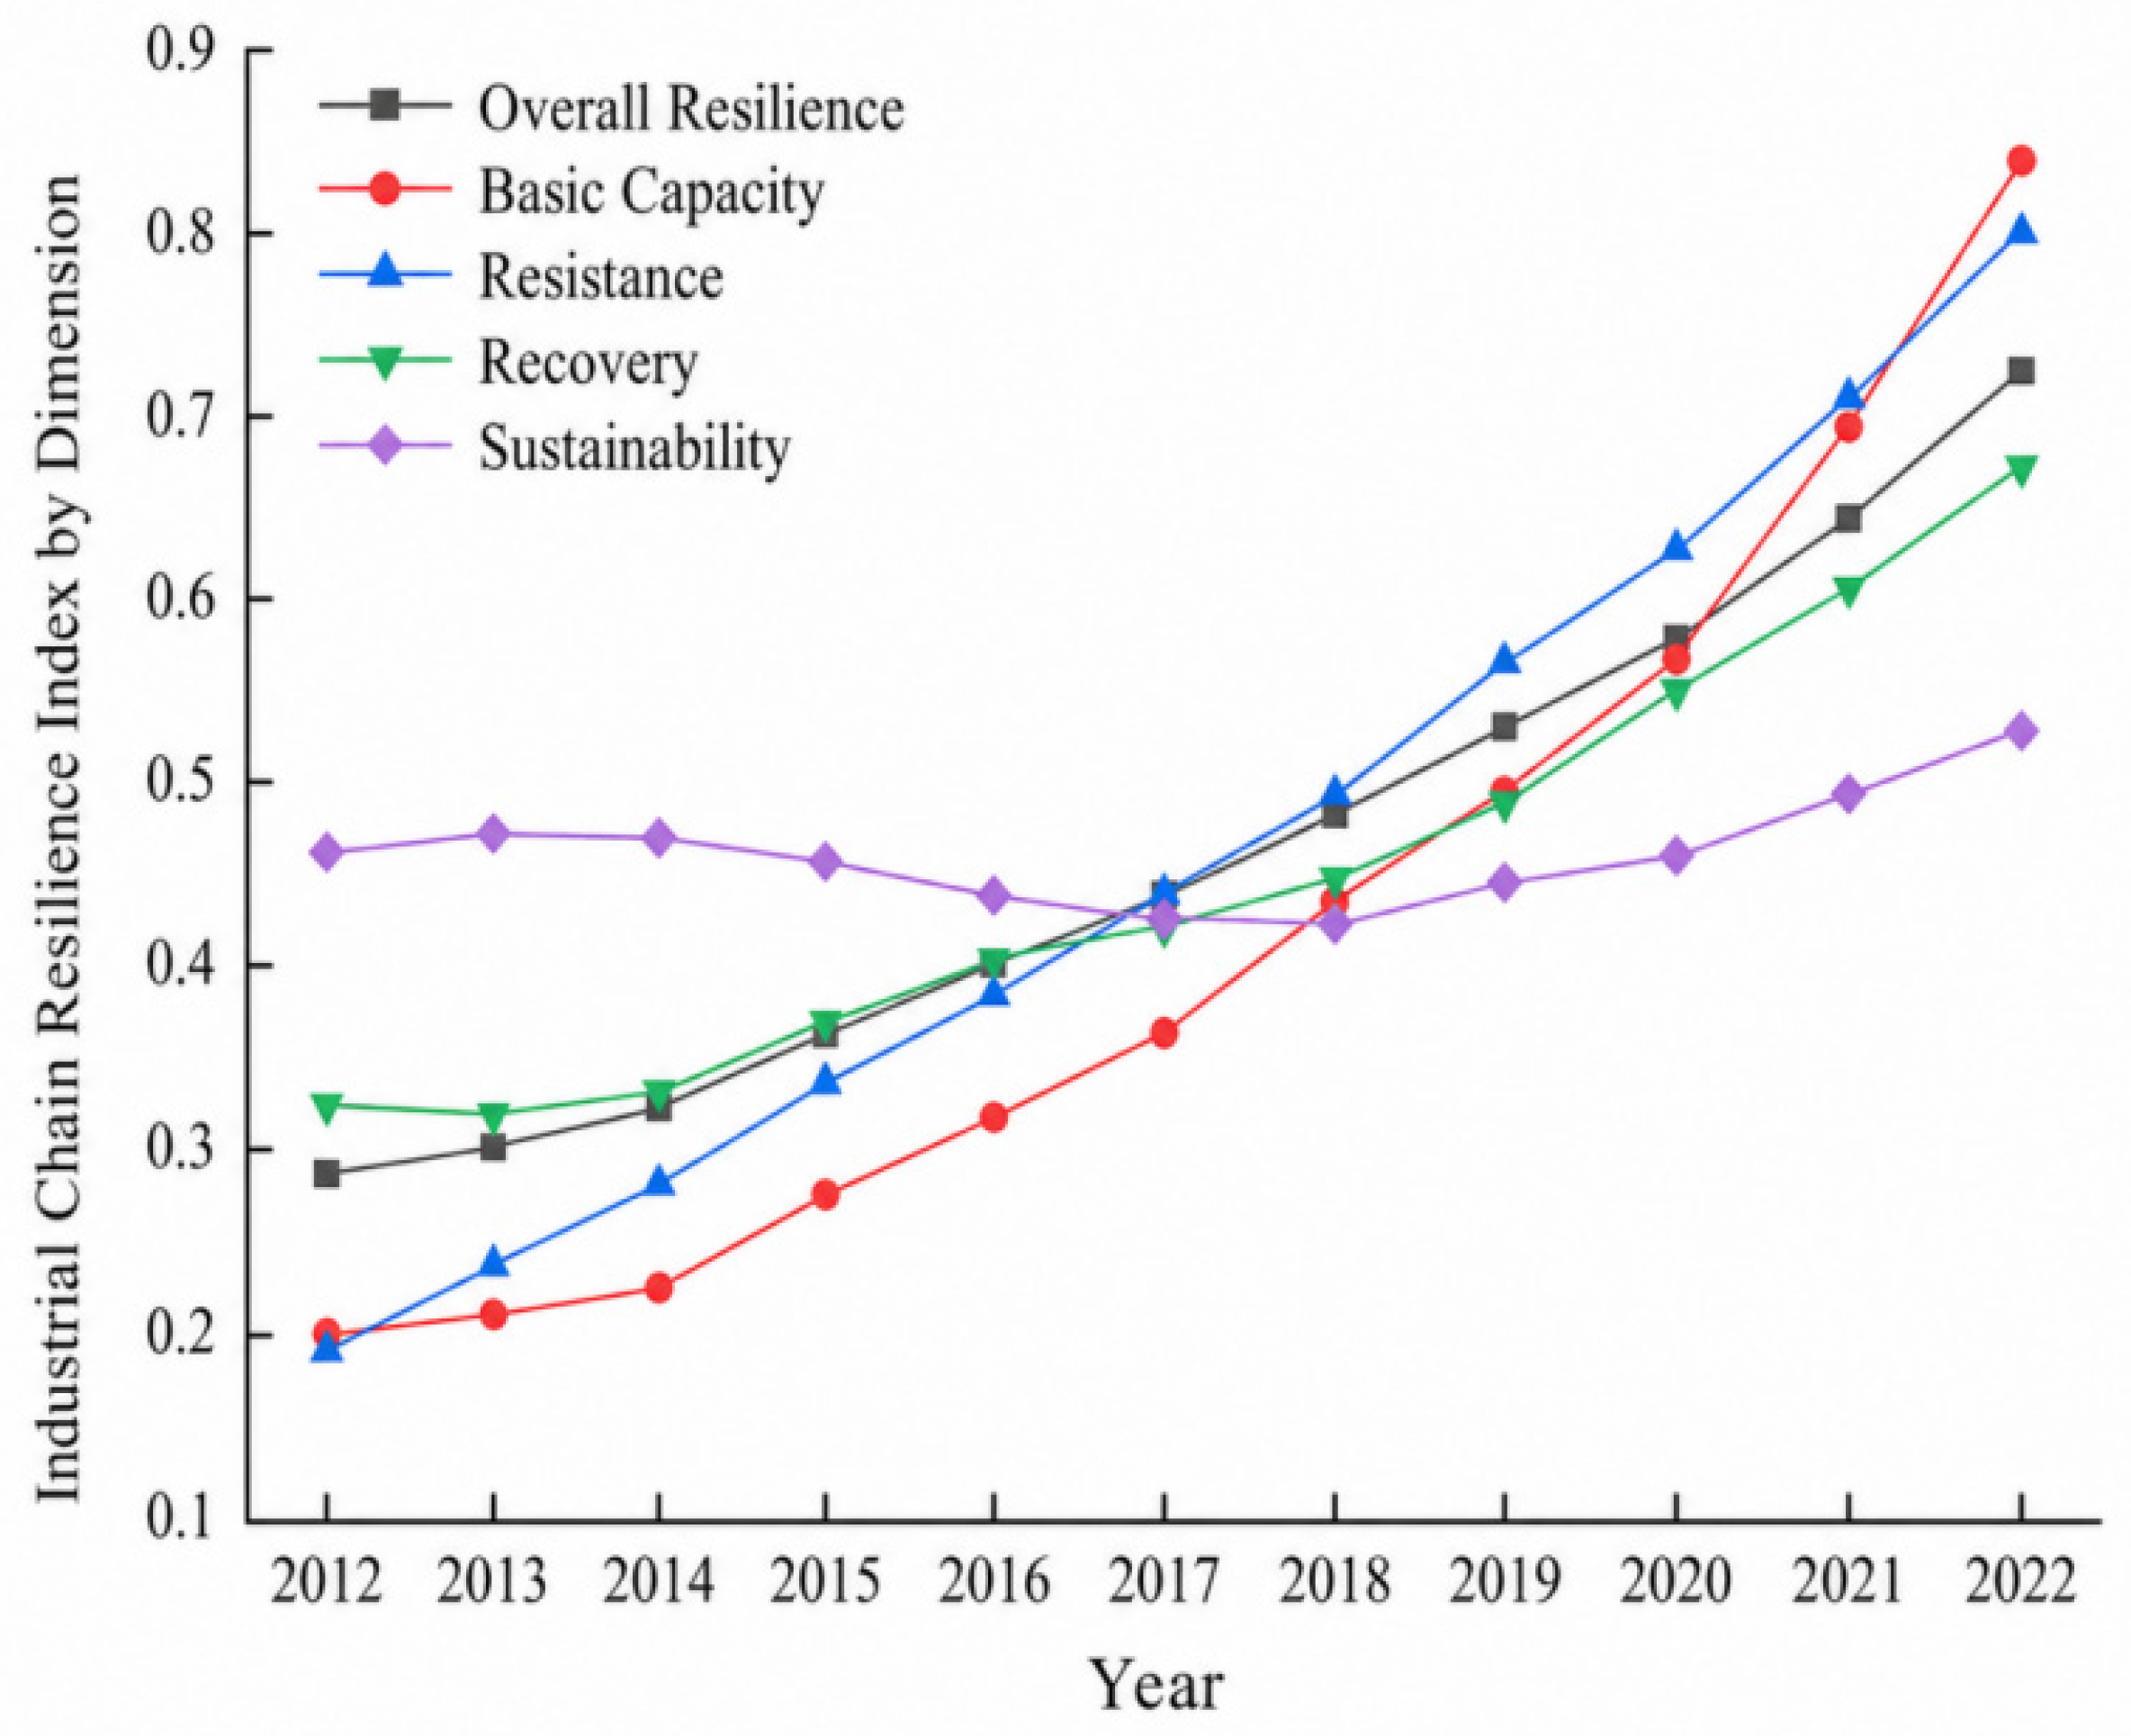
Figure 1. Overall resilience of the beef cattle industry and levels of various indicators from 2012 to 2022.
Sustainability 18 07014 g001
Figure 2. Kernel density map of the resilience development level of the national and regional beef cattle industry from 2012 to 2022: (a) China; (b) Eastern China; (c) Central China; (d) Western China; (e) Northeastern China. Note: The color gradient is used to distinguish the height of the kernel density surface; warmer colors indicate higher kernel-density values, whereas cooler colors indicate lower kernel-density values.
Sustainability 18 07014 g002
Figure 3. Spatiotemporal evolution comparison of the resilience of the beef cattle industry: (a) 2013; (b) 2016; (c) 2019; (d) 2022. Note: The colors from light to dark represent low resilience, relatively low resilience, medium resilience, relatively high resilience, and high resilience, respectively. The dashed lines denote the South China Sea boundary lines shown in the China base map.
Sustainability 18 07014 g003
Figure 4. Scatter plot of local Moran’s I for specific years: (a) 2012; (b) 2022.
Sustainability 18 07014 g004
Table 1. Evaluation index system for the resilience of the beef cattle industry.
DimensionsLevel 1 Ind.Level 2 Ind.UnitAttr.Wt.
Foundational CapacityIndustrial FoundationYear-end beef cattle inventory104 head+0.0420
Beef production104 t+0.0444
Output value of beef cattle industry108 CNY+0.0510
Transportation InfrastructureHighway freight turnover108 ton-km+0.0430
Digital infrastructure availabilityBroadband access ports per 10,000 peopleports/104 persons+0.0327
Resistance
capacity
Disease Prevention and ControlTownship veterinary stationsstation+0.0258
Innovation OutputGranted patent applicationsitem+0.0882
Resource EndowmentAnnual soybean production104 t+0.0732
Annual corn production104 t+0.1192
Green-fodder sown area103 ha+0.1025
Recovery CapacityPopulation RetentionYear-end breeding cattle inventory104 head+0.1015
Government SupportAnnual agriculture-related fiscal expenditure108 CNY+0.0193
Scale of OperationShare of farms raising 100+ beef cattle%+0.1171
Sustainability
capacity
Green DevelopmentBeef cattle carbon emissions104 t CO2-eq0.0071
Carbon-emission economic loss intensity%0.0069
Market EnvironmentPer capita beef consumptionkg/person+0.0647
IndustrializationBeef cattle cooperativesunit+0.0614
Table 2. Measurement results of the resilience development level of the beef cattle industry in 31 provinces of China.
Province20122013201420152016201720182019202020212022MeanRank
Inner Mongolia0.2000.2300.2530.3530.2730.2810.3180.3410.3690.4010.4110.3121
Heilongjiang0.2320.2310.2440.2600.2660.2690.2780.3120.3360.3260.3580.2832
Shandong0.2140.2160.2160.2270.2320.2430.2480.2520.2500.2800.2920.2433
Henan0.2240.2300.2330.2440.2450.1840.2050.2090.2190.2260.2420.2244
Hebei0.1670.1780.1850.1900.1960.2020.2080.2140.2250.2360.2370.2035
Jilin0.1590.1760.1830.1860.1950.1830.1800.1990.1980.2200.2810.1966
Sichuan0.1390.1520.1670.1790.1910.1900.2020.2050.2180.2290.2310.1917
Yunnan0.1110.1210.1310.1400.1540.1640.1740.1870.2040.2170.2240.1668
Liaoning0.1340.1470.1450.1540.1620.1420.1490.1580.1680.1780.1830.1569
Gansu0.1010.1200.1320.1880.1610.1630.1490.1550.1690.1820.1970.15610
Xinjiang0.0960.1100.1240.1420.1410.1490.1500.1630.1820.2110.2200.15311
Guangdong0.0900.0970.1040.1320.1250.1350.1550.1590.1720.1840.1880.14012
Anhui0.1200.1240.1350.1420.1550.1280.1330.1250.1350.1480.1560.13713
Jiangsu0.0900.0960.1050.1220.1200.1270.1440.1560.1660.1780.1800.13514
China mean0.1050.1110.1190.1330.1350.1290.1350.1410.1500.1590.1670.135-
Beijing0.1240.1350.1380.1430.1570.1130.1080.1200.1370.1250.1220.12915
Hunan0.0970.1040.1090.1160.1940.1140.1230.1210.1310.1380.1420.12616
Hubei0.0940.1080.1180.1200.1350.1180.1210.1200.1250.1360.1420.12217
Shanxi0.0710.0830.0910.0970.1070.1090.1240.1220.1320.1350.1460.11118
Guizhou0.0710.0760.0820.0920.1060.1090.1090.1210.1240.1240.1380.10519
Xizang0.1180.1140.1070.1010.0960.0880.0980.1000.1020.1090.1140.10420
Shaanxi0.0780.0800.0940.0970.0960.0980.0990.0980.1050.1070.1110.09621
Jiangxi0.0700.0760.0820.1140.0940.0900.0950.0980.1030.1130.1180.09622
Zhejiang0.0640.0680.0690.0810.0800.0860.0920.0980.1040.1140.1190.08923
Guangxi0.0610.0640.0630.0740.0800.0810.0910.0910.0990.1040.1060.08324
Tianjin0.0700.0480.0570.0670.0920.1010.0840.0920.1030.0950.1050.08325
Qinghai0.0520.0560.0620.0660.0700.0750.0800.0790.0980.1070.1040.07726
Chongqing0.0570.0600.0870.0690.0680.0690.0690.0700.0740.0760.0780.07027
Ningxia0.0430.0440.0750.0760.0800.0530.0580.0580.0670.0700.0740.06328
Fujian0.0440.0480.0520.0770.0600.0580.0590.0600.0650.0690.0730.06029
Shanghai0.0320.0320.0330.0340.0350.0390.0400.0460.0480.0500.0490.04030
Hainan0.0220.0230.0240.0280.0310.0300.0320.0340.0370.0360.0350.03031
Note: Values are rounded to three decimal places. China mean represents the arithmetic mean of the 31 provincial-level regions.
Table 3. Dagum Gini coefficient and decomposition of beef cattle industry resilience.
Year G Within-Region GiniBetween-Region GiniContribution Share (%)
ECWNEE–CE–WE–NEC–WC–NEW–NE G w G b G t
20120.2900.1220.2280.2410.3460.2750.3240.3550.2500.3060.30525.84032.07042.090
20130.2940.0990.2060.2540.3590.2580.3150.3590.2440.3160.32226.01734.38539.598
20140.2770.1140.1950.2300.3470.2430.2870.3530.2220.3030.30726.13735.80338.060
20150.2810.1160.1650.2870.3140.2280.2940.3220.2520.2700.31327.67730.92841.395
20160.2670.1100.1860.2440.3180.1950.2810.3250.2380.2820.29126.66837.23636.097
20170.2670.1410.2660.1180.3160.2810.2440.3220.2200.3020.24327.86826.50045.632
20180.2710.1400.1220.2710.3250.2310.2810.3210.2240.2600.30628.03126.25145.718
20190.2760.1510.2820.1200.3130.3000.2720.3300.2310.3050.25027.71928.08944.192
20200.2710.1570.2780.1210.3000.2930.2680.3220.2300.2990.24127.85129.09943.050
20210.2760.1350.2850.1120.3170.2840.2490.3180.2340.3120.25228.16428.88742.948
20220.2820.1400.2820.1180.3170.3110.2840.3510.2350.3110.25227.06132.85040.089
Note: G denotes the overall Dagum Gini coefficient. G w , G b , and G t denote the contribution shares of within-region disparity, between-region disparity, and transvariation, respectively. E, C, W, and NE represent East, Central, West, and Northeast, respectively.
Table 4. Moran’s I of the overall resilience of the beef cattle industry during 2012–2022.
YearContiguity Weight MatrixEconomic-Geographic Weight Matrix
Moran’s Iz-Scorep-ValueMoran’s Iz-Scorep-Value
20120.3313.0640.002 ***0.1203.1360.002 ***
20130.3162.9350.003 ***0.1032.7620.006 ***
20140.3303.0620.002 ***0.1062.8360.005 ***
20150.2452.4240.015 **0.0872.5320.011 **
20160.2492.3620.018 **0.0732.1440.032 **
20170.2392.3120.021 **0.0772.2480.025 **
20180.2032.0210.043 **0.0772.2820.023 **
20190.2262.2280.026 **0.0762.2640.024 **
20200.2082.0820.037 **0.0662.0690.039 **
20210.1871.8970.058 *0.0662.0670.039 **
20220.2552.4910.013 **0.0742.2180.027 **
Note: *** p < 0.01, ** p < 0.05, * p < 0.1.
Table 5. Main factors hindering the resilience of the beef cattle industry (Unit: %).
Obstacle FactorsYear
20122013201420152016201720182019202020212022
1stC9C9C9C9C9C9C9C9C9C9C9
12.70712.85812.96313.20213.16212.96313.02712.99713.05413.40513.301
2ndC13C13C13C13C13C13C13C13C13C13C13
12.40812.52412.49412.76212.62112.64912.84112.84912.80312.90212.939
3rdC10C10C10C11C11C10C10C10C10C10C10
11.20411.28711.39111.36311.29811.53611.61011.69611.82611.90112.026
4thC11C11C11C10C10C11C11C11C11C11C11
11.10011.13511.15910.54711.13711.26711.27611.26811.28211.14710.979
5thC7C7C7C7C7C7C7C7C7C7C7
9.4569.4669.4959.6659.6009.4259.3659.3509.2929.2429.251
Table 6. Main barriers to the resilience of the beef cattle industry in the four major regions (unit: %).
RegionYear
2013201620192022
1st2nd3rd1st2nd3rd1st2nd3rd1st2nd3rd
EastC9C13C10C9C10C11C9C10C13C9C10C11
CentralC13C9C11C9C13C11C13C9C10C9C13C10
WestC9C13C10C9C13C10C13C9C10C13C9C10
NortheastC13C10C11C13C10C11C13C10C11C13X10C7
Disclaimer/Publisher’s Note: The statements, opinions and data contained in all publications are solely those of the individual author(s) and contributor(s) and not of MDPI and/or the editor(s). MDPI and/or the editor(s) disclaim responsibility for any injury to people or property resulting from any ideas, methods, instructions or products referred to in the content.