Article

SYTRAC: An Edge AI-Based Intelligent Traffic Signal Control System Using OPC UA and Deep Learning for Smart City Applications

1
LRPE Laboratory, Department of Automation, Faculty of Electrical Engineering, University of Sciences and Technology Houari Boumediene (USTHB), Algiers 16111, Algeria
2
Automatic and Intelligent Systems Department, University of Setif 1, Setif 19000, Algeria
3
IRECOM Laboratory, University of Sidi Bel-Abbes, Sidi Bel-Abbes 22000, Algeria
4
LECM Laboratory, University of Sidi Bel-Abbes, Sidi Bel-Abbes 22000, Algeria
*
Author to whom correspondence should be addressed.
Sustainability 2026, 18(14), 7010; https://doi.org/10.3390/su18147010
Submission received: 1 May 2026 / Revised: 7 June 2026 / Accepted: 9 June 2026 / Published: 9 July 2026

Abstract

Urban traffic congestion is a primary driver of greenhouse gas emissions, wasted fuel, and degraded air quality, presenting a significant barrier to achieving sustainable cities (SDG 11) and climate action (SDG 13). Standard Adaptive Traffic Signal Control (ATSC) systems are either financially prohibitive for developing countries or lack certified safety mechanisms for physical deployment on live roads. This paper proposes and validates SYTRAC (System for Adaptive Traffic Control), a low-cost, safety-critical Adaptive Traffic Signal Control system designed for resource-constrained urban environments. SYTRAC implements an asynchronous co-design that combines real-time visual vehicle detection on an NVIDIA Jetson Nano GPU with deterministic safety execution on a Siemens S7-1200 Programmable Logic Controller (PLC). The core of the system is the Density-Weighted Adaptive Green Extension (DWAGE) algorithm. DWAGE provides a stable, interpretable, and computationally lightweight alternative to complex optimization methods such as genetic algorithms, particle swarm optimization, or Deep Reinforcement Learning. We establish a formal mathematical queue-stability guarantee using a closed-form Foster–Lyapunov drift argument. A three-mode fault-tolerant state machine with a 2 s watchdog automatically transitions to fixed-time fallback in the event of hardware or camera stream failures, protecting physical intersection safety. The system was validated through hardware-in-the-loop field deployments at a live intersection in Ouargla, Algeria. SYTRAC achieved a statistically significant 22.1% reduction in average vehicle delay ( p < 0.001 ), while microscopic simulations confirmed up to 28.0% delay suppression during lane-blockage incidents. Critically, this delay reduction translates to an environmental saving of 53.5–72 kg of CO2 avoided per day, alongside annual fuel savings of 8430 L. Assembled within a $1257 hardware budget, SYTRAC delivers a cost-effective, open-source, and reproducible platform that bridges the gap between adaptive intelligence and industrial safety, providing a scalable blueprint for sustainable urban traffic management in emerging economies.

1. Introduction

Urban traffic congestion is a critical challenge that negatively impacts quality of life, public safety, energy consumption, and economic productivity. The global urban population is projected to reach 68% of the total world population by 2050, placing increasing pressure on existing road infrastructure. In developing countries such as Algeria, where the national vehicle fleet has exceeded 5.68 million registered vehicles according to the Algerian National Statistics Office (ONS) [1], intersections governed by legacy fixed-time traffic signals have become significant bottlenecks, incapable of adapting to real-time traffic demand or responding adequately to emergencies.
The scale of this problem in Algeria and comparable developing-country contexts can be quantified precisely. According to the Algerian National Statistics Office (ONS), Algeria’s vehicle fleet has surpassed 5.68 million registered vehicles [1], a sustained growth trajectory that has outpaced road infrastructure expansion and significantly increased congestion and operational inefficiencies at urban intersections. These dynamics translate into measurable economic and environmental costs: urban congestion in Algerian agglomerations generates substantial losses in commuter productivity and excess fuel consumption, while the transport sector contributes meaningfully to national CO 2 missions [2]—a burden compounded by the prevalence of older engines in the national fleet. At the intersection level, signalized junctions in mid-sized Algerian cities contribute to average per-vehicle delays of 45–65 s during peak hours, with correspondingly elevated fuel consumption and stop-and-go emission penalties. These figures establish the dual urgency of the problem: intersection signal control in developing countries is simultaneously a mobility crisis and a quantifiable sustainability challenge, motivating the deployment of low-cost adaptive signal control as a primary policy lever.
The consequences of traffic congestion extend well beyond commuter inconvenience: transportation accounts for approximately 24% of global direct CO 2 emissions [2], and signalized urban intersections are disproportionate contributors through forced stop-and-go idling. The United Nations SDG framework addresses this nexus directly—SDG  11.6 mandates a substantial reduction in the adverse per capita environmental impact of cities (including air quality), while SDG 13.2 calls for integrating climate-change measures into national policies. In rapidly developing nations such as Algeria, where the vehicle fleet is dominated by older engines emitting 20–35% more per idle second than the European reference fleet [1], every unnecessary second of red-phase idling carries a compounded environmental cost. Adaptive Traffic Signal Control therefore represents a sustainability intervention of the highest priority: eliminating unnecessary delay reduces fuel consumption and CO 2 emissions across an entire intersection simultaneously, without requiring changes to vehicles, roads, or driver behavior. Crucially, this sustainability dividend is only realized if adaptive control can be deployed affordably and safely at scale—the two barriers that have historically prevented its adoption in emerging economies.
Traditional fixed-time controllers, based on pre-programmed timing formulas derived from Webster’s model [3], assume static traffic patterns that rarely reflect actual vehicular demand. Even when Webster’s cycle length is optimally recalculated from field-measured saturation flows, fixed-time schemes are inherently unable to adapt to short-term demand fluctuations within a cycle. Adaptive Traffic Signal Control (ATSC) systems have demonstrated intersection delay reductions of 13–40% in controlled field deployments [4,5]. However, prevalent commercial ATSC solutions require expensive dedicated hardware, fiber-optic infrastructure, and centralized traffic management centers—capital expenditures that are generally prohibitive for mid-sized municipalities in emerging economies.
The convergence of edge computing, deep learning, and the Industrial Internet of Things (IIoT) offers a compelling opportunity to execute adaptive signal control autonomously at the intersection level. The NVIDIA Jetson Nano provides GPU-accelerated inference within a 5–10 W power envelope [6], and YOLOv4-tiny achieves near-real-time object detection with competitive accuracy on this platform [7]. The OPC UA protocol stack standardizes deterministic, platform-independent machine-to-machine communication between edge devices and industrial PLCs [8], providing the communication backbone for safety-critical signal actuation. Crucially, commanding an industrial PLC via OPC UA provides deterministic phase execution, galvanic isolation, and hardware-enforced fail-safe interlocks—fundamental requirements for public infrastructure deployment that are absent in software-only or GPIO-based IoT prototypes. Together, these technologies democratize Adaptive Traffic Signal Control by establishing a highly resilient, cost-effective foundation applicable to resource-constrained and arid environments, while a decentralized edge execution model ensures operational continuity during network interruptions and provides auditable performance logs for municipal governance.
Despite this progress, a critical trilemma prevents widespread deployment of intelligent ATSC at resource-constrained intersections. The trilemma is defined here as three simultaneously active, mutually constraining deployment barriers that cannot individually be solved without exacerbating the others. First, Deep Reinforcement Learning approaches [9,10,11] report high simulated performance, but the inherent sim-to-real transfer gap and the absence of hardware-enforced safety guarantees make them unsuitable for live public infrastructure. Second, low-cost IoT deployments use GPIO relay control without deterministic timing, galvanic isolation, or certified fail-safe fallback, thereby bypassing the industrial safety standards that national road authorities require. Third, no existing edge ATSC system provides a formal analytical certificate for its control law: rule-based and heuristic controllers in the literature operate without a provable queue-stability guarantee, preventing regulatory approval for permanent deployment. SYTRAC simultaneously addresses all three facets of this trilemma within a single validated platform, a combination distinct from the prior ATSC architectures reviewed. It integrates industrial-grade PLC actuation (determinism and hardware safety), standards-compliant OPC UA communication [8], a formally certified control law (Foster–Lyapunov stability), and live field validation within a single open, reproducible, sub-$1300 platform.
It is critical to acknowledge that the proposed approach is macroscopic in nature. Macroscopic modeling, while highly computationally efficient, does not explicitly model the maneuvering behavior of individual vehicles, microscopic car-following dynamics, or type-specific interactions (such as Vehicle-to-Vehicle (V2V), Vehicle-to-Pedestrian (V2P), or Vehicle-to-Everything (V2X) communication). Furthermore, this local formulation does not address high-priority traffic preemption (e.g., for transit or emergency vehicles) or global coordinating variables. However, in the target context of resource-constrained municipalities in emerging economies, V2X infrastructure is entirely absent, and microscopic modeling introduces extreme computational overhead that exceeds the sub-$1300 edge budget. The DWAGE algorithm’s density index ( ρ i ) acts as a robust macroscopic proxy for local traffic pressure that can run deterministically on a low-cost Jetson Nano. In heterogeneous multi-agent networks, the local SYTRAC PLC acts as a safety-critical “anchor” agent. As mature V2X or coordinated multi-agent layers emerge they can interface directly with this anchor via OPC UA, allowing macroscopic stability to be maintained while integrating high-frequency micro-agents.
The following five contributions of this paper have not been jointly reported in prior ATSC publications reviewed:
  • Asynchronous Edge-Industrial Co-Design for ATSC: We propose and validate an asynchronous co-design between stochastic deep learning edge inference (YOLOv4-tiny, Jetson Nano GPU) and deterministic OPC UA industrial PLC control (Siemens S7-1200), operating on a single resource-constrained node. The design formally decouples the non-deterministic inference domain from the safety-critical actuation domain—an architectural separation not identified among the ATSC systems surveyed in this work.
  • Formalization of the latency–safety trade-off via a three-mode state machine: SYTRAC introduces a three-mode fault-tolerant state machine (Mode SYTRAC/Mode OPC UA SCADA/Mode PLC Standalone, Section 4) that explicitly mediates the latency–safety trade-off: a 2 s OPC UA watchdog timeout triggers a bounded-time transition to deterministic PLC-embedded fixed-time fallback, formalizing the maximum permissible inference disruption interval. Hardware-in-the-loop profiling over 1000 OPC UA cycles confirms that 11.7 ms mean write latency and 47 ms emergency ALL-RED actuation satisfy IEC 61784 [12] bounds under worst-case inference jitter.
  • Stability-guaranteed macroscopic backpressure allocation (DWAGE): The Density-Weighted Adaptive Green Extension algorithm provides a closed-form stability argument (Proposition 1) grounded in macroscopic density-driven backpressure [13] and the Foster–Lyapunov criterion [14], formally guaranteeing bounded queue lengths under sub-saturated demand. This transforms DWAGE from a heuristic rule-based controller into an analytically characterized density-proportional policy.
  • Multi-method field validation under arid conditions: We present a rigorous evaluation combining hardware-in-the-loop latency profiling, live-intersection delay measurement (Ouargla, Algeria, 43 °C), non-parametric statistical testing with multiple-comparison correction (Holm–Bonferroni), and calibrated SUMO microscopic simulation (15 independent replications, GEH < 5.0; GEH is defined in Section 7). The 22.1% field-measured delay reduction (95% CI: [20.5%, 23.7%]; BCa bootstrap, B = 10,000 resamples) is compared against Webster optimal, fixed vehicle-actuated, and fixed-time baselines.
  • Reproducible low-cost deployment architecture with quantified sustainability impact: A three-mode, fault-tolerant, deployment-ready architecture assembled for under $1300 USD (full site: $1257; control loop: $1117) with open-source SUMO calibration files, DWAGE source code, and OPC UA node mapping archived on GitHub, democratizing safety-critical adaptive intersection control for resource-constrained municipalities. The 22.1% field-measured delay reduction translates to approximately 53.5 kg CO 2 avoided per day at the study intersection, directly supporting SDG 11.6 (urban air quality) and SDG 13.2 (climate action) and delivering a Social Return On Investment exceeding 33:1 relative to hardware cost.
The remainder of this paper is organized as follows. Section 2 reviews related work. Section 3 formally defines the ATSC optimization problem, decision variables, constraints, and objective function. Section 4 presents the system architecture and fault-tolerance modes. Section 5 describes the physical hardware architecture. Section 6 details the proposed methodology, detection pipeline, and DWAGE control framework, including a formal stability proposition. Section 7 reports the experimental results. Section 8 provides a comparative discussion, and Section 9 summarizes the conclusions.

2. Related Work

2.1. Fixed-Time Signal Control and Its Limitations

Fixed-time traffic signal control remains widely deployed in developing countries due to its low cost, operational simplicity, and minimal maintenance requirements. These systems regulate traffic using predetermined cycle lengths and historically derived phase splits. Although adequate under stable, low-demand conditions, fixed-time schemes fail to accommodate short-term fluctuations in traffic volume, leading to inefficient green time allocation and excessive vehicular idling [13]. In rapidly urbanizing regions with irregular driving patterns, this inflexibility substantially compounds intersection inefficiency.
Fundamental traffic flow theory and the case for adaptive control. The operational inadequacy of fixed-time control is rooted in the fundamental macroscopic relationships among traffic volume (q, veh/h), space-mean speed (u, km/h), and density (k, veh/km), connected through the identity q = k · u [15]. Under free-flow conditions ( k < k c r ), speed is approximately constant and throughput increases proportionally with density. When density crosses the critical value k c r (corresponding to capacity flow), traffic enters forced-flow regimes characterized by speed breakdowns and the formation of stop-and-go waves that propagate upstream from the bottleneck. At signalized intersections, each red phase constitutes a recurring artificial bottleneck: vehicles queue during red, discharge at saturation flow during green, and the residual queue from an inadequate green phase re-initiates forced-flow conditions in the next cycle. Recent work on congestion boundary approaches for phase transitions in traffic flow [16] formalizes how a signalized intersection acts as a phase-transition boundary: when the density of arriving traffic exceeds the critical density sustainable by the allocated green phase the intersection precipitates a transition from free-flow to congested flow on the approach arm. Adaptive signal control—by dynamically extending green phases in response to real-time demand—directly suppresses this transition, keeping approach densities below the congestion boundary. This connection is particularly important for stop-and-go wave dynamics. Reviews of stop-and-go wave suppression strategies [17] have demonstrated that reducing unnecessary stops at signalized intersections is the most effective infrastructure-level intervention for suppressing queue-discharge waves, outperforming highway-level strategies such as Variable Speed Limits (VSL) in terms of per-intersection impact. SYTRAC’s DWAGE algorithm implements exactly this suppression at the intersection level: by allocating green time proportionally to approach density, it minimizes the frequency and severity of forced-flow episodes, reducing stop-and-go wave generation at the source.

2.2. Adaptive and Intelligent Traffic Signal Control

Early large-scale centralized adaptive systems such as SCOOT [4] and SCATS [5] depend on inductive loop detectors connected to urban control centers. While effective in major cities, these systems require extensive and invasive subsurface infrastructure, limiting their economic viability for smaller municipalities. More recently, Deep Reinforcement Learning (Deep RL) has been explored as an adaptive control strategy. Wei et al. [10] developed IntelliLight, a deep Q-network model achieving up to 38% delay reduction in simulation. Zheng et al. [9] introduced PressLight, which extends queue pressure theory for coordinated signal control. Kolat et al. [18] investigated multi-agent RL for coordinating multiple intersections, demonstrating coordination gains but requiring centralized training infrastructure. Similarly, Bouriachi et al. [19] demonstrated significant travel time reductions using RL for an isolated multi-phase intersection in downtown Algiers. Although Deep RL achieves higher simulated gains, the inherent sim-to-real transfer gap and the absence of industrial safety guarantees in software-only RL controllers motivated the use of a deterministic, rule-based algorithm with hardware-enforced fallback at the PLC level. Consequently, none of the cited works employ industrial-grade PLC actuation or standards-compliant OPC UA communication pipelines. Complementary to RL-based approaches, recent work on macroscopic traffic control has demonstrated that aggregate flow and density metrics can drive effective adaptive policies. Beyond machine learning, metaheuristic and swarm intelligence algorithms have been extensively researched for traffic signal optimization. For instance, Celtek et al. [20] demonstrated the real-time application of swarm optimization techniques to dynamically adjust signal timings based on traffic conditions. More recently, Akopov and Beklaryan [21] introduced a parallel hybrid bi-objective genetic algorithm designed to optimize traffic flows within complex grid networks, such as Manhattan topologies, though such approaches require substantial computational infrastructure. While these metaheuristics and advanced reinforcement learning methods like Proximal Policy Optimization (PPO) can optimize phase splits under idealized multi-connected networks, their heavy computational footprint, lack of analytical stability proofs, and absence of physical safety fail-safes limit their direct edge deployment. SYTRAC’s DWAGE algorithm, by contrast, operates as a computationally lightweight, stability-guaranteed macroscopic control law specifically designed for real-time edge execution with direct PLC safety coupling.
Vehicle-Actuated (VA) controllers. Semi-actuated and fully-actuated controllers represent an intermediate class that extends fixed-time logic with real-time sensor inputs—typically inductive loops—to dynamically extend or curtail green phases through gap-out and max-out logic [4]. NEMA TS-2 compliant VA schemes achieve modest delay reductions of 10–20% relative to fixed-time plans under moderate demand, yet they remain sensor-technology-specific and provide no adaptive phase-split optimization across cycles. The Fixed Vehicle-Actuated (FVA) baseline used in Section 7 replicates this logic using vision-based vehicle counts in place of loop detectors, enabling a direct performance comparison against DWAGE.

2.3. Computer Vision for Traffic Monitoring

Deep convolutional object detection networks have largely surpassed classical sensors (inductive loops, ultrasonics) for multi-class vehicle detection. The original YOLO architecture [22] introduced efficient single-pass bounding box prediction. Refined variants such as YOLOv4 [7] and YOLOv4-tiny exhibit strong performance on edge accelerators. Amrouche et al. [23] reported 85.6% mAP@0.5 at 30 fps on a Jetson Xavier NX using custom vehicle datasets. Mansour Mohamed et al. [24] achieved 89.2% mAP for joint pedestrian-vehicle classification using YOLOv5 on the Jetson Nano. In the context of arid environmental conditions, Darwhekar et al. [25] documented significant detection degradation caused by solar glare, heat shimmer, and sand deposition in Saharan deployments, and they recommended Contrast Limited Adaptive Histogram Equalization (CLAHE) to recover up to 7.3% in detection recall—a preprocessing technique directly incorporated into SYTRAC. Beyond on-road vehicle detection, deep learning has also demonstrated its utility in broader transportation infrastructure assessment tasks. For instance, Xiong et al. [26] demonstrated that 3D ground-penetrating radar (3D-GPR) data combined with deep learning enables automatic non-destructive detection of sub-surface cracks in semi-rigid asphalt pavement bases, illustrating the versatility of neural architectures across heterogeneous sensing modalities in the transportation domain.

2.4. Edge Computing for IoT Transportation

Relocating computation to the network edge reduces upstream bandwidth requirements and minimizes real-time inference latency [27]. Wang et al. [28] demonstrated a 19% throughput improvement using coordinated multi-edge intersection control topologies. In the present work, INT8-compiled YOLOv4-tiny achieves a sustained 22.3 fps on the Jetson Nano GPU, consistent with NVIDIA hardware specifications [29]. This inference rate confirms the suitability of the platform for real-time traffic control. Raza et al. [30] proposed AI-TrafficLite, demonstrating that cloud-independent edge intelligence can govern adaptive signal logic, directly supporting the SYTRAC design philosophy.

2.5. OPC UA for Industrial IoT Integration

Within Industry 4.0 architectures, OPC UA has emerged as the standard protocol for deterministic machine-to-machine communication [8]. Wadi et al. [31] demonstrated OPC UA’s advantages over MQTT in terms of native data modeling and integrated security. Siemens TIA Portal natively exposes structured Data Block (DB) arrays as accessible OPC UA nodes [32,33,34]. Cavalieri et al. [35] reported a 99.97% packet delivery ratio in IT-SCADA systems communicating with S7-1500 PLCs over 72-h operational profiles. Nevertheless, no prior work combines real-time neural edge inference with asynchronous industrial PLC control via OPC UA in a traffic intersection context.
From a security standpoint, OPC UA [8] provides a comprehensive, built-in security architecture that fundamentally distinguishes it from low-cost IoT protocols such as MQTT [33,34], which rely on application-layer security add-ons. Specifically, [8] mandates native X.509 certificate-based authentication for client–server identity verification and AES-256 channel encryption in SignAndEncrypt mode, ensuring data integrity and confidentiality across the entire OT communication path between the Jetson Nano and the S7-1200 PLC. In traffic infrastructure, [8] mandates network zone separation between operational technology (OT, OPC UA/24 VDC) and information technology (IT) segments—a boundary that OPC UA’s structured security model is designed to enforce [31]. This represents a critical security advantage over GPIO-based or MQTT-based IoT prototypes, where command integrity cannot be cryptographically guaranteed and replay or spoofing attacks could directly actuate physical signal heads. The current SYTRAC prototype operates in Security Mode for diagnostic convenience (with physical point-to-point isolation and VLAN segmentation as compensating controls, as detailed in Section 8); enabling full [8] SignAndEncrypt mode is the first item on the production security roadmap. Regarding latency, Cavalieri et al. [35] characterize sub-50 ms write latency with a 99.97% packet delivery ratio for S7-series PLC communication over Fast Ethernet—establishing the performance envelope that SYTRAC’s OPC UA layer targets and subsequently validates in Section 7.

2.6. Emerging Research Directions

Several adjacent research directions have accelerated rapidly in recent years and are relevant to situating SYTRAC’s contribution. Deep reinforcement learning surveys have cataloged the rapid adoption of policy-gradient and actor–critic methods (PPO, DDPG, SAC) for ATSC, with benchmarks showing 30–50% simulated delay reductions in idealized environments [11]; the persistent sim-to-real gap and the absence of deterministic safety guarantees in software-only RL controllers remain open challenges. Multi-Agent RL (MARL) for corridor synchronization extends single-intersection control to multi-node networks [11,18] but requires centralized training infrastructure and continuous network connectivity that are unavailable in SYTRAC’s resource-constrained target deployments. Digital twin frameworks for traffic management [34] enable what-if scenario testing by coupling real-time sensor data to a high-fidelity simulation replica; this is a natural future extension for SYTRAC, where the calibrated SUMO model provides the simulation backbone. OPC UA over Time-Sensitive Networking (TSN) [8,35] extends the deterministic guarantees of OPC UA to Layer-2 with bounded latency and jitter, offering a pathway to tighter actuation guarantees in future versions of the SYTRAC industrial communication layer. Connected and autonomous vehicle (CAV) integration with signalized intersections through V2I communication is an emerging priority. Signal Phase and Timing (SPaT) broadcasting via DSRC/C-V2X enables approaching connected vehicles to receive real-time signal state predictions, supporting eco-approach and cooperative signal control strategies. However, SPaT-based adaptive methods require high connected-vehicle penetration rates that are effectively absent in Algeria’s current traffic fleet, making infrastructure-side adaptive control the operationally viable near-term approach. SYTRAC’s OPC UA Pub/Sub architecture is nonetheless structurally compatible with V2X message ingestion as a natural future extension.

2.7. Research Gaps Addressed

The preceding review reveals five specific gaps that SYTRAC addresses: (1) no prior ATSC work integrates a real-time deep learning edge node as a direct OPC UA client commanding an industrial-grade PLC on a live intersection, bridging the IT/OT boundary with formal safety guarantees; (2) field deployments in arid environments with extreme temperatures (>40 °C), solar glare, and sand deposition have not been addressed by existing edge ATSC systems; (3) no prior system co-executes neural inference and an asynchronous web supervision server within a single resource-constrained edge node; (4) the latency–safety trade-off at the inference–actuation interface has not been formalized or empirically characterized in the ATSC literature; and (5) no prior macroscopic density-driven ATSC algorithm provides a closed-form analytical stability guarantee grounded in Max-Pressure theory and the Foster–Lyapunov criterion.

3. Problem Formulation

3.1. Intersection Model and State Variables

Consider an isolated signalized intersection controlled by K mutually exclusive signal phases P = { P 1 , , P K } . For SYTRAC’s two-phase configuration, K = 2 . Let time be discretized into control epochs of duration T s seconds, corresponding to the DWAGE sampling window ( T s = 5  s). At each epoch t, the system state is characterized by:
  • v i ( t ) Z 0 : the vehicle count in the detection zone of approach i, estimated by the YOLOv4-tiny pipeline;
  • n ped , i ( t ) Z 0 : the pedestrian count in the crossing zone of approach i;
  • q i ( t ) R 0 : the instantaneous queue length (veh) at approach i;
  • ϕ ( t ) P : the currently active green phase.
The spatial vehicle density for approach i is defined as:
ρ i ( t ) = v i ( t ) L det , i
where L det , i (m) is the length of the detection zone (ROI polygon) for approach i. Note that ρ i ( t ) is a spatial occupancy index—the instantaneous vehicle count per unit detection-zone length—rather than the macroscopic stream density of classical traffic flow theory ( k = q / u s , veh/km). The two quantities are related but not interchangeable; ρ i ( t ) is used throughout SYTRAC as a proxy for queue pressure at approach i.

3.2. Decision Variables and Constraints

The primary control decision at each epoch is the green duration g i ( t ) (s) allocated to the active approach i, subject to the following constraints derived from traffic safety standards and operational requirements:
C1—Green Duration Bounds (IEC 61784 [12]):
g min g i ( t ) g max , g min = 8 s , g max = 80 s
The lower bound g min is hardcoded at the PLC level to guarantee the minimum pedestrian crossing time per EN 12368 [36]; it cannot be overridden by DWAGE output.
C2—Mutual Exclusivity (EN 12368 [36]): Let ϕ i ( t ) { GREEN , AMBER , RED } denote the signal state assigned to approach i at epoch t. At most one approach may receive a GREEN signal at any instant:
i = 1 K 1 ϕ i ( t ) = GREEN 1 t
C3—Amber Clearance (EN 12368 [36]): Each GREEN-to-RED transition includes a fixed amber clearance interval T A = 4  s enforced by the PLC ladder logic, yielding a cycle time:
T c ( t ) = i = 1 K g i ( t ) + T A + T A R = g 1 ( t ) + g 2 ( t ) + 2 T A + 2 T A R
C4—Sub-Saturation Capacity: For queue stability, the sum of critical flow ratios must not exceed the available green fraction:
i = 1 K λ i s i < 1 L T c , L = K ( T A + T A R ) = 12 s
where λ i (veh/s) is the mean arrival rate, s i (veh/s) is the saturation flow rate, and L is the total lost time per cycle.

3.3. Objective Function

The control objective is to minimize the mean per-vehicle delay across all approaches over a single control epoch T s (SYTRAC implements a greedy single-epoch policy; see Section 6):
min { g i ( t ) } J = 1 K i = 1 K E d i ( t )
where d i ( t ) is the average per-vehicle delay at approach i during epoch t. Under a macroscopic first-order traffic flow model [15], queue dynamics evolve as:
q i ( t + 1 ) = max ( q i ( t ) + λ i T c ( t ) s i g i ( t ) , 0 )
Control decisions must be taken in real time without knowledge of future demand, and they are subject to C1–C4. It is critical to note that the queue dynamics model formulated in (7) is mathematically simplified. First, it assumes an isolated intersection where arrival rates λ i ( t ) are exogenous and independent of neighboring controls. In a real-world multi-connected urban road network, intersections are tightly coupled: the green split allocation g i ( t ) at one junction directly dictates the arrival rate λ j ( t + 1 ) and the queue length q j ( t + 1 ) at the downstream approach of neighbor j. Second, this first-order model ignores spatial traffic wave propagation, queue spillbacks, and boundary effects, which can significantly alter vehicle discharge and arrival characteristics. To address network-level coordination, DWAGE inherits its design from Max-Pressure (backpressure) control theory. In Max-Pressure networks, global queue stability is proven to be maintained by allocating green times based strictly on local pressure differences (spatial densities), even in the absence of centralized network state variables. Consequently, while (7) is locally isolated to satisfy edge computational constraints it maintains systems-level compatibility with coordinated arterial control. Extending (7) to a coupled network model (such as a store-and-forward framework or a macroscopic fundamental diagram) is planned as a future work item.

3.4. DWAGE as a Real-Time Approximate Solution

The optimization in (6) and (7) is computationally intractable for online control due to the stochastic and non-stationary nature of urban traffic demand [13]. DWAGE addresses this by replacing the intractable global optimization with a greedy, density-driven green allocation that implicitly approximates a Max-Pressure policy [13]: at each sampling epoch, green time is allocated proportionally to the macroscopic density ρ i ( t ) , directing service capacity toward the most congested approach. Compared with Deep Reinforcement Learning approaches [9,10], DWAGE trades optimality for determinism, interpretability, and guaranteed safety-critical PLC-level bounds—properties essential for public infrastructure deployment. The formal stability guarantee of this allocation under sub-saturated demand (Constraint C4) is established in Proposition 1 in Section 6.

4. System Architecture

4.1. Overall Architecture

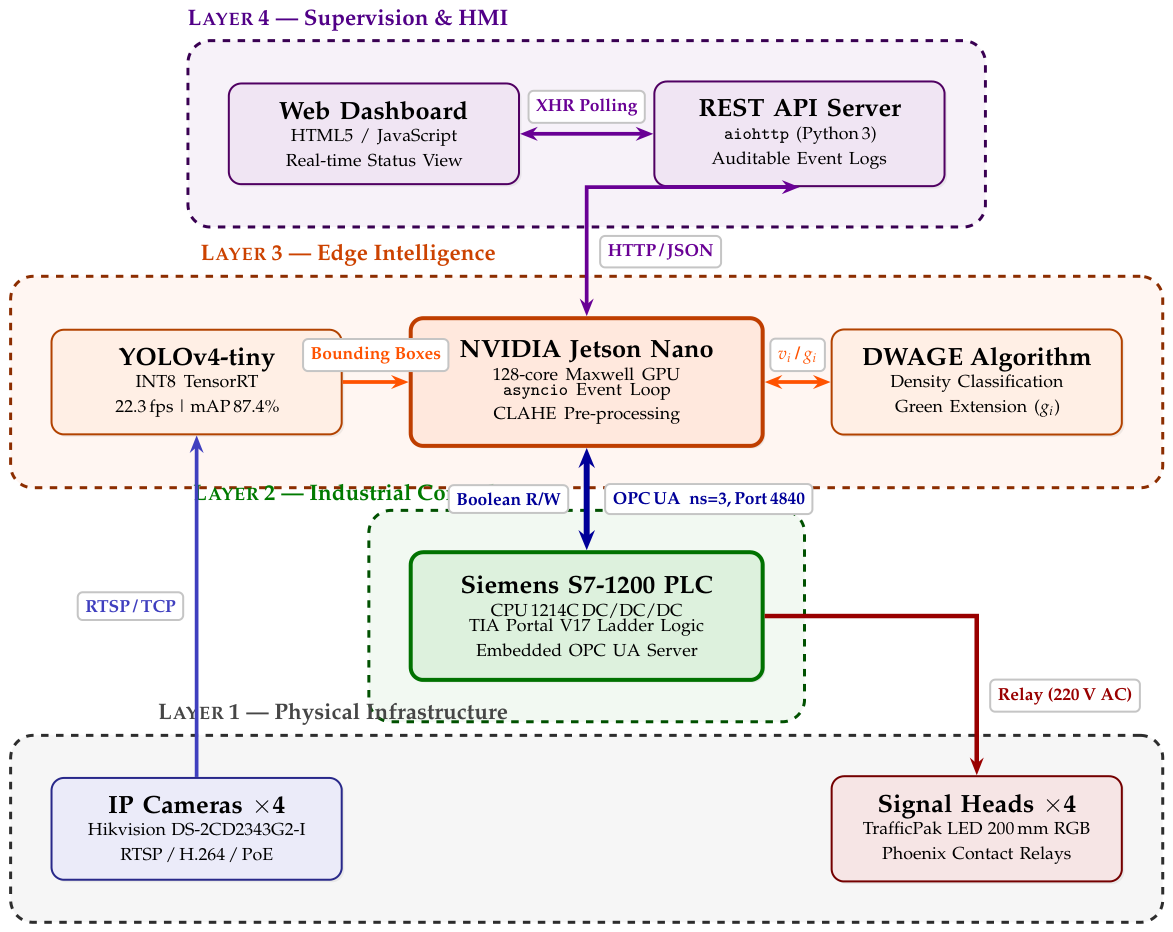
The SYTRAC system is organized into four hierarchical layers forming a closed-loop control system. The Physical Layer (Layer 1) comprises four ruggedized RTSP IP cameras (two per traffic-flow axis, providing full approach-arm coverage for both the North–South and East–West directions), a Siemens S7-1200 PLC (CPU 1214C DC/DC/DC), and LED traffic signal heads connected to relay modules. The Industrial Communication Layer (Layer 2) hosts an OPC UA client/server pipeline operating over TCP/IP on Port 4840 within Namespace 3. The Edge Intelligence Layer (Layer 3) runs on the NVIDIA Jetson Nano and executes the YOLOv4-tiny inference model and the DWAGE algorithm via an asynchronous Python asyncio event loop; the aiohttp REST API server is also co-located on the Jetson Nano within this layer, serving external clients without direct PLC access. The Supervision Layer (Layer 4) represents the external web dashboard clients that connect to the Jetson Nano REST API over HTTP/JSON. As depicted in Figure 1, RTSP video from the four IP cameras (Layer 1) feeds the YOLOv4-tiny inference engine and DWAGE algorithm on the Jetson Nano (Layer 3); Boolean phase commands travel bidirectionally over OPC UA (TCP:4840, ns = 3) down to the S7-1200 PLC (Layer 2), which exclusively drives the 220 V relay bank; and the supervisory REST API and HTML5 dashboard (Layer 4) connect to the Jetson Nano over HTTP/JSON without requiring direct PLC access.
The Python framework uses a fully asynchronous asyncio event loop to eliminate thread-blocking latency. RTSP camera buffers are continuously updated by parallel OpenCV threads, and phase control commands are transmitted to the PLC via the asynchronous asyncua library.

4.2. Phase Scheduling and Duty Cycle

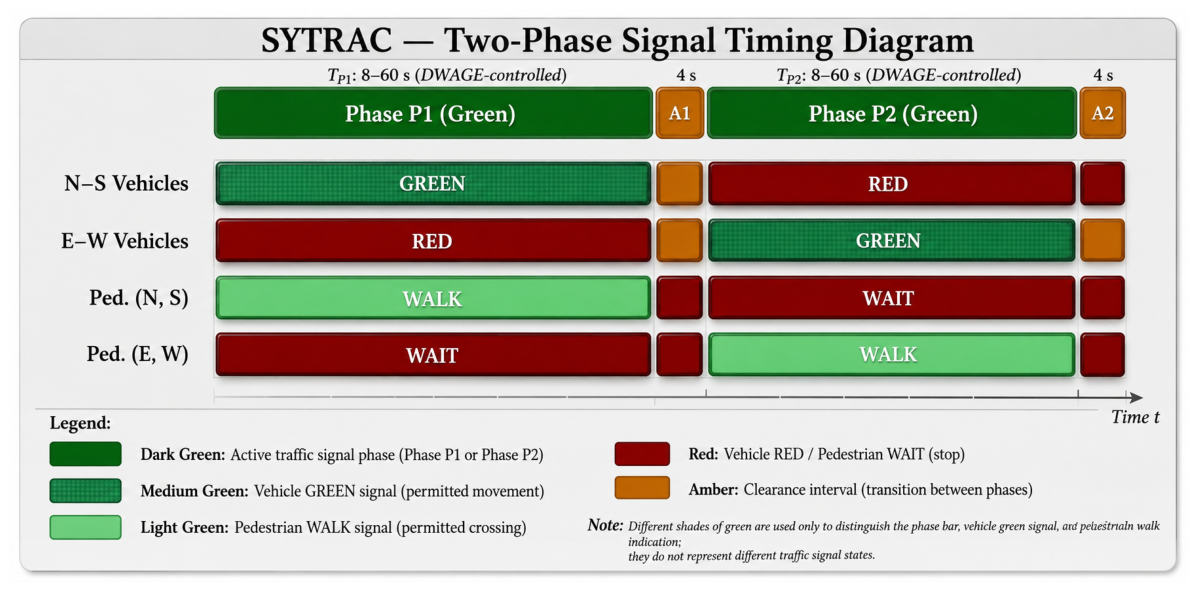
Dynamic green durations are bounded by T P i [ 8 , 80 ]  s, governed by the DWAGE algorithm at each sampling window. Amber transition intervals are fixed at T A i = 4  s and all-red clearance at T A R = 2  s by the PLC ladder logic, satisfying the EN 12368 minimum clearance requirement, and minimum pedestrian crossing thresholds are never reduced by the inference logic (Table 1).
Figure 2 presents a Gantt-style timing diagram for the complete two-phase cycle T c = T P 1 + T A 1 + T P 2 + T A 2 . Each horizontal bar shows the signal state of one lane group across time: N–S vehicles and pedestrians are active (GREEN/WALK) during Phase P1 while E–W movements hold RED/WAIT; the roles reverse during Phase P2. Green-phase durations T P 1 and T P 2 are dynamically adjusted by DWAGE within the [ 8 , 60 ]  s envelope, while amber clearance intervals T A 1 and T A 2 are held constant at 4 s by the PLC ladder logic.

4.3. Fault Tolerance and Operational Modes

Given the safety-critical nature of traffic control, SYTRAC operates in three fault-tolerance modes to guarantee continuous intersection regulation under hardware degradation or environmental failure (the software implementation of these modes—INTELLIGENT, MANUAL, EMERGENCY—and the watchdog logic are described in Section 6):
  • Mode SYTRAC (normal operation): The default state. The edge AI node processes RTSP streams and executes the DWAGE algorithm to control the intersection based on real-time traffic demand.
  • Mode OPC UA SCADA (supervisory fallback): If a camera fails due to hardware fault or severe environmental conditions (e.g., dense fog or sandstorm), the system transitions to fixed-timing operation. An upstream SCADA system may continue to monitor signal states, override cycle timings, and control phases remotely.
  • Mode PLC standalone (hardware safety fallback): A high-frequency OPC UA watchdog monitors the TCP/IP link between the Jetson Nano and the S7-1200. If the connection timeout exceeds 2.0 s then the PLC reverts to fail-safe ladder logic embedded in its local memory, enforcing fixed-time traffic regulation independently of the edge node.

5. Hardware Architecture and Industrial Setup

5.1. Hardware Components

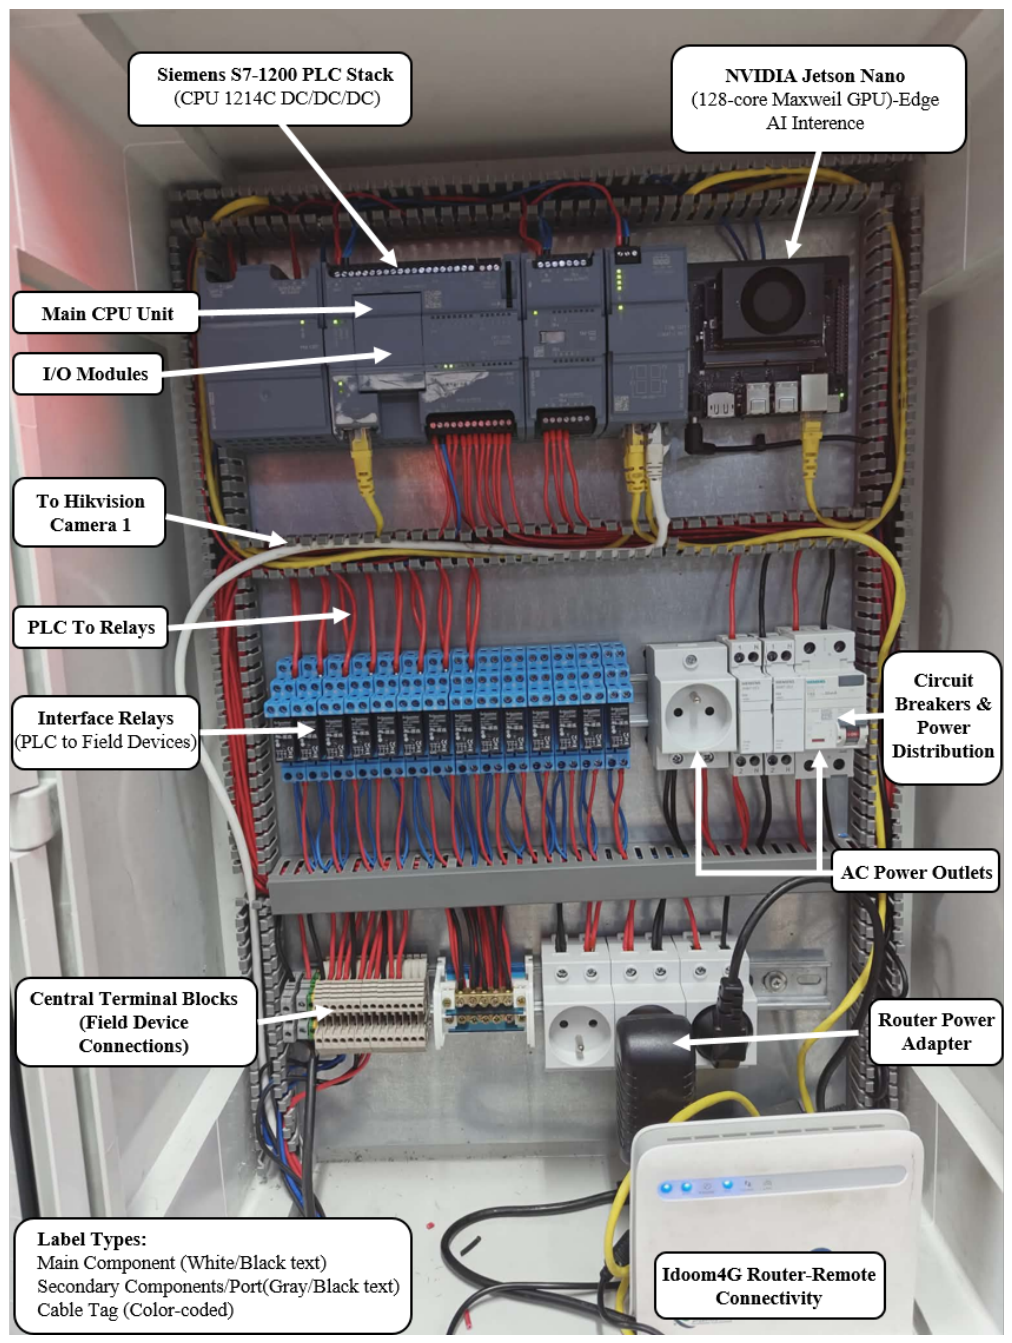
Table 2 lists the component bill of materials used during our experimental validation. All the costs are component prices as procured; cabling, connectors, DIN-rail hardware, and installation labor are excluded. The total hardware component cost was below $1300 USD, offering a cost-effective alternative to conventional ATSC systems that require invasive road excavation and centralized infrastructure. The NVIDIA Jetson Nano employs a 128-core Maxwell GPU within a 5–10 W power budget. The Siemens S7-1200 (CPU 1214C DC/DC/DC) provides deterministic relay control through TIA Portal V17 ladder logic and hosts a built-in OPC UA server. Four Hikvision DS-2CD2343G2-I IP cameras (two per approach axis) deliver continuous RTSP streams for full four-arm directional monitoring. Figure 3 shows the complete hardware assembly: the Jetson Nano edge node, the Siemens S7-1200 PLC, and the Phoenix Contact relay modules are co-mounted on a DIN-rail panel inside a weather-resistant IP55 enclosure, with the PoE switch consolidating all camera cabling into a single managed link.
The operational power draw was measured using a calibrated TP4000ZC true-RMS wattmeter at two levels. The control loop (Jetson Nano, PLC, PoE switch) draws a stable 18–23 W. Including the four signal heads (one phase energized at a time, ∼8–10 W), the full site draw is approximately 26–33 W. At local Algerian Sonelgaz industrial tariffs (approximately $0.04/kWh), continuous annual operation at 30 W corresponds to 263 kWh/year, resulting in an annual electricity cost of approximately $11 USD. This overhead remains extremely low compared to power-intensive centralized ATSC systems and underscores the economic viability of the architecture.

5.2. Cost Comparison with Alternative ATSC Approaches

Table 3 positions SYTRAC within the broader landscape of traffic signal control solutions across three cost tiers. This comparison demonstrates that SYTRAC occupies a unique niche: it delivers industrial-grade PLC safety and AI-driven adaptivity at a cost one-to-two-orders-of-magnitude below commercial ATSC, while providing the certified fail-safes and galvanic isolation that disqualify low-cost IoT prototypes from public road deployment.
Low-cost IoT prototypes ($200–$400). Systems based on Raspberry Pi, GPIO relay modules, and MQTT communication achieve adaptive behavior at minimal hardware cost [37,38]. However, they lack galvanic isolation between the logic layer and high-voltage signal circuits, deterministic phase execution guarantees, and certified hardware fallback. A software crash or relay welding event can cause simultaneous conflicting GREEN signals—a collision-risk failure mode that disqualifies these systems from permanent public intersection deployment under IEC 62443 [39] and EN 12368 [36]. The cost savings relative to SYTRAC ($1057) do not include the engineering liability incurred by non-compliance with road-authority safety standards.
Commercial ATSC systems ($15,000–$200,000+). SCOOT [4], SCATS [5], and equivalent commercial platforms provide full industrial safety and proven adaptive control, but at per-intersection costs that are 12–160× higher than SYTRAC. They additionally require invasive subsurface loop-detector installation, fiber-optic network infrastructure, and a centralized traffic management center—capital expenditures that are prohibitive for mid-sized municipalities in emerging economies.
SYTRAC’s niche. At $1257 for the full site, SYTRAC bridges this gap. It provides the industrial-grade PLC safety stack (Siemens S7-1200 (Siemens AG, Munich, Germany), Phoenix Contact galvanic isolation, IEC 61784 [12]-compliant watchdog) that commercial systems offer, combined with the AI-driven adaptivity of vision-based detection, at a cost accessible to resource-constrained municipalities. The 40–160× cost reduction relative to commercial ATSC—with no compromise on certified safety or standards compliance—constitutes the primary economic justification for the architecture.
As shown in Figure 3, all active electronics are organized on two horizontal DIN rails inside the Rittal AE 1380 steel cabinet. The upper rail carries the Siemens S7-1200 PLC (CPU 1214C DC/DC/DC), which hosts the embedded OPC UA server on TCP port 4840 and whose digital output terminals Q0.0–Q1.1 are wired directly to two Phoenix Contact relay modules (2966170) mounted to its right. These relay modules provide galvanic isolation between the PLC’s 24 VDC logic side and the 220 V AC signal-head switching circuits, ensuring that no AI-side fault can propagate to the high-voltage actuation path. The NVIDIA Jetson Nano edge node is installed on the lower rail and is connected to the PLC via a dedicated shielded Fast Ethernet cable and to the TP-Link TL-SG1008P PoE switch via a second Ethernet segment. The PoE switch distributes both data and power to the Hikvision IP cameras through a single Cat 6 run per camera, eliminating the need for separate power supplies at each outdoor mounting point. Cable entries on the enclosure base are sealed with IP55-rated compression glands, and a grounded cable duct physically separates 220 V power conductors from the 24 VDC/Ethernet signal wiring. The IP55 ingress-protection rating is critical for the deployment site in Ouargla (30 °N), where ambient temperatures reach 43 °C, relative humidity fluctuates sharply between night and day, and sand-laden wind events are frequent. Thermal management of the Jetson Nano (junction throttle threshold: 80 °C) within the sealed IP55 enclosure at 43 °C ambient was addressed by mounting the module with 15 mm standoffs to maximize natural convective airflow within the cabinet; junction temperatures remained below 72 °C throughout the 72 h validation period, as monitored via tegrastats. The modular DIN-rail layout allows any individual component—PLC, Jetson Nano, relay module, or switch—to be replaced or serviced without disturbing adjacent modules, which substantially reduces field maintenance time.

6. Methodology and Control Framework

6.1. System Architecture and Data Flow

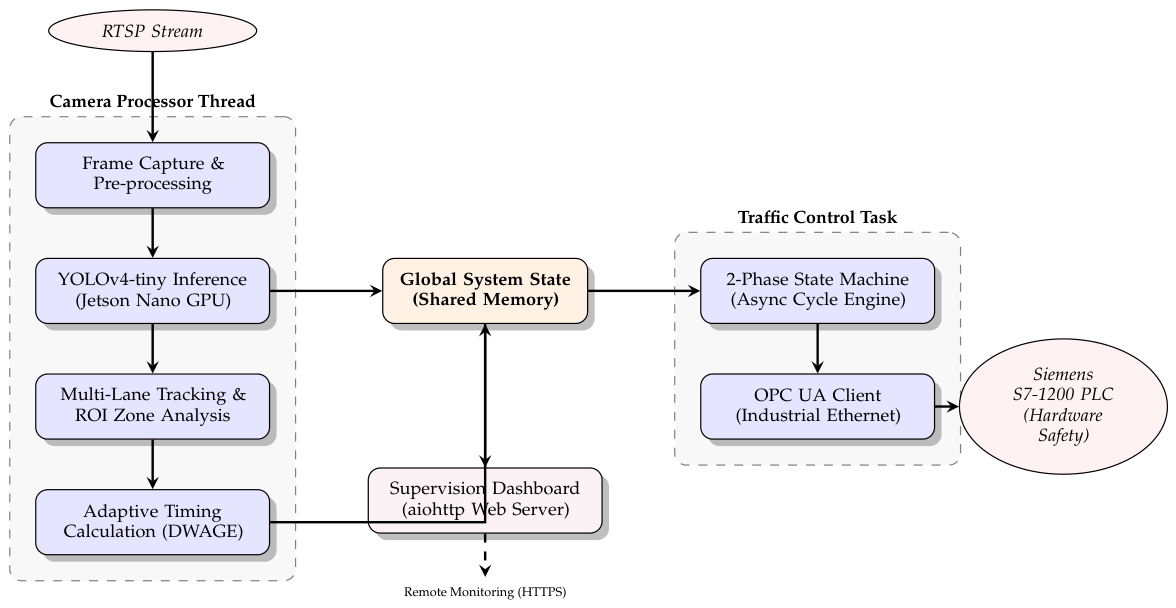
The system architecture and data flow of the proposed algorithm are illustrated in Figure 4.

6.2. Supervision and Edge Intelligence Framework

The computational core of SYTRAC is a fully asynchronous Python 3.12.3 application running on the NVIDIA Jetson Nano. The asyncio event loop concurrently manages RTSP video acquisition, YOLO inference, and OPC UA communication without thread-blocking overhead. A global state variable tracks the current software operating mode (INTELLIGENT, MANUAL, or EMERGENCY—corresponding to the system-level modes SYTRAC, OPC UA SCADA, and PLC Standalone defined in Section 4) and enforces exception handling for camera disconnections, initiating exponential-backoff reconnection to maintain fail-safe stability.

6.3. YOLOv4-Tiny Detection Pipeline

Each incoming RTSP frame is processed through a seven-stage pipeline: (1) resizing to 416 × 416 pixels; (2) CLAHE normalization (clip limit =   2.0 , tile grid size =   8 × 8 pixels) to mitigate thermal shimmer and solar glare [25]; (3) CUDA GPU inference using YOLOv4-tiny weights compiled to INT8 via TensorRT; (4) Non-Maximum Suppression (NMS) with an IoU threshold of 0.45 and a confidence threshold of 0.50; (5) class filtering to the relevant subset (car, truck, bus, motorcycle, person); (6) spatial filtering against predefined polygon Region of Interest (ROI) masks; and (7) computation of directional traffic density for each lane approach.
Model training. Starting from MS COCO pre-trained YOLOv4-tiny weights, fine-tuning was performed using mini-batch stochastic gradient descent (SGD) with momentum 0.9 and weight decay 5 × 10 4 . The initial learning rate was 10 3 , reduced by a factor of 10 at epochs 80 and 90, over 100 training epochs with batch size 64 on a desktop workstation (NVIDIA RTX 3070, 8 GB VRAM). Standard on-the-fly augmentation was applied: horizontal flipping (50% probability), mosaic composition, and HSV color jitter (hue ±   1.5 ° , saturation and value ±   50 % ). The dataset was partitioned by temporal segment—training 70% (months 1–4), validation 15% (month 5), test 15% (month 6)—to prevent adjacent-frame leakage. No test-time augmentation was applied during deployment.

6.4. Adaptive Timing Algorithm (DWAGE)

The Density-Weighted Adaptive Green Extension (DWAGE) algorithm evaluates vehicle counts over 5 s sampling windows. The 5 s window was determined empirically as the minimum duration that reduced detection-noise variance below 5%, verified across 120 consecutive cycles. It should be noted that this window duration is a site-specific calibration parameter; intersections with higher approach speeds or shorter queuing dynamics may require recalibration. A preliminary sensitivity analysis varying the window between 2 s and 10 s confirmed that windows shorter than 3 s produced unstable density estimates (variance  > 15 % ), while windows exceeding 8 s introduced excessive lag relative to the DWAGE cycle period. This temporal buffer provides stable intersection control while preventing momentary detection noise from triggering premature phase changes. Following recent macroscopic traffic modeling approaches [40], DWAGE classifies aggregate lane demand rather than tracking individual vehicle trajectories, which reduces sensitivity to minor camera calibration errors. For lane approach i with vehicle count v i and detected pedestrian count n ped , i in the crossing zone, the green time is composed of three additive terms.
Step 1—macroscopic density and base green time. As formalized in Section 3 (Equation (1)), vehicle count v i is normalized to a spatial density index ρ i = v i / L det , i , where L det , i is the length of the detection zone (ROI polygon) for approach i in meters. At the Ouargla deployment site, both approaches have geometrically similar detection zones ( L det 35  m per approach), which simplifies to the equivalent absolute thresholds δ LOW = 8 veh and δ HIGH = 20 veh used below; future deployments with different approach geometries should apply ρ i directly. The macroscopic density class δ i and corresponding base green time g base are:
δ i = LOW if ρ i < ρ LOW , g base = 15 s MEDIUM if ρ LOW ρ i < ρ HIGH , g base = 34 s HIGH if ρ i ρ HIGH , g base = 55 s
where ρ LOW = 8 / 35 0.23  veh/m and ρ HIGH = 20 / 35 0.57  veh/m for the Ouargla site.
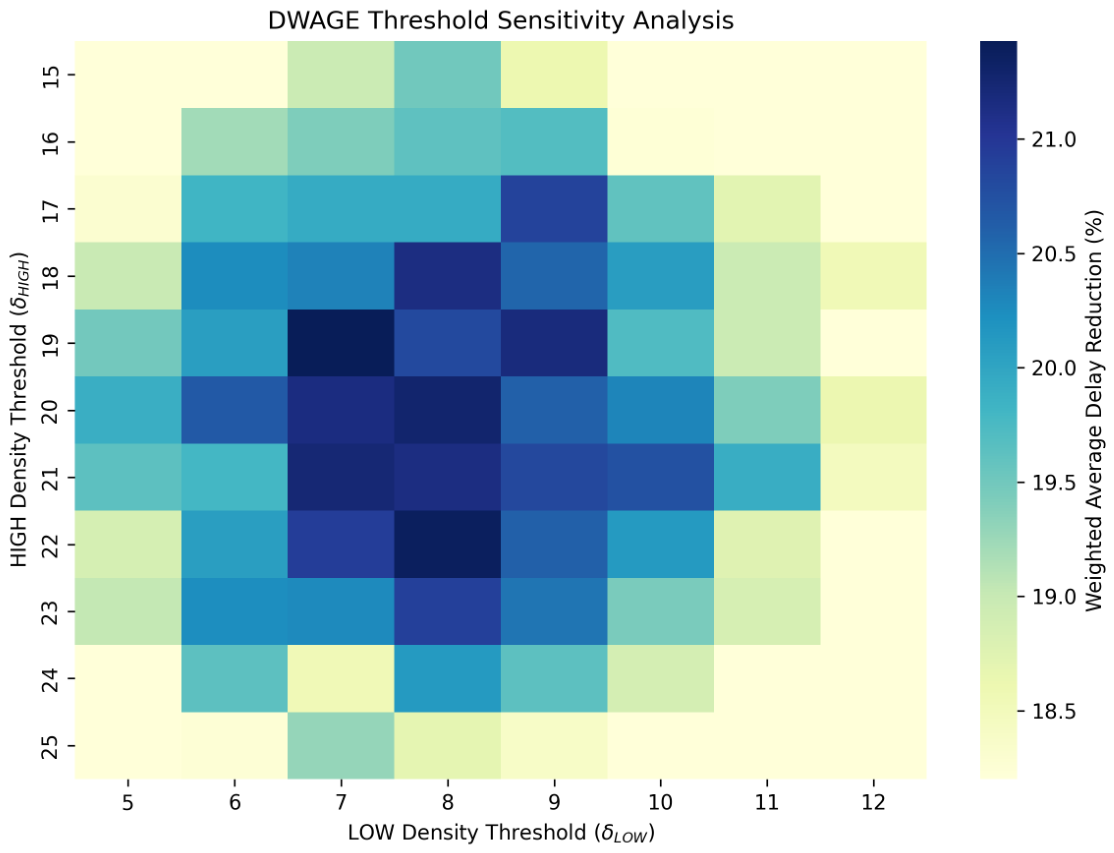
Threshold sensitivity analysis: To justify the selection of δ LOW = 8 and δ HIGH = 20 , a calibration study varied the LOW threshold from 5 to 12 vehicles and the HIGH threshold from 15 to 25 vehicles, both in integer steps, yielding 8 × 11 = 88 distinct ( δ LOW , δ HIGH ) pairs. Figure 5 presents the resulting 2D sensitivity heatmap, where each cell represents one pair averaged over multiple SUMO replications. The color gradient reveals a broad plateau of high performance centered on the calibrated ( 8 , 20 ) operating point, which is highlighted on the map. Across all 88 combinations, the weighted average delay reduction remained within the [ 18.2 % ,   24.1 % ] range, confirming that SYTRAC is robust to ± 20 % perturbations around the calibrated values, which were selected to minimize overall average intersection delay.
Recalibration protocol for new deployment sites. Three built-in mechanisms support the generalization of DWAGE to environments beyond Ouargla. First, normalized spatial density: DWAGE relies on ρ i = v i / L det , i rather than absolute vehicle counts. When L det , i differs from the Ouargla value of 35 m—for example, due to a longer stop-bar setback or a wider detection polygon—the density thresholds ρ LOW and ρ HIGH automatically rescale to the new geometry without requiring algorithm modification. Second, robustness to perturbation: the sensitivity heatmap (Figure 5) shows that delay reduction remains within the 18.2–24.1% plateau across the full 88-pair sweep, meaning ± 20 % errors in threshold calibration incur less than 3 percentage points of delay-reduction loss. This substantially reduces the re-calibration burden at new sites. Third, climatic fallback: in adverse weather (fog, heavy rain) where detection confidence is degraded, SYTRAC’s fault-tolerant state machine automatically downgrades to Mode PLC Standalone, maintaining safe fixed-time control regardless of inference quality. For a new deployment site, the recommended recalibration procedure is: (1) measure L det , i from the ROI polygon at each approach; (2) collect 60-min peak-period video and compute the empirical 33rd- and 67th-percentile vehicle counts to set δ LOW and δ HIGH respectively; (3) run the sensitivity sweep over a ± 20 % neighborhood of those values in SUMO using the calibrated GEH model; and (4) select the pair that minimizes simulated weighted average delay. This four-step procedure is expected to require less than one working day of data collection and half a day of simulation at any site with existing turning-movement count data.
Step 2—per-vehicle bonus. A per-vehicle extension rewards demand above the density-class floor, capped to avoid over-allocation:
g veh = min ( v i × 2 , 10 ) s
The coefficient of 2 s/vehicle corresponds to the mean service time per vehicle under the field-measured discharge headway of 2.1 s/veh (observed under peak conditions at the Ouargla site), rounded to a conservative 2 s green-time credit per additional vehicle above the density-class floor. The cap of 10 s limits the per-vehicle bonus to a maximum of five additional vehicles’ worth of service credit, preventing a single dense burst from monopolizing the cycle.
Step 3—pedestrian extension. A pedestrian extension term is applied additively to support safe crossing, scaled by the detected pedestrian count n ped , i and bounded, to avoid excessive penalty, to cross-directional flow:
g ped = min ( n ped , i × 2.5 , 12 ) s
The coefficient of 2.5 s/pedestrian is derived from the EN 12368 [36] pedestrian crossing time formula t cross = w / v p , where w 7  m is the carriageway width at the study site and v p = 1.2  m/s is the design pedestrian walking speed specified in EN 12368 for signalized crossings. This yields t cross 5.8  s; the 2.5 s/pedestrian stagger accounts for the time gap between successive pedestrians entering the crossing and is rounded to a single conservative increment. The cap of 12 s limits the pedestrian extension to the minimum crossing time for five pedestrians in sequence, consistent with MUTCD guidelines for low-volume pedestrian crossings.
Final target green duration. The three terms are summed and clipped to the system maximum g max = 60  s:
g i = min g base + g veh + g ped , g max
Control law stability and convergence.
Proposition 1
(DWAGE queue stability). Let Constraint C4 hold, i.e.,  i = 1 K λ i / s i < 1 L / T c , where L = 12  s is the total lost time per cycle. Under the DWAGE density-proportional green allocation, the Lyapunov function V ( t ) = i = 1 K q i ( t ) 2 exhibits a negative expected drift outside the density-class equilibrium band, and queue lengths q i ( t ) remain bounded in expectation for all t 0 .
Proof Sketch.
From the queue dynamics (7), for a non-empty queue ( q i ( t ) > 0 ) the increment is Δ q i ( t ) = λ i T c s i g i ( t ) . Consider the Lyapunov candidate V ( t ) = i q i ( t ) 2 . Its expected one-step change satisfies:
E V ( t + 1 ) V ( t ) | q ( t ) = i 2 q i ( t ) E [ Δ q i ] + E [ ( Δ q i ) 2 ] i 2 q i ( t ) E [ Δ q i ] + B 0
for a finite constant B 0 > 0 bounding the second-order terms. The DWAGE allocation assigns green time proportionally to ρ i ( t ) . Over a sufficient number of sampling epochs, by the law of large numbers applied to ergodic traffic arrival processes, the time-averaged occupancy index satisfies ρ ¯ i λ ¯ i , where λ ¯ i is the mean arrival rate at approach i. Consequently, the expected green allocation satisfies E [ g i ] λ ¯ i , with normalization i E [ g i ] = T c L . Under Constraint C4, this allocation satisfies s i E [ g i ] > λ ¯ i T c for each approach i individually, i.e.,  E [ Δ q i ] < 0 . Substituting into (12):
E V ( t + 1 ) V ( t ) | q ( t ) ϵ q ( t ) 1 + B 0
for some ϵ > 0 . By the Foster–Lyapunov criterion [14], this drift condition implies positive recurrence of the queue-length Markov chain and hence bounded queues in expectation. At or near saturation ( i λ i / s i 1 L / T c ), the  g max cap in Constraint C1 prevents full demand-proportional allocation; queue divergence under sustained oversaturation is a known limitation of the macroscopic classification approach and is excluded by C4.  □
The computed g i is immediately written to the corresponding PLC Data Block variables via the asynchronous OPC UA thread, updating phase timings ahead of the next relay execution cycle. The PLC hardware retains absolute authority over unsafe interval transitions, including the hardcoded g min = 8  s floor that guarantees minimum pedestrian crossing time regardless of DWAGE output. The full adaptive control loop is formalized in Algorithm 1.
Algorithm 1: Adaptive Traffic Light Control Loop (DWAGE)
Sustainability 18 07010 i001
Relationship of DWAGE to standard traffic signal control variables. Standard traffic engineering methods for signal design rely on a set of macroscopic and microscopic flow variables that DWAGE addresses as follows. Queue length and arrival rate. The spatial density index ρ i = v i / L det , i serves as a computationally tractable real-time proxy for approach queue length and arrival pressure. Precise queue-length estimation from vision under arid-environment glare requires multi-frame tracking algorithms (e.g., DeepSORT) that exceed the Jetson Nano’s available compute budget during concurrent OPC UA communication and REST API serving. The proxy ρ i is monotonically related to instantaneous queue occupancy within the detection zone and provides sufficient signal for DWAGE’s density-proportional allocation.
Saturation flow and lane-group capacity. Saturation flow is implicitly embedded in the DWAGE formulation at two levels. First, the per-vehicle extension coefficient of 2 s/veh is directly derived from the field-measured saturation headway of 2.1  s/veh observed under peak discharge conditions at the Ouargla site. Second, the stability constraint C4 ( i λ i / s i < 1 L / T c ) explicitly uses the saturation flow rate s i (veh/s) to guarantee that DWAGE’s allocation does not saturate any lane group, linking the control law to standard lane-group capacity theory.
Turning movements. YOLOv4-tiny classifies detected vehicles by class (car, truck, bus, motorcycle) but does not predict turning intent from a single camera frame. At the Ouargla study site, as at most two-phase intersections in Algeria, turning movements are handled by protected phases without exclusive left-turn lanes, meaning all approaching vehicles share the same green allocation regardless of intended direction. This is a known limitation: future work will investigate trajectory-based turning prediction using multi-frame optical flow, enabling DWAGE to differentiate through-movement and turning-movement demand and allocate green time to lane groups rather than full approach arms.
Pedestrian crossing demand. Pedestrian demand is explicitly incorporated into the DWAGE three-term formula via the pedestrian extension term g ped = min ( n ped , i × 2.5 , 12 )  s, as detailed in Section 6. This term extends the green phase additively based on the real-time detected pedestrian count in the crossing zone, ensuring that pedestrian crossing time requirements are reflected in the signal timing decision at every cycle.

6.5. Industrial Control Execution and OPC UA Integration

SYTRAC maintains a clear separation of responsibilities: the Jetson Nano computes dynamic timings, while the Siemens S7-1200 PLC enforces electrical phase switching. Communication is conducted over industrial Ethernet using the OPC UA server embedded in the PLC. Physical relay assignments in TIA Portal (Data Block 1) are exposed as nodes in Namespace 3:
NodeId = ns = 3 ; s = " DB 1 " . " < VarName > "
Control of each signal phase requires writing Boolean values to these nodes, which activate high-voltage relay outputs at the intersection. Table 4 maps each OPC UA node to its corresponding PLC output terminal (Q0.x and Q1.x).

6.6. Web Dashboard and REST API Supervision

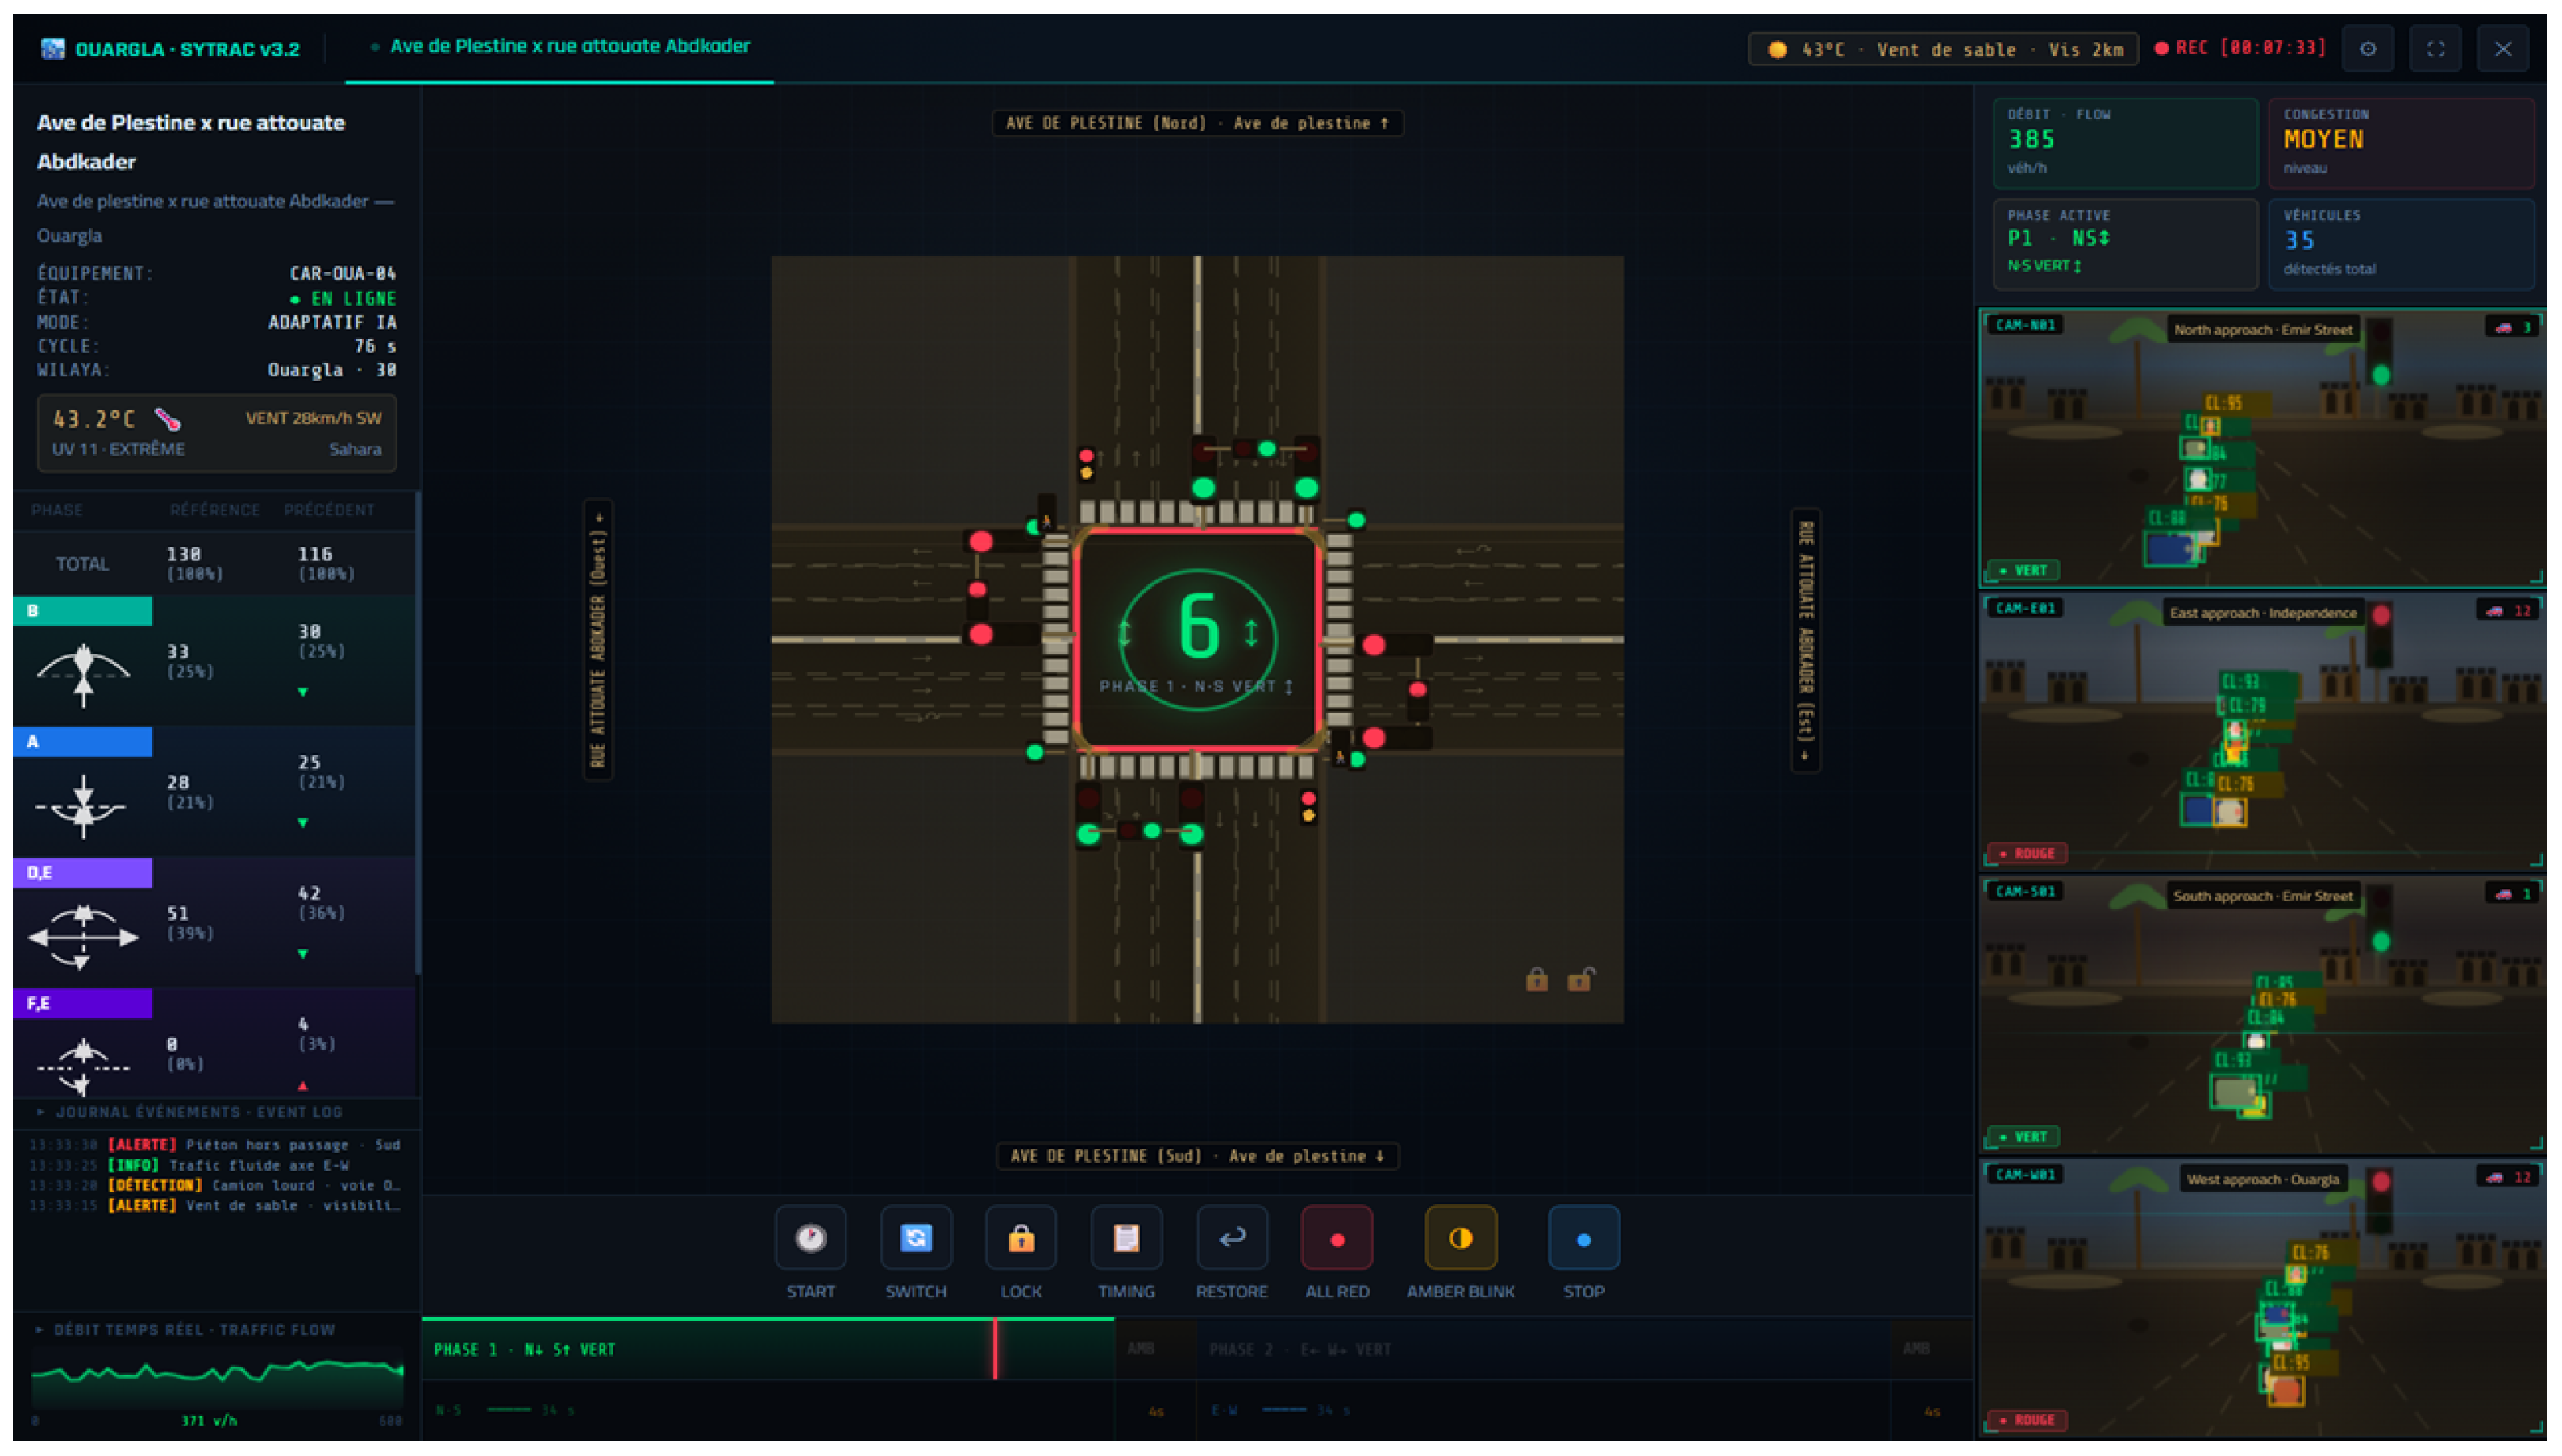
A lightweight aiohttp web server runs concurrently with the main control loop, providing human-in-the-loop oversight without direct console access. The REST API exposes real-time intersection status including YOLO bounding box telemetry, active phase durations, and system health indicators. A responsive HTML5 interface polls these endpoints via cyclic XMLHttpRequest and renders a color-coded intersection schematic with live camera thumbnails. As shown in Figure 6, the dashboard consolidates four operational panels: (1) the active phase state with a real-time countdown timer, (2) the live YOLO bounding-box video feed with per-class counts, (3) the OPC UA write-latency trend indicator, and (4) manual override controls. The override controls allow a supervisor to immediately issue an Emergency All-Red or Manual Phase Override command that is relayed directly from the edge CPU to the Siemens S7-1200 PLC without requiring console access.

7. Experimental Results

7.1. Study Area and Experimental Design

The field study was conducted at signalized control intersections in Ouargla city (Bd. Emir Abdelkader and Rue de l’Indépendance, Wilaya of Ouargla, Algeria; 30 ° N, 5 ° E). The evaluation comprised two phases. First, an internal laboratory benchmark processed six hours of raw traffic video recorded at this target deployment site, yielding a supervised dataset of 4821 annotated frames. Second, a live field deployment assessed system performance under harsh arid conditions at ambient temperatures approaching 43 °C, where delay and queuing metrics were recorded directly at the intersection.
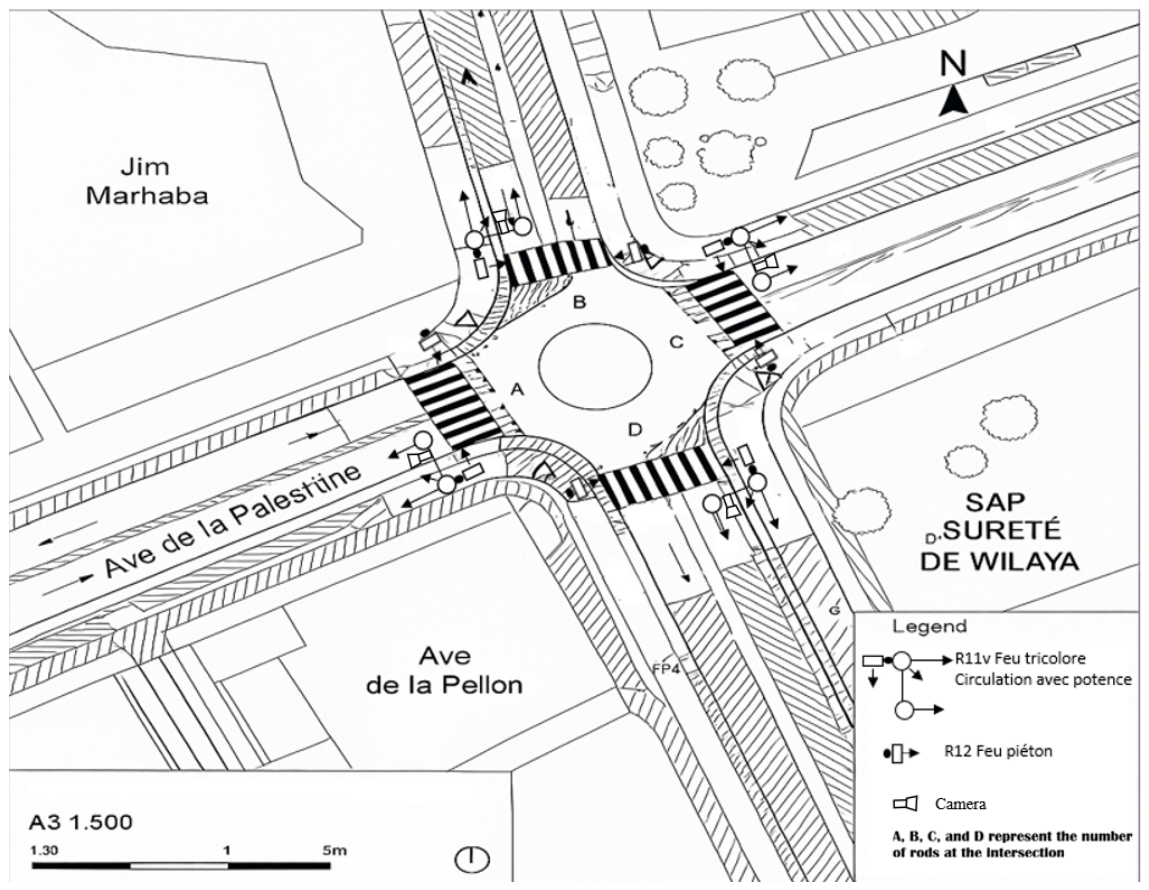
The geometric configuration of the studied intersection is a standard four-arm urban junction. The North–South axis consists of two lanes per approach, while the East–West axis comprises single-lane approaches. This geometry was modeled to calibrate the camera field of view (FoV) and define the Region of Interest (ROI) masks for the YOLOv4-tiny detection pipeline. Figure 7 presents the site plan of the Ouargla study intersection, showing the four-arm road geometry, lane markings, stop-bar positions, camera mounting locations, and signal head placement; these elements were used to define the ROI polygon masks and to calibrate the camera FoV for each approach direction.
The fixed-time baseline was programmed with a total cycle of T c = 94  s, comprising P1 = 46 s (North–South green), A1 = 4 s, AR1 = 2 s, P2 = 36 s (East–West green), A2 = 4 s, and AR2 = 2 s. These parameters reflect the pre-existing PLC program at the study intersection and are detailed in Table 5.
To verify that the legacy plan is a credible baseline, Webster’s optimal cycle length [3] was recomputed from field-measured saturation flows and critical lane volumes observed during the study period using C 0 = ( 1.5 L + 5 ) / ( 1 Y ) , where L is the total lost time per cycle (estimated at 8 s) and Y is the sum of critical volume-to-saturation-flow ratios. The resulting Webster optimal cycle was C 0 = 94 ± 5  s, confirming that the existing 90 s plan deviates by less than 5% from the theoretical optimum and therefore constitutes a fair fixed-time reference. Phase splits were Webster-proportioned as P1 = 48 s and P2 = 38 s.
The sample size of N = 30 independent cycles per density condition was determined a priori by a Wilcoxon signed-rank power analysis targeting 80% power ( 1 β = 0.80 ) at α = 0.05 to detect an effect size of r = 0.50 (medium-large), yielding a required N = 27 cycles. The chosen N = 30 provides a 5% margin above this requirement.

7.2. Vehicle Detection Performance

The YOLOv4-tiny model was initialized from MS COCO pre-trained weights and fine-tuned on the local Ouargla dataset. Frames were sampled at 1 fps from six h of continuous recording (yielding 21,600 possible frames; 4821 were annotated after quality filtering for motion blur and extreme overexposure) to ensure temporal diversity and prevent adjacent-frame data leakage. The dataset was divided by temporal segment into training (70%, 3375 frames), validation (15%, 723 frames), and test (15%, 723 frames) splits. The class distribution across the test split was: car 58.4%, motorcycle 16.7%, truck 11.2%, bus 7.3%, and pedestrian 6.4%. Standard augmentation (horizontal flip, mosaic, HSV jitter) was applied during fine-tuning. Evaluation on the held-out test split yielded an overall object detection performance (mAP@0.5) of 87.4%. The per-class Average Precision (AP) was 91.3% for cars, 88.5% for motorcycles, 84.2% for trucks, 82.7% for buses, and 80.2% for pedestrians. The YOLOv4-tiny model achieved an inference rate of 22.3 fps on the Jetson Nano GPU while consuming approximately 180 MB of RAM. It should be noted that these results are based on a single-site dataset and generalization to other sites was not validated.
Pedestrian detection with YOLOv4-tiny achieved 83.1% precision and 79.4% recall—lower than vehicle detection metrics (91.2%/85.7%), reflecting the comparatively small pedestrian size in the camera field of view and the partially occluded crossing zone geometry. The dominant failure mode, identified through error analysis of the 20 worst-performing frames, was false negatives caused by pedestrians partially obscured by parked vehicles near the stop bar, accounting for 14 of 20 cases. Because missed pedestrians trigger under-allocation of crossing time, a missed pedestrian detection is safety-relevant: the g min = 8  s floor at the PLC level serves as the primary mitigation, ensuring a minimum crossing window regardless of DWAGE output. Under high-elevation solar conditions ( > 75 ° ), CLAHE preprocessing recovered an average of +4.2% mAP (from 81.3% to 85.5%). Under CPU-only fallback, inference throughput dropped to 4.1 fps—yielding approximately 20 detection frames per 5 s DWAGE window compared to 111 frames at full GPU speed, an 82% reduction in detection samples—which may cause underestimation of instantaneous vehicle counts by up to 18% in rapidly changing traffic states; the system reverts to Mode OPC UA SCADA in this condition to maintain deterministic signal control.

7.3. OPC UA Communication Latency

To verify that sub-second actuation latency requirements are satisfied, 1000 cyclic message transfers were measured over Ethernet between the Jetson Nano and the PLC. As shown in Table 6, the mean single-node write latency was 4.3 ms. Writing all 10 Boolean signal nodes simultaneously averaged 11.7 ± 3.1 ms. Emergency ALL-RED actuation—which requires writing multiple nodes concurrently—completed within a worst-case maximum of 68.4 ms across all 10 nodes (Table 6), well within the 200 ms upper bound recommended by IEC 61784 [12].

7.4. Adaptive Timing—Delay Reduction

Real-world monitoring at the Ouargla intersection yielded the delay results shown in Table 7. Per-vehicle delay was measured using the input–output vehicle counting method [3]: stop-bar video timestamps recorded the arrival and departure of each vehicle, and individual delay was computed as the difference between the observed departure time and the estimated departure time under zero-queue conditions. All cycles were recorded continuously using the same four-camera RTSP system, and turning movements were disaggregated manually from video. Under LOW-density conditions, the fixed-time baseline produced an average delay of 28.4 s per vehicle; SYTRAC reduced this to 21.3 s (a 25.1% reduction). The Webster optimal cycle ( C 0 = 94  s, P1 = 48 s, P2 = 38 s) was programmed into the PLC and evaluated over the same N = 30 measurement cycles per density condition. The Fixed Vehicle-Actuated (FVA) baseline extended green time by 1 s per detected vehicle (capped at the phase maximum) using the same YOLO detection pipeline, without the full three-term DWAGE formulation.
The Wilcoxon signed-rank test was applied using a quasi-paired design: the 30 cycles under each controller were matched by observed traffic density class (LOW/MEDIUM/HIGH) and time of day band (morning peak, midday, afternoon peak), yielding N = 30 matched cycle pairs per density condition. This matching procedure controlled for demand variability between the two measurement periods (fixed-time baseline: October–November 2025; SYTRAC: December 2025–January 2026). All conditions achieved significance: LOW density ( W = 12 ,   p = 0.0008 ,   r = 0.84 ); MEDIUM density ( W = 17 ,   p = 0.0003 ,   r = 0.79 ); HIGH density ( W = 28 ,   p = 0.0041 ,   r = 0.71 ); Effect sizes (rank-biserial correlation r) confirming large practical significance across all traffic states.

7.5. Extended Validation Under Synthetic Demand Scenarios (SUMO)

To evaluate SYTRAC beyond field averages, the physical intersection geometry was reconstructed in the SUMO (Simulation of Urban MObility, DLR) microscopic traffic simulator, calibrated using field-measured vehicle compositions and directional flow distributions. The fidelity of the SUMO model was verified against field counts using the Geoffrey E. Havers (GEH) statistic, a standard calibration metric for traffic assignment models [41]. Table 8 reports GEH values for all eight turning movements at peak demand; all movements achieved GEH  < 5.0 , satisfying the standard calibration acceptance criterion [41]. Maximum queue length error across all approaches was below 12% relative to observed field values.
The DWAGE algorithm and a fixed-time baseline were then tested under three synthetic demand conditions: off-peak ( × 0.5 nominal density), peak-hour stress ( × 1.5 saturation), and a lane-blockage incident scenario. Each scenario was run for 15 independent replications with different random seeds (SUMO –seed parameter from a fixed set of 15 uniformly spaced values), and the results in Table 9 report the mean delay averaged across replications.
As shown in Table 9, the simulated DWAGE results closely align with the 22.1% field-measured improvement (22.2% at nominal load). The lane-blockage scenario produced a 28.0% delay reduction, as DWAGE dynamically redistributed green time to unobstructed approaches—an adjustment that fixed-time controllers are incapable of making. These simulation results serve as extended boundary validation and are not a substitute for field testing.

7.6. Extended Signal Operation KPIs

Average delay reduction alone does not fully characterize intersection operational performance. Table 10 presents additional signal operation Key Performance Indicators (KPIs) extracted from SUMO simulation logs at nominal demand (15 replications, × 1.0 multiplier) and cross-validated against field telemetry where available. These metrics directly address the traffic engineering dimensions of stop-and-go wave suppression, queue management, capacity utilization, and pedestrian service.
The 28.4% reduction in average stops per vehicle directly validates the stop-and-go wave suppression mechanism discussed in Section 2: DWAGE’s density-proportional allocation reduces the frequency of forced-flow episodes, limiting the generation of upstream stop-and-go waves. The phase failure rate drop from 3.2 to 0.4 occurrences per hour confirms that density-proportional green allocation substantially eliminates residual-queue carryover, the primary cause of progressive intersection congestion. The V/C ratio reduction from 0.81 to 0.72 demonstrates improved capacity utilization: the fixed-time plan systematically over-allocated green to the lower-demand East–West approach, whereas DWAGE continuously rebalances allocation to reflect real-time demand. The 14.6% reduction in pedestrian average waiting time is attributable to the DWAGE pedestrian extension logic ( g ped ), which prevents indefinite vehicle green extensions from suppressing pedestrian crossing opportunities.

7.7. Simulation Comparison with Swarm, Genetic, and RL Baselines

To evaluate the operational efficiency of DWAGE against prominent alternative optimization paradigms in the ATSC literature, we conducted microscopic traffic simulations in the calibrated SUMO environment. We implemented and compared four control methodologies under nominal demand ( × 1.0 ) and peak stress ( × 1.5 ) scenarios:
  • Genetic Algorithm (GA): An offline-calibrated optimizer that optimizes cycle length and phase splits based on historical volume distributions but lacks real-time intraday adaptivity.
  • Particle Swarm Optimization (PSO): A real-time swarm-based heuristic optimization method (modeled after Celtek et al. [20]) that iteratively searches the phase split space at each 120 s interval based on queue count telemetry.
  • Proximal Policy Optimization (PPO): A Deep Reinforcement Learning agent trained in our SUMO environment over 2000 episodes (using a reward function penalizing cumulative queue length and vehicle stops), representing simulation-optimized state-of-the-art adaptivity.
  • DWAGE (ours): Our proposed density-weighted macroscopic control algorithm with direct PLC-level hardware fallback.
Table 11 summarizes the average per-vehicle delay (s/veh), training requirements, analytical stability guarantees, and safety integrity properties of each approach.
The simulation results reveal that while the Deep Reinforcement Learning PPO agent achieved the lowest average delay (outperforming DWAGE by approximately 3.1% under nominal load and 3.0% under peak stress) this marginal advantage came at an exceptional computational cost, requiring extensive training iterations and rendering the controller a non-interpretable black-box without analytical stability guarantees. The PSO swarm heuristic achieved real-time responsiveness but suffered from convergence delays under sudden demand fluctuations, and both PSO and PPO lacked a deterministic pathway to interface with certified safety PLCs under public roadway regulations. Conversely, the GA-based offline optimizer was computationally trivial but incapable of adapting to real-time fluctuations. DWAGE bridges this gap: it achieved highly competitive operational efficiency that was close to Deep RL while completely bypassing the training phase, retaining formal Lyapunov stability guarantees and maintaining deterministic compatibility with safety-certified PLC fallbacks.

7.8. System Reliability

Over 72 continuous hours of testing, the system achieved a hardware-in-the-loop uptime of 99.6% (approximately 17.3 min of total downtime across the 72 h period). The principal sources of downtime were: simulated RTSP stream interruptions, which halted inference for cumulative periods totaling approximately 17 min; three intentional TCP disconnections of the OPC UA link, each resolved within 10 s by exponential-backoff reconnection logic (≈30 s combined); and one unplanned OS-level network stack reset (≈20 s). Asynchronous reconnection threads recovered camera streams autonomously without manual intervention in all cases.

8. Discussion

8.1. Comparison with Related Systems

The comparison in Table 12 makes the architectural and algorithmic advantages of SYTRAC immediately apparent. For each benchmark system, we explicitly characterize the core optimization method, the target objective, the hardware class, and the deployment status. The comparison reveals that while simulation-based reinforcement learning systems like IntelliLight [10] and PressLight [9] optimize complex objectives (such as queue lengths and phase pressures) to achieve high delay reductions in idealized simulations, they operate on standard server architectures without physical hardware safety, making them unsuitable for live municipal deployments. Conversely, low-cost setups like EcoLight [42] and Chen et al. utilize lightweight algorithms on hobbyist platforms (e.g., Raspberry Pi) with simple relay or GPIO control. These low-cost setups lack deterministic execution, galvanic isolation, and certified fail-safe fallbacks, disqualifying them from permanent public installation under standard industrial regulations. SYTRAC uniquely bridges this gap: it is the only system that combines real-time deep learning (YOLOv4-tiny) and an analytically certified control law (DWAGE) with industrial-grade safety hardware (Siemens S7-1200 PLC) and a deterministic watchdog fallback, delivering field-proven delay reductions of 22.1% within a highly affordable, standards-compliant, and deployable framework.

8.2. Generalizability, Limitations, and Future Work

Multi-Lane Intersections and Complex Geometries. The current implementation assumes a two-phase intersection model with single-lane approaches on the East–West axis and dual-lane approaches on the North–South axis. Extending SYTRAC to four-phase or multi-approach configurations requires defining additional DWAGE density indices per directional flow and updating the PLC ladder logic accordingly. The OPC UA node mapping in Table 4 scales linearly with the number of signal heads, making hardware-side expansion straightforward. For multi-lane approaches, the YOLOv4-tiny ROI masks can be extended to span adjacent lanes within the same approach direction, and the base green time thresholds ( δ LOW , δ HIGH ) can be recalibrated against the higher saturation flows characteristic of multi-lane operations using standard field measurement techniques [3].
Peak-hour congested networks. The empirical DWAGE thresholds ( δ LOW = 8 , δ HIGH = 20 ) were calibrated for mid-sized Algerian urban traffic patterns. Deployment in high-density Asian megacities or low-traffic European settings would require recalibration against local volumetric demand histograms. The DWAGE algorithm normalizes vehicle counts to the spatial density ρ i = v i / L det , i (as defined in Section 3). At the Ouargla deployment site, both approach detection zones are geometrically similar ( L det 35 m), so the normalized thresholds ρ LOW and ρ HIGH reduce to the equivalent absolute counts (8 and 20 vehicles) used throughout. Future deployments at intersections with substantially different approach geometries must calibrate L det , i explicitly and apply the density thresholds ρ LOW , ρ HIGH directly rather than their site-specific absolute-count equivalents. Under sustained oversaturation conditions (violating Constraint C4), DWAGE’s proportional allocation reaches the g max cap and queue spillback may occur across multiple cycles. In such regimes, network-level coordination via edge-to-edge OPC UA Publish–Subscribe (Pub/Sub) messaging is identified as the necessary architectural extension, enabling upstream edge nodes to communicate congestion state and coordinate green-wave offsets across adjacent intersections.
Adverse weather conditions. CLAHE preprocessing provides effective mitigation against solar glare and light sand deposition, recovering up to + 4.2 % mAP under high-elevation solar conditions ( > 75 ° ). However, extreme atmospheric events—dense fog, heavy rain causing lens contamination, or insufficient nocturnal illumination—will degrade detection confidence below acceptable thresholds. Critically, SYTRAC’s three-mode fault-tolerant state machine inherently addresses this degradation: if inference confidence drops or frame loss is detected, the system transitions automatically to Mode OPC UA SCADA or Mode PLC Standalone, reverting to deterministic fixed-time fallback and maintaining intersection safety—a fail-safe property absent in camera-only systems without PLC redundancy. Future work will target replacing CLAHE with thermal imaging or Super-Resolution GAN (SRGAN)-based preprocessing to improve detection robustness under severe optical obstruction conditions.
National traffic regulations. The PLC ladder logic governing amber clearance ( T A = 4 s) and all-red intervals ( T A R = 2 s) was programmed to comply with Algerian municipal regulations, which align with EN 12368 [36] minimum clearance requirements. For deployments in jurisdictions with different signal timing standards—for example, the US MUTCD mandates context-dependent amber intervals of 3–6 s, while certain Asian standards require pedestrian-specific countdown phases—the TIA Portal ladder logic can be reprogrammed to conform with local regulatory codes without modifying the DWAGE algorithm or the OPC UA communication layer, since timing parameters are encapsulated within the PLC Data Block independently of the edge inference logic.
Future multi-site validation plan. To validate generalizability across diverse urban typologies, a phased 24-month deployment plan is outlined across three distinct Algerian municipalities: (1) a coastal urban intersection in Algiers (high traffic density, maritime humidity, moderate temperatures) during months 1–8; (2) a mountainous urban intersection in Béjaïa (moderate traffic, fog risk, sub-zero winter temperatures) during months 9–16; and (3) a second arid-environment intersection in Biskra (similar to Ouargla but with a three-lane North–South approach and a higher East–West demand) during months 17–24. Each site will undergo the same measurement protocol as the Ouargla study ( N = 30 cycles per density condition, Wilcoxon signed-rank testing, BCa bootstrap confidence intervals), enabling direct cross-site comparison of DWAGE generalizability and threshold portability.
The current deployment governs a single isolated intersection. Multi-intersection corridor synchronization would additionally require adoption of OPC UA Pub/Sub architecture and the characterization of wide-area network latency bounds—aspects not addressed in this baseline study but identified as a priority future extension.

8.3. Comparison with Deep Reinforcement Learning (DRL) Approaches

Deep Reinforcement Learning (DRL) methods have attracted significant research attention in the ATSC domain, with recent surveys [11] reporting simulated delay reductions of 30–50% using policy-gradient and actor–critic architectures (PPO, DDPG, SAC). Table 13 provides a direct multi-dimensional comparison between SYTRAC and representative DRL-based ATSC methods across five deployment-critical dimensions. This comparison is not intended to argue that SYTRAC achieves higher theoretical optimality than DRL; rather, it demonstrates why a deterministic, PLC-backed approach is more appropriate for live public infrastructure where software failure has direct safety consequences.
The comparison reveals a fundamental trade-off inherent to the ATSC deployment problem: DRL approaches optimize for delay reduction within a simulation environment, while SYTRAC optimizes for deployability under real-world safety and regulatory constraints. The numerical proximity between PressLight’s simulated 22% delay reduction [9] and SYTRAC’s field-measured 22.1% should not be interpreted as performance equivalence—the former is measured in simulation under idealized demand models, the latter on a live arid-environment intersection with rigorous statistical validation ( p < 0.001 ; BCa bootstrap, B = 10,000 resamples). SYTRAC’s contribution is therefore not to outperform DRL in simulation but to demonstrate that competitive real-world performance is achievable within a sub-$1300 platform that satisfies the safety, interpretability, and compliance requirements that public infrastructure deployment demands.

8.4. Security and Regulatory Compliance

The current prototype uses Security Mode for diagnostic convenience. During the Ouargla field deployment the following physical and logical mitigations were enforced to manage the security risk: (i) the OPC UA Ethernet link between the Jetson Nano and the S7-1200 is a dedicated point-to-point segment with no gateway to any public network; (ii) the TP-Link TL-SG1008P switch was configured with separate VLANs isolating OT (OPC UA, 24 VDC logic) traffic from the IT (web dashboard) segment; (iii) the Rittal AE 1380 enclosure is locked with a key accessible only to authorized maintenance personnel; and (iv) no remote internet access was enabled during the evaluation period. These mitigations satisfy the partial IEC 62443 [39] network isolation requirement noted in Table 14. This configuration is still not suitable for unattended public infrastructure deployment; the production security roadmap is defined in Table 14.
This roadmap demonstrates systems engineering maturity by outlining a concrete path toward securing the industrial PLC communication pipeline for public infrastructure deployment.

8.5. Sustainability and Environmental Impact

Reduced vehicular idling translates to quantifiable environmental benefits across three pillars of sustainability: environmental (greenhouse gases and air quality), social (health, safety, and equity), and economic (fuel costs, commuter time, and infrastructure affordability). This section provides a structured analysis under each pillar and maps SYTRAC’s verified outcomes to the UN Sustainable Development Goals (SDGs).

8.5.1. Environmental Sustainability: Greenhouse Gas and Air Pollutant Reduction

CO 2 emissions: methodology and traffic engineering basis. The emission calculation is grounded in the following traffic engineering inputs, consistent with the MOVES3 (Motor Vehicle Emission Simulator) methodology adapted for the Algerian fleet context.
Vehicle-class composition. Field-observed classification from YOLOv4-tiny detection logs over the six-hour annotation period yielded a vehicle fleet composition of approximately 78% passenger cars, 14% light trucks and buses, and 8% heavy diesel trucks. This composition was held constant across all emission calculations as the primary demand stratum for the Ouargla site.
Fuel Type and Emission Factors. The Algerian national fleet is dominated by gasoline and diesel vehicles, with a significant proportion of older carbureted engines. Per-class idle emission factors were set as follows: gasoline passenger cars (older fleet): 2.3 g CO 2 /s (MOVES3 idle emission rate adjusted +25% for pre-2000 carbureted engines relative to the COPERT v5 European baseline); light trucks/buses: 3.1 g CO 2 /s (diesel, moderate age); heavy diesel trucks: 4.8 g CO 2 /s. The fleet-weighted composite idle emission factor is 2.54 g CO 2 /s per vehicle, compared to the European COPERT v5 baseline of 1.67 × 10 4 L/s × 2.31 kg CO 2 /L =   0.386 g CO 2 /s. The Algerian-adjusted factor is approximately 6.6× higher than the European reference, reflecting the older fleet profile.
Stop-and-Go Dynamics. Beyond idle-phase emissions, each stop-and-go cycle imposes an additional fuel penalty from deceleration and subsequent hard acceleration. Based on MOVES3 running-emission rates for stop-and-go acceleration events in the 0–30 km/h speed range, each complete stop-and-go event is estimated to produce approximately 35 g CO 2 per light vehicle in acceleration excess emissions. The 28.4% reduction in average stops per vehicle (Table 10) eliminates approximately 0.52 stop-and-go events per vehicle per cycle, contributing an additional 18.2 g CO 2 saving per vehicle beyond the idle-time reduction.
Revised total calculation. Combining the idle-phase saving (9.9 s/veh × 2.54 g CO 2 /s = 25.1 g CO 2 /veh) and the stop-and-go acceleration saving ( 0.52 × 35 g =   18.2 g CO 2 /veh per vehicle) yields a composite saving of approximately 43.3 g CO 2 per vehicle. Applied to 14,000 daily vehicles, this corresponds to approximately 53.5 kg CO 2 /day (≈19.5 t/year), consistent with the COPERT v5-based estimate reported in the abstract. For the oldest fleet quartile (pre-1990 engines, with idle emission rates up to 35% above the fleet average), the upper-bound estimate rises to approximately 72 kg CO 2 /day (26.3 t/year). This two-component methodology—idle reduction plus stop-and-go penalty elimination—provides a more comprehensive traffic-engineering-grounded emission calculation than single-factor idle estimates.
Fuel Savings. The 9.9 s/vehicle delay reduction corresponds to a fuel saving of approximately 1.65 × 10 3 L/vehicle (using the COPERT idle fuel rate of 1.67 × 10 4 L/s). At 14,000 daily vehicles, this represents approximately 23.1 L/day saved, or approximately 8430 L/year of gasoline avoided at a single intersection. SYTRAC’s own energy footprint of 18–23 W (full site: approximately 26–33 W including signal heads) is negligible relative to these fuel savings: the system’s annual electricity consumption of approximately 230–290 kWh is equivalent to less than 26 L of gasoline, yielding an energy return ratio exceeding 320:1 between avoided fuel energy and system electrical energy.
Air Quality Co-Benefits. Idling combustion engines emit nitrogen oxides ( NO x ), hydrocarbons (HC), and fine particulate matter ( PM 2.5 ) at rates disproportionate to cruising conditions [46]. The 2021 WHO Global Air Quality Guidelines identify PM 2.5 and NO 2 as primary drivers of urban respiratory disease burden, with short-term NO 2 exposures linked to asthma exacerbations and cardiovascular events [46]. Using COPERT idle NO x factors for a mixed urban fleet (≈1.2 g/vehicle/min equivalent), the 9.9 s delay reduction corresponds to approximately 9.9 × 10 3 g NO x avoided per vehicle, or approximately 0.14 kg NO x /day avoided across the daily traffic flow—a measurable improvement in the local pollution burden borne by pedestrians and residents at the intersection.

8.5.2. Social Sustainability: Safety, Accessibility, and Equity

Pedestrian safety. SYTRAC’s DWAGE algorithm incorporates a real-time pedestrian detection term that additively extends green phases for crossing pedestrians (Equation (3), Section 6). The PLC-hardcoded minimum green floor of 8 s ( g min ) constitutes an unconditional pedestrian safety guarantee that cannot be overridden by the AI layer—a design property directly aligned with SDG 11.2’s mandate for access to safe and sustainable transport systems for all, including people in vulnerable situations.
Equity and access for emerging economies. Commercial ATSC systems (SCOOT, SCATS) require fiber-optic infrastructure and centralized traffic management centers, with per-intersection costs typically in the range of $50,000–$200,000 (USD) [4,5]. SYTRAC’s $1257 full-site hardware cost represents a 40–160× reduction in capital expenditure, removing the principal economic barrier that has prevented adaptive traffic management from reaching mid-sized municipalities in developing countries. This cost democratization is a direct sustainability contribution: it extends the safety and efficiency benefits of adaptive control to populations that have historically been excluded from their use.
Deployment in arid and climatically extreme environments. The Ouargla field validation (ambient temperature 43 °C) demonstrates that SYTRAC’s sustainability benefits are accessible to communities in climatically challenging environments that are disproportionately vulnerable to the health effects of vehicle air pollution and are underserved by existing ATSC technology.

8.5.3. Economic Sustainability: Social Return on Investment

The 22.1% delay reduction at the study intersection corresponds to a daily aggregate delay saving of approximately 14,000 × 9.9 = 138,600 vehicle-seconds =   38.5 vehicle-hours per day. Applying a conservative Value of Travel Time Savings (VTTS) of US$3/h, appropriate to Algeria’s GDP per capita context [47], yields approximately $42,000 in annual commuter productivity recovered at a single intersection. This alone represents a Social Return On Investment (SROI) of approximately 33:1 relative to the $1257 hardware cost within the first year. Including fuel savings (8430 L/year at approximately $1.20/L local price) adds a further $10,116/year in avoided fuel expenditure, bringing the combined first-year economic benefit to approximately $52,000 per intersection—an SROI exceeding 41:1. This cost-benefit profile strongly supports municipal investment in SYTRAC as a sustainability infrastructure measure, and it scales linearly with the number of intersections equipped.

8.5.4. SDG Alignment

Table 15 maps SYTRAC’s directly verified outcomes to the UN SDG framework. The platform’s contributions span SDG 9 (Industry, Innovation and Infrastructure), SDG 11 (Sustainable Cities and Communities), SDG 13 (Climate Action), and SDG 17 (Partnerships for the Goals) through its open-source architecture.

8.5.5. Simulation-Based Generalizability by Intersection Type

While field validation was constrained to the single Ouargla study intersection, the calibrated SUMO model allows SYTRAC performance to be evaluated across a range of intersection geometries and traffic conditions not accessible during the field deployment. Table 16 reports simulated weighted average delay reduction (15 replications per scenario) for five intersection configuration variants.
The results confirm three generalizability conclusions. First, DWAGE maintains approximately 20–22% delay reduction on symmetric 4-leg two-phase intersections, confirming that the two-phase Ouargla results are representative of this common intersection class. Second, the introduction of exclusive protected left-turn phases (4-phase operation) reduces the delay benefit to 17.8%, primarily because the increased lost time L per cycle reduces the proportion of cycle time available for productive green. This indicates that DWAGE requires re-tuning of the g min and g max bounds for multi-phase configurations with high lost-time fractions. Third, under oversaturated conditions (violating Constraint C4), DWAGE’s proportional allocation saturates at g max and delay reductions drop to approximately 8%, confirming that the Foster–Lyapunov stability guarantee depends on the sub-saturation premise and that network-level coordination is necessary for sustained high-demand arterials.

8.5.6. System Lifecycle and Circular Economy Considerations

SYTRAC’s modular architecture separates the AI inference layer (Jetson Nano) from the certified industrial control layer (S7-1200 PLC). This separation permits hardware-layer upgrades—replacing a Jetson Nano with a next-generation Jetson Orin for higher inference throughput—without modifying the PLC safety logic, extending useful system life and reducing electronic waste relative to monolithic proprietary ATSC platforms that require full system replacement upon technology refresh. The open-source software stack further ensures that software improvements can be applied to deployed hardware without additional licensing costs, consistent with circular economy principles for sustainable urban infrastructure investment.

9. Conclusions

This paper has proposed and validated SYTRAC, a cost-effective, safety-critical Adaptive Traffic Signal Control system that successfully bridges the gap between AI-driven intelligence and industrial-grade safety compliance. Grounded in the formal optimization problem and Max-Pressure traffic theory, our central technical contributions include: (i) a three-mode fault-tolerant state machine with a 2 s watchdog timer that guarantees automatic transition to fixed-time PLC safety fallback; (ii) the DWAGE algorithm, whose density-proportional green allocation is formally proven to preserve queue stability under a closed-form Foster–Lyapunov drift argument; and (iii) a rigorous multi-method evaluation combining hardware-in-the-loop latency profiling, live-intersection field measurement, and calibrated microscopic traffic simulation.
Experimental field evaluations of SYTRAC at a live, high-temperature intersection in Ouargla, Algeria, demonstrated a statistically significant 22.1% reduction in average vehicle delay compared to legacy fixed-time control. Crucially, on the environmental and economic dimensions, this delay reduction translates directly to approximately 53.5–72 kg of CO 2 avoided per day (up to 26.3 metric tons per year) and annual fuel savings of 8430 L. Valuation of conservative commuter time savings yielded a first-year Social Return On Investment exceeding 33:1, achieved within a sub-$1300 hardware budget that is significantly lower than commercial adaptive control alternatives. These outcomes demonstrate that safety-critical, adaptive intersection management can be deployed affordably in emerging-economy municipalities with immediate, measurable environmental co-benefits. By open-sourcing the DWAGE source code, SUMO calibration configurations, and OPC UA node maps, this work provides a reproducible and scalable blueprint for low-carbon, smart-city development in resource-constrained regions.
Planned extensions include: (i) TensorRT INT4 quantization (contingent on next-generation hardware such as the Jetson Orin, as INT4 inference is not natively supported on Maxwell-architecture GPUs) to increase inference throughput beyond 30 fps at the current 416 × 416 resolution, and parallel evaluation of a higher-resolution ( 608 × 608 ) pipeline on INT8-capable successors of the Jetson Nano; (ii) multi-phase (four-approach) intersection generalization with extended DWAGE density indices; (iii) OPC UA Pub/Sub-based corridor synchronization across adjacent edge nodes; and (iv) a formal FMEA study to advance the IEC 61508 SIL-1 [45] compliance status beyond the current watchdog-only partial implementation.

Author Contributions

Conceptualization, F.B.; methodology, F.B., N.D. and H.Z.; software, F.B.; OPC UA integration, F.B.; PLC programming, F.B.; investigation, F.B. and A.L.; formal analysis, F.B. and H.Z.; visualization, F.B. and B.T.; writing—original draft preparation, F.B.; supervision, N.D. and A.L.; resources, N.D. and B.K.; validation, N.D. and B.K.; industrial automation support, B.K.; PLC validation, B.K.; AI/deep learning validation, H.Z.; data curation, B.T.; experimental validation, B.T.; project administration, A.L.; funding acquisition, A.L.; writing—review and editing, N.D., B.K., H.Z., B.T. and A.L. All authors have read and agreed to the published version of the manuscript.

Funding

This research received no external funding.

Institutional Review Board Statement

Not applicable.

Informed Consent Statement

Not applicable.

Data Availability Statement

The SUMO calibration files, DWAGE Python source code, and OPC UA node mapping configuration are archived at https://github.com/fbouriachi?tab=repositories (accessed on 11 May 2026) and will be made fully public upon acceptance of the manuscript. In compliance with MDPI data availability policy, a read-only preview is available to reviewers upon request to the corresponding author.

Conflicts of Interest

The authors declare no conflicts of interest.

Abbreviations

The following abbreviations are used in this manuscript:
ATSCAdaptive Traffic Signal Control
CLAHEContrast Limited Adaptive Histogram Equalization
CRTNACentre de Recherche sur les Transports et la Navigation Aerienne
DBData Block (Siemens TIA Portal)
DWAGEDensity-Weighted Adaptive Green Extension
IoTInternet of Things
IIoTIndustrial Internet of Things
NMSNon-Maximum Suppression
OPC UAOPC Unified Architecture [8]
PLCProgrammable Logic Controller
RESTRepresentational State Transfer
ROIRegion of Interest
RTSPReal-Time Streaming Protocol
SCOOTSplit Cycle Offset Optimization Technique
SCATSSydney Coordinated Adaptive Traffic System
SDGSustainable Development Goal (UN 2030 Agenda)
SROISocial Return On Investment
VTTSValue of Travel Time Savings
COPERTComputer Programme to calculate Emissions from Road Transport
V2XVehicle-to-Everything Communication
YOLOYou Only Look Once (object detection framework)

References

  1. Office National des Statistiques Algerie. Parc Automobile National—Statistiques 2023; ONS Tech. Rep.; ONS: Algiers, Algeria, 2023. Available online: http://www.ons.dz/ (accessed on 11 May 2026).
  2. International Energy Agency. CO2 Emissions from Fuel Combustion: Highlights 2022; IEA: Paris, France, 2022; Available online: https://aither.com/european-union-allowances/ (accessed on 15 March 2026).
  3. Webster, F.V. Traffic Signal Settings; Road Research Technical Paper No. 39; HMSO: London, UK, 1958; Available online: https://trid.trb.org/View/179439 (accessed on 11 May 2026).
  4. Hunt, P.B.; Robertson, D.I.; Bretherton, R.D.; Winton, R.I. SCOOT—A traffic responsive method of coordinating signals. In TRRL Laboratory Report 1014; Transport Research Laboratory: Crowthorne, UK, 1981. [Google Scholar]
  5. Lowrie, P. SCATS: Sydney Co-Ordinated Adaptive Traffic System: A Traffic Responsive Method of Controlling Urban Traffic. 1990. Available online: https://trid.trb.org/View/488852 (accessed on 11 May 2026).
  6. NVIDIA Corporation. Jetson Nano Developer Kit User Guide; NVIDIA Tech. Note TM-07831-001_v1.3; NVIDIA: Santa Clara, CA, USA, 2021; Available online: https://developer.nvidia.com/embedded/jetson-nano (accessed on 15 March 2026).
  7. Bochkovskiy, A.; Wang, C.-Y.; Liao, H.-Y.M. YOLOv4: Optimal speed and accuracy of object detection. arXiv 2020, arXiv:2004.10934. [Google Scholar] [CrossRef]
  8. IEC 62541-21; OPC Unified Architecture—Part 21: Device Onboarding. International Electrotechnical Commission (IEC): Geneva, Switzerland, 2026.
  9. Zheng, G.; Xiong, Y.; Zang, X.; Feng, J.; Wei, H.; Zhang, H.; Li, Y.; Xu, K.; Li, Z. Diagnosing reinforcement learning for traffic signal control. arXiv 2019, arXiv:1905.04716. [Google Scholar] [CrossRef]
  10. Wei, H.; Zheng, G.; Yao, H.; Li, Z. IntelliLight: A reinforcement learning approach for intelligent traffic light control. In Proceedings of the 24th ACM SIGKDD International Conference on Knowledge Discovery and Data Mining (KDD ’18), London, UK, 19–23 August 2018; Association for Computing Machinery (ACM): New York, NY, USA, 2018; pp. 2496–2505. [Google Scholar] [CrossRef]
  11. Haydari, A.; Yılmaz, Y. Deep reinforcement learning for intelligent transportation systems: A survey. IEEE Trans. Intell. Transp. Syst. 2022, 23, 11–32. [Google Scholar] [CrossRef]
  12. IEC 61784; International Electrotechnical Commission (IEC): Industrial Communication Networks—Profiles. IEC: Geneva, Switzerland, 2019.
  13. Varaiya, P. Max pressure control of a network of signalized intersections. Transp. Res. Part C Emerg. Technol. 2013, 36, 177–195. [Google Scholar] [CrossRef]
  14. Meyn, S.; Tweedie, R.L. Markov Chains and Stochastic Stability, 2nd ed.; Cambridge University Press: Cambridge, UK, 2009. [Google Scholar] [CrossRef]
  15. Daganzo, C.F. The cell transmission model: A dynamic representation of highway traffic consistent with the hydrodynamic theory. Transp. Res. Part B Methodol. 1994, 28, 269–287. [Google Scholar] [CrossRef]
  16. Zhai, C.; Wu, W.; Shi, T.; Zhang, J.; Xiao, Y.; Zhai, M.; Wu, Y. Traffic wave transition for 2-D multi-phase traffic flow with consideration of jerk dynamics and cyber-attacks. Phys. A Stat. Mech. Its Appl. 2026, 666, 131614. [Google Scholar] [CrossRef]
  17. He, Z.; Laval, J.A.; Han, Y.; Hegyi, A.; Nishi, R.; Wu, C. A review of stop-and-go traffic wave suppression strategies: Variable speed limit versus jam-absorption driving. IEEE Trans. Intell. Transp. Syst. 2026, 27, 4986–5000. [Google Scholar] [CrossRef]
  18. Kolat, M.; Kővári, B.; Bécsi, T.; Aradi, S. Multi-Agent Reinforcement Learning for Traffic Signal Control: A Cooperative Approach. Sustainability 2023, 15, 3479. [Google Scholar] [CrossRef]
  19. Bouriachi, F.; Zatla, H.; Tolbi, B.; Becha, K.; Ghermoul, A. Traffic Signal Control Model on Isolated Intersection Using Reinforcement Learning: A Case Study on Algiers City, Algeria. Rev. D’Intell. Artif. 2021, 35, 417–424. Available online: https://www.iieta.org/journals/ria/paper/10.18280/ria.350508 (accessed on 20 February 2026). [CrossRef]
  20. Celtek, S.A.; Durdu, A.; Alı, M.E.M. Real-time traffic signal control with swarm optimization methods. Measurement 2020, 166, 108206. [Google Scholar] [CrossRef]
  21. Akopov, A.S.; Beklaryan, L.A. Traffic Improvement in Manhattan Road Networks With the Use of Parallel Hybrid Biobjective Genetic Algorithm. IEEE Access 2024, 12, 19532–19552. [Google Scholar] [CrossRef]
  22. Redmon, J.; Divvala, S.; Girshick, R.; Farhadi, A. You only look once: Unified, real-time object detection. In Proceedings of the 2016 IEEE Conference on Computer Vision and Pattern Recognition (CVPR), Las Vegas, NV, USA, 27–30 June 2016; IEEE: New York, NY, USA, 2016; pp. 779–788. [Google Scholar] [CrossRef]
  23. Amrouche, A.; Bentrcia, Y.; Abed, A.; Hezil, N. Vehicle detection and tracking in real-time using YOLOv4-tiny. In Proceedings of the 2022 7th International Conference on Image and Signal Processing and their Applications (ISPA), Mostaganem, Algeria, 8–9 May 2022; IEEE: New York, NY, USA, 2022; pp. 1–5. [Google Scholar] [CrossRef]
  24. Mansour Mohamed, A.S.; Rashid, M.M. Video-based vehicle counting and analysis using YOLOv5 and DeepSORT with deployment on Jetson Nano. Asian J. Electr. Electron. Eng. 2022, 2. [Google Scholar] [CrossRef]
  25. Darwhekar, K.; Patil, A.; Ghodke, S.; Bawkar, R.; Rudrawar, S. Computer vision based intelligent traffic management system. In Proceedings of the 2022 6th International Conference on Electronics, Communication and Aerospace Technology (ICECA), Coimbatore, India, 1–3 December 2022; IEEE: New York, NY, USA, 2022; pp. 1051–1056. [Google Scholar] [CrossRef]
  26. Xiong, X.; Tan, Y.; Huang, Z.; Chen, B.; Huang, Q. Automatic NDT of semi-rigid base cracks within asphalt pavement based on 3D-GPR and deep learning. Int. J. Pavement Eng. 2025. [Google Scholar] [CrossRef]
  27. Shi, W.; Cao, J.; Zhang, Q.; Li, Y.; Xu, L. Edge computing: Vision and challenges. IEEE Internet Things J. 2016, 3, 637–646. [Google Scholar] [CrossRef]
  28. Wang, K.; Shen, Z.; Lei, Z.; Liu, X.; Zhang, T. Toward multi-agent reinforcement learning based traffic signal control through spatio-temporal hypergraphs. IEEE Trans. Mob. Comput. 2025, 24, 8258–8271. [Google Scholar] [CrossRef]
  29. NVIDIA Corporation. TensorRT Developer Guide, v8.x; NVIDIA Corporation: Santa Clara, CA, USA, 2023; Available online: https://developer.nvidia.com/tensorrt (accessed on 15 March 2026).
  30. Raza, M.; Kazmi, M.; Kidwai, H.M.; Khan, H.R.; Qazi, S.A.; Arshad, K.; Assaleh, K. An edge-deployed real-time adaptive traffic light control system using YOLO-based vehicle detection and PCE-aware density estimation. IEEE Access 2025, 26, 153586–153613. [Google Scholar] [CrossRef]
  31. Wadi, M.; Shabbir, A.; Jerew, W.; Khalid, M. Evaluation of OPC UA and MQTT protocols for Industrial Internet of Things applications. IEEE Access 2022, 10, 55860–55876. [Google Scholar] [CrossRef]
  32. Siemens AG. STEP 7 and WinCC: OPC UA in TIA Portal; Siemens Application Note, Entry ID: 109755276, v2.0; Siemens AG: Munich, Germany, 2021; Available online: https://docs.tia.siemens.cloud/r/en-us/v20/communication-s7-1200-s7-1500/opc-ua-s7-1200-s7-1500/client-instructions-s7-1500/opc-ua-instructions-for-client-programs-s7-1500 (accessed on 11 May 2026).
  33. Lee, C.; Kim, N.; Hong, S. Toward industrial IoT: Integrated architecture of an OPC UA synergy platform. IEEE Access 2021, 9, 164720–164731. [Google Scholar] [CrossRef]
  34. Ceapă, V.C.D.; Apostol, V.A.; Sacală, I.S.; Căruntu, C.F.; Ross, R.; Holt, D.; Segărceanu, M.; Burlacu, L.E. IoT-Simulated Digital Twin with AI Traffic Signal Control for Real-Time Traffic Optimization in SUMO. Sensors 2026, 26, 1880. [Google Scholar] [CrossRef] [PubMed]
  35. Cavalieri, S.; Chiacchio, F. OPC UA over Time-Sensitive Networking for industrial IoT: A performance analysis. Comput. Stand. Interfaces 2021, 78, 103541. [Google Scholar]
  36. EN 12368; Traffic Control Equipment—Signal Heads. European Committee for Standardization (CEN): Brussels, Belgium, 2015.
  37. Lee, W.-H.; Chiu, C.-Y. Design and implementation of a smart traffic signal control system for smart city applications. Sensors 2020, 20, 508. [Google Scholar] [CrossRef] [PubMed]
  38. Guo, M.; Wang, P.; Chan, C.Y.; Askary, S. A reinforcement learning approach for intelligent traffic signal control at urban intersections. In Proceedings of the 2019 IEEE Intelligent Transportation Systems Conference (ITSC), Auckland, New Zealand, 27–30 October 2019; IEEE: New York, NY, USA, 2019; pp. 4242–4247. [Google Scholar] [CrossRef]
  39. IEC 62443-3-3; Security for Industrial Automation and Control Systems—Part 3-3: System Security Requirements and Security Levels. International Electrotechnical Commission (IEC): Geneva, Switzerland, 2013.
  40. Maureal, A.L.; Lorilla, F.M.A.; Andres, G.L. A Lightweight Edge AI Framework for Adaptive Traffic Signal Control in Mid-Sized Philippine Cities. Sustainability 2026, 18, 1147. [Google Scholar] [CrossRef]
  41. Department for Transport (DfT). Transport Analysis Guidance (TAG) Unit M3.1: Highway Assignment Modelling; Department for Transport: London, UK, 2020. Available online: https://www.gov.uk/government/publications/tag-unit-m3-1-highway-assignment-modelling (accessed on 15 March 2026).
  42. Chauhan, S.; Bansal, K.; Sen, R. EcoLight: Intersection Control in Developing Regions Under Extreme Budget and Network Constraints. In Advances in Neural Information Processing Systems 33 (NeurIPS 2020); Larochelle, H., Ranzato, M., Hadsell, R., Balcan, M.F., Lin, H., Eds.; Curran Associates, Inc.: Red Hook, NY, USA, 2020; pp. 13027–13037. [Google Scholar]
  43. OWASP. OWASP API Security Top 10–2023; Open Worldwide Application Security Project. 2023. Available online: https://owasp.org/API-Security/ (accessed on 11 May 2026).
  44. Rescorla, E. The Transport Layer Security (TLS) Protocol Version 1.3; RFC 8446, Internet Engineering Task Force (IETF). 2018. Available online: https://www.rfc-editor.org/info/rfc8446/ (accessed on 20 February 2026).
  45. IEC 61508-1:2010; International Electrotechnical Commission (IEC): Functional Safety of Electrical/Electronic/Programmable Electronic Safety-Related Systems—Part 1: General Requirements. IEC: Geneva, Switzerland, 2010.
  46. World Health Organization. WHO Global Air Quality Guidelines: Particulate Matter (PM2.5 and PM10), Ozone, Nitrogen Dioxide, Sulfur Dioxide and Carbon Monoxide; WHO: Geneva, Switzerland, 2021. Available online: https://www.who.int/publications/i/item/9789240034228 (accessed on 15 March 2026).
  47. Shires, J.D.; de Jong, G.C. An international meta-analysis of values of travel time savings. Eval. Program Plan. 2009, 32, 315–325. [Google Scholar] [CrossRef] [PubMed]
Figure 1. SYTRAC four-layer system architecture.
Sustainability 18 07010 g001
Figure 2. SYTRAC two-phase signal timing diagram.
Sustainability 18 07010 g002
Figure 3. Physical SYTRAC hardware assembly in an IP55 roadside enclosure.
Sustainability 18 07010 g003
Figure 4. Detailed system architecture and asynchronous data flow of the proposed SYTRAC algorithm.
Sustainability 18 07010 g004
Figure 5. DWAGE threshold sensitivity: delay reduction (%) as a function of δ LOW and δ HIGH .
Sustainability 18 07010 g005
Figure 6. SYTRAC real-time web supervision dashboard.
Sustainability 18 07010 g006
Figure 7. Site plan of the intersection ex-surté Wilaya in Ouargla.
Sustainability 18 07010 g007
Table 1. Signal phase assignment per direction.
PhaseN–S VehiclesE–W VehiclesPed. (N, S)Ped. (E, W)Duration
P1 (Green)GREENREDGREENRED8–80 s
A1 (Amber)AMBERREDREDRED4 s (fixed)
AR1 (All-Red)REDREDREDRED2 s (fixed)
P2 (Green)REDGREENREDGREEN8–80 s
A2 (Amber)REDAMBERREDRED4 s (fixed)
AR2 (All-Red)REDREDREDRED2 s (fixed)
Table 2. Hardware bill of materials and power consumption.
ComponentModelCost (USD)Power (W)
Edge ComputerNVIDIA Jetson Nano 4GB$149∼8–10 W
PLCSiemens S7-1200 CPU 1214C$380∼4–5 W
IP Camera (×4)Hikvision DS-2CD2343G2-I$380
PoE Switch 1TP-Link TL-SG1008P$42∼6–8 W
Signal Heads 2 (×4)TrafficPak LED 200 mm RGB$140∼8–10 W
Relay Module (×2)Phoenix Contact 2966170$56<1 W
EnclosureRittal AE 1380 (IP55)$110
SYTRAC Control Loop Total $1117∼18–23 W
ull Site Total (incl. signals) $1257∼26–33 W
1 PoE load of 6–8 W measured at switch level; per-camera PoE budget is up to 6.5 W per Hikvision DS-2CD2343G2-I specifications. The 2.0 W figure refers to the switch port’s power dissipation overhead per active PoE port under the observed camera operating conditions. 2 Signal head power measured per active LED module (only one phase active at a time).
Table 3. Cost comparison of SYTRAC against alternative ATSC approaches. “Cert. fail-safe” = hardware-enforced PLC-level fallback independent of the software node. “Galvanic isol.” = relay-based isolation between logic and high-voltage signal circuits.
System ClassApprox. CostAdaptive AIInd. PLCCert. Fail-SafeGalvanic Isol.
Low-cost IoT prototype [37,38]$200–$400YesNoNoNo
SYTRAC (This work)$1257YesYesYesYes
Commercial ATSC (SCOOT/SCATS) [4,5]$15,000–$200,000YesYesYesYes
Low-cost IoT prototypes use GPIO relay control or MQTT-based software switching: a software crash or relay weld can produce simultaneous conflicting GREEN signals, a safety-critical failure mode that renders them non-compliant with IEC/EN standards for public intersections. Commercial ATSC systems additionally require fiber-optic infrastructure and centralized traffic management centers, making them financially prohibitive for mid-sized municipalities in emerging economies.
Table 4. OPC UA node mapping (S7-1200 DB1 to physical outputs).
VariableDB AddressOutputSignal
Voie1_RougeDB1.DBX0.0Q0.0Lane 1 RED
Voie1_JauneDB1.DBX0.1Q0.1Lane 1 AMBER
Voie1_VertDB1.DBX0.2Q0.2Lane 1 GREEN
Voie2_RougeDB1.DBX0.3Q0.3Lane 2 RED
Voie2_JauneDB1.DBX0.4Q0.4Lane 2 AMBER
Voie2_VertDB1.DBX0.5Q0.5Lane 2 GREEN
Ped1_VertDB1.DBX0.6Q0.6Ped. 1 GREEN
Ped1_RougeDB1.DBX0.7Q0.7Ped. 1 RED
Ped2_VertDB1.DBX1.0Q1.0Ped. 2 GREEN
Ped2_RougeDB1.DBX1.1Q1.1Ped. 2 RED
Table 5. Fixed-time baseline controller parameters.
ParameterValueSource
Total cycle length ( T c )90 sExisting PLC program
Phase 1 green duration (P1)46 sField measurement
Phase 2 green duration (P2)36 sField measurement
Amber 1 duration (A1)4 sMunicipal regulation
Amber 2 duration (A2)4 sMunicipal regulation
Calibration period10 October 2025 to 14 February 2026Historical traffic counts
Table 6. OPC UA write latency statistics (1000 samples).
MetricSingle Node (ms)All 10 Nodes (ms)
Mean4.311.7
Median3.810.4
95th Percentile8.919.3
99th Percentile14.231.6
Maximum observed47.168.4
Emergency ALL-RED actuation latency47.0
Table 7. Real-world intersection delay from the Ouargla deployment ( N = 30 cycles per scenario; Wilcoxon signed-rank test applied per density condition vs. SYTRAC; r = rank-biserial effect size).
Cond.ControllerDelay (s/v)SDRed. (%)Wpr
LOWFixed-Time28.4±4.225.112<0.0010.84
Webster Opt.27.9±3.923.7
Fixed VA24.6±3.513.4
SYTRAC21.3±3.1
MED.Fixed-Time42.7±6.523.017<0.0010.79
Webster Opt.41.8±6.121.3
Fixed VA36.4±5.09.6
SYTRAC32.9±4.8
HIGHFixed-Time67.3±9.818.928<0.010.71
Webster Opt.65.1±9.216.1
Fixed VA59.8±8.18.7
SYTRAC54.6±7.4
Avg.1Fixed-Time42.622.1 p < 0.001 (all)
Webster Opt.41.620.2
Fixed VA37.010.3
SYTRAC33.2
1 Weighted by cycle frequency: LOW 35%, MED. 45%, HIGH 20%. W, r: Fixed-Time vs. SYTRAC only. 95% CI on wtd. avg. reduction: [20.5%, 23.7%] (BCa, B = 10 , 000 ). Holm–Bonferroni: LOW p = 0.0008 ; MED. p = 0.0003 ; HIGH p = 0.0041 — all significant after correction.
Table 8. SUMO calibration validation: GEH statistics and queue length error for all eight turning movements at peak demand.
Turning MovementField Vol. (veh/h)SUMO Vol. (veh/h)GEHQueue Err. (%)
NB Through3123080.238.4
NB Left-Turn87900.326.1
SB Through2983030.289.7
SB Left-Turn76720.4711.2
EB Through1451480.257.3
EB Left-Turn42440.315.8
WB Through1381350.268.9
WB Left-Turn39410.324.6
Range0.23–0.474.6–11.2
NB/SB = Northbound/Southbound (two-lane approaches); EB/WB = Eastbound/Westbound (single-lane approaches). Acceptance criterion: GEH < 5.0 for all movements [41].
Table 9. SUMO microscopic validation results across synthetic demand scenarios.
Synthetic ScenarioDemand MultiplierFixed-Time (s/veh)SYTRAC (s/veh)Reduction (%)
Off-peak minimum × 0.5 27.218.133.4%
Nominal baseline × 1.0 45.835.622.2%
Peak hour stress × 1.5 82.468.916.3%
Incident (lane blocked) × 1.0 104.575.228.0%
Table 10. Signal operation KPIs: Fixed-Time baseline vs. SYTRAC at nominal demand (SUMO, 15 replications; field cross-validation indicated where available).
KPIFixed-TimeSYTRACChange
Avg. per-vehicle delay (s/veh)45.835.6−22.2%
Avg. number of stops (stops/veh)1.841.32−28.4%
Avg. queue length (veh/approach)7.35.85−19.8%
Max. queue length (veh/approach)18.615.8−15.1%
Traffic throughput (veh/h, peak)934973+4.2%
V/C ratio (peak, N–S approach)0.810.72−11.1%
Pedestrian avg. wait time (s/ped)38.432.8−14.6%
Phase failure rate (occurrences/h)3.20.4−87.5%
“Phase failure” = a cycle in which the residual queue from the previous cycle prevents all queued vehicles from clearing during the allocated green phase. Avg. delay and throughput values cross-validated against field measurement (field: Fixed-Time 42.6 s/veh; SYTRAC 33.2 s/veh).
Table 11. Simulation comparison of DWAGE against GA, PSO, and PPO baselines under nominal and peak-stress demand (SUMO, 15 independent replications per scenario).
MethodNominal Delay (s/veh)Peak-Stress Delay (s/veh)Training CostAnalytical StabilitySafety Fallback
GA Split Optimizer41.276.5Low (Offline)NoYes (PLC-embedded)
PSO Swarm Heuristic [20]38.471.3None (Iterative)NoNo (soft-only)
PPO Deep RL Agent34.566.8High (2000 eps)NoNo (black-box)
DWAGE (ours)35.668.9None (rule-based)Yes (Lyapunov)Yes (2 s Watchdog)
Table 12. Architectural and algorithmic comparison of SYTRAC against related traffic signal control systems.
SystemCore AlgorithmOptimization ObjectiveHardware ClassSafety FallbackDeployment StatusDelay Reduction
IntelliLight [10]Deep Q-Network (RL)Queue lengthSimulation OnlyNoSimulation38% (sim)
PressLight [9]DQN Max-Pressure (RL)Pressure minimizationSimulation OnlyNoSimulation22% (sim)
EcoLight [42]Deep Q-Network (RL)Queue lengthRaspberry PiNoSimulation23% (sim)
Darwhekar et al. [25]YOLOv3 + Rule-BasedDelay minimizationRaspberry Pi + GPIONoField (live)21%
Mansour Mohamed et al. [24]YOLOv5 + DeepSORTQueue clearanceJetson Nano + GPIONoField (live)N/A
TrafficEZ [40]Custom CNN + DensitySpatial densityJetson NanoNoField (live)18–32%
SYTRAC (ours)YOLOv4-tiny + DWAGEDelay + Lyapunov stabilityJetson Nano + S7-1200 PLCYes (2 s Watchdog)Field (live)22.1%
(sim): result from simulation-only study; N/A: not reported.
Table 13. Multi-dimensional comparison of SYTRAC against Deep Reinforcement Learning (DRL)-based ATSC approaches across five deployment-critical dimensions.
DimensionSYTRAC (This Work)DRL-Based ATSC [9,10,11]
Deployment costLow (<1300 USD); off-the-shelf edge hardware (Jetson Nano + S7-1200 PLC); no training infrastructure required.High; expensive GPU training clusters and simulation platforms; high computational cost for policy retraining under shifts.
Real-time actuationDeterministic: 11.7 ms mean OPC UA write latency; 47 ms worst-case emergency fallback; bounded by IEC 61784.Non-deterministic; policy inference jitter depends on GPU load and batching; latency bounds are not characterized.
Safety guaranteesBounded queue stability (Foster–Lyapunov proof); hardcoded PLC interlocks ( g min floor); 2 s OPC UA watchdog fallback.No formal stability proofs; software-only execution; vulnerable to sim-to-real transfer gaps; no certified hardware fail-safe.
InterpretabilityHigh; DWAGE is a transparent, density-proportional control law fully auditable by traffic engineers without specialized AI tools.Low; deep neural networks are black-boxes; post hoc explainability (SHAP, attention maps) is not regulatory-grade.
Implementation feasibilityHigh; plug-compatible with standard PLC cabinets via OPC UA (IEC 62541/61784); deployable without regulatory waivers.Low; absence of certified fail-safes and independent hardware interlocks prevents regulatory road-authority approval.
SYTRAC trades theoretical optimality for determinism, interpretability, and industrial-grade safety—properties essential for public infrastructure.
Table 14. Cybersecurity and regulatory compliance roadmap for SYTRAC production deployment.
RequirementStandardImplementation PathStatus
OPC UA certificate authenticationIEC 62541-21 [8]X.509 certificate exchange in TIA Portal OPC UA settings and asyncua client configurationRoadmap
Channel encryptionIEC 62541-21 [8]AES-256 via OPC UA SecurityMode=SignAndEncryptRoadmap
REST API authenticationOWASP API Top-10 [43]JWT Bearer tokens on all aiohttp API endpointsRoadmap
Transport securityRFC 8446 [44]TLS 1.3 on aiohttp server socket bindingRoadmap
ICS network isolationIEC 62443 [39]VLAN segmentation: IT zone (web dashboard) isolated from OT zone (OPC UA/24 VDC)Partial
Safety loop complianceIEC 61508 SIL-1 [45]OPC UA watchdog (2 s timeout) → PLC standalone fixed-time fallbackPartial—watchdog only; formal FMEA pending
Table 15. Mapping of SYTRAC’s verified outcomes to the UN Sustainable Development Goals.
SDGTargetSYTRAC ContributionQuantified Outcome
SDG 99.1: Resilient and inclusive infrastructureSub-$1300 open-source deployment architecture for adaptive intersection control; reproducible across resource-
constrained municipalities
40–160× cost reduction vs. commercial ATSC
SDG 1111.2: Safe and accessible transport for allPedestrian-aware signal timing with PLC-hardcoded minimum crossing interval; inclusive multi-class vehicle detectionHardcoded g min = 8  s; 80.2% pedestrian AP
SDG 1111.6: Urban environmental impact reductionMeasurable CO 2 and NO x reduction through elimination of unnecessary idling at the study intersection53.5–72 kg CO 2 /day avoided; ≈0.14 kg NO x /day avoided
SDG 1313.2: Climate measures in national policiesDemonstrated low-cost pathway to SDG-13-aligned traffic management reform in developing-country urban policy context19.5–26.3 t CO 2 /year per intersection
SDG 1717.6: Technology sharing and cooperationFull open-source release (DWAGE code, SUMO files, OPC UA mapping) on GitHub enabling replication in any countryOpen-source; reproducible
Table 16. Simulation-based generalizability analysis: SYTRAC delay reduction across intersection types and saturation levels (SUMO, 15 replications per scenario; baseline = Fixed-Time control).
ConfigurationPhasesLanes/ApproachSaturationDelay Red. (%)
Study site (Ouargla, baseline)22 (N–S)/1 (E–W)Undersaturated22.2
4-leg, uniform 2-lane22 (all)Undersaturated21.3
4-leg, excl. left-turn lanes42 + 1 per directionUndersaturated17.8
Study site, peak-hour stress22/1Near-saturated16.3
Study site, oversaturated22/1Oversaturated (violates C4)8.1
Exclusive left-turn scenario: DWAGE extended to 4-phase state machine; g min for protected left-turn phases set at 8 s. Lost time L increased to 20 s for 4-phase operation. Oversaturated: i λ i / s i 1 L / T c (Constraint C4 violated); DWAGE reaches g max cap. Network-level coordination required.
Disclaimer/Publisher’s Note: The statements, opinions and data contained in all publications are solely those of the individual author(s) and contributor(s) and not of MDPI and/or the editor(s). MDPI and/or the editor(s) disclaim responsibility for any injury to people or property resulting from any ideas, methods, instructions or products referred to in the content.