Article

Evaluating Community Training Effectiveness for Blue Economy and Circular Economy Implementation: A Hybrid SEM–Machine Learning Approach in the Citarum River Basin

1
Department of Mathematics, Faculty of Mathematics and Natural Sciences, Universitas Padjadjaran, Sumedang 45363, Indonesia
2
Doctoral Program in Mathematics, Faculty of Mathematics and Natural Sciences, Universitas Padjadjaran, Sumedang 45363, Indonesia
3
Faculty of Informatics and Computing, Universiti Sultan Zainal Abidin, Besut Campus, Kuala Terengganu 22200, Malaysia
*
Author to whom correspondence should be addressed.
Sustainability 2026, 18(14), 6973; https://doi.org/10.3390/su18146973
Submission received: 16 May 2026 / Revised: 6 July 2026 / Accepted: 6 July 2026 / Published: 8 July 2026

Abstract

Community capacity building in the Citarum River Basin is critical for sustainable environmental management through the principles of the Circular Economy (CE) and the Blue Economy (BE). This study developed an integrated modeling approach combining Structural Equation Modeling (SEM) and Machine Learning (ML) to analyze the effectiveness of CE- and BE-based training programs designed to strengthen community capacity in the Citarum River Basin. The factors examined include individual characteristics, teaching quality, and organizational and environmental support, with participant commitment serving as a mediating variable in influencing training effectiveness and sustainable environmental management outcomes. In this framework, SEM was employed to validate theoretical constructs and test causal relationships among latent variables, while ML techniques, specifically Random Forests and Artificial Neural Networks (ANNs), were incorporated to enhance predictive capabilities beyond what theory-driven models alone can achieve. The results demonstrate that all exogenous variables significantly influence training performance, both directly and indirectly, with organizational and environmental support as the most dominant factor, and that the integrated SEM-ML model outperforms the standalone SEM model. The integrated SEM-ML model yielded lower prediction error rates and higher explanatory power, with SEM-ANN delivering the best overall performance. These findings underscore the value of integrating theory-based and data-driven approaches in capacity-building research, effectively addressing the trade-off between model interpretability and predictive accuracy, and providing actionable insights for designing more impactful community training programs to support sustainable management of the Citarum River Basin.

1. Introduction

Today, the world faces a variety of complex challenges, one of which concerns natural resources. These challenges include the overexploitation of natural resources, environmental degradation, and the emergence of socioeconomic disparities in areas where resources are extracted. One strategy to address these issues is to establish a sustainable economic system [1]. In aquatic areas such as Watersheds (DAS), a strategic step that can be taken to establish a sustainable economic system is to integrate the concepts of the Blue Economy and the Circular Economy; in this way, the efficiency of natural resource utilization in the watershed can be improved while simultaneously maintaining the sustainability of the local ecosystem [2]. Conceptually, the Blue Economy focuses on how water-based natural resources can be utilized and optimized in a sustainable manner [3], while the concept of the Circular Economy focuses on how to establish a production and consumption system that minimizes waste generation through three key principles: reduce, reuse, and recycle [4].
The Citarum River Basin (DAS) is an area facing complex environmental challenges. This is due to the fact that the region hosts numerous industrial, domestic, and agricultural activities that not only rely on the Citarum River but also impact the environmental quality of the basin. The Citarum River Basin is one of the most important river systems in Indonesia, serving as a critical source of water for domestic consumption, agriculture, fisheries, industry, and hydroelectric power generation. However, rapid industrialization, population growth, urban expansion, and inadequate waste management practices have led to severe environmental degradation throughout the watershed [5]. Over the past several decades, the river has experienced significant pollution from industrial effluents, domestic wastewater, agricultural runoff, and solid waste accumulation, resulting in deteriorating water quality and ecosystem health. Recognizing the strategic importance of the Citarum River, the Indonesian government has implemented a series of restoration initiatives aimed at improving environmental quality and supporting sustainable development in the watershed. One of the most prominent initiatives is the Citarum Harum Program, which integrates environmental rehabilitation, pollution control, waste management, ecosystem restoration, and community empowerment [6]. The program emphasizes not only environmental recovery but also the active participation of local communities in adopting sustainable practices and supporting long-term ecological resilience. Despite substantial investments in environmental restoration and infrastructure development, the long-term success of these initiatives ultimately depends on the capacity of local communities to implement sustainable economic practices [7]. Consequently, community-based training programs focusing on Blue Economy and Circular Economy principles have become increasingly important as instruments for enhancing environmental awareness, promoting sustainable livelihoods, and facilitating behavioral change. Understanding the factors that determine the effectiveness of such training programs is therefore essential for maximizing the impact of sustainability interventions in the Citarum River Basin.
These challenges mean that implementing sustainable economic practices in the Citarum River Basin cannot rely solely on policies issued by the local government. Implementation in the Citarum region must also be accompanied by changes in the behavior of communities living and conducting economic activities in this area [8]. To bring about behavioral transformation, training and education programs can serve as a means to this end. These programs can help the community develop awareness of the importance of preserving the environment and encourage the adoption of sustainable economic practices [9]. Thus, the effectiveness of training is not merely about how effectively knowledge is transferred, but also about how behavioral and cultural changes can be realized within the community [10].
Based on the existing literature, the effectiveness of training programs is multidimensional, encompassing improvements in knowledge, skills, and behavior in the workplace or daily life [11]. Based on the existing literature in human resource management, several factors can influence the effectiveness of a training program. Broadly speaking, the factors influencing the effectiveness of training programs include individual participants, teaching quality, and organizational and environmental factors [12,13]. To investigate how these factors interact and the extent of one factor’s influence on another, Structural Equation Modeling (SEM) is a useful tool. SEM can be used by researchers to model qualitative research factors as theoretical constructs, thereby enabling the estimation of their influence magnitudes. Another advantage of SEM is its ability to accommodate both direct and indirect relationships via mediating variables, thereby providing a more comprehensive understanding of the mechanisms underlying training effectiveness [14,15]. However, SEM has limitations: it assumes linear relationships among latent variables and focuses primarily on parameter significance to validate established theoretical constructs rather than on the model’s predictive power [16].
In social contexts, interactions among actors within a social system are often non-linear, so linearity does not fully reflect the actual relationships between latent variables [17]. These interactions may involve threshold effects or conditional interactions [18]. As a result, the linearity assumption can lead to model misspecification when the true relationship is non-linear, thereby reducing predictive accuracy and generalizability [19]. A model suitable for inferring causal relationships is not necessarily suitable for making predictions, and vice versa.
On the other hand, advancements in Machine Learning (ML) methods offer excellent predictive capabilities, particularly for handling non-linear relationships between variables. ML can estimate predictive functions that are far more optimal than those of conventional statistical methods when a sufficiently large amount of empirical data is available; this process is achieved by minimizing the risk associated with expectations [20]. ML algorithms such as Random Forests and Artificial Neural Networks offer high flexibility; in addition to requiring no underlying assumptions, these methods can model non-linear interactions [21]. In systems with high complexity and large data dimensions, the ML approach has proven superior in improving prediction accuracy. However, the advantage in prediction accuracy of ML methods is accompanied by a significant drawback: the method’s limitations in interpreting the phenomena under study. Most ML algorithms are black-box in nature, making it difficult to interpret them or to conceptualize and theoretically explain the relationships between variables [22]. This is a crucial shortcoming, particularly in social research, where understanding how phenomena occur and the causal relationships between factors are of paramount importance—or may even be the primary focus of the study.
The differences in characteristics between SEM and ML reflect a dilemma between theory-based and data-driven or empirical approaches. SEM has advantages for interpreting causal relationships, but is limited in nonlinear cases. Conversely, ML excels in the flexibility of its assumptions and the accuracy of its predictions but falls short in providing meaningful interpretations of phenomena. To date, most research still positions these two approaches as competing rather than complementary [23]. This issue is also known as the bias-variance trade-off. This phenomenon occurs when parametric models, such as SEM, tend to yield relatively low variance but high bias, particularly when the actual relationships among variables do not align with the model’s assumptions. Conversely, non-parametric models, such as ML, offer high flexibility because they do not require assumptions, thereby reducing potential bias, but carry the risk of producing high variance [24].
Several recent studies have attempted to integrate Structural Equation Modeling (SEM) and Machine Learning (ML) to leverage the complementary strengths of explanatory and predictive modeling. Hybrid SEM–ML frameworks have been applied in various domains, including consumer behavior analysis [25], healthcare prediction [26], educational assessment [27], and organizational performance evaluation [28]. In these studies, SEM is typically used to validate latent constructs and estimate causal relationships, while ML algorithms are employed to improve predictive performance by capturing nonlinear interactions among variables. Despite these advances, existing SEM–ML studies remain concentrated in marketing, management, healthcare, and behavioral research contexts. Limited attention has been devoted to environmental sustainability and community capacity-building programs, particularly those related to Circular Economy and Blue Economy implementation [29]. Furthermore, few studies have examined how theoretically validated latent constructs can be transformed into machine-learning features for predicting the effectiveness of community-based sustainability interventions [30]. Building upon these previous studies, this research extends the application of theory-guided SEM–ML frameworks to the evaluation of sustainability-oriented community capacity-building programs in the Citarum River Basin.
Although these studies demonstrate that integrating SEM and machine learning can improve predictive performance while preserving theoretical interpretability, their primary emphasis has been on validating the effectiveness of the hybrid methodology within their respective application domains. Most previous studies have focused on commercial, organizational, healthcare, and educational settings, where prediction accuracy is the principal objective. Comparatively fewer studies have investigated the applicability of hybrid SEM–ML frameworks in sustainability-oriented community interventions, where understanding the theoretical mechanisms underlying behavioral change is equally important as predictive performance. Moreover, existing studies generally employ domain-specific latent constructs, indicating that the effectiveness and generalizability of hybrid SEM–ML approaches remain highly dependent on the characteristics of the investigated phenomenon. Consequently, further empirical evidence from different sustainability contexts is required to evaluate the robustness and applicability of theory-guided SEM–ML frameworks.
Based on these issues, this study developed an approach that integrates SEM and ML into a comprehensive framework that considers both the theoretical validity and predictive power of the model. In this study, the SEM method was used to validate the established theoretical constructs and generate a score for each latent variable. These scores are then used as input in the ML model to make predictions. The ML model is used because it can capture non-linear and other complex relationships. Thus, this method improves prediction accuracy. This approach can be viewed as a form of latent embedding, in which the theoretically validated latent constructs are projected into a structured, low-dimensional feature space. This transformation serves as a theory-based regularization mechanism, helping reduce data noise and improve model stability. Machine learning methods are then used to estimate the non-linear functions that describe the relationships between latent variables. Accordingly, this study seeks to investigate the factors that influence the effectiveness of community-based Blue Economy and Circular Economy training programs implemented in the Citarum River Basin. In particular, the study examines the extent to which participant commitment mediates the relationships between participant characteristics, training instruction, organizational and environmental factors, and training performance. Furthermore, the study explores whether a hybrid Structural Equation Modeling–Machine Learning (SEM–ML) framework can provide superior predictive performance compared with conventional explanatory modeling approaches. Based on these research questions, the study aims to identify the key determinants of training effectiveness and evaluate the usefulness of a theory-guided SEM–ML framework for predicting training performance in sustainability-oriented community capacity-building programs. While the constructs examined in this study are well established in the training effectiveness literature, their application within Blue Economy and Circular Economy capacity-building programs remains limited. Unlike conventional organizational training, sustainability-oriented training initiatives aim not only to improve individual knowledge and skills but also to foster community engagement, environmental awareness, and the adoption of sustainable practices. Therefore, investigating these determinants within the context of the Citarum River Basin provides insights into how established training effectiveness factors operate in sustainability-oriented community development programs.
This study contributes to the literature in three important ways. First, it extends training effectiveness research into the context of community-based sustainability interventions, specifically Blue Economy and Circular Economy capacity-building programs implemented within the Citarum River Basin. Second, the study contributes methodologically by integrating Structural Equation Modeling (SEM) and Machine Learning (ML) into a unified analytical framework. Unlike conventional predictive modeling approaches, the proposed framework utilizes theoretically validated latent variables as machine learning inputs, thereby combining explanatory and predictive perspectives. Third, the findings provide practical guidance for policymakers, local governments, and training providers seeking to strengthen sustainability-oriented community empowerment programs through improved training design, participant engagement, and institutional support mechanisms.

2. Overview

2.1. The Effectiveness of Training in the Context of Sustainable Transformation

The effectiveness of a training program is generally defined as the degree to which it improves trainees’ skills, attitudes, and behavioral changes, which are subsequently applied in various contexts, such as work or daily life [10]. The effectiveness of a training program is often measured through an outcome-based evaluation, such as improvements in individual performance. In the context of integrating the Blue Economy and the Circular Economy, the goal is not only to enhance individuals’ cognitive capacities but also to foster collective behavioral changes within community groups, which, in turn, impact the environment. This makes the effectiveness of training programs multidimensional, involving the interaction among various factors, including individual, instructional, and organizational and environmental support factors, in the setting where the training takes place [12].
Based on the existing literature, the success and effectiveness of training programs are influenced by each individual’s ability to apply the knowledge and skills acquired during training in real-world practice. This does not occur automatically but is also influenced by various factors, such as each participant’s motivation, the quality of instruction during training, and, finally, the support from the community where the trainees reside [10]. Consequently, evaluating the effectiveness of training programs requires an approach capable of capturing the complexity of the relationships among these factors.

2.2. Structural Equation Modeling (SEM)

SEM is a method frequently used in quantitative social research due to its ability to model latent constructs and causal relationships among the factors under study [14]. An SEM model consists of two main components: the measurement model and the structural model. The measurement model for a reflective construct can be expressed as Equation (1),
x = Λ x ξ + δ ,   y = Λ y η + ε ,
where x and y are vectors of observed variables, while ξ and η are exogenous and endogenous latent variables, respectively; Λ x and Λ y are factor loading matrices; and δ and ε are measurement errors. The relationships among latent constructs in the structural model can be expressed as Equation (2),
η = B η + Γ ξ + ζ ,
where B is the coefficient matrix for the relationships among endogenous constructs, Γ is the matrix of effects of exogenous constructs on endogenous constructs, and ζ is the structural residual. In practice, component-based approaches such as Partial Least Squares Structural Equation Modeling (PLS-SEM) are often used when the primary objective is prediction and when the assumption of a multivariate normal distribution is not fully met [31,32].

2.3. Individual, Instructional, and Environmental Factors as Determinants of Training Performance

The effectiveness and success of a training program are greatly influenced by various factors. Common factors identified in the literature include participant characteristics, the quality of instructional design, and organizational support.

2.3.1. Participant Individual Factors

The individual characteristics of each training participant are the primary factors influencing the learning process. Variables such as motivation, participants’ prior competencies, knowledge levels, and attitudes toward the training play a significant role in determining the extent to which participants can grasp and internalize the training material provided. Participants’ motivation influences the intensity and stability of their learning; prior competencies determine their capacity to understand; and participants’ attitudes toward the training influence their openness to the behavioral changes expected from it [33,34].
Individual participant variables can be viewed as latent constructs, as these variables cannot be directly observed or measured. These variables are represented by specific indicators that reflect participants’ psychological and cognitive conditions. This approach allows researchers to separate theoretical concepts from measurement errors, thereby yielding more reliable results regarding the characteristics of each individual.

2.3.2. Instructional Factors in Training

In addition to participants’ individual character factors influencing the effectiveness of a training program, the instructional aspect of the program includes various aspects, ranging from the competence of the training instructors, the depth of the material presented, the clarity of the training objectives and focus, to the appropriateness of the methods used to deliver the training content [35]. Factors such as the competence of the training instructor play a role in the depth of the material and the clarity with which it can be conveyed to the trainees, while factors such as the appropriateness of the methods determine how knowledge and skills can be processed by the participants; furthermore, appropriate methods also play a role in maintaining participant motivation throughout the training process [36,37].

2.3.3. Organizational and Workplace Factors

The success of training is not only measured by knowledge transfer but also by the extent to which training outcomes can be applied and implemented in broader contexts. Therefore, factors such as support from the local community, interaction with other individuals in the training, availability of facilities, and the work environment are contextual factors that can influence the implementation of new competencies and behavioral changes introduced through training [38,39]. Based on organizational systems theory, the work environment can serve as either a supporting or hindering mechanism for implementing new behaviors in actual conditions. Without adequate organizational and structural support, the competencies or habits introduced through training may not be optimally implemented in daily practice [40].

2.4. Fundamentals of Machine Learning

Machine learning problems can be formulated as the task of estimating a predictive function f : R p R based on random data pairs X Y [41]. The primary objective of this process is to minimize the expected risk; mathematically, this process is presented in Equation (3).
R ( f ) = E [ ( Y f ( X ) ) 2 ] ,
using the criterion of the optimal solution with minimum mean squared error, given by the conditional regression function f * ( x ) = E [ Y X = x ] . Since the population distribution is unknown, the estimation is performed by minimizing the empirical risk presented in Equation (4),
R ^ n ( f ) = 1 n i = 1 n ( y i f ( x i ) ) 2 , f ^ = a r g   m i n f F   R ^ n ( f ) ,
where F is the chosen function class. The complexity of this chosen function class largely determines the model’s ability to approximate the nonlinear structures that may appear in the data. The main difference between parametric and non-parametric models lies in the structure of the function class F . Linear models restrict the chosen function form to simple additive structures, whereas ML approaches such as Artificial Neural Networks or ensemble trees extend the function to non-linear compositions or aggregations of basic models [42,43] as shown in Equation (5),
f ^ ( x ) = 1 B b = 1 B T b ( x ) .
Prediction performance is determined by the balance between bias and variance, so regularization is often used in the form of the optimization presented in Equation (6).
f ^ = a r g   m i n f F R ^ n ( f ) + λ Ω ( f ) ,
which controls the model’s complexity and improves its ability to generalize to new data.

2.5. Blue Economy

The blue economy is an economic development paradigm that emphasizes the sustainable utilization of aquatic resources while preserving environmental balance [44]. This concept arose in response to widespread overexploitation of aquatic resources, which jeopardizes the long-term viability of communities that rely on aquatic ecosystems. The Blue Economy describes how an economic system based on natural resources in aquatic environments can contribute value to the economy when properly exploited, while ensuring the survival of the aquatic environment [45].
The Blue Economy is an ecosystem-based economic system in which all economic activities are intended to limit the capacity and carrying capacity of the local aquatic environment. This notion focuses on the use of natural resources in aquatic environments, ensuring that use does not exceed the ecosystem’s capacity to regenerate. As a result, economic operations cannot be based solely on short-term profits; they must also consider the long-term implications for aquatic ecosystems, ensuring that natural resources in aquatic areas are used sustainably over time [45]. Blue economy activities include sustainable fishing systems, water quality management, ecotourism, and the repurposing of aquatic waste as a resource or alternative energy source.

2.6. Circular Economy

The circular economy is an economic concept that aims to create an efficient cycle of production and consumption by promoting the sustainable reuse of resources [46]. Unlike the linear economy, which operates on a “take-make-dispose” basis, the circular economy employs a closed-loop economic system approach, in which waste from one operation is repurposed as input for another. This method seeks to reduce natural resource exploitation, eliminate production and consumer waste, and improve overall economic system efficiency [47].
The Circular Economy is based on three fundamental principles: lowering resource consumption (reduce), reusing (reuse), and recycling. In addition to these three ideas, this notion encourages the recovery of value from items at the conclusion of their life cycle [48]. Thus, implementing these principles not only benefits the environment but also creates new economic prospects through innovation in product design, manufacturing techniques, and appropriate business structures.

2.7. Hypothesis Development

The effectiveness of community-based training programs is influenced by a combination of individual, instructional, and environmental factors. Training effectiveness literature suggests that successful learning outcomes depend not only on training quality but also on participant characteristics and the contextual environment in which acquired knowledge is applied. This is particularly relevant in Blue Economy and Circular Economy capacity-building programs, where long-term behavioral change is required to implement sustainability-oriented practices. Participant Characteristics reflect individual readiness, motivation, prior experience, and learning capability [33,34]. Training transfer theory suggests that participants with stronger motivation and readiness for change are more likely to engage actively in training activities, remain committed to training objectives, and successfully apply acquired knowledge [49]. Therefore:
H1. 
Participant Characteristics positively influence Participant Commitment.
H4. 
Participant Characteristics positively influence Training Performance.
Training Instruction represents the quality of training delivery, including learning materials, trainer competence, instructional methods, and participant engagement. According to adult learning theory, effective instructional design enhances learning experiences, strengthens participant commitment, and improves the application of acquired knowledge [50]. Therefore:
H2. 
Training Instruction positively influences Participant Commitment.
H5. 
Training Instruction positively influences Training Performance.
Organizational and Environmental Factors refer to external conditions that facilitate or constrain the transfer of training outcomes, including institutional support, community involvement, resource availability, and social encouragement. A supportive environment strengthens participant motivation and facilitates the implementation of newly acquired competencies [51]. Therefore:
H3. 
Organizational and Environmental Factors positively influence Participant Commitment.
H6. 
Organizational and Environmental Factors positively influence Training Performance.
Participant Commitment reflects the degree of psychological engagement and willingness to implement knowledge gained from training. Prior studies identify commitment as a key determinant of successful training transfer because committed participants are more likely to sustain learning efforts and translate knowledge into practice [52]. Therefore:
H7. 
Participant Commitment positively influences Training Performance.
Training effectiveness research further suggests that the effects of participant characteristics, instructional quality, and environmental support are often transmitted through psychological mechanisms such as commitment [49,50,51]. Participants who are motivated, receive high-quality instruction, and operate within supportive environments are more likely to develop stronger commitment toward training objectives, which subsequently enhances training outcomes [52]. Accordingly:
H8. 
Participant Commitment mediates the relationship between Participant Characteristics and Training Performance.
H9. 
Participant Commitment mediates the relationship between Training Instruction and Training Performance.
H10. 
Participant Commitment mediates the relationship between Organizational and Environmental Factors and Training Performance.

3. Methods

This study integrates SEM and ML into a single, comprehensive modeling framework. Methodologically, the integration of these two approaches was undertaken to ensure consistency and theoretical validity at the latent construct level, while simultaneously enhancing the overall model’s flexibility and predictive accuracy.

3.1. Study Area and Data Collection

This study was conducted in the Citarum River Basin, West Java, Indonesia, which spans several administrative areas, including Bandung Regency, West Bandung Regency, Sumedang Regency, Bandung City, Cimahi City, Purwakarta Regency, Karawang Regency, and Bekasi Regency, and has become a national priority area for environmental restoration and sustainable development initiatives. The study focused on participants involved in community empowerment programs related to the implementation of Blue Economy and Circular Economy principles within the watershed area. Data collection was conducted between August 2025 and March 2026 following the completion of a series of community-based training programs. The target population consisted of community members who participated in sustainability-related training activities organized as part of environmental improvement and economic empowerment initiatives in the Citarum River Basin.
A structured questionnaire was used as the primary data collection instrument. The questionnaire was developed based on established measurement scales from previous studies on training effectiveness and organizational learning and was adapted to the context of sustainability-oriented community training. All indicators were measured using a five-point Likert scale ranging from 1 (strongly disagree) to 5 (strongly agree). A purposive sampling approach was employed to ensure that respondents possessed direct experience with the training programs being evaluated. A total of 150 valid responses were collected and subsequently used in the SEM v32.0 and Machine Learning analyses. The sample size satisfies the minimum requirements for PLS-SEM v4.1.1.8 analysis and provides sufficient observations for the predictive modeling stage. Prior to data collection, the questionnaire underwent content validation through expert review and pilot testing to ensure clarity, relevance, and contextual suitability. Responses were then screened for completeness and consistency before being included in the final dataset used for analysis.
Table 1 summarizes the principal components of the Blue Economy and Circular Economy training program evaluated in this study. The training combined conceptual knowledge regarding sustainable resource management with community-based learning activities and institutional support mechanisms. These components are reflected in the research model through five latent constructs: Participant Characteristics, Training Instruction, Organizational and Environmental Factors, Participant Commitment, and Training Performance. While the training content focused on Blue Economy and Circular Economy principles, the present study specifically investigates the factors that influence the effectiveness of the training and its capacity-building outcomes. Accordingly, Training Performance represents the extent to which participants perceive improvements in their understanding, competencies, and readiness to support sustainability-oriented practices, whereas Participant Commitment reflects their willingness to engage with and apply the knowledge acquired during the training process.

3.2. Data

The dataset used in this study consisted of 150 valid responses collected from participants involved in Blue Economy and Circular Economy training programs implemented in the Citarum River Basin. Each respondent represented a community member who had completed the capacity-building program and subsequently evaluated the training experience through a structured questionnaire. The questionnaire measured five latent constructs: Participant Characteristics, Training Instruction, Organizational and Environmental Factors, Participant Commitment, and Training Performance. A total of 19 indicators were used to represent these constructs, and all indicators were measured using a five-point Likert scale ranging from 1 (strongly disagree) to 5 (strongly agree).
As summarized in Table 2, the questionnaire consisted of five latent constructs measured using 19 reflective indicators. Participant Characteristics (IP), Training Instruction (PEL), Organizational and Environmental Factors (OL), and Participant Commitment (KP) were each measured using four indicators, while Training Performance (KI) was measured using three indicators. All construct measurements were collected using a five-point Likert scale ranging from 1 (strongly disagree) to 5 (strongly agree). Prior to analysis, the collected data were screened for completeness and consistency. Responses with missing values or incomplete information were excluded from the analysis. The resulting dataset was subsequently used for both the PLS-SEM and machine learning stages. In the PLS-SEM stage, the observed indicators were used to estimate and validate the latent constructs. The validated latent variable scores were then extracted and utilized as input features for the machine learning models to improve predictive performance. For mathematical formulation, let the validated dataset consist of n observations, where each observation corresponds to one training participant. Each participant is represented by a vector of observed indicator values,
x i = ( x i 1 , x i 2 , , x i p ) ,
where p is the total number of indicators representing three exogenous latent constructs (individual, instructional, organizational) and one endogenous latent construct (training performance). The data used are on a Likert scale and were therefore treated as continuous numerical variables in the PLS-SEM-based estimation. Prior to analysis, data completeness checks, outlier detection, and variable standardization were performed to ensure the stability of the estimates.

3.3. Theoretical Rationale of the SEM–ML Integration

The integration of SEM and Machine Learning in this study is motivated by the complementary strengths of explanatory and predictive modeling approaches. SEM is particularly effective for validating theoretical relationships among latent constructs and ensuring construct reliability and validity. However, SEM is not primarily designed for maximizing predictive accuracy. Conversely, machine learning algorithms excel at prediction but often operate as data-driven models with limited theoretical interpretability. By using latent variable scores generated from SEM as machine learning inputs, the proposed framework combines the strengths of both approaches. SEM serves as a theory-guided feature extraction mechanism, transforming multiple observed indicators into theoretically meaningful latent representations. These latent representations are subsequently utilized by Random Forest and Artificial Neural Network models to improve predictive performance while preserving conceptual interpretability. Therefore, the SEM–ML framework should not be viewed merely as a sequential analytical procedure but as an integrated approach that bridges explanatory modeling and predictive analytics.
In the context of sustainability-oriented training programs, this integrated framework enables researchers to identify theoretically validated determinants of training effectiveness while simultaneously assessing their predictive relevance. Consequently, the proposed approach provides a more comprehensive evaluation of post-training capacity-building outcomes than would be achieved through explanatory or predictive methods alone.

3.4. SEM Model Specifications

SEM model consists of two main components: the measurement model and the structural model. In the measurement model, for each exogenous latent construct ξ k , its reflective indicators are expressed as Equation (8),
x i k = Λ k ξ i k + δ i k ,
where Λ k is the factor loading vector, δ i k   is the measurement error, and E [ δ i k ] = 0 . Then, for the endogenous latent construct η, the measurement model is expressed as Equation (9),
y i = Λ y η i + ε i ,
The assumption of reflectivity implies that the covariance among indicators is explained by the variance of the underlying latent construct. For the structural model, the relationships among latent variables are formulated as a linear regression model at the latent level, as presented in Equation (10),
η i = γ 1 ξ 1 i + γ 2 ξ 2 i + γ 3 ξ 3 i + ζ i ,
where γ k   is the path coefficient, ζ i is the structural error term with E [ ζ i ] = 0 , and is assumed to be uncorrelated with the exogenous constructs. This model allows for the estimation of the direct effects of each construct on training performance.

3.5. Estimation Procedure

The estimation was performed using the Partial Least Squares (PLS) approach, which optimizes the explained variance of the endogenous variables. Iteratively, the PLS algorithm constructs latent scores as linear combinations of the indicators presented in Equation (11),
ξ ^ k i = w k x i k ,
where w k is the estimated weight obtained through the alternating least squares procedure. The measurement model was then evaluated using several criteria, including convergent validity, composite reliability, and discriminant validity. The structural model evaluation included path coefficient estimates, bootstrap-based significance tests, and the coefficient of determination R 2   or the endogenous construct [53,54].

3.6. SEM Model Evaluation

The SEM evaluation in this study was conducted in stages. There are two aspects of SEM model evaluation: first, measurement model evaluation; and second, structural model evaluation. These two aspects were evaluated to ensure that the latent variables used in this study are statistically valid and reliable. Additionally, the evaluation was conducted to ensure that the constructs developed can represent causal relationships consistent with the established theoretical framework. Table 3 shows the SEM model testing criteria used in this study.
Table 3 presents the evaluation criteria adopted in this study for assessing the quality of the PLS-SEM model. Because several alternative evaluation criteria have been proposed in the PLS-SEM literature, this study selected the most widely recommended and commonly applied measures for evaluating reflective measurement models and structural relationships [A]. Convergent validity was assessed using factor loadings and Average Variance Extracted (AVE) to ensure that the indicators adequately represented their respective latent constructs. Discriminant validity was evaluated using both cross-loadings and the Heterotrait–Monotrait Ratio (HTMT), with HTMT included because it has been widely recommended as a more sensitive criterion for detecting discriminant validity issues than traditional approaches [B]. Reliability was assessed using Cronbach’s Alpha and Composite Reliability to examine the internal consistency of the measurement model. For the structural model, explanatory power was evaluated using the coefficient of determination (R2), while predictive relevance was assessed using the Stone–Geisser Q2 statistic. Finally, the significance of the structural relationships was examined using bootstrapping, whereas mediation effects were evaluated using indirect effects and the Variance Accounted For (VAF) criterion.

3.7. Machine Learning Model

After obtaining latent-construct scores using the SEM approach, the next step is to apply ML algorithms to model the nonlinear relationships between the latent constructs and the dependent variables. The use of ML in this study aims to improve the model’s predictive power. In this study, two ML algorithms were used: Random Forest (RF) and Artificial Neural Network (ANN).

3.7.1. Random Forest

Random Forest is a decision-tree-based ensemble learning method that works by building a large number of decision trees and combining the predictions from each tree to produce a final prediction [54]. Mathematically, the Random Forest model can be expressed as Equation (12),
f ^ z = 1 T t = 1 T f t z ,
where T is the number of decision trees in the forest, f t ( z ) is the prediction from the t-th tree, and z is the latent construct score vector. Each tree is constructed using a subset of data selected at random via bootstrap sampling, as well as a subset of features selected at random at each node. This approach is known as bagging (bootstrap aggregating), which aims to reduce model variance and improve prediction stability [54,55,56].

3.7.2. Artificial Neural Network (ANN)

ANN is a machine learning algorithm inspired by biological neural networks. This algorithm consists of an input layer, hidden layers, and an output layer [57]. ANNs have the ability to model complex nonlinear relationships through a combination of nonlinear transformations and activation functions. Mathematically, an ANN model with a single hidden layer can be expressed as Equation (13),
f ( z ) = σ W 2 σ ( W 1 z + b 1 ) + b 2 ,
let z be the input, W 1 , W 2 be the weight matrices, b 1 , b 2 be the biases, and σ ( ) e the nonlinear activation function. Commonly used activation functions include ReLU (Rectified Linear Unit) and sigmoid, which allow the model to capture nonlinear relationships in the data. Model parameters are estimated via the backpropagation algorithm by minimizing the loss function using optimization methods such as gradient descent.

3.8. Integration with Machine Learning

Once the SEM model has been validated and the latent scores have been obtained, those scores are then used as input for the machine learning algorithm. Mathematically, this process is presented in Equation (14),
z i = ( ξ ^ 1 i , ξ ^ 2 i , ξ ^ 3 i ) ,
where ξ ^ 1 i , ξ ^ 2 i , ξ ^ 3 i are the latent scores for each latent variable in the SEM model. The predictive model in this study is presented in Equation (15),
y ^ i = f ( z i ) ,
where f is a nonlinear function estimated from the function class F . The estimated function is obtained by minimizing the empirical risk presented in Equation (16),
f ^ = a r g   m i n f F 1 n i = 1 n ( y i f ( z i ) ) 2 .
In this study, the class of functions F is represented by random forests and artificial neural networks, which are capable of capturing nonlinear interactions among latent constructs. This integration can be viewed as a two-stage transformation composition as presented in Equation (17),
x i SEM ξ ^ i ML y ^ i .
The first transformation is theory-driven, while the second is data-driven. Although the dataset consists of 150 observations, the machine learning models were developed using SEM-derived latent variable scores rather than the full set of questionnaire indicators. This approach substantially reduced data dimensionality, resulting in only four theoretically validated input features. Accordingly, the machine learning component was intended to complement the explanatory SEM analysis by exploring predictive capability rather than developing a large-scale predictive system.

3.9. Model Training and Evaluation

Once the machine learning model and its integration with SEM have been determined, the next steps are hyperparameter tuning, model training, and finally, model performance evaluation. These three steps are designed to ensure that the resulting model does not overfit—a condition in which the model is accurate only during training and performs poorly when applied to previously unseen data. Model training in this study was conducted using k-fold cross-validation. In this approach, the dataset is divided into 10 mutually exclusive subsets; in each iteration, one subset serves as the test set, while the remaining 9 serve as the training set. This process is repeated 10 times so that each data subset serves as test data exactly once. During the training process, the model is estimated by minimizing the function presented in Equation (18),
f ^ = a r g   m i n f F 1 n i = 1 n L ( y i , f ( z i ) ) + λ Ω ( f ) ,
where L ( ) is the loss function, Ω ( f ) is the regularization function, λ   is the regularization parameter that controls the model’s complexity, and z i   is the latent construct score vector.
In this study, hyperparameter tuning was performed using a grid search approach. This approach systematically tests various hyperparameter combinations and selects the best configuration based on the evaluation criteria. For the Random Forest algorithm, the configured parameters include the number of trees, the maximum tree depth, and the number of nodes considered at each split. For the ANN, the parameters include the number of neurons per layer, the number of hidden layers, the learning rate, and the activation function.
Finally, to evaluate the model’s performance, several prediction accuracy metrics were used. The metrics used include Mean Squared Error (MSE), Root Mean Squared Error (RMSE), and the coefficient of determination ( R 2 ). MSE is used to measure the average squared error between the actual values and the predicted values, which is mathematically expressed in Equation (19),
M S E = 1 n i = 1 n ( y i y ^ i ) 2 .
RMSE is the square root of MSE, which expresses the error in the same units as the dependent variable,
R M S E = 1 n i = 1 n ( y i y ^ i ) 2 .
Meanwhile, the coefficient of determination R2 is used to measure the proportion of variance in the dependent variable that can be explained by the model, as expressed in Equation (21),
R 2 = 1 i = 1 n ( y i y ^ i ) 2 i = 1 n ( y i y ˉ ) 2 .

4. Result

This section describes the results obtained from the study. It includes SEM model estimates, validity and reliability test results, structural model evaluation, machine learning model results, and concludes with a performance comparison of each model examined in the study.

4.1. SEM Model Measurement

In this study, the model measurement stage was conducted by testing the validity and reliability of the indicators that form the constructs in the model. Validity testing consisted of convergent validity testing, using factor loadings and AVE. Discriminant validity was tested using cross-loading parameters, and reliability testing was conducted using Cronbach’s alpha and composite reliability values.

4.1.1. Convergent Validity

The purpose of a validity test is to determine whether a research instrument is valid. Specifically, in a convergent validity test, the objective is to assess the correlation among indicators within a single construct. The criterion for convergent validity is met when indicators within a construct are correlated with one another. In this study, the data used were questionnaire responses from a sample of 150 respondents. These data were then used as input for the SEM model developed in this study. Table 4 shows the results of the convergent validity test for the SEM model developed in this study.
The factor loadings for each indicator shown in Table 4 are greater than 0.6; therefore, based on the criteria outlined in Table 3, these indicators meet the convergent validity criterion. In exploratory research, a cutoff of 0.6 for factor loading values is appropriate for convergent validity. Following the factor loadings, convergent validity was evaluated using AVEs; the results are presented in Table 5.
The AVE values shown in Table 5 are greater than the cutoff criterion for convergent validity, which is 0.5. Thus, based on the factor loadings and AVE values obtained, it can be concluded that the measurement model developed in this study meets the criteria for convergent validity.

4.1.2. Discriminant Validity

Following the convergent validity test, a discriminant validity test was conducted to ensure that each latent construct in the SEM model shows clear distinctions from the others. The criterion for discriminant validity is met when the indicators within a single construct show higher correlations with the latent construct they measure than with other constructs. To test discriminant validity in this study, the cross-loading criterion was used. This procedure involved comparing the loadings of each indicator on the construct it measures with those on other constructs. The cross-loadings for all indicators used in this study are presented in Table 6.
The cross-loading values in Table 6 indicate that all indicators used in this study have the highest loading values on the constructs they measure. These loading values are highlighted in yellow in the table. Thus, based on the results of the cross-loading test, it can be concluded that the criteria for discriminant validity have been met. In addition to the cross-loading criterion, discriminant validity was further assessed using the Heterotrait–Monotrait Ratio (HTMT). Recent methodological studies have recommended HTMT as a more sensitive and reliable approach for detecting discriminant validity issues compared to traditional methods such as cross-loadings and the Fornell–Larcker criterion. An HTMT value below 0.85 indicates that two latent constructs are empirically distinct and measure different conceptual domains. The HTMT results for all construct pairs are presented in Table 7. The results show that all HTMT values are below the recommended threshold of 0.85, indicating satisfactory discriminant validity. These findings confirm that each latent construct captures a unique aspect of training effectiveness and that there is no evidence of excessive overlap among the constructs included in the model.

4.1.3. Reliability

Following the validity test, the reliability test in this study was conducted to assess the consistency of an indicator in measuring the latent construct present in the research model. Reliability was evaluated using Cronbach’s Alpha and Composite Reliability. A construct is considered reliable when its Cronbach’s Alpha and Composite Reliability values are greater than 0.6. In exploratory research, a cutoff of 0.6 is appropriate. The Composite Reliability values for each latent variable in this research model are presented in Table 8.
The composite reliability values shown in Table 8 exceed the required minimum of 0.6. This indicates that the latent variables used meet one of the criteria for reliability. For the next reliability criterion—Cronbach’s Alpha for each latent variable—see Table 9.
Based on the Cronbach’s Alpha values presented in Table 9, all latent constructs have values above the minimum threshold of 0.6 required for reliability. These results indicate that the latent variables in this study have met all reliability criteria. Thus, the results of the measurement model based on three test parameters—factor loadings, Average Variance Extracted (AVE), and Composite Reliability and Cronbach’s Alpha—indicate that the model has met the criteria for validity and reliability.

4.1.4. Common Method Bias Assessment

Since all constructs were measured using a self-administered questionnaire collected from the same respondents at a single point in time, the possibility of common method bias (CMB) was assessed. The full collinearity variance inflation factor (VIF) approach was employed to evaluate whether common method bias could potentially inflate the observed relationships among constructs. Full collinearity VIF values below 3.3 indicate that common method bias is unlikely to be a serious threat to the validity of the model [58]. Table 10 presents the full collinearity VIF values for all latent constructs.
The results show that all VIF values are below the recommended threshold of 3.3. Therefore, common method bias does not appear to significantly affect the data, suggesting that the observed relationships among the constructs are unlikely to be attributable to measurement method effects.

4.2. Structural Model Evaluation

Following validity and reliability assessment, a structural model evaluation was conducted in this study. This evaluation analyzed the R-squared values for each endogenous variable to assess the predictive ability of the structural model. The R-Square value indicates the proportion of the dependent variable’s variance that can be explained by the latent variables in the model. Changes in the R-Square value indicate a significant influence of certain exogenous variables on the endogenous variables. In addition to R-Square, this study conducted significance tests for the relationships among latent variables using bootstrapping. This process was used to obtain test statistics and significance levels for the model’s parameters.

4.2.1. R-Square

The R-squared value of a latent variable is one of the most commonly used measures to assess the predictive power of a structural model. The R-squared value indicates the percentage of variance in the dependent variable explained by the independent variables in the same model. R-squared values of 0.75, 0.50, and 0.25 serve as thresholds for classifying a model as strong, moderate, or weak. Table 11 shows the R-squared values for each endogenous latent variable in the SEM model.
Table 11 shows the R-squared values for each endogenous variable in the SEM model. The following provides a more detailed explanation of each R-squared value obtained in this study.
(1)
The R-squared value for the Participant Commitment variable is 0.532, which is classified as moderate. This indicates that 53.2% of the variance in the Participant Commitment variable is explained by the model variables, while the remaining 46.8% is explained by variables not included in the model.
(2)
The R-squared value for the Training Performance variable is 0.581, or classified as moderate. This indicates that 58.1% of the variance in the Training Performance variable is explained by the model variables, with the remaining 41.9% by other variables not included in the model.

4.2.2. Predictive Relevance

The predictive relevance of the structural model was evaluated using the Stone–Geisser Q2 statistic obtained through the blindfolding procedure with an omission distance of 7. Unlike the coefficient of determination (R2), which measures the explanatory power of the model, Q2 assesses its predictive relevance for endogenous constructs. A Q2 value greater than zero indicates that the model has predictive relevance, whereas higher values indicate stronger predictive capability.
As presented in Table 12, both endogenous constructs produced positive Q2 values, indicating that the proposed structural model possesses predictive relevance. Participant Commitment achieved a Q2 value of 0.156, while Training Performance obtained a Q2 value of 0.289. According to the recommended guidelines, both values indicate a moderate level of predictive relevance. Furthermore, the higher Q2 value for Training Performance suggests that the structural model exhibits stronger predictive capability for Training Performance than for Participant Commitment. These findings complement the R2 results by demonstrating that the model not only explains the relationships among the latent constructs but also possesses satisfactory predictive capability. The positive Q2 values further support the suitability of the latent variable scores generated by the PLS-SEM model as input features for the subsequent machine learning models.

4.2.3. Significance Level

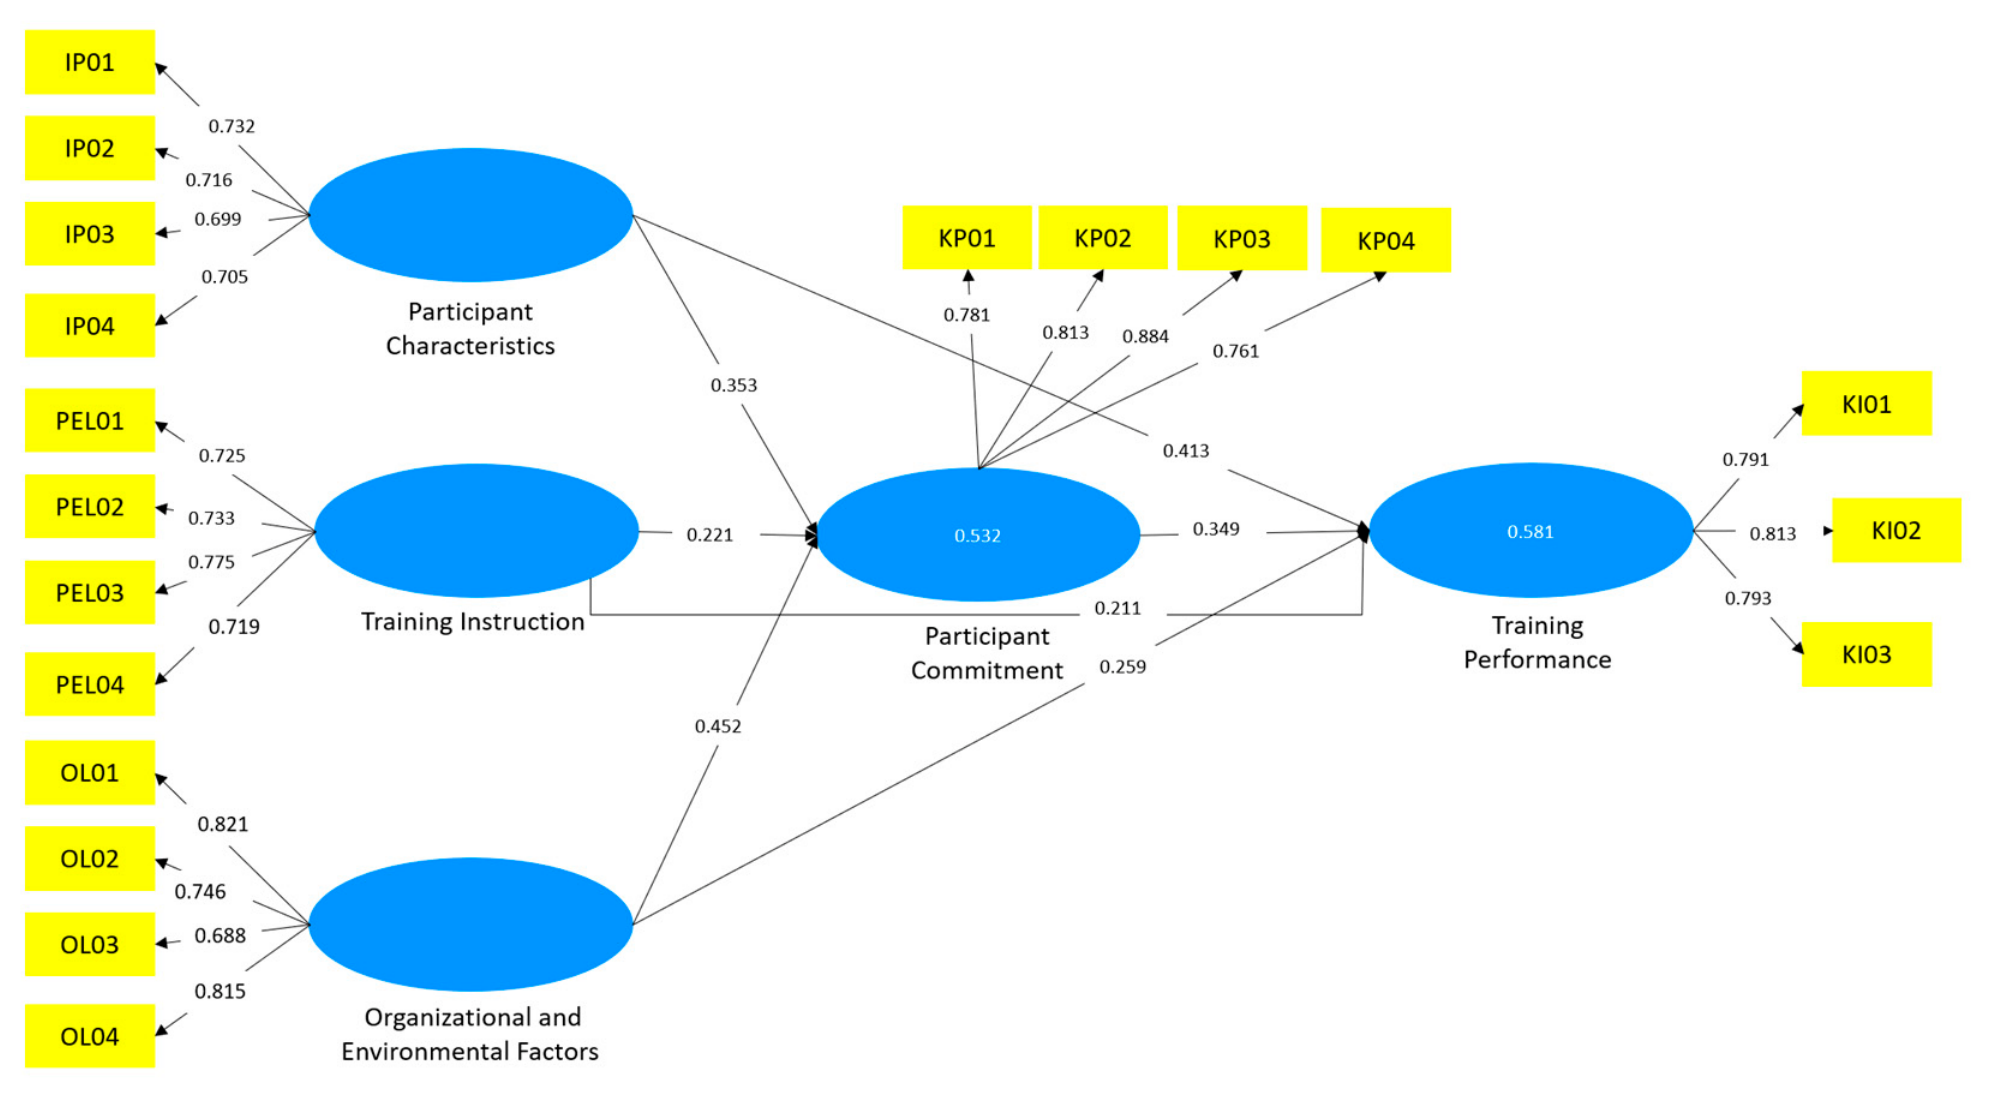
The final step in the structural model evaluation is assessing the significance level of the relationships between latent variables in the model through the bootstrapping process. In this study, a significance level of 5% was used. Before interpreting the significance test results, the PLS algorithm’s model estimation results are presented. The PLS output is used to estimate the magnitudes of the path coefficients between latent variables in the research model. Figure 1 presents the output of the PLS-SEM model constructed in this study.
Figure 1 shows the path diagram for the model developed in this study. In addition, Figure 1 also illustrates the path coefficients between the latent variables in the model developed in this study. More specifically, the estimated path coefficients for the model are presented in Table 13.
Based on the path coefficients and p-values presented in Table 13, the following conclusions can be drawn:
(1)
Participant Characteristics and Participant Commitment
H1. Participant Characteristics have a positive effect on Participant Commitment. Based on the table, the p-value is 0.000 and the path coefficient is 0.353. Since the p-value is <0.05, H1 is accepted, meaning the Participant Characteristics variable has a positive effect on Participant Commitment.
(2)
Training Instruction on Participant Commitment.
H2. Training Instruction has a positive effect on Participant Commitment. Based on the table, the p-value is 0.000 and the path coefficient is 0.221. Since the p-value is <0.05, H2 is accepted, meaning the Training Instruction variable has a positive effect on Participant Commitment.
(3)
Organizational and Environmental Factors on Participant Commitment
H3.Organizational and Environmental Factors have a positive effect on Participant Commitment. Based on the table, the p-value is 0.000 and the path coefficient is 0.452. Since the p-value is <0.05, H3 is accepted, meaning that the Organizational and Environmental Factors variable has a positive effect on Participant Commitment.
(4)
Participant Characteristics on Training Performance
H4. Participant Characteristics have a positive effect on Training Performance. Based on the table, the p-value is 0.000 and the path coefficient is 0.413. Since the p-value is <0.05, H4 is accepted, meaning the Participant Characteristics variable has a positive effect on Training Performance.
(5)
Training Instruction on Training Performance
H5. Training Instruction has a positive effect on Training Performance. Based on the table, the p-value is 0.000 and the path coefficient is 0.211. Since the p-value is <0.05, H5 is accepted, meaning the Training Instruction variable has a positive effect on Training Performance.
(6)
Organizational and Environmental Factors on Training Performance
H6. Organizational and Environmental Factors have a positive effect on Training Performance. Based on the table, the p-value is 0.000 and the path coefficient is 0.259. Since the p-value is <0.05, H6 is accepted, meaning the Organizational and Environmental Factors variable has a positive effect on Training Performance.
(7)
Participant Commitment on Training Performance
H7. Participant Commitment has a positive effect on Training Performance. Based on the table, the p-value is 0.000 and the path coefficient is 0.349. Since the p-value is <0.05, H7 is accepted, meaning that the Participant Commitment variable has a positive effect on Training Performance.

4.2.4. Indirect Effect

Mediation analysis was conducted to determine the extent to which an exogenous variable influences an endogenous variable through an intermediate variable. The intermediate variable, or mediator, serves to bridge the causal relationship between the independent and dependent variables in the research model. The results of the mediation effect tests in this study are presented in Table 14, which includes the p-values, t-statistics, and the magnitude of the indirect effect for each tested relationship.
Based on the statistical values of the mediation test presented in Table 14, the following conclusions can be drawn:
(1)
Participant Characteristics on Training Performance via Participant Commitment
H8. Participant Characteristics influence Training Performance via Participant Commitment. Based on the table, the p-value is 0.000 and the indirect effect is 0.385. H8 is accepted, indicating an indirect effect through the mediation model of the influence of Participant Characteristics on Training Performance via Participant Commitment.
(2)
Training Instruction on Training Performance via Participant Commitment
H9. Training Instruction influences Training Performance via Participant Commitment. Based on the table, the p-value is 0.000 and the indirect effect is 0.252. H9 is accepted, meaning there is an indirect effect through the mediation model of the influence of Training Instruction on Training Performance via Participant Commitment.
(3)
Organizational and Environmental Factors on Training Performance via Participant Commitment
H10. Organizational and Environmental Factors influence Training Performance via Participant Commitment. Based on the table, the p-value is 0.000 and the indirect effect is 0.421. H10 is accepted, meaning there is an indirect effect through the mediation model of Organizational and Environmental Factors on Training Performance via Participant Commitment.

4.2.5. Mediation Analysis

To further evaluate the mediating role of Participant Commitment, mediation analysis was conducted using indirect effect significance testing and the Variance Accounted For (VAF) approach. While the significance of indirect effects confirms the presence of mediation, VAF quantifies the extent of mediation and classifies it as no mediation (<20%), partial mediation (20–80%), or full mediation (>80%). The VAF values were calculated as the ratio of the indirect effect to the total effect. Table 15 presents the direct effects, indirect effects, total effects, and VAF values for the mediation relationships examined in this study.
The mediation analysis results indicate that Participant Commitment partially mediates the relationships between Participant Characteristics, Training Instruction, Organizational and Environmental Factors, and Training Performance. The VAF values ranged from 48.25% to 61.91%, suggesting that a substantial proportion of the effects of the antecedent variables on Training Performance is transmitted through Participant Commitment. However, because all VAF values remained below 80%, the direct effects of the antecedent variables on Training Performance were still significant, confirming the presence of partial rather than full mediation. The significance of the identified determinants should be interpreted within the specific context of Blue Economy and Circular Economy training programs. While the constructs themselves are commonly used in training effectiveness studies, their relevance in sustainability-oriented community programs differs from conventional organizational training environments. Participants in the present study were expected not only to acquire knowledge but also to develop the capacity and commitment necessary to support sustainability-related practices within their communities. Therefore, the findings contribute to understanding how established training effectiveness factors operate within environmental and community-based development initiatives.

4.3. Machine Learning

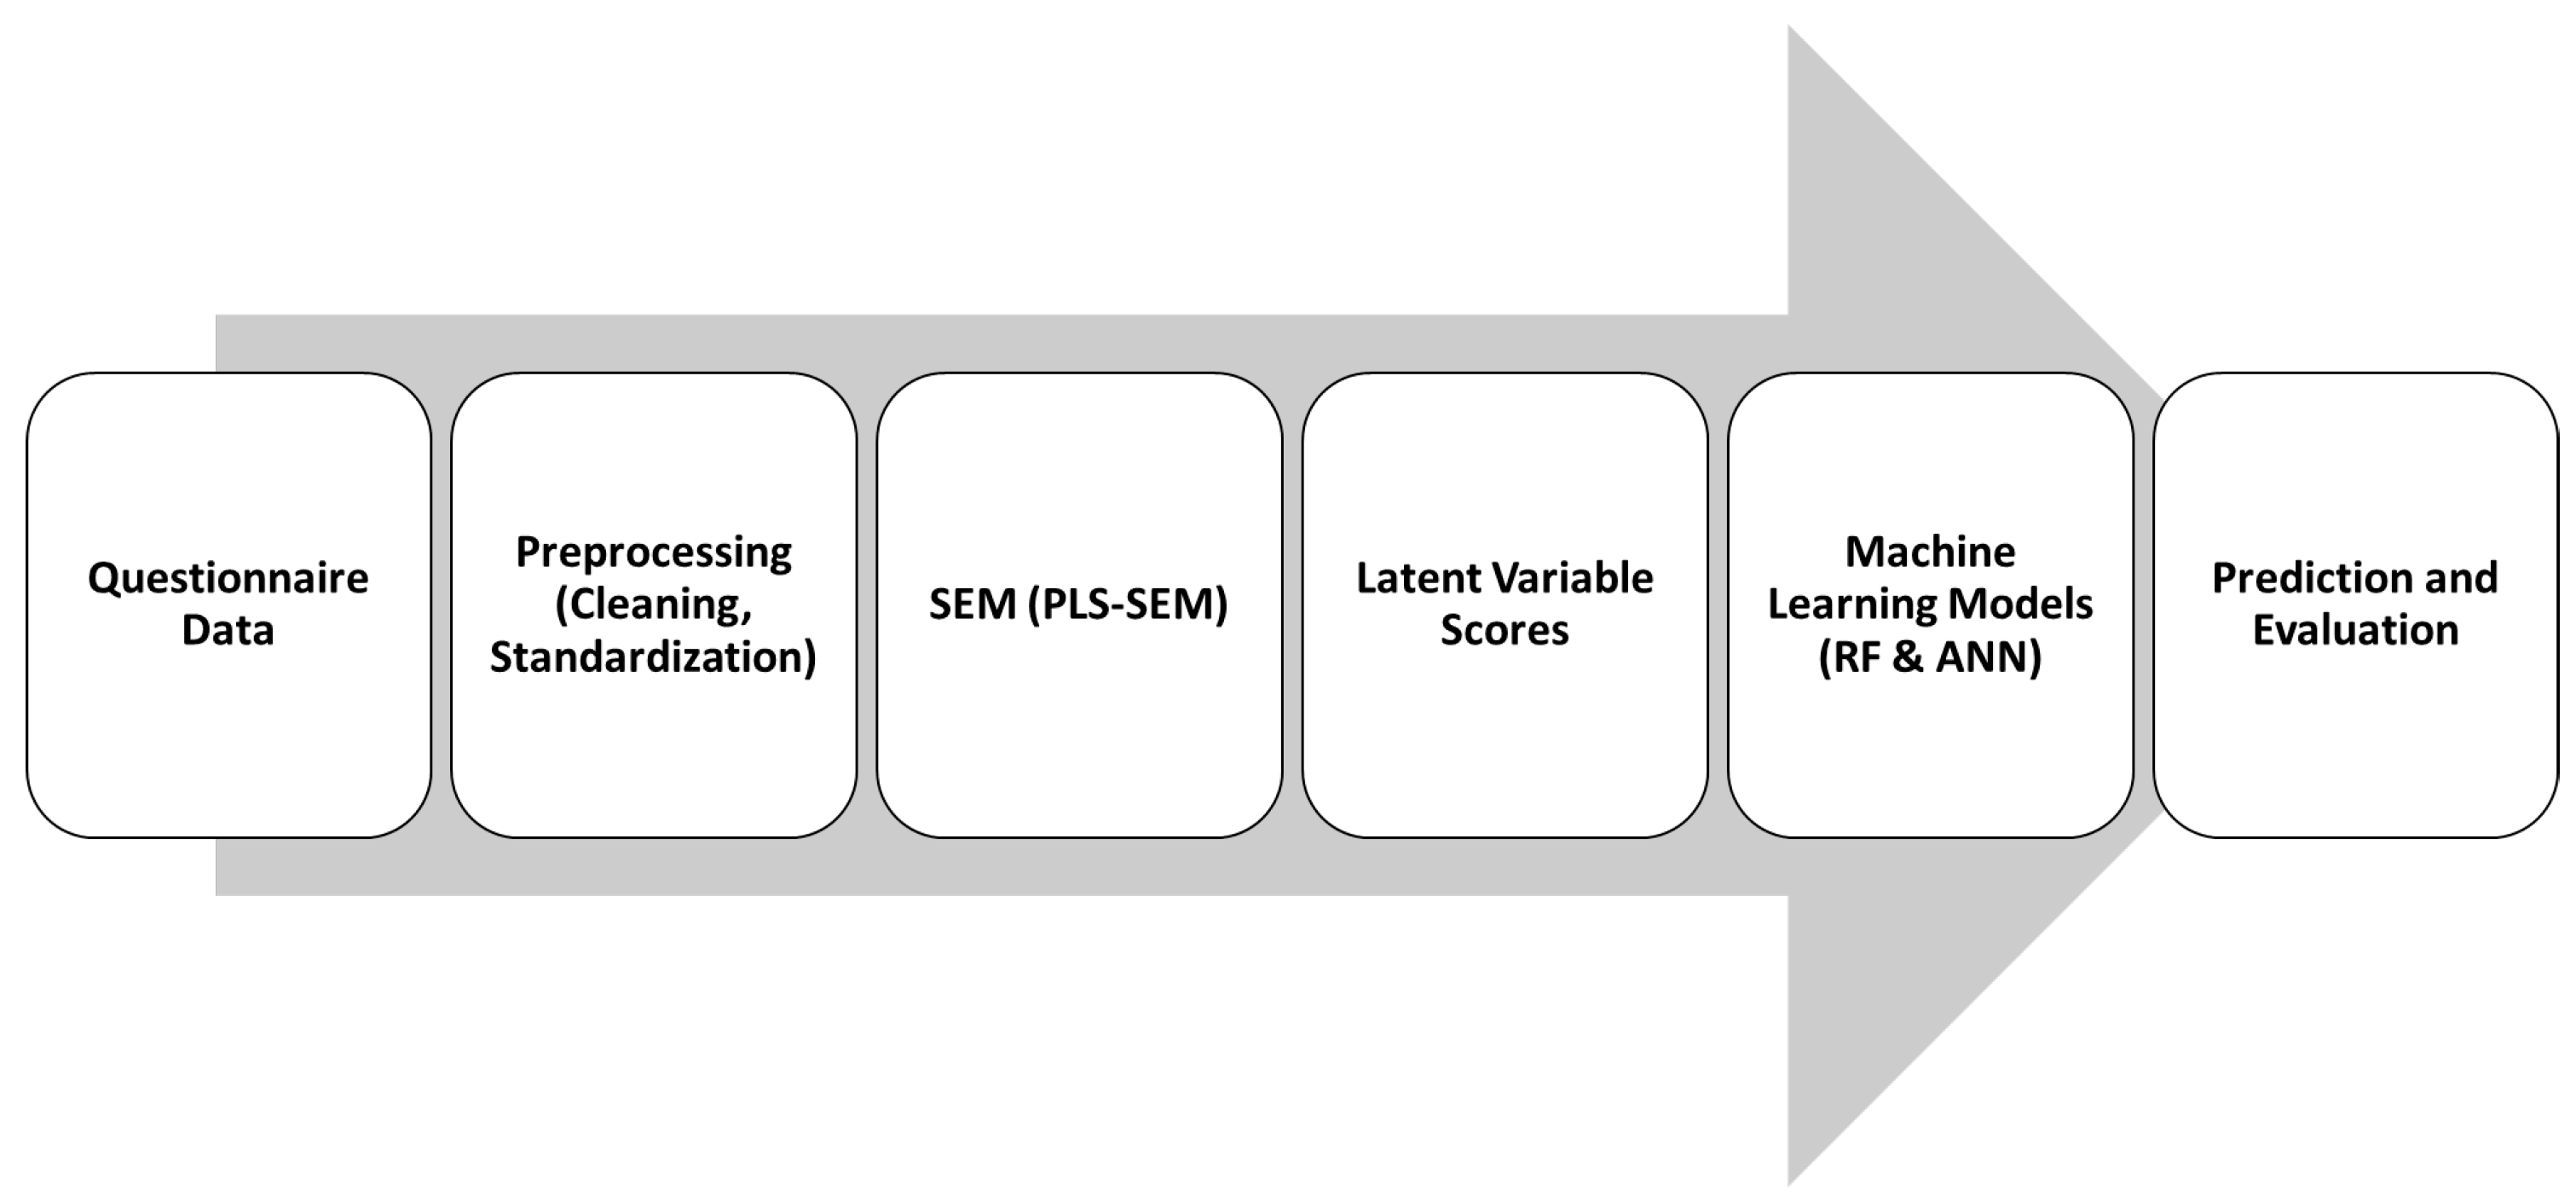
In this study, a machine learning approach was used to improve the model’s predictive capabilities. The previously developed SEM model was linear and therefore unable to capture potential nonlinear relationships among latent constructs. SEM was integrated with ML to address this issue. Once the SEM model was obtained, the latent scores generated by the SEM were used as input to the ML model for prediction. The general flow of the SEM-ML implementation in this study is presented in Figure 2.
As shown in Figure 2, the modeling process in this study was conducted in two stages of transformation. The first stage involved theory-based transformation using SEM to generate latent constructs. The second stage involved data-based transformation using machine learning to estimate nonlinear relationships. This approach was adopted to enhance the representational power of the variables while maintaining the theoretical model’s consistency.

4.3.1. Model Specification

In this study, hyperparameter tuning was performed using a grid search approach. This process was conducted to identify the combination of model parameters that yields the best performance. In the grid search process, the search space was defined for each parameter of the ML algorithm used in this study. The search space for the grid search process in this study is presented in Table 16.
The search space in Table 16 is designed to cover a wide range of model complexities. As in Random Forest, the number of trees, maximum depth, and feature subsampling parameters are varied to control model capacity, reduce overfitting, and enhance diversity among trees within the ensemble. In ANN, variations in model architecture and learning rate are used to control model complexity and training stability. A grid search is then performed by combining all possible parameter values within the search space. Each combination is then evaluated using a 10-fold cross-validation scheme. The parameter combination with the lowest MSE value is then selected as the final parameters for this study. The selected parameters are presented in Table 17.
Based on Table 17, the Random Forest model with a relatively large number of trees (500) and no tree depth restrictions indicates that the data structure exhibits fairly complex patterns. In the ANN model, it was found that a two-hidden-layer architecture with 16 and 8 neurons is the best for predicting without overfitting. Regarding the activation function, it was found that using ReLU can help address the vanishing gradient problem during training. The ANN model performed best with a learning rate of 0.001. Furthermore, this very tiny amount increased the stability of the training process, albeit at a slower rate. Overall, the parameter tweaking results show that increasing model complexity does not always lead to higher prediction accuracy.

4.3.2. Performance of Machine Learning Models

In this study, the predictive performance of each machine learning model was assessed. The performance of each model was assessed using k-fold cross-validation. MSE, RMSE, and R-squared value were used to evaluate each model’s performance. Table 18 summarizes the evaluation results for each of the models utilized in this study.
Table 18 summarizes the performance of the two machine learning algorithms employed in this study. According to the table, the algorithms analyzed do reasonably well in terms of prediction accuracy. The R2 values for both research models are over 0.65, indicating strong results. In terms of accuracy, the ANN model outperforms the Random Forest model, as indicated by lower MSE and RMSE values. Furthermore, when the stability of the created models is assessed, both models perform well. This is evident from the very small standard deviations for the MSE and RMSE of both models. This suggests that the models exhibit strong stability despite data variation.

4.3.3. Feature Importance

In this study, a variable contribution analysis was conducted. This analysis was performed to enhance the interpretability of the model under study and to identify which features have the most significant impact on training performance. The variable contribution analysis measured the extent to which each input variable contributed to reducing the prediction error of the output variable during decision tree construction. In this study, the variables analyzed were the latent scores generated by the SEM model. Thus, the interpretation derived from these importance scores remains within a validated theoretical framework. Table 19 shows the feature importance scores for each research variable.
Table 19 shows that the Organizational and Environmental Factors variable makes the largest contribution to predicting Training Performance, followed by the Participant Commitment variable. This indicates that organizational environmental factors have the greatest influence on training effectiveness, followed by individual factors and the quality of training instruction. These feature-importance results are consistent with the SEM results, which indicate that causally significant variables are also predictively significant.

4.4. Model Performance Comparison Results

In this study, we evaluated all the models used, including SEM, SEM-Random Forest (SEM-RF), and SEM-Artificial Neural Network (SEM-ANN); we also included a Multiple Linear Regression (MLR) model for comparison. The evaluation of these four models was performed to determine which method is the most superior and to identify the trade-off between inferential power and predictive accuracy for each model examined. A comparison of the models’ performance in this study is presented in Table 20.
Table 20 compares the predictive performance of the baseline and hybrid models. The Multiple Linear Regression (MLR) model produced the lowest predictive performance, with an MSE of 0.247 and an R2 of 0.534. The SEM model showed improved performance, achieving a lower MSE (0.221) and a higher R2 (0.581), indicating the benefit of using theoretically validated latent constructs. The hybrid models further enhanced predictive accuracy, with SEM-RF reducing the MSE to 0.162 and increasing R2 to 0.673. Among all models, SEM-ANN achieved the best performance, yielding the lowest MSE (0.149) and the highest R2 (0.701).
The hybrid SEM–ML approach in this study addresses the limitations of the SEM model in capturing non-linear relationships in the data. In the first modeling stage, SEM is used to generate theoretically validated latent scores, thereby ensuring that the variables used have clear conceptual meaning. Then, in the second stage, Machine Learning is used to model the non-linear relationships among these constructs, thereby improving prediction accuracy. Furthermore, the hybrid model’s increased accuracy demonstrates that using latent scores as inputs in Machine Learning can be viewed as a form of theory-based feature engineering. This transformation reduces the noise generated by each indicator measuring latent variables and improves data quality by enhancing representativeness. Thus, the findings of this study indicate that integrating SEM- and ML-based approaches can maintain the model’s predictive accuracy while preserving interpretability at an acceptable level.

5. Discussion

Based on the research findings, integrating two modeling frameworks, namely SEM and ML, can yield more detailed, comprehensive insights into the effectiveness of training programs. Through this approach, it was found that the relationship between variables in the theoretical framework of the training program, specifically training on the implementation of the Blue Economy and Circular Economy in the Citarum River Basin, is not entirely linear but involves a complex relationship [57,58,59].
The SEM analysis revealed that, among the factors determining the effectiveness of the training program, organizational and environmental factors were the most influential. The significance of these organizational and environmental factors is reflected in their direct and indirect effects on the training program’s effectiveness. This finding is consistent with the literature, which has previously emphasized the importance of environmental support in facilitating the transfer of knowledge from training into community practice [12,13]. A conducive and supportive environment can accelerate the application of skills and knowledge gained from training. Thus, this indicates that the role of the government and local community groups is crucial in creating an ecosystem that supports the practice of the Blue Economy and Circular Economy in the Citarum River Basin.
Another finding from the machine learning analysis indicates that the interactions among the factors determining training effectiveness are not entirely linear. This is evidenced by a significant improvement in prediction accuracy when the SEM model is integrated with ML. This suggests a complex interaction pattern among the factors determining training effectiveness, such as threshold effects and non-linear interactions, that can be captured only when the SEM model is integrated with an ML model. For example, improvements in instructional quality during training may only significantly affect performance up to a certain level, or when they are supported by high trainee motivation.
From a methodological perspective, this study’s results indicate that combining SEM and Machine Learning can address the shortcomings of each approach when used independently. The SEM approach has a strong conceptual framework, grounded in the formation and validation of latent constructs, whose causal relationships are then tested. Meanwhile, Machine Learning methods can enhance a model’s predictive capability through nonlinear approximations. Therefore, by using latent construct scores as input to the ML model, this study demonstrates that the features generated by the model are not only more structured and theoretically valid but also capable of improving the predictive model’s accuracy. This approach can also be viewed as theory-guided feature engineering, in which the feature creation process is guided by a sound conceptual theory. This is one of the advantages of this method compared to conventional ML methods, which often overlook theoretical aspects in the modeling process. Thus, this study contributes to addressing the shortcomings of both explanatory modeling and predictive modeling.
The findings also provide practical insights for organizations involved in sustainability-oriented capacity-building programs. The significant effects of Participant Characteristics, Training Instruction, and Organizational and Environmental Factors suggest that improving training effectiveness requires a comprehensive approach that extends beyond curriculum design alone. Training providers should consider participant readiness, learning needs, and prior experience when designing training activities. Furthermore, instructional strategies should emphasize interactive learning, practical exercises, and context-specific examples that facilitate the application of Blue Economy and Circular Economy principles. The results also highlight the importance of post-training support mechanisms, including mentoring, community engagement, and institutional assistance, which can strengthen participant commitment and increase the likelihood that acquired knowledge will be translated into practice. For local governments and development agencies, these findings suggest that investments in sustainability-oriented training programs should be accompanied by supportive environmental and organizational conditions to maximize post-training capacity-building outcomes.
The findings should be interpreted within the scope of training effectiveness and community capacity-building rather than as direct evidence of environmental improvement. While Participant Characteristics, Training Instruction, Organizational and Environmental Factors, and Participant Commitment were found to significantly influence Training Performance, the present study does not directly assess environmental indicators such as water quality, waste reduction, ecosystem restoration, or other watershed management outcomes. Nevertheless, effective training programs represent an important prerequisite for sustainability-oriented behavioral change. By enhancing participant knowledge, skills, engagement, and commitment, Blue Economy and Circular Economy training initiatives may strengthen the capacity of local communities to support future environmental management efforts. Therefore, the contribution of this study lies in identifying the factors that improve training effectiveness and post-training capacity-building potential, which may subsequently facilitate the implementation of sustainability-oriented practices within the Citarum River Basin.


6. Conclusions

The purpose of this study is to examine the key elements that influence the effectiveness of community training programs in the context of implementing the Blue Economy and the Circular Economy. This study employs a hybrid approach combining ML and SEM. The findings show that, in terms of interpretability and model prediction accuracy, combining these two modeling frameworks yields more comprehensive insights than relying on a single approach.
The study found that Organizational and Environmental Factors have the greatest impact on increasing Training Performance, both directly and through mediating factors such as Participant Commitment. These results show that factors outside these two domains, namely, environmental factors, determine the efficacy of training programs, alongside instructional aspects on the training side and individual characteristics. The extent to which community and surroundings facilitate training significantly impacts its effectiveness, as the adoption of sustainable economic practices in the Citarum River basin requires the backing of local community organizations and the government. The Machine Learning research results show a non-linear relationship between latent factors and training performance that the SEM model cannot fully describe. The SEM-ML model outperforms the SEM model in predictive performance, suggesting that intricate interaction patterns underlie the dynamics of this training program’s efficacy. This result supports the earlier claim that occurrences in complex social systems cannot be adequately explained by a linear approach.
However, the findings should be interpreted as evidence of improved training effectiveness and enhanced post-training capacity-building potential rather than direct improvements in environmental management performance. Assessing the long-term environmental impacts of such training programs remains an important direction for future research. Furthermore, the relatively small sample size may limit the generalizability of the machine learning results. Therefore, the predictive findings should be interpreted as exploratory evidence and validated in future studies using larger and more diverse datasets. Another limitation of this study concerns its cross-sectional design. The data were collected at a single point in time and therefore do not capture longitudinal changes in participant commitment, training outcomes, or sustainability-related behaviors. Future research may employ longitudinal designs to investigate how training effects evolve over time and whether improvements in training performance lead to sustained behavioral and environmental outcomes.

Author Contributions

Conceptualization: S., M.D.J. and M.P.A.S.; Methodology: S., R., A.K. and A.S.A.; Software: H.b.H., M.P.A.S., S.S.B.A., M.D.J., A.S. and D.S.P.; Validation: S., A.S.A., H.b.H., A.K., S.S.B.A., A.S. and D.S.P.; Formal analysis: D.S.P., A.K., R. and S.; Investigation: M.P.A.S., H.b.H. and I.; Resources: S., I., M.D.J. and R.; Data curation: R., M.P.A.S., H.b.H., A.K., S.S.B.A., A.S. and I.; Writing—original draft preparation: S., A.S.A., H.b.H., S.S.B.A., A.S. and D.S.P.; Writing—review and editing: R., M.P.A.S., A.K., S.S.B.A., A.S. and D.S.P.; Visualization: S.S.B.A., A.S., A.S.A. and D.S.P.; Supervision: S., M.D.J., I. and M.P.A.S.; Project administration: S., A.S.A., I. and M.P.A.S.; Funding acquisition: S. All authors have read and agreed to the published version of the manuscript.

Funding

This scientific work was supported by the Equity-WCU International Community Service (PPM Internasional) Grant, Universitas Padjadjaran, number: 4450/UN6.3.1/PT.00/2025.

Institutional Review Board Statement

The study was conducted in accordance with the Declaration of Helsinki, and approved by the Research Ethics Committee, Bening Saguling Foundation (BSF/ER-C/10/11/2025, 7 October 2025).

Informed Consent Statement

Informed consent for participation was obtained from all subjects involved in the study.

Data Availability Statement

The original contributions presented in this study are included in the article. Further inquiries can be directed to the corresponding author.

Acknowledgments

The authors are grateful to Universitas Padjadjaran (Unpad) for providing Article Processing Charge (APC) support. The APC for this article was funded by Unpad through the Indonesian Endowment Fund for Education (LPDP) on behalf of the Indonesian Ministry of Higher Education, Science and Technology, and managed under the EQUITY Program (Contract No. 4303/B3/DT.03.08/2025 and 3927/UN6.RKT/HK.07.00/2025). The authors also thank to Universiti Sultan Zainal Abidin (UniSZA), and Bening Saguling Foundation (BSF), for their cooperation in implementing the International Community Service (PPM Internasional).

Conflicts of Interest

The authors declare no conflict of interest.

References

  1. Moroz, N.Y.; Antipova, O.V.; Psareva, N.Y.; Lyapuntsova, E.V.; Matveeva, N.S. Strategies for sustainable development of socio-economic systems. Stud. Appl. Econ. 2021, 39, 1–12. [Google Scholar] [CrossRef]
  2. Barroso, S.; Pinto, F.R.; Silva, A.; Silva, F.G.; Duarte, A.M.; Gil, M.M. The circular economy solution to ocean sustainability: Innovative approaches for the blue economy. In Research Anthology on Ecosystem Conservation and Preserving Biodiversity; IGI Global Scientific Publishing: Hershey, PA, USA, 2022; pp. 875–901. [Google Scholar]
  3. Pace, L.A.; Saritas, O.; Deidun, A. Exploring future research and innovation directions for a sustainable blue economy. Mar. Policy 2023, 148, 105433. [Google Scholar]
  4. Elston, J.; Pinto, H.; Nogueira, C. Tides of change for a sustainable blue economy: A systematic literature review of innovation in maritime activities. Sustainability 2024, 16, 11141. [Google Scholar] [CrossRef]
  5. Riyadi, B.S.; Alhamda, S.; Airlambang, S.; Anggreiny, R.; Anggara, A.T. Environmental damage due to hazardous and toxic pollution: A case study of citarum river, west java, Indonesia. Int. J. Criminol. Sociol. 2020, 9, 1844–1852. [Google Scholar]
  6. Idris, A.M.S.; Permadi, A.S.C.; Kamil, A.I.; Wananda, B.R.; Taufani, A.R. Citarum Harum Project: A restoration model of river basin. J. Perenc. Pembang. Indones. J. Dev. Plan. 2019, 3, 310–324. [Google Scholar] [CrossRef]
  7. Juliandar, M.; Rohmat, D.; Setiawan, I. The Impact of Citarum Harum Project on Ecoliteracy Among Upper Citarum Residents. Geosfera Indones. 2023, 8, 316. [Google Scholar] [CrossRef]
  8. Wikarta, E.K. Towards green economy: The development of sustainable agricultural and rural development planning, the case on upper Citarum river basin West Java Province Indonesia. Ecodevelopment 2022, 3. [Google Scholar] [CrossRef]
  9. Anikwe, S.O.; Unachukwu, L.C.; Onah, F.N. Human capacity development and sustainable growth in the blue economy: Opportunities, challenges, and strategies for Nigeria. Afr. Bank. Financ. Rev. J. 2024, 15, 201–212. [Google Scholar]
  10. Abd Rahman, A.; Imm Ng, S.; Sambasivan, M.; Wong, F. Training and organizational effectiveness: Moderating role of knowledge management process. Eur. J. Train. Dev. 2013, 37, 472–488. [Google Scholar] [CrossRef]
  11. Sitzmann, T.; Weinhardt, J.M. Training engagement theory: A multilevel perspective on the effectiveness of work-related training. J. Manag. 2018, 44, 732–756. [Google Scholar]
  12. Tonhäuser, C.; Büker, L. Determinants of transfer of training: A comprehensive literature review. Int. J. Res. Vocat. Educ. Train. 2016, 3, 127–165. [Google Scholar] [CrossRef]
  13. Hughes, A.M.; Zajac, S.; Woods, A.L.; Salas, E. The role of work environment in training sustainment: A meta-analysis. Hum. Factors 2020, 62, 166–183. [Google Scholar] [PubMed]
  14. Kozlinska, I.; Mets, T.; Rõigas, K. Measuring learning outcomes of entrepreneurship education using structural equation modeling. Adm. Sci. 2020, 10, 58. [Google Scholar] [CrossRef]
  15. Yáñez-Araque, B.; Hernández-Perlines, F.; Moreno-Garcia, J. From training to organizational behavior: A mediation model through absorptive and innovative capacities. Front. Psychol. 2017, 8, 1532. [Google Scholar] [CrossRef] [PubMed]
  16. Lowry, P.B.; Gaskin, J. Partial least squares (PLS) structural equation modeling (SEM) for building and testing behavioral causal theory: When to choose it and how to use it. IEEE Trans. Prof. Commun. 2014, 57, 123–146. [Google Scholar] [CrossRef]
  17. Martin, T.; Hofman, J.M.; Sharma, A.; Anderson, A.; Watts, D.J. Exploring limits to prediction in complex social systems. In Proceedings of the 25th International Conference on World Wide Web; ACM: New York, NY, USA, 2016; pp. 683–694. [Google Scholar]
  18. Ryo, M.; Rillig, M.C. Statistically reinforced machine learning for nonlinear patterns and variable interactions. Ecosphere 2017, 8, e01976. [Google Scholar] [CrossRef]
  19. Blume, L.E.; Brock, W.A.; Durlauf, S.N.; Jayaraman, R. Linear social interactions models. J. Political Econ. 2015, 123, 444–496. [Google Scholar] [CrossRef]
  20. Belkin, M.; Hsu, D.; Ma, S.; Mandal, S. Reconciling modern machine-learning practice and the classical bias–variance trade-off. Proc. Natl. Acad. Sci. USA 2019, 116, 15849–15854. [Google Scholar] [PubMed]
  21. Thorson, J.T.; Taylor, I.G. A comparison of parametric, semi-parametric, and non-parametric approaches to selectivity in age-structured assessment models. Fish. Res. 2014, 158, 74–83. [Google Scholar]
  22. Carvalho, D.V.; Pereira, E.M.; Cardoso, J.S. Machine learning interpretability: A survey on methods and metrics. Electronics 2019, 8, 832. [Google Scholar] [CrossRef]
  23. Miraz, M.H.; Annamalah, S.; Sham, R. Integrating PLS-SEM and NVivo in mixed-methods educational research: A comprehensive evaluation of quantitative and qualitative analytical tools. Educ. Process Int. J. 2025, 19, e2025531. [Google Scholar]
  24. Williamson, B.D.; Gilbert, P.B.; Carone, M.; Simon, N. Nonparametric variable importance assessment using machine learning techniques. Biometrics 2021, 77, 9–22. [Google Scholar] [PubMed]
  25. Mehedintu, A.; Soava, G. A hybrid SEM-neural network modeling of quality of M-commerce services under the impact of the COVID-19 pandemic. Electronics 2022, 11, 2499. [Google Scholar]
  26. Almarzouqi, A.; Aburayya, A.; Salloum, S.A. Determinants predicting the electronic medical record adoption in healthcare: A SEM-Artificial Neural Network approach. PLoS ONE 2022, 17, e0272735. [Google Scholar] [CrossRef] [PubMed]
  27. Yaqin, A.M.A.; Muqoffi, A.K.; Rizalmi, S.R.; Pratikno, F.A.; Efranto, R.Y. Hybrid learning in post-pandemic higher education systems: An analysis using SEM and DNN. Cogent Educ. 2025, 12, 2458930. [Google Scholar] [CrossRef]
  28. Jyoti, J.; Sanjeev, R.; Gupta, A.; Rupčić, N. Examining the relationship between hybrid HRM and employee performance through the lens of ambidextrous learning: A structural equation modeling approach. J. Organ. Eff. People Perform. 2026, 1–22. [Google Scholar] [CrossRef]
  29. Barasa, L.; Rinaldi, A.; Permana, A.; Jatmiko, M.A. Blue Economy Literacy Framework for Coastal Communities: Integrating Marine Conservation, Maritime Entrepreneurship, and Cultural Heritage. Multicore Int. J. Multidiscip. (MIJM) 2026, 2, 1–16. [Google Scholar] [CrossRef]
  30. Pumas, P.; Puangmanee, M.; Teeratitayangkul, P.; Sintuya, W.; Pumas, C. Data-driven strategies for household waste management through Policy, social Norms, and circular economy. Waste Manag. Bull. 2025, 3, 100216. [Google Scholar] [CrossRef]
  31. Shmueli, G.; Sarstedt, M.; Hair, J.F.; Cheah, J.H.; Ting, H.; Vaithilingam, S.; Ringle, C.M. Predictive model assessment in PLS-SEM: Guidelines for using PLSpredict. Eur. J. Mark. 2019, 53, 2322–2347. [Google Scholar] [CrossRef]
  32. Memon, M.A.; Ramayah, T.; Cheah, J.H.; Ting, H.; Chuah, F.; Cham, T.H. PLS-SEM statistical programs: A review. J. Appl. Struct. Equ. Model. 2021, 5, 1–14. [Google Scholar] [CrossRef]
  33. Crameri, L.; Hettiarachchi, I.; Hanoun, S. A review of individual operational cognitive readiness: Theory development and future directions. Hum. Factors 2021, 63, 66–87. [Google Scholar] [PubMed]
  34. Cook, D.A.; Artino, A.R., Jr. Motivation to learn: An overview of contemporary theories. Med. Educ. 2016, 50, 997–1014. [Google Scholar] [CrossRef] [PubMed]
  35. Mahmud, S.K.; Kurt, M. Enhancing inclusive sustainability-oriented learning in higher education using adaptive learning platforms and performance-based assessment. Sustainability 2026, 18, 1489. [Google Scholar]
  36. Hajian, S. Transfer of learning and teaching: A review of transfer theories and effective instructional practices. IAFOR J. Educ. 2019, 7, 93–111. [Google Scholar] [CrossRef]
  37. Vlachopoulos, D.; Makri, A. Online communication and interaction in distance higher education: A framework study of good practice. Int. Rev. Educ. 2019, 65, 605–632. [Google Scholar] [CrossRef]
  38. Kim, K.Y.; Eisenberger, R.; Baik, K. Perceived organizational support and affective organizational commitment: Moderating influence of perceived organizational competence. J. Organ. Behav. 2016, 37, 558–583. [Google Scholar] [CrossRef]
  39. Al-Tarawneh, A.I.; Al-Adaileh, R. The interplay among management support and factors influencing organizational learning: An applied study. J. Workplace Learn. 2021, 33, 460–485. [Google Scholar] [CrossRef]
  40. Paulsson, K.; Ivergård, T.; Hunt, B. Learning at work: Competence development or competence-stress. Appl. Ergon. 2005, 36, 135–144. [Google Scholar] [CrossRef] [PubMed]
  41. Hassija, V.; Chamola, V.; Mahapatra, A.; Singal, A.; Goel, D.; Huang, K.; Scardapane, S.; Spinelli, I.; Mahmud, M.; Hussain, A. Interpreting black-box models: A review on explainable artificial intelligence. Cogn. Comput. 2024, 16, 45–74. [Google Scholar]
  42. Fischer, M.M. Neural networks: A class of flexible non-linear models for regression and classification. In Handbook of Research Methods and Applications in Economic Geography; Edward Elgar Publishing: Cheltenham, UK, 2015; pp. 172–192. [Google Scholar]
  43. Kyriazos, T.; Poga, M. Application of machine learning models in social sciences: Managing nonlinear relationships. Encyclopedia 2024, 4, 1790–1805. [Google Scholar] [CrossRef]
  44. Okafor-Yarwood, I.; Kadagi, N.I.; Miranda, N.A.; Uku, J.; Elegbede, I.O.; Adewumi, I.J. The blue economy–cultural livelihood–ecosystem conservation triangle: The African experience. Front. Mar. Sci. 2020, 7, 586. [Google Scholar]
  45. Elegbede, I.O.; Fakoya, K.A.; Adewolu, M.A.; Jolaosho, T.L.; Adebayo, J.A.; Oshodi, E.; Hungevu, R.F.; Oladosu, A.O.; Abikoye, O. Understanding the social–ecological systems of non-state seafood sustainability scheme in the blue economy. Environ. Dev. Sustain. 2025, 27, 2721–2752. [Google Scholar]
  46. Camilleri, M.A. Closing the loop for resource efficiency, sustainable consumption and production: A critical review of the circular economy. Int. J. Sustain. Dev. 2018, 21, 1–17. [Google Scholar]
  47. Elroi, H.; Zbigniew, G.; Agnieszka, W.C.; Piotr, S. Enhancing waste resource efficiency: Circular economy for sustainability and energy conversion. Front. Environ. Sci. 2023, 11, 1303792. [Google Scholar] [CrossRef]
  48. Liu, L.; Liang, Y.; Song, Q.; Li, J. A review of waste prevention through 3R under the concept of circular economy in China. J. Mater. Cycles Waste Manag. 2017, 19, 1314–1323. [Google Scholar] [CrossRef]
  49. Kim, E.J.; Park, S.; Kang, H.S. Support, training readiness and learning motivation in determining intention to transfer. Eur. J. Train. Dev. 2019, 43, 306–321. [Google Scholar] [CrossRef]
  50. Karthik, B.; Chandrasekhar, B.B.; David, R.; Kumar, A.K. Identification of instructional design strategies for an effective e-learning experience. Qual. Rep. 2019, 24, 1537–1555. [Google Scholar] [CrossRef]
  51. Gana, R.; Medina, J.; Robina, R.; Barchino, R. Virtual learning environment to encourage students’ relationships and cooperative competence acquisition. In Proceedings of the 26th ACM Conference on Innovation and Technology in Computer Science Education V. 1; ACM: New York, NY, USA, 2021; pp. 53–59. [Google Scholar]
  52. Nafukho, F.M.; Irby, B.J.; Pashmforoosh, R.; Lara-Alecio, R.; Tong, F.; Lockhart, M.E.; El Mansour, W.; Tang, S.; Etchells, M.; Wang, Z. Training design in mediating the relationship of participants’ motivation, work environment, and transfer of learning. Eur. J. Train. Dev. 2023, 47, 112–132. [Google Scholar]
  53. Syam, N.; Kaul, R. Random forest, bagging, and boosting of decision trees. In Machine Learning and Artificial Intelligence in Marketing and Sales; Emerald Publishing Limited: Leeds, UK, 2021; pp. 139–182. [Google Scholar]
  54. Rostami, M.; Garrusi, B.; Baneshi, M.R. A study on the use of bootstrap aggregation methods in estimation of stable parameters. J. Biostat. Epidemiol. 2016, 2, 104–110. [Google Scholar]
  55. Hair, J.F.; Ringle, C.M.; Sarstedt, M. PLS-SEM: Indeed a silver bullet. J. Mark. Theory Pract. 2011, 19, 139–152. [Google Scholar] [CrossRef]
  56. Rasoolimanesh, S.M. Discriminant validity assessment in PLS-SEM: A comprehensive composite-based approach. Data Anal. Perspect. J. 2022, 3, 1–8. [Google Scholar]
  57. Zarei, S.; Bozorg-Haddad, O.; Reza Nikoo, M. The basis of artificial neural network (ANN): Structures, algorithms and functions. In Computational Intelligence for Water and Environmental Sciences; Springer Nature: Singapore, 2022; pp. 225–250. [Google Scholar]
  58. Kock, N. Common method bias: A full collinearity assessment method for PLS-SEM. In Partial Least Squares Path Modeling: Basic Concepts, Methodological Issues and Applications; Springer International Publishing: Cham, Switzerland, 2017; pp. 245–257. [Google Scholar]
  59. Carnia, E.; Saputra, M.P.A.; Mashadi; Sukono; Sya’imaa HS, A.A.; Lestari, M.; Zamri, N.; Azahra, A.S. An Integrated Weighted Fuzzy N-Soft Set–CODAS Framework for Decision-Making in Circular Economy-Based Waste Management Supporting the Blue Economy: A Case Study of the Citarum River Basin, Indonesia. Mathematics 2026, 14, 238. [Google Scholar] [CrossRef]
Figure 1. PLS Algorithm Output.
Sustainability 18 06973 g001
Figure 2. SEM-ML Implementation Flow.
Sustainability 18 06973 g002
Table 1. Training Curriculum Structure.
Training ComponentDescriptionRelated Research Construct
Blue Economy PrinciplesSustainable utilization of water resources, watershed conservation, and environmental stewardshipTraining Instruction, Training Performance
Circular Economy PrinciplesWaste reduction, recycling, resource efficiency, and sustainable production-consumption practicesTraining Instruction, Training Performance
Community-Based Learning ActivitiesGroup discussions, case studies, practical exercises, and collaborative problem-solving activitiesTraining Instruction, Participant Commitment
Institutional and Community SupportSupport from local governments, community organizations, and environmental initiatives that facilitate knowledge applicationOrganizational and Environmental Factors
Sustainability Engagement and Capacity BuildingActivities aimed at encouraging participation, commitment, and implementation of sustainability-oriented practicesParticipant Commitment, Training Performance
Table 2. Summary of the latent constructs and questionnaire measurements used in this study (19 reflective indicators).
ConstructCodeNo. of
Indicators
Representative Measurement Items
Participant CharacteristicsIP4Voluntary participation, interest in training, learning effort, perceived importance of training
Training InstructionPEL4Clarity of objectives, quality of materials, trainer effectiveness, instructional methods
Organizational and Environmental FactorsOL4Family support, community support, opportunity to apply knowledge, environmental support
Participant CommitmentKP4Intention to apply knowledge, willingness to participate in follow-up activities, continuous learning
Training PerformanceKI3Knowledge improvement, skill improvement, confidence in applying knowledge
Table 3. SEM Evaluation Criteria.
Evaluation AspectIndicatorCriteriaInterpretation
Convergent ValidityLoading Factor>0.70Indicators have a strong contribution to the latent construct
AVE (Average Variance Extracted)>0.50The construct explains more than 50% of the variance of its indicators
Discriminant ValidityCross LoadingLoading on its own construct > other constructsConstructs are empirically distinct
HTMT<0.85Latent constructs are sufficiently distinct and free from discriminant validity issues
ReliabilityCronbach’s Alpha>0.60Adequate internal consistency (exploratory research)
Composite Reliability>0.70High construct reliability
Structural ModelR20.25 (weak), 0.50 (moderate), 0.75 (substantial)Model explanatory power
Q2>0Predictive relevance of the structural model
Path CoefficientSignificant (p < 0.05)Significant relationships between constructs
Bootstrappingt-statistic > 1.96Significance at α = 5%
Mediation EffectIndirect EffectSignificantMediation effect exists
VAF (Variance Accounted For)<20% (none), 20–80% (partial), >80% (full)Type of mediation
Table 4. Loading Factor Value.
VariablesIndicatorLoading ValueStatus
Participant CharacteristicsIP010.732Passed
IP020.716Passed
IP030.699Passed
IP040.705Passed
Training InstructionPEL010.725Passed
PEL020.733Passed
PEL030.775Passed
PEL040.719Passed
Organizational and Environmental FactorsOL010.821Passed
OL020.746Passed
OL030.688Passed
OL040.815Passed
Participant CommitmentKP010.781Passed
KP020.813Passed
KP030.884Passed
KP040.761Passed
Training PerformanceKI010.791Passed
KI020.813Passed
KI030.793Passed
Table 5. AVE Value.
Table 5. AVE Value.
Latent VariablesAVEDetails
Participant Characteristics0.722Passed
Training Instruction0.804Passed
Organizational and Environmental Factors0.603Passed
Participant Commitment0.731Passed
Training Performance0.691Passed
Table 6. Cross-Loading.
Participant CharacteristicsTraining InstructionOrganizational and Environmental FactorsParticipant CommitmentTraining Performance
IP010.7320.5410.6210.4760.531
IP020.7160.3510.6520.4150.373
IP030.6990.4220.5130.4560.644
IP040.7050.4870.5340.5290.536
PEL010.4510.7250.4760.3450.435
PEL020.5760.7330.5870.4430.418
PEL030.4230.7750.6840.4920.414
PEL040.4030.7190.6110.5320.453
OL010.4880.3330.8210.4570.425
OL020.6220.4260.7460.5740.451
OL030.6570.4530.6880.4130.611
OL040.6630.4950.8150.4030.536
KP010.6110.5230.6320.7810.542
KP020.5320.4220.6390.8130.439
KP030.7140.4410.6710.8840.549
KP040.5880.3980.5630.7610.413
KI010.4520.3010.4940.3440.791
KI020.5110.6310.3280.5140.813
KI030.3320.4390.5190.3610.793
Table 7. HTMT Result.
Construct PairHTMT
Participant Characteristics—Training Instruction0.721
Participant Characteristics—Organizational and Environmental Factors0.684
Participant Characteristics—Participant Commitment0.742
Training Instruction—Organizational and Environmental Factors0.769
Training Instruction—Participant Commitment0.793
Organizational and Environmental Factors—Participant Commitment0.811
Participant Commitment—Training Performance0.782
Table 8. Composite Reliability.
Latent VariablesComposite ReliabilityDetails
Participant Characteristics0.712Passed
Training Instruction0.651Passed
Organizational and Environmental Factors0.622Passed
Participant Commitment0.769Passed
Training Performance0.713Passed
Table 9. Cronbach’s Alpha.
Latent VariablesCronbach’s AlphaDetails
Participant Characteristics0.726Passed
Training Instruction0.667Passed
Organizational and Environmental Factors0.631Passed
Participant Commitment0.773Passed
Training Performance0.738Passed
Table 10. VIF Value.
ConstructVIF
Participant Characteristics2.902
Training Instruction3.136
Organizational and Environmental Factors3.103
Participant Commitment3.201
Training Performance2.538
Table 11. Result of R-Square.
Latent VariablesR SquareDetails
Participant Commitment0.532Moderate
Training Performance0.581Moderate
Table 12. Stone–Geisser Predictive Relevance (Q2).
Endogenous ConstructQ2
Participant Commitment0.156
Training Performance0.289
Table 13. Path Coefficients and p-Values.
Direct EffectCoefficientp-ValueDecision
Participant Characteristics Participant Commitment0.3530.000Reject Null Hypothesis
Training Instruction Participant Commitment0.2210.000Reject Null Hypothesis
Organizational and Environmental Factors Participant Commitment0.4520.000Reject Null Hypothesis
Participant Characteristics Training Performance0.4130.000Reject Null Hypothesis
Training Instruction Training Performance0.2110.000Reject Null Hypothesis
Organizational and Environmental Factors Training Performance0.2590.000Reject Null Hypothesis
Participant Commitment Training Performance0.3490.000Reject Null Hypothesis
Table 14. Result of Indirect Effect.
Indirect EffectOriginal Sample (O)T-Statisticsp-ValuesDecision
Participant Characteristics Participant Commitment Training Performance0.3857.6200.000Reject Null Hypothesis
Training Instruction → Participant Commitment Training Performance0.2524.9870.000Reject Null Hypothesis
Organizational and Environmental Factors → Participant Commitment Training Performance0.4218.3320.000Reject Null Hypothesis
Table 15. Mediation Analysis Results.
RelationshipDirect EffectIndirect EffectTotal EffectVAF (%)Mediation Type
Participant Characteristics → Training Performance0.4130.3850.79848.25Partial
Training Instruction → Training Performance0.2110.2520.46354.43Partial
Organizational and Environmental Factors → Training Performance0.2590.4210.6861.91Partial
Table 16. Hyperparameter Search Space.
ModelHyperparameterSearch Space
Random Forestn_estimators{100, 300, 500, 700}
max_depth{None, 10, 20, 30}
max_features{√p, log2, p}
min_samples_split{2, 5, 10}
min_samples_leaf{1, 2, 4}
ANNhidden_layer_sizes{(8), (16,8), (32,16)}
activation{ReLU, Tanh}
learning_rate{0.01, 0.001, 0.0001}
batch_size{8, 16, 32}
epochs{50, 100, 200}
Table 17. Machine Learning Specification.
ModelParameterValue
Random ForestNumber of Trees500
Max DepthNone
Max Features p
Sampling MethodBootstrap Sampling
Splitting CriterionMean Squared Error
ANNArchitectureFeedforward Neural Network
Hidden Layers2 layer
Neuron16 (layer 1), 8 (layer 2)
Activation FunctionReLU (hidden), Linear (output)
OptimizerAdam
Learning Rate0.001
Epoch100
Batch Size16
RegularizationEarly Stopping
Table 18. Model Performance.
ModelMSE (Mean ± Std.)RMSE (Mean ± Std.)R2 (Mean ± Std.)
Random Forest0.162 ± 0.0180.402 ± 0.0220.673 ± 0.031
ANN0.149 ± 0.0150.386 ± 0.0190.701 ± 0.028
Table 19. Importance Score.
Latent VariablesImportance Score
Organizational and Environmental Factors0.312
Participant Commitment0.271
Participant Characteristics0.228
Training Instruction0.189
Table 20. Model Performance Comparison.
ModelTypeAssumptionNon-Linear CapabilityMSER2
SEMParametricLinearNo0.2210.581
Multiple Linear Regression (MLR)ParametricLinearNo0.2470.534
SEM-RFHybridSemi-parametricYes0.1620.673
SEM-ANNHybridSemi-parametricYes0.1490.701
Disclaimer/Publisher’s Note: The statements, opinions and data contained in all publications are solely those of the individual author(s) and contributor(s) and not of MDPI and/or the editor(s). MDPI and/or the editor(s) disclaim responsibility for any injury to people or property resulting from any ideas, methods, instructions or products referred to in the content.