3.1. The FBIREC Framework for Disaster Chain Representation
To systematically represent typhoon disaster chains and their constituent components, this study adopts the FBIREC framework [
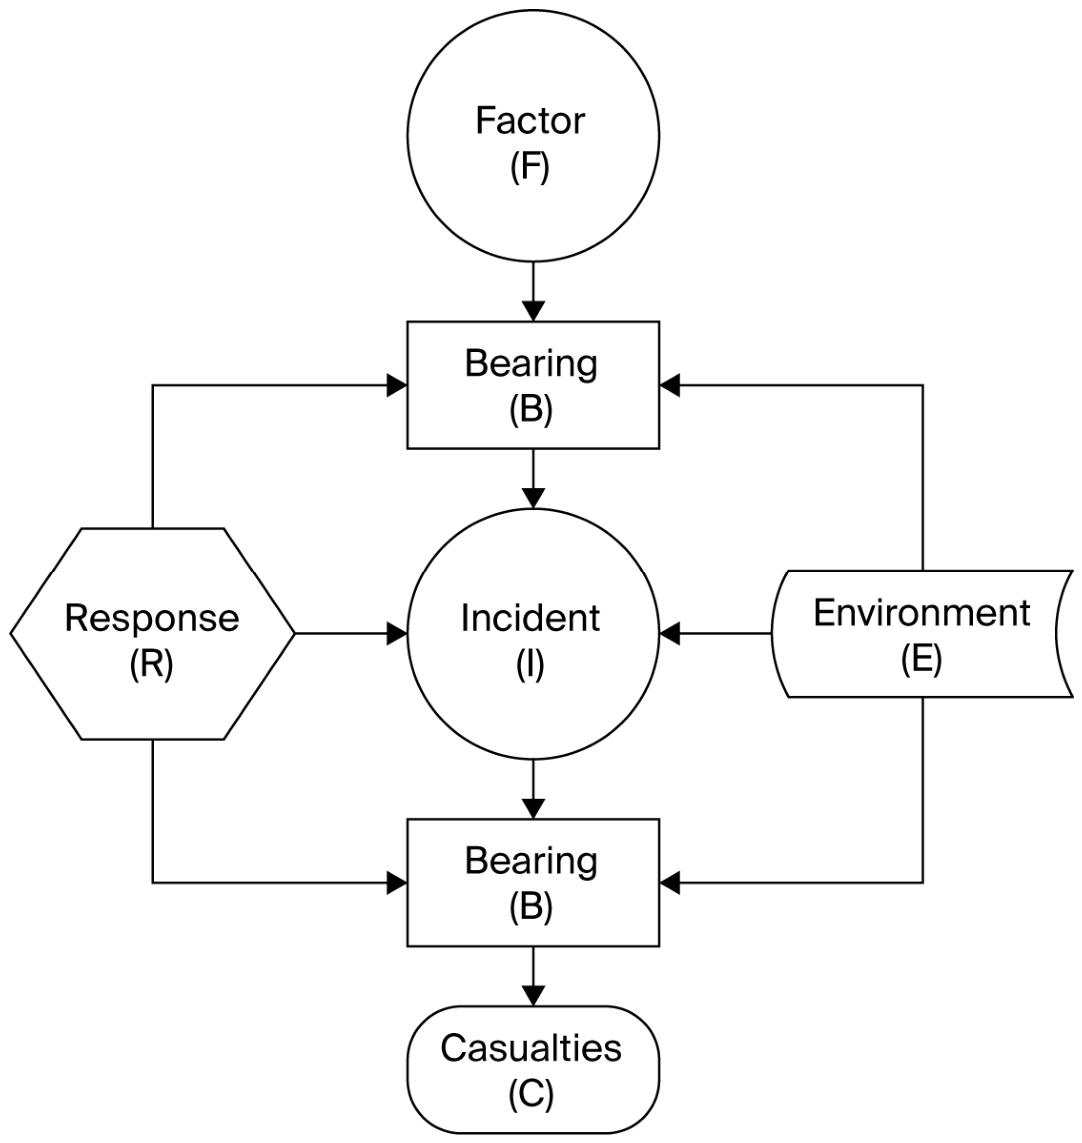
34], which consists of six key elements: initial hazard factor (F), disaster-bearing body (B), incident (I), emergency response (R), environment (E), and consequences (C). The framework provides a structured way to capture the contextual characteristics and interaction mechanisms within each branch of a typhoon disaster chain.
The initial hazard factor (F) refers to potentially destructive natural or human-induced triggers, with their impact depending largely on the exposure and vulnerability of affected systems. The disaster-bearing body (B) represents the entities exposed to hazards, whose physical and functional characteristics influence the propagation of disaster effects. Incidents (I) describe the states or events that emerge when disaster-bearing bodies are impacted by hazard factors. For instance, typhoon winds (F) over open seas are typically regarded as meteorological phenomena; however, when they make landfall and interact with coastal urban systems (B), they may trigger a series of hazardous events such as storm surges and structural failures (I), thereby initiating cascading disaster processes.
Emergency response (R) refers to intervention measures aimed at both disaster-bearing bodies and incidents, with the purpose of reducing risk and interrupting the progression of disaster chains. The environment (E) encompasses the broader geographical, meteorological, and socio-economic context in which disasters occur, while consequences (C) represent the resulting losses in terms of infrastructure damage, economic impacts, and casualties.
For example, a typhoon may induce storm surges that damage seawalls, leading to coastal inundation and urban flooding. In response, emergency agencies may implement seawall reinforcement and evacuation measures, while the final consequences include economic losses and service disruptions.
Based on existing literature [
19,
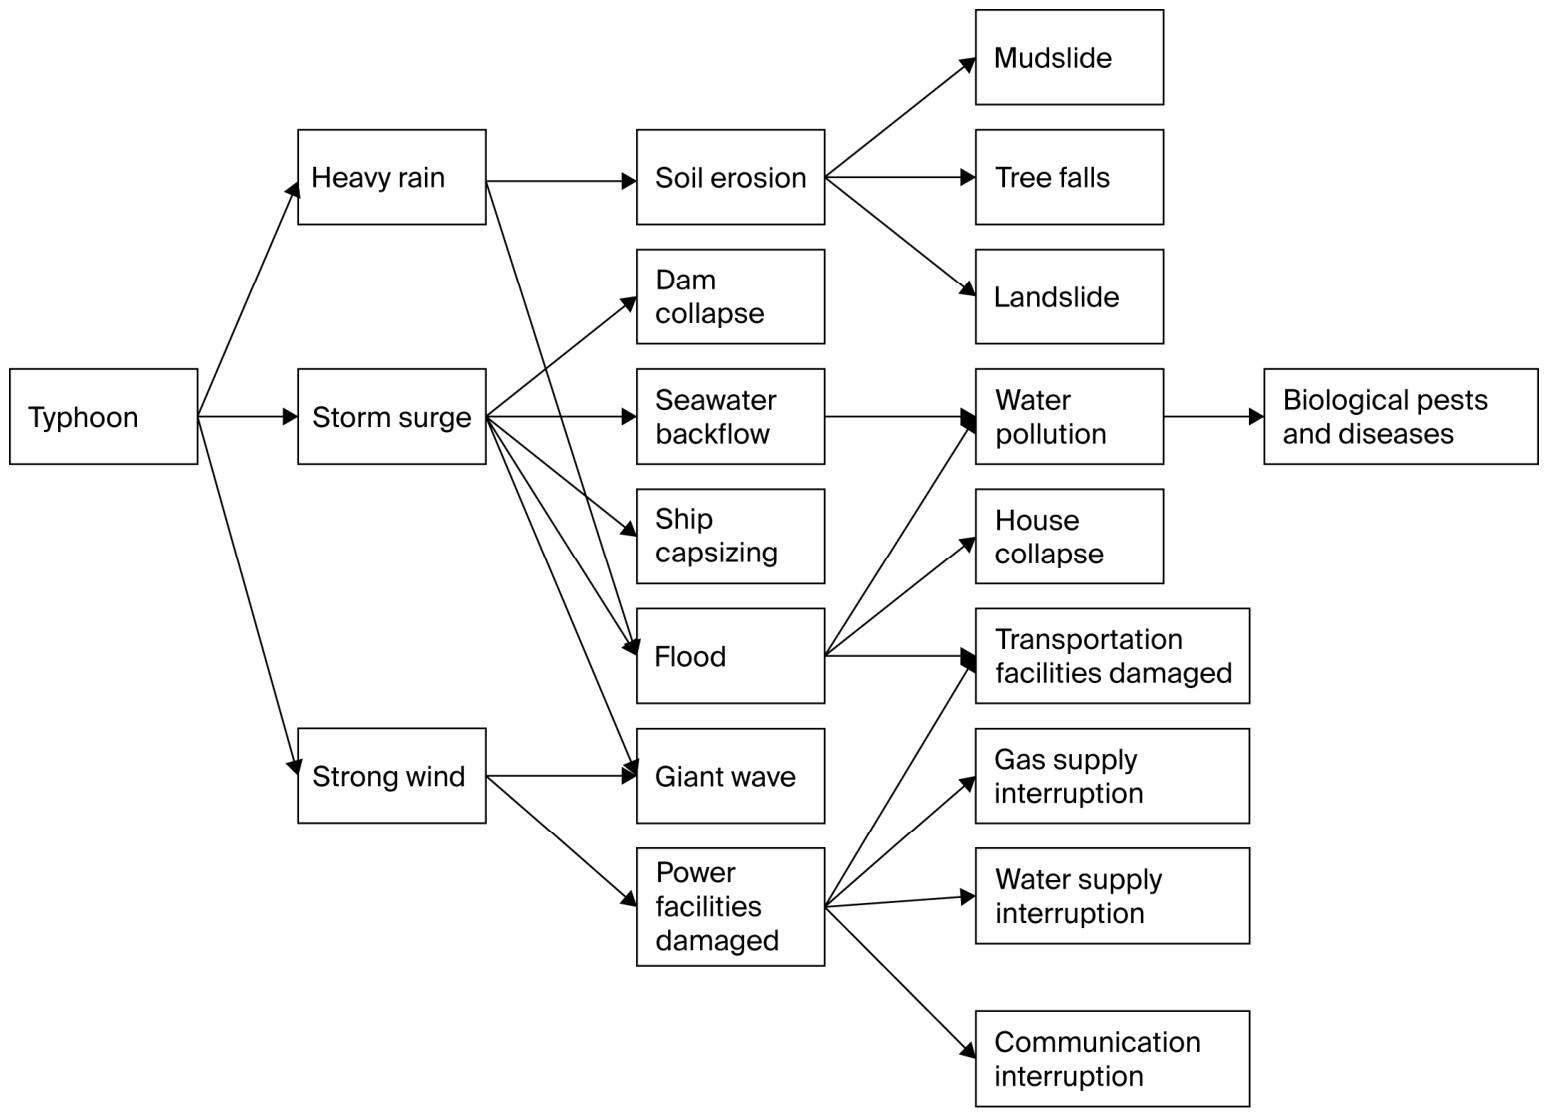
21] and empirical analysis, typhoon-related hazards can be broadly categorized into three primary types: storm surges, heavy rainfall, and strong winds. These primary hazards further trigger secondary hazards such as floods, building collapses, flash floods, and landslides, which together form a cascading typhoon disaster chain characterized by a sequential process of occurrence, development, and evolution.
Some secondary disasters may be jointly triggered by multiple primary hazards and further develop into cascading chains of subsequent impacts. Taking flooding as an example, storm surges and heavy rainfall can simultaneously affect coastal flood protection infrastructure, such as seawalls and sluice gates, leading to seawater intrusion into low-lying coastal areas. In addition, short-duration intense precipitation increases pressure on urban drainage systems, further exacerbating surface water accumulation.
Once the drainage capacity is exceeded, urban flooding in roads and residential areas becomes more likely, which in turn increases structural stress and the risk of building damage or collapse. Floodwaters may also transport surface contaminants into groundwater systems, thereby threatening drinking water safety and potentially affecting agricultural productivity and soil conditions.
Based on the theoretical foundation of the FBIREC framework and the disaster chain relationships and emergency response processes described above, this study constructs typhoon disaster scenario evolution pathways. The initial hazard factor is defined as a typhoon event, and the overall evolution process is illustrated in
Figure 2. The disaster-forming environment, including spatial and socio-economic conditions, is treated as contextual background and is therefore not explicitly included in the flowchart.
Some secondary disasters may be jointly triggered by multiple primary hazards and further develop into cascading chains of subsequent impacts. Taking flooding as an example, storm surges and heavy rainfall can simultaneously affect coastal flood protection infrastructure, such as seawalls and sluice gates, leading to seawater intrusion into low-lying coastal areas. In addition, short-duration intense precipitation increases pressure on urban drainage systems, further exacerbating surface water accumulation.
Once the drainage capacity is exceeded, urban flooding in roads and residential areas becomes more likely, which in turn increases structural stress and the risk of building damage or collapse. In addition, floodwater can transport surface contaminants into groundwater systems. Such water quality contamination not only threatens drinking water safety but may also have longer-term implications for agricultural productivity and soil conditions.
Based on the theoretical foundation of the FBIREC framework and the disaster chain relationships and emergency response processes described above, this study constructs typhoon disaster scenario evolution pathways. The initial hazard factor is defined as a typhoon event, and the overall evolution process is illustrated in
Figure 3. The disaster-forming environment, including spatial and socio-economic conditions, is treated as contextual background and is therefore not explicitly included in the flowchart.
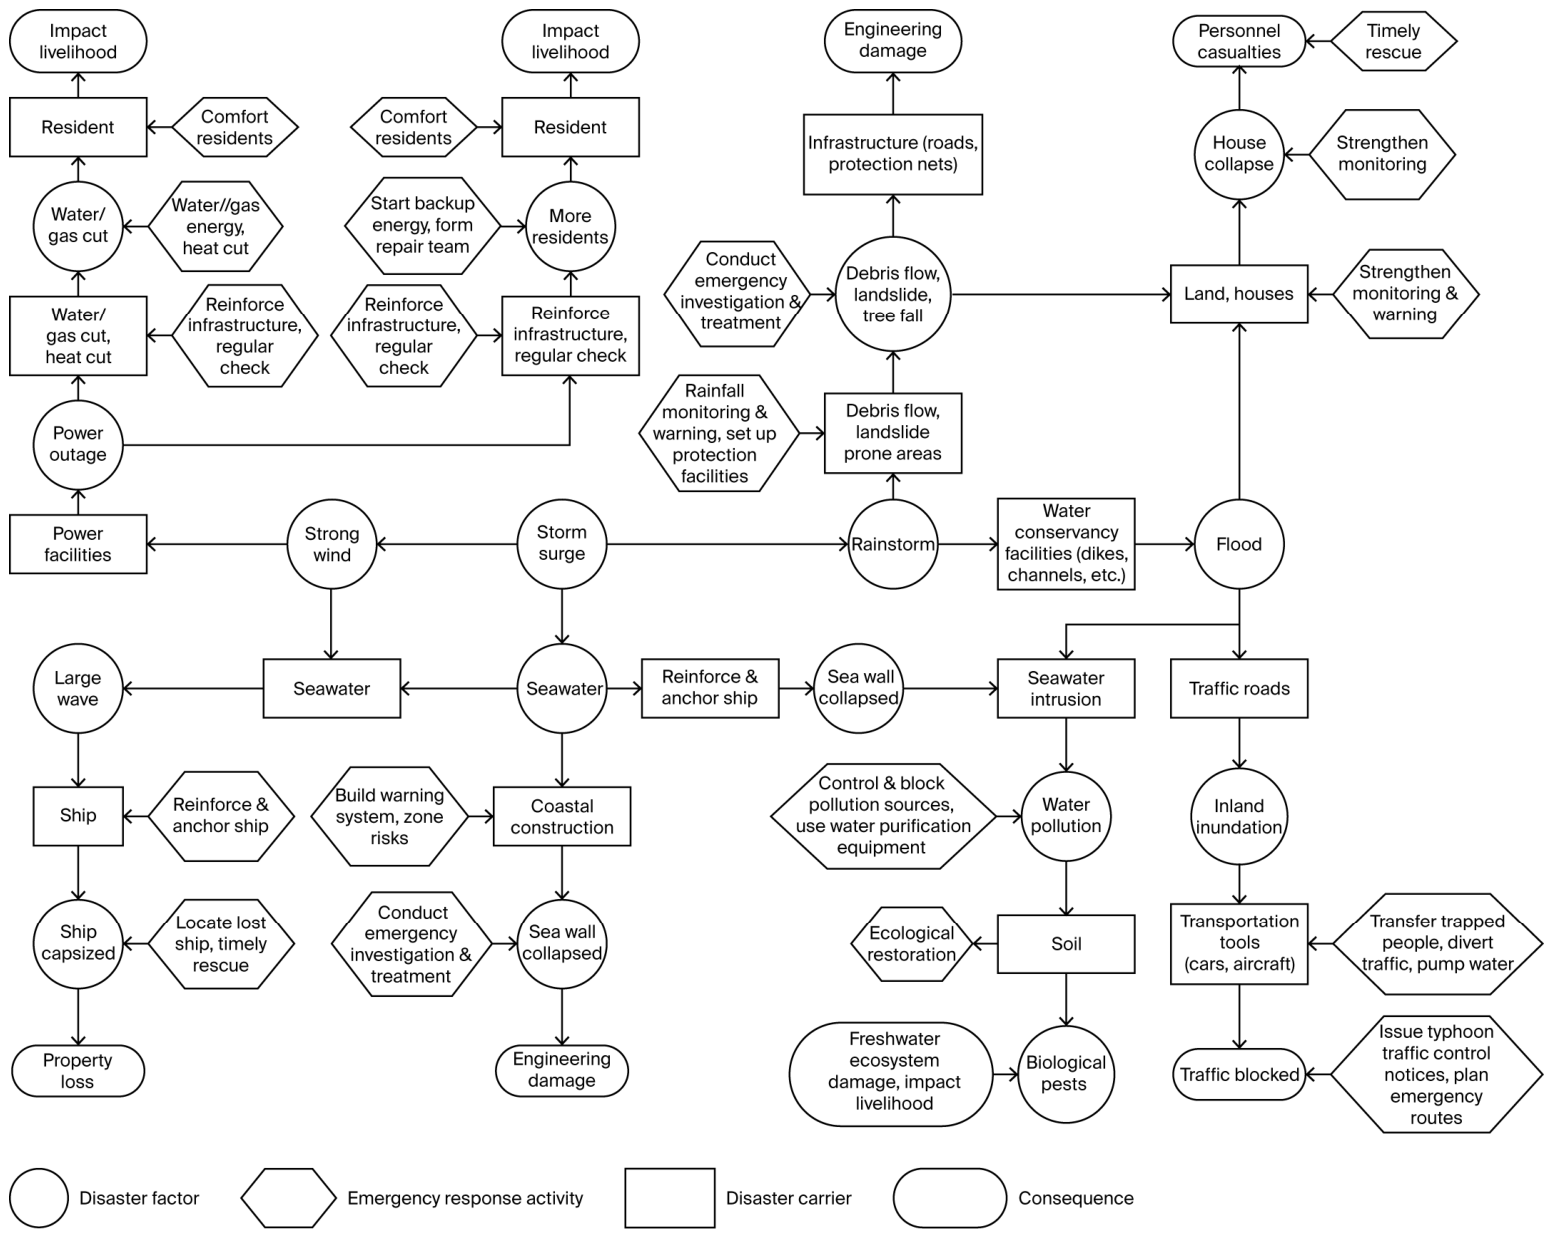
By combining the typhoon occurrence–development–evolution chain shown in
Figure 2 with the FBIREC single-scenario framework shown in
Figure 3, the complete typhoon disaster scenario evolution process was constructed, as illustrated in
Figure 4.
3.2. GERT Network Model
GERT integrates network theory, probability analysis, simulation modeling, and signal flow graphs to form a system analysis method with stochastic characteristics. Compared to traditional network techniques, GERT’s core value lies in its ability to effectively handle probabilistic associations and stochastic logical relationships between nodes, providing a mathematical foundation for dynamic behavior modeling of complex systems.
The three elements of a GERT network are logical nodes, directed branches, and flows [
35]. Nodes are jointly composed of input and output ends. The input end has three logical relationships (exclusive-or, inclusive-or, and-and), while the output end has two logical relationships (deterministic and probabilistic). This configuration yields six node types, as summarized in
Table 2.
GERT networks are essentially models of semi-Markov processes. In this process, the transition probability from state
i to state
j (or itself) is determined by a Markov chain, while the transition time is a random variable associated with states
i and
j. In GERT networks, transition probabilities correspond to the realization probabilities of activities (
i,
j), and transition times correspond to the durations of activities (
i,
j). The basic building block of the GERT network is shown in
Figure 5.
Based on the typhoon disaster chain constructed in
Section 3.1 and following logical transformation rules, the typhoon disaster scenario evolution process (
Figure 4) is mapped into a GERT network model. The key scenarios in the evolution process are identified in
Table 3.
In the GERT network, each scenario state is represented by corresponding “or-type” nodes. The network beginning has probabilities all equal to 1, using “deterministic” output nodes. Through appropriate logical transformations, both “inclusive-or” and “and-type” nodes can be converted to “exclusive-or” nodes. Through appropriate logical transformations, inclusive-or and and-type structures can be represented using equivalent exclusive-or computational forms. Accordingly, exclusive-or nodes were adopted for analytical tractability in the transfer-function calculation. It should be noted, however, that the branch probabilities used in this study represent conditional hazard-transition probabilities derived from historical observations rather than mutually exclusive routing probabilities. Therefore, multiple downstream consequences may be associated with the same upstream hazard event.
It should be noted that this simplification may affect model fidelity for nodes that inherently require multiple simultaneous inputs (and-type logic). For instance, in reality, certain infrastructure failures may require the co-occurrence of both flooding and power outage rather than either alone. However, the exclusive-or simplification is standard practice in GERT modelling and enables tractable analytical solutions. The implications of this modelling simplification are further discussed in the Limitations section (
Section 5.4).
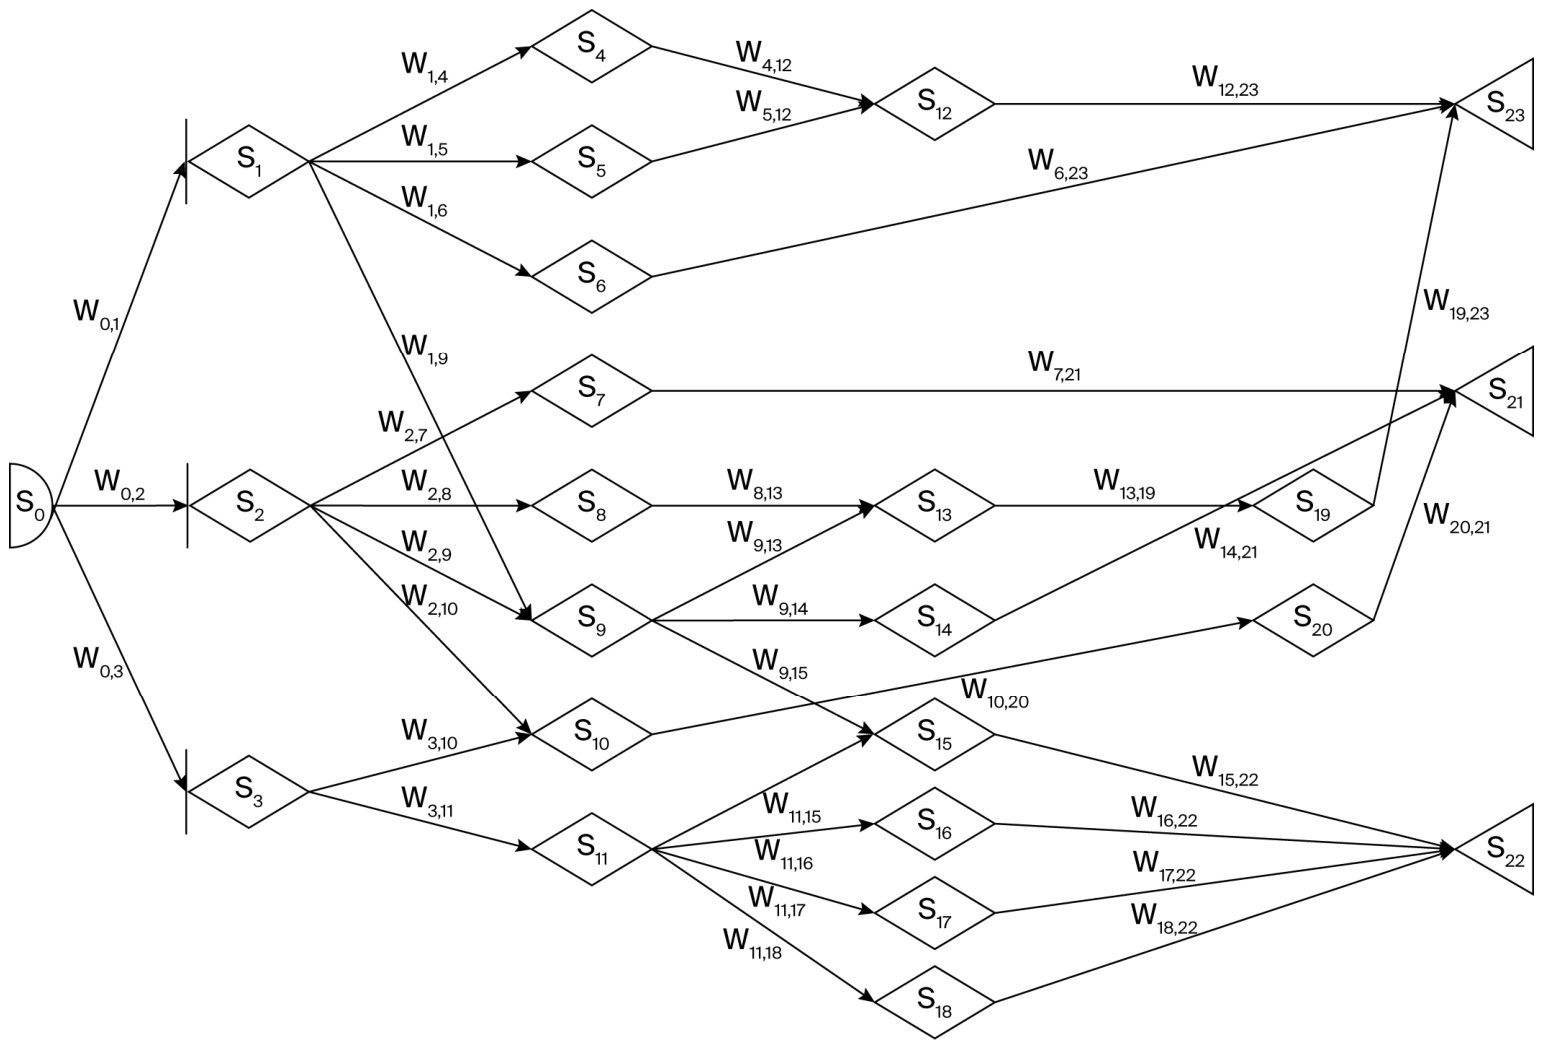
The resulting GERT network diagram for typhoon disaster chain evolution is presented in
Figure 6. This network comprises two basic structural types: series structure and parallel structure. Series structures represent sequential causal relationships (e.g., typhoon → heavy rainfall → tree falls), while parallel structures represent concurrent multiple pathways leading to the same outcome (e.g., both debris flows and landslides affecting infrastructure).
The complete GERT network shown in
Figure 6 represents the full typhoon disaster-chain structure derived from the FBIREC framework. However, not all pathways were incorporated into the quantitative simulation. In particular, the environmental-impact pathway involving S
13 (water quality pollution), its downstream consequence S
19 (increased biological pests and diseases), and the reconstruction stage S
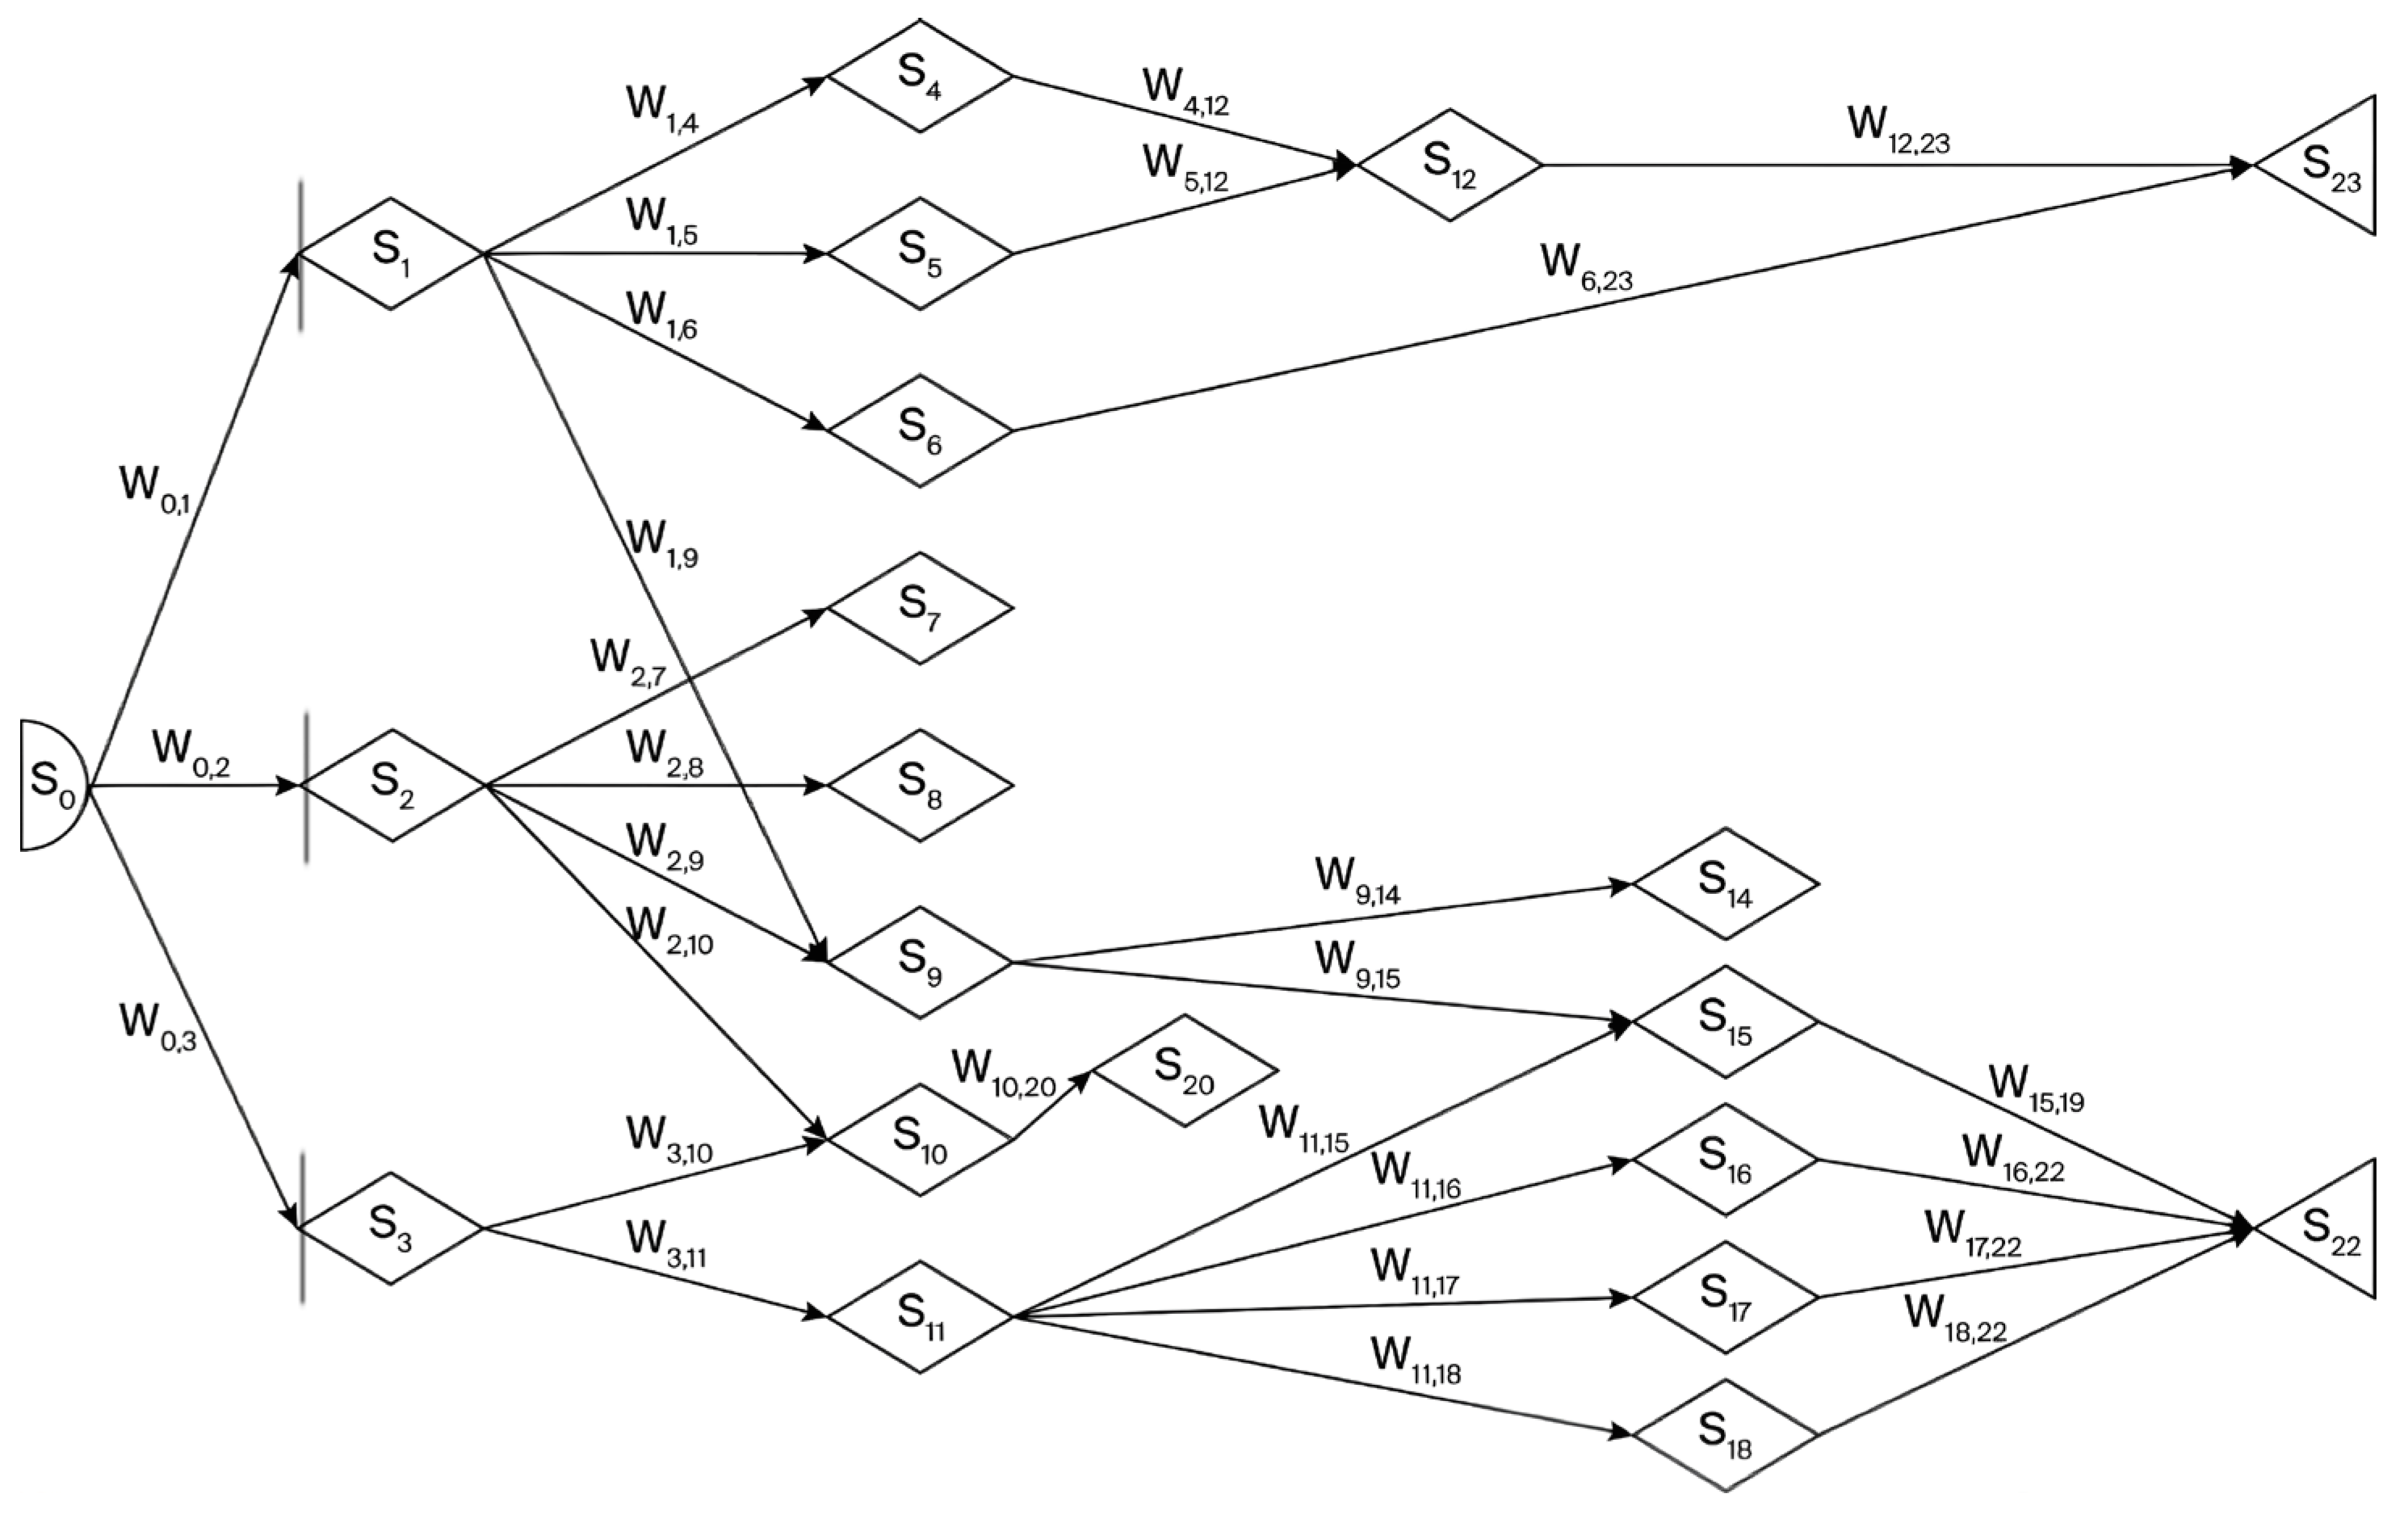
21 were excluded from the quantitative GERT calculation because sufficient duration parameters and downstream transition information were not available for reliable parameterization. To ensure consistency between the simulation network and the available data, a reduced quantitative GERT simulation network was constructed, as shown in
Figure 7.
3.3. Model Logic and Transmission Mechanisms
The GERT network for typhoon disaster chains operates through directed branches that represent evolutionary relationships between disaster events. Two basic types of network structures govern the propagation of hazards: series structure and parallel structure. Understanding these structures is essential for calculating the overall transfer function of the disaster chain.
Series structure. In a series structure, hazards propagate sequentially from one node to the next. This structure captures causal chains where one event must occur before the next can happen. For example, in the typhoon disaster chain, the sequence “typhoon → heavy rainfall → flood → building damage” follows a series structure because each event is a prerequisite for the subsequent one. In this case, the overall transfer function from the start node i to the end node j through intermediate nodes a, b, …, d is the product of the individual transfer functions:
Parallel structure. In a parallel structure, multiple independent pathways can lead to the same outcome. This structure captures situations where different hazard processes can trigger the same disaster event. For example, infrastructure damage (S12) may result from multiple independent hazard pathways, such as debris flows (S4) or landslides (S5). In a parallel structure, the overall transfer function from the start node i to the end node j is the sum of the individual transfer functions:
The overall probability of the outcome cannot be obtained by directly summing the probabilities of individual pathways, as parallel pathways may partially overlap. Therefore, the calculation must account for the logical relationship at the merging node, particularly the exclusive-or condition between alternative branches.
Combination of series and parallel structures. The Quantitative GERT Simulation Network used in this study (
Figure 7) consists of multiple series and parallel substructures arranged hierarchically. For series structures, the transfer functions of consecutive branches are multiplied sequentially. For parallel structures, the transfer functions of alternative branches are combined according to the exclusive-or relationship at the corresponding node. This recursive decomposition allows the systematic calculation of both transmission probabilities and expected durations throughout the disaster chain. In addition, the moment-generating function (MGF) associated with each branch describes the probability distribution of activity completion times, enabling the estimation of both expected values and variances. These measures are important for characterizing uncertainty in disaster propagation processes.
Example application. Consider the pathway corresponding to Event 1: typhoon → heavy rainfall → (debris flow OR landslide) → infrastructure damage → ecological restoration. This pathway contains both series and parallel structures. The parallel substructure consisting of debris flow and landslide branches is first combined using the parallel reduction rule. The equivalent transfer function obtained from this step is then multiplied by the transfer functions of the remaining series branches, including typhoon → heavy rainfall and infrastructure damage → ecological restoration. Through this stepwise reduction process, the overall transfer function incorporates all feasible propagation pathways within the network.
By systematically applying these combination rules, the GERT network model quantifies both the occurrence probability and expected timing of disaster chain propagation pathways, thereby providing a basis for identifying critical nodes and evaluating emergency response strategies.
3.5. Conditional Probability Estimation
For a given node S; being realized, the conditional probability of a subsequent event S
j is defined as:
In this study, (pij) represents the conditional occurrence probability of event (Sj) given the realization of event (Si). Therefore, multiple downstream events may be triggered by the same upstream event, and the probabilities associated with outgoing branches from a node are not required to sum to one. The branch probabilities should thus be interpreted as conditional hazard-transition probabilities rather than mutually exclusive routing probabilities.
Based on existing studies compiling historical typhoon loss data and probabilistic estimates for Guangdong Province [
34,
35], the conditional probabilities for all event transitions were calculated and are summarized in
Table 4.
Table 4 presents the historical conditional probabilities for the complete typhoon disaster-chain framework. Not all conditional probabilities reported in
Table 4 were subsequently incorporated into the quantitative GERT simulation. In particular, environmental-impact processes associated with S
13 and its downstream consequence S
19, as well as the reconstruction stage S
21, were retained in the conceptual framework but excluded from the quantitative simulation because reliable duration parameters and complete downstream transition information were unavailable. Therefore, these pathways do not appear in the activity parameter tables used for simulation (
Table 5 and
Table 6).
3.6. Activity Parameters for Super Typhoon Scenarios
In the GERT network simulation, each directed branch is characterized by two core parameters: occurrence probability Pij and time parameter tij. The time parameter represents the expected duration of transition from Si to Sj.
It should be noted that the probability values assigned to activities in the super typhoon scenario (
Table 5) differ from the historical conditional probabilities in
Table 4.
Table 4 reports average conditional probabilities derived from all typhoon events affecting Guangdong Province during 2014–2023, whereas
Table 5 presents adjusted parameters specifically calibrated for super typhoon conditions (sustained winds category 14). The adjustment is based on empirical evidence from the literature [
5,
36,
37] indicating that super typhoons exhibit systematically higher hazard transition probabilities due to their greater energy input and wider impact area. For example, the probability of typhoon-to-heavy-rainfall transition increases from 85.4% (historical average,
Table 3) to 90.0% (super typhoon scenario,
Table 5) based on observed data from category 14+ events. The parameter adjustment was intended to reflect the increased hazard intensity associated with super typhoon conditions and should therefore be interpreted as scenario-specific calibration rather than direct empirical estimation. These calibrated values were used to represent a plausible super-typhoon scenario based on historical observations and published literature, rather than to establish universally applicable transition probabilities.
Based on the moment-generating function (MGF) framework and empirical evidence from the literature, as well as datasets from the Ministry of Emergency Management of China, the parameters for each activity were estimated. Short-term parameters for super typhoon scenarios are presented in
Table 5 while long-term ecological recovery parameters are provided in
Table 6.
Additionally, the environmental-impact pathway (S
13–S
19) and the reconstruction stage (S
21), previously introduced in
Figure 6, were not included in the quantitative parameterization presented in
Table 5 and
Table 6 because corresponding duration parameters and complete downstream transition information were unavailable.
Table 5.
Short-term activity parameters for super typhoon disasters.
Table 5.
Short-term activity parameters for super typhoon disasters.
| Activity | Node Pair | Probability | Distribution | Parameter/h | MGF Mij(s) |
|---|
| A1 | S0 → S1 | 0.90 | Constant | t = 0.2 | |
| A2 | S1 → S4 | 0.20 | Constant | t = 0.2 | |
| A3 | S1 → S5 | 0.20 | Constant | t = 0.2 | |
| A4 | S4 → S12 | 0.50 | Exponential | t = 0.5 | |
| A5 | S5 → S12 | 0.40 | Exponential | t = 0.5 | |
| A6 | S1 → S6 | 0.28 | Normal | t = 1 = 0.2 | |
| A7 | S1 → S9 | 0.40 | Constant | t = 0.5 | |
| A8 | S9 → S14 | 0.42 | Normal | t = 1 = 0.2 | |
| A9 | S9 → S15 | 0.66 | Constant | t = 0.2 | |
| A10 | S0 → S2 | 0.70 | Constant | t = 0.1 | |
| A11 | S2 → S7 | 0.15 | Constant | t = 0.1 | |
| A12 | S2 → S8 | 0.35 | Exponential | t = 0.3 | |
| A13 | S2 → S9 | 0.35 | Constant | t = 0.5 | |
| A14 | S2 → S10 | 0.15 | Constant | t = 0.05 | |
| A15 | S0 → S3 | 0.70 | Constant | t = 0.2 | |
| A16 | S3 → S10 | 0.72 | Constant | t = 0.05 | |
| A17 | S10 → S20 | 0.06 | Constant | t = 0.02 | |
| A18 | S3 → S11 | 0.50 | Constant | t = 0.2 | |
| A19 | S11 → S15 | 0.66 | Constant | t = 0.5 | |
| A20 | S11 → S16 | 0.30 | Constant | t = 0.4 | |
| A21 | S11 → S17 | 0.66 | Constant | t = 0.5 | |
| A22 | S11 → S18 | 0.67 | Constant | t = 0.2 | |
| A23 | S15 → S22 | 0.80 | Normal | t = 12 = 3 | |
| A24 | S16 → S22 | 0.92 | Normal | t = 10 = 3 | |
| A25 | S17 → S22 | 0.91 | Normal | t = 10 = 3 | |
| A26 | S18 → S22 | 0.90 | Normal | t = 12 = 3 | |
Table 6.
Long-term activity parameters for super typhoon disasters.
Table 6.
Long-term activity parameters for super typhoon disasters.
| Activity | Node Pair | Probability | Distribution | Parameter/h | MGF Mij(s) |
|---|
| A27 | S12 → S23 | 0.90 | Normal | t = 25 = 10 | |
| A28 | S6 → S23 | 0.90 | Normal | t = 5 = 5 | |
The selection of probability distributions for activity durations was guided by the operational characteristics of different disaster processes and common practices in GERT-based stochastic network modelling. Three distribution types were adopted in this study: constant, exponential, and normal distributions.
Constant distributions were assigned to rapid triggering processes and direct hazard transitions (e.g., typhoon occurrence, heavy-rainfall generation, storm-surge formation, and immediate infrastructure impacts). These activities typically occur within a relatively short time window and exhibit limited temporal variability compared with the overall disaster-chain evolution. Therefore, they were approximated as deterministic transitions for modelling simplicity.
Exponential distributions were assigned to hazard-development processes characterized by stochastic waiting times, including debris-flow generation, landslide-induced infrastructure impacts, and seawater intrusion. Such processes are influenced by multiple environmental conditions and may occur randomly after threshold exceedance, making the exponential distribution suitable for representing their temporal uncertainty.
Normal distributions were assigned to recovery-related activities and processes with relatively stable average durations, including emergency repair, utility restoration, ecological restoration, and tree-fall clearance. These activities are typically influenced by multiple independent factors, such as resource availability, workforce deployment, weather conditions, and logistical constraints. According to the central limit theorem, the combined effects of multiple independent factors can often be reasonably approximated using normal distributions.
The mean duration parameters were estimated from official disaster reports, emergency-management documents, and published studies concerning typhoon impacts in Guangdong Province. Standard-deviation parameters were introduced to represent operational uncertainty associated with disaster response and recovery activities. Specifically, σ = 3 h was assigned to emergency-repair processes (A23–A26), reflecting moderate variability in resource deployment, repair efficiency, and weather conditions during post-disaster operations. Larger uncertainty was assumed for long-term ecological restoration activities (A27), for which σ = 10 h was adopted because recovery durations are influenced by multiple environmental and management factors and generally exhibit substantially greater variability than short-term emergency repairs. These values should therefore be interpreted as representative scenario parameters rather than precise empirical measurements. Future studies may improve parameter accuracy through detailed empirical observations and larger post-disaster datasets.
For the stochastic network G = (N, A), where node set N contains only “exclusive-or” type nodes, the probability parameter p
ij and moment-generating function were combined into a single parameter represented by the transfer function W
ij(s):
where p
ij represents the occurrence probability of node (Si, Sj) and M
ij(s) represents the moment-generating function of that node. For transfer functions in parallel structures, Mason’s formula can be applied for solution:
For transfer functions in series structures, the transfer function can be expressed as:
From these, the transfer probability PE, expected time E(t), and variance V(t) can be obtained by setting s = 0:
These equations form the computational basis for quantifying the probabilistic propagation of typhoon disaster chains, enabling the calculation of transmission probabilities, expected durations, and their variances for each pathway in the network.