1. Introduction
The transition toward decentralized and renewable-based energy systems has become one of the strategic priorities of the global climate agenda, particularly in rural territories where dependence on fossil fuels continues to operate as a structural obstacle to sustainable development. According to Tracking SDG 7: The Energy Progress Report 2025, jointly prepared by the International Energy Agency, the International Renewable Energy Agency, the United Nations Statistics Division, the World Bank, and the World Health Organization [
1], approximately 666 million people still lacked access to electricity in 2023, while nearly 2.1 billion remained dependent on polluting fuels for cooking. This gap makes the achievement of universal access by 2030 unfeasible if the current pace of progress is maintained.
In addition, Sub-Saharan Africa accounts for approximately 85% of this deficit, while rural regions of Latin America and South Asia share similar structural patterns, in which geographic dispersion, low population density, and the limited profitability of conventional grid expansion make hybrid microgrids the most technically viable and economically competitive alternative. Consequently, systems that combine photovoltaic generation with anaerobic digestion for biogas production emerge as a particularly promising configuration because of their seasonal complementarity, their capacity to use agricultural and livestock residues, and their alignment with the guiding principles of the circular bioeconomy [
2,
3,
4].
Despite the growing technical evidence supporting the feasibility of these hybrid solutions, the specialized scientific literature has focused predominantly on sizing optimization, economic dispatch, and techno-economic analysis, leaving comparatively underexplored the behavioral and organizational determinants that condition the effective adoption decision [
5,
6,
7]. Indeed, while HOMER-based simulation tools, metaheuristic algorithms, and multi-objective models have reached considerable methodological maturity for sizing biogas-solar microgrids [
8,
9,
10], a tangible disconnect persists between the technological prescriptions derived from such models and the actual willingness of recipient organizations to internalize these solutions in their daily operations.
Because hybrid biogas–solar microgrids are strongly local technologies, their viability cannot be inferred from organizational opinion alone. Any implementation decision must also consider the availability and seasonality of biomass residues, solar irradiation, waste collection logistics, expected power demand, storage needs, operating and maintenance capacity, regulatory permits, and the results of a prior techno-economic feasibility assessment. Therefore, the present manuscript does not evaluate the technical design or economic feasibility of a specific microgrid project; rather, it examines the declared organizational conditions that may precede interest in such projects. The empirical scope is consequently local and exploratory, mainly linked to the territorial context represented in the sample, and the results are not intended to be valid worldwide.
Likewise, the most recent evidence on barriers to renewable energy integration indicates that obstacles are not concentrated exclusively in the financial dimension; rather, they are intertwined with institutional factors, internal organizational capabilities, and perceived environmental legitimacy. This condition requires integrative analytical frameworks capable of capturing such multidimensionality [
11,
12,
13]. In addition, bibliometric studies published over the last three years converge in showing that the conversion of favorable environmental attitudes into effective investment intentions remains a process mediated by internal configurations that have not yet been sufficiently mapped within the circular bioenergy field.
In parallel, interpretable machine learning has consolidated its role as an increasingly prominent analytical tool in energy transition research, owing to its ability to model nonlinear relationships among multiple predictors while preserving the traceability of predictive decisions through permutation importance, SHAP values, and hierarchical variable-decomposition techniques [
14,
15]. However, its specific application to modeling the adoption intention of hybrid biogas-solar microgrids within explicit circular bioeconomy frameworks remains, to date, a scarcely explored niche, particularly in Latin American contexts where the convergence of residual biomass availability, high solar irradiation, and unmet rural demand would generate ideal conditions for deployment.
Accordingly, the research problem is synthesized in the following guiding question: what configuration of organizational and environmental determinants makes it possible to predict, through interpretable machine learning, the adoption intention of biogas-solar microgrids in organizations embedded within a circular bioeconomy framework? This question is disaggregated into three operational questions: what is the aggregate descriptive profile of the predictor blocks; which supervised algorithm provides the best balance between predictive performance and interpretability; and which latent profiles can be identified through unsupervised segmentation as an explanatory complement to the main model.
The justification of the study rests on three complementary analytical dimensions. From the theoretical dimension, the study provides exploratory evidence regarding the articulation between internal organizational capabilities and perceived environmental legitimacy as antecedents of technological intention, thereby extending classical technology adoption frameworks toward a systemic approach to sociotechnical maturity that integrates capabilities, perceptions, and contextual conditions within a single explanatory model [
16]. From the methodological dimension, it integrates a reproducible pipeline that combines supervised classification, continuous regression, and unsupervised segmentation using ExtraTrees, Random Forest, permutation importance, principal component analysis, and K-Means clustering, thereby strengthening interpretive capacity without sacrificing predictive performance, a fundamental requirement for data science tools to be adopted by the environmental research community [
14]. From the applied dimension, the findings may guide the design of targeting policies intended to identify organizational profiles with greater willingness to invest in circular bioenergy solutions, thus facilitating the prioritization of public and private resources in territories where financial, institutional, and organizational-capability constraints coexist simultaneously. In this sense, the study is positioned as an analytical bridge between the technical evidence accumulated by the techno-economic literature and the operational needs of those who design instruments to promote the energy transition.
The applied contribution is limited to decision-support screening. The results may help organizations, policymakers, and project developers identify which organizational, environmental, financial, and institutional conditions deserve attention before investing in feasibility studies or pilot projects. They should not be used as a stand-alone decision rule for financing, installation, or deployment.
The knowledge gap addressed by this study emerges from the convergence of four systematically identified gaps. First, most research on biogas–solar microgrids privileges techno-economic analysis over the behavioral component, producing knowledge that is useful for sizing but insufficient for sustained implementation [
17,
18]. Second, studies addressing renewable energy adoption often rely on classical linear models, such as logistic regression, multilevel regression, or structural equations, thereby underusing the potential of tree-ensemble algorithms to capture complex interactions among behavioral predictors [
19]. Third, the specific dimension of the circular bioeconomy has been treated predominantly from macroeconomic or public policy perspectives, with limited incorporation at the organizational micro level, which restricts its usefulness for operational decision-making [
16]. Finally, the evidence available from developing economies in Latin America regarding circular technology adoption remains fragmented and dispersed. For these reasons, the study is explicitly aligned with Sustainable Development Goal 7, which concerns affordable and clean energy; Goal 12, related to responsible consumption and production; and Goal 13, associated with urgent climate action, thereby articulating its scientific contribution with global targets on energy access, organic waste valorization, and greenhouse gas mitigation.
As a consequence of the preceding framework, the general objective of the study is to exploratorily analyze through interpretable machine learning the organizational and environmental determinants associated with stated adoption intention of biogas–solar microgrids within a circular bioeconomy framework. Three specific objectives derive from this general objective: first, to identify the aggregate descriptive profile of the organizational, environmental, financial, institutional, perceived benefit, and barrier variable blocks associated with adoption intention; second, to compare the exploratory predictive performance of eight supervised classification algorithms and eight continuous regression algorithms, selecting the model with the best discriminant and interpretive capacity according to a composite criterion integrating ROC AUC, F1 score, balanced accuracy, and average precision; and third, to identify tentative latent organizational readiness profiles through unsupervised segmentation with K-Means and validation by silhouette coefficient, thereby complementing the supervised predictive reading with a typological reading of the cases.
Based on the available conceptual evidence, three working hypotheses are proposed and interpreted as exploratory expectations rather than confirmatory population-level claims. The first hypothesis (H1) states that organizational capabilities constitute the predictor block with the greatest explanatory weight over adoption intention, surpassing perceived benefits, institutional conditions, and financial factors. The second hypothesis (H2) proposes that tree-ensemble algorithms will outperform penalized linear models in predictive capacity because of the nonlinear nature of the interactions among behavioral predictors. The third hypothesis (H3) posits that the sample will reveal at least two differentiated latent profiles, in which high intention will emerge from a systemic configuration that simultaneously articulates organizational capabilities, environmental legitimacy, financial feasibility, and institutional conditions, rather than from a single isolated factor.
3. Materials and Methods
3.1. Research Design
The study was developed under a quantitative, applied, cross-sectional, and correlational predictive approach aimed at analyzing the factors that explain the adoption intention of biogas-solar microgrids within the framework of the circular bioeconomy. The research was non-experimental because no variable was manipulated; rather, the perceptions, capabilities, and organizational conditions declared by participants were observed in their real context. Likewise, the design was cross-sectional, since the information was collected during a single fieldwork period between December 2025 and February 2026.
From the analytical standpoint, the study combined psychometric procedures, statistical modeling, and machine learning techniques. This strategy made it possible to evaluate not only the internal structure and reliability of the instrument but also the capacity of the data to classify profiles with high technological adoption intention. Consequently, the methodology was conceived as an integrated process of measurement, validation, predictive modeling, and explainable interpretation of the factors associated with the adoption of sustainable energy solutions.
Given the small sample size and the use of nonprobabilistic convenience sampling, the study was explicitly treated as an exploratory pilot analysis. The machine-learning models were used to examine patterns in the available responses and to generate hypotheses for future validation; they were not intended to provide a definitive predictive instrument for adoption decisions or to support generalizable claims about the population of organizations interested in hybrid microgrids.
3.2. Population, Sample, and Sampling
Participants were individual respondents who reported links with production units, organizations, ventures, or companies related to agriculture, agro-industry, livestock, energy, waste management, or other activities with potential biomass use. Responses were not completed by groups or by formally constituted organizational panels; rather, each questionnaire represented the perception of one participant associated with a relevant organizational or productive context. This distinction is important because the unit of measurement was the respondent’s declared perception, whereas the analytical interpretation refers cautiously to organizational conditions.
Participants were recruited through purposive convenience criteria because no closed and verifiable sampling frame was available for actors with potential interest in biogas–solar microgrids. Inclusion criteria required that respondents be adults, be linked to an organization or productive activity with potential relevance to biomass, renewable energy, waste management, or circular bioeconomy processes, and have sufficient familiarity with the operational context to answer the instrument. The questionnaire also collected profile variables related to sector, firm size, biomass availability, previous experience with renewable energy, and respondent role. No probabilistic representativeness is claimed.
Although the inclusion criteria required contextual familiarity, the study did not independently test each participant’s technical knowledge of biogas-solar engineering, nor did it verify whether respondents could estimate the quantity, quality, and continuity of waste required for constant power generation. Before answering, participants were presented with a general description of biogas–solar microgrids and their dependence on organic residues and solar resource; however, the survey measures adoption intention under a conceptual scenario, not validated project readiness.
The analytical database comprised 71 original responses, with no record deletion, and 42 initial columns that included profile variables and 35 Likert-type items. In territorial terms, the sample showed a relevant concentration in Cajamarca, which recorded 31 valid responses and represented 47% of cases with a declared region; participation was also observed from La Libertad, Lambayeque, Lima, Piura, Amazonas, and Trujillo. This composition supports a differentiated local reading but prevents statistical generalization to all organizations in Peru, Latin America, or other contexts.
3.3. Instrument and Operationalization of Variables
The information was collected through a structured questionnaire composed of closed items on a five-point Likert scale, aimed at measuring perceptions, barriers, institutional conditions, financial viability, environmental value, organizational capabilities, and adoption intention. The instrument was organized into seven analytical blocks: perceived benefits, adoption barriers, institutional readiness, financial feasibility, environmental value, organizational capability, and adoption intention. This structure made it possible to capture the phenomenon from a multidimensional perspective, considering both technical and economic factors as well as organizational and environmental conditions.
The main dependent variable was constructed from the items associated with the intention to adopt or invest in biogas-solar microgrids. First, these items were aggregated into a continuous intention score; subsequently, a binary variable was generated to distinguish cases with high adoption intention from cases with low or moderate intention. This dual operationalization allowed the phenomenon to be analyzed both as a gradual disposition and as a classifiable condition. To avoid problems of circularity or predictive overestimation, the items used to construct the target variable were excluded from the predictor set in the supervised models.
The dependent variable therefore represents stated adoption intention. It should not be interpreted as evidence of real adoption, investment, installation, or sustained use. Actual adoption would additionally require investment capacity, engineering design, availability of organic waste in sufficient quantity and quality, solar resource assessment, grid/interconnection conditions, technical support, operation and maintenance arrangements, and a favorable regulatory environment.
The binary threshold of 4.0 was selected because the five-point Likert scale defined values of 4 and 5 as agreement or strong agreement with the intention items. This cutoff therefore identifies respondents whose average intention score expresses at least clear agreement with adoption or investment interest. The threshold is demanding enough to distinguish high intention from neutral or moderate positions, while preserving a balanced distribution for classification, with 36 low/moderate cases and 35 high-intention cases.
Each block score was constructed as the arithmetic mean of its items after numeric conversion of the Likert responses. The predictor matrix included profile variables and item-level predictors from the BEN, BAR, INS, FIN, ENV, and ORG blocks. The three intention items were used only to construct the target variable and were excluded from the supervised predictor set to avoid circular prediction and artificial inflation of model performance.
3.4. Instrument Validity and Expert Judgment
The content validity of the instrument was supported through expert judgment by three specialists with complementary profiles in renewable energy/circular bioeconomy projects, quantitative research and instrument validation, and organizational management of sustainable technologies. The review evaluated four criteria for each item: relevance to the construct, clarity of wording, coherence with the theoretical block, and representativeness of the dimension measured. This procedure made it possible to evaluate whether the items adequately reflected the conceptual components of perceived benefits, barriers, institutional conditions, financial feasibility, environmental criteria, organizational capabilities, and adoption intention.
On the basis of this validation, the instrument was refined before its definitive application, seeking to ensure that the items maintained conceptual correspondence with the study variables and were understandable to participants. The expert observations were used to adjust item wording, reduce semantic ambiguity, and verify the correspondence between the item blocks and the phenomenon of biogas–solar microgrid adoption in circular bioeconomy contexts. The complete item structure is reported in
Appendix A, and the expert validation forms are indicated in the
Supplementary Materials.
3.5. Internal Reliability: Cronbach’s Alpha and McDonald’s Omega
The internal reliability of the instrument was evaluated using Cronbach’s alpha and McDonald’s omega in order to estimate the consistency of the items grouped within each theoretical dimension of the questionnaire. Cronbach’s alpha allowed the internal homogeneity of the scales to be assessed under the assumption of item consistency, while McDonald’s omega was incorporated as a more robust complementary indicator in the presence of possible differences in the factorial loadings of the items. This double verification strengthened the psychometric evaluation of the instrument and supported its subsequent use in statistical, structural, and predictive analyses.
The Cronbach’s alpha results showed adequate levels of internal consistency in most dimensions. The perceived benefits dimension obtained a value of α = 0.7933; institutional support and alliances, α = 0.7837; economic-financial viability, α = 0.8879; environmental-circular impact, α = 0.9260; organizational circular readiness, α = 0.8777; and adoption/investment intention, α = 0.7054. These values exceed the commonly accepted minimum threshold of 0.70, indicating adequate internal coherence among the items comprising each block. In the case of perceived barriers, the coefficient was α = 0.6983, a value practically equivalent to the 0.70 cutoff point; therefore, it was considered acceptable with methodological caution, especially because this dimension consisted of only two items, a condition that may naturally reduce the magnitude of alpha. The reversed version of this same dimension maintained the same coefficient, α = 0.6983, as it was a linear transformation of the same items.
3.6. Data Preparation and Cleaning
Before modeling, the database was subjected to a statistical preparation process. Record consistency was verified, variable names were standardized, Likert responses were transformed into numeric format, and the presence of missing values was reviewed. According to the data preparation matrix, Likert-type items were converted to integers from 1 to 5, the blocks were aggregated by simple means for each theoretical dimension, and the final matrix was structured in numeric format for use in SEM, machine learning, or regression.
Likewise, the items associated with barriers were treated according to their conceptual orientation so that they could be interpreted coherently within the general model. The final matrix made it possible to construct dimensional indicators, profile variables, categorical codifications, and a binary target variable linked to high adoption intention. This phase was fundamental to ensuring that the data entered the models under appropriate conditions of consistency, traceability, and comparability.
3.7. Statistical Analysis and Modeling Strategy
The analysis incorporated a descriptive, psychometric, and predictive route. First, the sample was characterized using frequencies and percentages associated with region, economic sector, company size, biomass availability, previous experience with renewable energies, and participant role. Second, the quality of the instrument was evaluated through internal consistency, content validity, and dimensional aggregation of the items. Third, a modeling strategy was developed to explain and predict the adoption intention of biogas-solar microgrids.
The supervised strategy included a binary classification task to estimate the probability of high adoption intention and a regression task to approximate the continuous intention score. For this purpose, linear and nonlinear models were compared, including penalized logistic regression, support vector machines, Random Forest, Extra Trees, Gradient Boosting, HistGradientBoosting, and XGBoost for classification; while Ridge, Elastic Net, SVR, and tree-based ensemble models were considered for regression (Python 3.14.6). This comparison made it possible to identify the type of algorithm with the best performance for representing a phenomenon characterized by complex relationships among perceptions, capabilities, and technological disposition.
3.8. Validation and Performance Metrics
Model validation used a stratified 75/25 train-test partition for classification, preserving the balance between the high-intention and low/moderate-intention groups. The final hold-out test set contained 18 cases, and the remaining cases were used for training. Model comparison also used five-fold cross-validation; in classification, the folds were stratified, whereas in regression the folds were generated from the continuous intention score. Because the dataset was small, performance metrics were interpreted jointly rather than as definitive estimates of out-of-sample accuracy.
In the regression task, performance was examined using RMSE, MAE, MAPE, R2, and explained variance. Selection of the best model was based on differentiated criteria according to the nature of the task: for classification, a composite criterion integrating ROC-AUC, F1-score, balanced accuracy, and average precision was prioritized; for regression, the reduction of RMSE was considered primarily, complemented by R2 as an indicator of explanatory capacity. Hyperparameter search was deliberately limited to reduce overfitting: penalized models used regularization, tree ensembles were configured with conservative settings and fixed random seeds, and model selection prioritized cross-validated performance rather than only hold-out performance. The analysis also reported calibration, Brier score, log loss, MCC, and error matrices to detect overconfident or unstable behavior. These precautions reduce, but do not eliminate, the risk that the results are sample-specific; therefore, external validation with larger samples is required.
3.9. Interpretability and Complementary Analysis
The interpretation of the results was strengthened through variable-importance analysis, correlations with adoption intention, permutation importance, and native importance of tree-based models. These techniques made it possible to identify the most influential predictors and to understand which dimensions contributed greater explanatory capacity in the classification of high-intention profiles. Complementarily, unsupervised exploration procedures, such as principal component analysis and K-Means clustering, were applied to identify latent profiles of organizational readiness, environmental perception, and technological disposition.
This methodological combination transformed perceptual data into analytical evidence useful for understanding the adoption of biogas–solar microgrids. Rather than being limited to a description of responses, the proposed approach made it possible to recognize patterns, estimate probabilities, compare models, and explain the relative contribution of the analyzed dimensions. In this way, the methodology offered a solid technical basis for studying the adoption of sustainable energy technologies in circular bioeconomy contexts.
Cluster analysis was used only as an exploratory segmentation tool. The silhouette coefficient was interpreted as evidence of weak-to-moderate separation, not as a definitive classification of organizations. For this reason, clusters are discussed as tentative readiness profiles requiring replication with larger samples and independent validation.
3.10. Scope of Technical and Economic Inference
This study does not estimate electrical output, biodigester sizing, photovoltaic capacity, levelized cost of energy, payback period, or the minimum biomass flow required for continuous generation. Those elements must be assessed through local engineering and techno-economic studies before any adoption decision. Consequently, the present analysis should be read as an organizational perception and intention study that identifies possible preconditions for future feasibility work, not as a viability assessment of biogas–solar microgrids in a specific location.
4. Results
The analytical processing was conducted on 71 valid observations and 40 original columns. After excluding the three items used to construct the target variable, the modeling system retained 37 numerical predictors associated with participant profile, perceived benefits, barriers, institutional conditions, financial factors, environmental criteria, and organizational capabilities. The main dependent variable was constructed as the average of the INT1, INT2, and INT3 items, generating the continuous Target_Intention_Score indicator. Additionally, a binary variable called Target_High_Intention was defined using a threshold value of 4.0 on the Likert scale, which made it possible to differentiate cases with high adoption or investment intention from cases with low or moderate intention. According to
Table 1, the final analytical configuration presents an almost balanced distribution between classes, with 36 cases of low or moderate intention and 35 cases of high intention, a methodologically favorable condition for training supervised classifiers because it reduces the risk of extreme bias toward a dominant class.
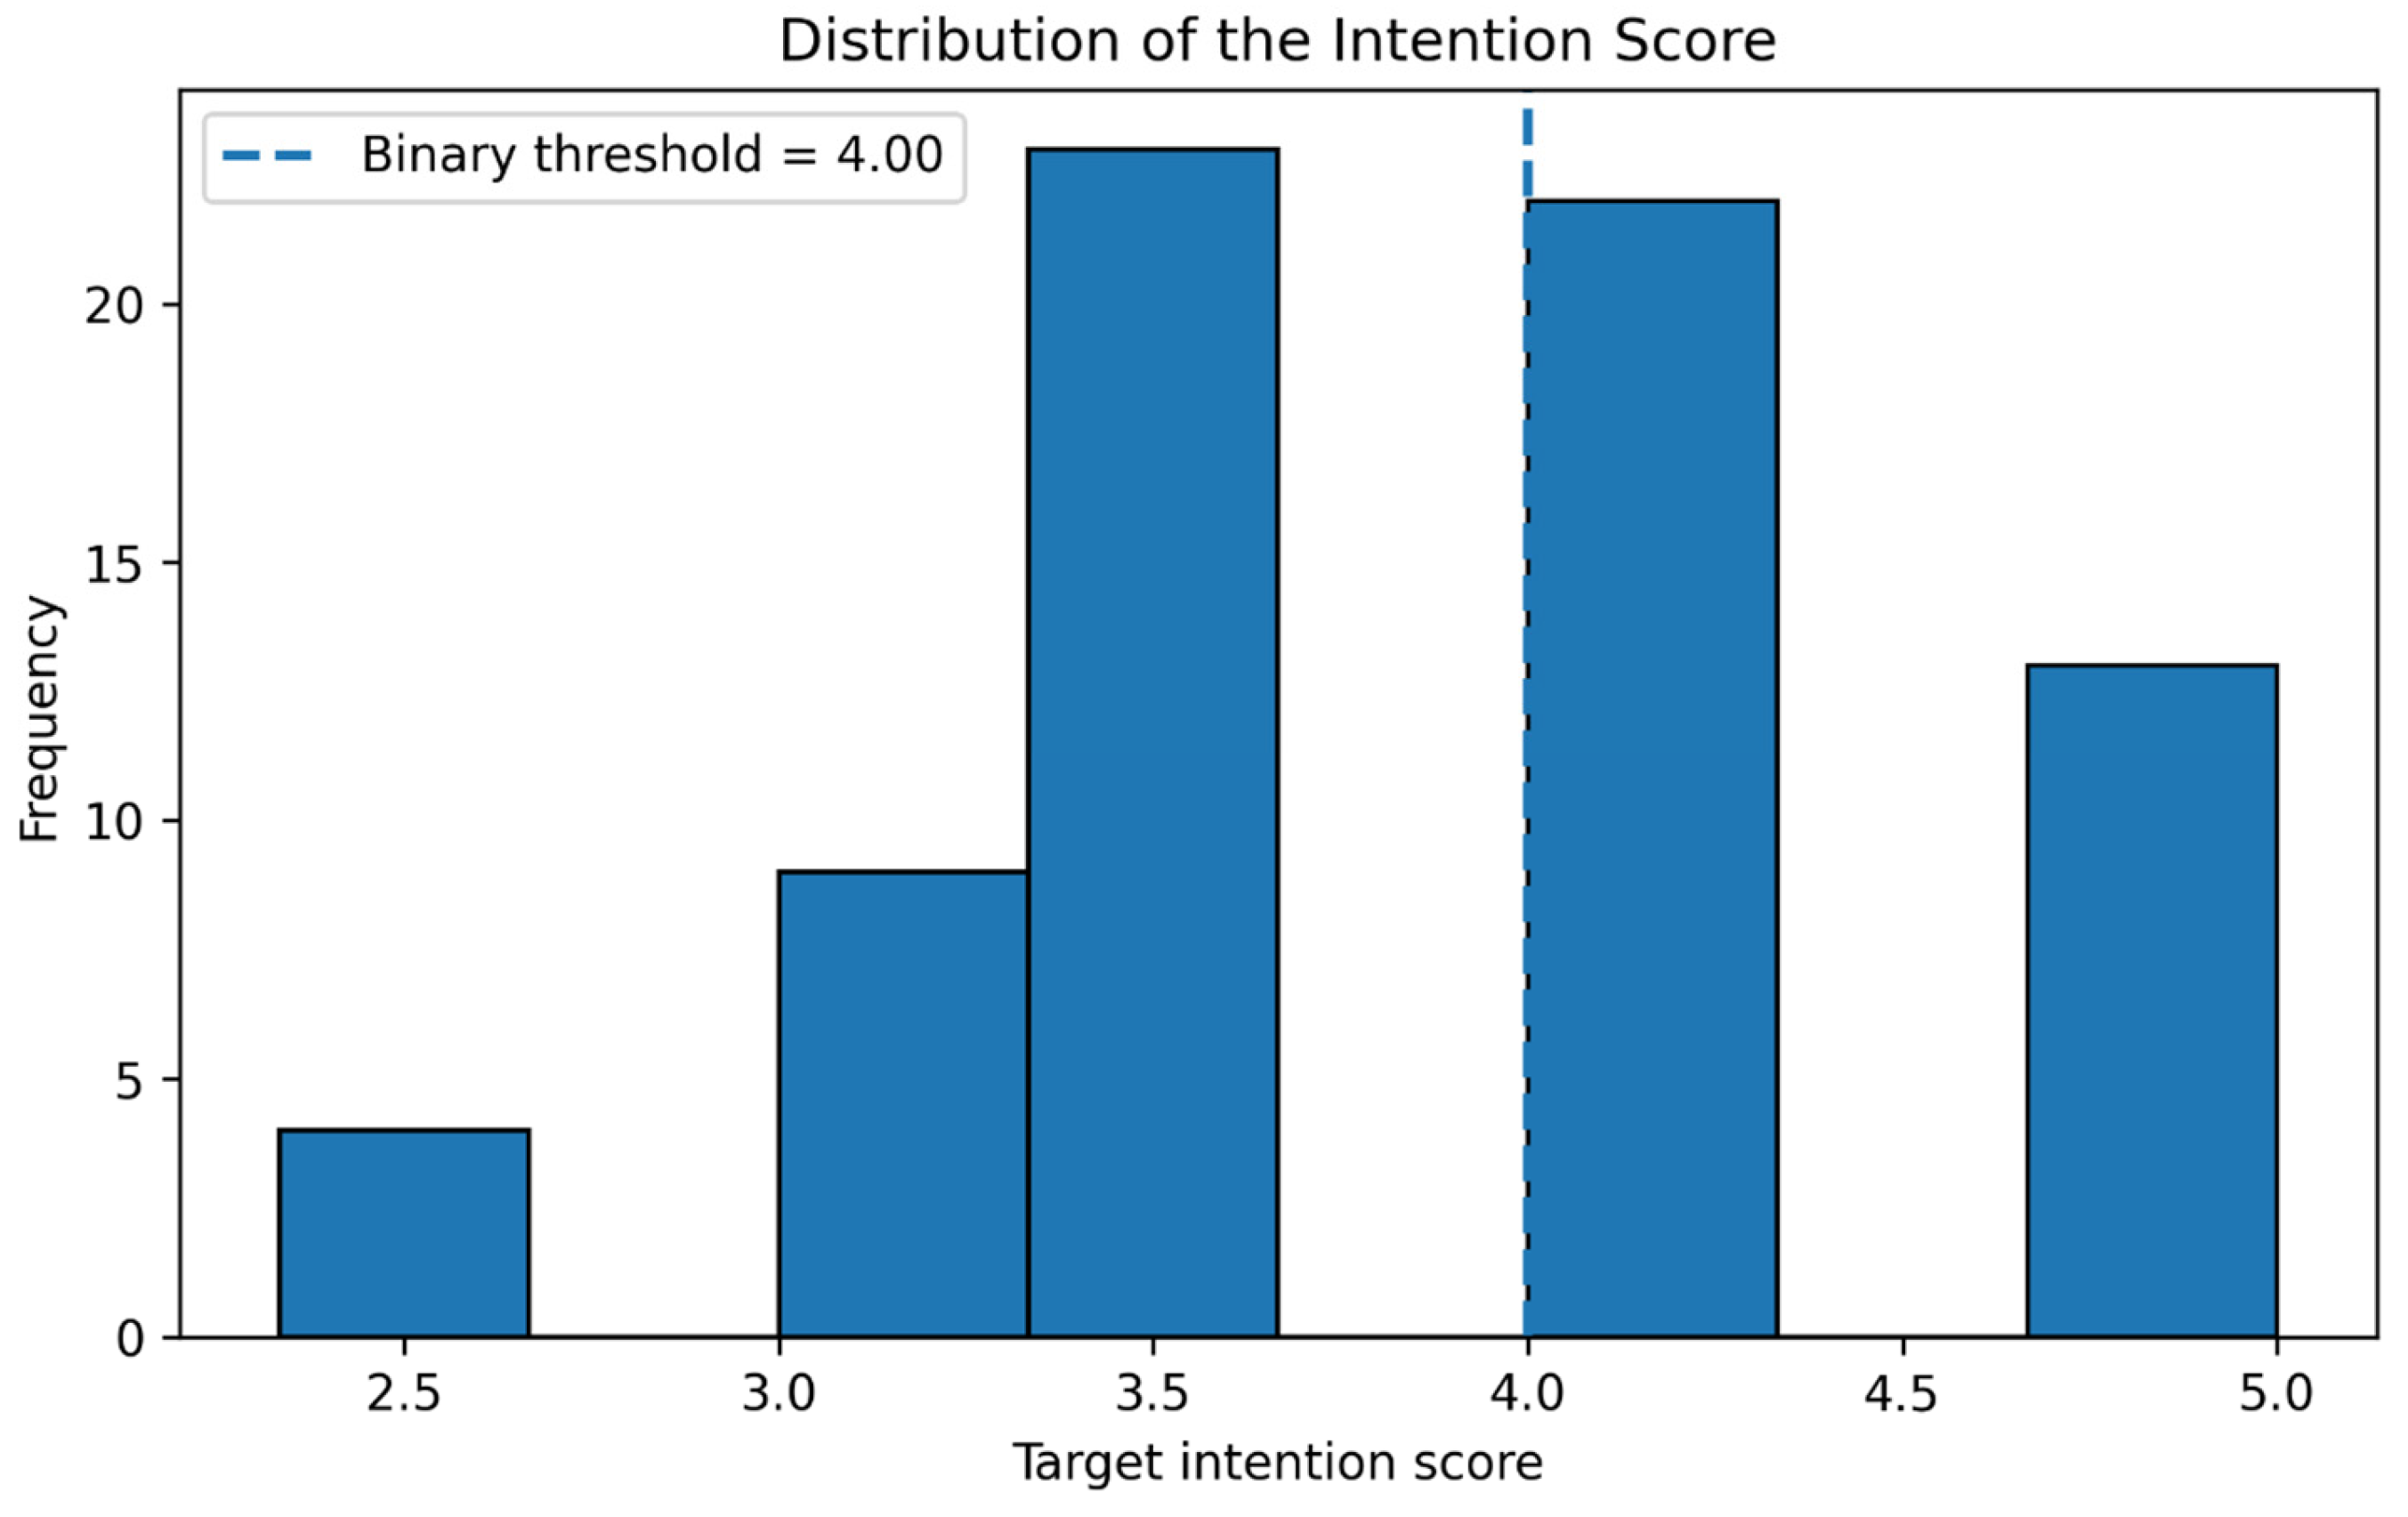
The empirical distribution of the target variable confirms that intention toward the adoption of biogas–solar microgrids does not behave as a marginal or exceptional variable within the sample, but rather as an outcome with substantive presence in almost half of the cases. According to
Figure 1, the intention score is concentrated around medium–high values, although without collapsing completely at the upper end of the scale. This pattern is relevant because it indicates that the phenomenon should not be interpreted only as general acceptance of the circular bioeconomy, but as a heterogeneous disposition modulated by organizational, environmental, financial, and institutional conditions. In modeling terms, this variability is especially important because it allows algorithms to learn decision boundaries and response gradients instead of operating on a database saturated by homogeneous responses.
The descriptive profile of the predictor blocks shows a consistently favorable valuation structure toward environmental components and perceived benefits, although with greater caution regarding barriers and some financial factors. According to
Table 2, the environmental block presents the highest aggregate mean among the observed constructs, with an average of 4.092, followed by perceived benefits with 4.028 and organizational capabilities with 3.984. These values suggest that environmental legitimacy and the perception of strategic usefulness of biogas–solar microgrids constitute mature dimensions within respondents’ imaginaries. However, the barriers block registers the lowest mean, with 3.387, indicating that obstacles do not disappear in the presence of a positive valuation of the technology; rather, they remain a structural dimension that may moderate the conversion of favorable attitudes into effective adoption intention.
The item-level analysis confirms that environmental valuation does not operate as a peripheral element, but rather as one of the model’s highest-intensity cores. The ENV1, ENV8, ENV3, ENV6, and ENV2 indicators are among the variables with the highest means, all above 4.09 on the scale, which evidences that the adoption of biogas–solar microgrids is strongly associated with an expectation of environmental contribution and operational sustainability. In contrast, BAR2 and BAR1 register the lowest averages, with means of 3.366 and 3.408, respectively. This gap suggests a central tension in the results: the field of application perceives high environmental and strategic benefits, but adoption still faces technical, economic, institutional, or implementation barriers that prevent an automatic transition from conceptual acceptance to the investment decision.
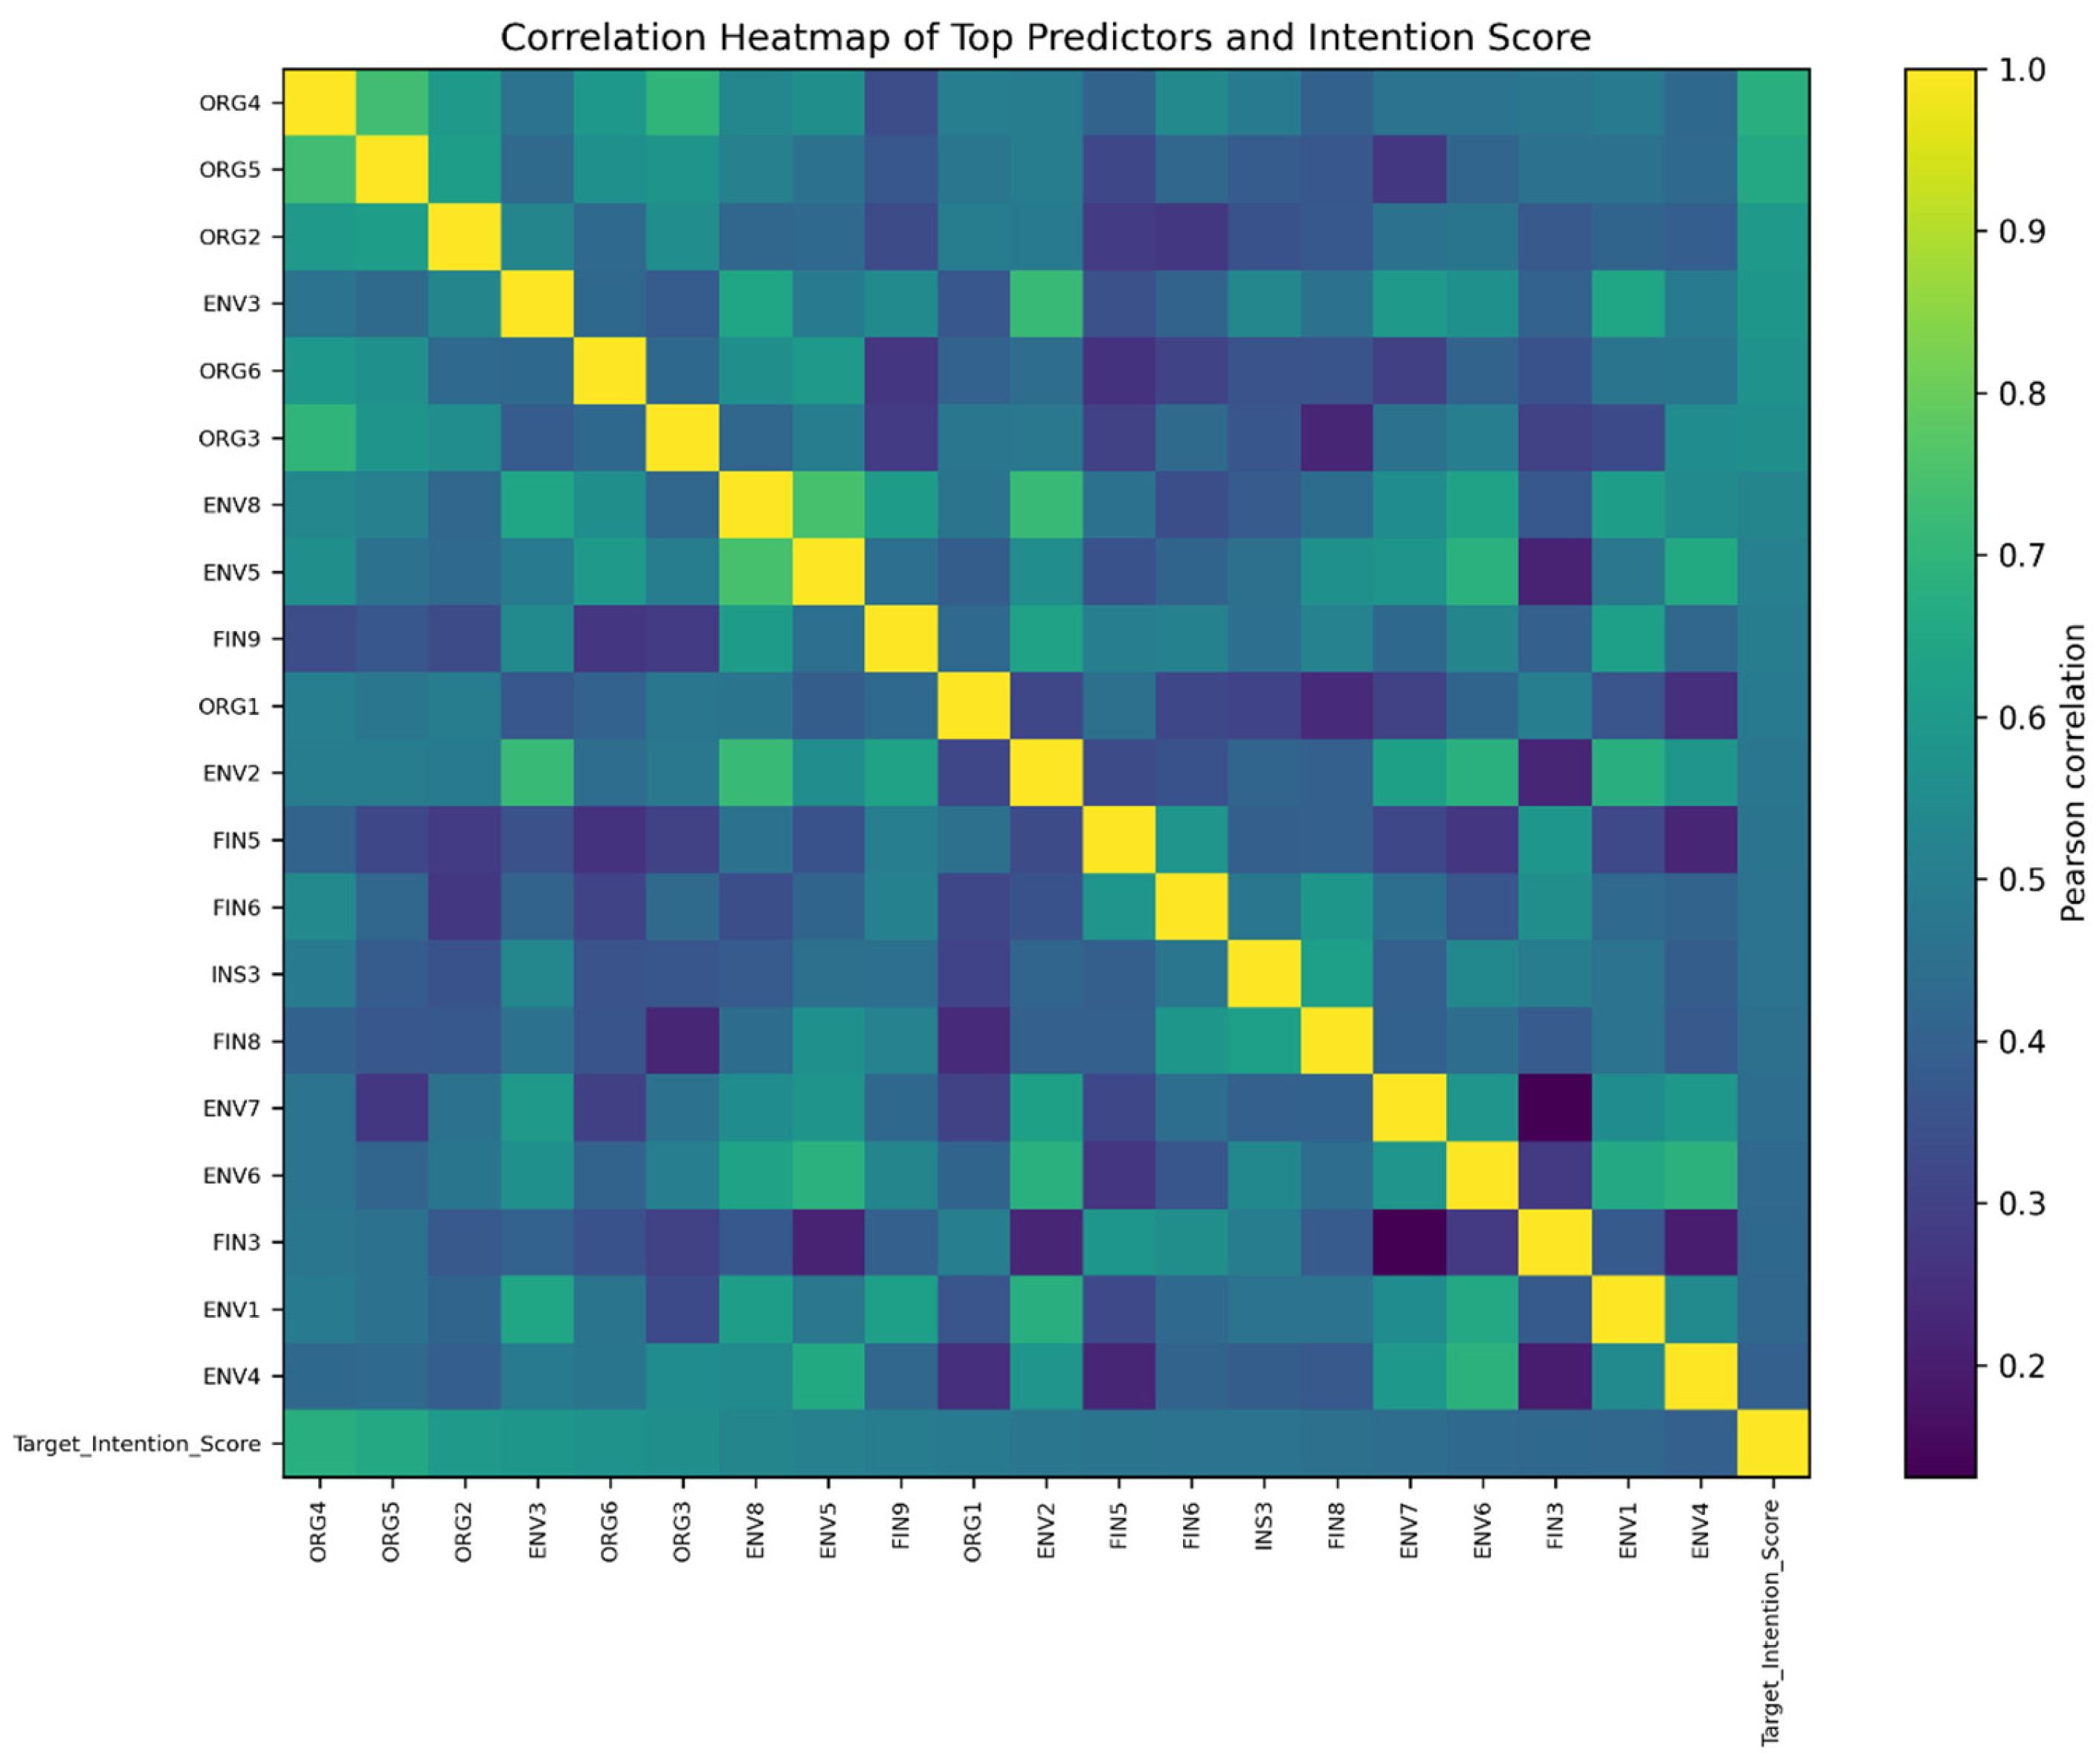
The correlation matrix between predictors and the continuous intention score reveals that organizational capabilities explain a substantive part of the observed variability in adoption intention. According to
Table 3, ORG4 shows the highest correlation with intention, with a coefficient of 0.680, followed by ORG5 with 0.657, ORG2 with 0.597, ENV3 with 0.590, ORG6 with 0.575, and ORG3 with 0.565. This result is technically relevant because it indicates that intention does not depend solely on environmental perception or technological attractiveness, but on the internal capacity of organizations to translate that opportunity into a viable decision.
Figure 2 complements this reading by showing that the main predictors are not randomly distributed, but rather form a correlational core in which organizational and environmental variables appear as closely articulated dimensions.
For the prediction of high adoption intention, eight supervised algorithms were compared: logistic regression with L2 regularization, Elastic Net logistic regression, radial-basis function support vector machines, Extra Trees, Random Forest, Gradient Boosting, HistGradientBoosting, and histogram-based XGBoost. The comparison was performed through stratified cross-validation and hold-out evaluation, using a broad set of metrics that included accuracy, balanced accuracy, precision, recall, specificity, F1-score, ROC-AUC, average precision, Matthews correlation coefficient, Brier score, and log loss. According to
Table 4, the best overall model was ExtraTrees, selected for the highest combined performance in ROC-AUC, F1-score, balanced accuracy, and average precision. In cross-validation, ExtraTrees reached a mean accuracy of 0.723, balanced accuracy of 0.727, F1-score of 0.744, ROC-AUC of 0.819, and average precision of 0.862. In the test set, the same model reached accuracy of 0.833, balanced accuracy of 0.833, precision of 0.875, recall of 0.778, specificity of 0.889, F1-score of 0.824, ROC-AUC of 0.889, and average precision of 0.879.
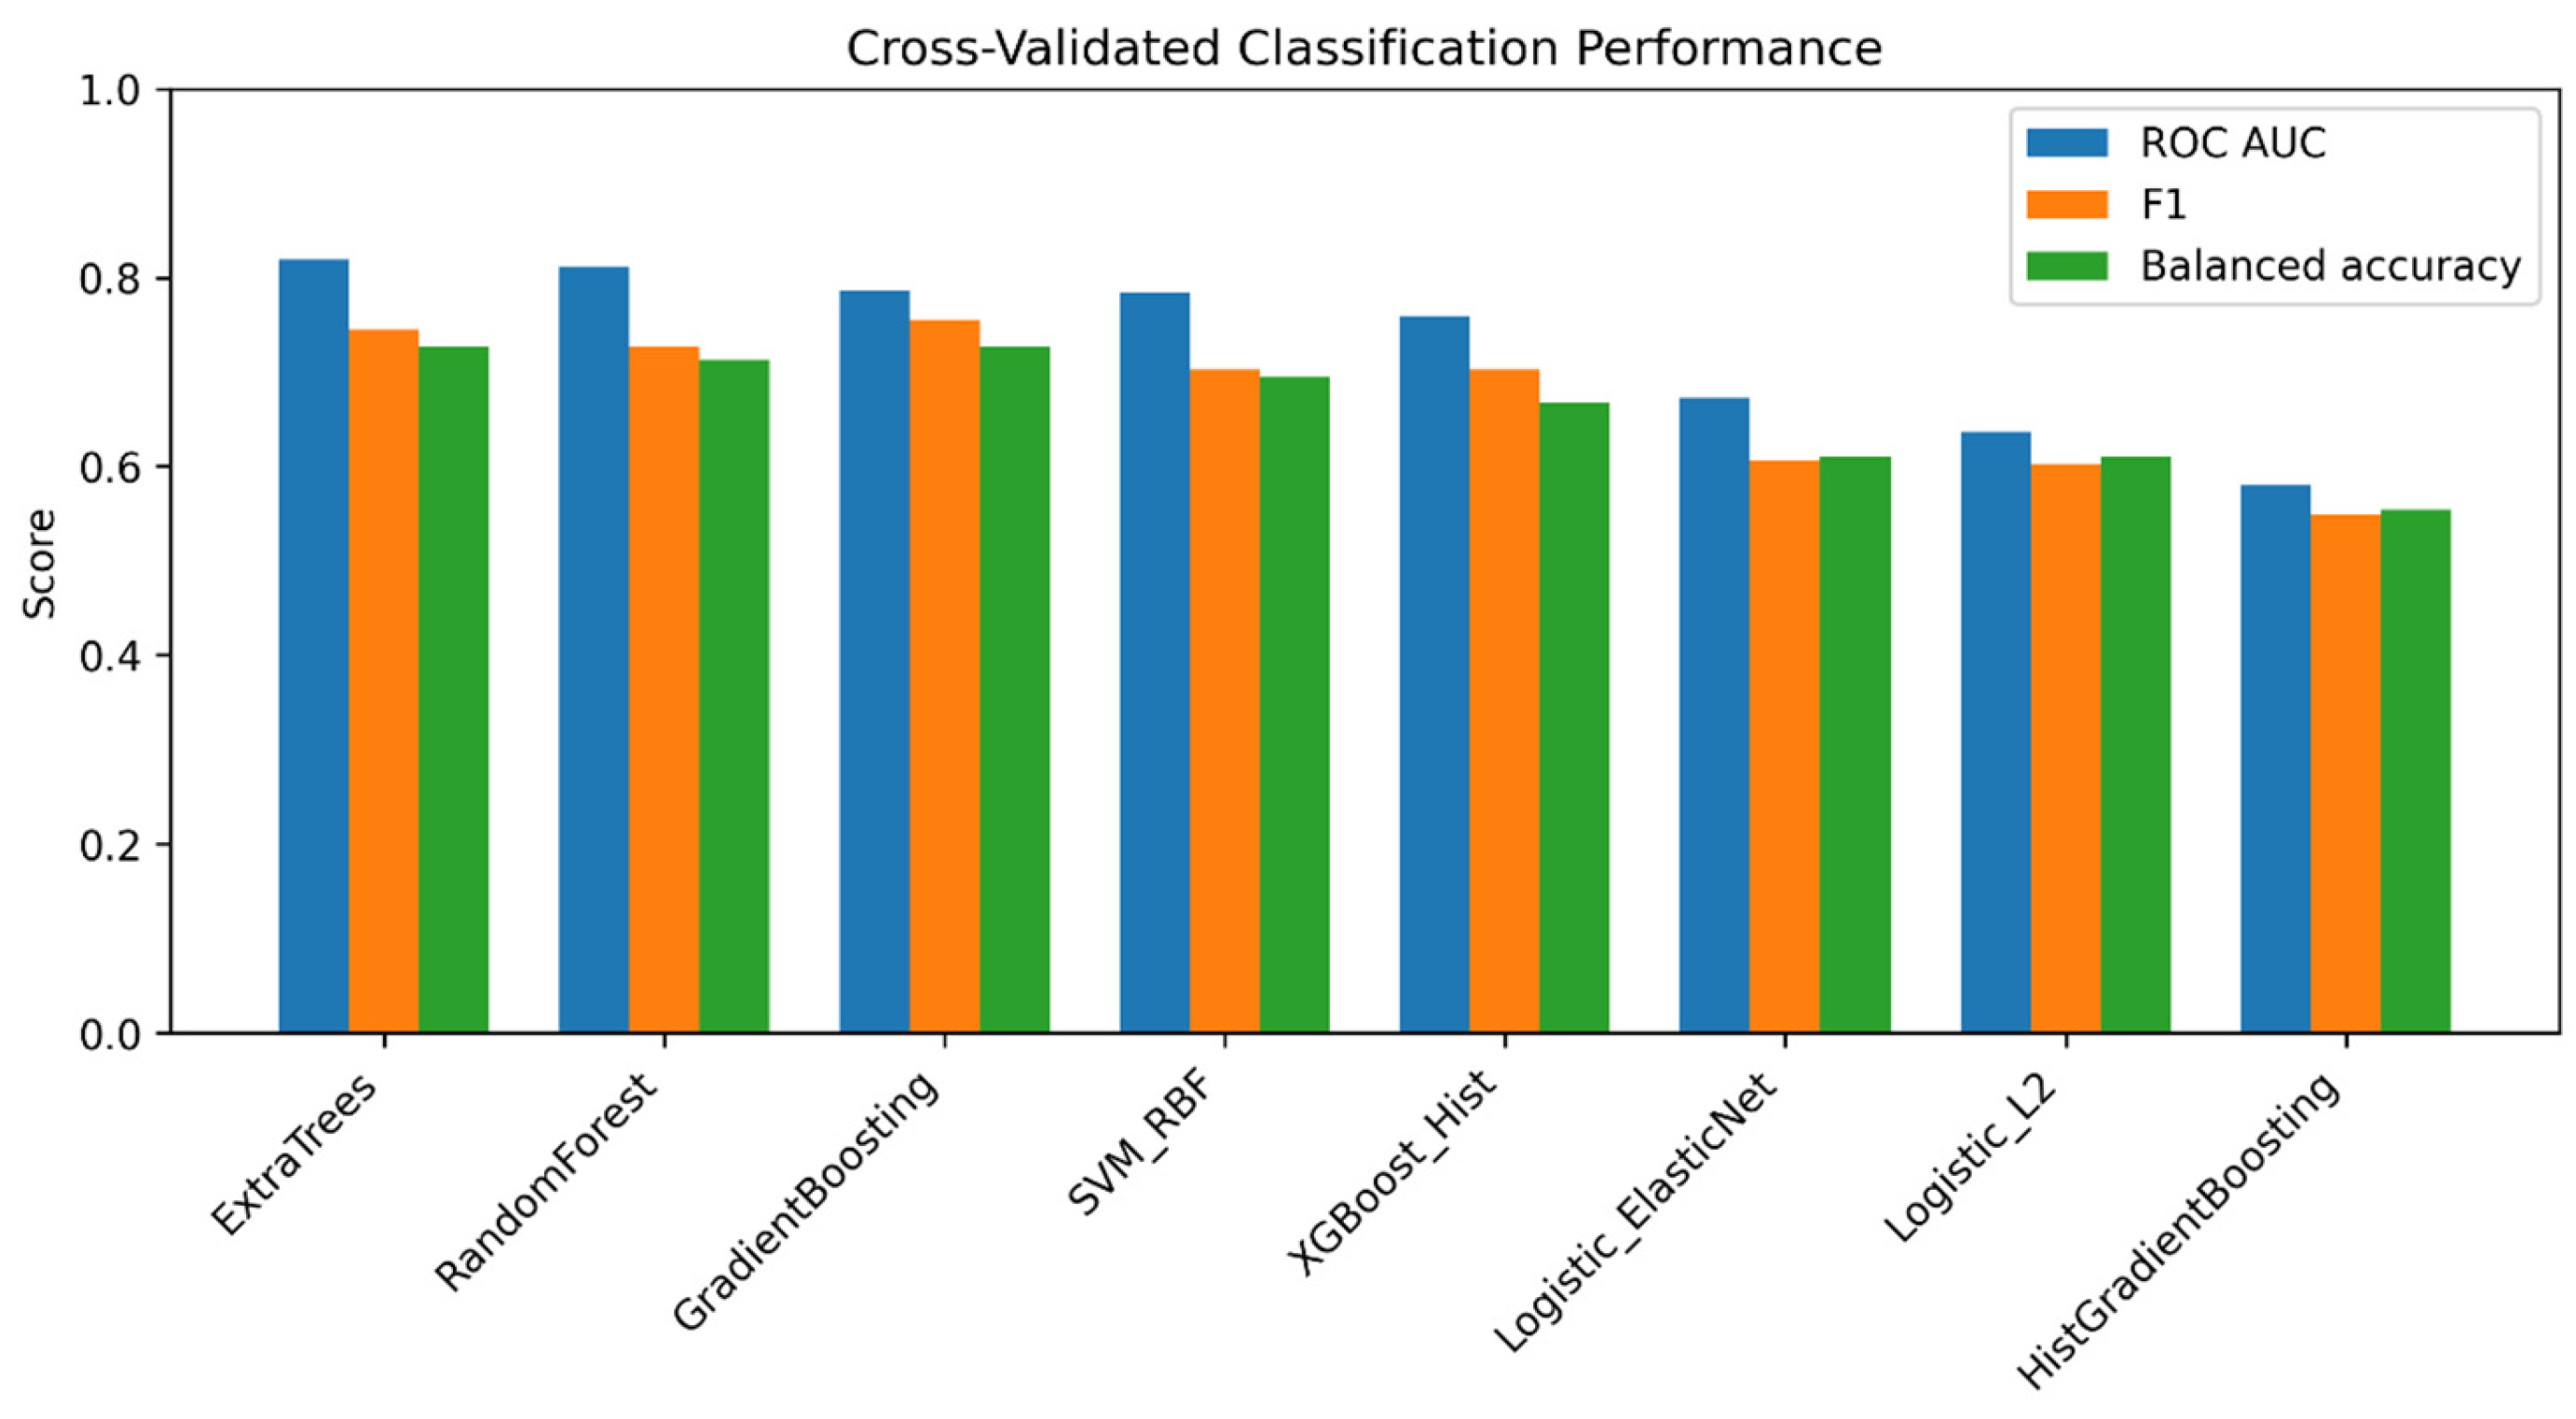
The visual comparison of classifiers reinforces the selection of ExtraTrees as the model with the best balance between discrimination and stability. According to
Figure 3, tree-ensemble models dominate overall predictive performance, especially ExtraTrees and Random Forest, whereas linear models show a more limited capacity to capture complex relationships among predictors. This difference is methodologically coherent with the nature of the problem, since the adoption intention of biogas–solar microgrids probably responds to nonlinear interactions among organizational capabilities, financial constraints, environmental legitimacy, and institutional conditions. The fact that ExtraTrees outperforms linear models and other boosting algorithms suggests that the decision structure benefits from flexible partitions and randomized tree aggregation, especially in a small sample with multiple ordinal predictors.
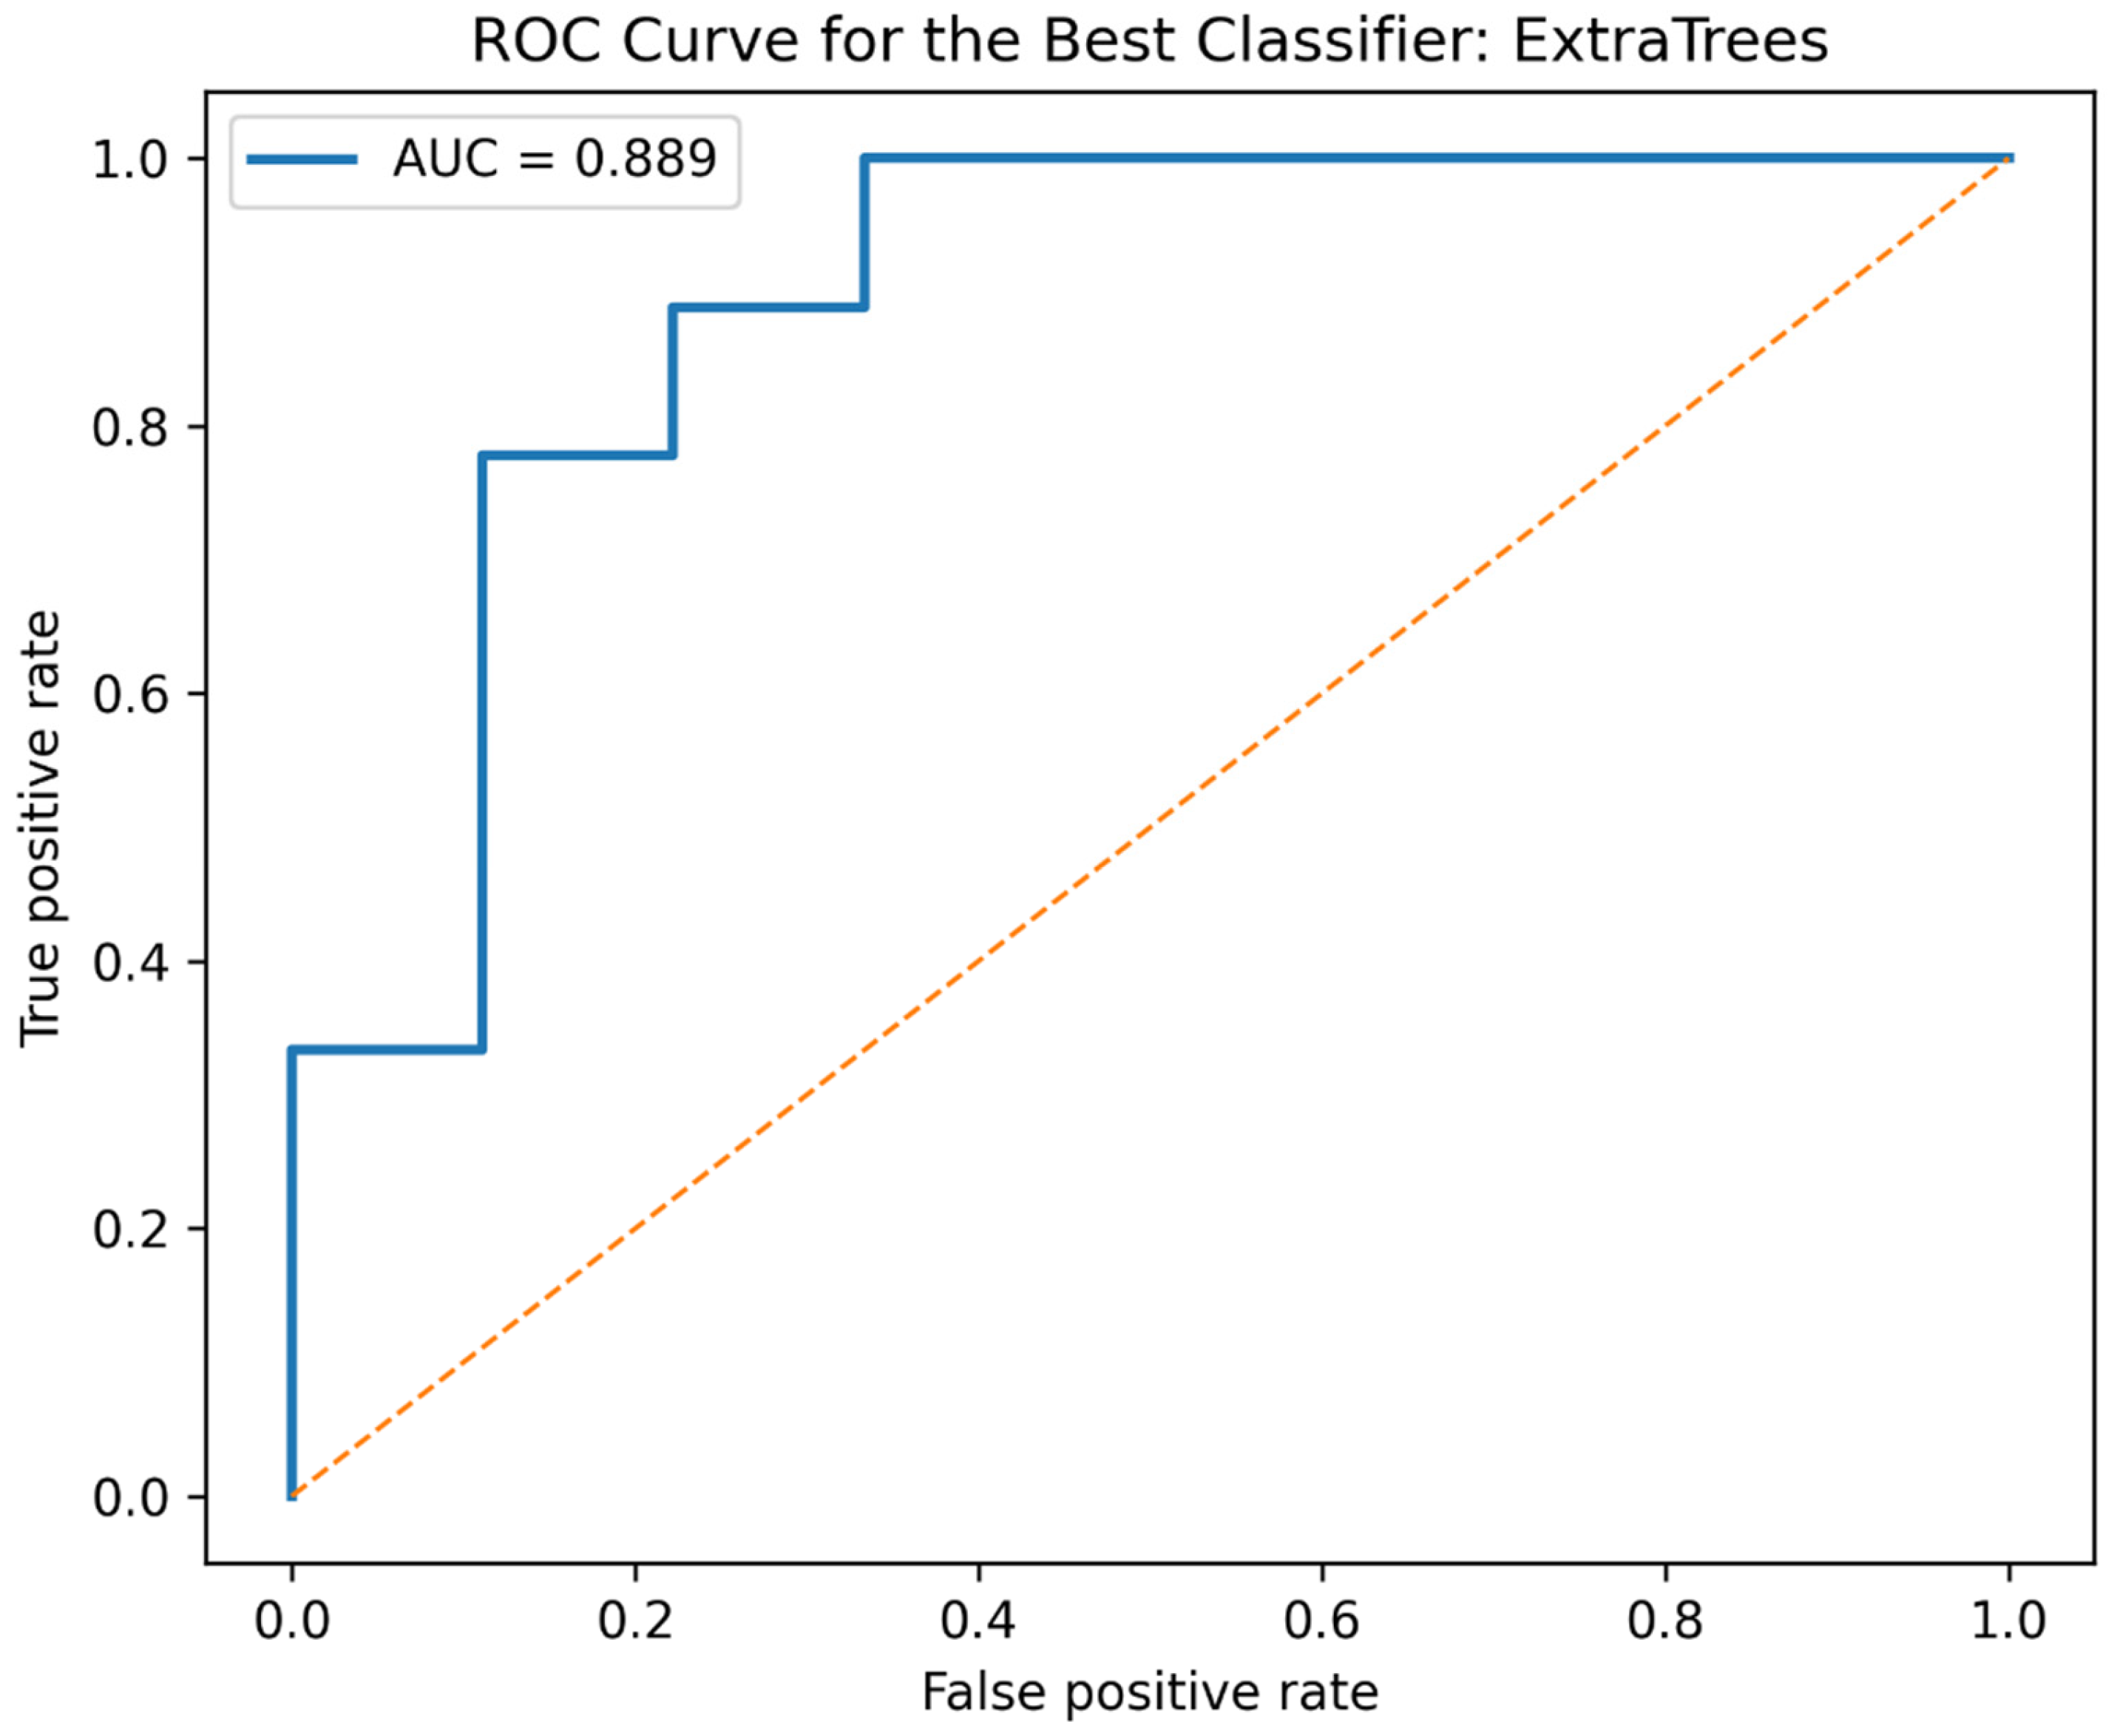
The ROC curve of the best classifier confirms high discriminant capacity within the exploratory hold-out sample to distinguish between organizations with high stated intention and those with low or moderate stated intention. According to
Figure 4, the area under the curve in the test set was 0.889, which indicates that the model assigned a higher probability score to positive cases in a proportion considerably greater than expected by chance. Because the test set contained only 18 cases, this result should not be interpreted as external validation or as evidence of a robust predictive tool; it is a preliminary ranking result that requires replication.
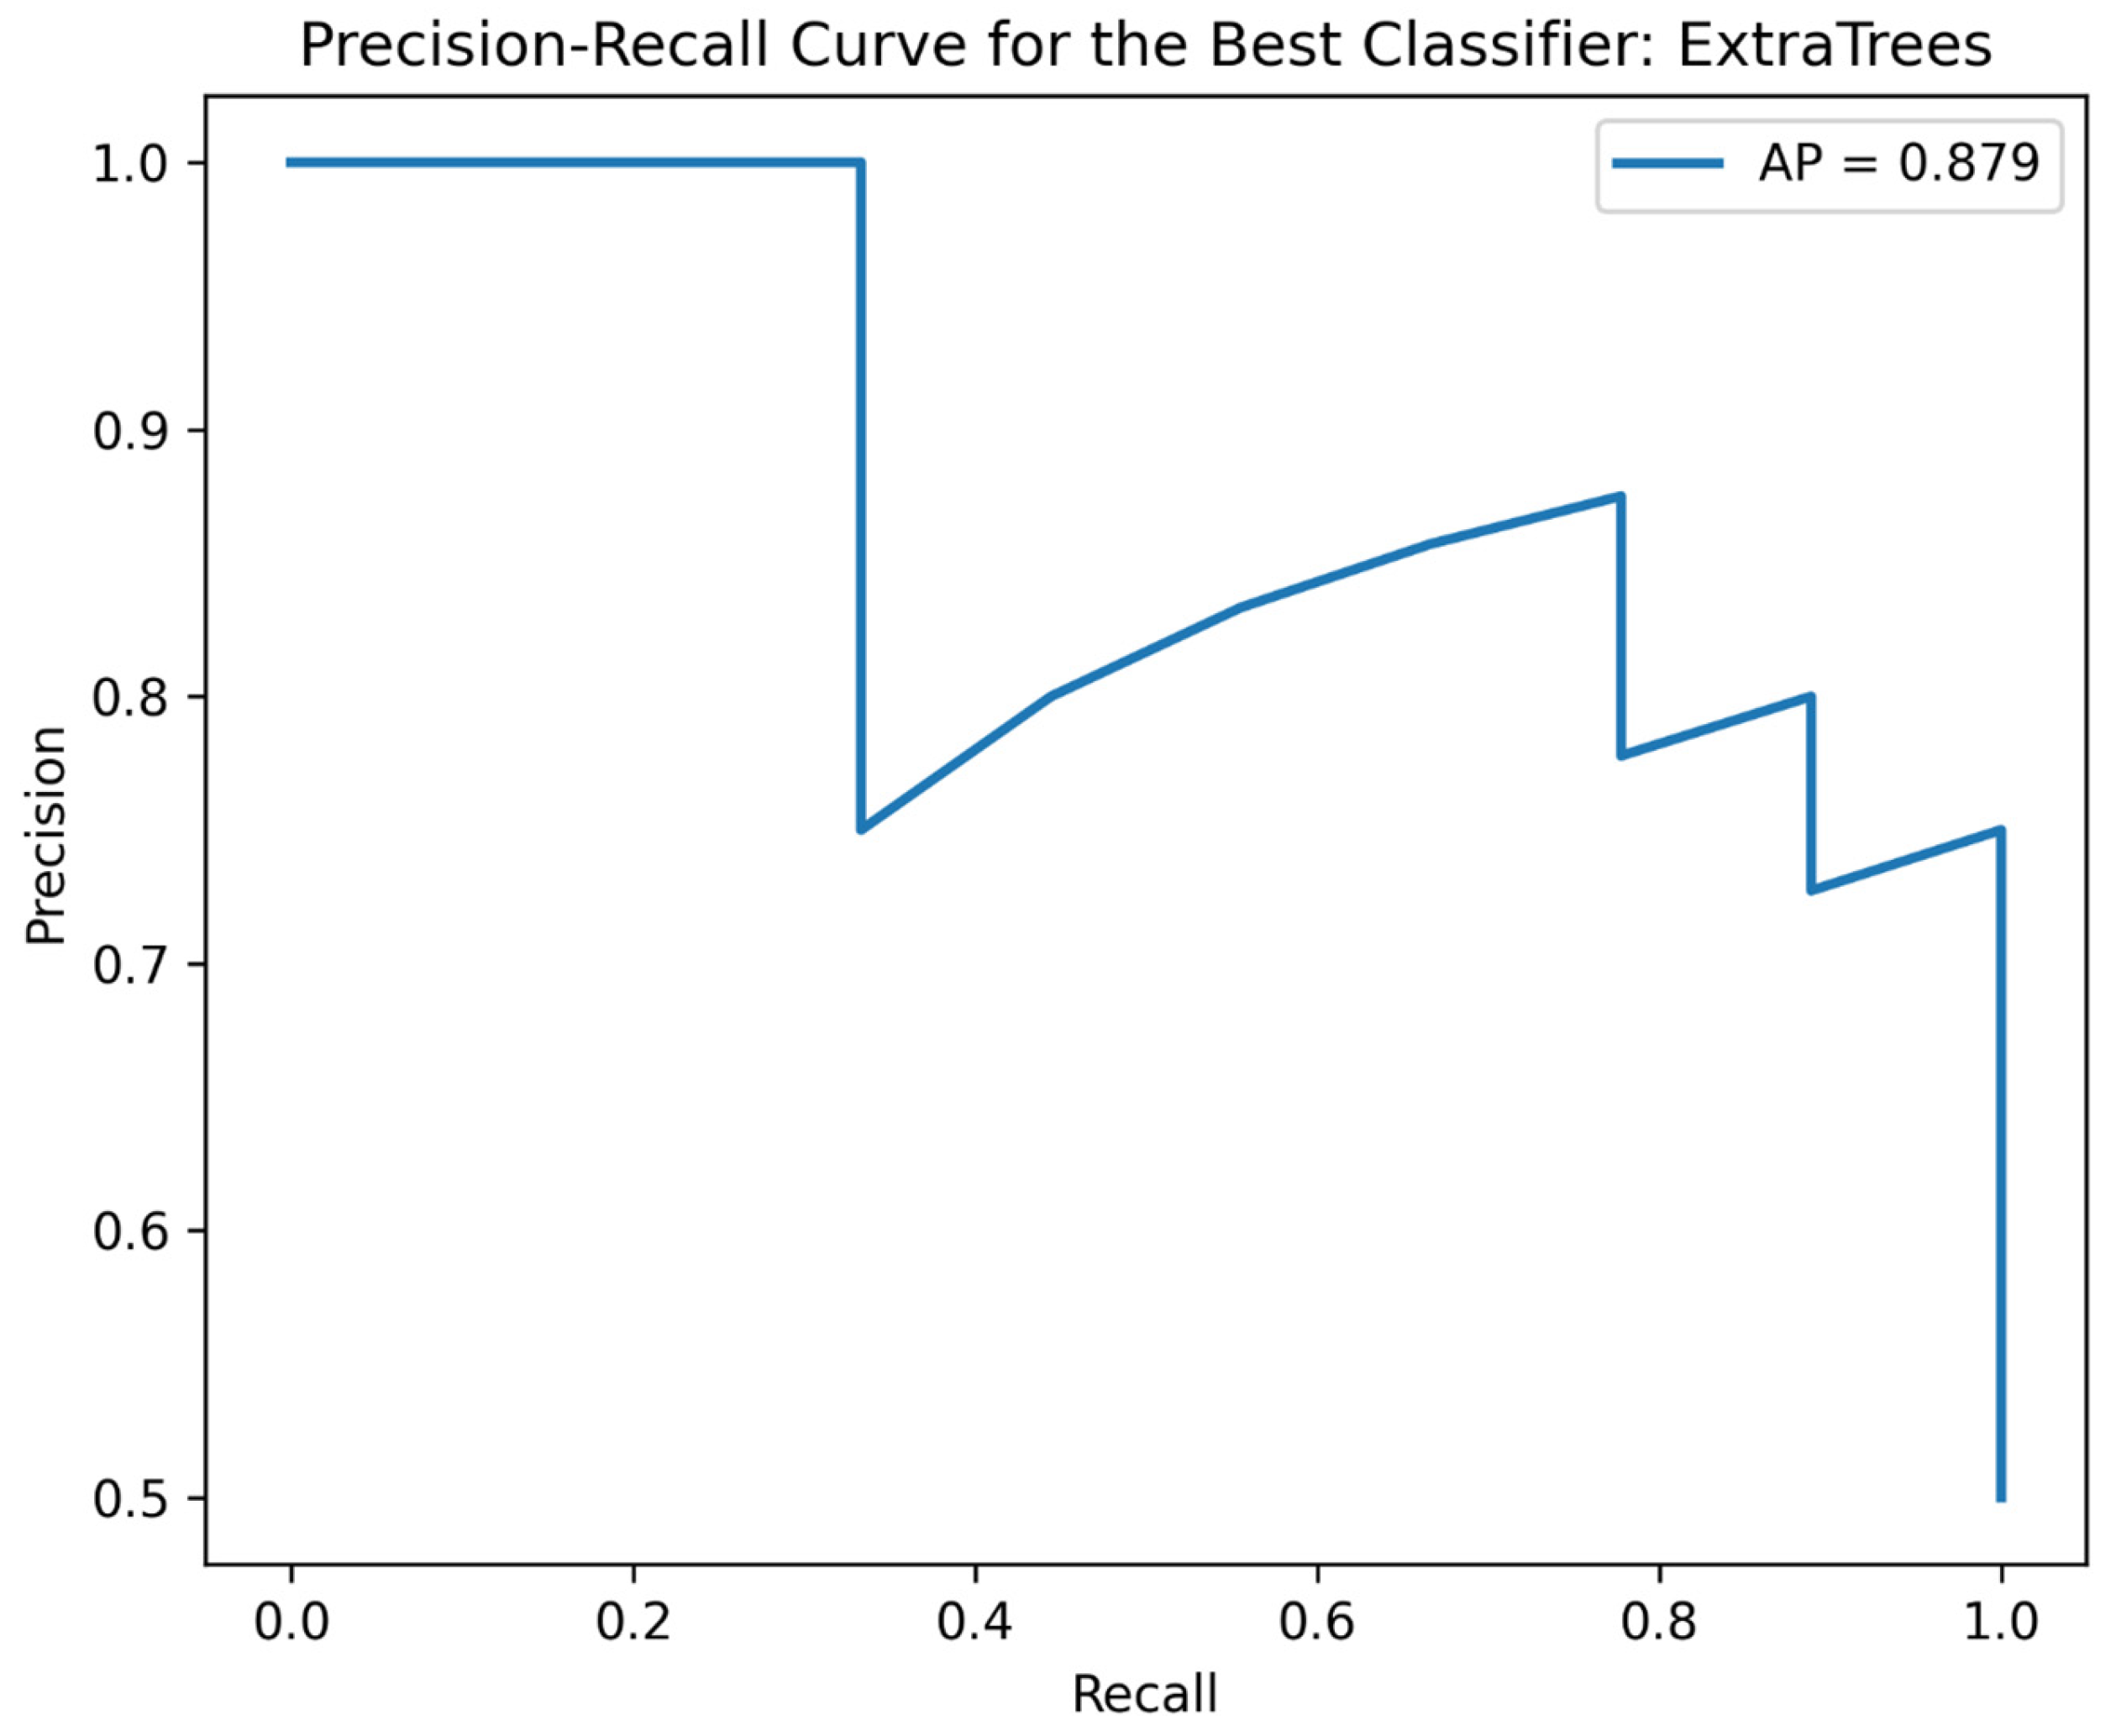
The precision-recall analysis adds a more demanding reading of the model’s capacity to recover high-intention cases without inflating false positives. According to
Figure 5, ExtraTrees achieved an average precision of 0.879 in testing, a performance consistent with the observed balance between precision and recall. In substantive terms, this means that the model not only distinguishes reasonably well between classes but also maintains a high capacity to identify relevant positive cases when attention focuses on the class of greatest practical interest: organizations with high willingness to adopt. This aspect is critical for energy-transition and circular bioeconomy studies because classification errors do not have the same interpretive cost. Classifying an organization as highly willing when it still lacks sufficient conditions may lead to inefficient interventions; conversely, omitting organizations with high intention may limit the identification of early actors for technological scaling processes.
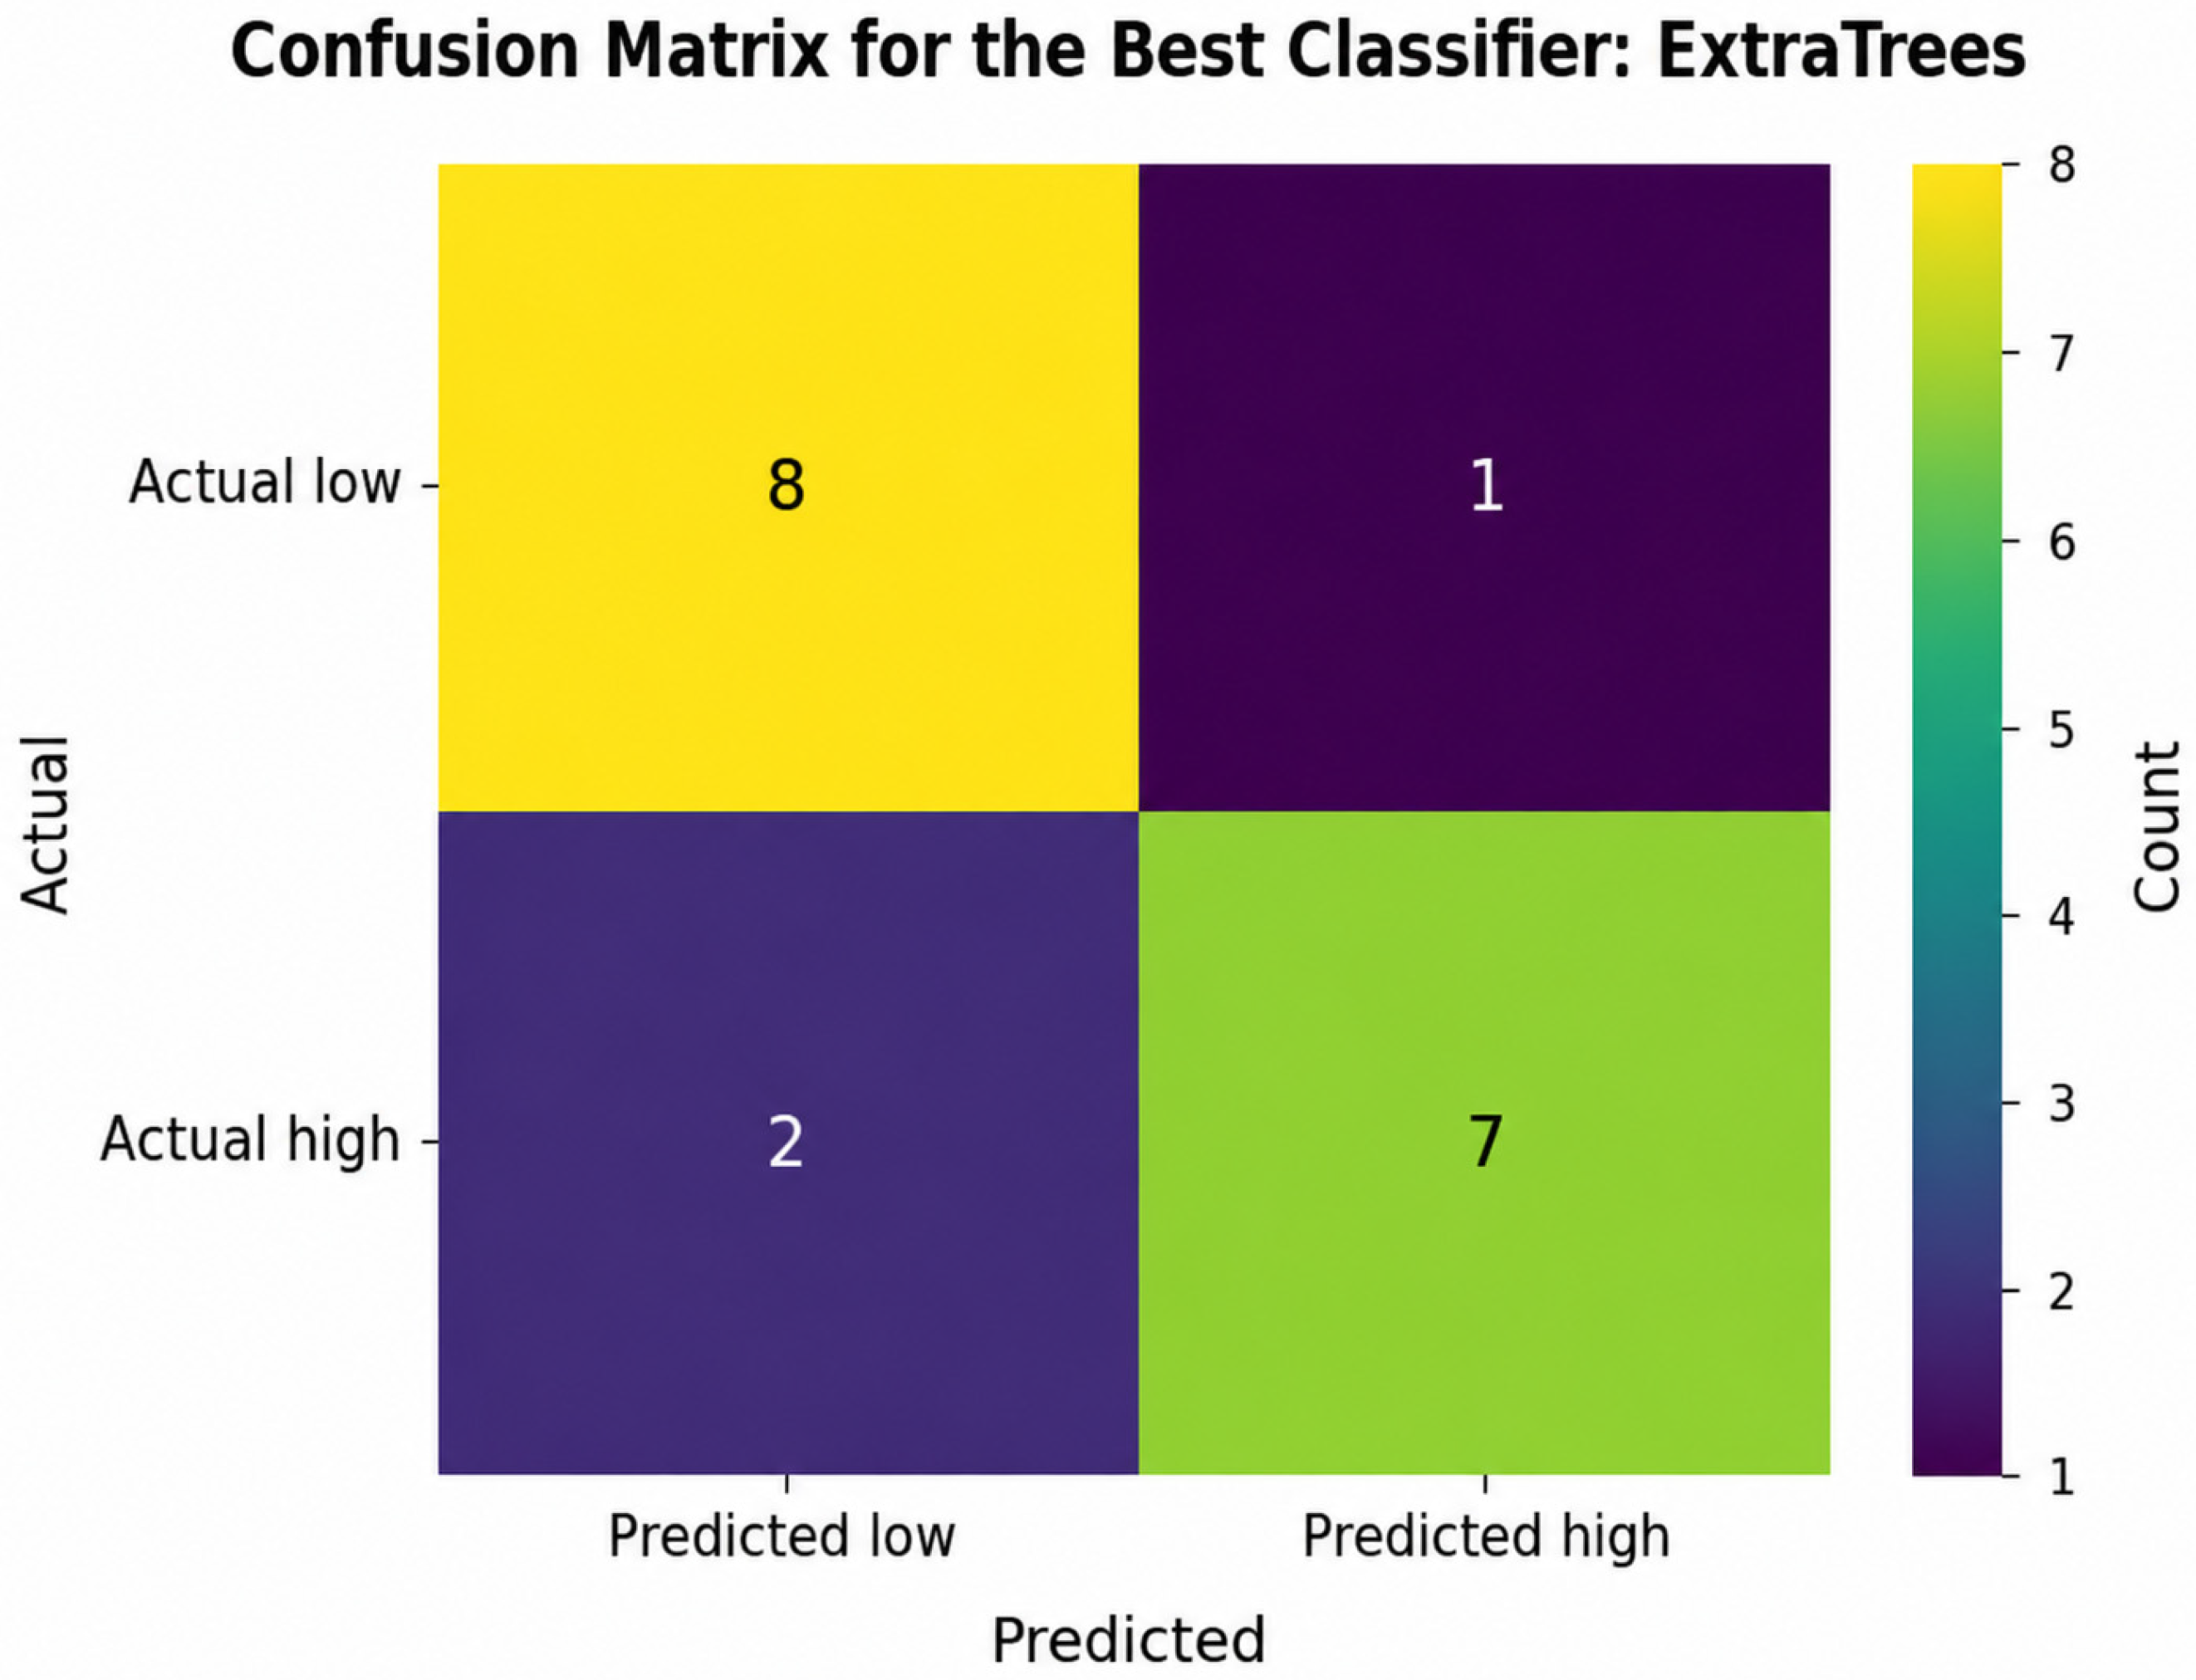
The confusion matrix makes it possible to observe the concrete distribution of correct and incorrect classifications produced by the selected classifier. According to
Figure 6, ExtraTrees correctly classified 8 negative cases and 7 positive cases, with only 1 false positive and 2 false negatives. This configuration explains the observed balance between specificity of 0.889 and recall of 0.778. The result suggests that the model is slightly more conservative in declaring high-intention cases than in identifying low- or moderate-intention cases, which may be a desirable property when the objective is to avoid overestimating system readiness to adopt biogas–solar microgrids. However, the two false negatives also indicate that there are profiles with high intention that the model does not capture, possibly because they combine favorable signals in some blocks with constraints or atypical patterns in others. Consequently, the model should be understood as a decision support system, not as a substitute for individual technical evaluation.
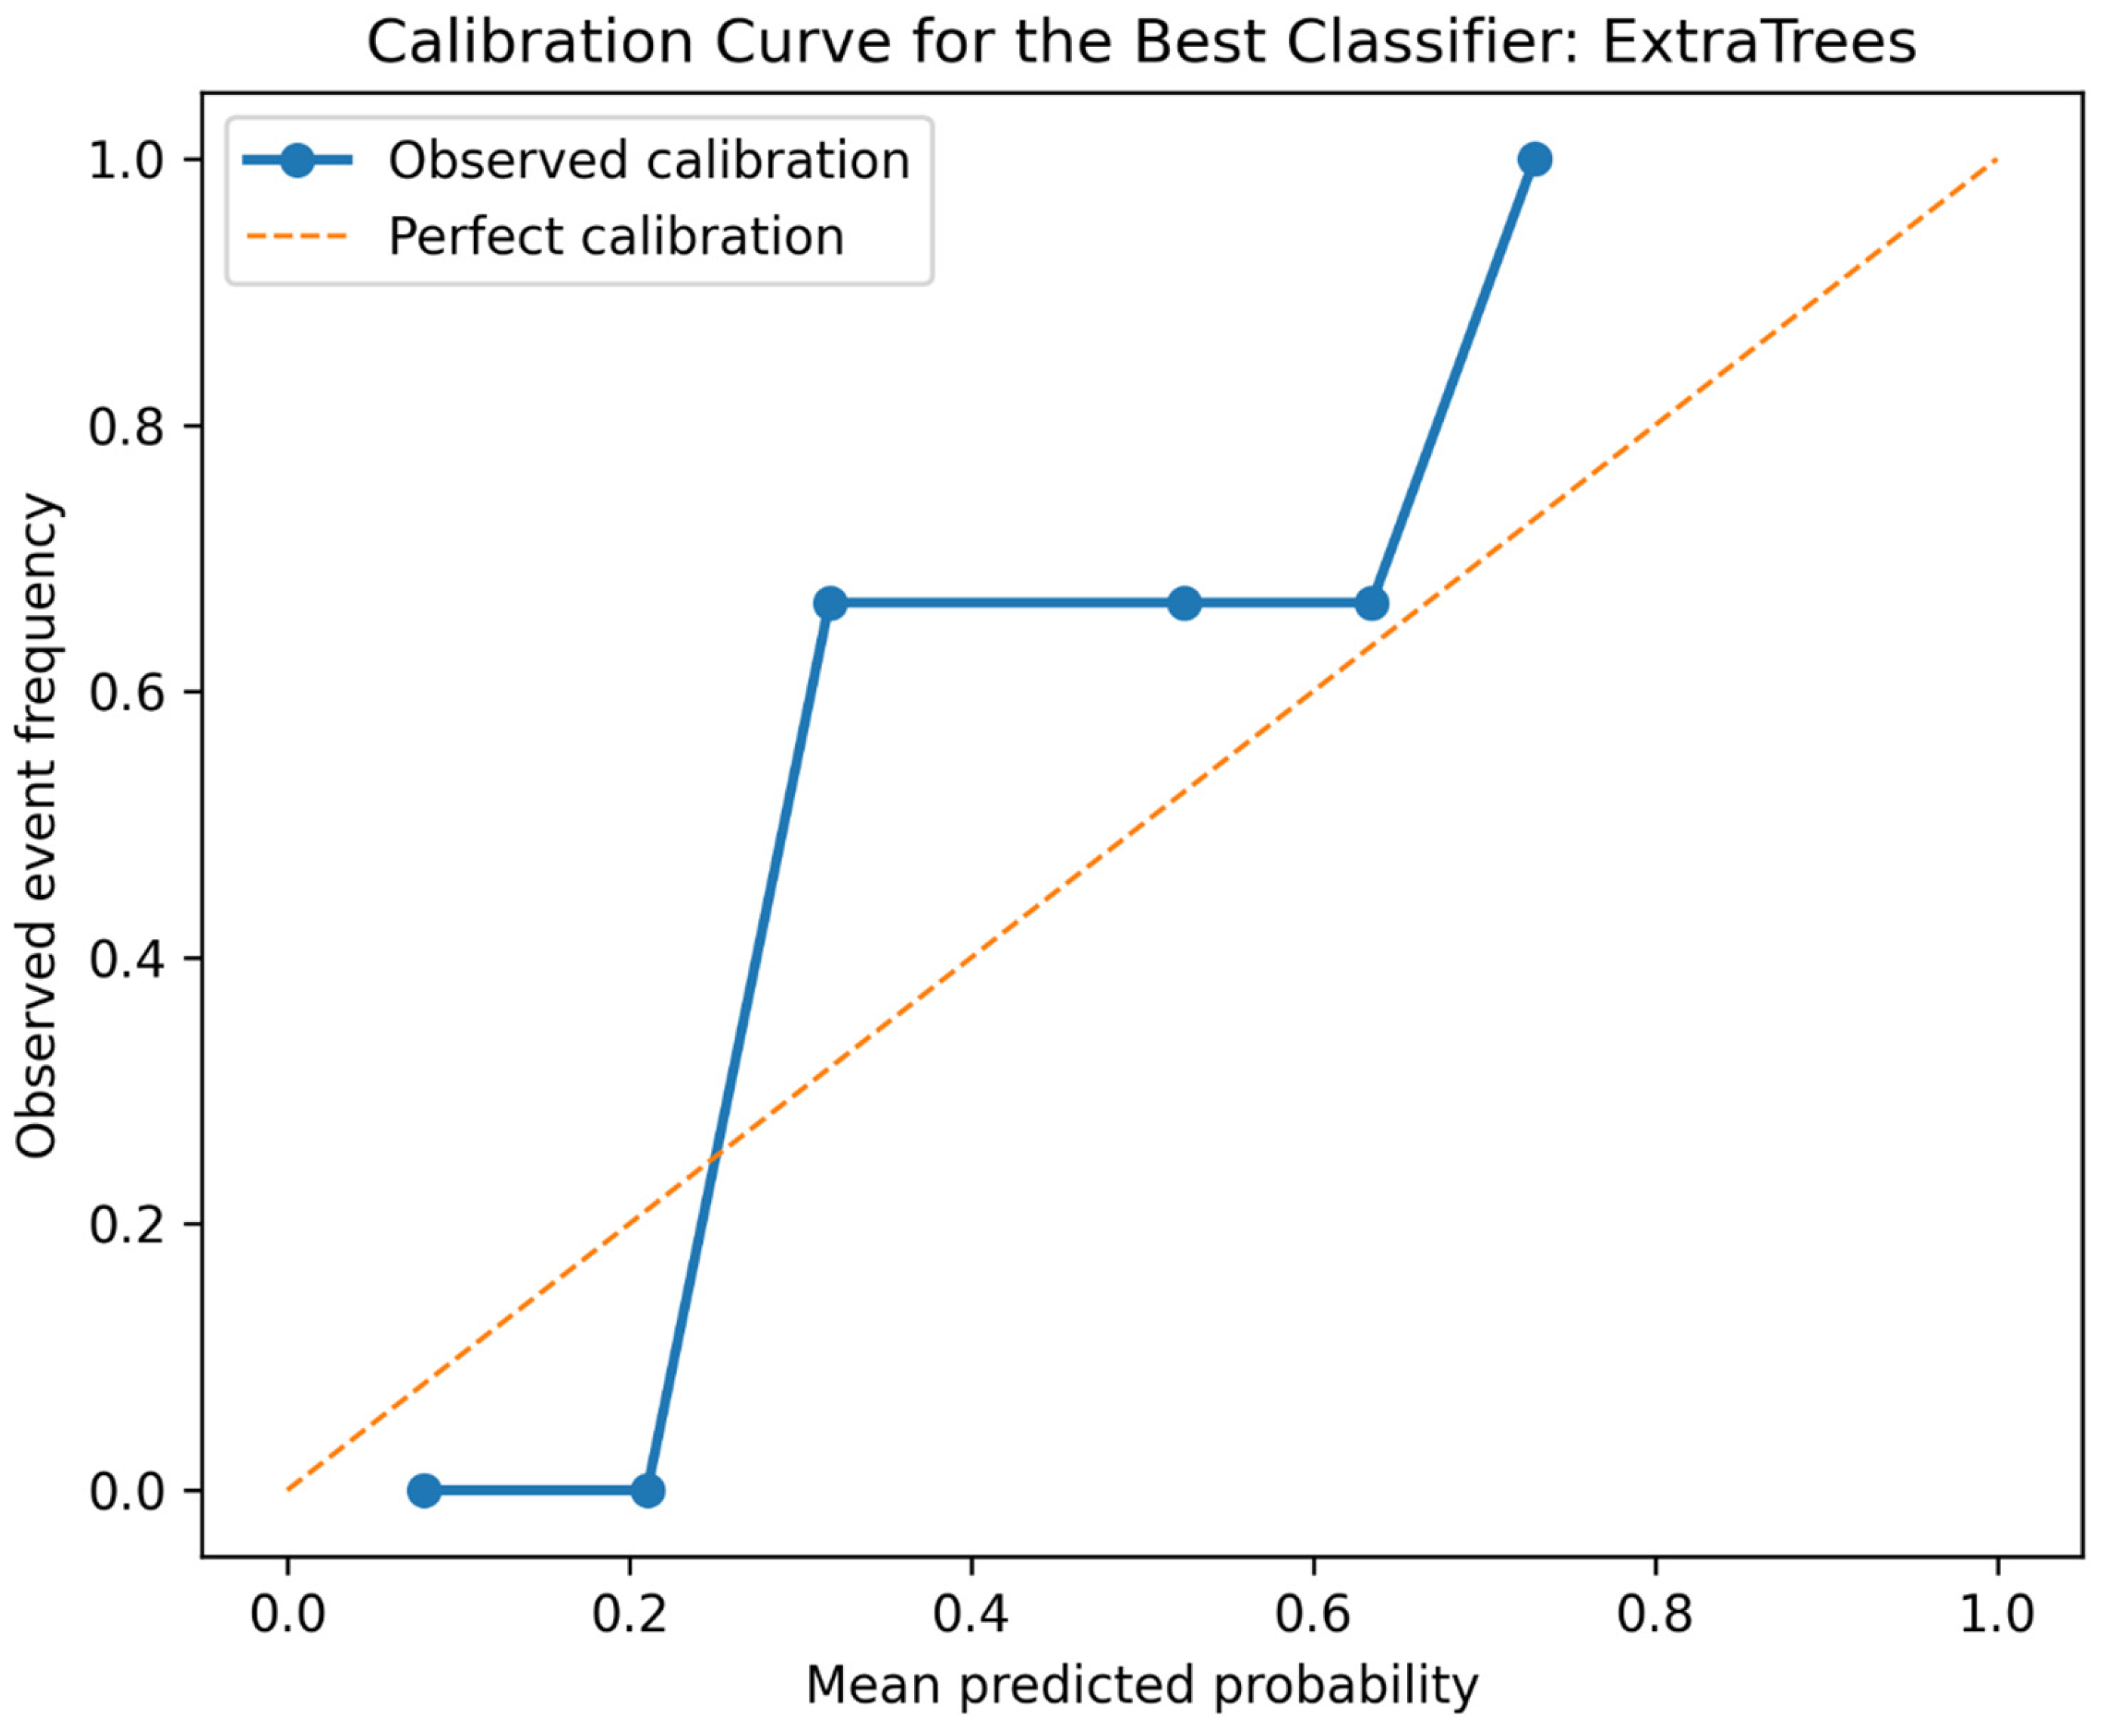
Calibration assessment shows an additional component of predictive quality, since it is not sufficient to rank cases correctly; estimated probabilities must also correspond reasonably with the observed frequency of the event. According to
Figure 7, the calibration curve makes it possible to assess whether the probabilities generated by ExtraTrees tend to underestimate or overestimate high adoption intention. Given the reduced size of the test set, this reading should be considered exploratory, but it remains methodologically valuable because it incorporates a probabilistic dimension that goes beyond dichotomous accuracy. For the technical study, this result strengthens the presentation of the model by demonstrating that the evaluation is not limited to conventional classification metrics but incorporates discriminant performance, positive case recovery capacity, error balance, and probabilistic quality.
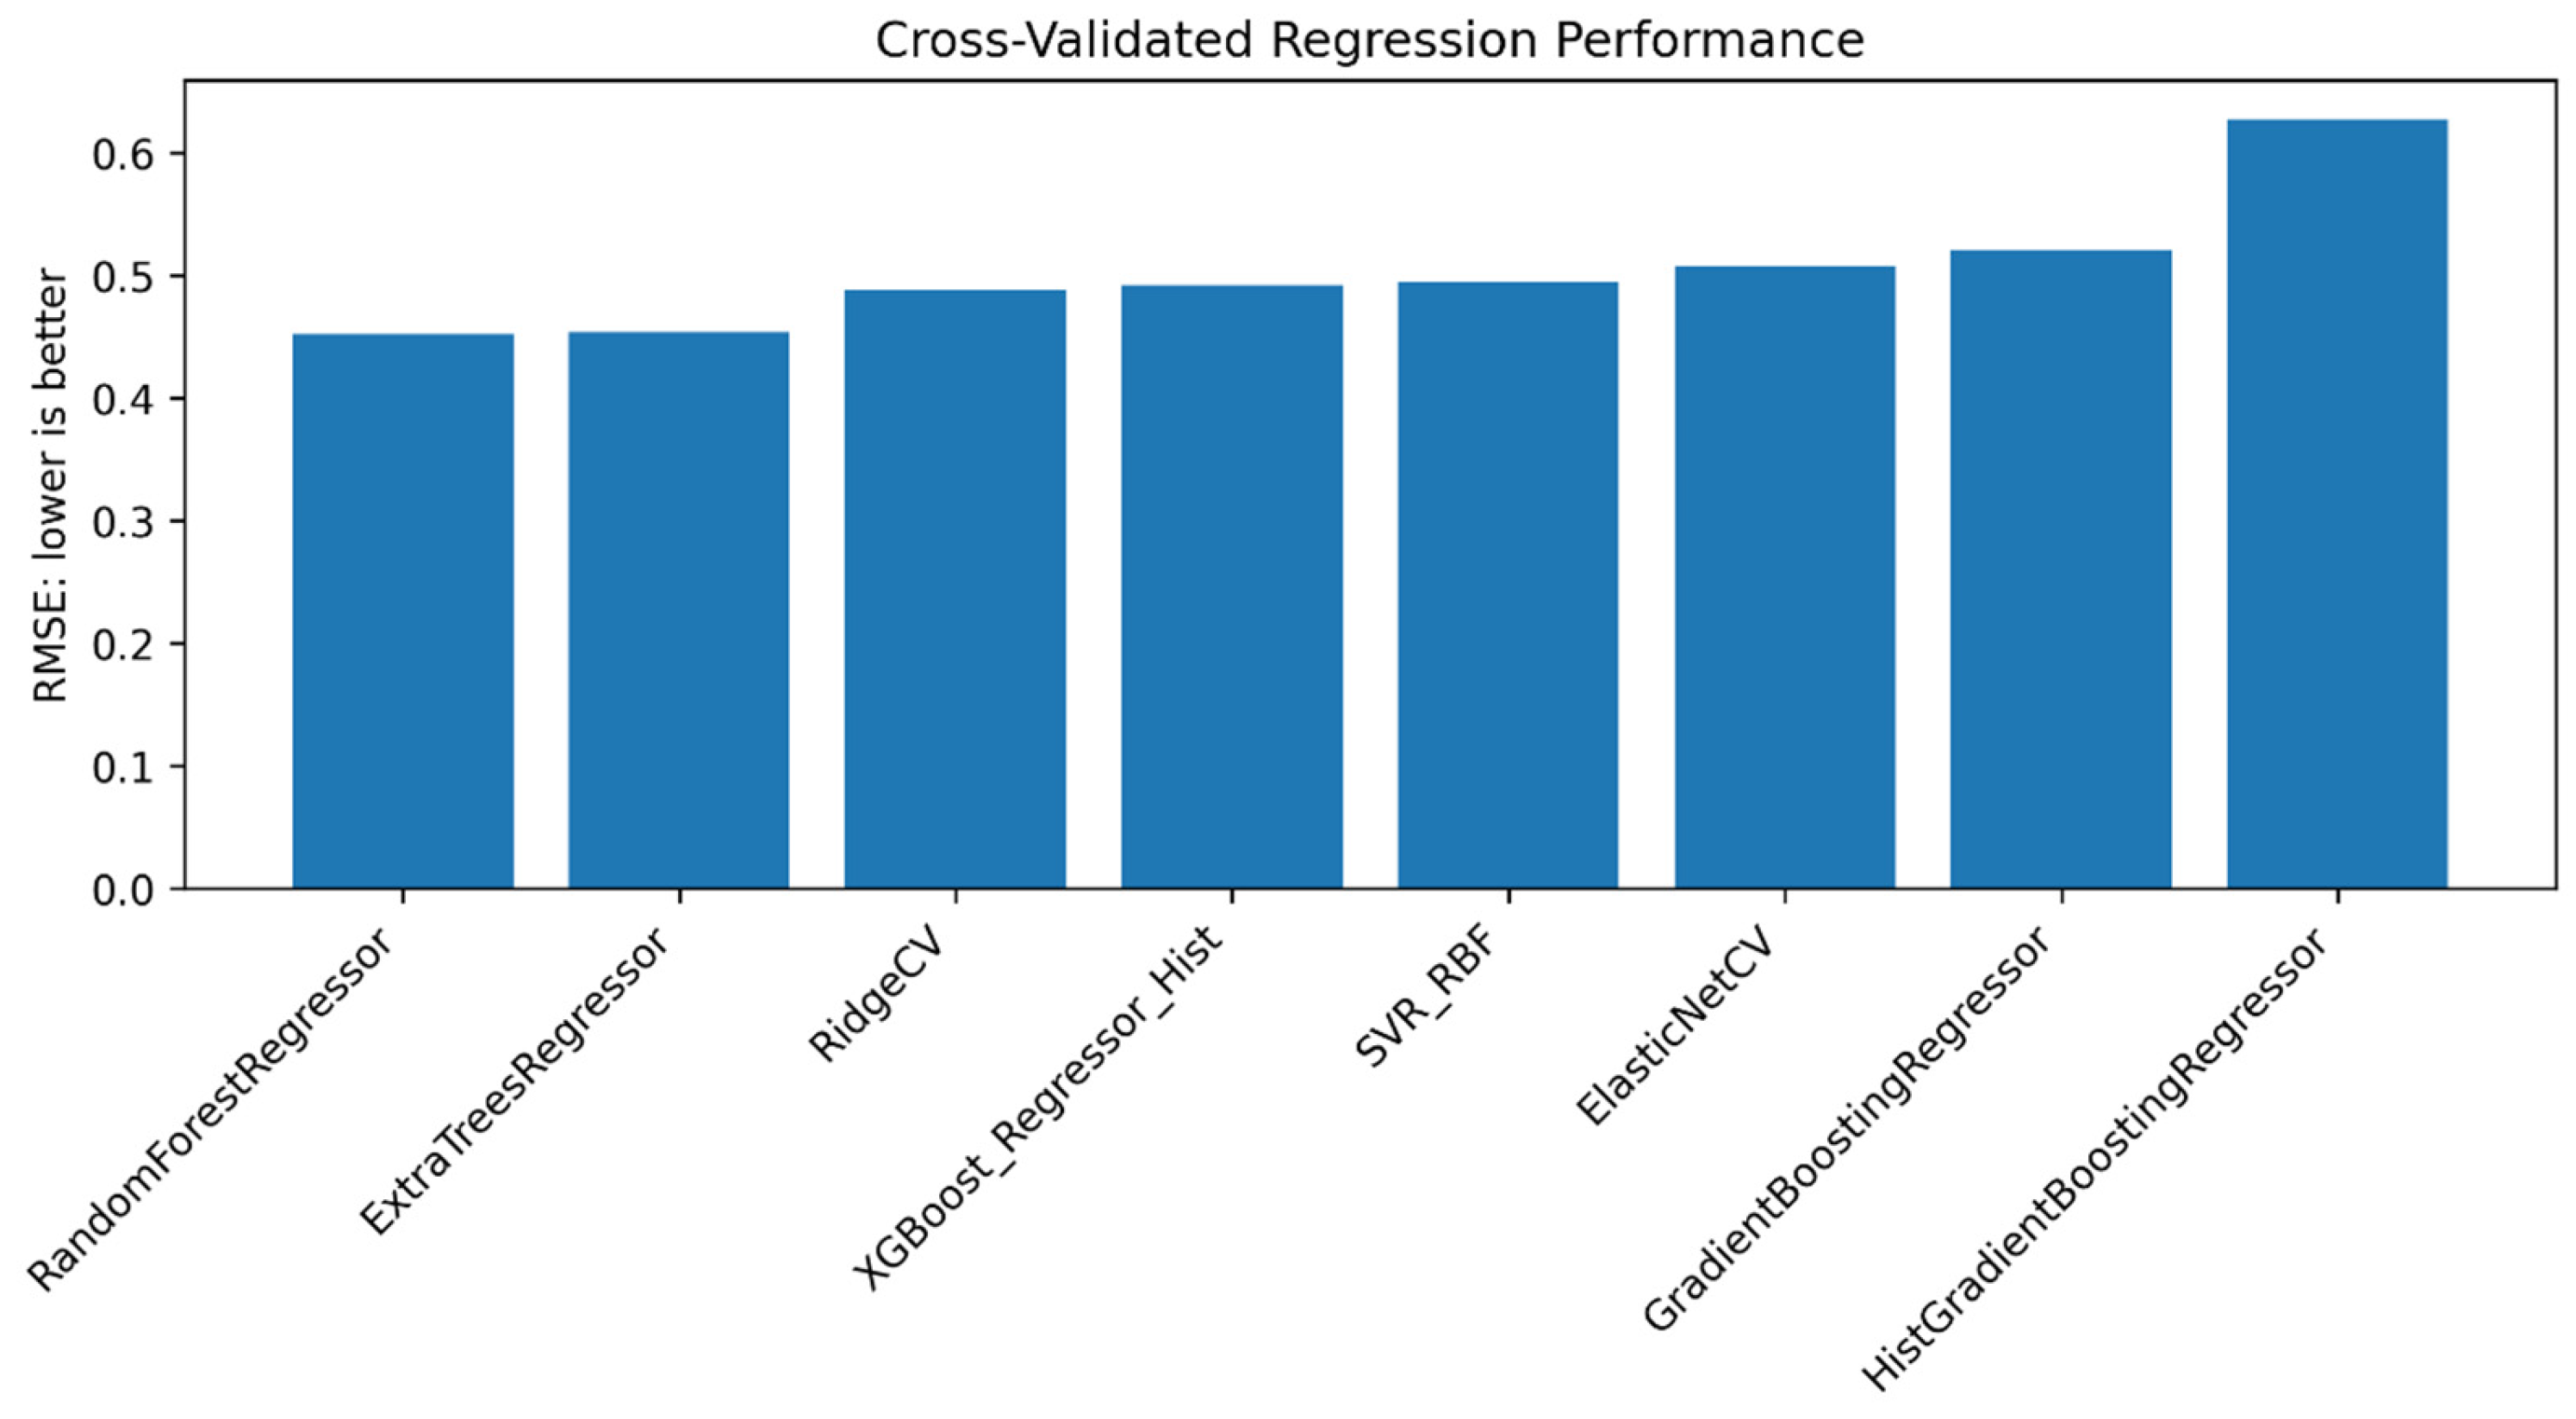
The regression route was used as a complementary analysis to estimate the continuous intention score, not only its binary version. In this case, RidgeCV, ElasticNetCV, radial-basis-function SVR, ExtraTreesRegressor, RandomForestRegressor, GradientBoostingRegressor, HistGradientBoostingRegressor, and XGBoost_Regressor_Hist were compared. The cross-validation comparison shows that the best performance corresponded to RandomForestRegressor, with a mean RMSE of 0.453, MAE of 0.358, mean R
2 of 0.453, explained variance of 0.534, and MAPE of 0.100. ExtraTreesRegressor showed practically equivalent performance, with RMSE of 0.454, MAE of 0.348, R
2 of 0.455, and explained variance of 0.532. According to
Table 5, ensemble models again outperform most linear or boosting alternatives, confirming that the empirical structure of the phenomenon presents relationships among predictors that are not strictly additive.
The graphical comparison of regression models confirms the superiority of Random Forest- and Extra Trees-type ensembles. According to
Figure 8, the distance between the leading models and the remaining algorithms is not extreme, but it is consistent across error metrics. This suggests that the intention score can be approximated with a reasonable level of precision, although continuous prediction is naturally more demanding than binary classification. From the substantive standpoint, this result indicates that adoption intention should not be understood only as a dichotomous category but also as a gradient of readiness or disposition. Nevertheless, the regression test results sheet recorded a compatibility error in the RMSE calculation with the squared argument; therefore, the interpretation of regression is supported mainly by cross-validation, which is the most stable comparative evidence available in the exported file.
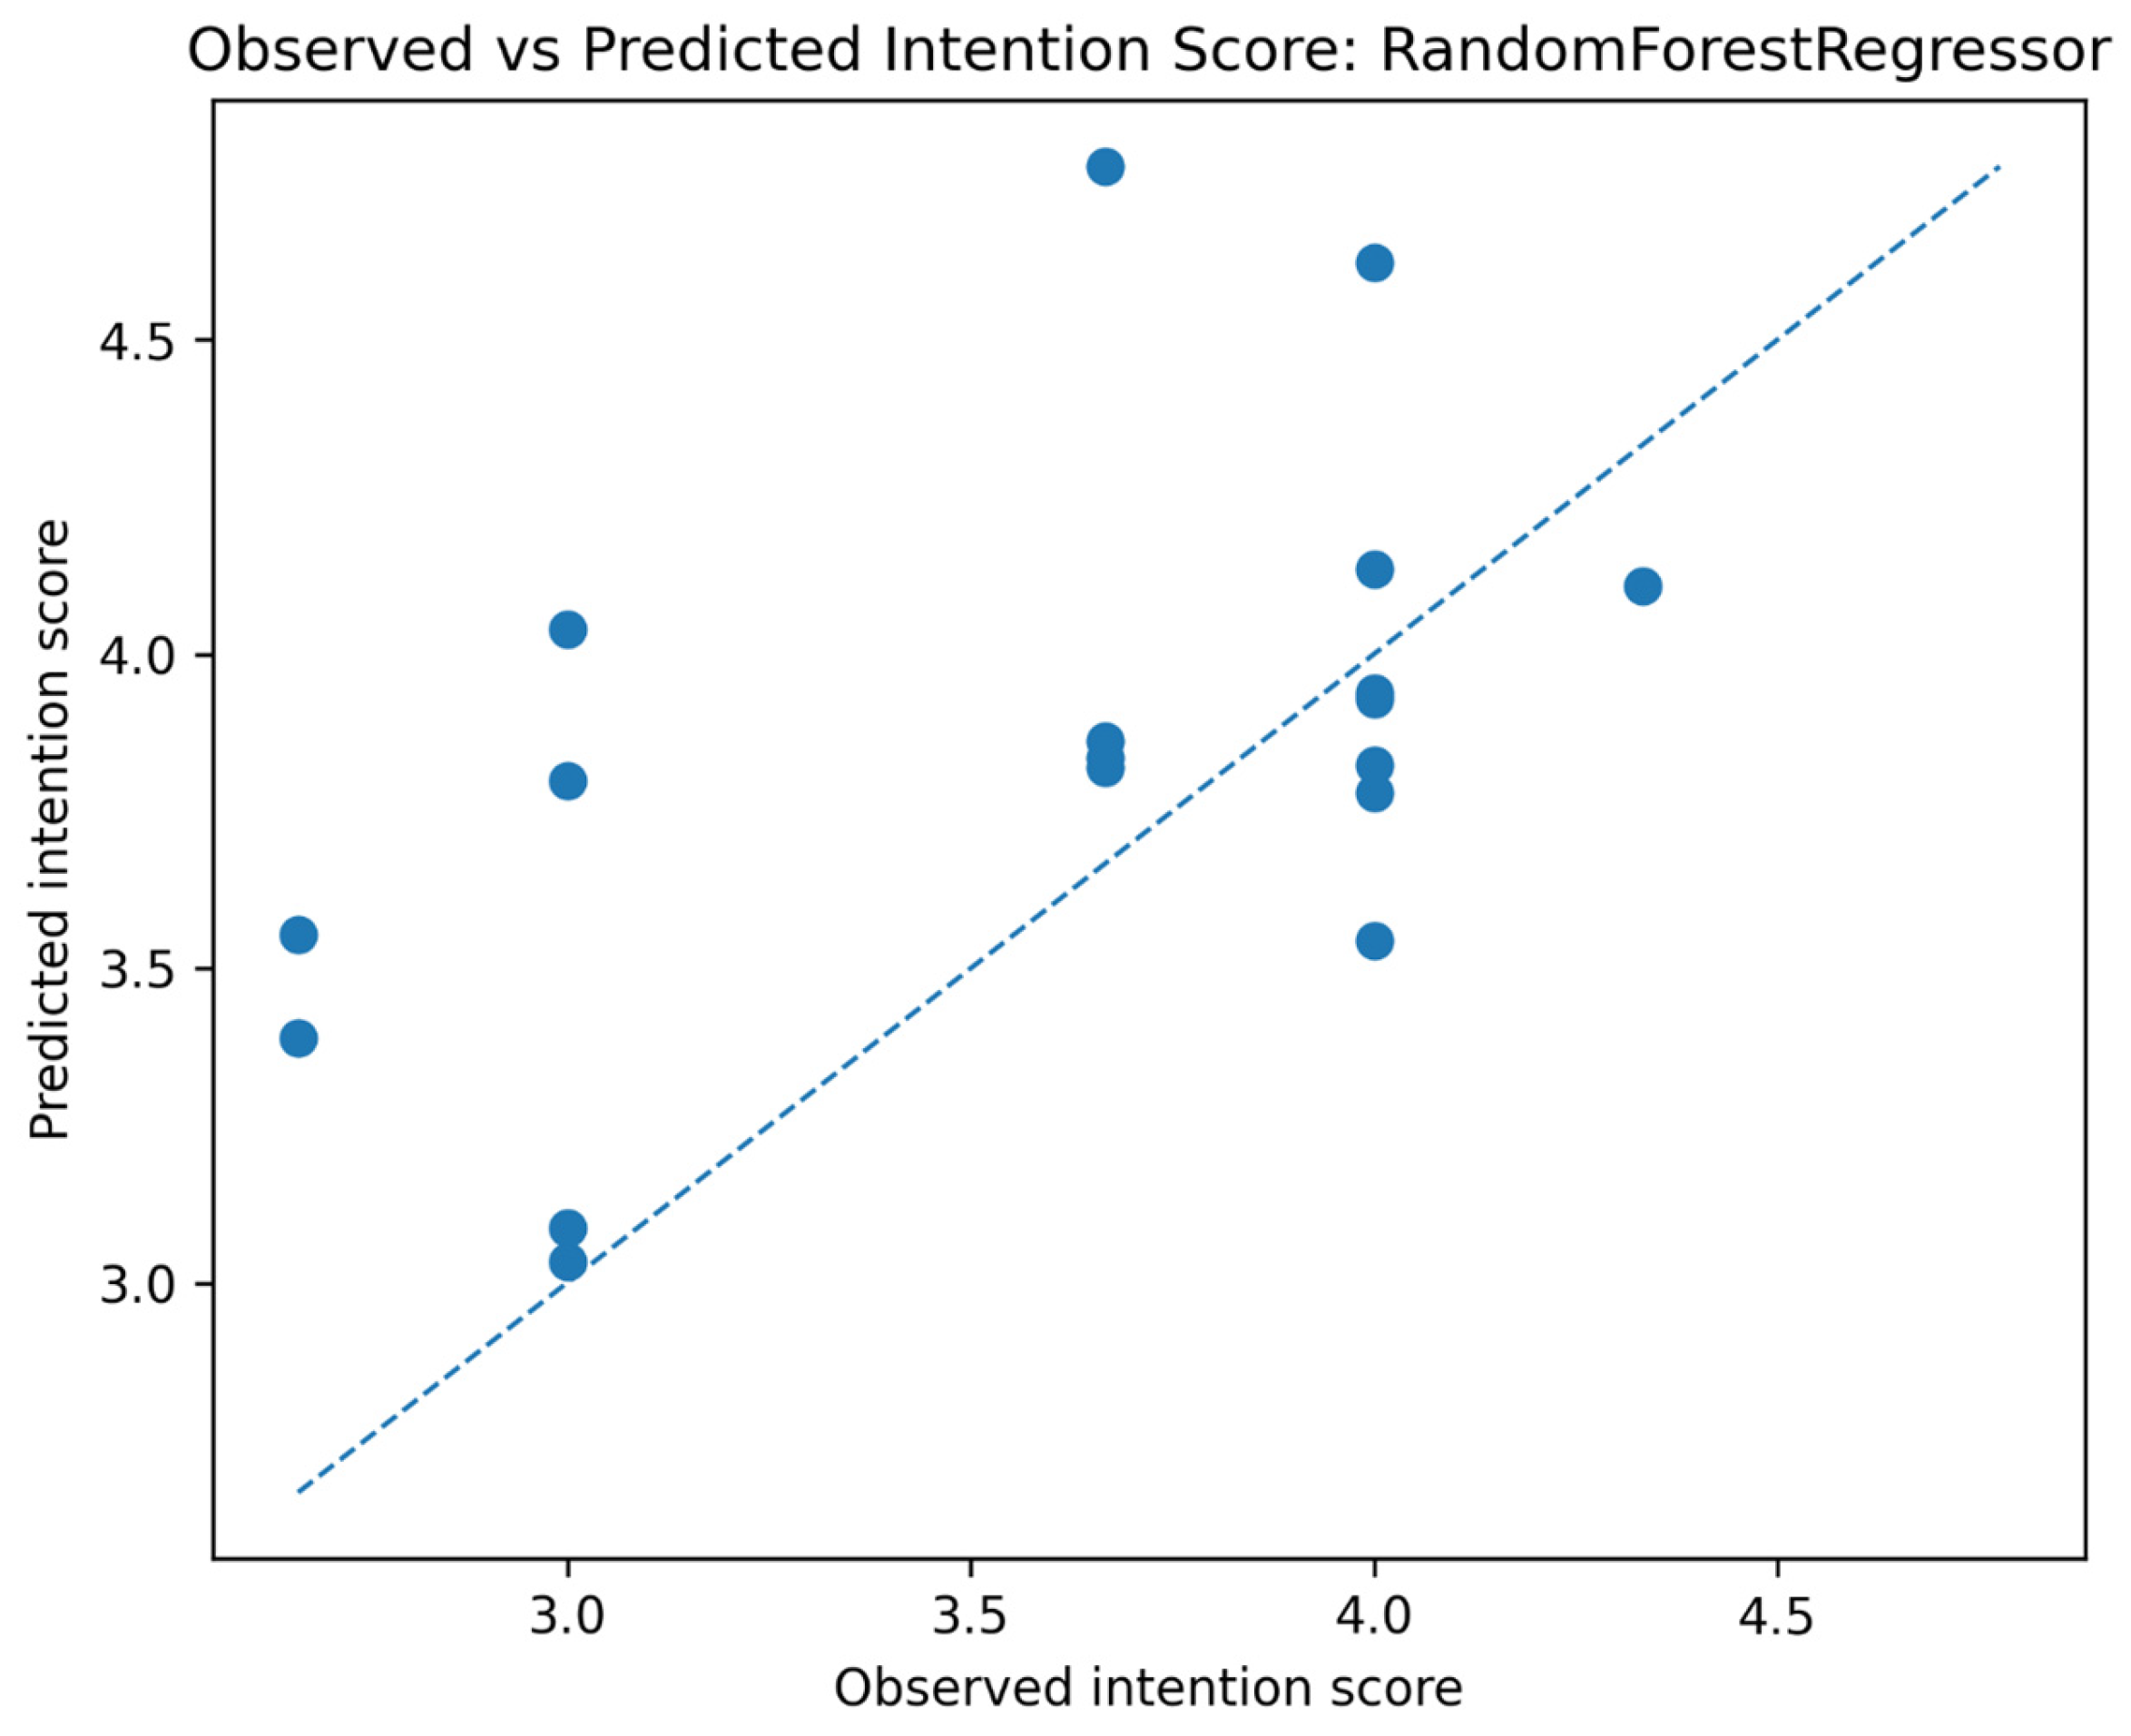
The relationship between observed and predicted values of the best regressor makes it possible to visually evaluate the model’s capacity to approximate the continuous intention score. According to
Figure 9, the expected pattern in a useful model is the concentration of points around the reference diagonal, which would indicate correspondence between observed and estimated intention. In this case, the cross-validation evidence suggests a moderate explanatory capacity, with R
2 close to 0.45; therefore, the point cloud should be interpreted as a reasonable but imperfect predictive approximation. In applied research terms, this result is useful because it supports the assertion that organizational, environmental, financial, and institutional predictors capture a significant portion of intention, although there are still unobserved components that may be associated with technological, regulatory, cultural, or actual biomass and capital availability factors.
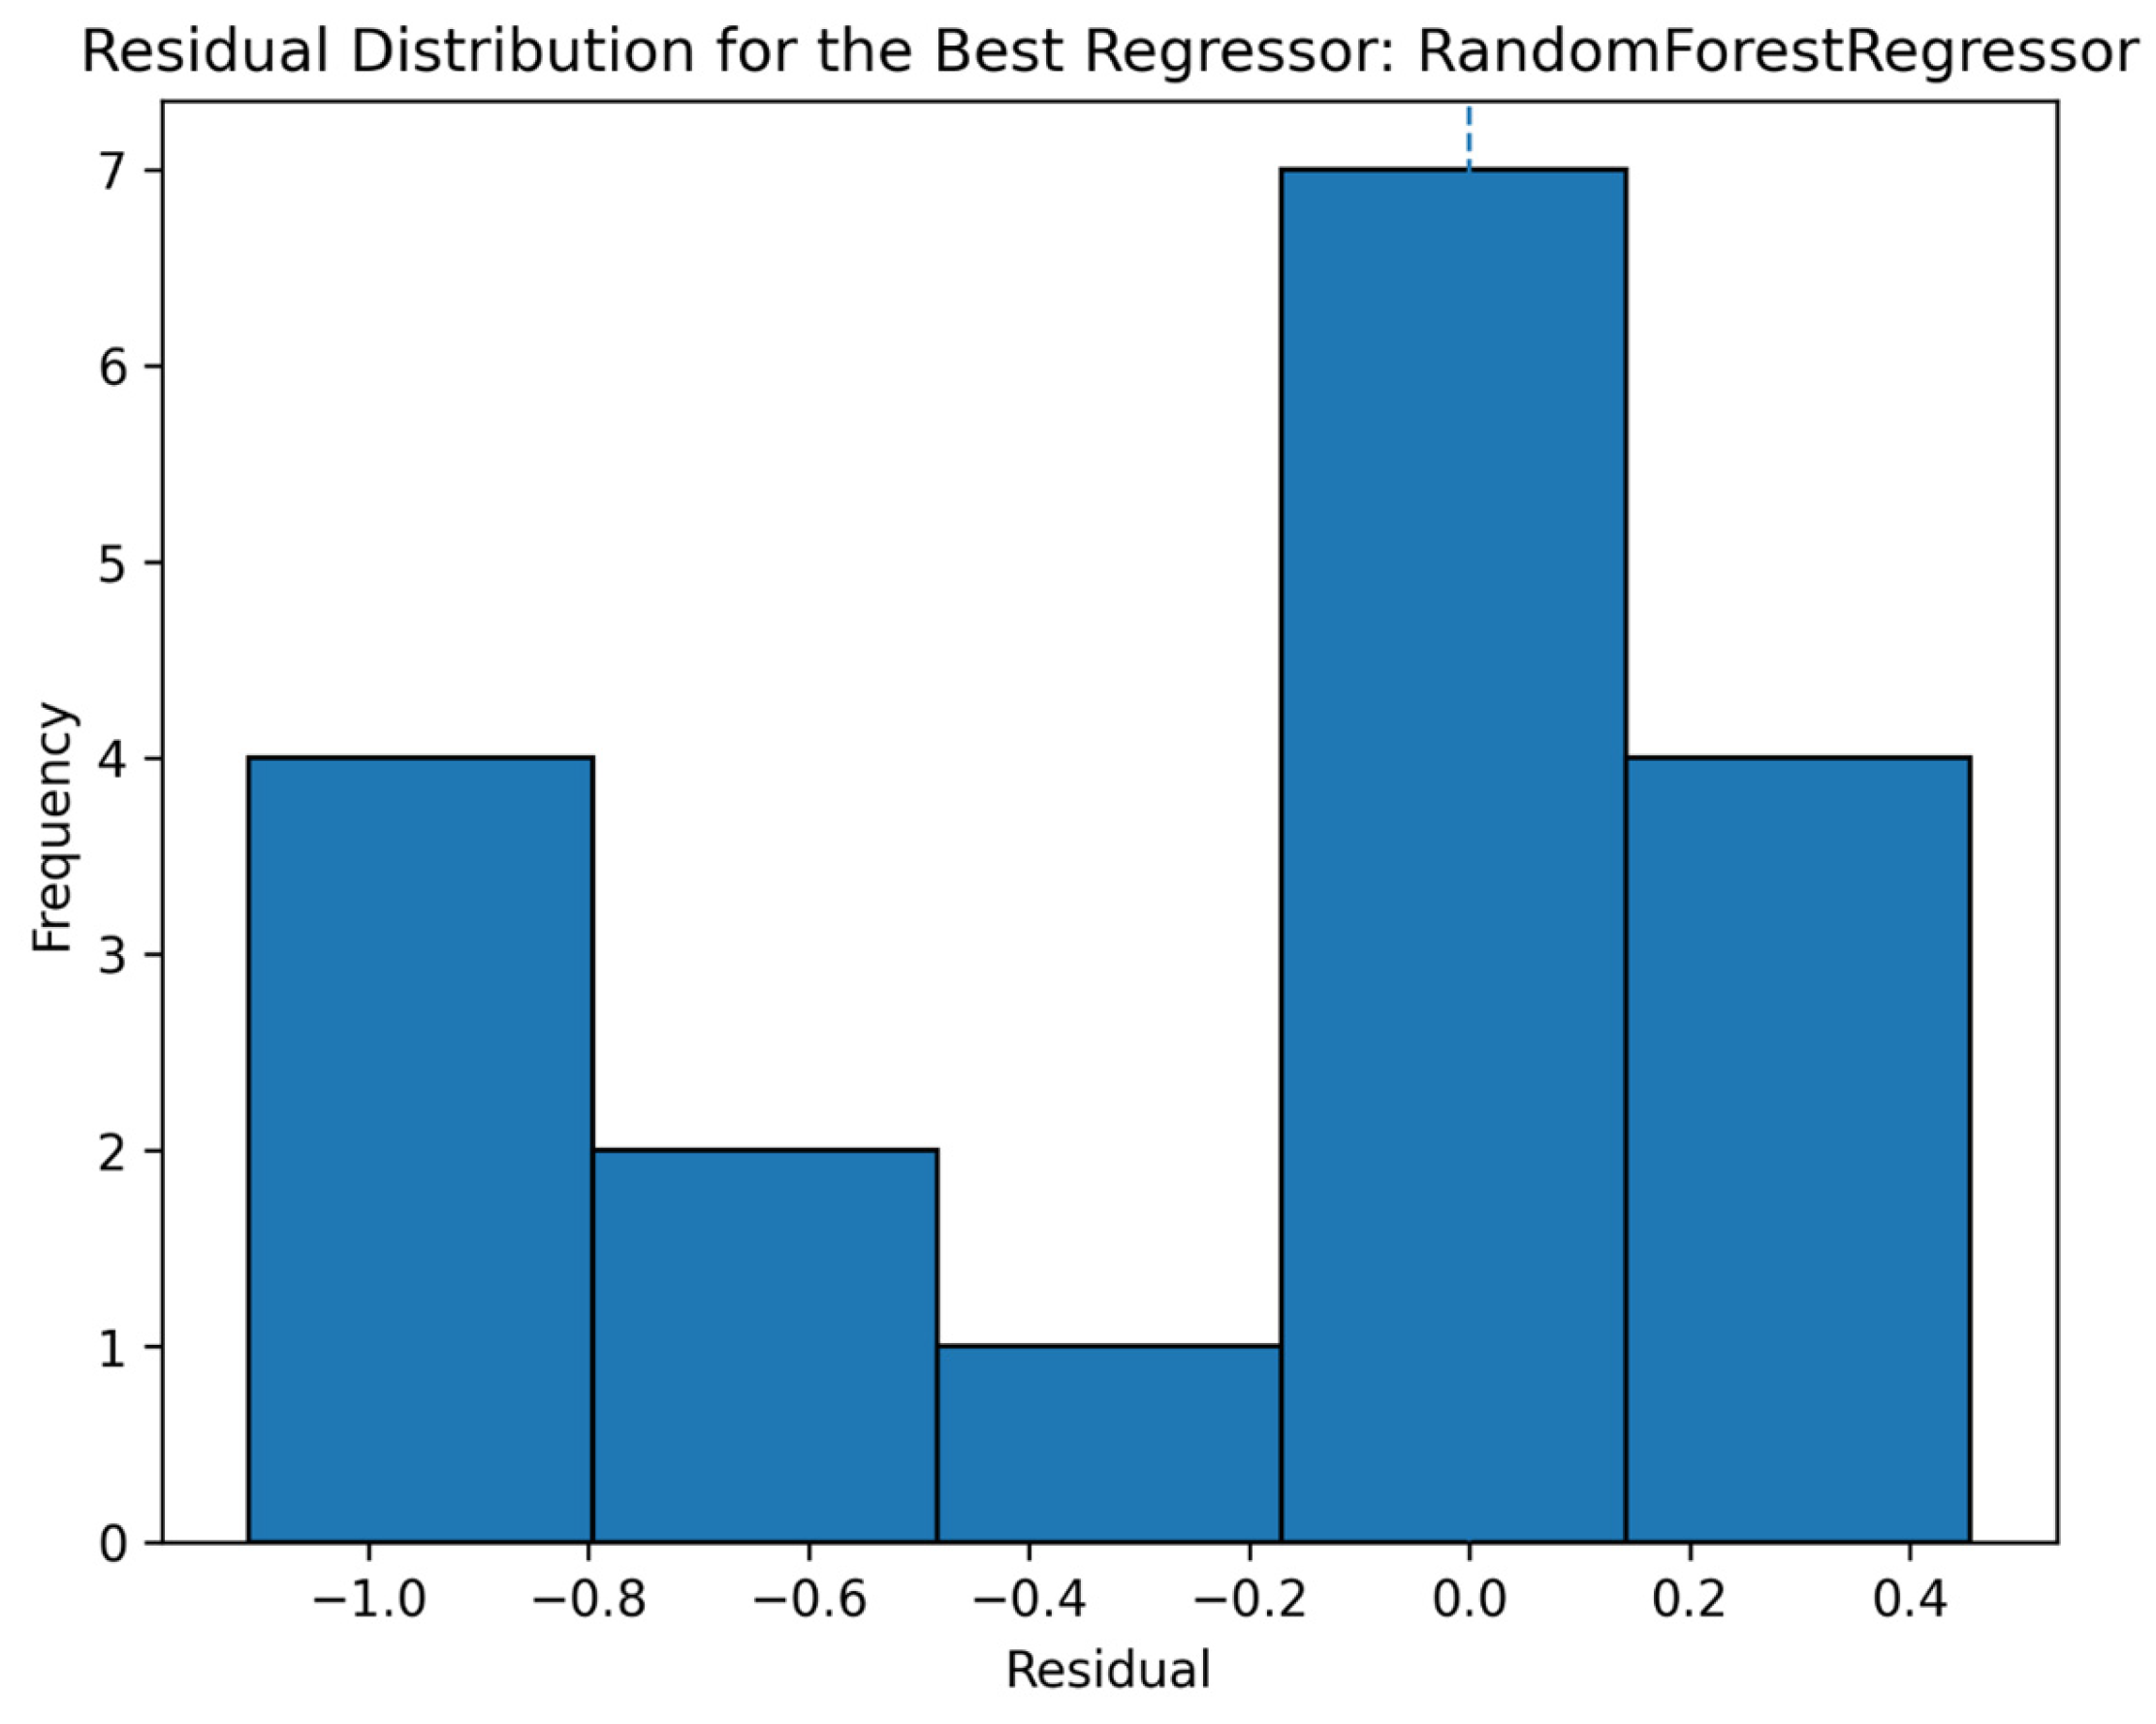
The residual distribution complements the evaluation of the regression model by showing whether errors are concentrated around zero or whether relevant asymmetries are present. According to
Figure 10, the technical reading should focus on the shape of the distribution and the presence of tails or systematic deviations. A reasonably centered residual distribution suggests the absence of severe global bias, whereas pronounced tails would indicate atypical cases in which the model underestimates or overestimates intention. Because the dependent variable is constructed from an aggregated Likert scale, small deviations may have important substantive interpretation, especially when working with technological-adoption decisions. Therefore, residual evaluation should not be treated as a secondary formal requirement, but rather as evidence of model stability in the face of organizational heterogeneity.
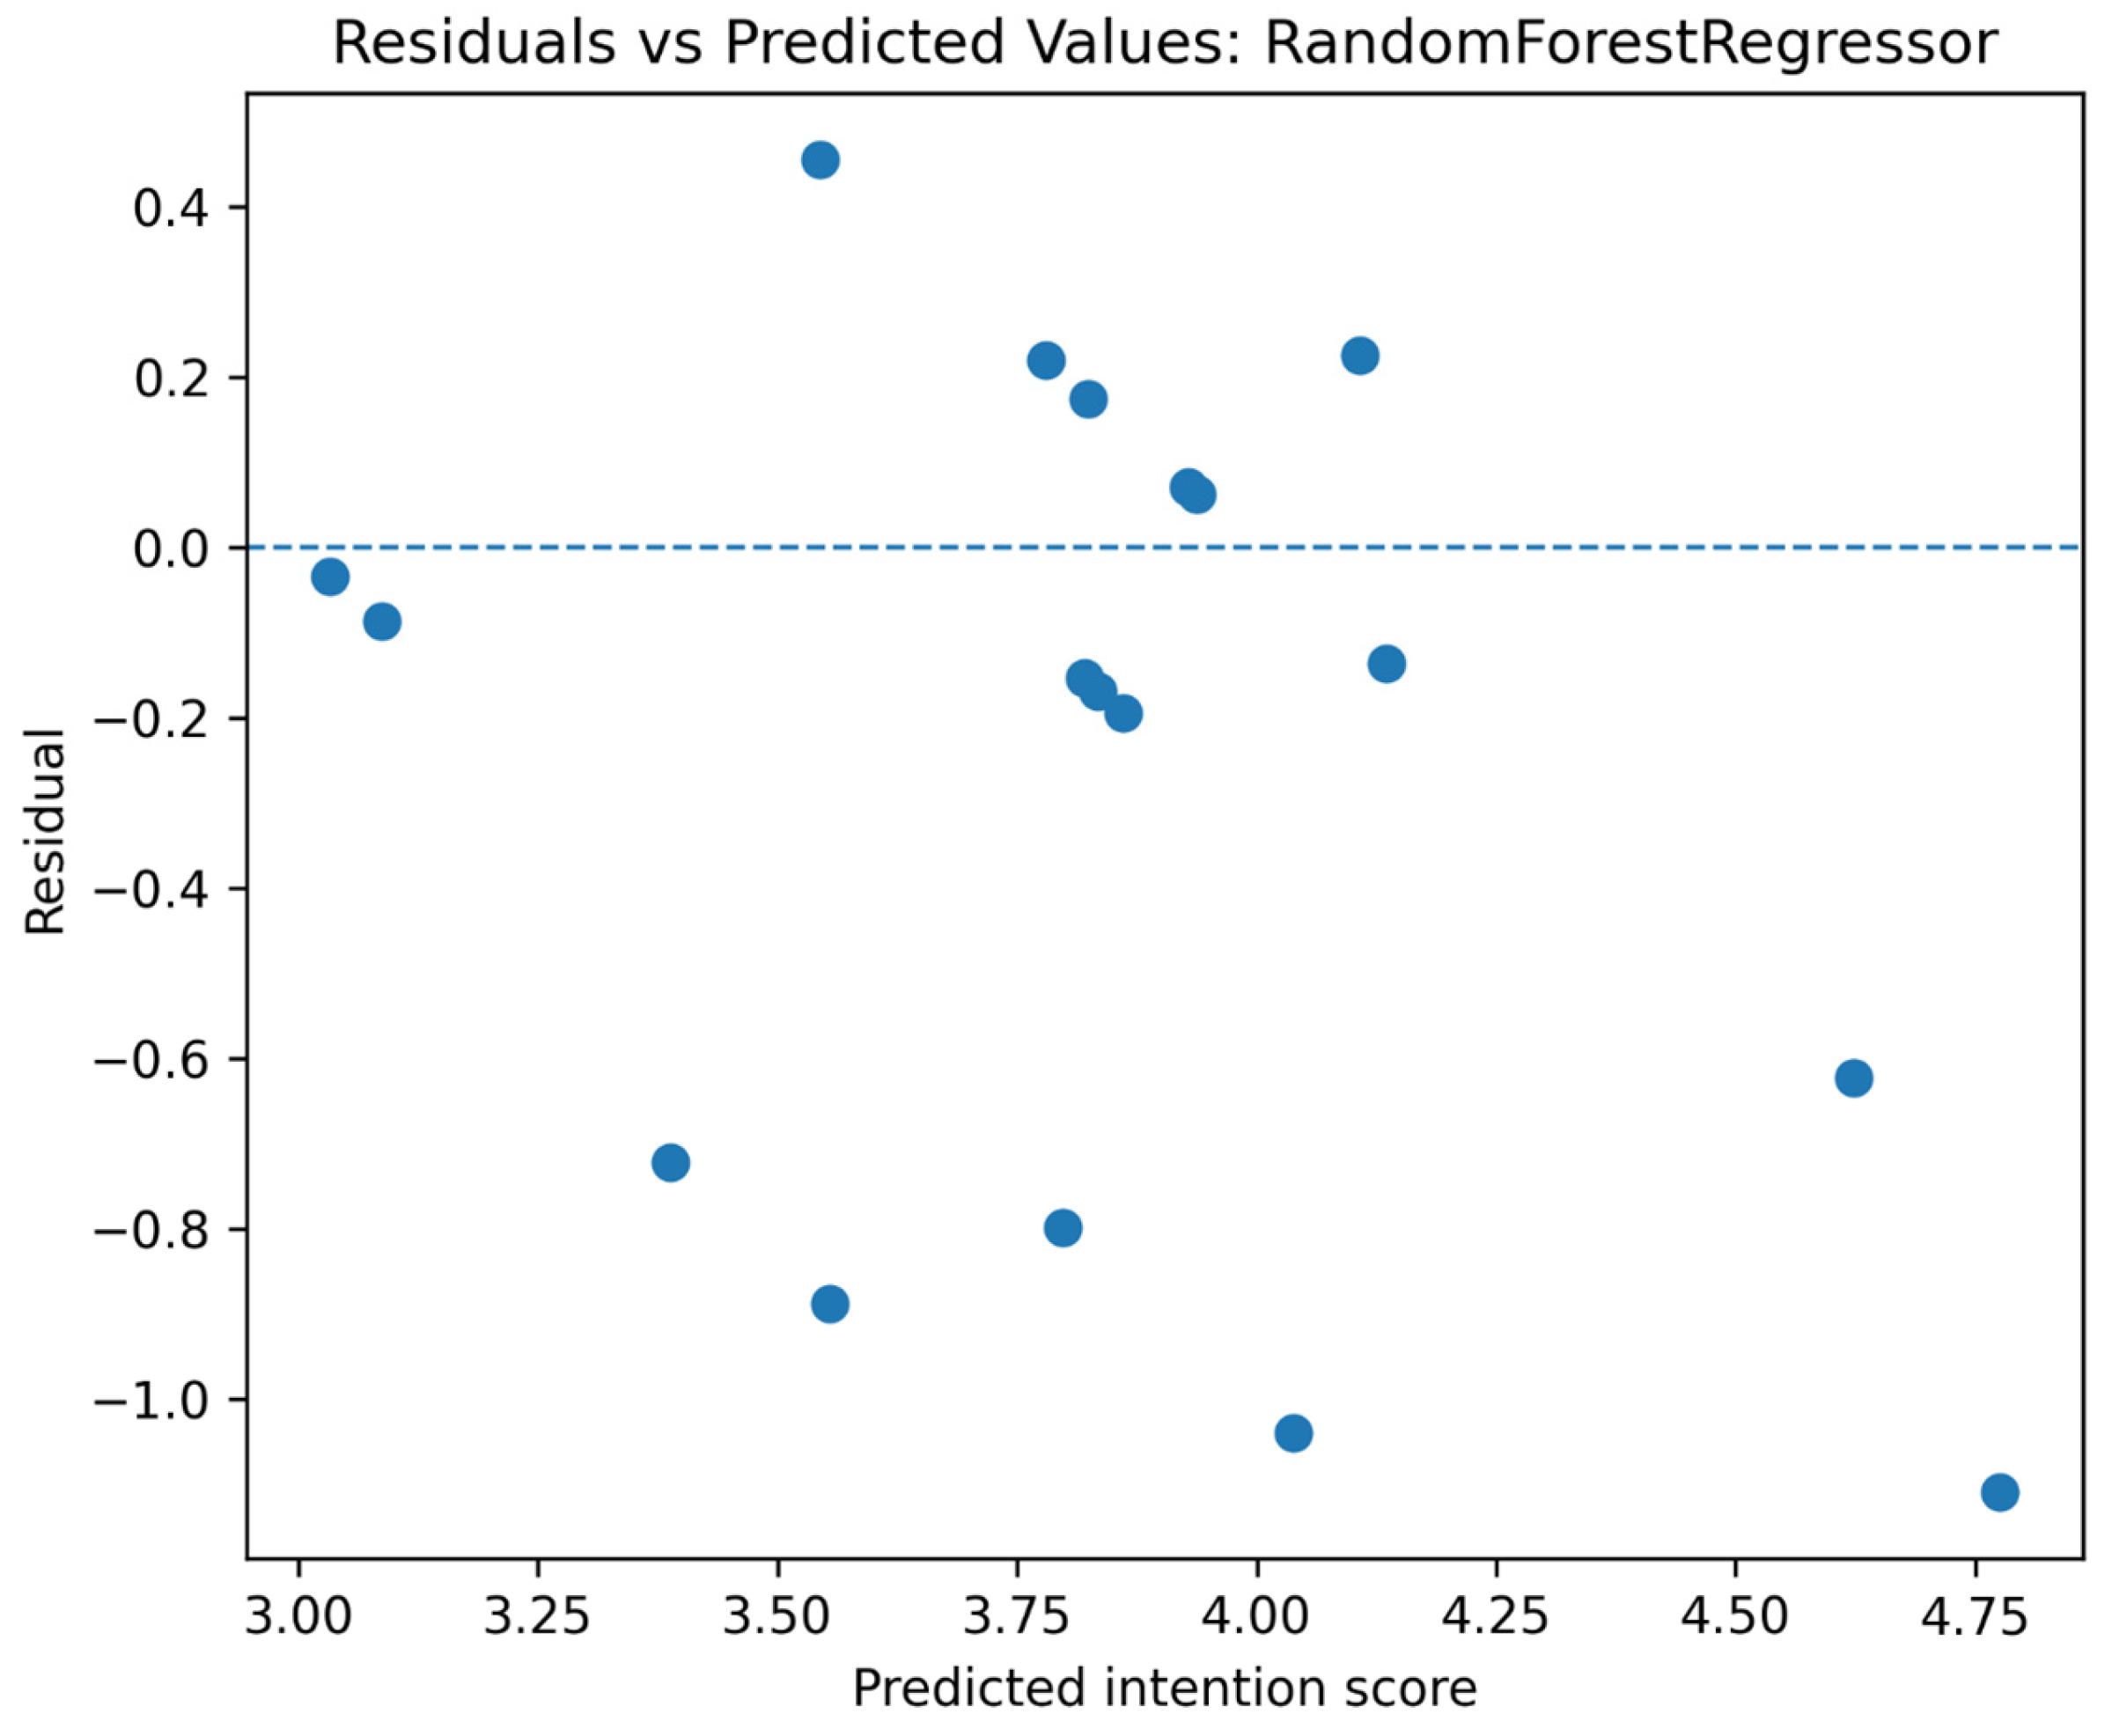
The plot of residuals against predicted values allows examination of possible heteroscedasticity patterns or systematic errors across the estimated range of intention. According to
Figure 11, the absence of a clearly curved structure or funnel-shaped pattern would be consistent with acceptable predictive behavior. If errors intensify at the upper or lower extremes, this would suggest that the model predicts intermediate cases better than extreme adoption profiles. This reading is important because, in studies of microgrids and circular transition, extreme cases are often the most relevant for public policy and strategic management: those with very high intention may act as early adopters, whereas those with low intention may represent segments where critical financing, information, or organizational capability barriers are concentrated.
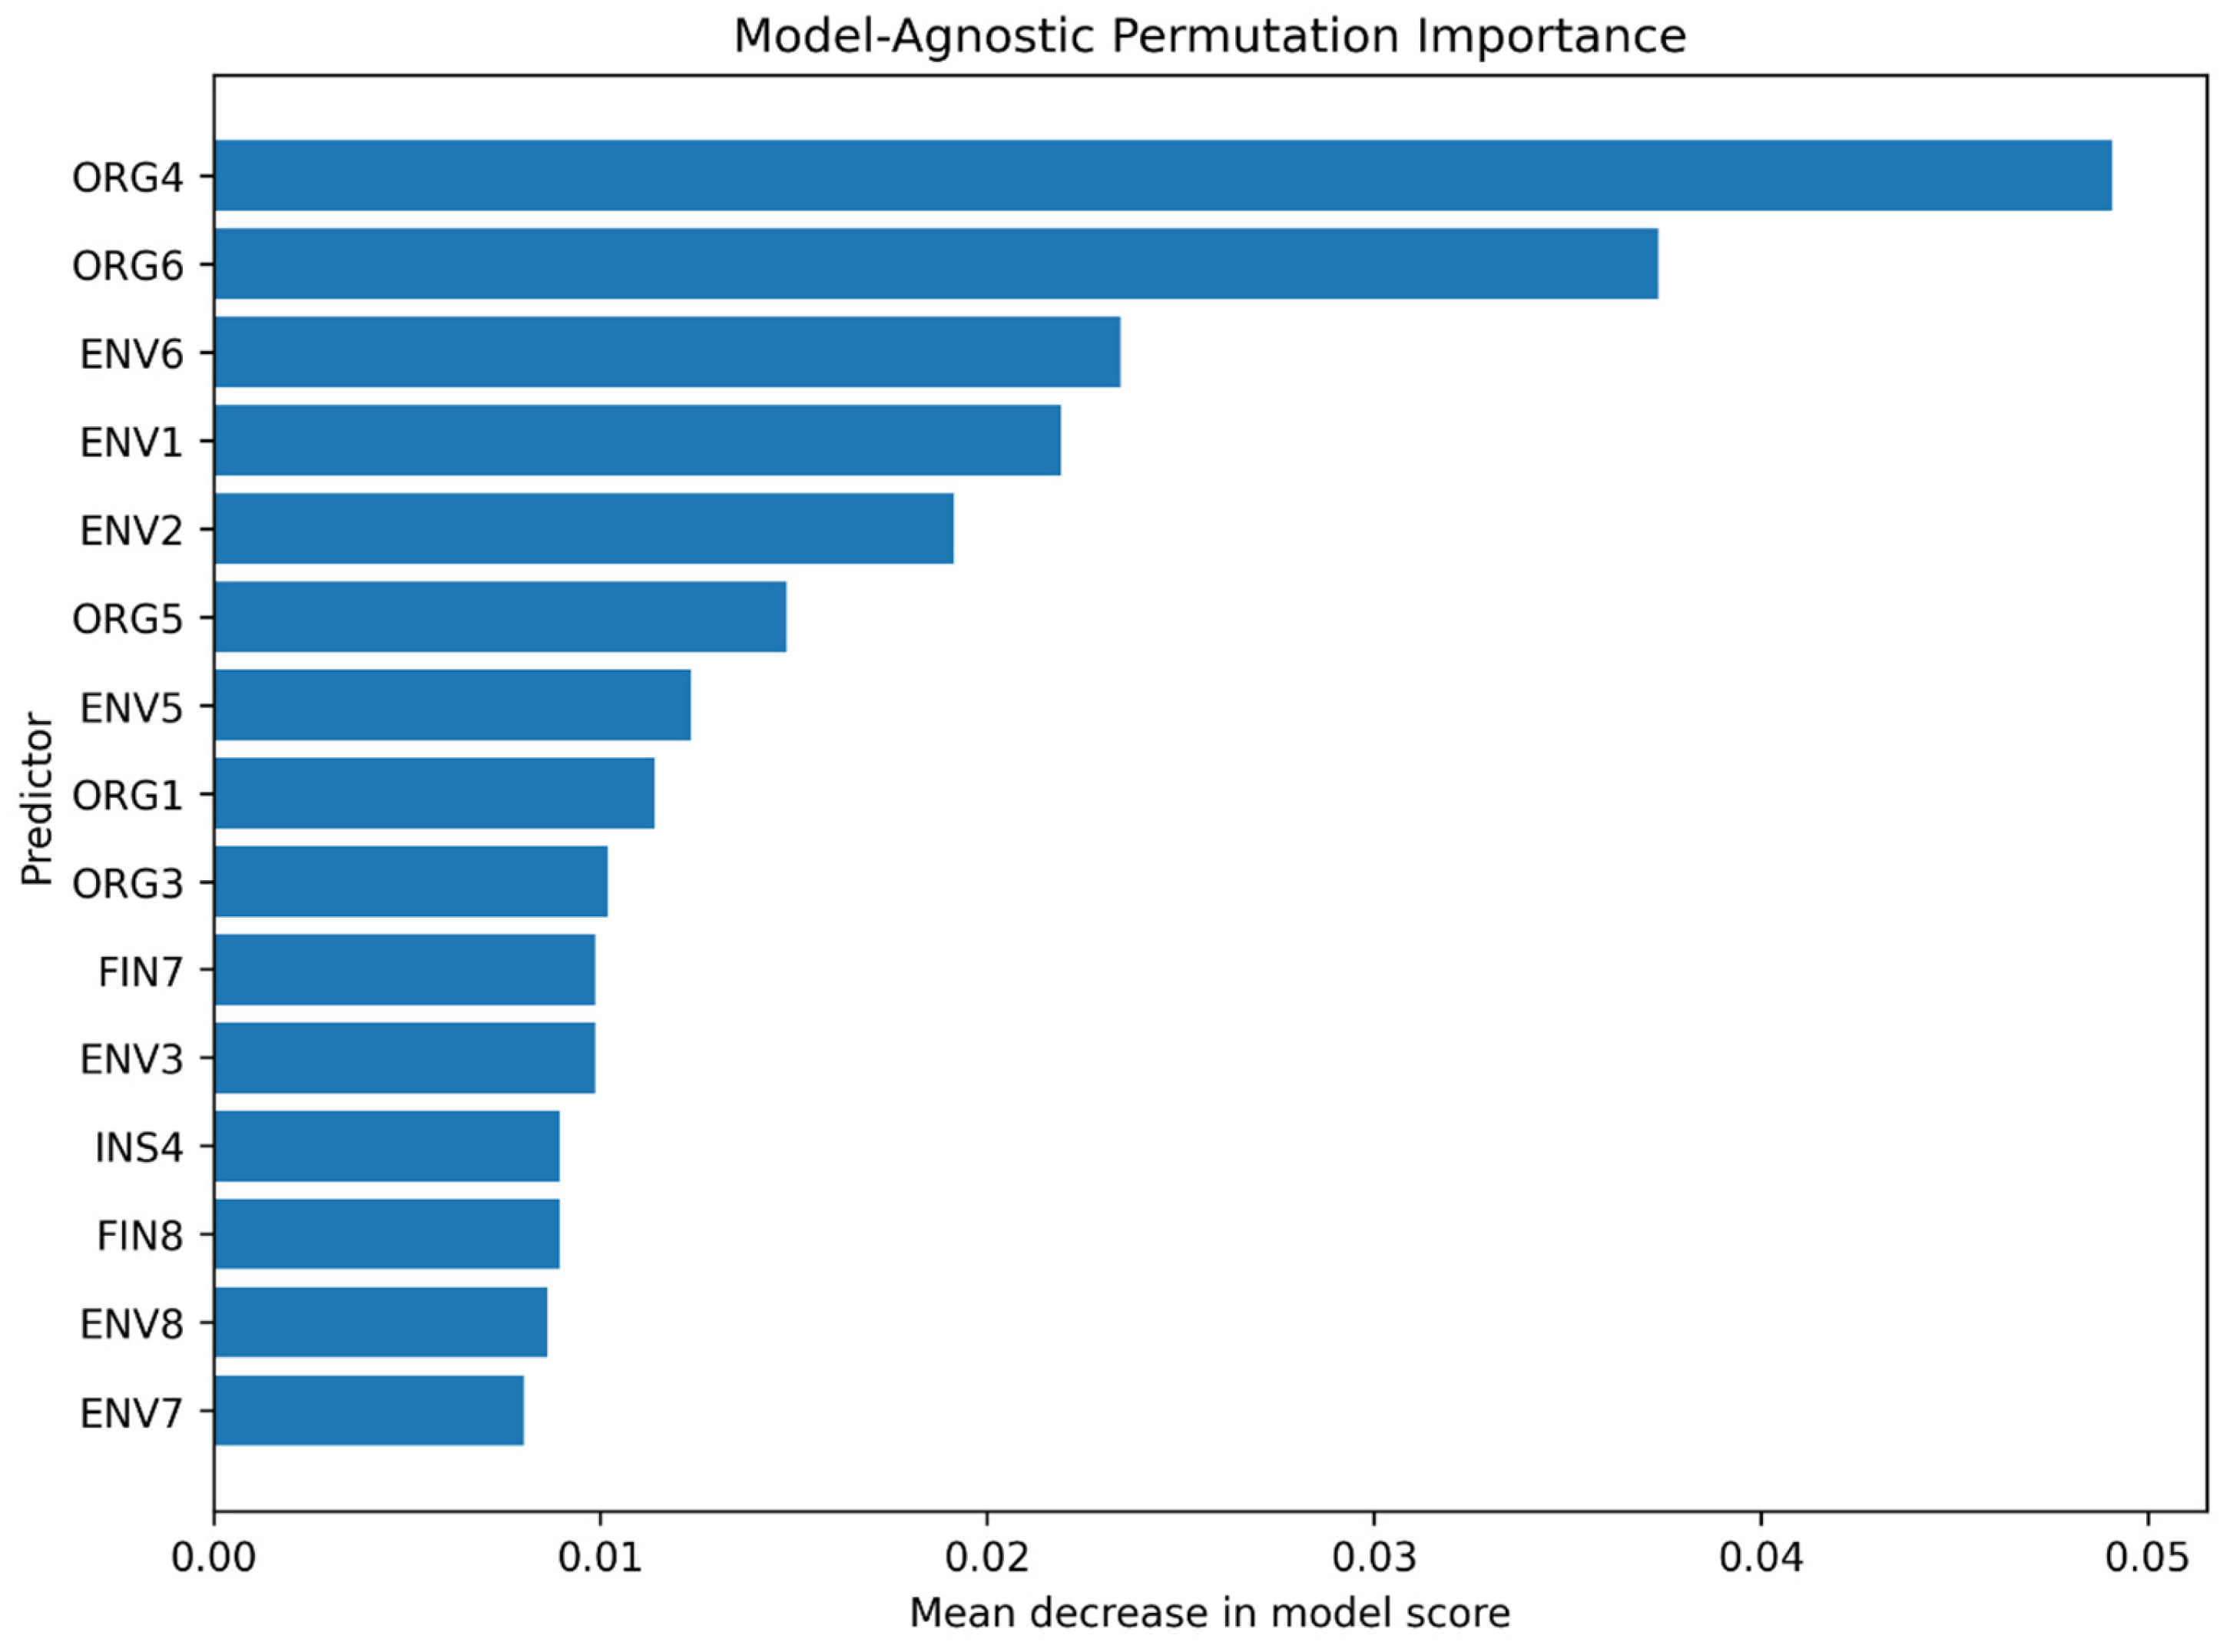
Variable importance analysis adds a layer of explainability to the classification model. According to
Table 6, ORG4 was the most important predictor according to both permutation importance and the model’s native importance, with values of 0.049 and 0.091, respectively. In addition, ORG6, ENV6, ENV1, ENV2, ORG5, ENV5, ORG1, ORG3, FIN7, and ENV3 appear among the predictors with the greatest contribution by permutation. In technical terms, the convergence among bivariate correlation, permutation importance, and native importance reinforces the interpretive robustness of the organizational and environmental variables. The result should not be read as causality, but rather as evidence that the prediction of high intention depends especially on internal capabilities and environmental criteria that act as readiness signals for translating the circular bioeconomy into a concrete technological decision.
Figure 12 visualizes the hierarchy of predictors from a model-perturbation perspective: a variable is more important when its randomization deteriorates predictive performance to a greater extent. According to
Figure 12, the predominance of ORG and ENV variables confirms that the model is not simply capturing general positive responses, but rather a pattern of organizational readiness and environmental orientation. This distinction is fundamental to the study’s contribution because it places the adoption of biogas–solar microgrids in a space that is more complex than the mere perception of benefits. The results suggest that organizations with higher intention not only value sustainability but also present internal capacity signals to operate, absorb, or manage the transition toward circular energy schemes.
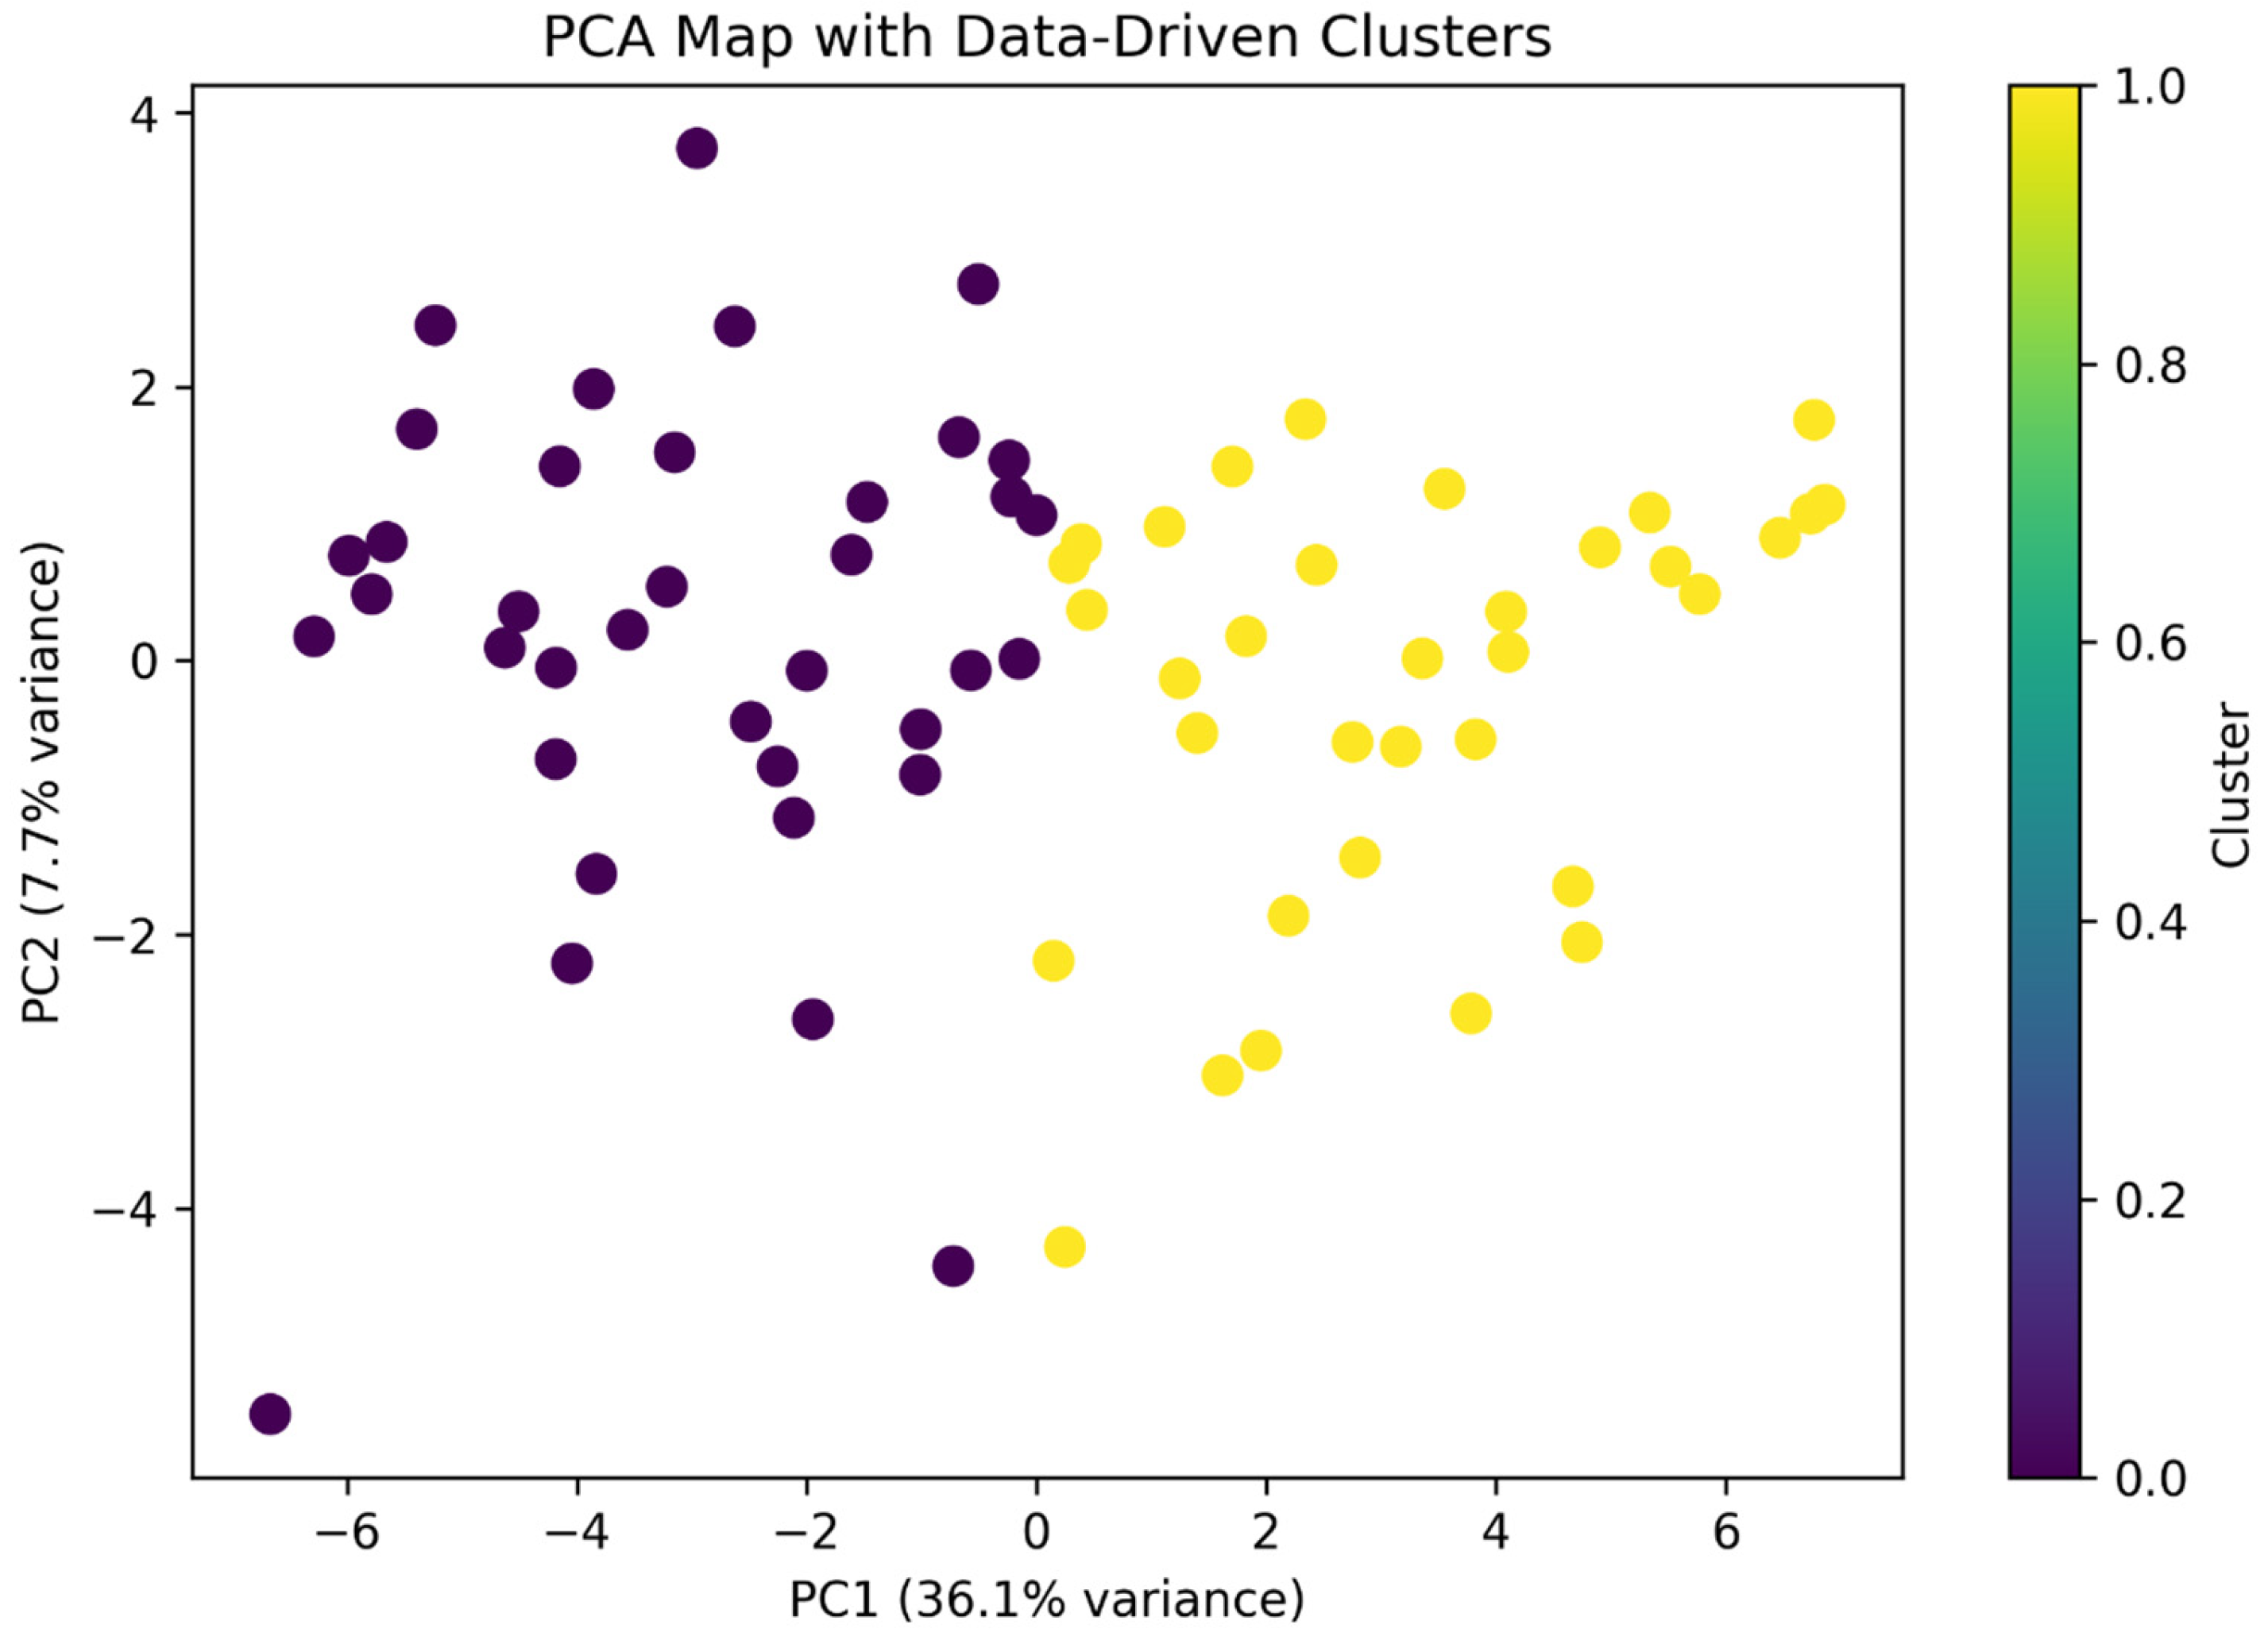
Finally, the unsupervised analysis explored the existence of latent profiles within the sample. Solutions with two, three, and four clusters were evaluated using the silhouette coefficient. According to
Table 7, the two-cluster solution obtained the best silhouette value, with 0.208, above the three-cluster solution, with 0.123, and the four-cluster solution, with 0.097. However, a silhouette value of 0.208 indicates weak separation; therefore, the clustering results should be interpreted only as exploratory segmentation and not as a definitive classification of organizations. This segmentation is useful for describing tentative differences between lower-readiness and higher readiness profiles, but it should be validated with larger and more diverse samples before being used for targeting or classification.
The cluster profile suggests that the segmentation differentiates two tentative groups. According to
Table 8, cluster 0 presents lower means across all aggregate blocks, with an intention score of 3.468 and a proportion of high intention of 0.324. In contrast, cluster 1 shows higher means in benefits, institutional conditions, financial factors, environmental criteria, and organizational capabilities, with an intention score of 4.216 and a proportion of high intention of 0.676. This difference suggests that high adoption intention does not emerge from a single isolated factor, but from a systemic configuration in which perceived benefits, environmental legitimacy, institutional support, financial feasibility, and organizational capabilities mutually reinforce one another. Given the weak cluster separation, this interpretation is descriptive and exploratory rather than confirmatory.
The PCA representation of the clusters offers a visual reading of the latent structure of the sample. According to
Figure 13, the separation between groups should not be understood as a rigid boundary, but as a gradual differentiation of profiles in a reduced principal component space. This evidence is coherent with the supervised results: adoption intention presents sufficient structure to be modeled, but preserves internal heterogeneity. Partial overlap between profiles may indicate that some organizations share similar environmental perceptions or benefits while differing in internal capabilities, financial conditions, or institutional maturity. Therefore, cluster analysis does not replace the predictive model and should not be treated as a stable typology; it only complements the analysis by suggesting possible strategic segments for future validation.
The results suggest that, within this small exploratory sample, the intention to adopt biogas–solar microgrids can be described and preliminarily modeled through machine-learning algorithms, especially tree ensembles. This statement should not be read as evidence of a validated predictive tool. The performance values were obtained from a limited dataset and must be confirmed through external validation. Nevertheless, the convergence among correlations, permutation importance, ROC-AUC, average precision, confusion matrix, calibration, residual analysis, and PCA-cluster segmentation provides preliminary evidence that high stated intention is associated with organizational capabilities, perceived feasibility, environmental legitimacy, and institutional conditions. This result contributes to a decision support discussion for circular microgrids based on biogas and solar energy, but it does not replace technical, financial, or regulatory feasibility assessment.
6. Conclusions
This exploratory pilot study analyzed the organizational and environmental determinants associated with stated adoption intention of biogas–solar microgrids within a circular bioeconomy framework, based on 71 individual responses. The results offer preliminary support for the proposed hypotheses, but they do not constitute confirmatory evidence or a generalizable predictive tool. Organizational capabilities emerged as the most consistent predictor block, with ORG4 showing the strongest bivariate correlation with intention (r = 0.680) and the highest permutation importance value (0.049). Tree-ensemble algorithms showed better exploratory performance than penalized linear models, with ExtraTrees reaching a test ROC-AUC of 0.889; however, this value was obtained from a small hold-out set and requires external validation. The K-Means analysis suggested two tentative readiness profiles, but the weak silhouette coefficient (0.208) requires cautious interpretation.
From the theoretical perspective, the study provides preliminary evidence on the role of internal organizational capabilities and environmental legitimacy as antecedents of technological intention, extending adoption frameworks toward a systemic reading of sociotechnical maturity. From the methodological perspective, the convergence among supervised classification, continuous regression, and unsupervised segmentation suggests the feasibility of using interpretable machine learning as an exploratory tool in energy-behavior research, provided that limitations related to sample size, overfitting, and external validation are explicitly acknowledged. From the applied perspective, the findings may support early stage decision-making by identifying conditions that deserve attention before feasibility studies or pilot projects are launched, especially technical–administrative capacity, financing, enabling regulation, environmental legitimacy, and institutional support.
The results should be read as exploratory evidence circumscribed to the territorial context studied, without claiming inferential generalization to the bioenergy sector as a whole. The study measures intention, not actual adoption; therefore, any practical implementation of biogas–solar microgrids must be preceded by local engineering design, biomass-flow estimation, solar-resource assessment, financial evaluation, infrastructure diagnosis, technical support planning, and regulatory review. Future research should validate the instrument and the models with larger and geographically diversified samples, incorporate longitudinal measurements that make it possible to study the conversion between stated intention and investment behavior, integrate objective technical-performance data with behavioral data, and apply additional post hoc explainability techniques that enrich the reading of predictive contributions. Under these conditions, the study provides a modest but defensible contribution to the discussion on sustainable energy transitions, circular resource use, and organizational readiness for circular bioeconomy implementation.



 ,
,