Article

Experimental and Numerical Investigations of Thermal Characteristics and Cooling Performance of Sodium-Ion Batteries

1
School of Energy and Power Engineering, Changsha University of Science and Technology, Changsha 410114, China
2
State Key Laboratory of Disaster Prevention and Reduction for Power Grid, Changsha University of Science and Technology, Changsha 410114, China
3
Guangdong Shunde Innovative Design Institute, Foshan 528300, China
*
Author to whom correspondence should be addressed.
Sustainability 2026, 18(14), 6960; https://doi.org/10.3390/su18146960 (registering DOI)
Submission received: 25 May 2026 / Revised: 27 June 2026 / Accepted: 2 July 2026 / Published: 8 July 2026
(This article belongs to the Section Energy Sustainability)

Abstract

Sodium-ion batteries (SIBs), owing to their cost-effectiveness and outstanding thermal safety, show great promise for energy storage applications, which is essential for improving the comprehensive utilization of renewable energy and advancing sustainable energy development. However, the thermal management technologies for SIBs have failed to attract enough attention for further research. Herein, temperature rise experiments of SIBs were carried out to explore their heat generation and transfer characteristics. The voltage and temperature rise characteristics, internal resistance, and entropy heat coefficient were investigated under various environmental temperatures and charge/discharge rates. Based on these findings, a thermal model was established according to the Bernardi theory. This model accurately describes the thermal behavior during the discharging process, enabling the prediction of heat generation in SIBs. The optimal air-cooled structure and operating condition parameters for the SIB pack were obtained using an orthogonal numerical optimization design. After optimization, the maximum temperature of the single cell is reduced by 7.76 °C, which is followed by a decrease of 21.33%. The average temperature difference of the SIB pack is 0.97 °C, which is reduced by 73.30%. This research is conducive to effectively controlling battery temperature within an optimal range to prevent combustion, explosion, and other thermal runaway events, providing a certain support for thermal management design for SIB packs in practical applications.

1. Introduction

Developing new energy, especially the transition from fossil fuels to renewable sources, plays a pivotal role in achieving global net-zero CO2 emissions [1,2]. Power grids serve as the foundation for the energy transition but lack the physical capacity to accommodate a large proportion of volatile renewable energy sources [3,4]. Energy storage technologies can smooth power output, provide frequency regulation, and perform peak shifting, thereby enhancing the coordinated control of source–network–load–storage in power grids [5,6]. Electrochemical energy storage, featuring a short response time, high energy density, low maintenance cost, and short construction cycle, is poised to become the most promising energy storage technology [7]. Currently, lithium-ion battery (LIB) technology dominates the field of electrochemical energy storage, accounting for 96.9% of total installed capacity [8]. Nevertheless, the elevated cost of raw materials, along with limitations in high-temperature stability and low-temperature efficiency, remains a significant challenge for LIBs [9]. For instance, LIBs cannot be charged below 0 °C and may suffer from thermal runaway risks above 45 °C because of intense internal chemical reactions [10]. In contrast, sodium-ion batteries (SIBs) are capable of readily surmounting the aforementioned obstacles of LIBs. They offer advantages, such as sustainability and low cost of raw materials and performance that is compatible with the energy storage environment, and hold great promise for broad application [11,12,13].
Considering the ease of transportation and rapid deployability, SIBs are generally housed in containerized energy storage systems. This setup is characterized by scalability, a small footprint, and environmental adaptability [14]. The battery pack, the core of the containerized system, significantly influences overall performance. Its efficiency, lifespan, and safety are intertwined with operating temperature and thermal uniformity [15,16]. Specifically, a large number of ions accumulate at the electrode–electrolyte interface at low temperatures, deteriorating the battery capacity and even causing short circuits, whereas at high temperatures, the internal chemical balance of the battery is disrupted, accelerating battery capacity degradation; this indicates that only within an appropriate temperature range can the optimal battery performance be achieved [17,18,19]. Hu et al. [20] investigated the effects of low-temperature cycling on SIBs and found that decreasing temperatures accelerate capacity fade, impedance rise, sodium deposition, and material decomposition. Song et al. [21] studied the performance of SIBs, and the results show that the capacity of SIBs decays rapidly under high-temperature conditions. In addition, it has been reported that the uneven temperatures among individual cells significantly affect the capacity and lifetime of the overall battery pack [22,23].
Notably, the battery packs in containers are arranged in close proximity, with small gaps between batteries. This makes it challenging to dissipate a large amount of heat in the charge and discharge processes [24]. In particular, the close spatial arrangement of these packs significantly hinders sufficient convective heat transfer to the surrounding air inside the container, potentially causing combustion or explosion [25,26]. According to the previous report, a total of 32 plant fires and explosion accidents have occurred over the last decade due to thermal runaway within the battery packs [27,28]. Despite superior thermal safety compared with LIBs, SIBs are still susceptible to thermal runaway under various abuse conditions, including thermal, electrical, and mechanical stresses [29]. Therefore, improving the heat dissipation performance of SIB packs represents a landmark in practical applications under various scenarios [30]. Nonetheless, the thermal management technologies for SIBs are currently in the early stages, and their accurate electrochemical–thermal coupling models remain uncharted [31].
In this work, thermal characteristics of SIBs are investigated by theoretical analysis, experimental investigation, and numerical simulation. Furthermore, an electrochemical–thermal coupling model is established to predict the performance of SIBs. The orthogonal optimization method is adopted to perform a multi-objective optimization design of the air cooling structure and operating parameters of a SIB pack, in order to improve heat dissipation performance. The findings can provide a certain reference for the design of the thermal management system of SIB packs in practical engineering applications, and are also expected to prolong the cycle life and enhance the long-term reliability of battery systems, thereby reducing life-cycle resource consumption and environmental burdens, which is conducive to the sustainability of energy storage technologies.

2. Working Principle, Heat Generation and Transfer Mechanism of SIB

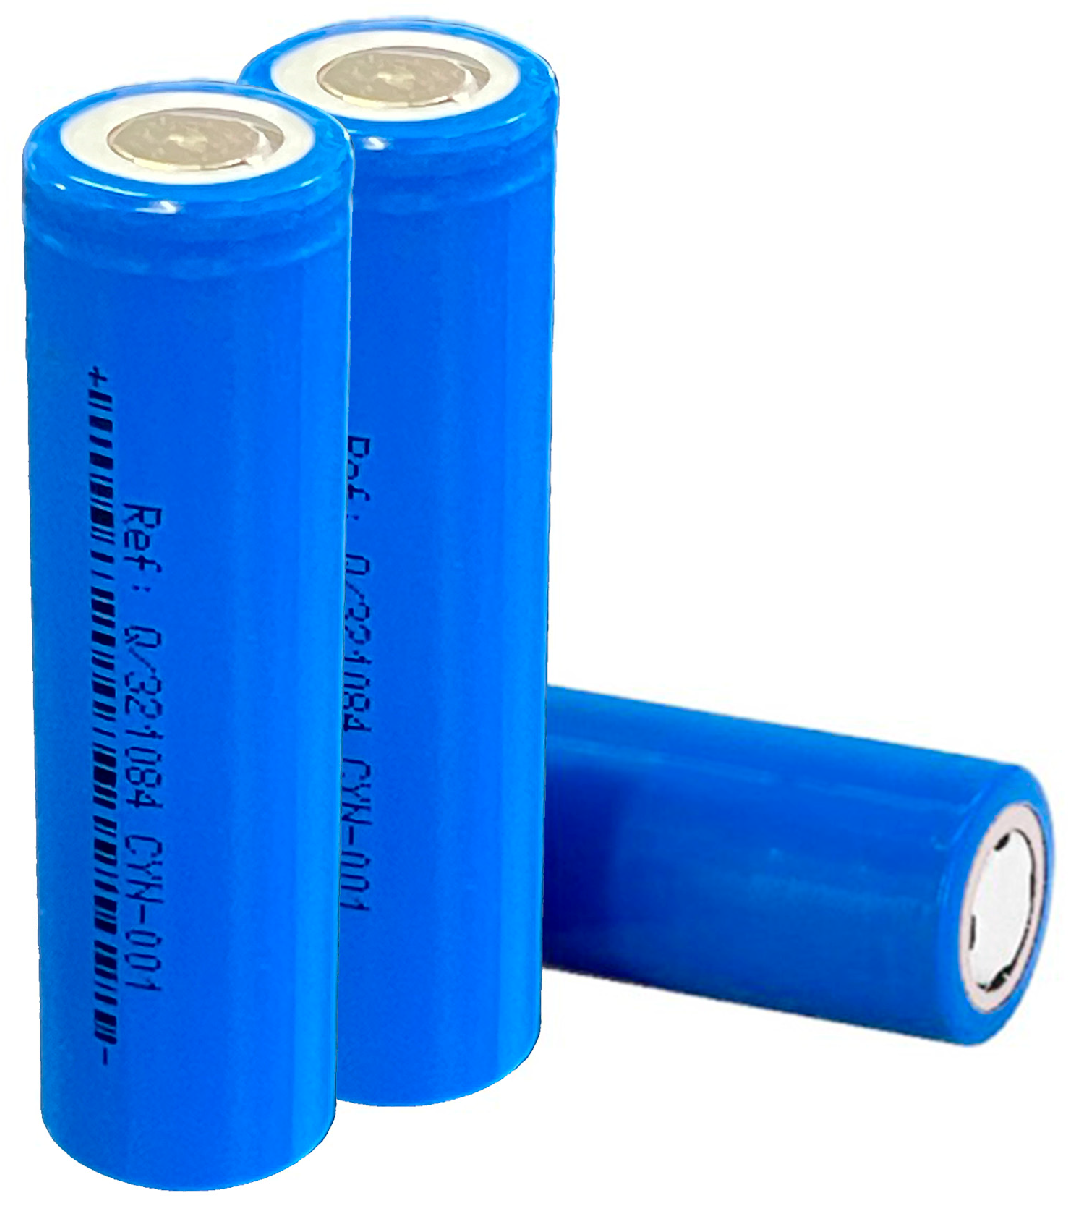
In this work, a commercial 18650 SIB with a capacity of 1300 mAh (as shown in Figure 1) was chosen as the research object. The SIB is produced by Beijing Xuexiong Technology Co., Ltd. (Beijing, China) under production batch number Q/321084 CYN-001, and the basic parameters are detailed in Table 1. The cathode material of the battery is layered NaNi1/3Fe1/3Mn1/3O2, while the anode material is hard carbon. Both electrode collectors are fabricated from aluminum foil. The separator material is polypropylene (PP)/polyethylene (PE), and the electrolyte consists of a mixture of sodium hexafluorophosphate salt and organic carbonate ester solvent.

2.1. Electrochemical Working Principles of SIB

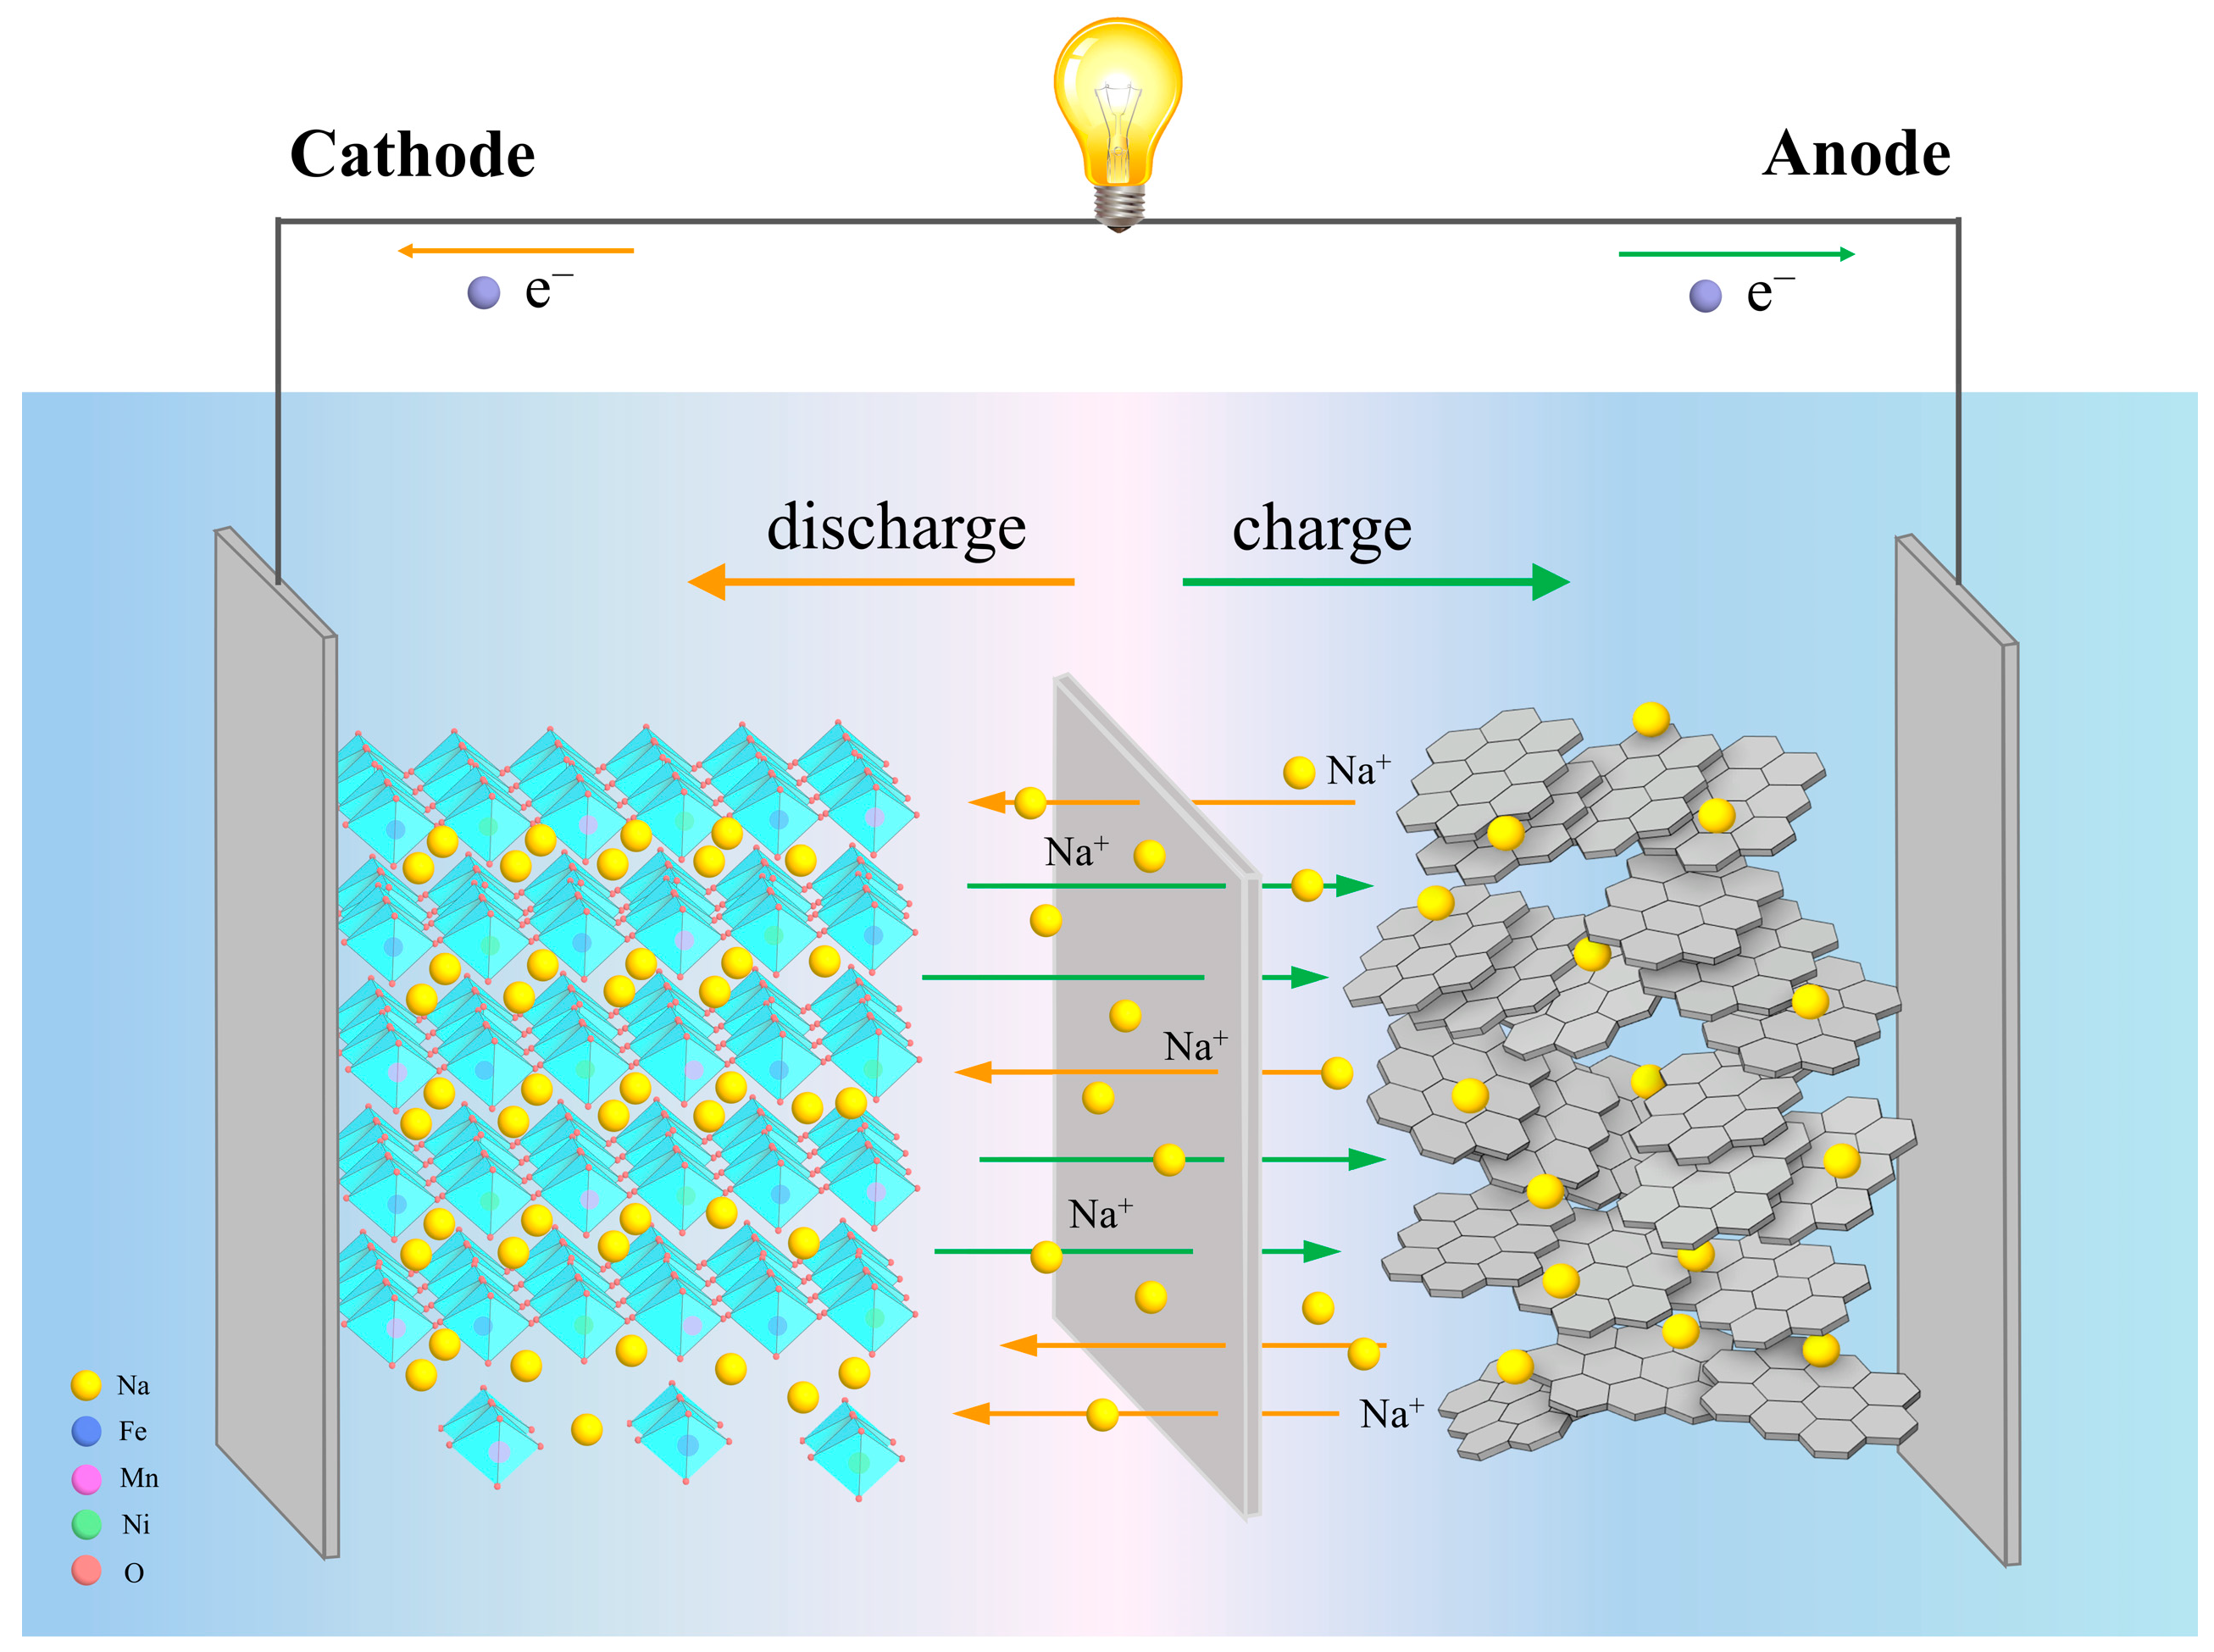
As illustrated in Figure 2, sodium ions move reversibly between the cathode and anode through the electrolyte, enabling energy storage via redox reactions at the electrodes. Specifically, during the charging process, an external potential facilitates the electrochemical extraction of sodium cations from the cathode material. Subsequently, these sodium cations migrate through the electrolyte and intercalate into the anode material. Conversely, during the discharging cycle, sodium cations spontaneously de-intercalate from the anode and transfer back to the cathode, resulting in the concomitant flow of electrons through an external load. The electrochemical reaction equations of the charging and discharging processes of the SIB are shown in Equations (1)–(3):
NaNi 1 / 3 Fe 1 / 3 Mn 1 / 3 O 2 + n C discharge charge Na 1 x Ni 1 / 3 Fe 1 / 3 Mn 1 / 3 O 2 + Na x C n
NaNi 1 / 3 Fe 1 / 3 Mn 1 / 3 O 2 discharge charge Na 1 x Ni 1 / 3 Fe 1 / 3 Mn 1 / 3 O 2 + x Na + + x e
n C + x Na + + x e discharge charge Na x C n
where x represents either the number of moles of sodium involved in the electrochemical reaction or the number of moles of electrons (e); and n refers to the number of electrons transferred in the electrode reaction.

2.2. Heat Generation and Transfer Mechanisms of SIB

2.2.1. Modeling of the Heat Production Rate of SIB

The primary heat sources of SIBs originate from two aspects. On one hand, the polarization heat is generated due to the internal resistance of the battery, which is calculated as follows:
R = ρ pol l S
q pol = I 2 R V pol
where R denotes the battery pole resistance, in Ω; ρpol represents the resistivity of the battery pole materials, in the unit of Ω·m; l stands for the length of the battery pole, measured in m; S is the cross-sectional area of battery pole, in m2; qpol is the heating power per unit volume of the positive and negative poles of the battery, in the unit of W/m3; I is the current passing through the battery pole, in A; Vpol is the volume of the battery pole, measured in m3.
On the other hand, the heat generation of batteries is influenced by factors such as electrode materials, charge/discharge rate, and environmental temperature. This makes it challenging to accurately measure the heat production rate. The Bernardi theory [32] regards the internal heat transfer in batteries as a heat conduction process occurring in a homogeneous anisotropic material. By analyzing the reversible and irreversible heat separately, it establishes the relationship between the heat generation and the measurement parameters of batteries.
The reversible or irreversible heat (Qr or Qp, W) generated during the battery heat production process is calculated as follows:
Q r = I T d E ocv d T
Q p = I E ocv U
where T is the average temperature of the battery, in K; dEocv/dT is the entropy coefficient, in the unit of mV/K; and U is the operating voltage, expressed in V.
The total heat production power (Q, W) of the battery can be expressed as:
Q = Q p + Q r
The volumetric rate of heat production (qcor, W/m3) in the charging and discharging processes can be expressed as:
q cor = Q V cor
where Vcor is the volume of the battery, in m3.

2.2.2. Modeling of Heat Transfer in SIB

Heat transfer in SIBs occurs in the processes of charging and discharging through three modes: conduction, convection, and radiation. Under nominal operating conditions, the continuous operating temperature range of sodium-ion batteries (SIBs), which is attributable to the internal heat generated during charge–discharge cycles, typically spans from −40 to 80 °C. In this context, thermal radiation to the surroundings accounts for a negligible proportion of the total heat produced by the battery and can thus be ignored.
The complex internal structure of SIBs, combined with heat generation and chemical reactions, makes it necessary to simplify the investigation of their thermal characteristics. Consequently, for modeling purposes, the battery is commonly approximated as a homogeneous solid cylinder with uniform internal heat generation. Fourier’s Law is employed to mathematically describe the heat transfer process within the SIB, expressed as:
ρ c p T t = k T + q pol + q cor
where ρ is the density of the SIB, in kg/m3; cp denotes the isobaric specific heat capacity of the SIB, in J/(kg·K); k is the thermal conductivity of the SIB, measured in W/(m·K).
In SIBs, convective heat transfer is facilitated by direct contact between the battery surface and the surrounding air or other cooling fluids. This process is driven by a temperature difference, enabling the transfer of heat generated inside the battery to the cooling fluid. The thermal convection process in SIB can be described by Newton’s law of cooling, expressed as:
q = h f T w T f
where q is the heat flux for convective processes, in W/m2; hf is the convective heat transfer coefficient, in W/(m2·K); and Tf and Tw are, respectively, the temperature of the cooling fluid and SIB surface, measured in K.

3. Experimental Study of Electrochemical-Thermal Characteristics of SIB

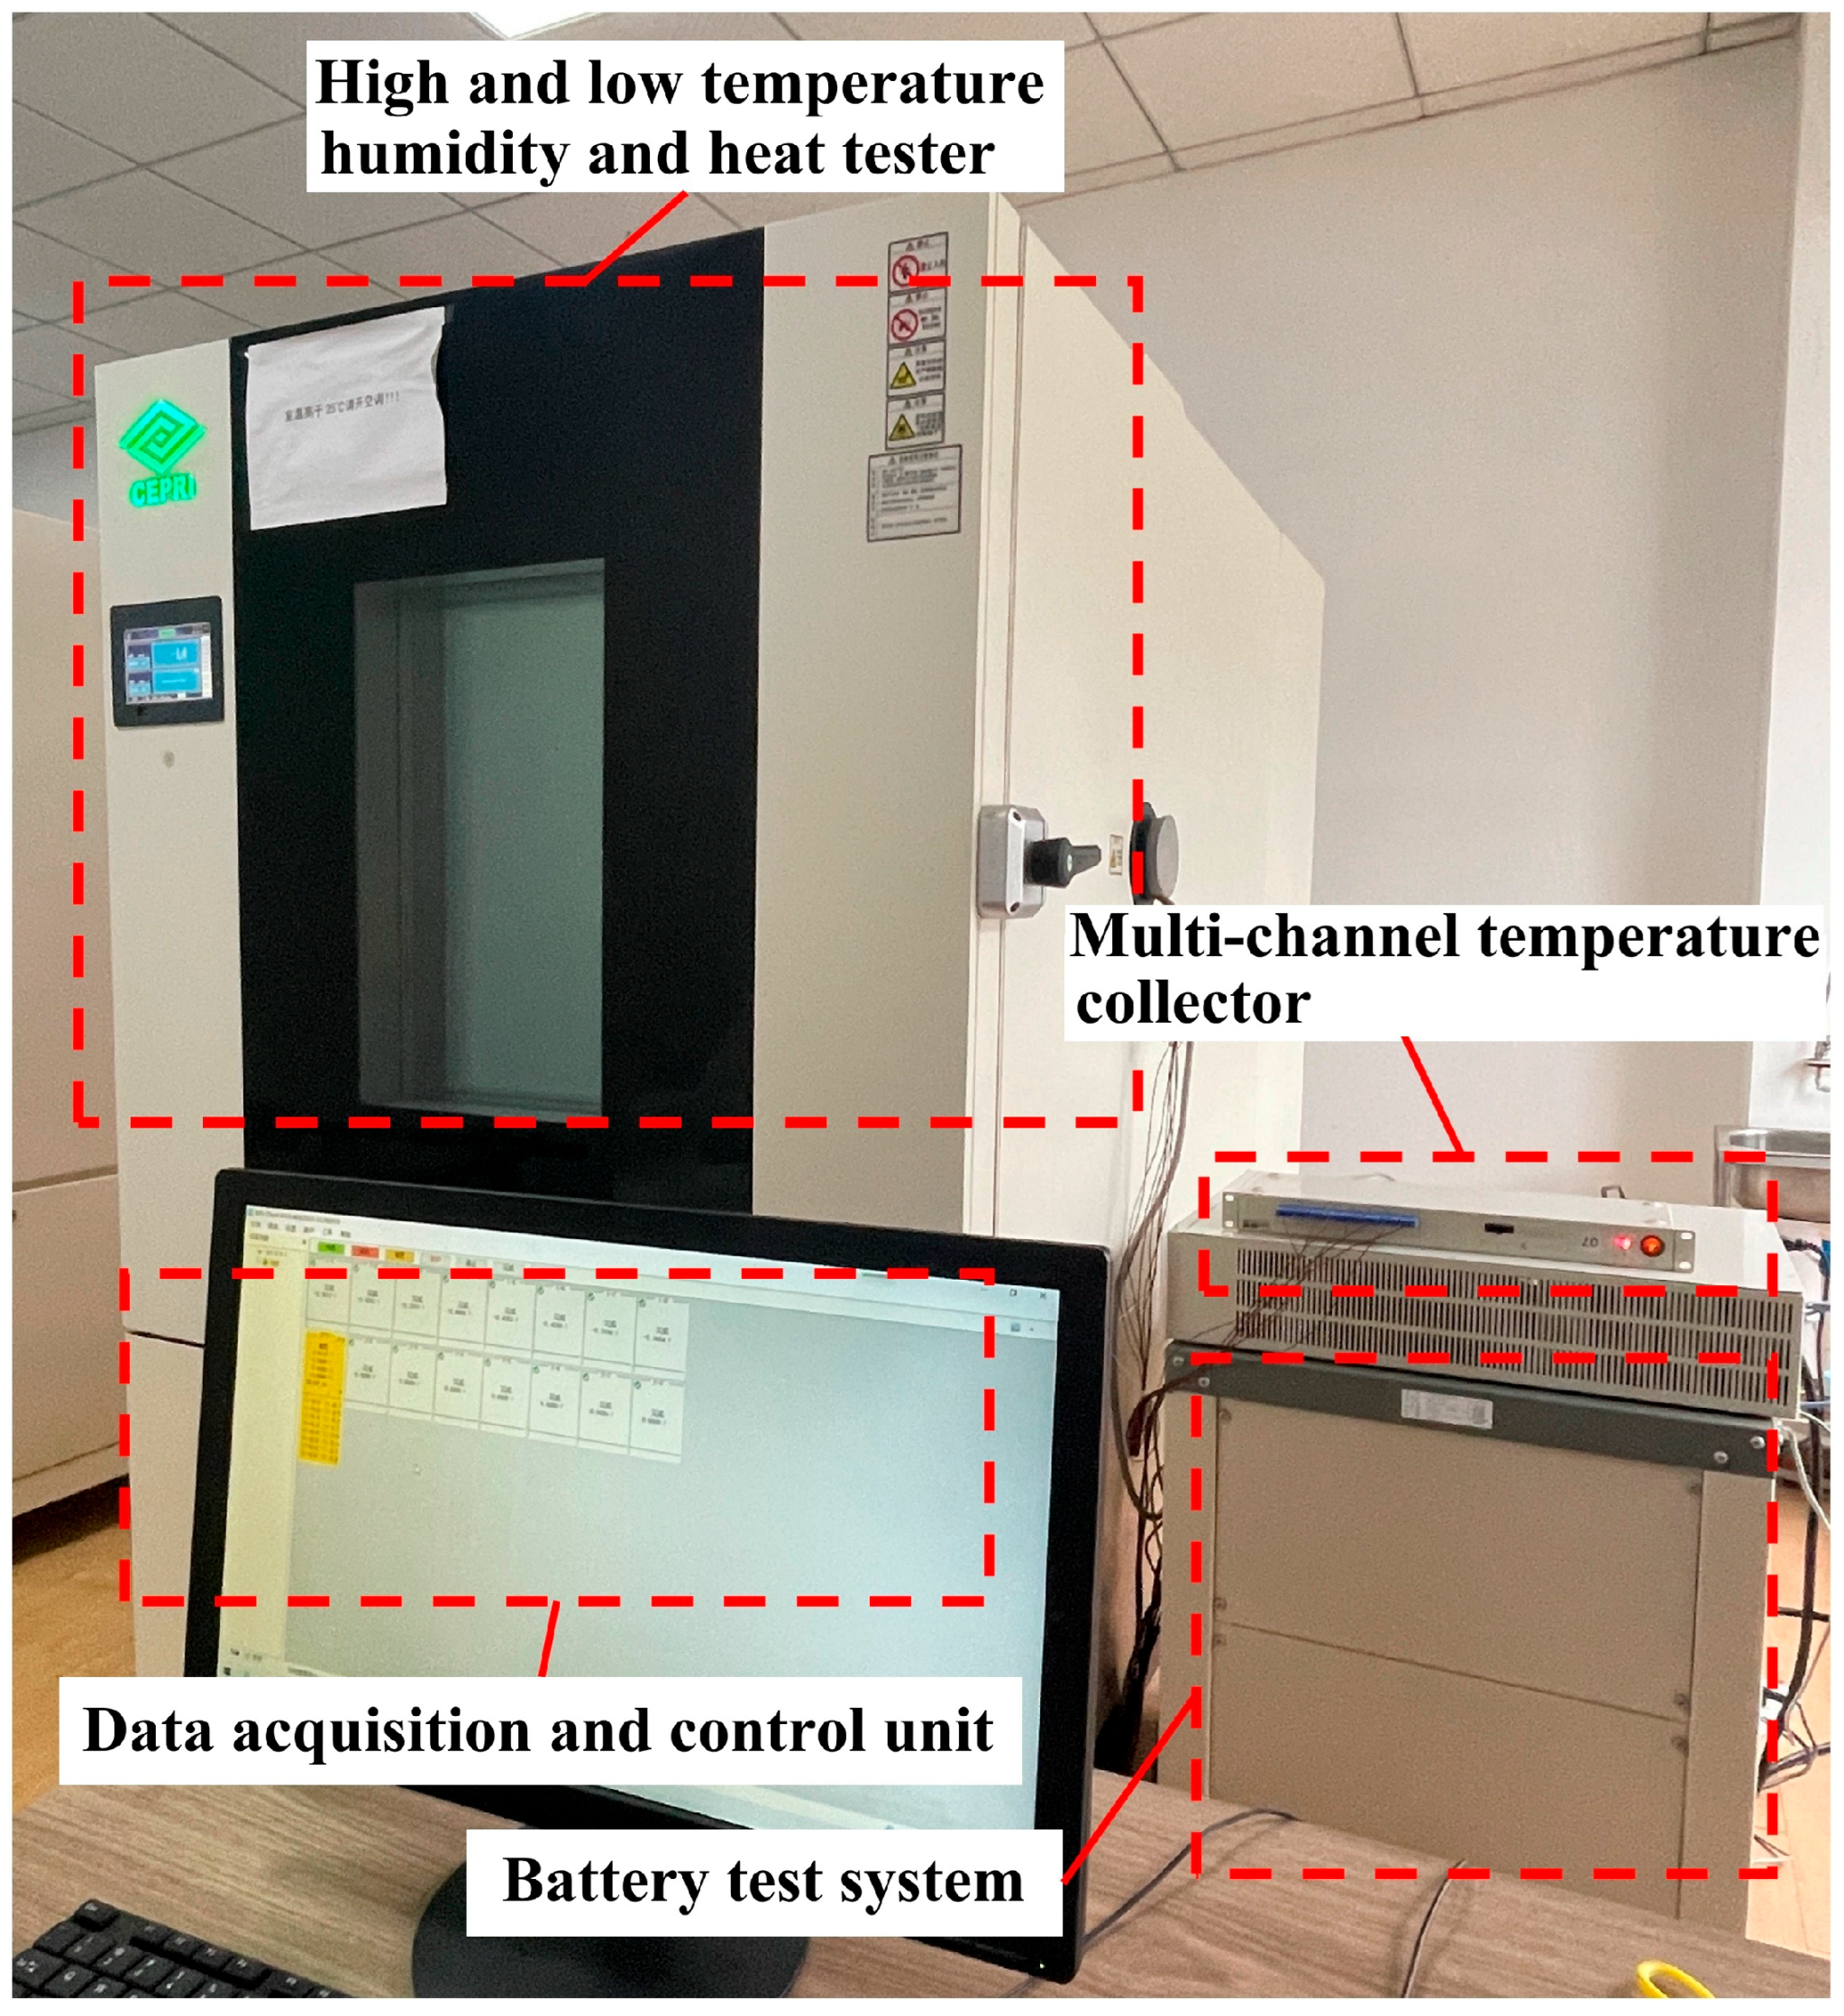
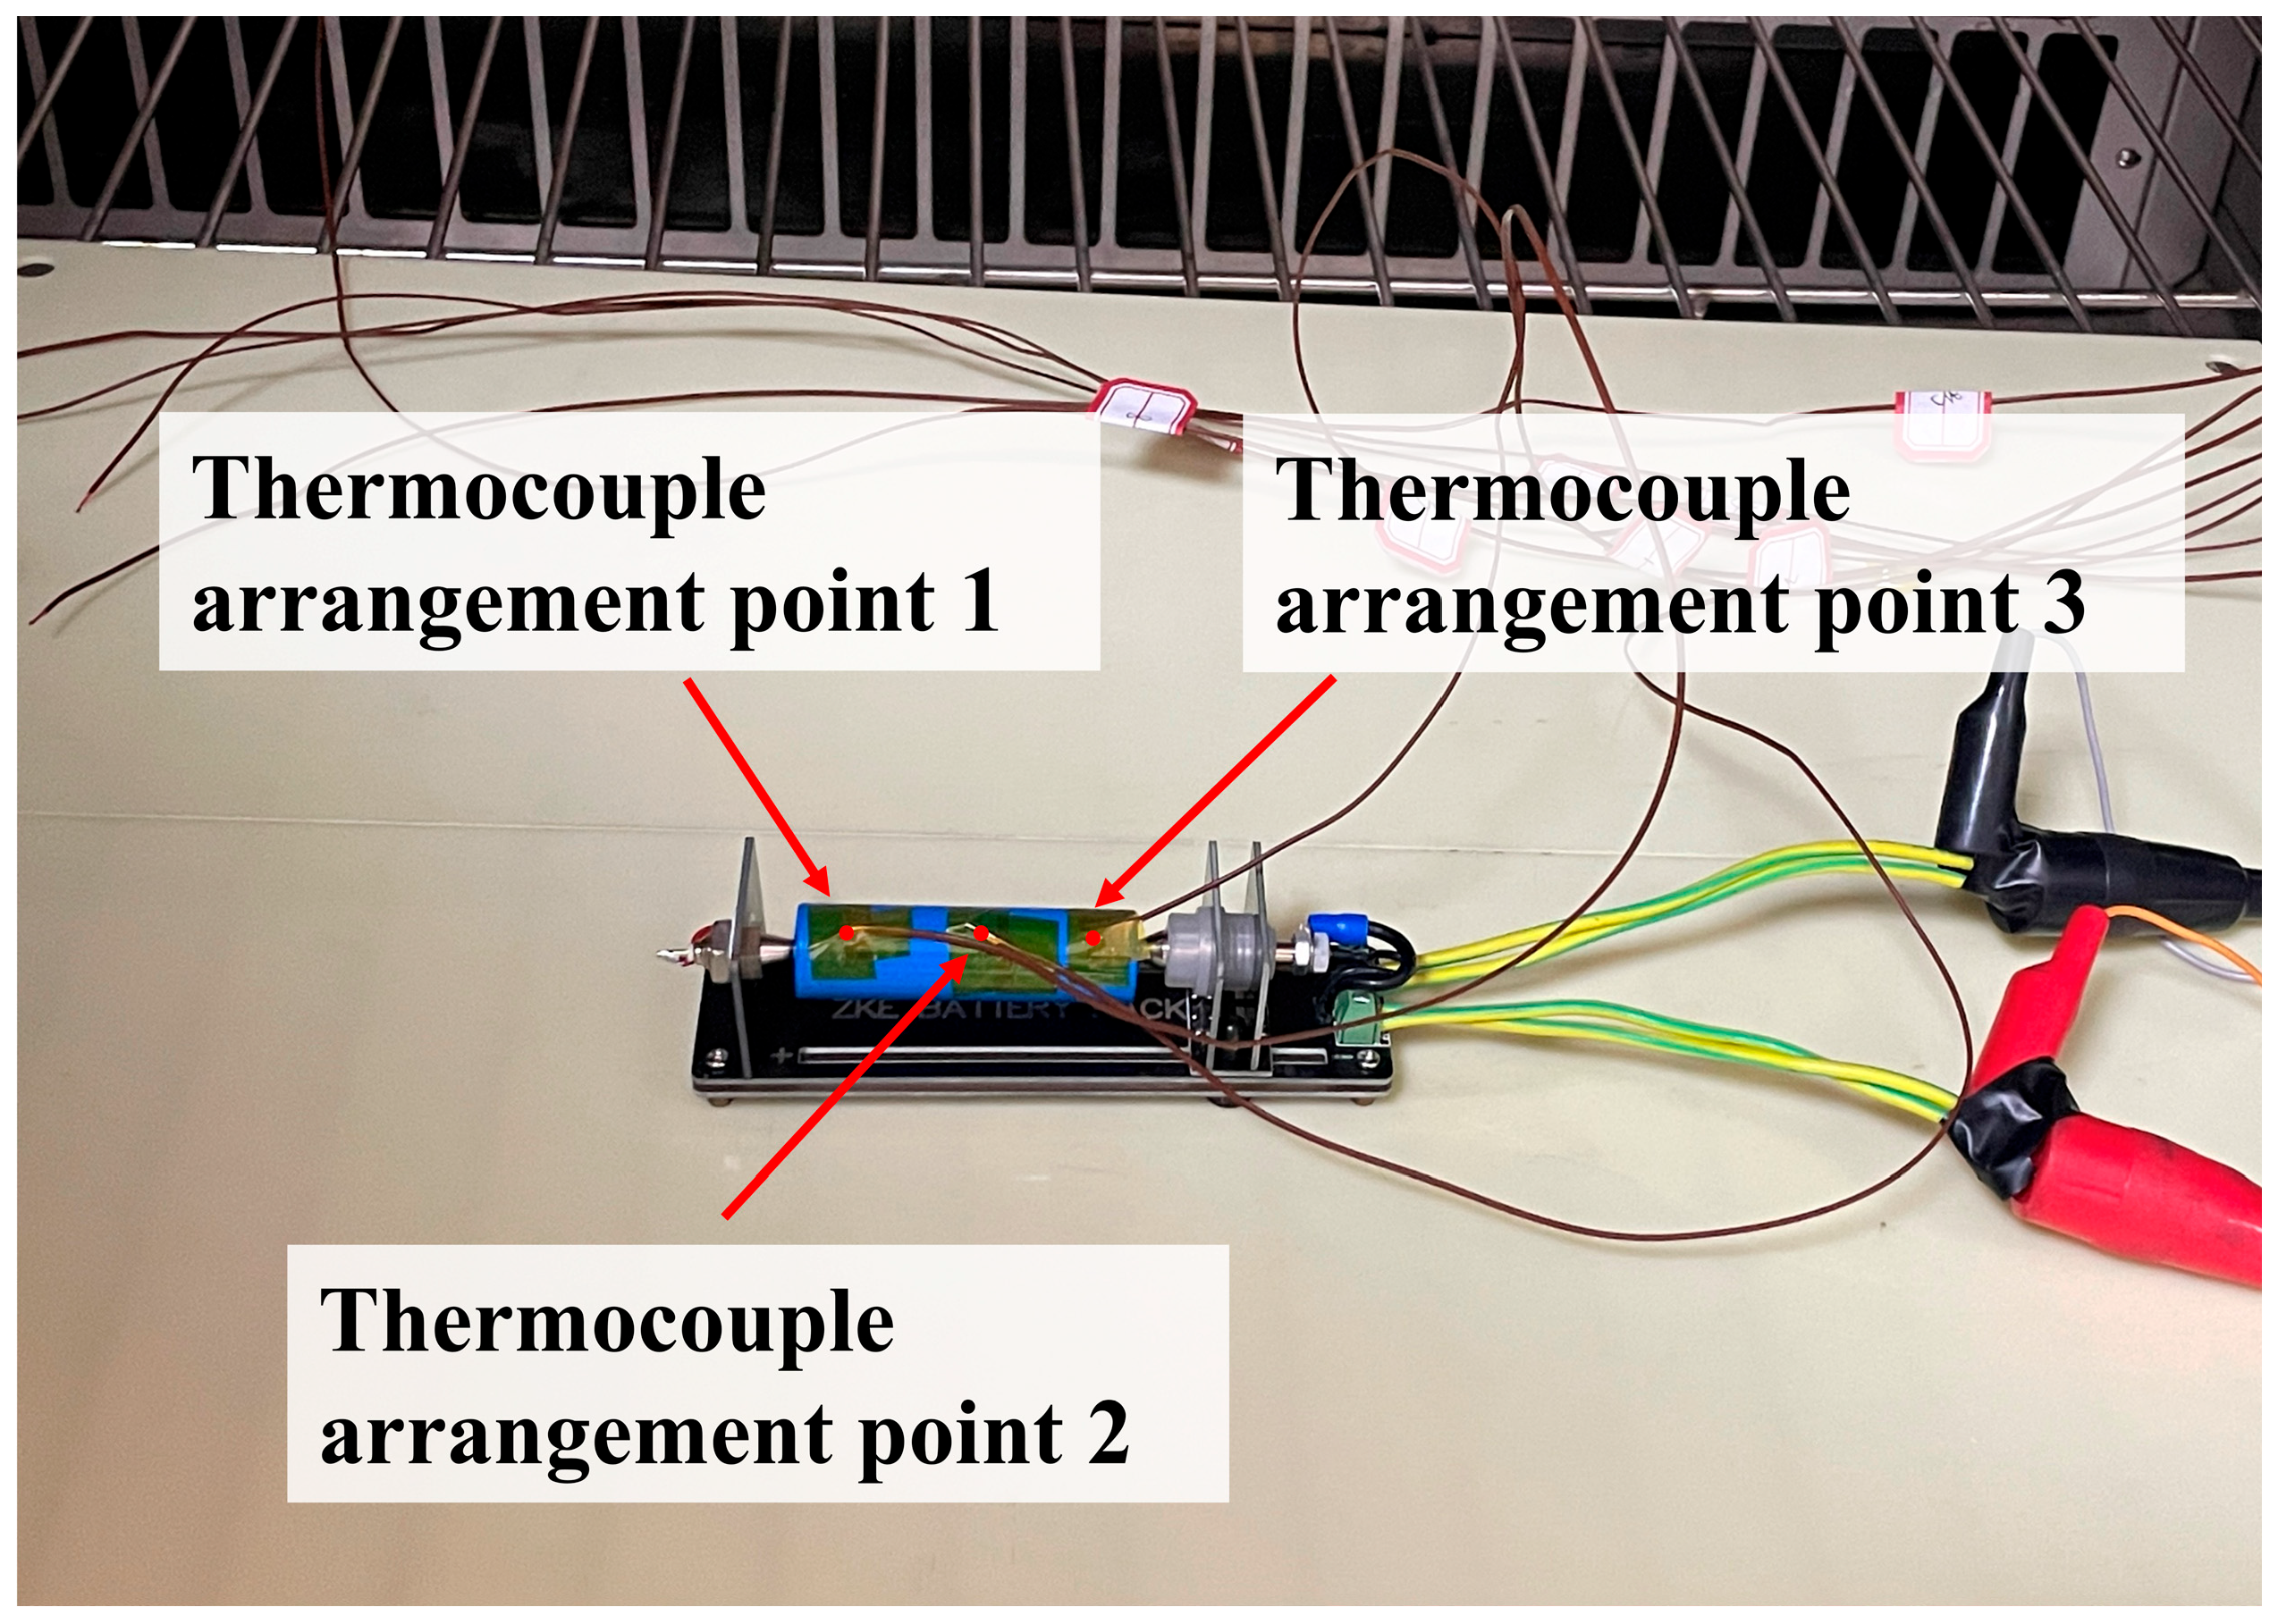
During the operation process, SIB undergoes continuous charging/discharging. Therefore, experimental exploration of the electrical and temperature characteristics during these processes is crucial for guiding thermal management design, validating electrochemical–thermal coupling models, and clarifying the fundamental laws governing internal behavior. A thermostatic charging/discharging test platform was constructed to investigate voltage, temperature rise, internal resistance, and entropy heat coefficient of SIBs under different environmental temperatures and charging/discharging rates, as shown in Figure 3. The main technical parameters of the test equipment are detailed in Table 2. Inside the chamber of the platform, thermocouples were evenly placed on the battery surface to record temperatures during charging and discharging at 0.5 C, 1.0 C, and 2.0 C, as illustrated in Figure 4. The above experiments were conducted repeatedly at chamber temperatures of 0 °C, 10 °C, 25 °C, and 40 °C.

3.1. Charge and Discharge Voltage Characteristics of SIB

3.1.1. Charge Voltage Characteristics of a Single Battery

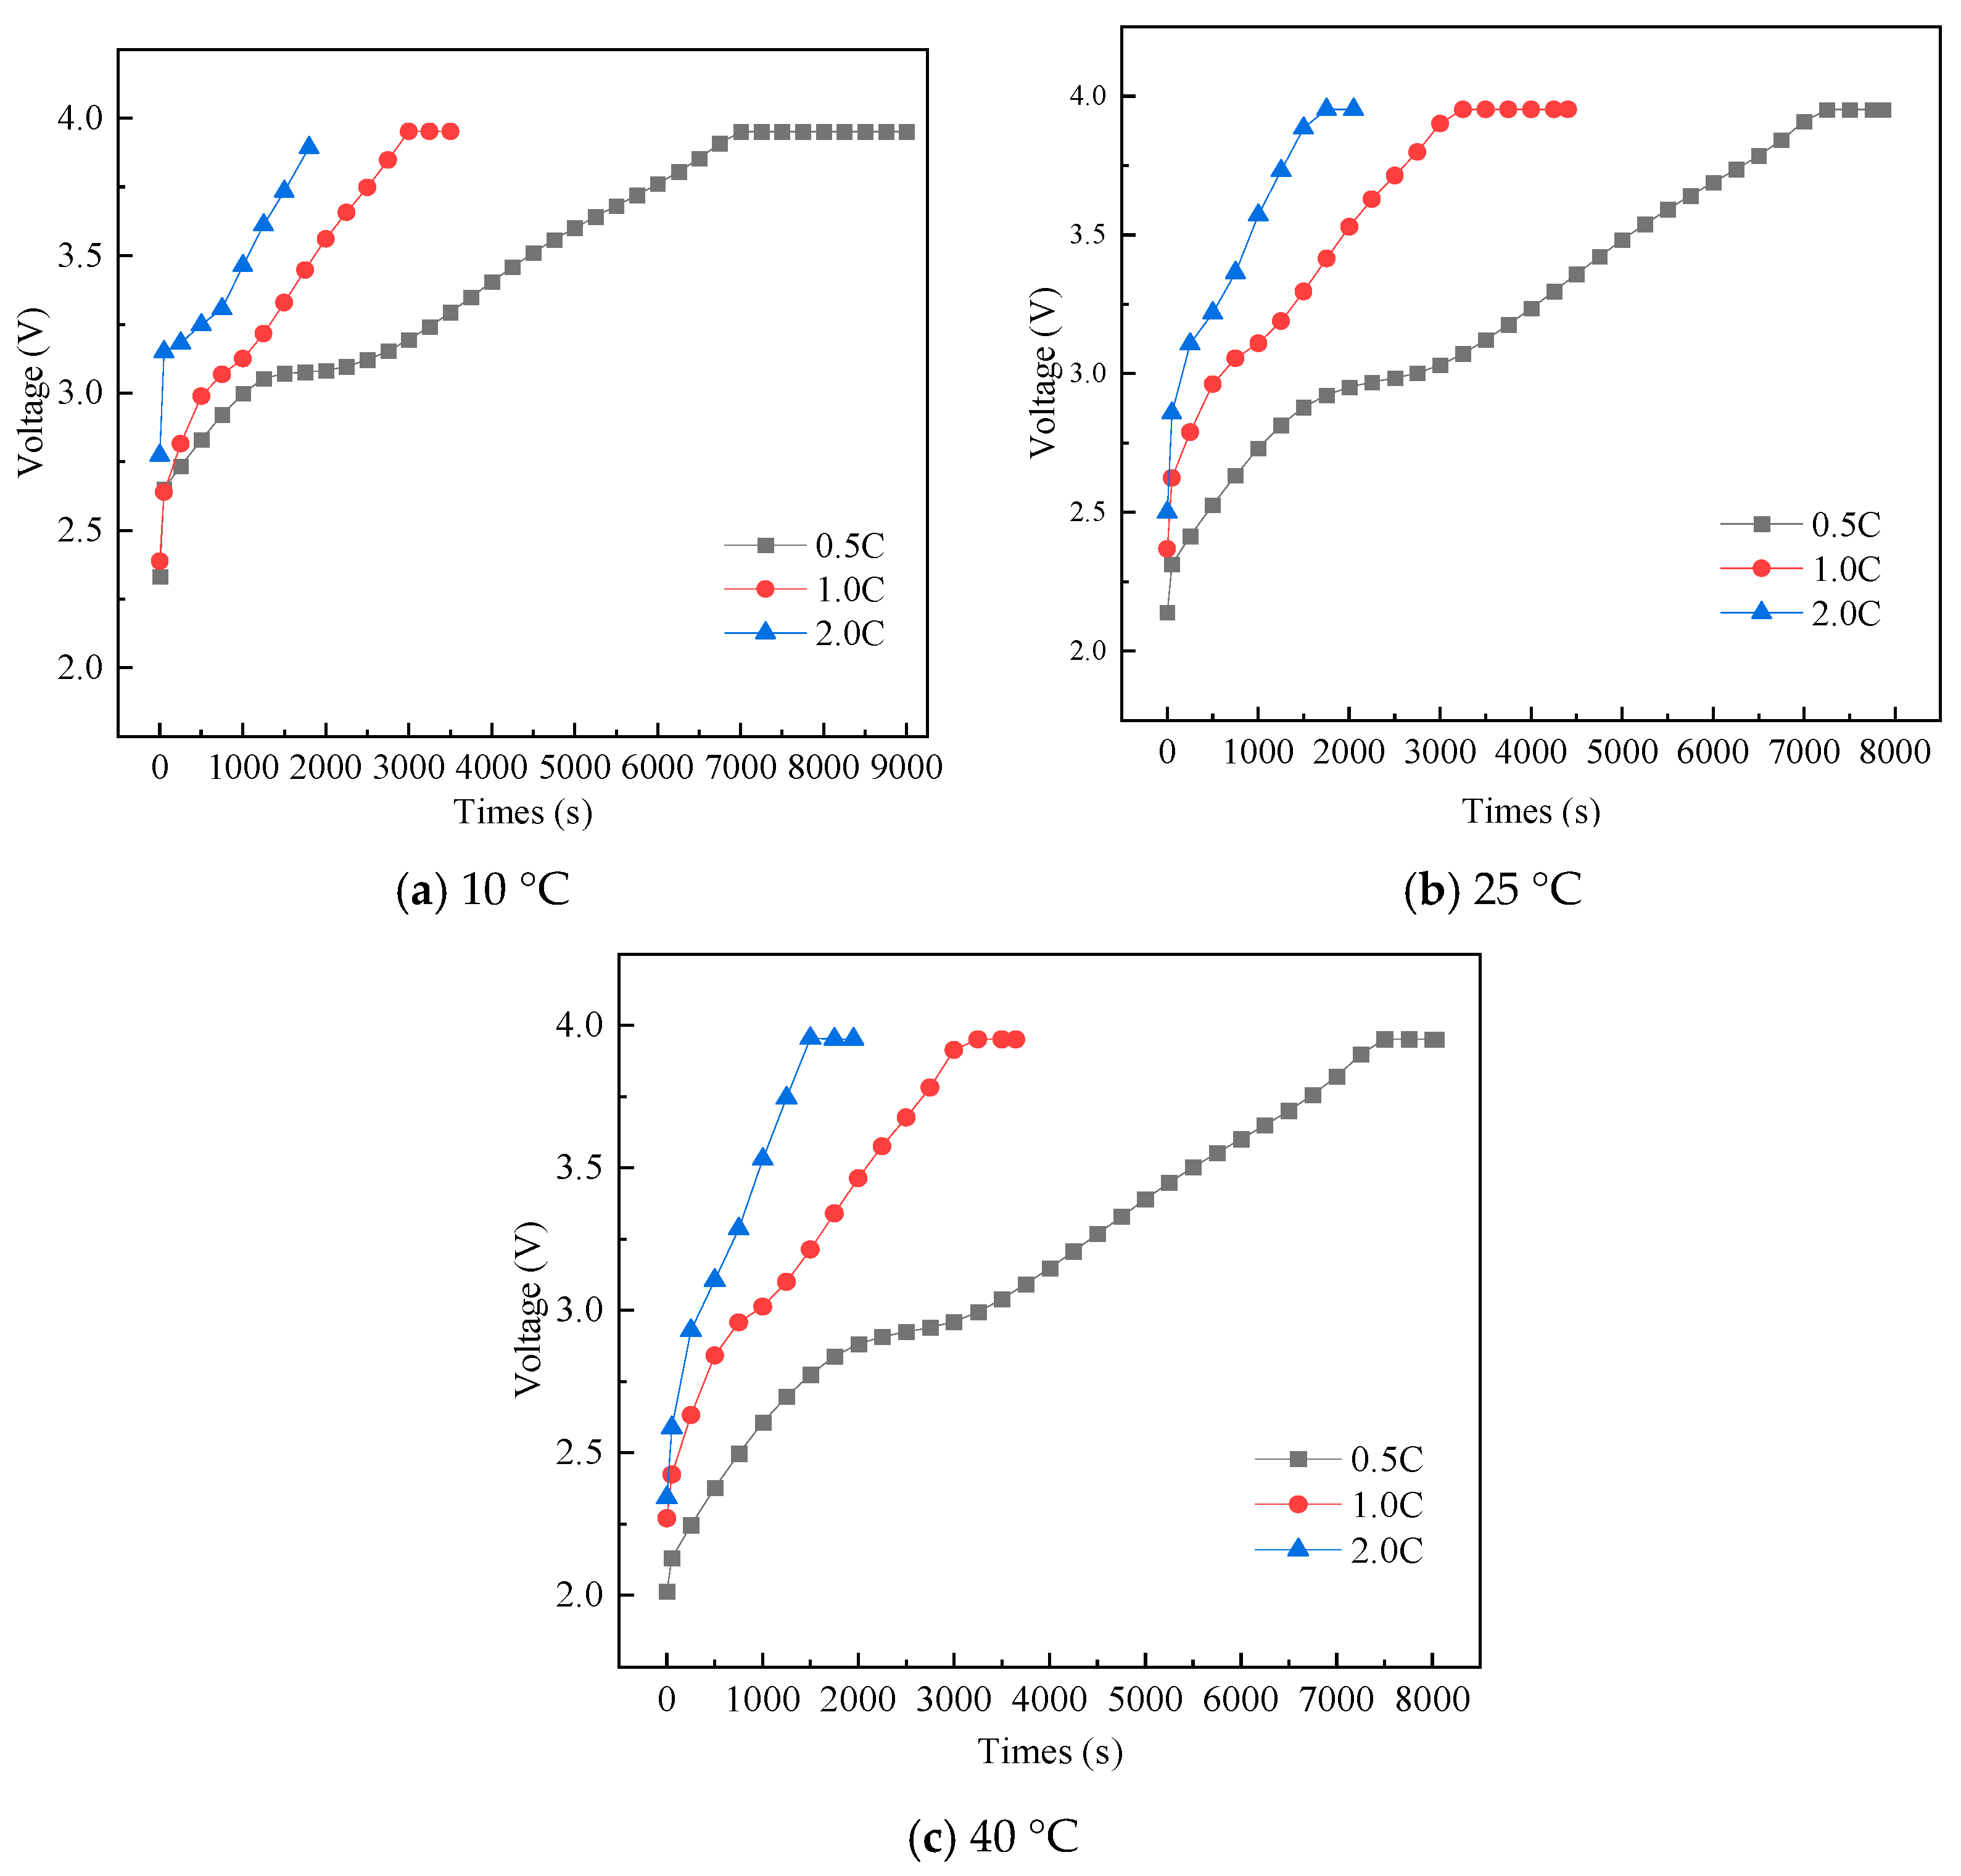
Figure 5 depicts the variation of voltages of 18650-type SIB during constant-current and constant-voltage charging at different temperatures. The experiments were carried out at three charging rates of 0.5 C, 1.0 C, and 2.0 C in a thermostat chamber. During the initial and intermediate stages of charging, the voltage of SIBs at 40 °C was consistently lower than that at 10 °C and 25 °C. Moreover, the batteries charged at 10 °C and 25 °C entered the constant-voltage charging stage earlier than those at 40 °C.
The above results demonstrate that, at the same charging rate, a high environmental temperature, which is associated with a low battery charging voltage, leads to a slow voltage rise rate and thus a longer time to reach the charging voltage plateau. Furthermore, when the battery was charged at a low rate of 0.5 C, the voltage surged to 2.8 V because of the ohmic internal resistance, followed by a gradual increase. Subsequently, the voltage continued to rise rapidly to the charging cut-off voltage of 3.95 V. This phenomenon can be attributed to the approaching saturation of sodium ions embedded in the anode, which induces a significant polarization effect. Finally, the battery was subjected to constant-voltage charging, causing the charging current to decrease to the cut-off current of 0.0325 A. As the charging rate increased, the voltage rise rate accelerated, and the charging voltage plateau rose, giving rise to a more rapid attainment of the charging cut-off voltage. The underlying mechanism is that despite an increased intercalation/deintercalation rate of sodium ions, the limited sodium-ion transport rate restricts the system. This limitation intensifies the imbalance of the electrochemical reaction rate in the electrode, leading to intensified electrochemical and concentration polarization.

3.1.2. Discharge Voltage Characteristics of a Single Battery

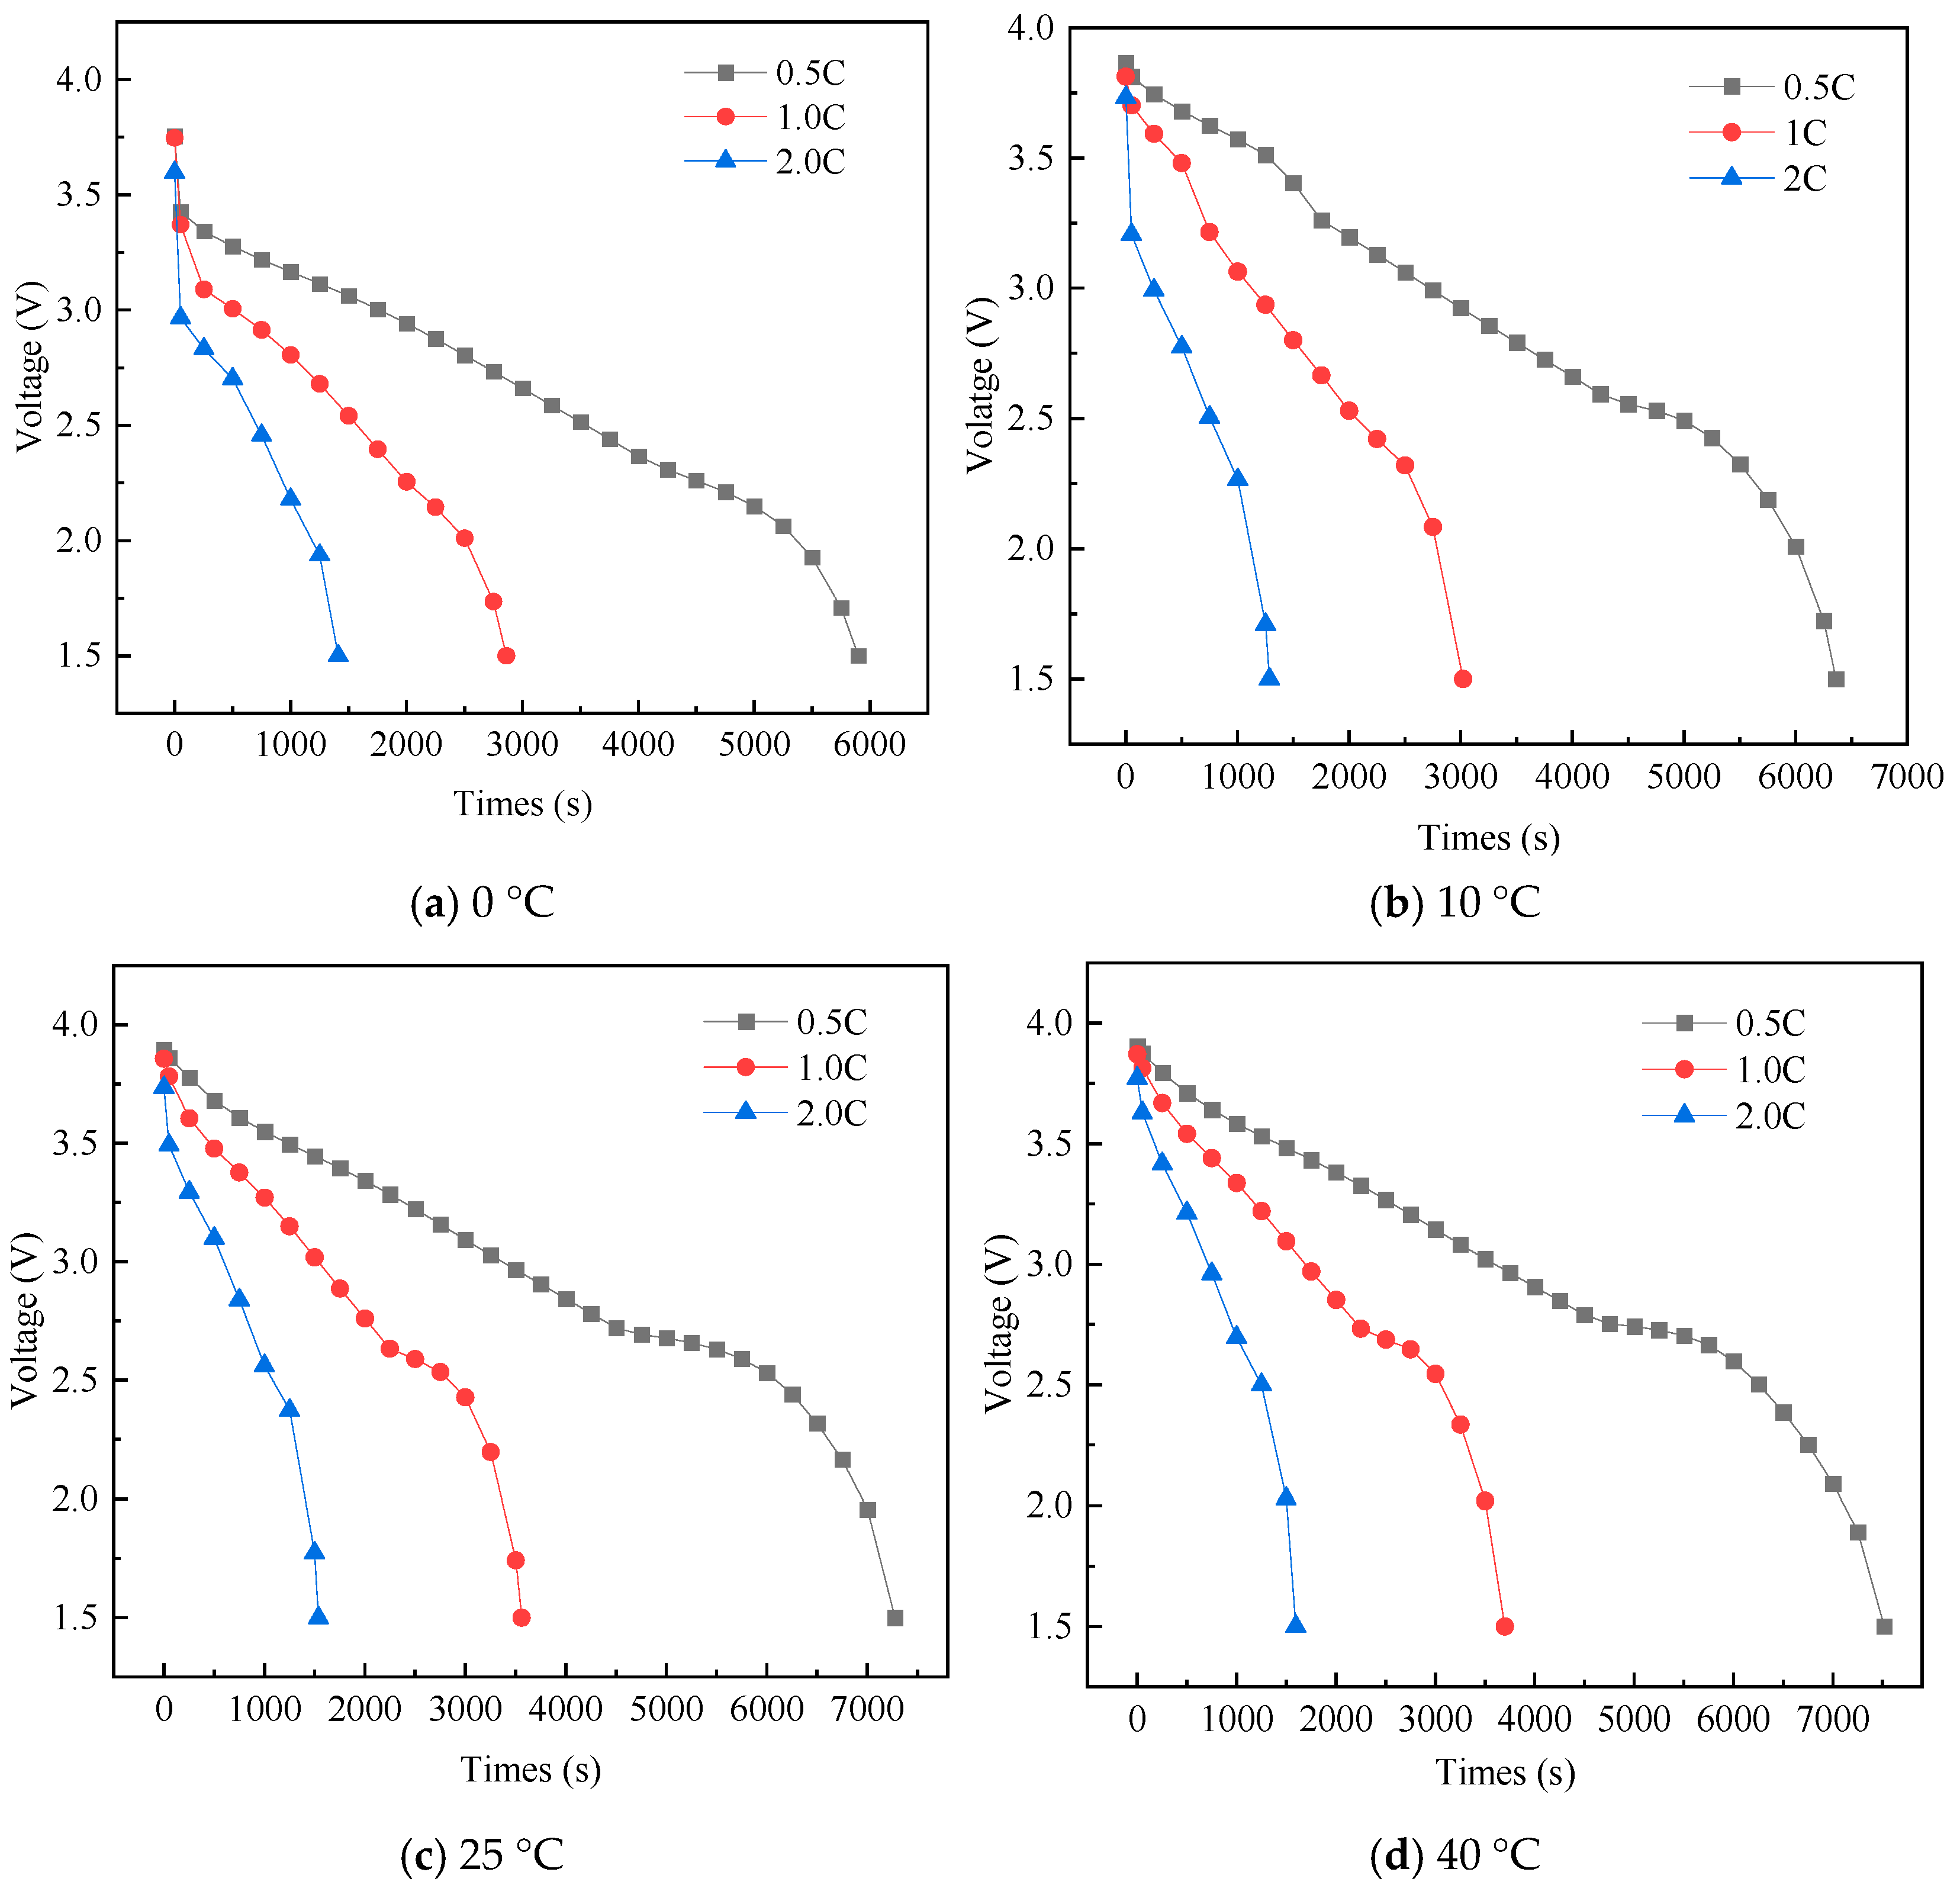
Figure 6 illustrates the variation of the battery operating voltages with temperature at three discharge rates of 0.5 C, 1.0 C, and 2.0 C. Across the environmental temperatures tested, the voltage trend exhibited similar behavior, characterized by two distinct phases: a slow voltage drop phase followed by a sudden voltage drop phase.
During the pre-discharge period, a constant-current discharge led to a rapid voltage decline. In the late discharge period, the voltage decreased drastically under constant current and quickly reached the cut-off voltage of 1.5 V. At a given rate, the discharge voltage at 0 °C was significantly lower than at the other temperatures, displaying the fastest discharge process among the tests. This is because, at the same discharge rate, the lower the environmental temperature, the higher the viscosity of the electrolyte inside the battery. This prompts the deterioration of the movement ability of sodium ions and thus the discharge efficiency of the battery. Moreover, at a given environmental temperature, discharging at a low rate of 0.5 C caused the battery voltage to decrease to approximately 2.5 V within 5000 s, followed by a subsequent sharp drop to the cut-off voltage (1.5 V). Notably, with the increase in the discharge rate, the high discharge current led to an increase in the voltage drop caused by the ohmic internal resistance, and the voltage decreased almost linearly. This finding reveals that the intercalated/deintercalated rate of sodium ions rises as the discharge rate increases. Consequently, the battery voltage deviates significantly from equilibrium, leading to a rapid decline in the voltage curve.

3.2. Temperature Rise Characteristics of SIB

3.2.1. Charging Temperature Rise Characteristics of a Single Battery

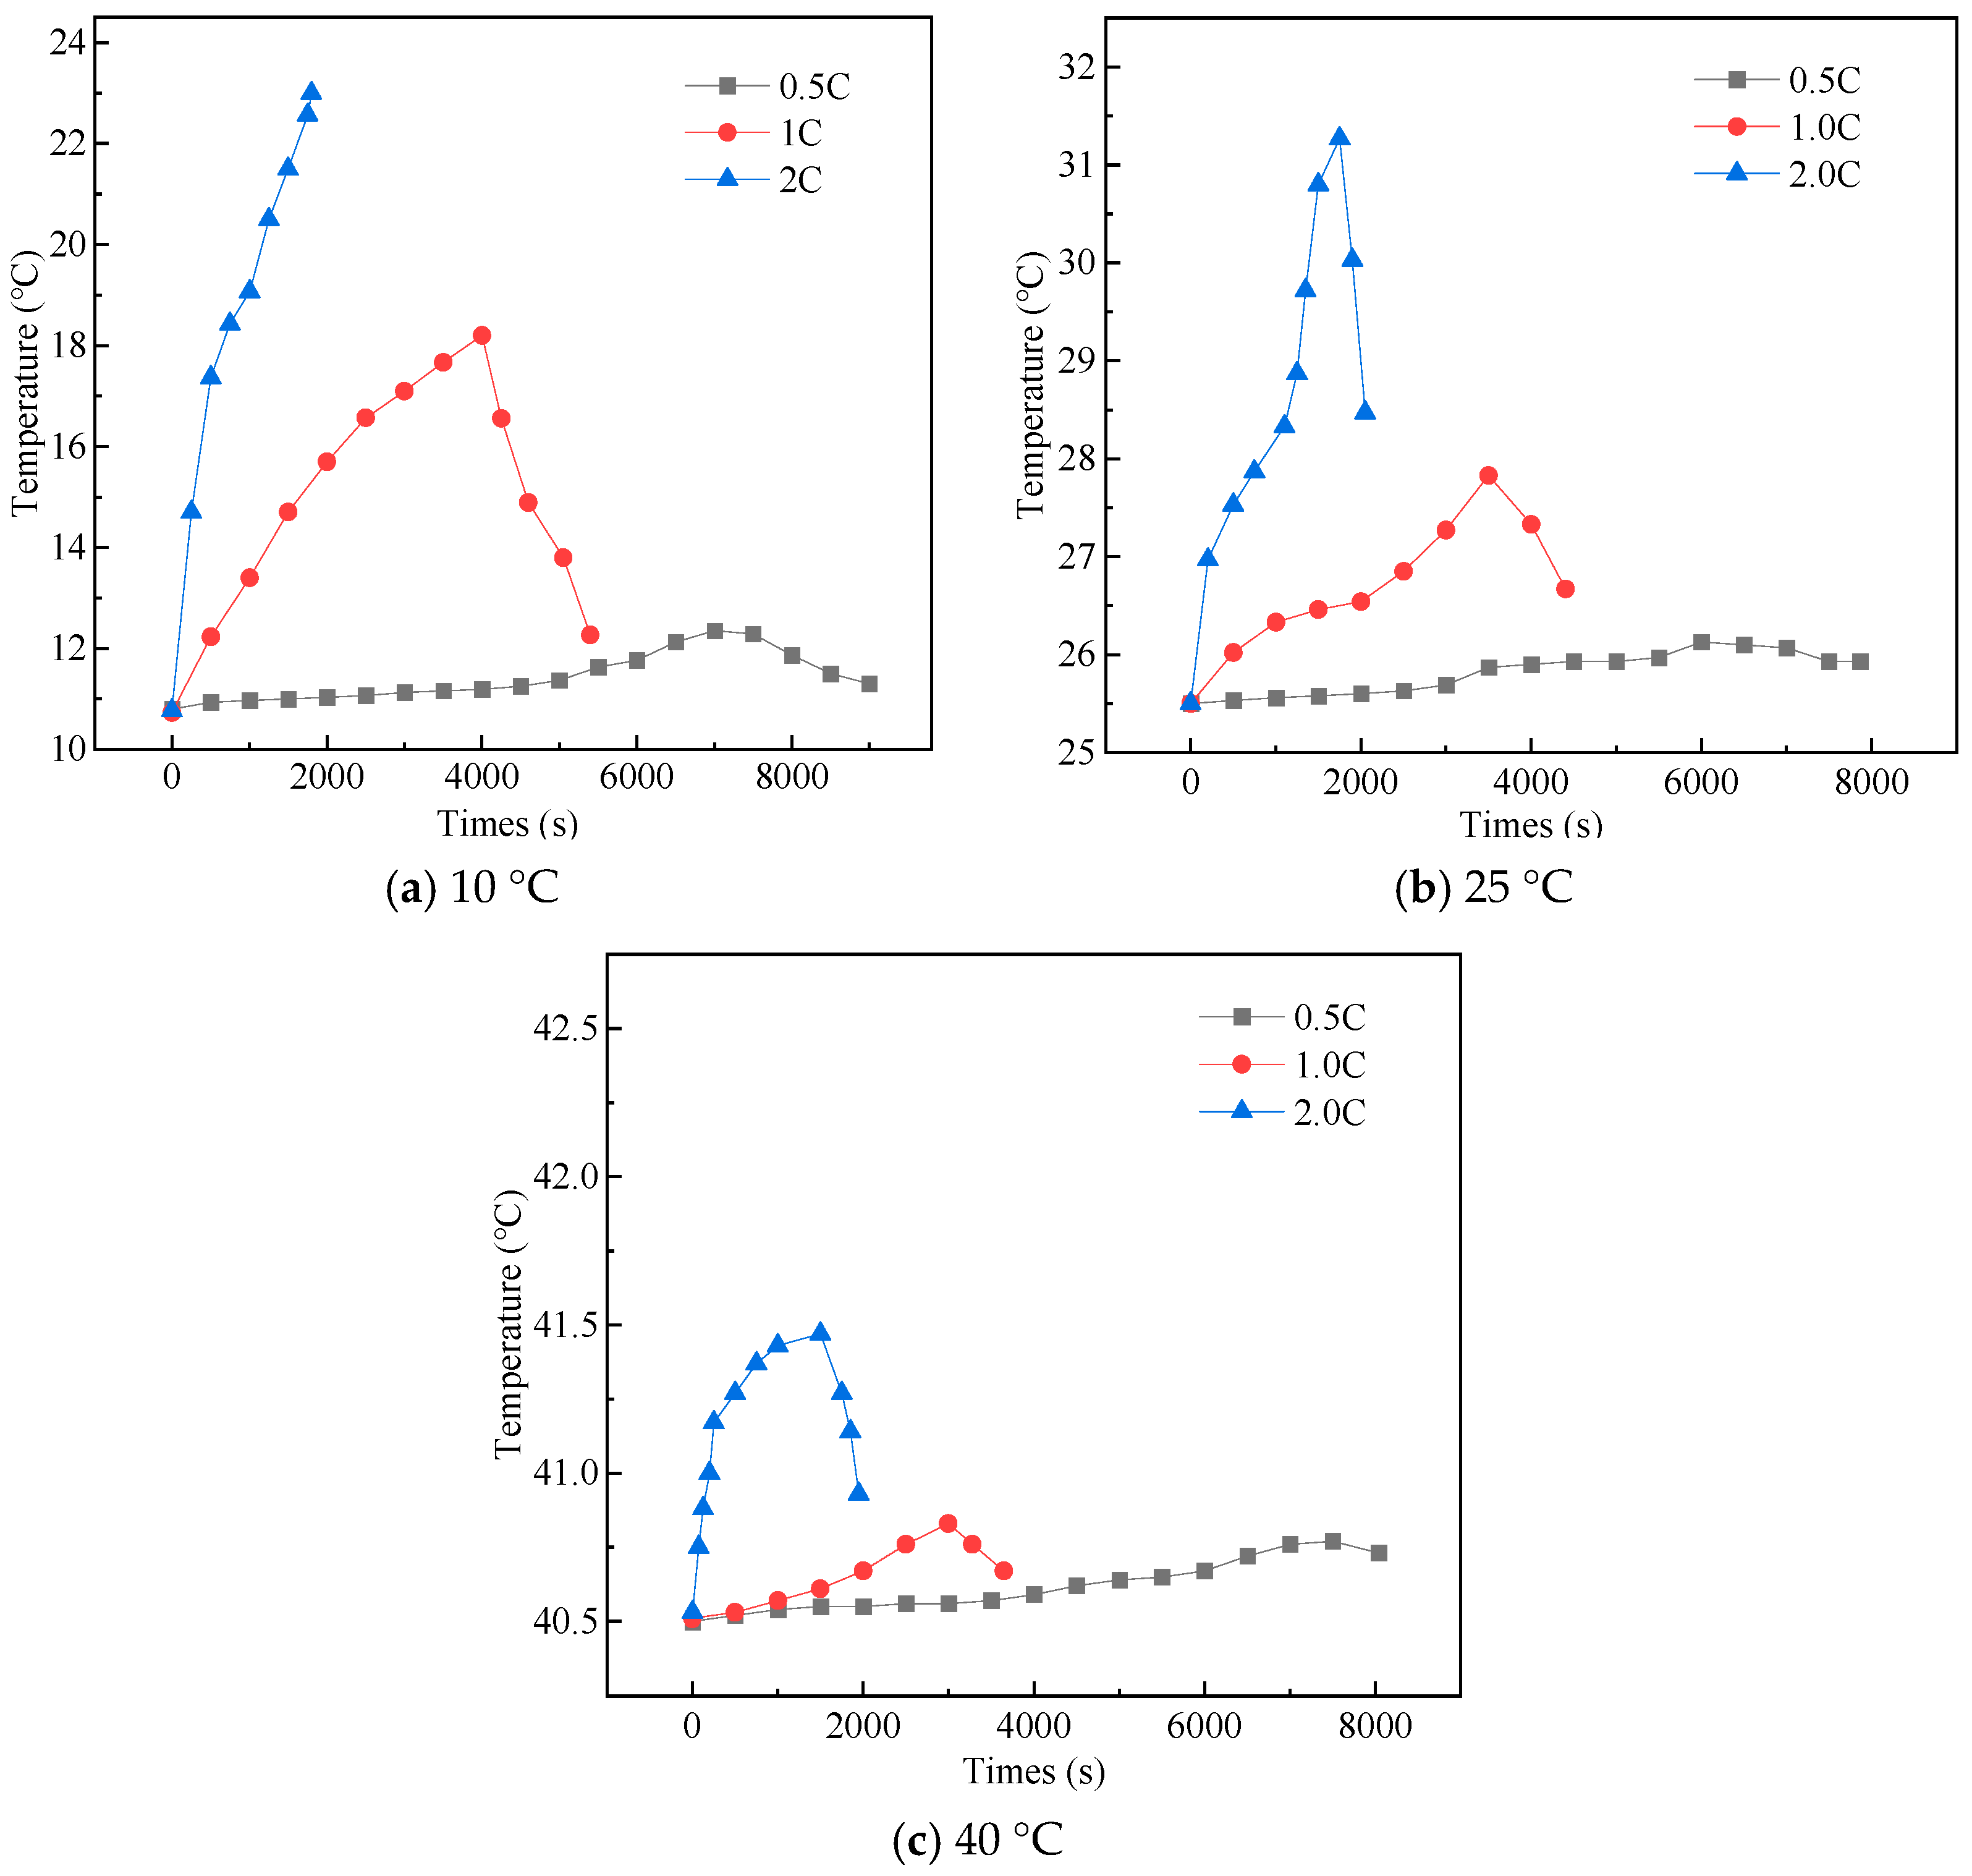
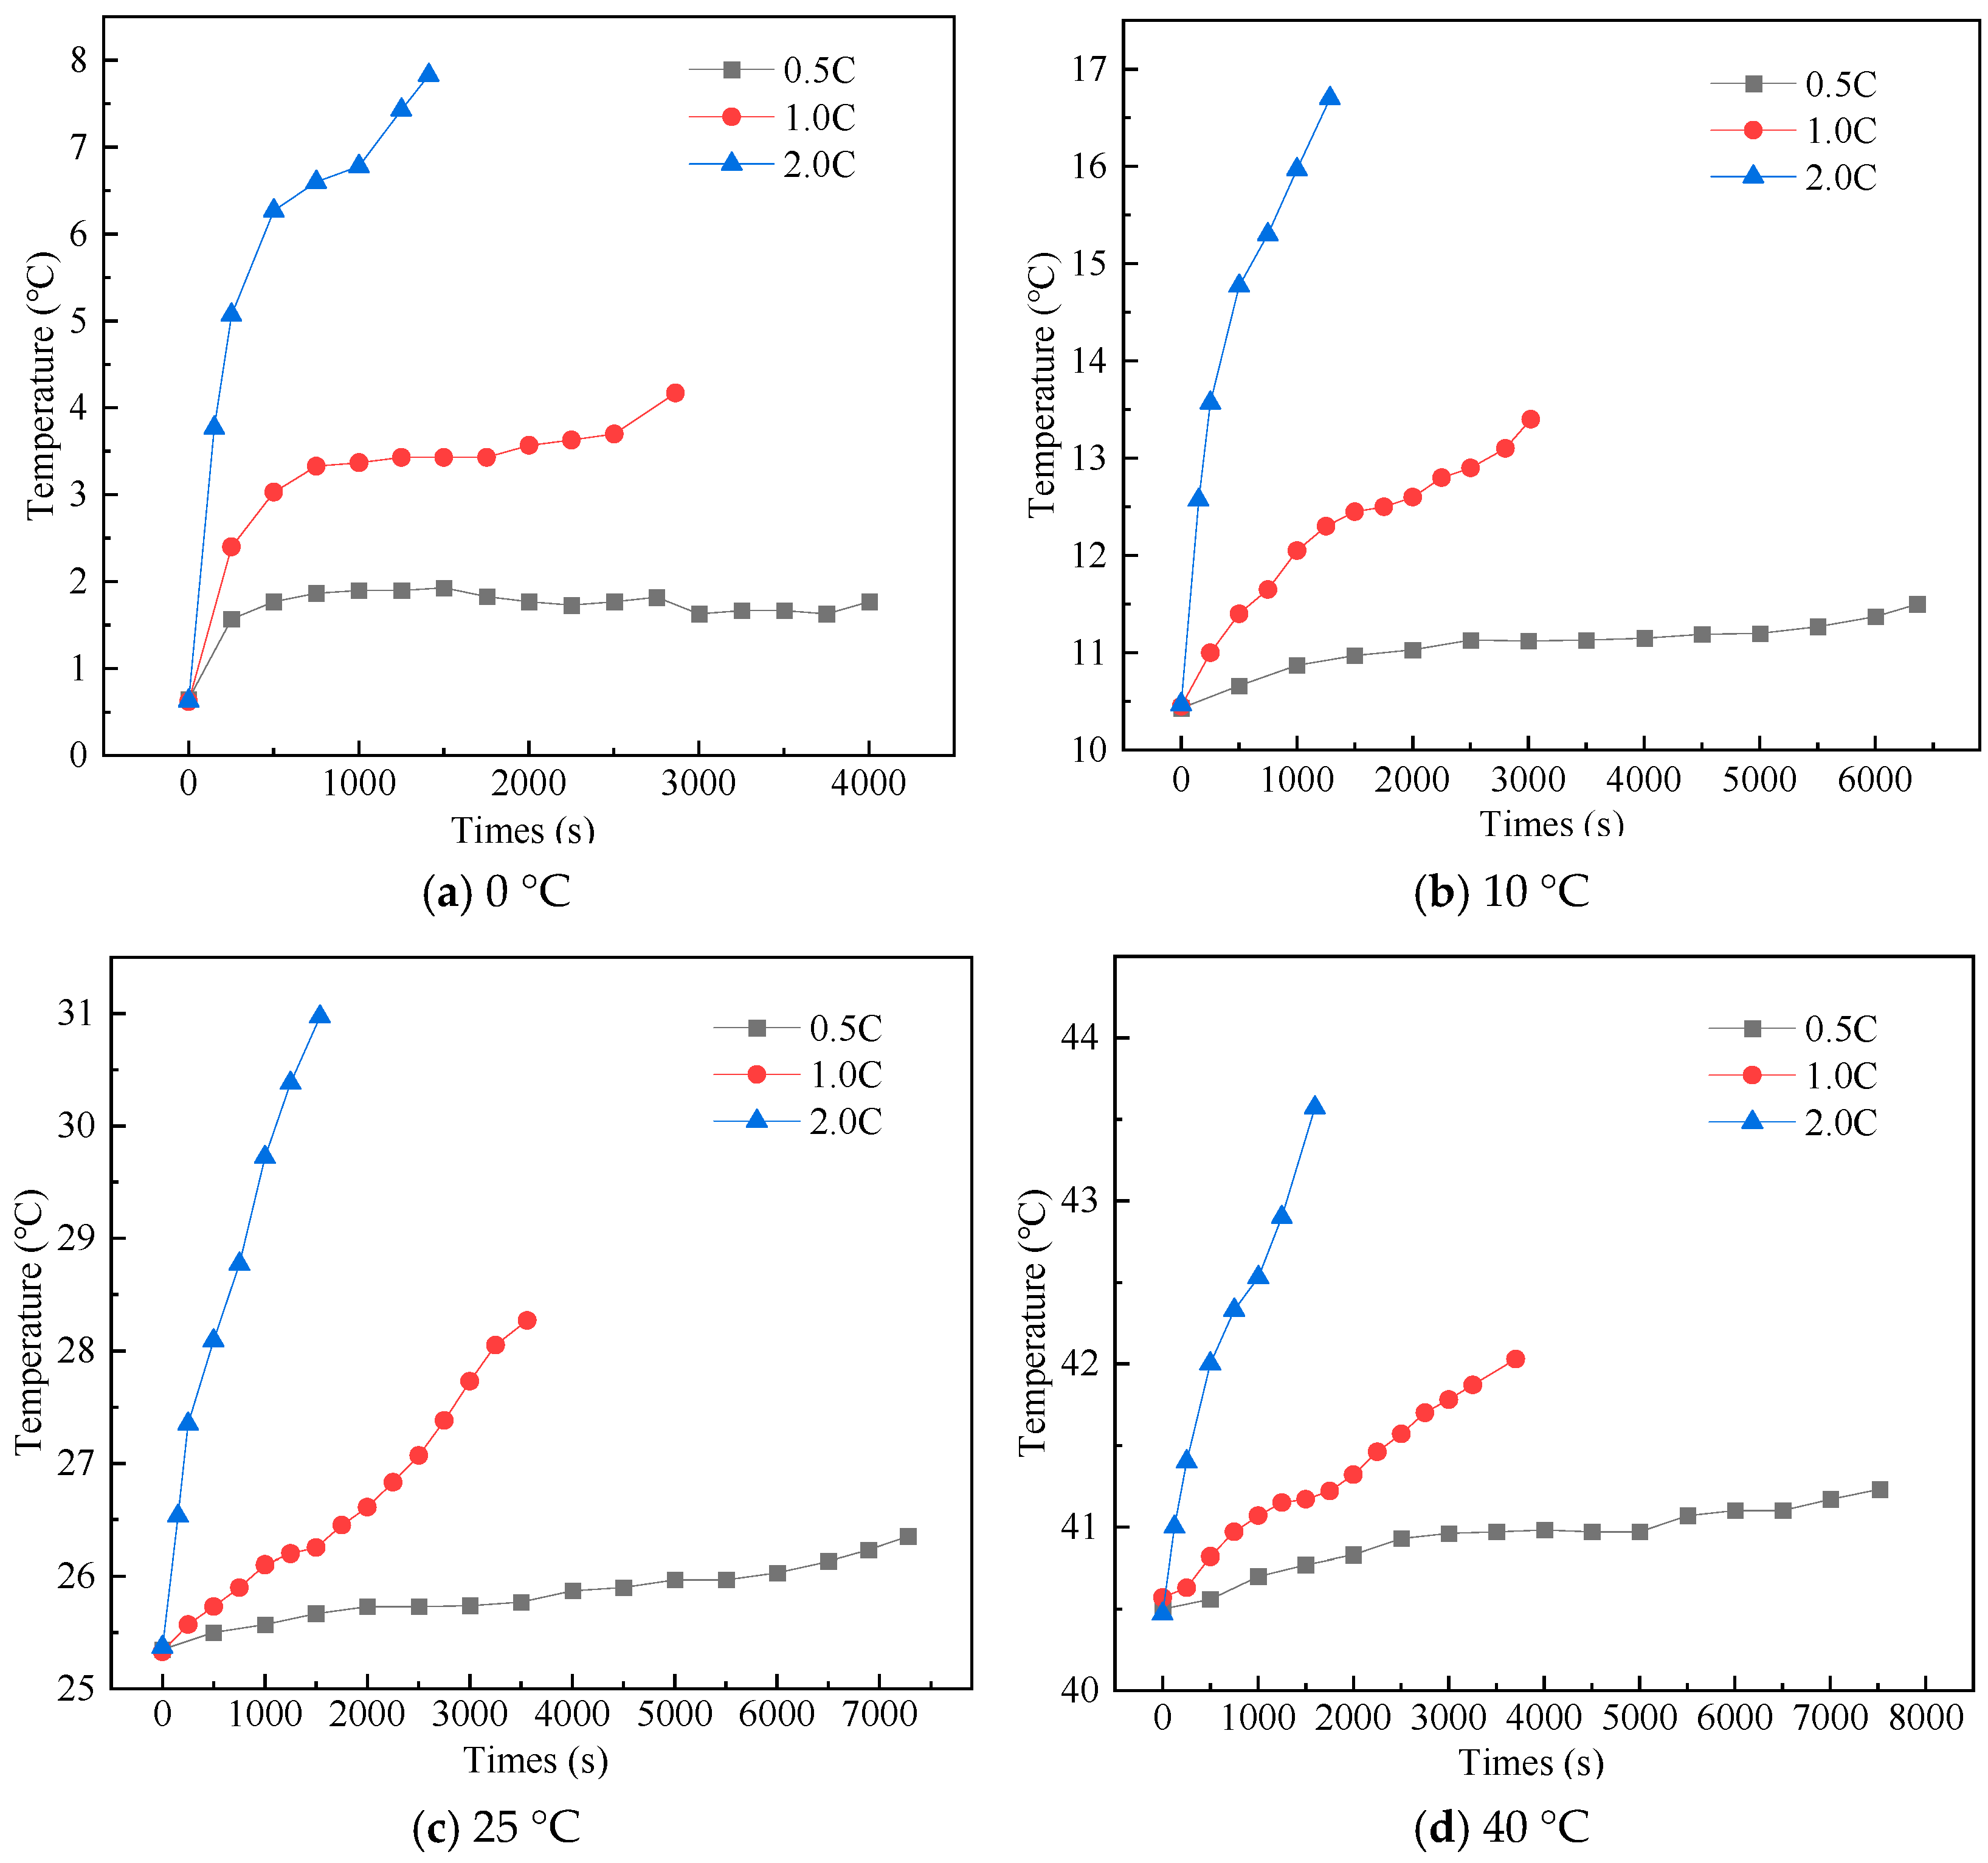
Figure 7 depicts the variation in average battery surface temperature with charging time at different temperatures, using three charging rates of 0.5 C, 1.0 C, and 2.0 C. As the charging process progressed, the battery temperature increased first and then decreased. During the pre-charging period, the internal electrochemical reaction of the battery was intense, leading to a sharp increase in internal heat generation and a rapid temperature rise. In contrast, in the late-charging stage, the battery switched from the constant-current model to the constant-voltage model, with the current gradually decreasing. This brought about a decrease in internal heat generation and thus a decrease in the battery temperature. Notably, at each environmental temperature, the maximum temperature rise of the battery increased with the charging rate. These results indicate that, at a given environmental temperature, increasing the charging rate leads to elevated electrochemical and concentration-differential polarization heat generation. This, in turn, increases both the rate of battery temperature change and the maximum temperature attained. Furthermore, at a given charging rate, lower environmental temperatures are responsible for a higher rate of heat generation in SIBs and a greater temperature rise. Low-temperature charging conditions also increase the susceptibility of the negative electrode to sodium deposition and dendrite formation, potentially causing internal short circuits.

3.2.2. Discharging Temperature Rise Characteristics of the Single Battery

Figure 8 depicts the variation in the average temperature on the battery surface over the discharging time at different temperatures, with three discharge rates of 0.5 C, 1.0 C, and 2.0 C. It can be noted that the temperature curves under different environmental temperatures are similar, and all of them increase as the discharging time elapsed. At a fixed discharge rate, raising the environmental temperature enhances ionic conductivity and electrode reaction rates, resulting in a reduction in the battery’s internal resistance. However, high temperatures do not necessarily decrease heat generation; instead, they typically result in a rapid increase in the battery temperature and a high overall operating temperature. Significantly, the smallest variation in the average surface temperature was observed at a low discharge rate of 0.5 C. A high discharge rate implies a substantial increase in the discharge current, triggering a high rate of internal heat generation and a corresponding sharp rise in the battery temperature. At 2.0 C, irreversible heat becomes a significant component of the total heat generated, which diminishes the endothermic effect of reversible reactions, resulting in an almost linear increase in the battery temperature. These results reveal that the internal polarization effect within the battery highly depends on the discharging rate at a specific temperature.
The intensification of polarization is associated with augmented irreversible heat generation, accounting for a correspondingly accelerated rate of temperature rise. This is mainly responsible for the growing disparity between surface temperatures of individual batteries and the temperature variations among cells within the battery pack. Meanwhile, a high battery temperature not only triggers side reactions such as the decomposition of the solid electrolyte interphase film at the anode but also induces thermal runaway in severe cases. Therefore, effective thermal management solutions are essential to cool the battery. As illustrated in Figure 7 and Figure 8, when the environmental temperature is below 25 °C, the charging process exhibits a more pronounced temperature rise compared to the discharging process. Conversely, when the environmental temperature exceeds 25 °C, the temperature rise in the battery during the discharging process is higher than that during the charging process. This is because low temperatures reduce the ionic conductivity and ion diffusion, thereby increasing the internal resistance of SIBs. This heightened resistance during charging requires more energy for sodium-ion deintercalation, leading to enhanced heat generation.

3.3. Internal Resistance and Entropic Thermal Coefficient of SIB

3.3.1. Internal Resistance During Charging and Discharging

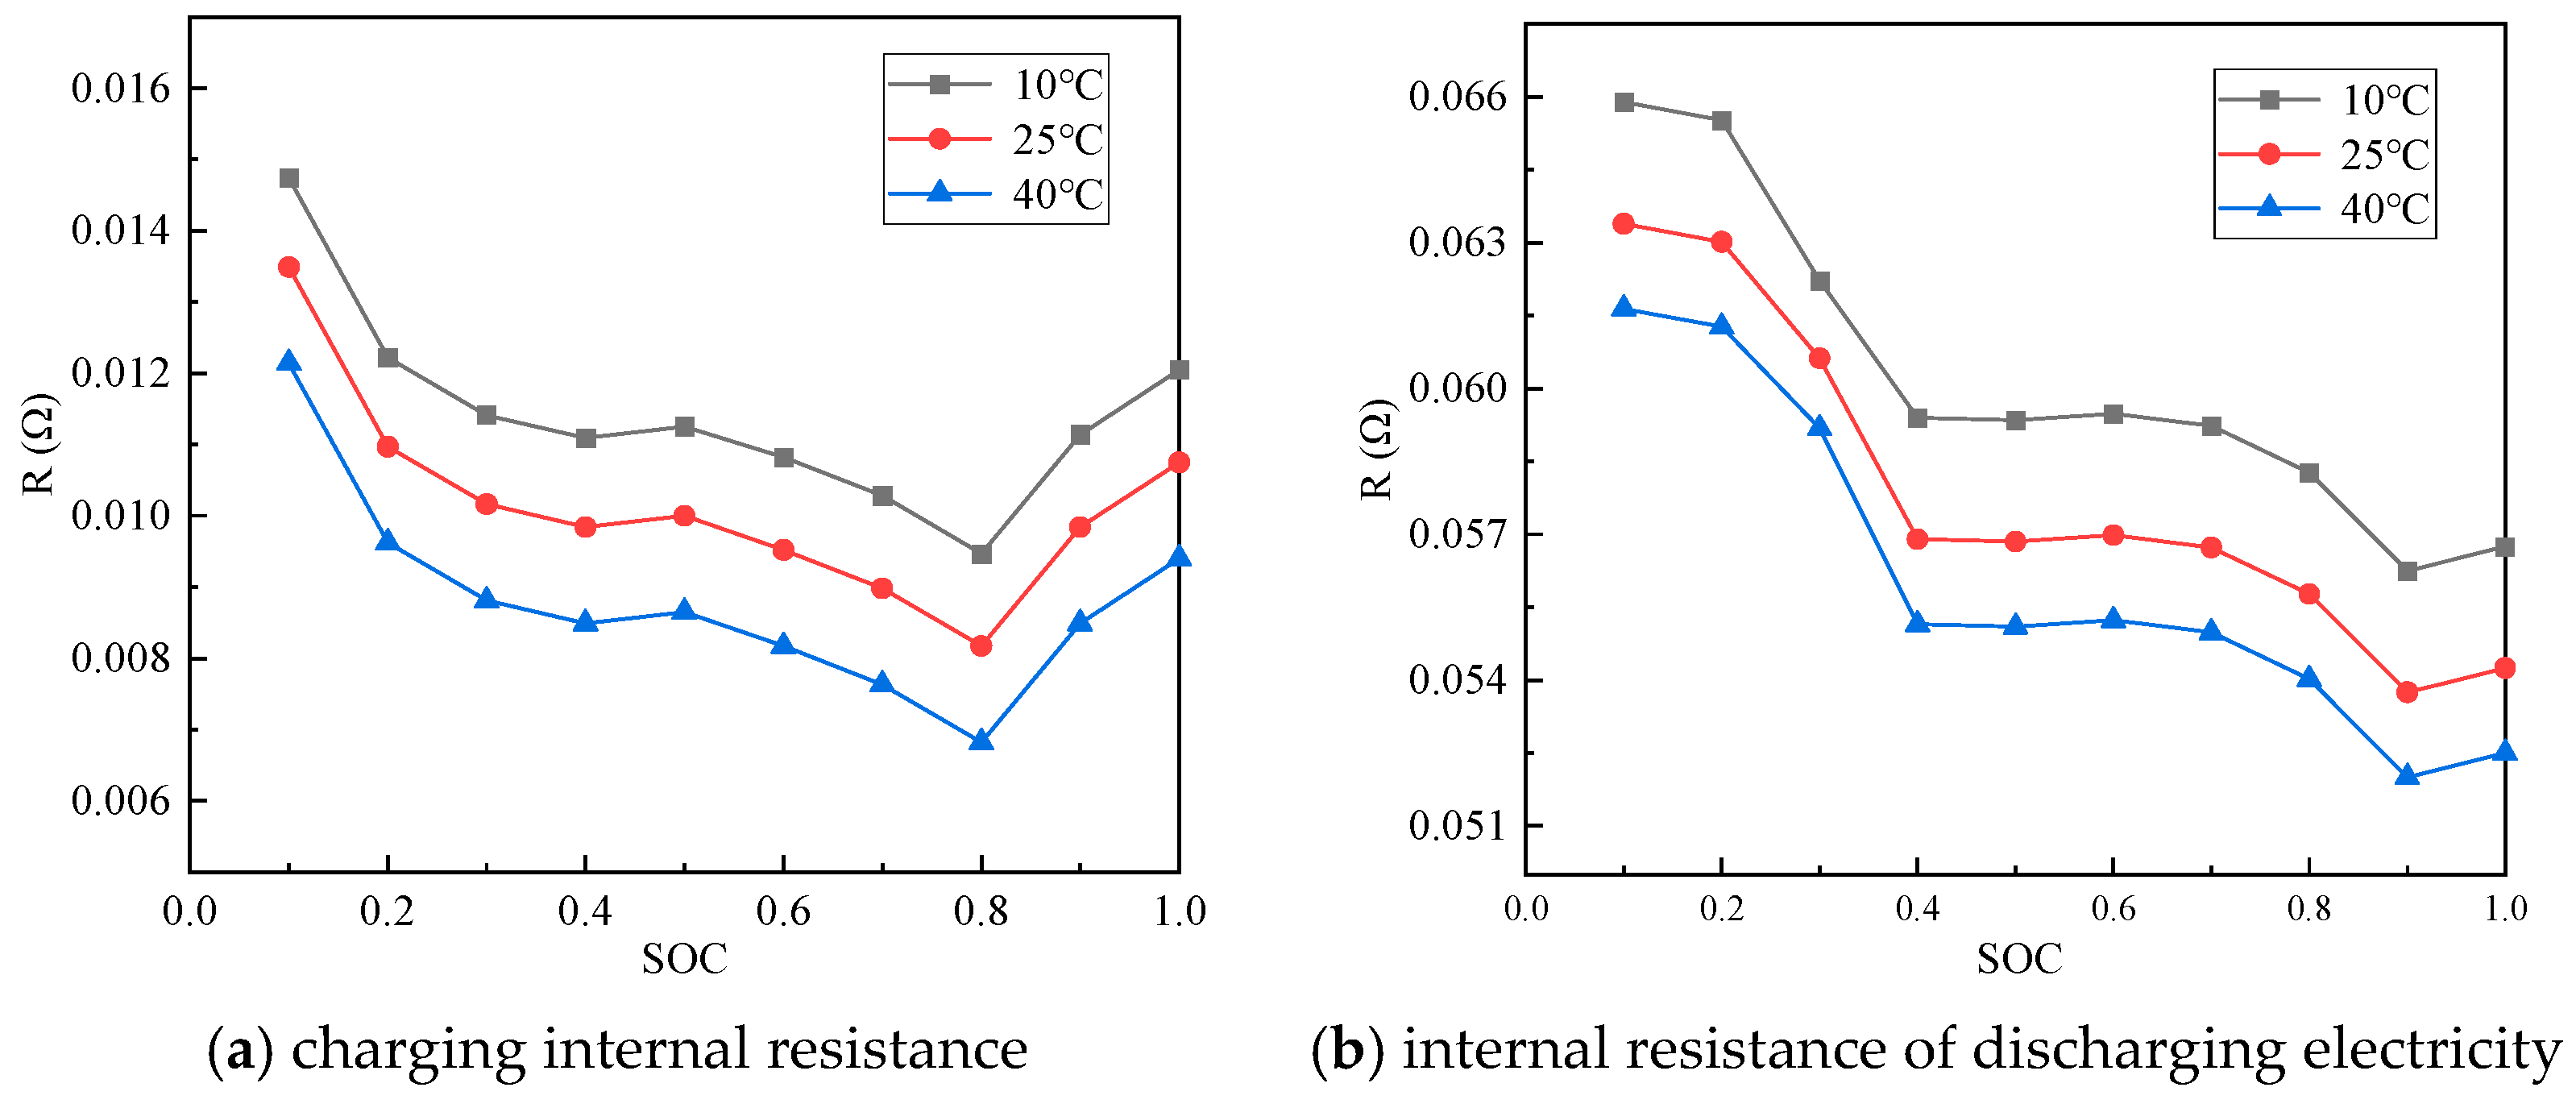
The internal resistance of the battery during charging and discharging at different states of charge (SOCs) was calculated by the hybrid-pulse-power-characteristic experiments conducted at different temperatures. Figure 9 shows the variation in internal resistance with SOC at three temperatures, 10 °C, 25 °C, and 40 °C. Conspicuously, the internal resistance crucially depends on the environmental temperature, exhibiting an inverse relationship. This is because the mobility of sodium ions increases at high temperatures, resulting in a low internal resistance. Additionally, SOC displays an identical relationship with resistance. Specifically, the lower the SOC, the higher the internal resistance of the battery; conversely, the higher the SOC, the lower the internal resistance of the battery. This phenomenon is attributed to the battery’s direct current (DC) internal resistance, which comprises two components: ohmic resistance and polarization resistance. The ohmic resistance demonstrates relatively minor variation with changes in SOC. Nonetheless, at low SOC, alterations in internal ion concentrations and other contributing factors can induce electrochemical instability, thereby leading to an increase in polarization resistance. In contrast, at a high SOC, the high concentration of sodium ions within the anode facilitates the processes of sodium ion deintercalation and intercalation, resulting in reduced resistance.
As can be seen in Figure 9, both temperature and SOC have a great influence on the internal resistance of the battery. Under a specific temperature, the internal resistance profile varies significantly with the SOC. A sharp increase in internal resistance is observed when the SOC is below 0.4, reaching a peak at the lowest SOC. When the SOC is between 0.4 and 0.6, the resistance exhibits relatively small fluctuations and generally appears stable. For SOC values ranging from 0.6 to 1, the resistance shows more pronounced fluctuations, characterized by an initial decrease followed by a slight increase near full charge. The main reason for this trend in internal resistance is related to the concentration of reactants on the surfaces of electrode materials at the beginning and end of the charging and discharging processes. This causes the internal resistance to decrease initially and then increase with SOC. At the beginning of charging and discharging, the internal resistance of the battery decreases as sodium ions are released and migrate. Towards the end of charging/discharging, the intercalation of sodium ions in the anode/cathode is close to saturation. Additionally, the electrochemical reaction rate of the electrode materials is lower than the rate of electron movement, increasing the internal resistance of the battery.

3.3.2. Entropy Coefficient

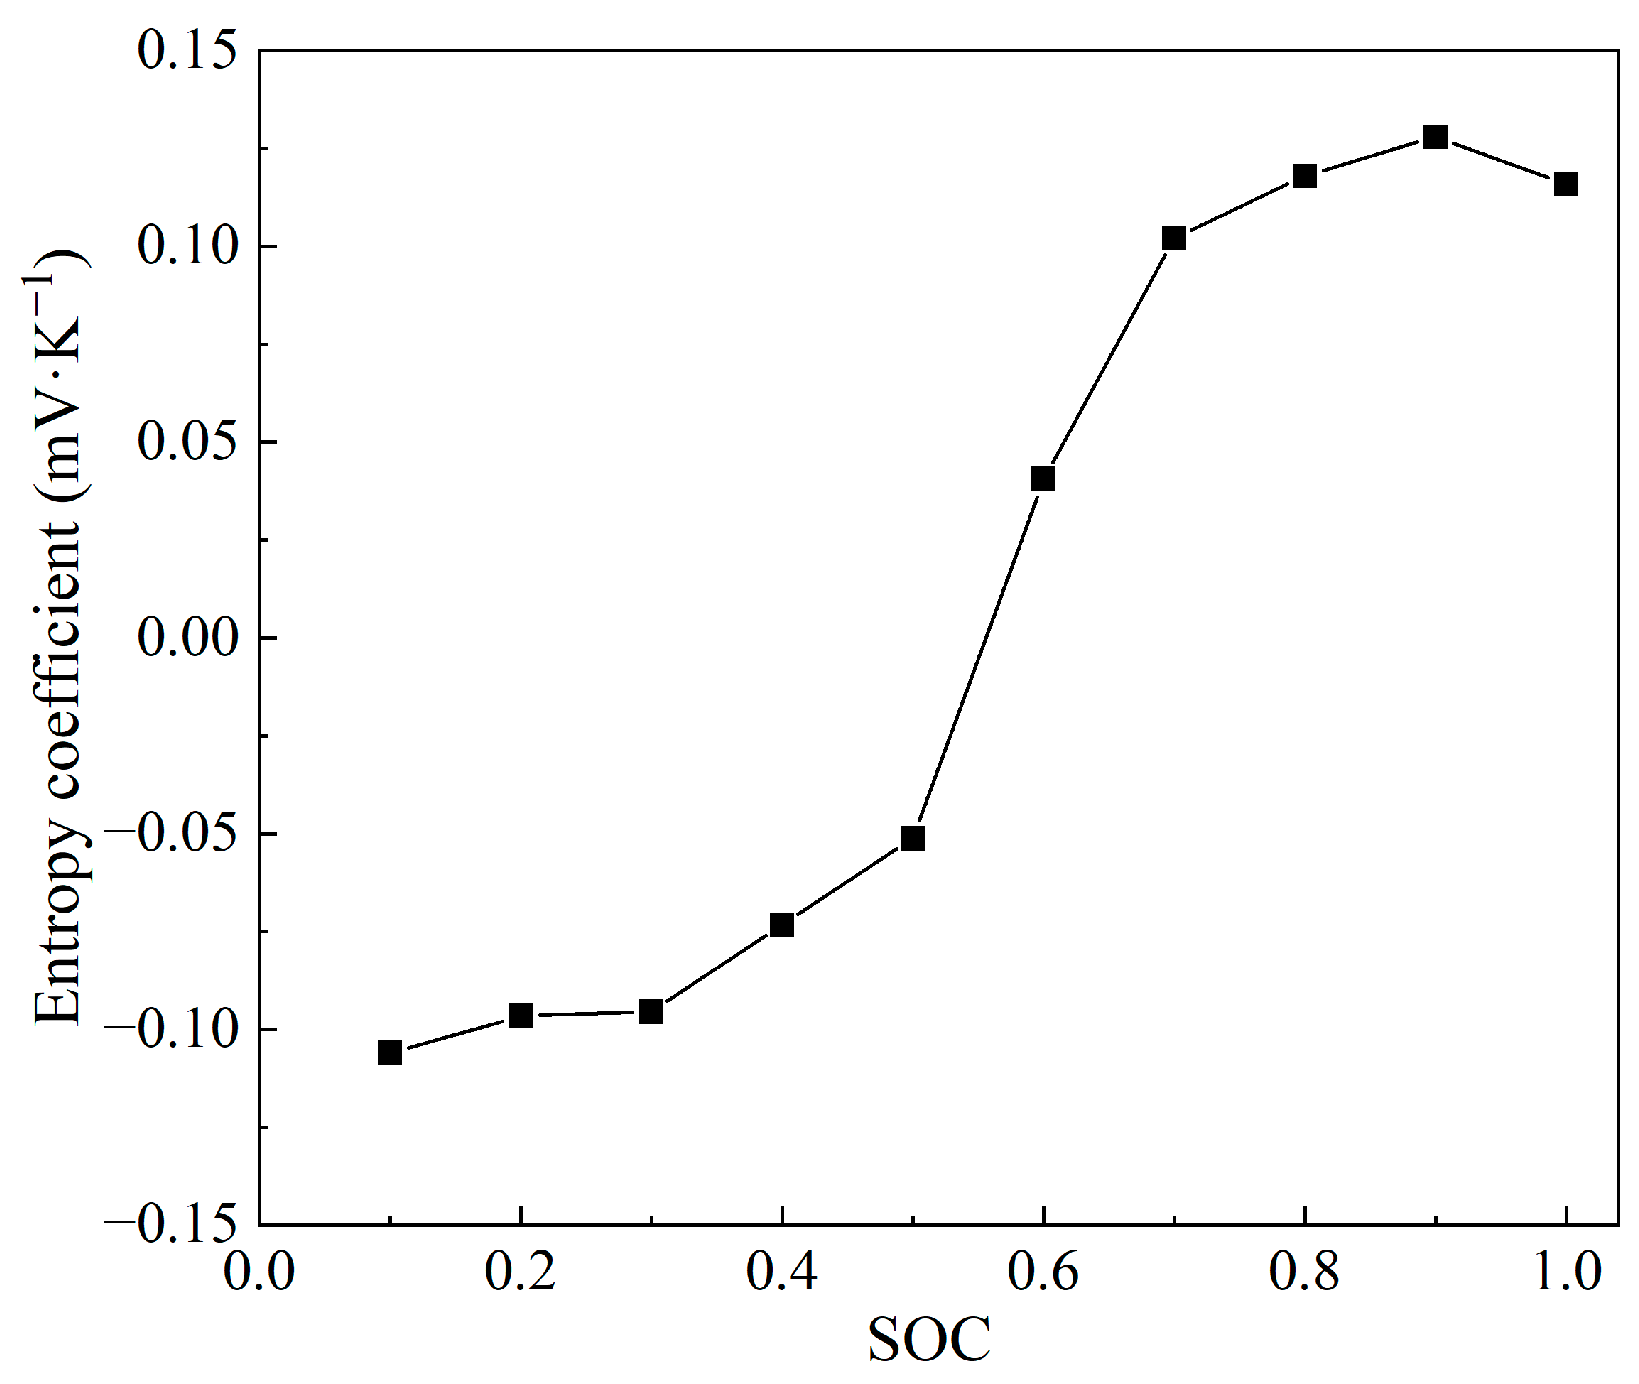
The open-circuit voltage and surface temperature of the battery at different environmental temperatures and SOCs were experimentally measured. Subsequently, the average entropy heat coefficient dU/dT at different SOCs was calculated. As shown in Figure 10, the entropy heat coefficient of the battery ranges from −0.106 to 0.128 mV/K. Generally, this coefficient is closely related to the change in SOC. During the discharging process, the entropy coefficient initially increases and then decreases. The sign of the entropy coefficient indicates the nature of the reversible heat associated with the electrochemical reactions: a positive value signifies an endothermic (heat-absorbing) process, whereas a negative value indicates an exothermic (heat-releasing) process. During the charging process, the entropy coefficient was positive when the SOC ranged from 0.6 to 1, suggesting an endothermic reaction within this range. The magnitude of this heat absorption peaks around an SOC of 0.9 and subsequently declines. Conversely, during the latter stages of discharge, when the SOC drops below 0.6, the entropy coefficient decreases sharply. This rapid decline results in a significant increase in reversible heat generation, leading to a notable rise in the battery’s temperature. This contrasting behavior in reversible heat generation unveils that SIBs typically produce more heat during discharge than during charge.
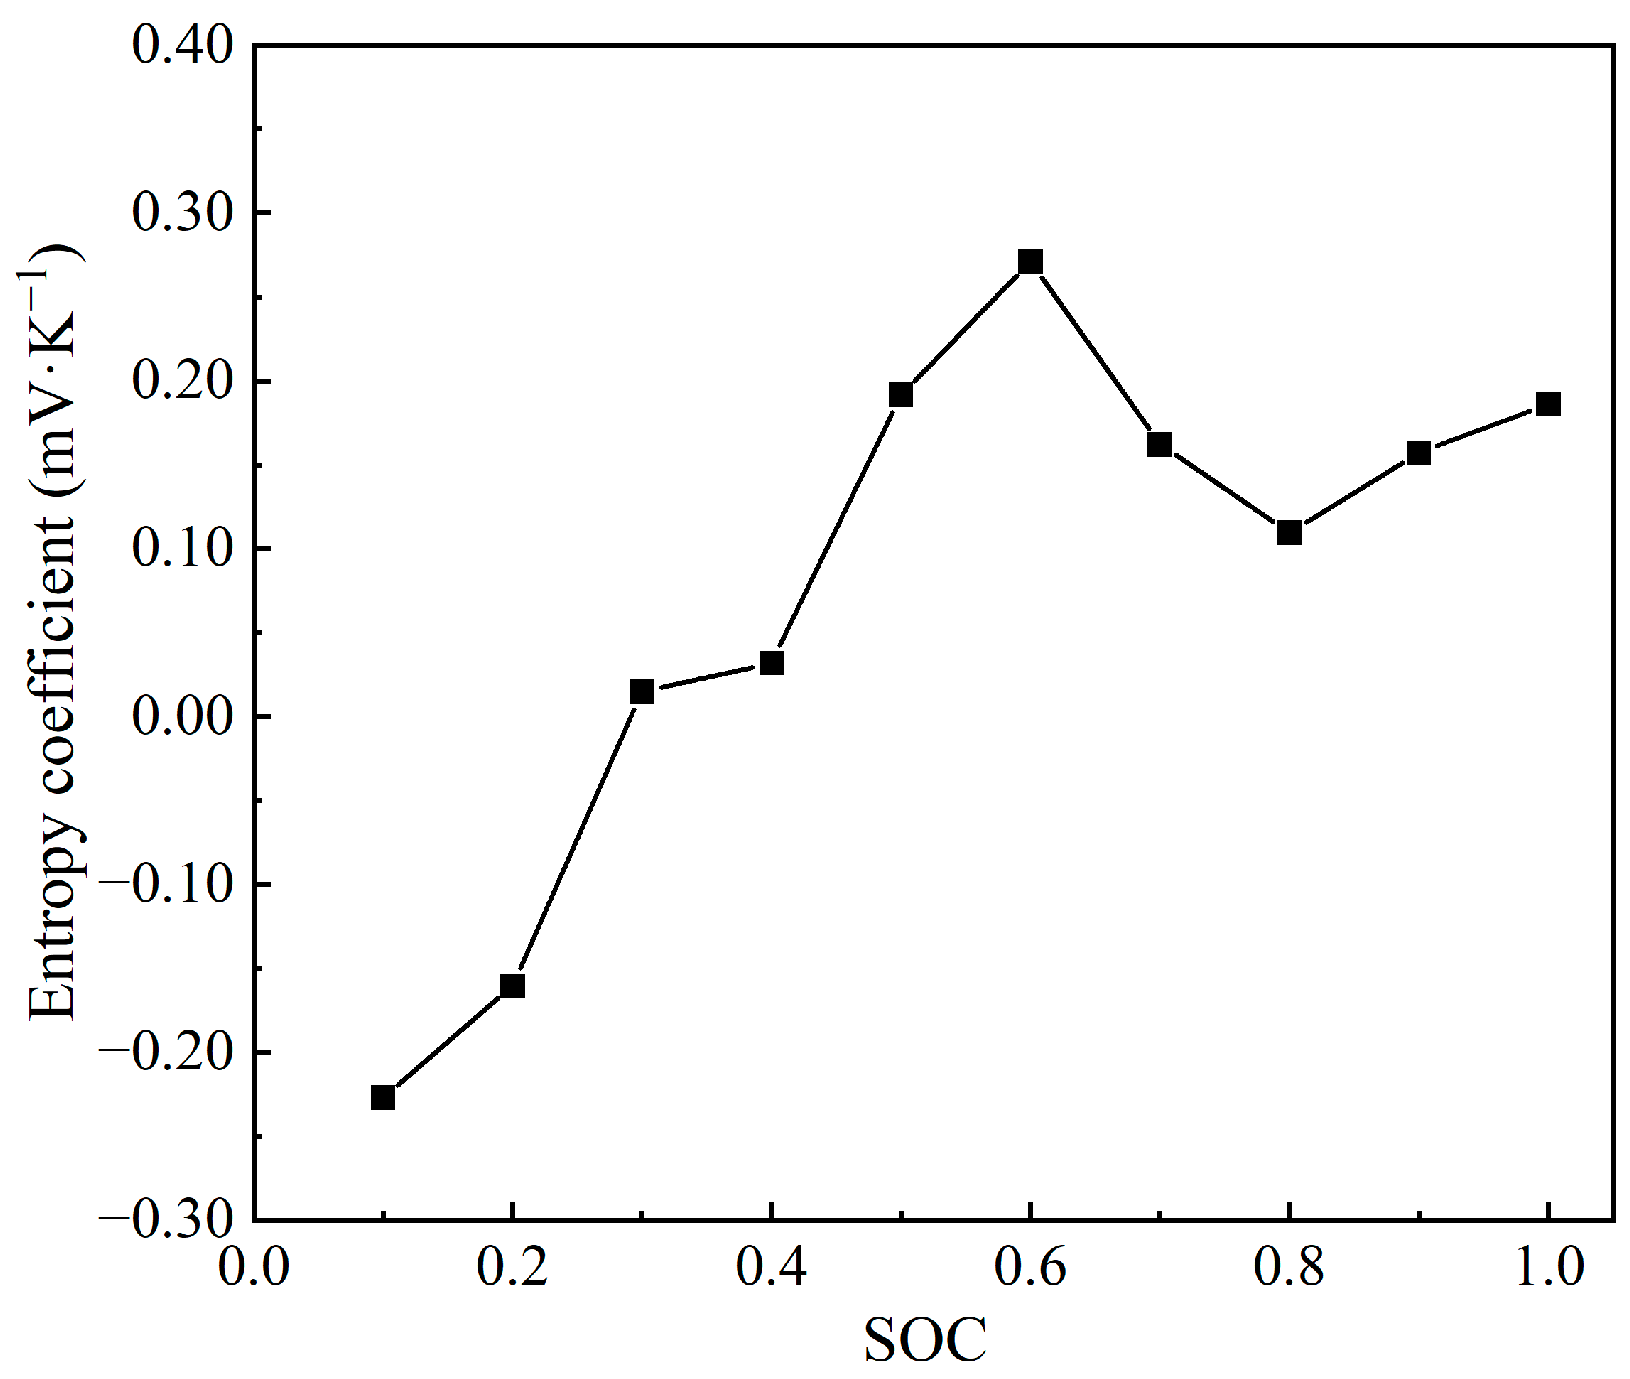
For the purpose of comparison, the entropy heat coefficient curve of the same 18650-type lithium-iron phosphate (LiFePO4) battery with a capacity of 1300 mAh is presented in Figure 11. The entropy heat coefficient of this battery ranged from −0.227 to 0.286 mV/K. The entropy heat coefficient of the investigated LiFePO4 battery exhibited a non-monotonic relationship with the SOC. Specifically, it initially increased, then decreased, and subsequently rose again. Notably, the coefficient changed from negative to positive values at approximately 50% SOC, and the peak endothermic heat was observed at approximately 60% SOC.
The entropy heat coefficients of lithium-ion and sodium-ion batteries (LIBs and SIBs) are compared in Figure 10 and Figure 11. In the low SOC range (SOC < 0.5), the increase in the entropy heat coefficient was more pronounced for the LIB compared to the SIB. Conversely, at high SOC levels (SOC > 0.5), the SIB exhibited a more significant rise in its entropy heat coefficient than its lithium-ion counterpart. This shows that the thermal stability of the SIB is inferior to that of the LIB at high SOC levels. Generally, thermal runaway is more prone to occur in LIBs at a low SOC.
The entropy heat coefficient of the SIB varies smoothly with SOC, which originates from the mutual compensation of entropy changes due to the multi-site sodium storage in the hard carbon anode, and from the single-phase solid-solution reaction of the layered sodium oxide cathode, where the lattice disorder continuously evolves with sodium content, avoiding the sharp entropy variation associated with two-phase coexistence. In contrast, the entropy heat coefficient of the LIB exhibits pronounced fluctuations, attributable to the reversible two-phase reaction between LiFePO4 and FePO4. In the intermediate SOC region, the dynamic variation in the proportion of the two phases induces ordered-disordered lattice rearrangement of Li+, resulting in concentrated entropy fluctuations. Consequently, the entropy heat coefficient trends of the two batteries differ across SOC intervals, but overall, the SIB shows a lower entropy coefficient, indicating better comprehensive thermal stability compared to the LIB.

4. Establishment of Thermal Simulation Model of a Single SIB

4.1. Calculation of Thermal Parameters in SIB

The material parameters of the SIB are shown in Table 3. For the thermal simulation analysis of a single SIB, it is necessary to calculate the specific heat capacity, thermal conductivity in all directions, and the heat production rate under different working conditions. The specific heat capacity of the SIB is calculated by Equation (12). The thermal conductivity of the SIB includes longitudinal and transverse thermal conductivity. They are calculated using the series-parallel thermal resistance method for the cell thickness and length and height directions, respectively, as expressed in Equations (13) and (14).
c p = 1 m i i m i c p , i
k lon = i L i i L i k i
k tran = i k i L i i L i
where cp,i represents the specific heat capacity of each layer of material, in J/(kg·K); mi is the mass of each individual material, in kg; klon, ktran are the longitudinal and transverse thermal conductivity of the battery, respectively, measured in W/(m·K); Li denotes the thickness of each layer of material, in m; and ki is the thermal conductivity of battery components, expressed in W/(m·K). The calculation results for the following thermal simulations are presented in Table 4.
The thermal model, which consists of a cylindrically shaped battery with internal heat generation and the surrounding air, solves the fundamental mass, momentum, and energy equations using the Realizable k-ɛ turbulence model. Heat conduction occurs for the heat transfer between the battery shell and the cell, while natural convection heat dissipation is involved in the heat transfer between the air and the shell. The environmental temperature and the heat transfer coefficient are set at 25 °C and 5 W/m·K, respectively. Based on the pressure-based solver, the second-order windward discretization format was adopted, and the control equations were solved with double precision. The impact of discharge rate on the temperature distribution of a single SIB is investigated at 0.5 C (0.65 A), 1 C (1.3 A), and 2 C (2.6 A), with a time step of 1 s.

4.2. Simulation Model Construction and Validation

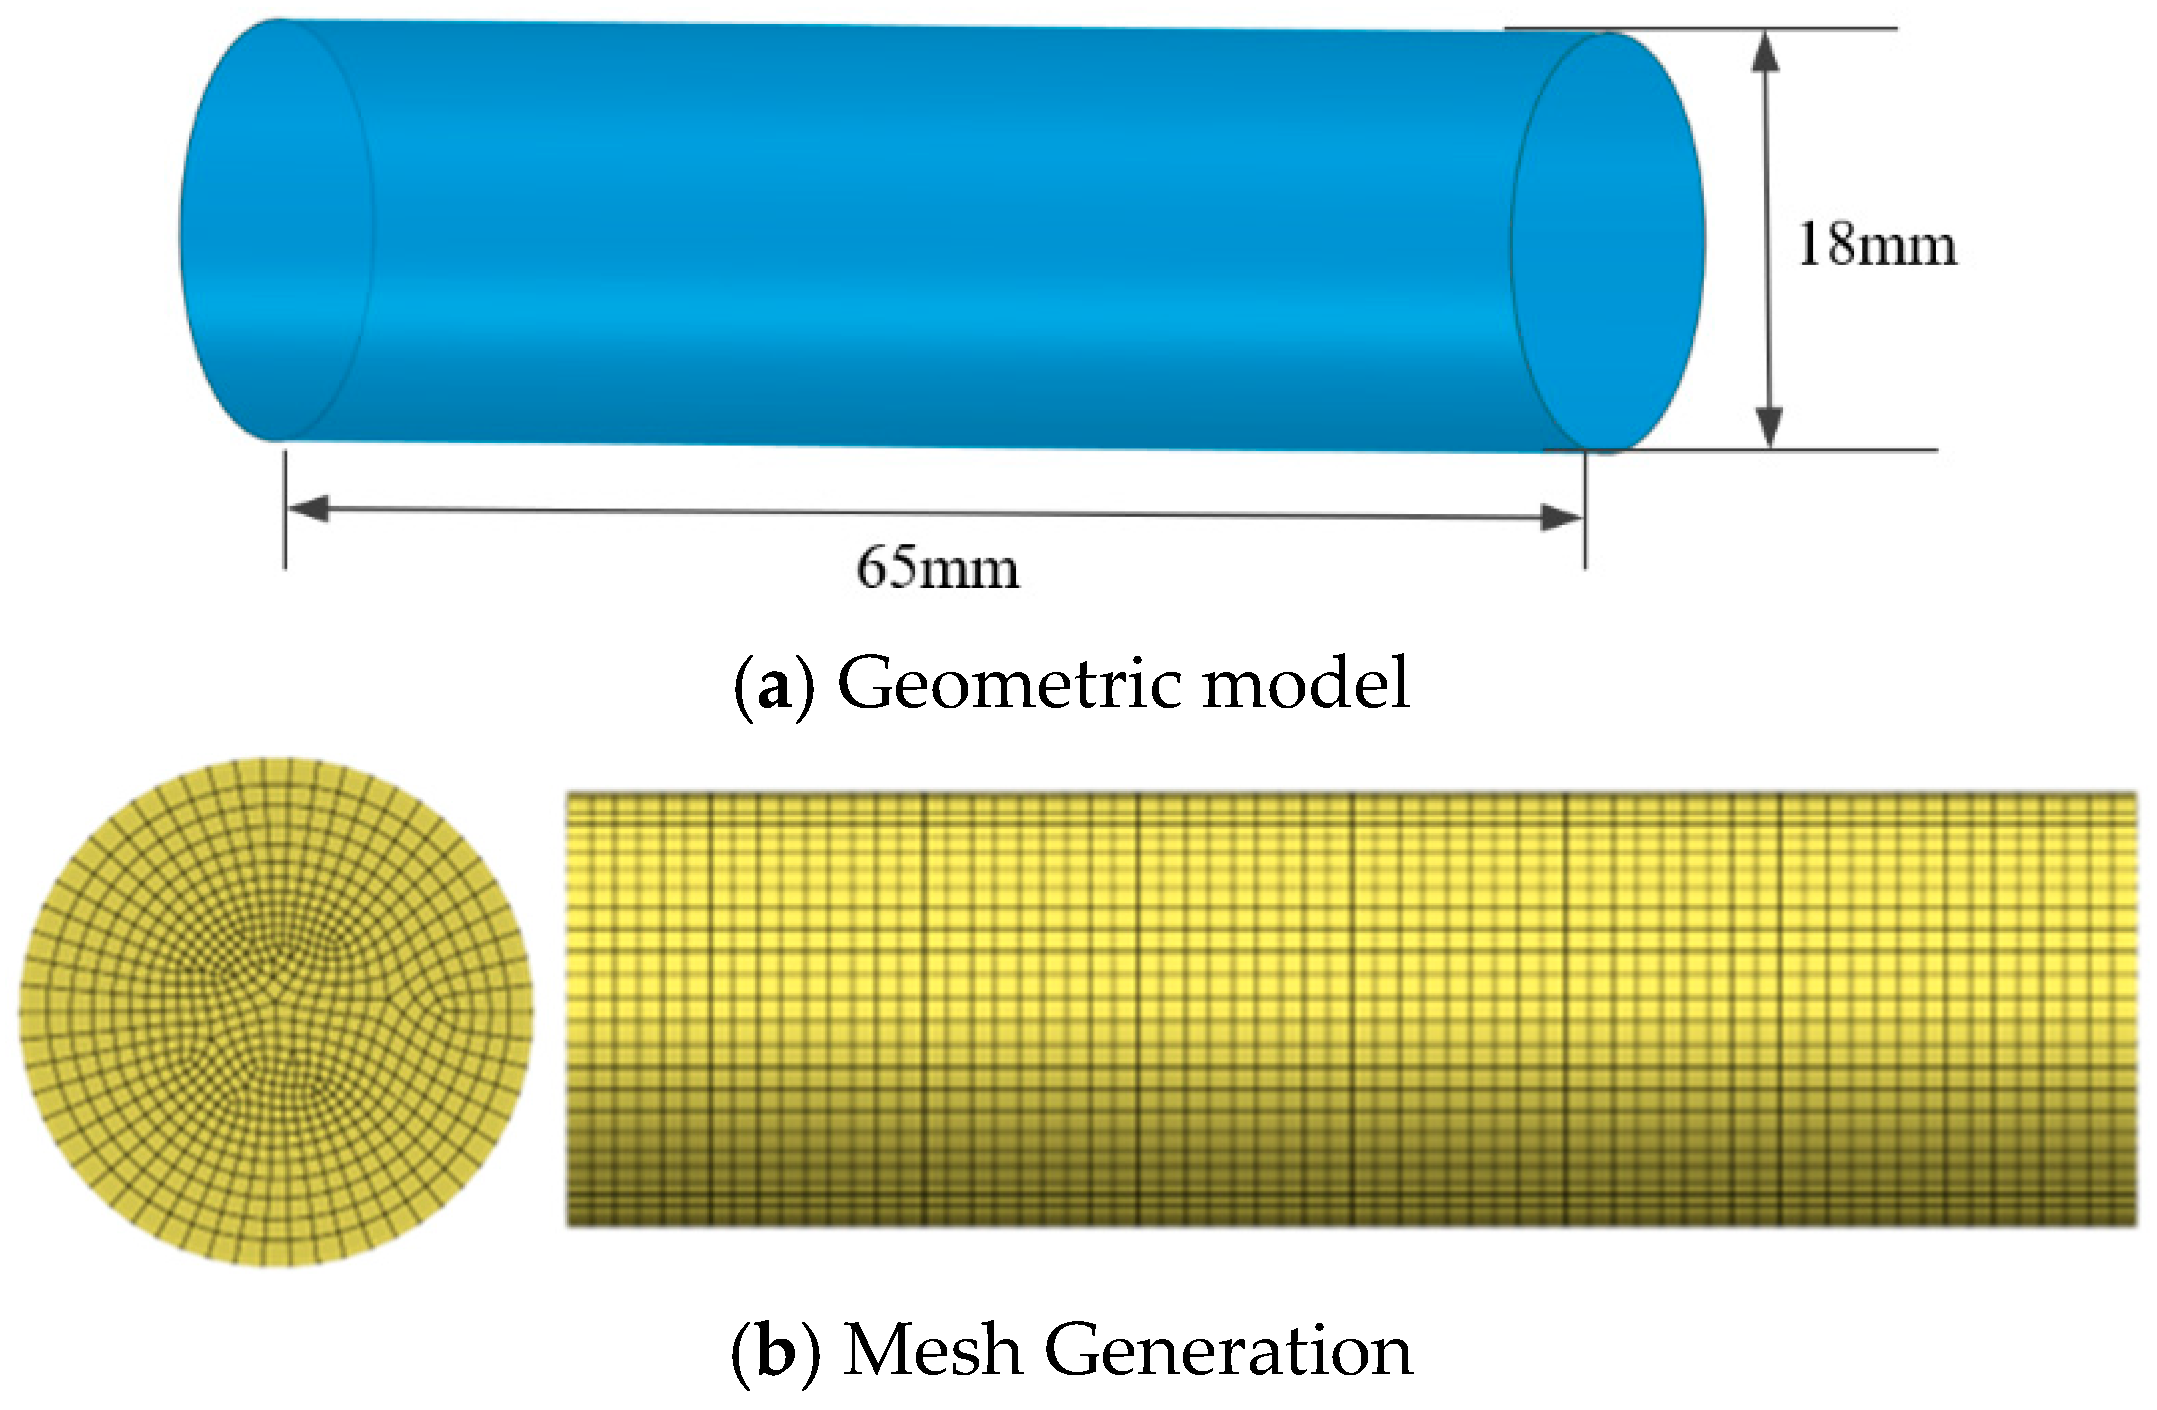
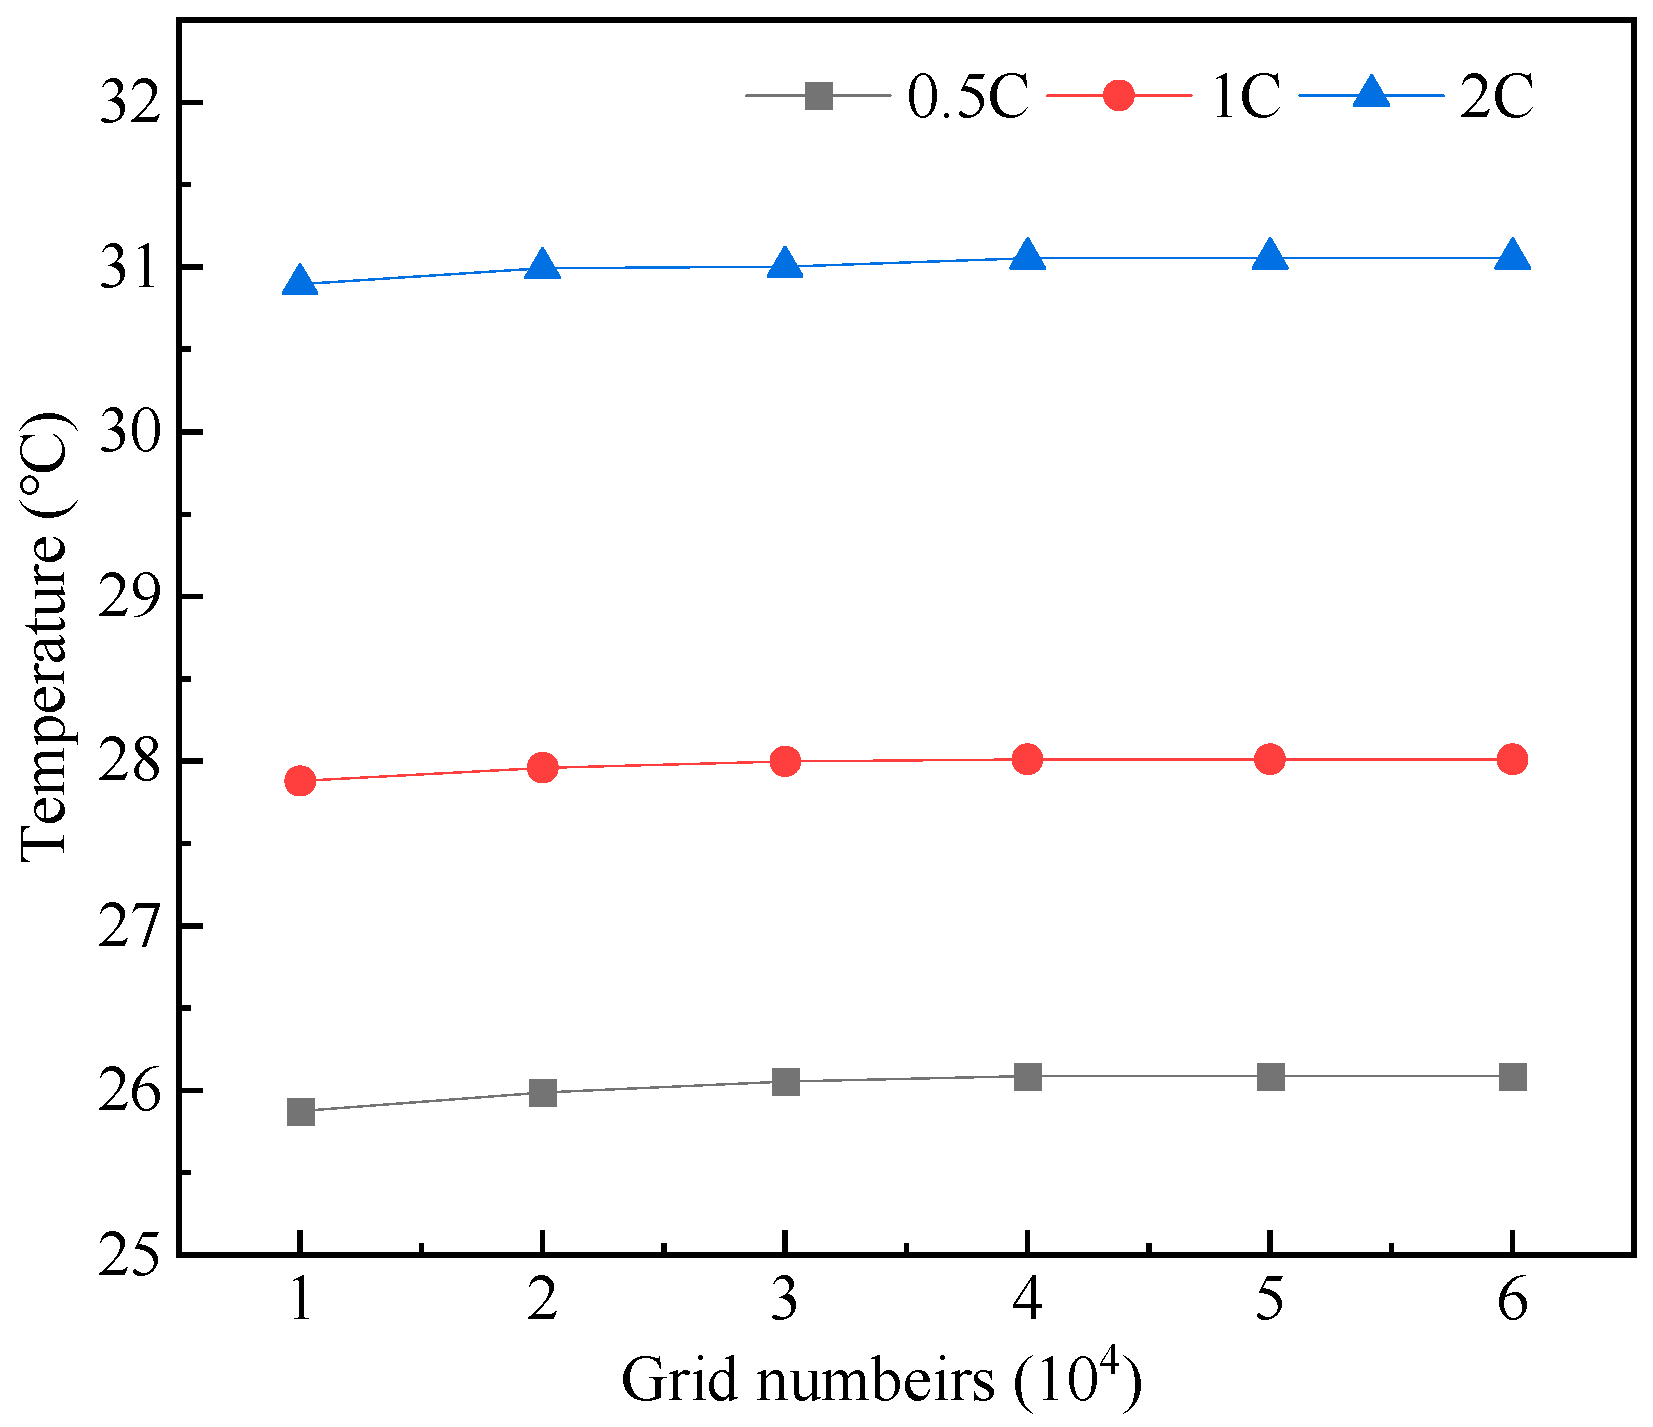
Based on the heat generation and heat transfer properties of the SIB, a computational model for a single cell was developed. To enhance computational efficiency, the battery’s geometry was simplified to a cylinder with homogeneous internal heat generation and uniform medium distribution. In the model, the battery shell and internal components were treated as a single entity. The geometric representation of the single SIB is depicted in Figure 12a. The simulation model’s mesh was generated using Ansys Meshing software (Ansys 2022), and the resulting discretization is illustrated in Figure 12b. To ensure that the numerical solution was independent of the mesh resolution, a grid convergence study was conducted through simulations. The single SIB was simulated under identical operating conditions using six different mesh densities. As evidenced in Figure 13, when the number of grid elements exceeded 40,000, the simulated battery temperature reached a stable state, exhibiting no significant variation with further mesh refinement. Considering the balance between computational accuracy and cost, a mesh comprising 40,000 elements was selected for the simulation model of the 18650-type SIB.
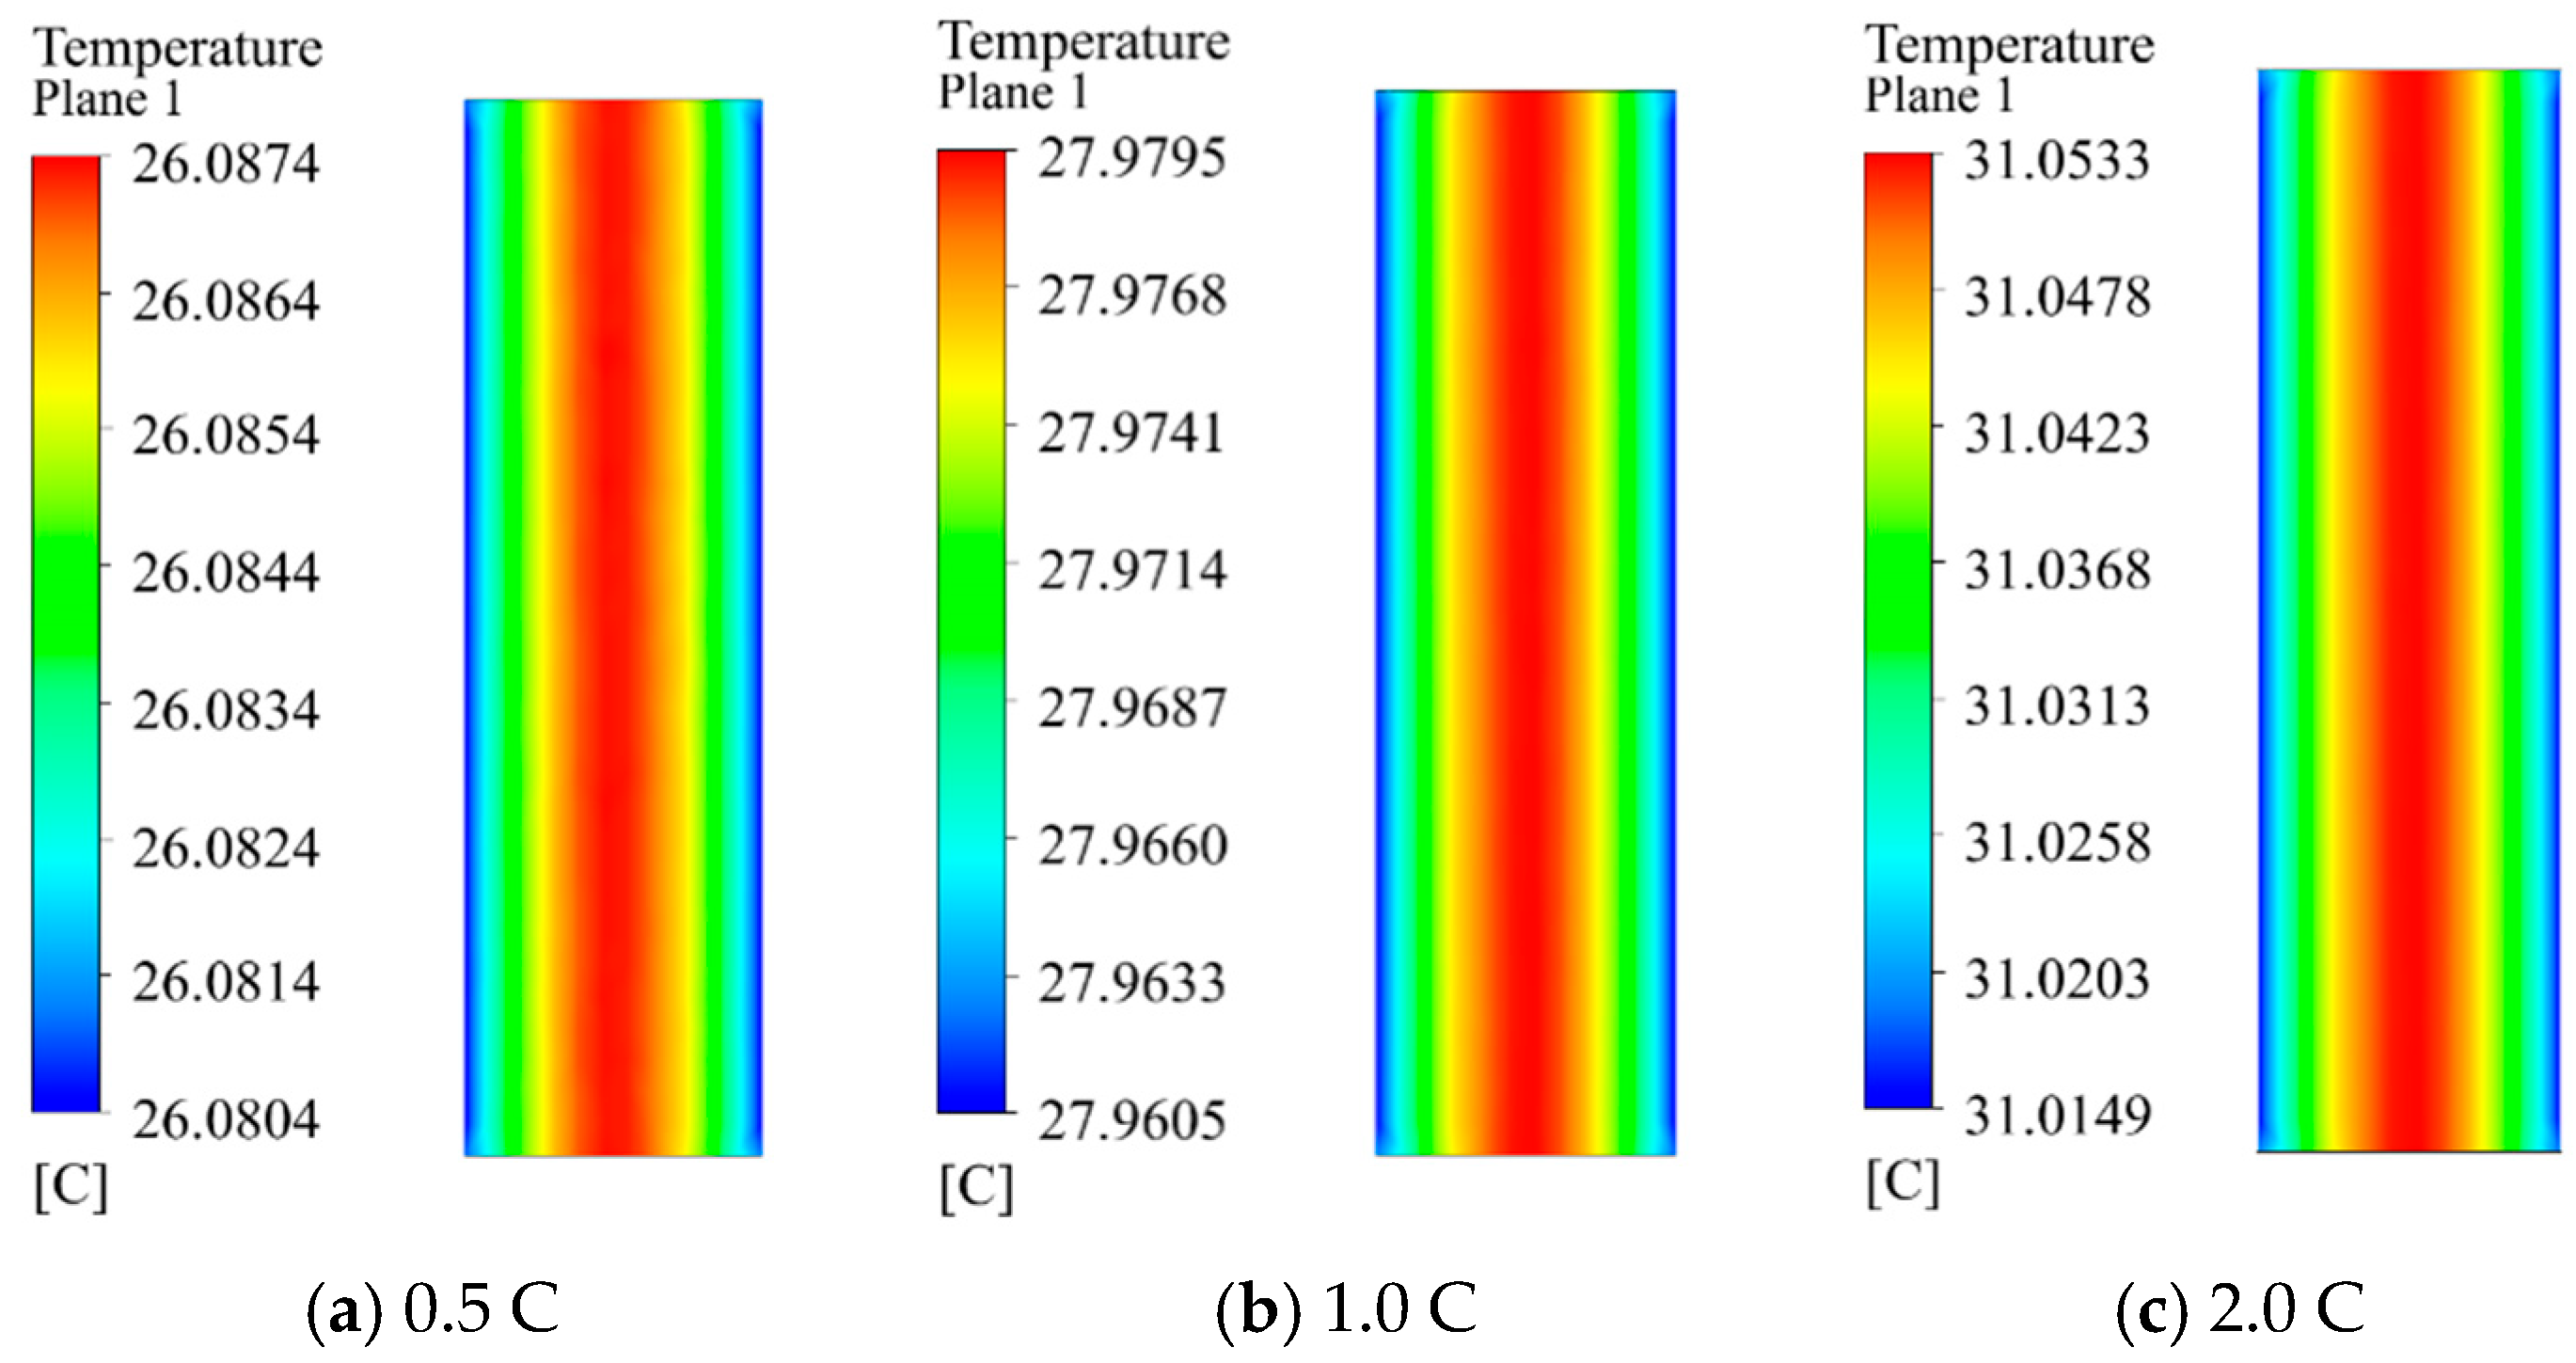
The simulation results of the temperature distribution in the single SIB at 0.5 C, 1 C, and 2 C are shown in Figure 14. During battery discharge, the simulated internal temperature distribution of the SIB exhibited an approximately elliptical pattern. The radial temperature gradient is characterized by a gradual decrease from the core towards the periphery. The central region exhibited significantly elevated temperatures. This is due to the exothermic nature of the electrochemical reactions occurring during charging and discharging, coupled with the concentration of current density and the resulting heat accumulation. In contrast, the upper-and-lower ends and the side periphery of the battery are the regions of low-temperature concentration. The temperature distribution obtained through simulation was fundamentally consistent with the established principles of battery thermal behavior as outlined in Bernardi’s theory [32].
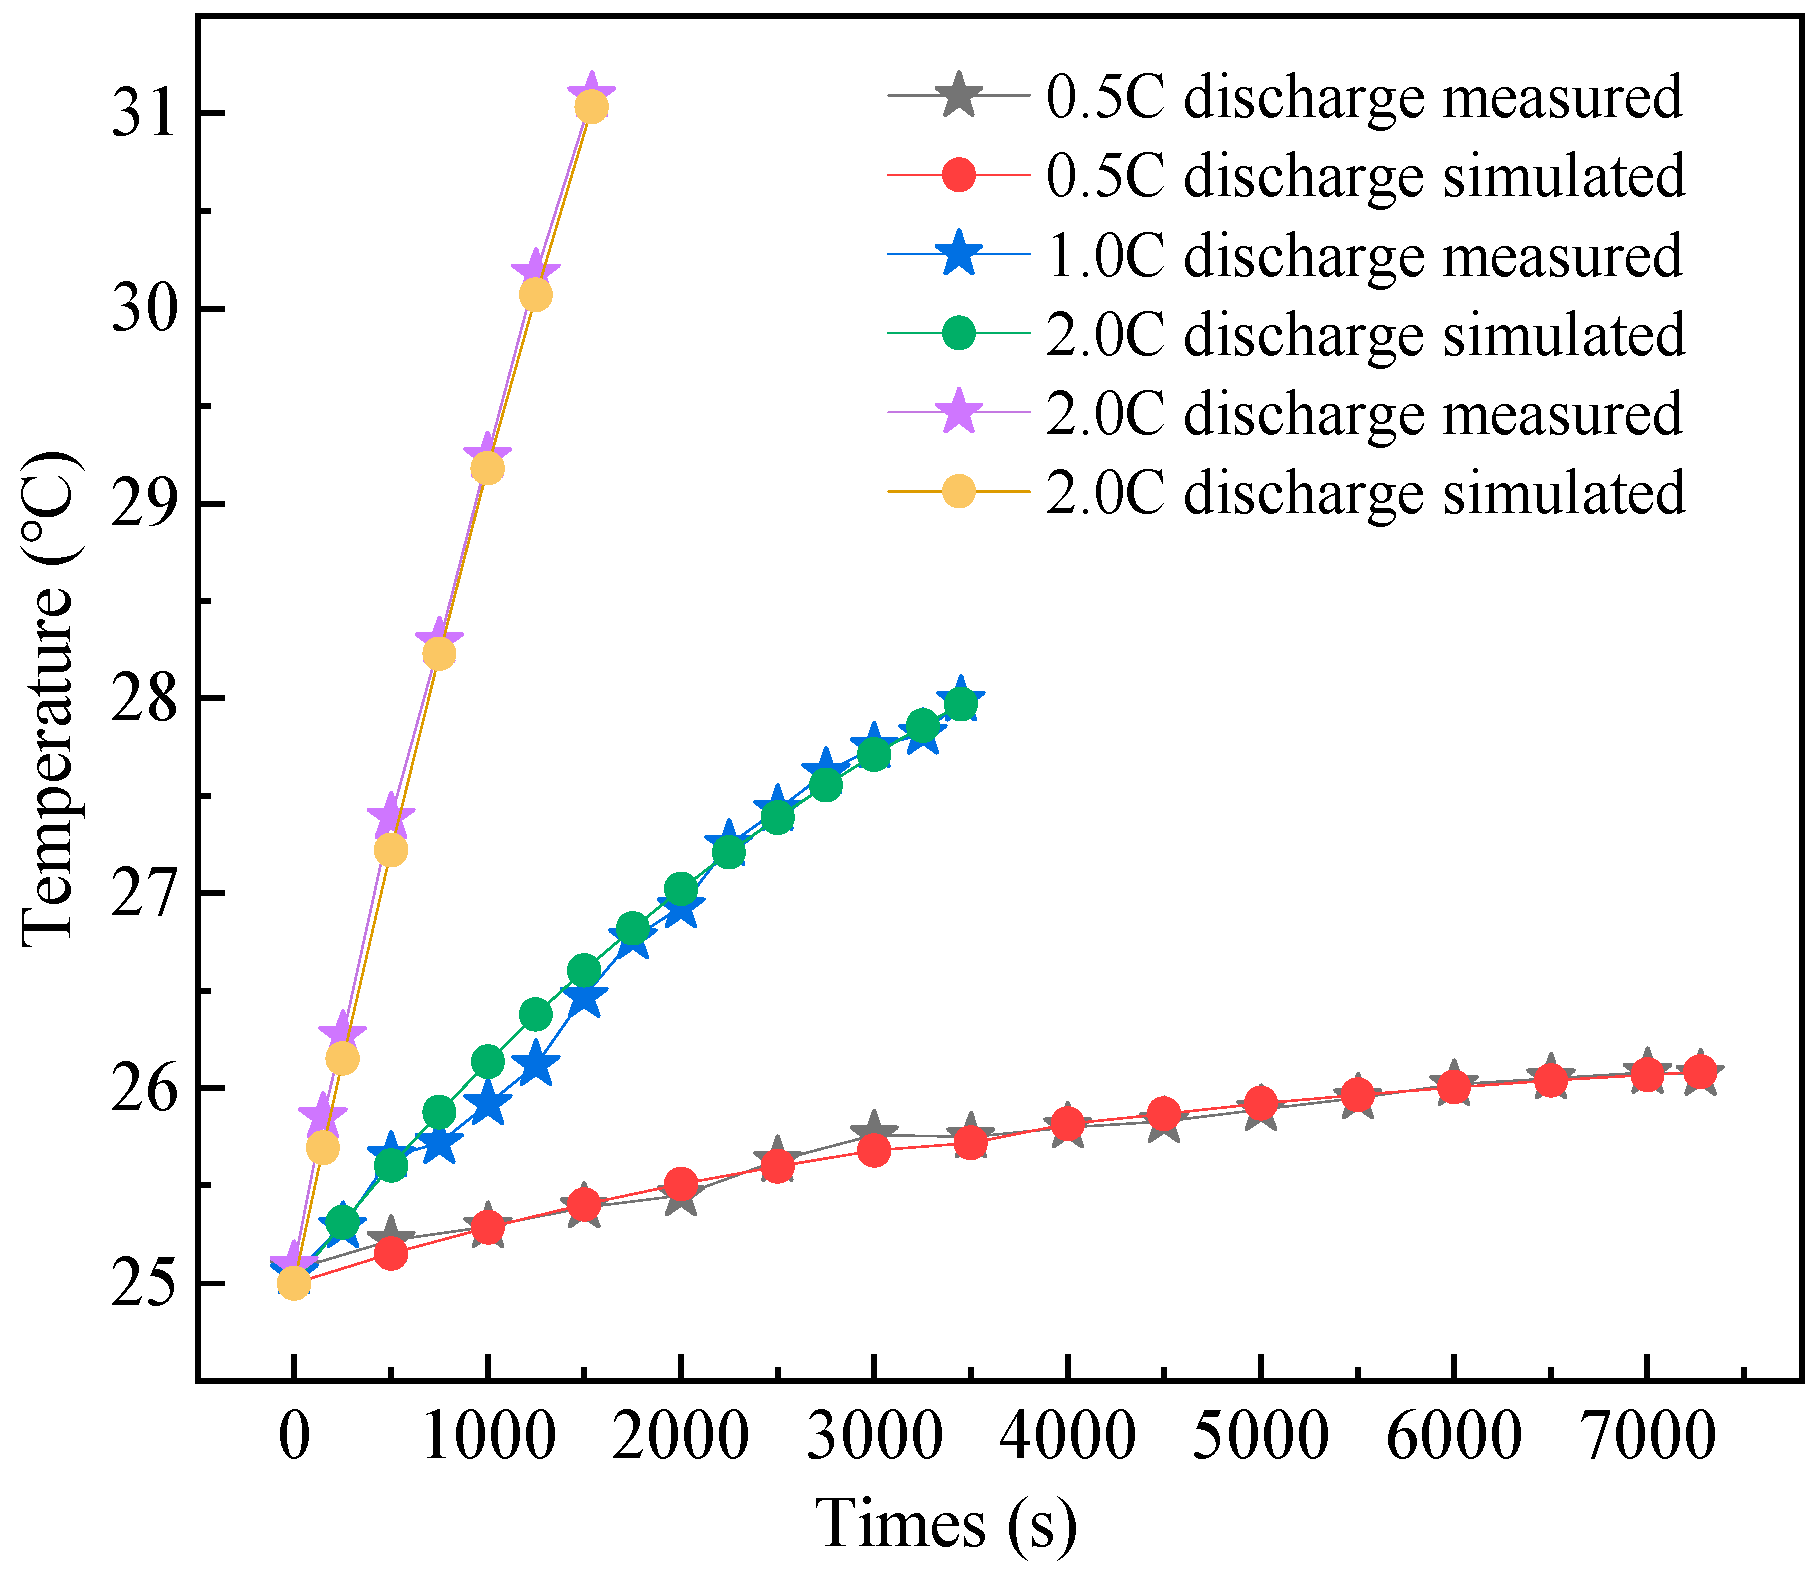
Figure 15 illustrates the comparison between the simulated and experimental average temperatures of the single SIB under varying discharge rates. The temporal trends of the average temperature obtained from the electrochemical-thermal simulation model, developed based on Bernardi’s theory, exhibited good concordance with the experimental measurements. Specifically, during battery discharge at 0.5 C, 1 C, and 2 C, the maximum deviations between the simulation results and experimental data were 0.31%, 0.98%, and 0.62%, respectively. This validates the accuracy of the developed simulation model.
The consistency between the simulation results and experimental findings confirms the validity of the single SIB thermal model on the basis of Bernardi’s theory and the accuracy of the thermal and physical parameters determined in this study. Furthermore, this agreement substantiates the simulation model’s capability to predict the thermal behavior of the single SIB during constant-current discharging. This predictive power provides a foundational basis for the design of thermal management systems for SIB packs and holds significant reference value for future research and development in this domain.

5. Thermal Simulation of SIB Pack

5.1. Numerical Model of SIB Pack

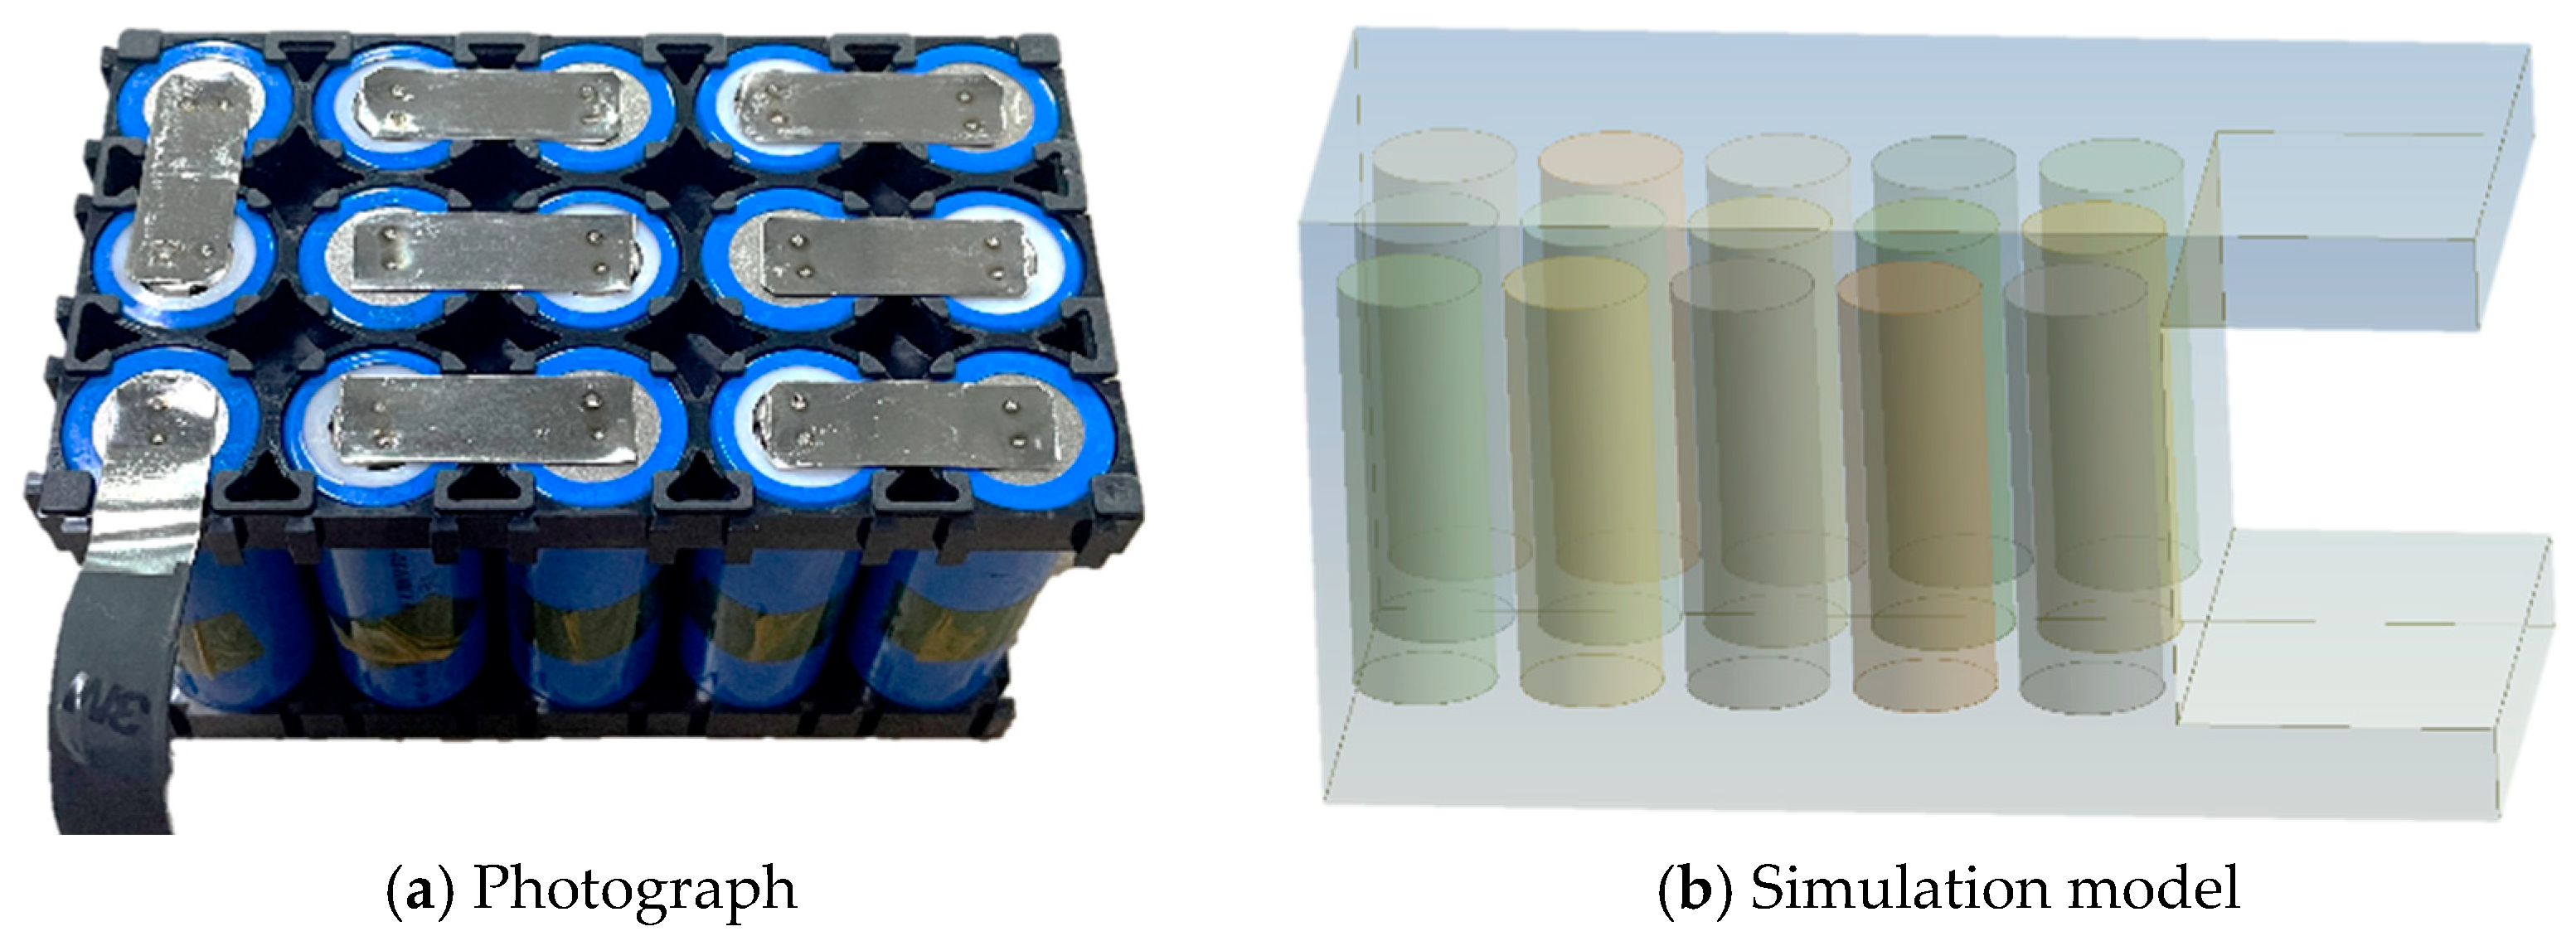
A 1P15S SIB pack is selected as the research object, which consists of 15 individual cells connected in series with an equally spaced arrangement. The battery terminals and welding seats are neglected in the modeling process, and a U-shaped airflow channel is adopted. Based on the single-battery thermal model established above, the SIB pack is modeled. The overall dimensions of the SIB module are 160 mm in length, 68 mm in width, and 95 mm in height, with a cell-to-cell spacing of 5 mm. The physical photograph and the simulated model structure of the SIB pack are shown in Figure 16.
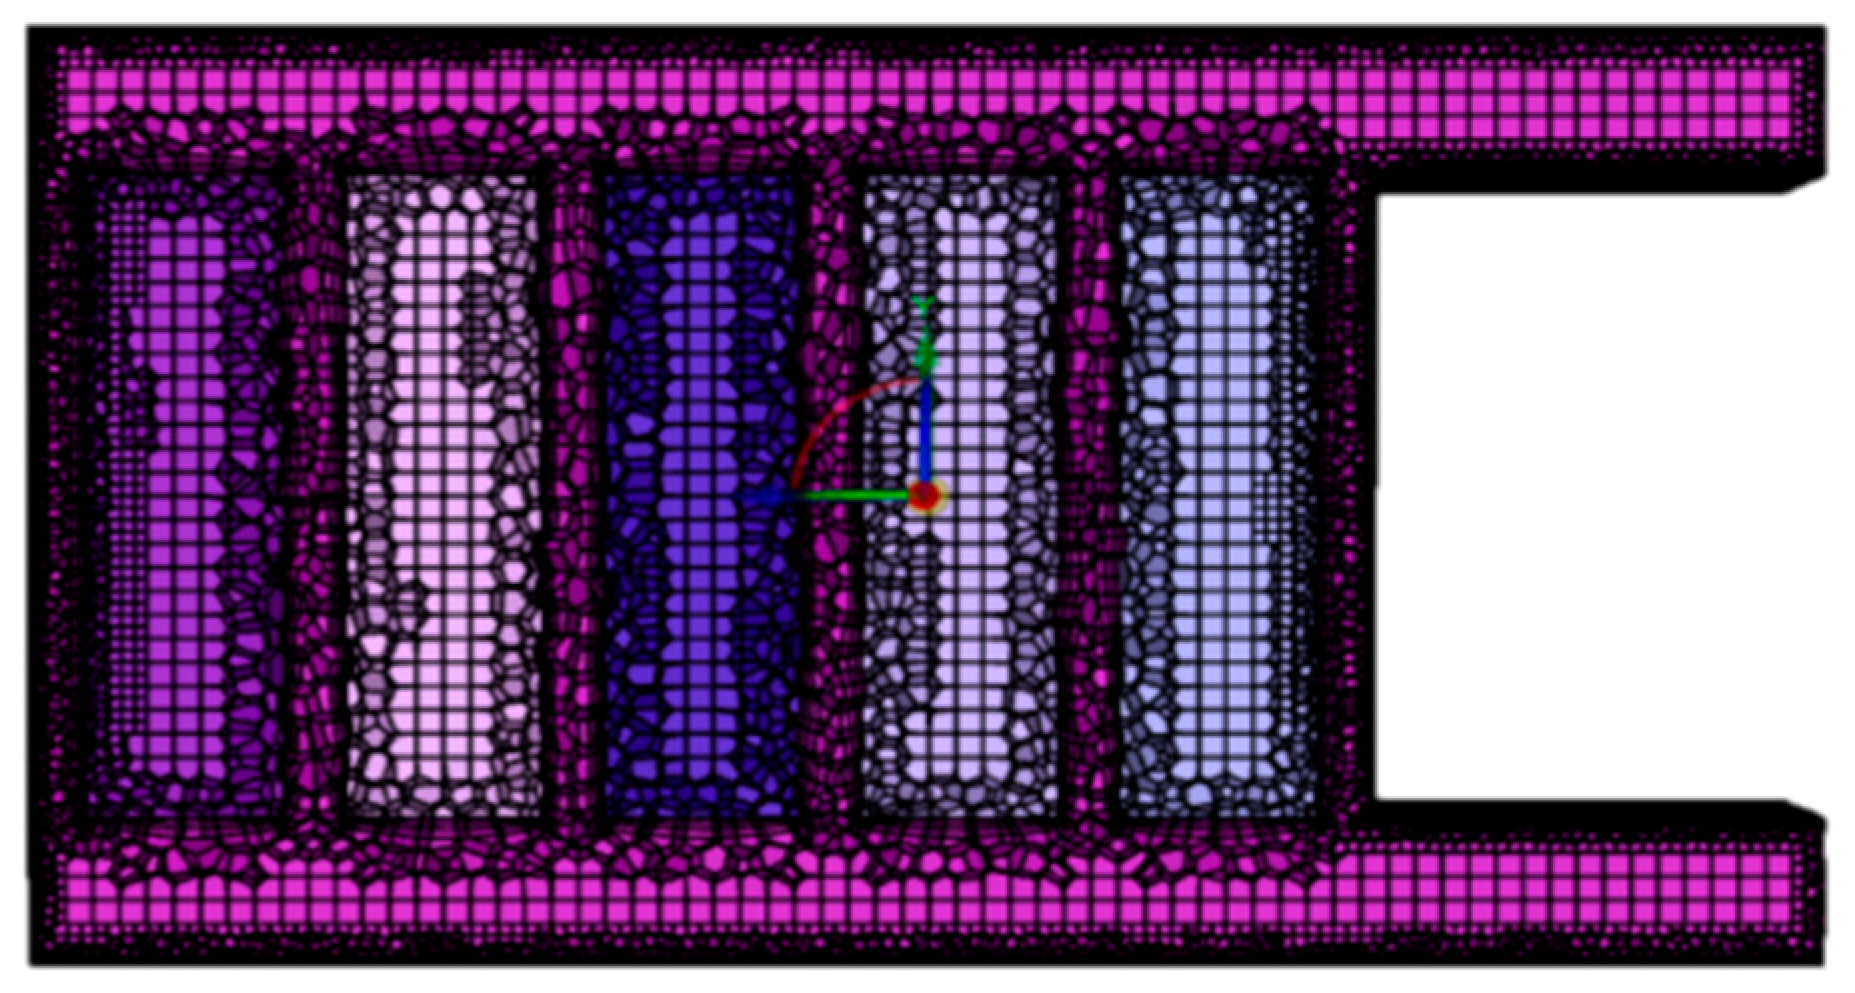
Based on the thermal model of a single SIB, a simulation model of the SIB pack is established. Local grid refinement is implemented in the fluid-battery wall coupling region to improve computational accuracy. The meshed model of the U-shaped channel battery pack is presented in Figure 17.
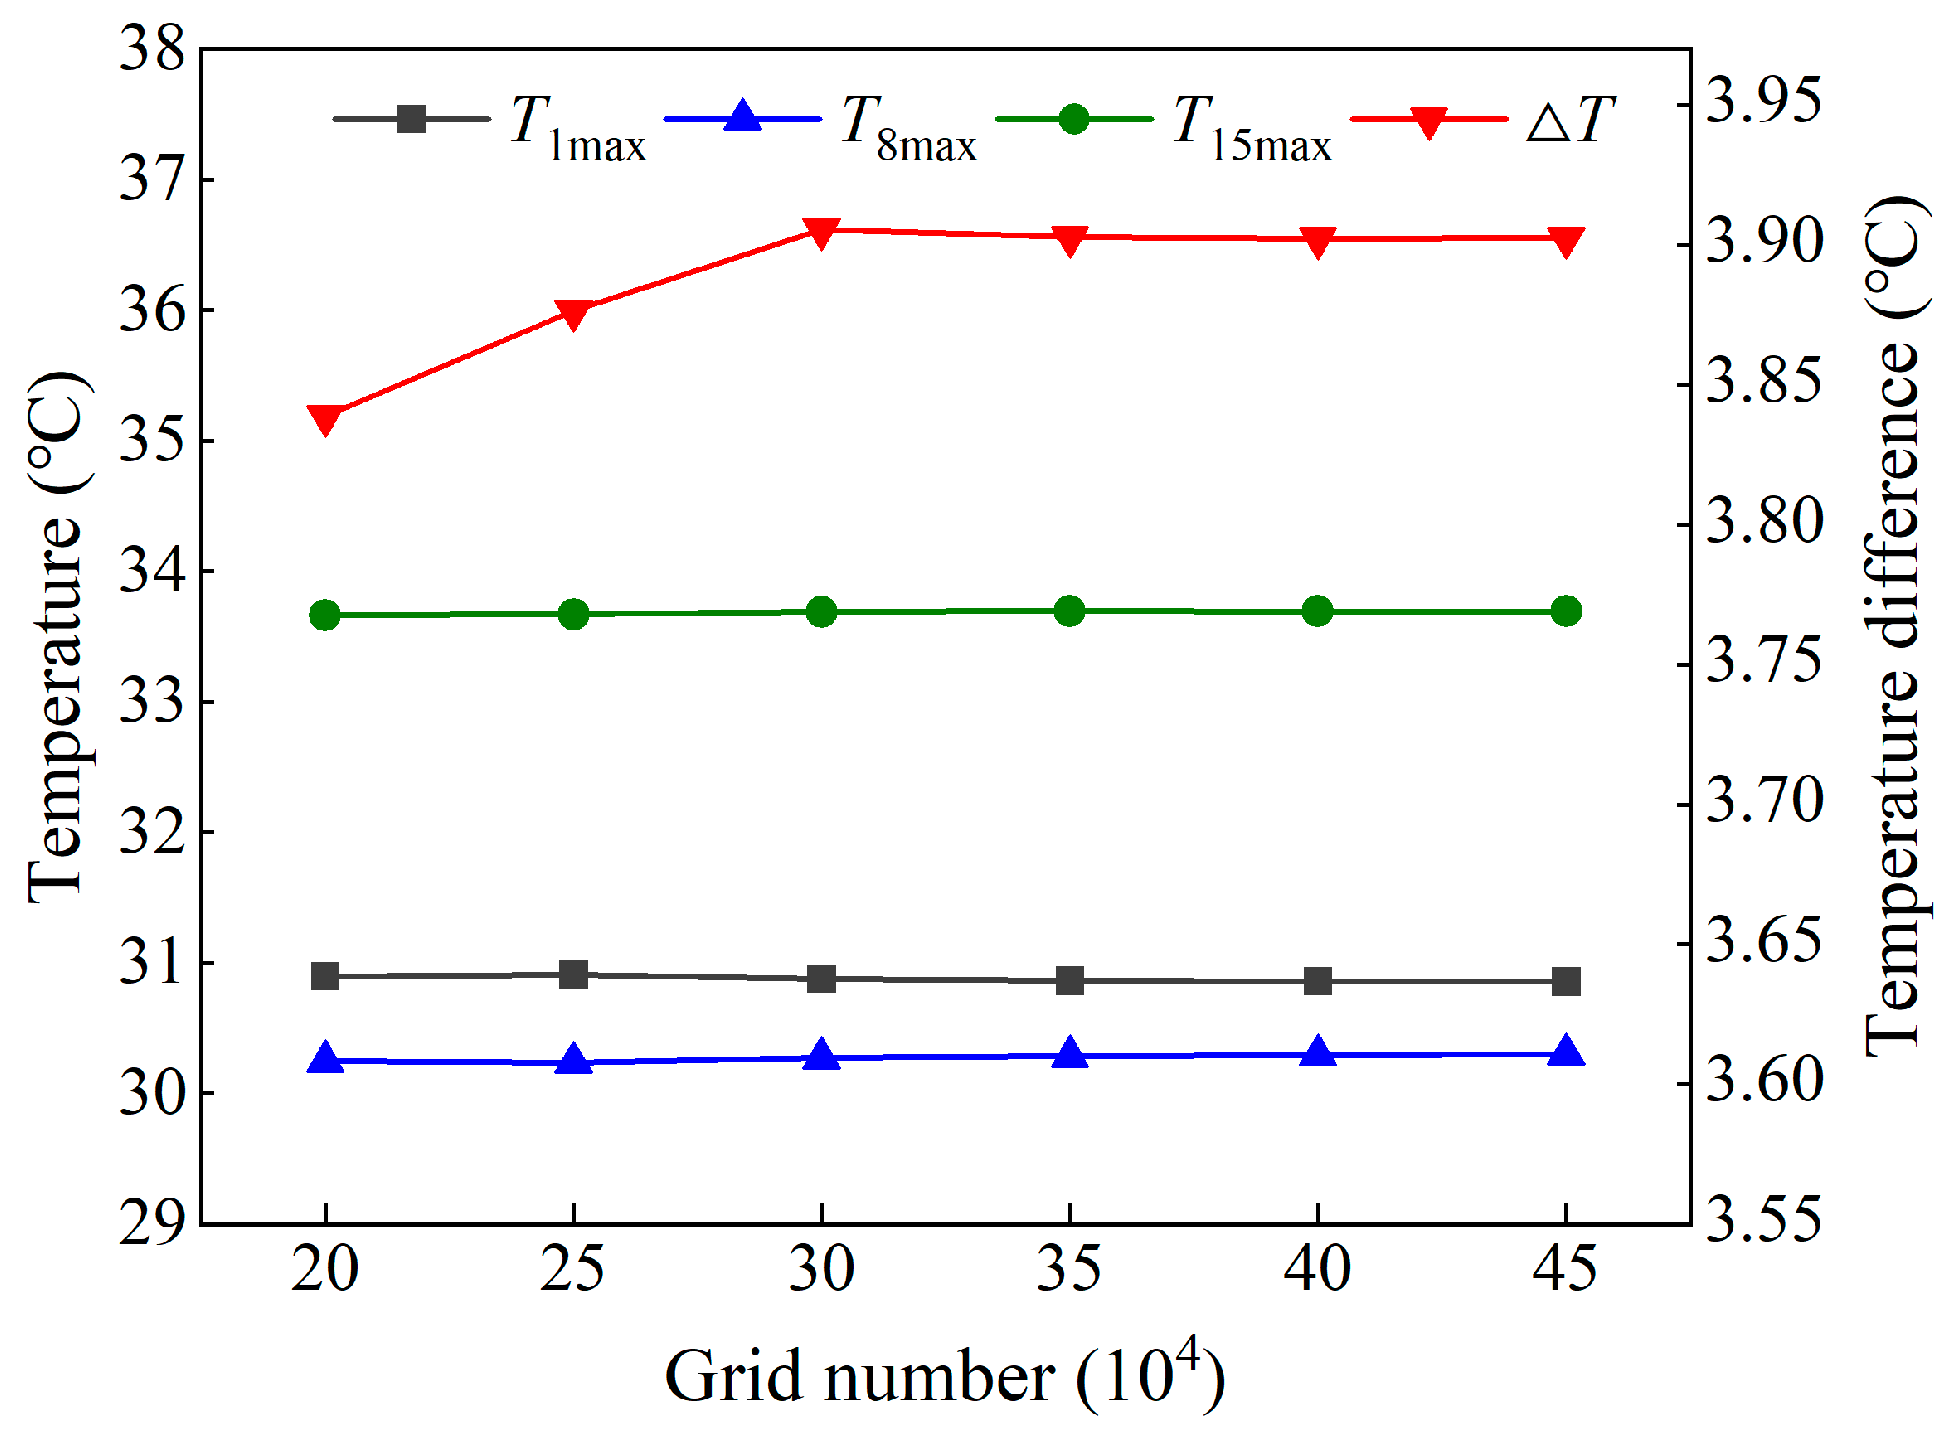
To verify grid independence, numerical calculations were also performed for the SIB pack, as shown in Figure 18. It can be observed that when the grid number exceeds 350,000, the surface temperature of the SIBs under a 1 C discharge rate tends to stabilize, remaining essentially constant and no longer varying with further increases in grid number, and the corresponding grid size is selected for subsequent mesh generation.
The details of heat transfer between the external air domain surrounding the SIB pack are neglected, and the boundary condition on the external surface of the SIB pack is set as a convective heat transfer wall, with a heat transfer coefficient of 5 W/(m2·K). The inlet boundary condition of the internal air domain within the SIB pack is set as a velocity inlet; the outlet boundary condition is set as a pressure outlet, with an outlet pressure of atmospheric pressure. The pressure-based solver with the SIMPLE algorithm is employed, and the second-order upwind discretization scheme is adopted for the convective terms. The governing equations are solved using a double-precision method.
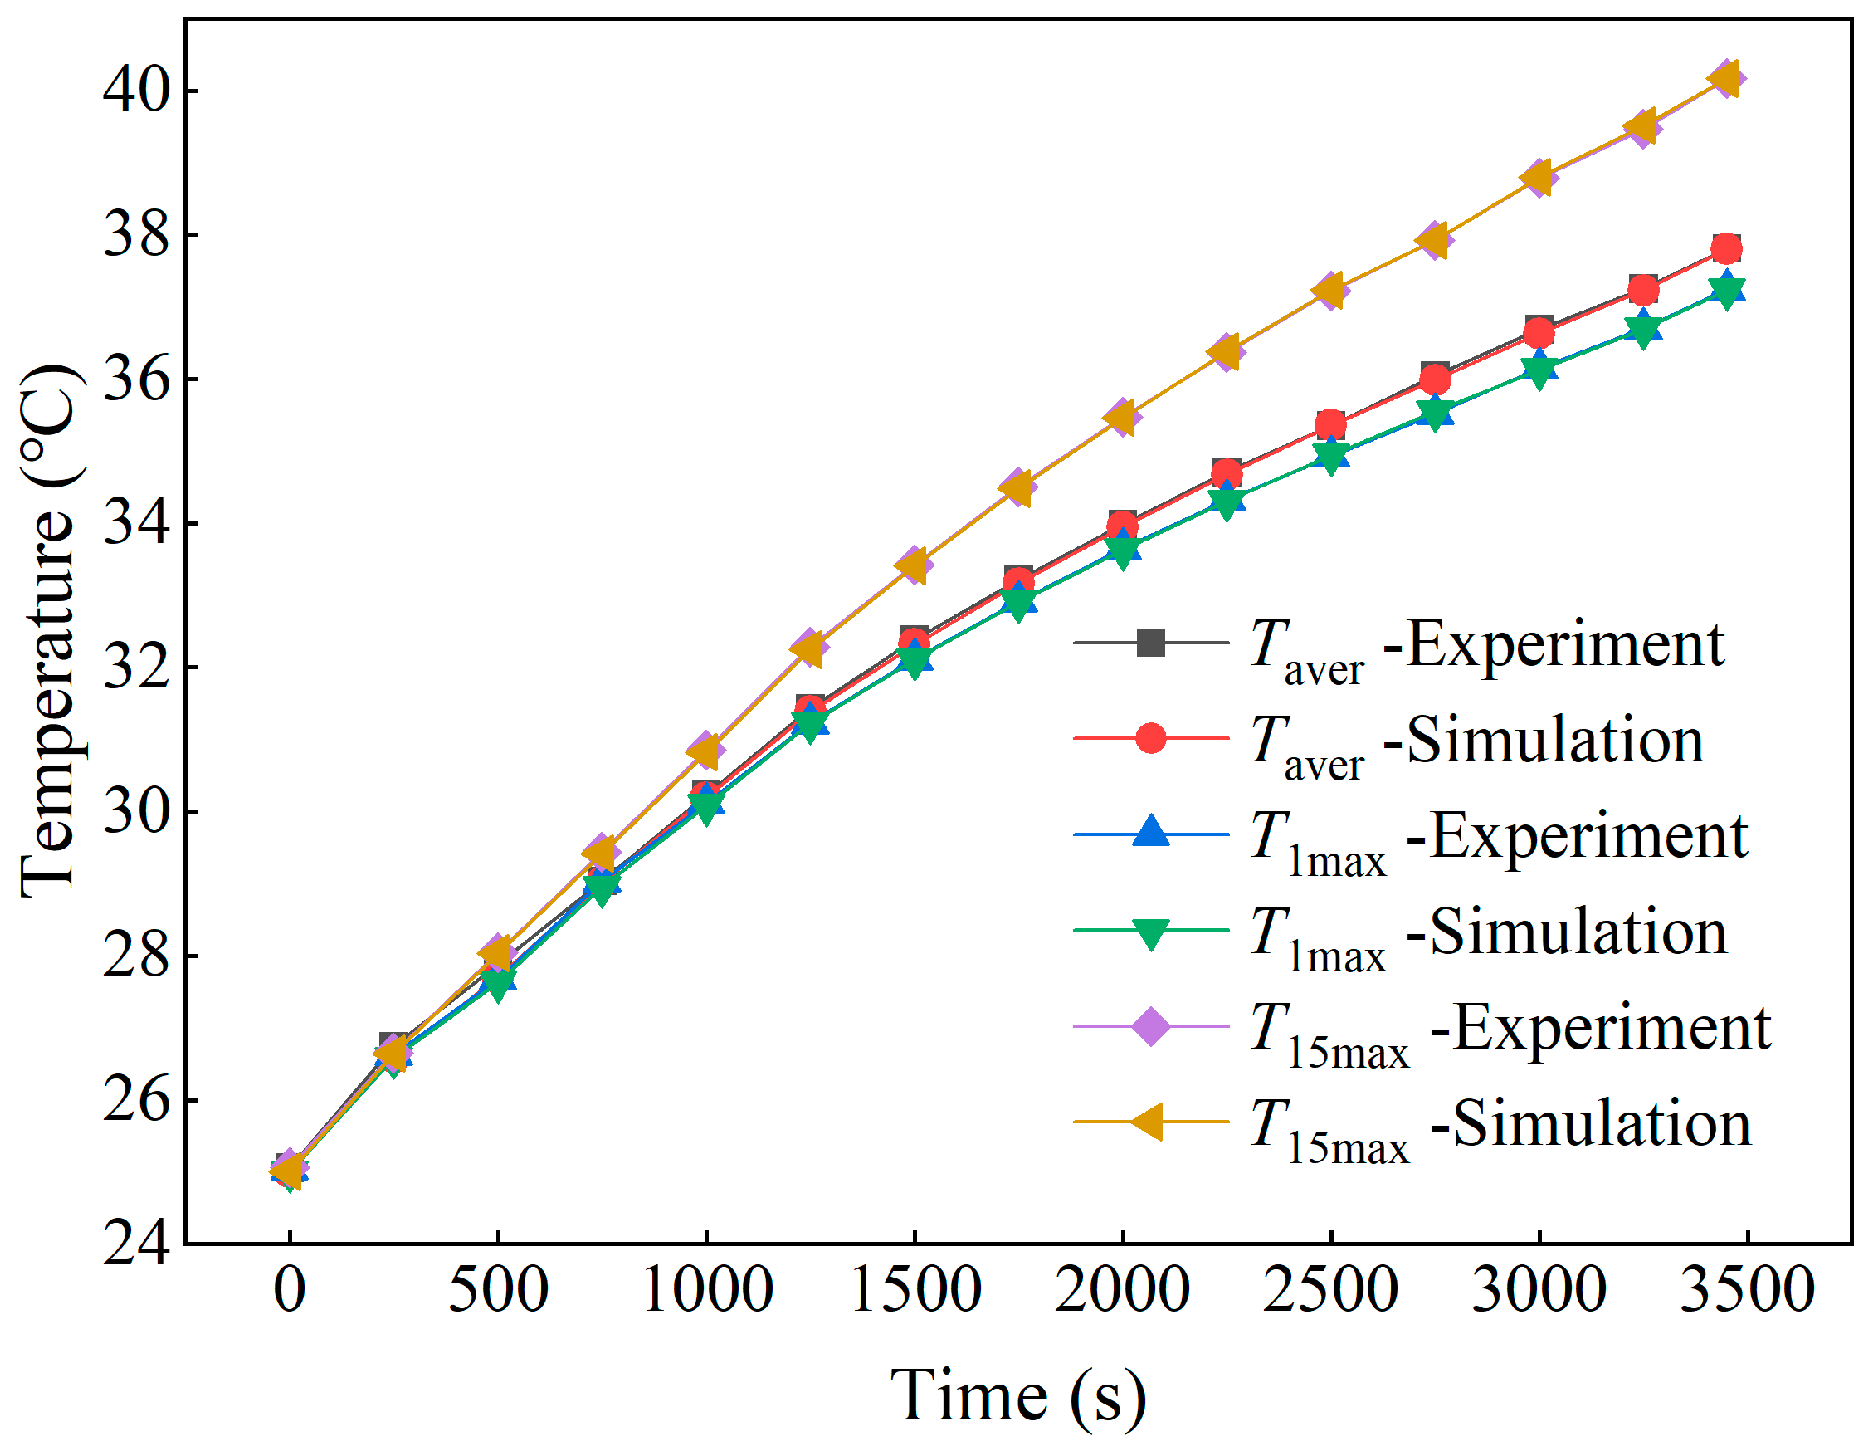
Considering that the SIBs exhibit severe heat generation under high-rate discharge conditions, the thermal characteristics of the SIB pack at a discharge rate of 2 C (2.6 A) are focused on, and a simulation-based optimization design is conducted. To further validate the accuracy of the SIB pack model, the SIB pack is discharged at a 2 C rate within a constant-temperature chamber at 25 °C, and the experiment and simulation results are shown in Figure 19. The maximum errors between the experiment and simulation results for the highest temperatures of the 1st and 15th cells in the SIB pack are 0.31% and 0.24%, respectively, and the average error for the average temperature of the SIB pack is 0.19%, indicating that the simulation model is reasonably accurate.

5.2. Parameter Optimization of SIB Pack

Owing to the structural constraints of the SIB enclosure, the internal cells are arranged in a compact manner, resulting in a low airflow rate at the rear end of the SIB pack. Consequently, the generated heat cannot be effectively dissipated, leading to heat accumulation and a subsequent temperature rise. To achieve multi-objective optimization of the thermal dissipation performance of the SIB pack, the effects of four factors (cell arrangement pattern, cell spacing, inlet air velocity, and flow channel geometry) on the thermal performance of the SIB pack are comprehensively considered. The orthogonal design method is adopted, treating the four factors as four independent and non-interacting controllable variables, each set at four levels. Following the principle of minimizing the number of numerical cases, a standard L16(44) orthogonal array is constructed, as shown in Table 5, where S0 denotes the control group, and U, T, I, and Z represent different airflow channel shapes. The schematic of the cell arrangement configuration design in the SIB pack is shown in Figure 20.
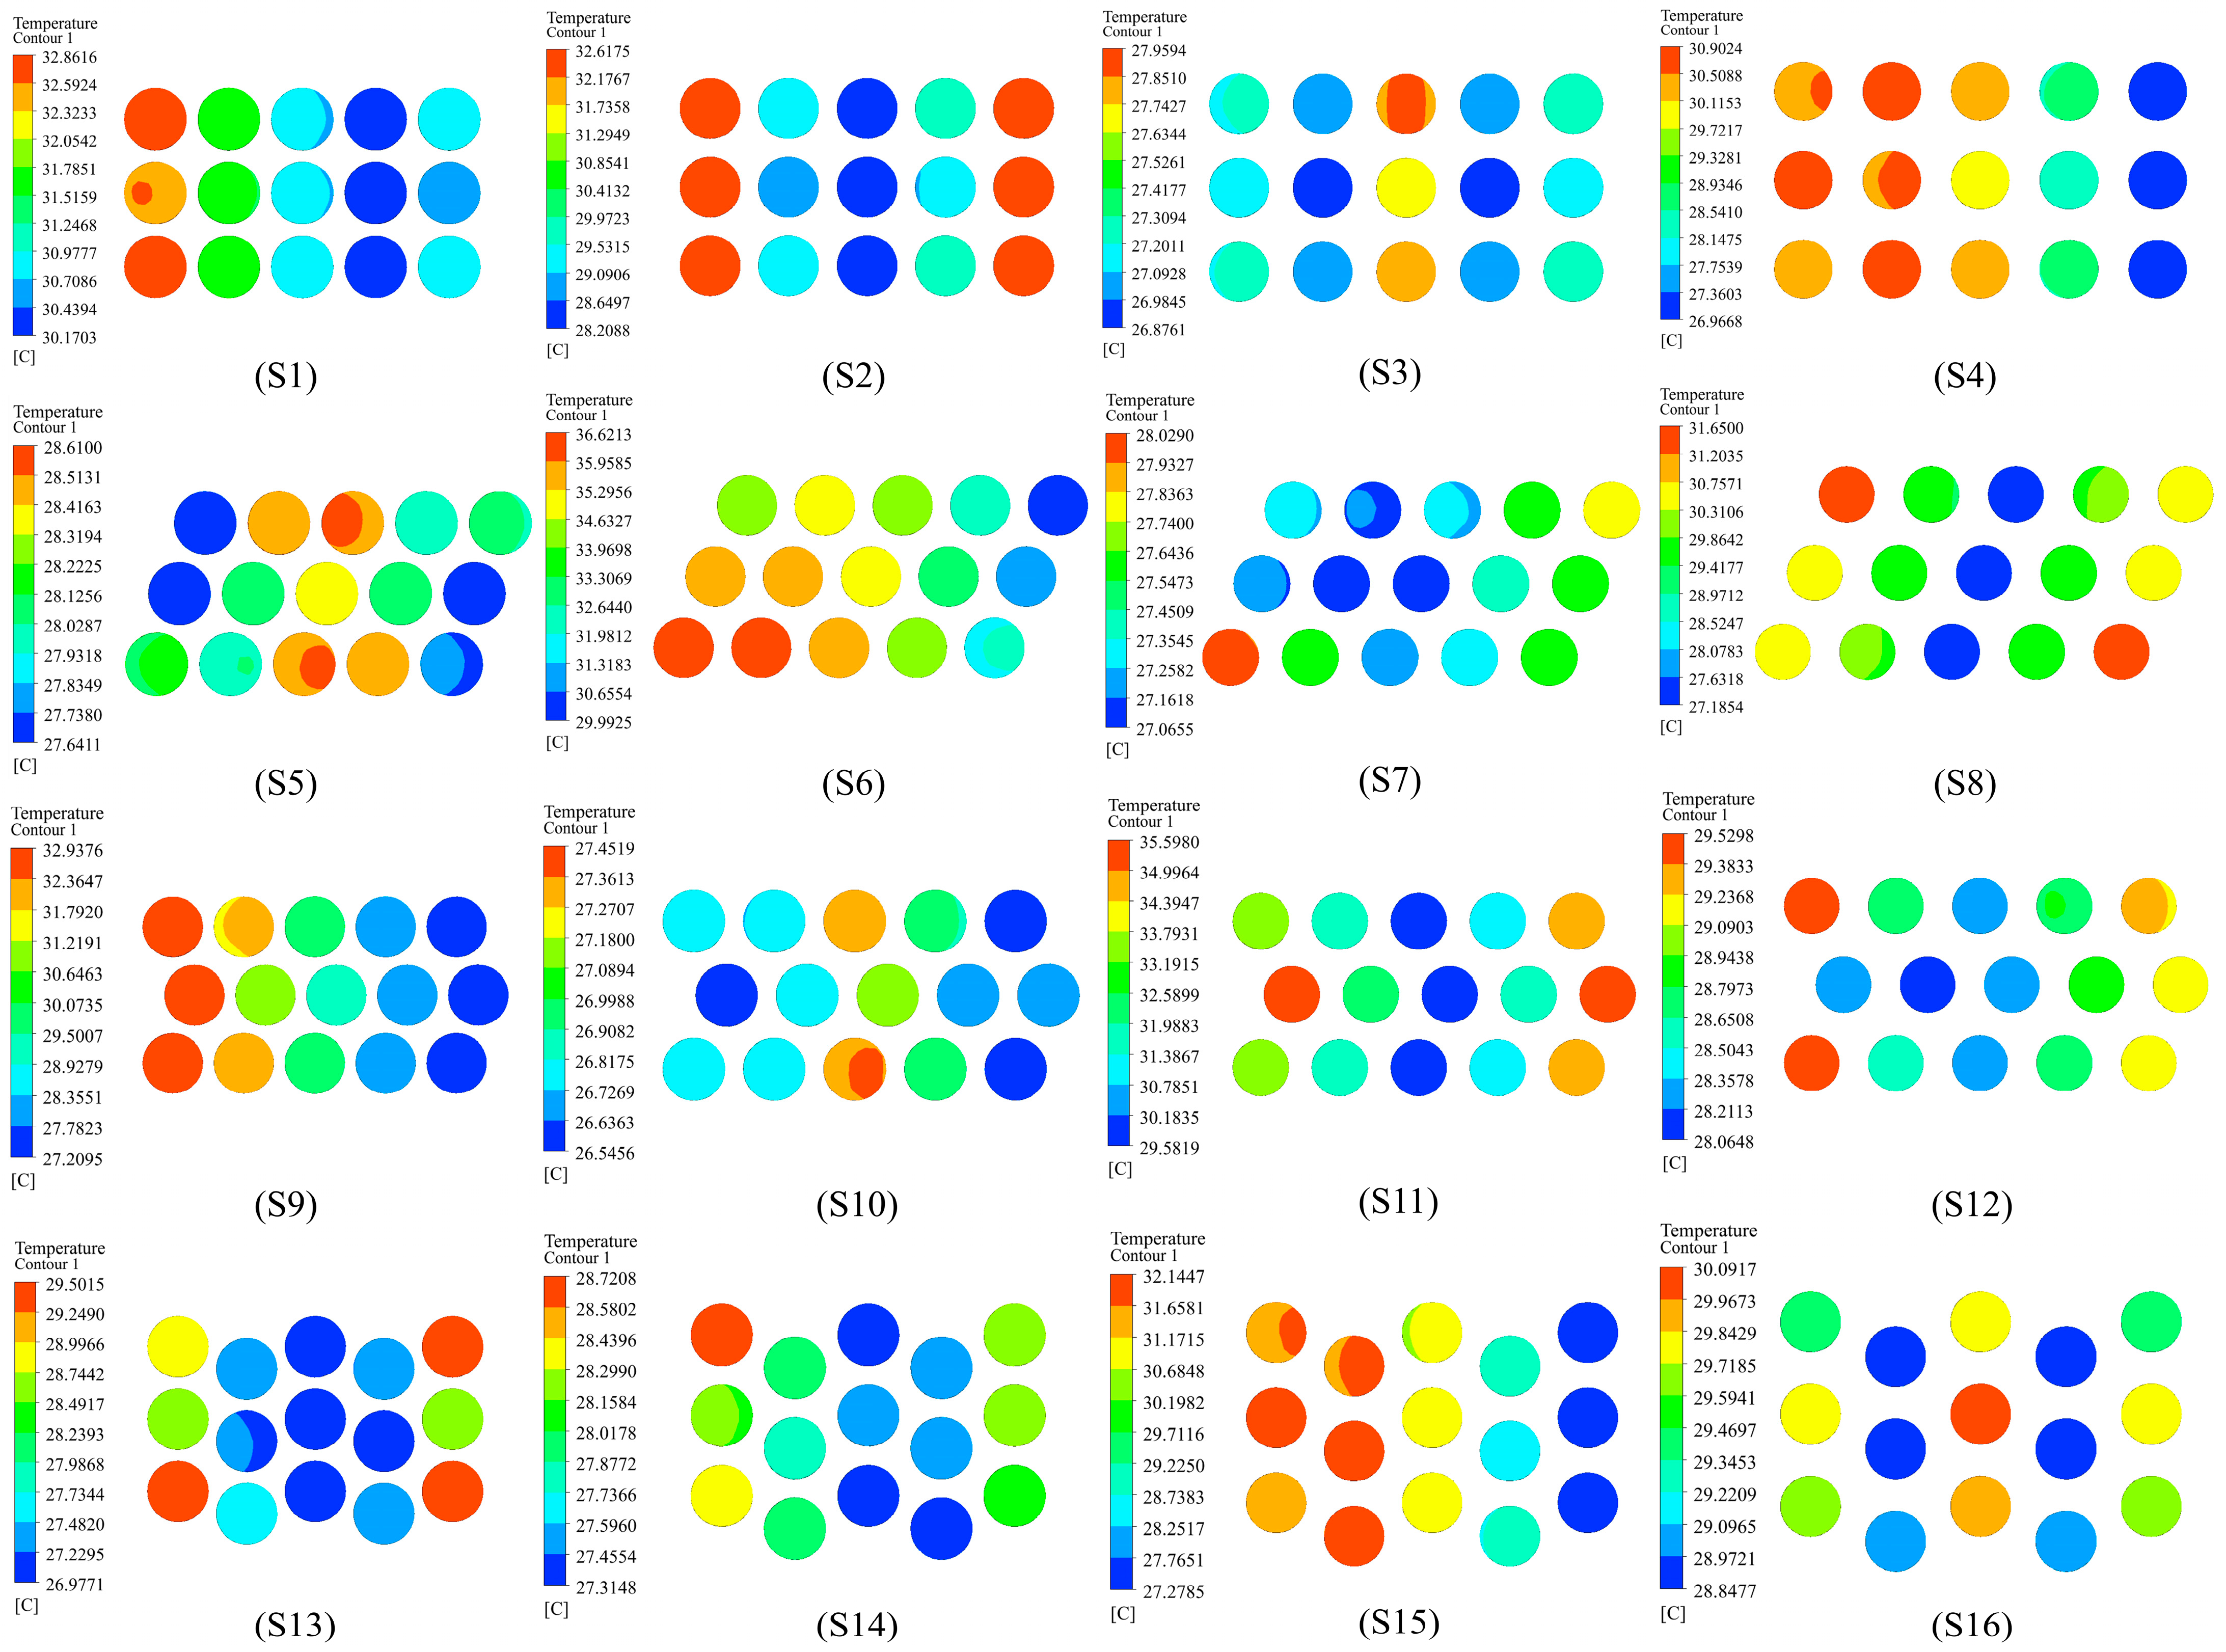
The temperature contours of the SIB pack corresponding to the orthogonal simulation design groups S1–S16 obtained from the simulations are shown in Figure 21, and the corresponding simulation results are presented in Table 6.
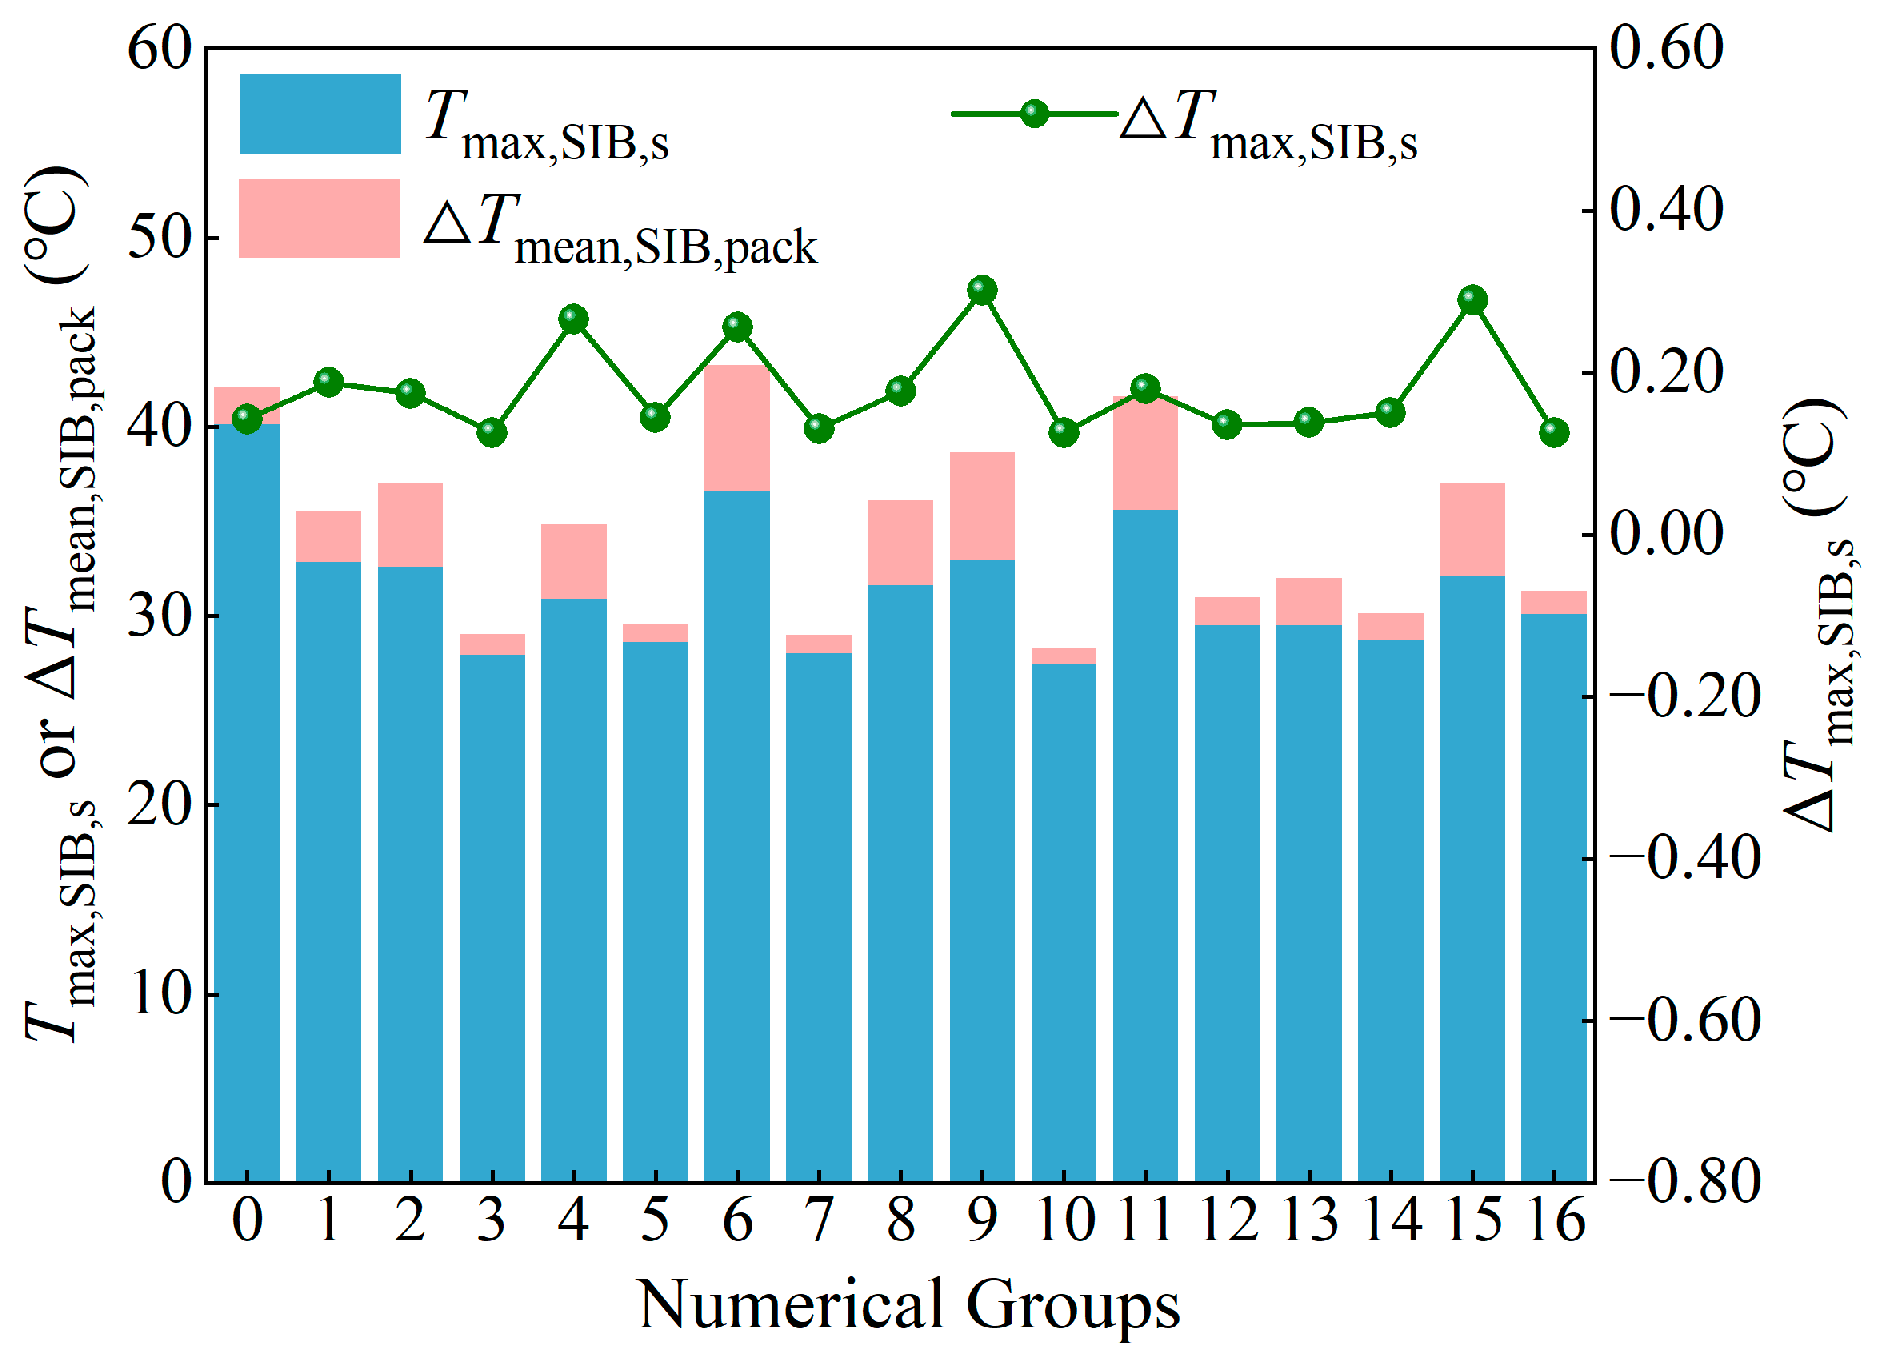
The highest temperature and maximum temperature difference of individual cells within the SIB pack (denoted as Tmax,SIB,s and ΔTmax,SIB,s, respectively), and the average temperature difference of the SIB pack (ΔTmean,SIB,pack) are selected as evaluation indices. Range analysis is performed on the orthogonal numerical results, as shown in Table 7, Table 8 and Table 9, where Kij is the average value of results for the ith level in the jth column, Rj is the range of the factor in the jth column, and a, b, c, and d represent the cells arrangement configuration, SIB spacing, inlet air velocity, and flow channel shape, respectively. The air cooling performance of the SIB pack corresponding to groups S0–S16 is shown in Figure 22.
As can be seen from the results in Table 7, for the highest temperature of individual cells within the SIB pack, the ranges are in the order of R3 > R4 > R1 > R2. Therefore, the factors influencing the cell temperature rank in descending order are inlet air velocity, flow channel shape, cell spacing, and cell arrangement. From Figure 22, the optimal groups are observed to be S3, S5, S7, S10, and S14. Similarly, for the maximum cell temperature difference, the influence factors are ranked in descending order as flow channel shape, inlet air velocity, cell spacing, and cell arrangement, and the optimal groups are S3, S5, S7, S10, and S16. For the average temperature difference of the SIB pack, the influence factors are ranked in descending order as flow channel shape, inlet air velocity, cell arrangement, and cell spacing, and the optimal groups are S3, S5, S7, S10, and S16.
Since the above factors are all important indicators for evaluating the air-cooling performance of the SIB pack, the optimal combinations are superimposed to represent the comprehensive performance, and the groups with superior comprehensive performance are S3, S5, S7, and S10.
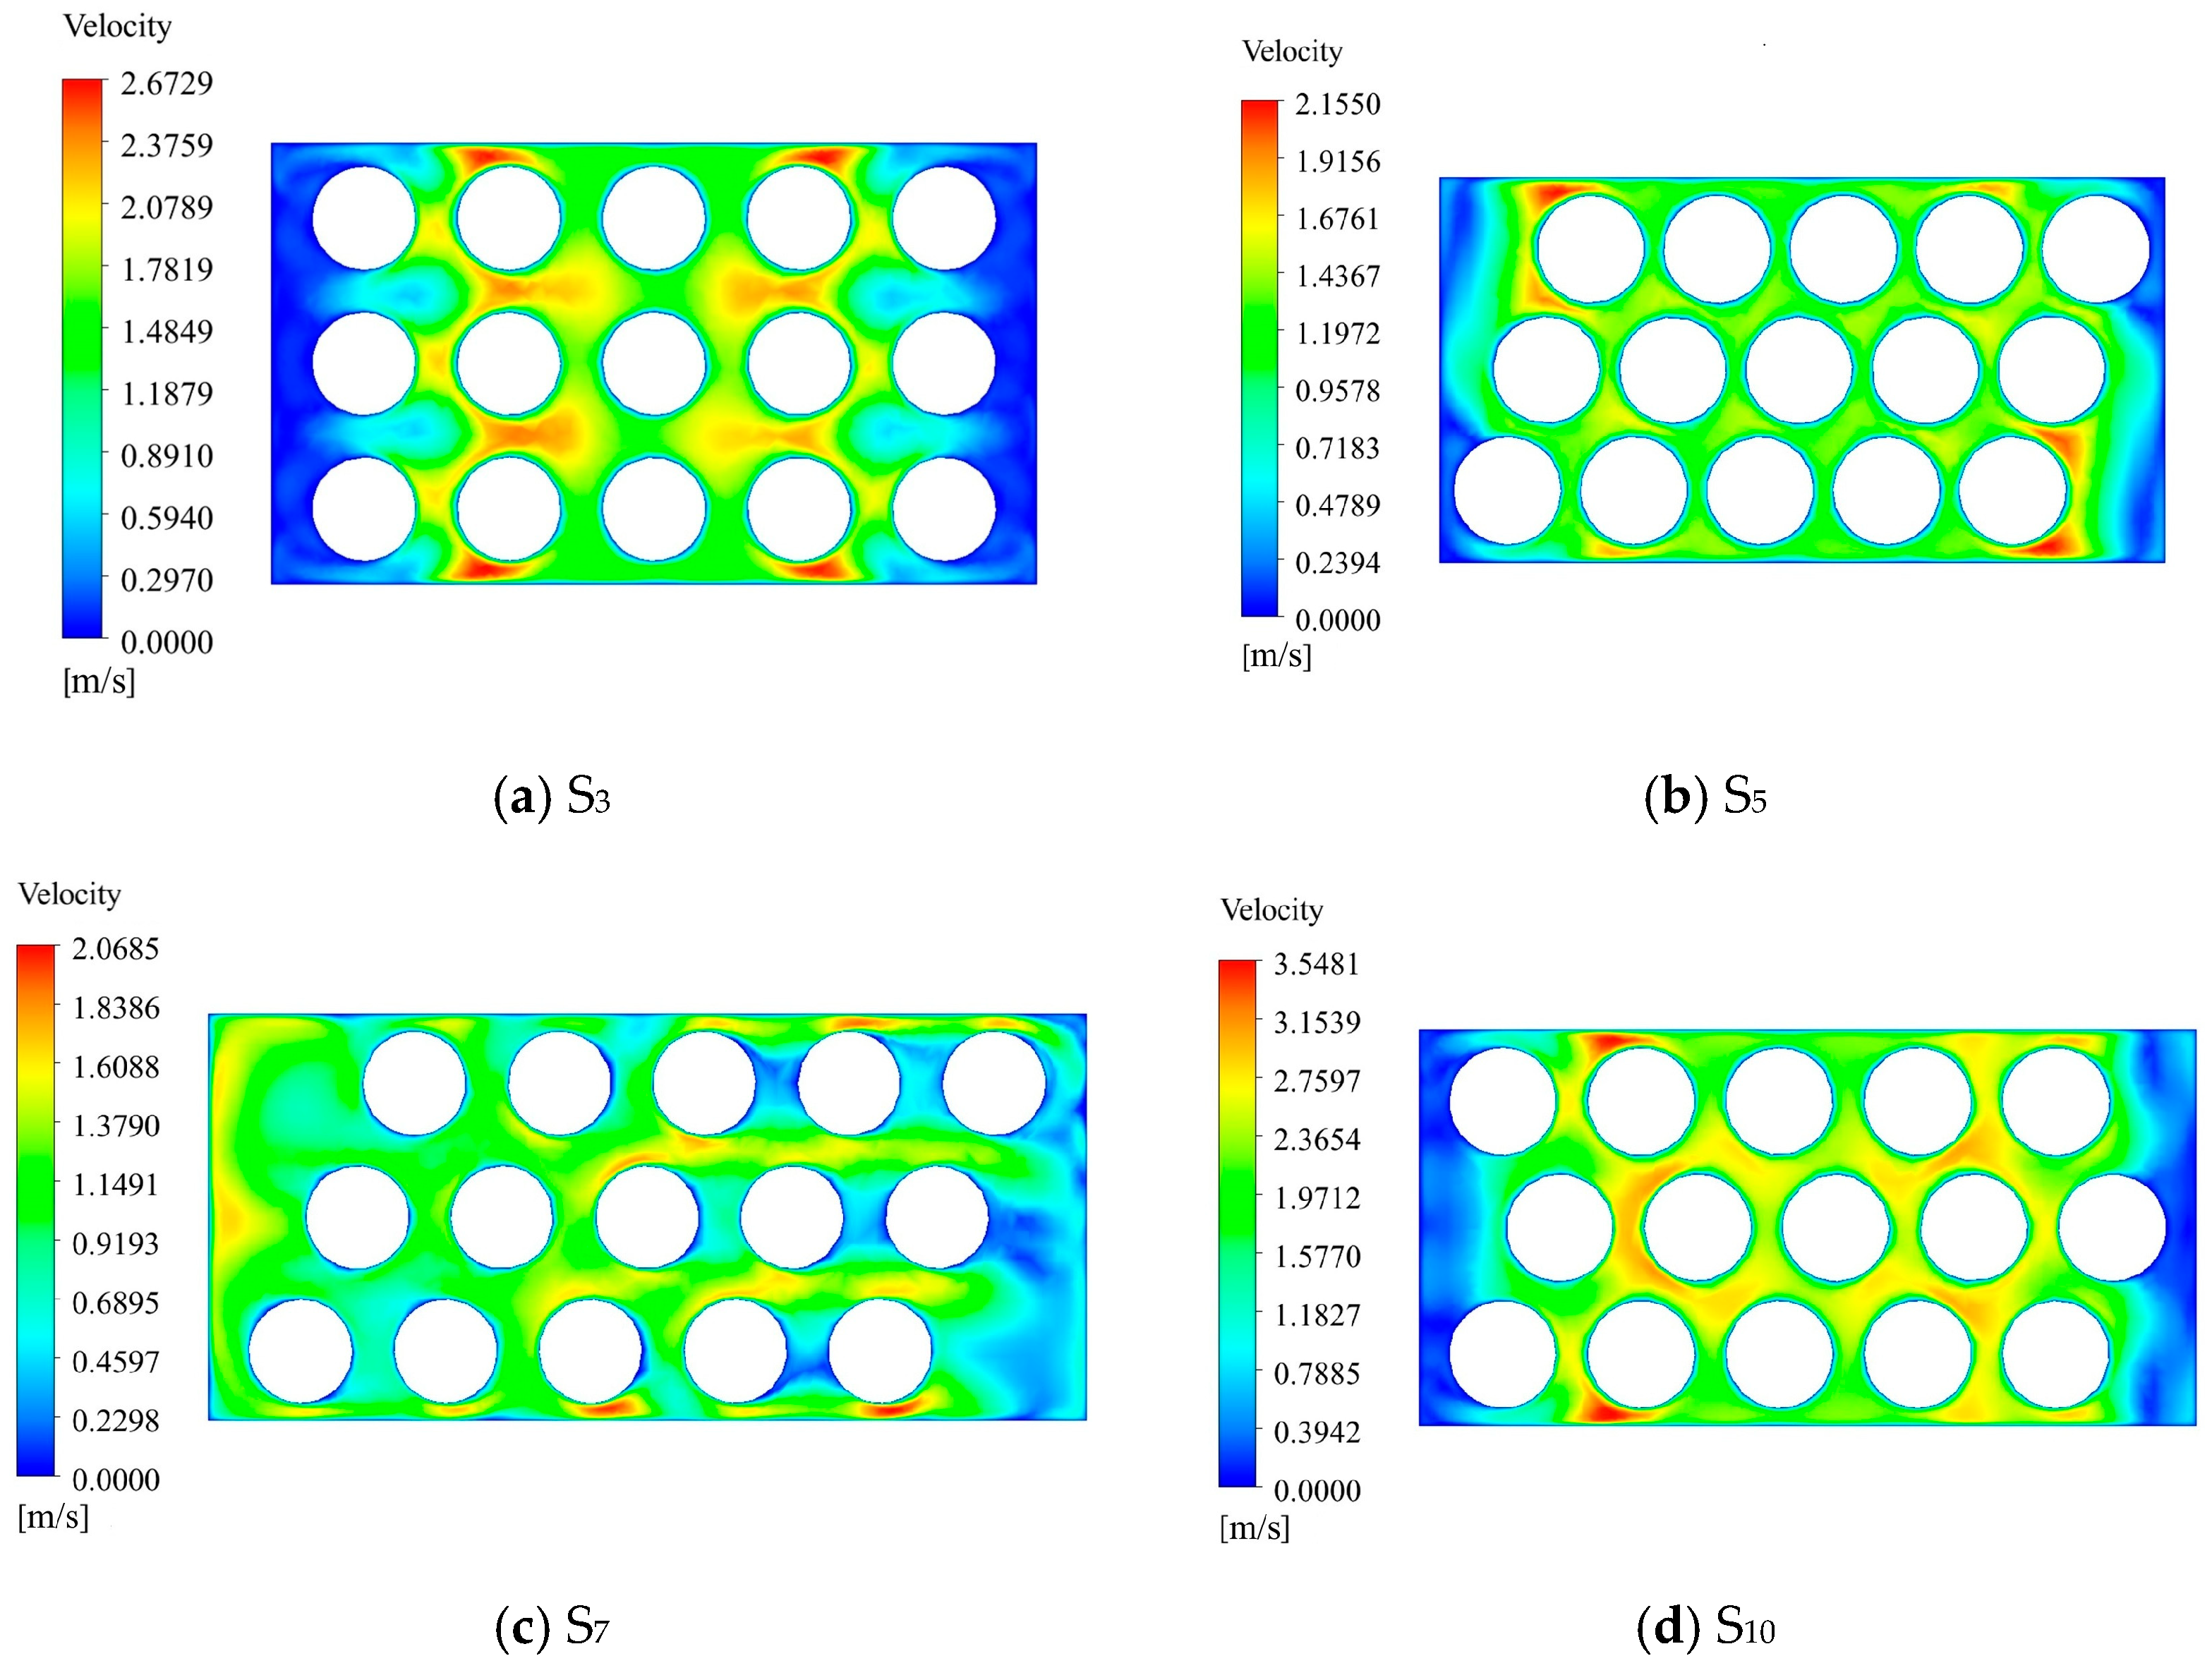
Figure 23 presents the velocity contours for each case. For S7, the air distribution in the first three rows of cells is relatively small, and the surfaces of these cells are not in sufficient contact with the air, resulting in poor cooling performance. For cases S3 and S10, significant flow disturbances are observed at both the front and rear ends of the SIB pack, and the air deviates from the cell surface, leading to significant non-uniform heat transfer. Moreover, there are numerous regions with excessively high local airflow velocities in the flow channels of the middle cells, resulting in localized non-uniform heat transfer and consequently reducing the overall temperature uniformity of the pack. For case S5, although minor flow disturbances and a few regions with excessively high local airflow velocities exist at the front and rear ends, the airflow velocities are uniformly distributed across all flow channels of the SIB pack, yielding superior overall temperature uniformity. Considering factors such as the maximum cell temperature and pack temperature uniformity, case S5 is identified as the optimal group for practical applications.
After the above multi-objective optimization, the average temperature difference of the SIB pack is reduced from 3.63 °C to 0.97 °C, a decrease of 2.66 °C, corresponding to a reduction of 73.30%, which is below the allowable temperature difference of 5 °C. The highest temperature of individual cells within the optimized SIB pack decreases from 36.37 °C to 28.61 °C, a reduction of 7.76 °C, representing a decrease of 21.33%. The maximum temperature difference within individual cells is reduced from 0.20 °C to 0.14 °C, a decrease of 0.05 °C, corresponding to a reduction of 26.86%. Following optimization, the overall heat dissipation performance of the SIB pack is enhanced, and favorable temperature uniformity is achieved.
To further verify the cooling performance of the optimal group S5, numerical simulations of the SIB cooling were conducted under various discharge rates, and the results are summarized in Table 10. The findings indicate that the S5 group consistently exhibits excellent cooling performance across discharge rates ranging from 0.5 C to 2 C.


6. Conclusions

To elucidate the thermal characteristics of sodium-ion batteries (SIBs), experimental investigations were conducted to analyze voltage characteristics, temperature rise behavior, internal resistance, and entropy heat coefficient under varying environmental temperatures and charging/discharging rates. A thermal simulation model of SIBs was established based on Bernardi’s theory. Furthermore, the influence of multi-factor interactions on the heat dissipation performance of the SIB pack was investigated, leading to the following conclusions.
(1)
During the charging process, the battery voltage generally exhibited a continuous upward trajectory. In contrast, the discharge voltage displayed a two-stage decline, characterized by an initial gradual decrease followed by a more precipitous drop. Under consistent environmental temperature conditions, a higher battery charging/discharging rate correlated with a more rapid rate of change in the respective voltages. Conversely, for a given rate, lower environmental temperatures resulted in a faster change in both the charging and discharging voltages.
(2)
During the charging process, the battery temperature initially increased and subsequently decreased. Conversely, during discharging, the battery temperature exhibited a continuous upward trend. Under the given environmental temperature conditions, a higher rate results in greater heat generation and a corresponding increase in the temperature rise rate. Furthermore, for a given rate, a lower charging environmental temperature leads to more significant changes in the temperature rise rate of the battery.
(3)
Environmental temperature demonstrated a significant negative correlation with the internal resistance of the battery. Specifically, elevated environmental temperatures were associated with lower internal resistance, whereas diminished environmental temperatures resulted in higher internal resistance. Furthermore, within the state-of-charge range of 0.6 to 1, the internal resistance fluctuated. This might be attributable to the charging and discharging kinetics of electrode materials and the concentration of surface reactants at the electrode–electrolyte interface. Specifically, an initial decrease in resistance was detected, followed by a slight increase towards the upper limit of the SOC range.
(4)
Multi-objective optimization of the cooling performance of a 1P15S SIB battery pack using the orthogonal numerical method was accomplished. The optimal thermal dissipation structure and operating parameters that achieve the best cooling performance are identified as a staggered cell arrangement, a cell spacing of 3 mm, an inlet air velocity of 2 m/s, and an I-shaped flow channel. After optimization, the maximum temperature of individual cells is reduced by 7.75 °C, corresponding to a decrease of 21.33%; the maximum temperature difference among cells is reduced by 0.05 °C, a decrease of 26.86%; and the average temperature difference of the battery pack is 0.97 °C, representing a reduction of 73.30%.

Author Contributions

Conceptualization, J.C. and B.Z.; methodology, P.Z. and B.Z.; software, Q.K. and J.C.; validation, Q.K.; formal analysis, Q.K. and P.Z.; investigation, Q.K. and B.Z.; resources, P.Z.; data curation, Q.K.; writing—original draft preparation, J.C. and Q.K.; writing—review and editing, P.Z. and J.C.; visualization, Q.K. and J.C.; supervision, B.Z. and P.Z.; project administration, B.Z.; funding acquisition, P.Z., J.C. and B.Z. All authors have read and agreed to the published version of the manuscript.

Funding

This research was funded by the Natural Science Foundation of Hunan Province (No. 2024JJ6030) and the Guangdong Basic and Applied Basic Research Foundation (No. 2023A1515110690).

Institutional Review Board Statement

Not applicable.

Informed Consent Statement

Not applicable.

Data Availability Statement

All original data reported in this study are contained within the article, and additional data can be provided if required.

Conflicts of Interest

The authors declare no conflicts of interest.

Abbreviations

The following abbreviations are used in this manuscript:
LIBLithium-ion battery
SIBSodium-ion battery
PEPolyethylene
PPPolypropylene
SOCState of charge
DCDirect current

References

  1. Ren, X.; Hong, K.; Tao, L. Driving a green future: Spatial econometric analysis of climate finance aid in renewable energy transition in developing countries. Econ. Anal. Policy 2025, 86, 929–949. [Google Scholar] [CrossRef]
  2. Bekun, F.; Fumeny, M.; Staniewski, M.; Sun, L.; Agboola, P. Energy intensive growth and the transition pathways: Insights into the role of renewable energy and open market conditions in developing countries. Energy 2025, 322, 135192. [Google Scholar] [CrossRef]
  3. Hu, X.; Li, H.; Xie, C. Optimal charging scheduling of an electric bus fleet with photovoltaic-storage-charging stations. Appl. Energy 2025, 390, 125714. [Google Scholar]
  4. Chen, Z.; Zhou, M.; Wu, Z.; Yang, L.; Yue, H. Attribution analysis to Co-planning renewable energy and storage capacity based on Shapley Additive Explanation. Energy 2025, 325, 136168. [Google Scholar] [CrossRef]
  5. Jankowski, M.; Pałac, A.; Sornek, K.; Goryl, W.; Żołądek, M.; Homa, M.; Filipowicz, M. Status and development perspectives of the compressed air energy storage (CAES) technologies—A literature review. Energies 2024, 17, 2064. [Google Scholar] [CrossRef]
  6. Malik, F.H.; Hussain, G.A.; Alsmadi, Y.M.S.; Haider, Z.M.; Mansoor, W.; Lehtonen, M. Integrating energy storage technologies with renewable energy sources: A pathway toward sustainable power grids. Sustainability 2025, 17, 4097. [Google Scholar] [CrossRef]
  7. Fang, Z.; Shek, K.; Sun, W. A review of grid-connected hybrid energy storage systems: Sizing configurations, control strategies, and future directions. J. Energy Storage 2025, 118, 116226. [Google Scholar] [CrossRef]
  8. Dai, J.; Selvaraj, J.; Hasanuzzaman, M.; Cai, H. Scientometric analysis of research hotspots in electrochemical energy storage technology. J. Energy Storage 2024, 93, 112300. [Google Scholar] [CrossRef]
  9. Yang, C.; Xi, H.; Wang, M. Structure optimization of air cooling battery thermal management system based on lithium-ion battery. J. Energy Storage 2023, 59, 106538. [Google Scholar] [CrossRef]
  10. Zheng, X.; Zhang, Z. State of charge estimation at different temperatures based on dynamic thermal model for lithium-ion batteries. J. Energy Storage 2022, 48, 104011. [Google Scholar] [CrossRef]
  11. Sandri, C.; Di Rienzo, R.; Deiaco, A.; Morelli, M.; Cristofoli, G.; Cazzanti, S.; Baronti, F.; Roncella, R.; Saletti, R. Sodium-ion batteries: A review of modeling, safety, and state estimation techniques. J. Energy Storage 2026, 163, 122120. [Google Scholar] [CrossRef]
  12. Nekahi, A.; Dorri, M.; Rezaei, M.; Bouguern, M.D.; Madikere Raghunatha Reddy, A.K.; Li, X.; Deng, S.; Zaghib, K. Comparative issues of metal-ion batteries toward sustainable energy storage: Lithium vs. Sodium. Batteries 2024, 10, 279. [Google Scholar] [CrossRef]
  13. Oral, B.; Tekin, B.; Eroglu, D.; Yildirim, R. Performance analysis of Na-ion batteries by machine learning. J. Power Sources 2022, 549, 232146. [Google Scholar] [CrossRef]
  14. Yi, D.; Chu, W.; Wang, Q. Airflow reorganization and thermal management in a large-space battery energy storage container using perforated deflectors. Int. Commun. Heat Mass Transf. 2024, 158, 107909. [Google Scholar] [CrossRef]
  15. Albay, A.; Zhu, Z.; Mercangöz, M. Optimization-based state-of-charge management strategies for supercritical CO2 Brayton cycle pumped thermal energy storage systems. J. Energy Storage 2025, 111, 115387. [Google Scholar]
  16. Abdelati, M.H.; Makrahy, M.; Mokbel, E.F.F.; Matar, A.-H.; Kamel, M.; Abdelkareem, M.A.A. combined experimental, statistical and CFD study of the thermal–electrical behavior of a LiFePO4 battery pack under varying load and cooling conditions. Sustainability 2026, 18, 1279. [Google Scholar] [CrossRef]
  17. Wang, S.; Xue, Z.; Chu, F.; Guan, Z.; Lei, J.; Wu, F. Moderately concentrated electrolyte enabling high-performance lithium metal batteries with a wide working temperature range. J. Energy Chem. 2023, 79, 201–210. [Google Scholar] [CrossRef]
  18. Wu, Q.; Li, Z.; Gan, Y.; Wan, Z.; Jiang, Q.; Yu, X. Experimental study on cycle aging life of 21700 cylindrical batteries under different heat exchange conditions. Sustainability 2026, 18, 187. [Google Scholar]
  19. Ren, T.; Mao, Z.; Chang, L.; Chen, W.; Xu, J.; Zhang, Y.; Chen, T.; Cai, Z. Experimental and simulation studies on the thermal characteristics of large-capacity square lithium-ion batteries with low-temperature discharge. Energy Technol. 2024, 12, 2300826. [Google Scholar]
  20. Hu, Y.; Jia, Z.; Li, Z.; Chen, S.; Jin, K.; Li, H.; Wang, Q.; Sun, J. Effects of low temperature on the performance and thermal safety of 18650 sodium-ion batteries. Process Saf. Environ. Prot. 2026, 214, 109045. [Google Scholar] [CrossRef]
  21. Song, Y.; Cui, H.; Gan, Y.; Gao, W. Unveiling the mechanism of particle size in governing the high-temperature performance of sodium-ion battery. J. Energy Storage 2026, 141, 119439. [Google Scholar]
  22. Saechan, P.; Dhuchakallaya, I. Numerical investigation of air cooling system for a densely packed battery to enhance the cooling performance through cell arrangement strategy. Int. J. Energy Res. 2022, 46, 20670–20684. [Google Scholar]
  23. Chang, L.; Chen, W.; Mao, X.; Huang, X.; Ren, T.; Zhang, Y.; Cai, Z. Experimental study on the effect of ambient temperature and discharge rate on the temperature field of prismatic batteries. J. Energy Storage 2023, 59, 106577. [Google Scholar] [CrossRef]
  24. Gan, H.; Tian, J.; Qiu, H.; Li, G.; Liu, C.; Zhao, J. Thermal performance of symmetrical double-spiral channel liquid cooling plate based battery thermal management for energy storage system. Appl. Therm. Eng. 2025, 263, 125399. [Google Scholar] [CrossRef]
  25. Wang, K.; Qiao, Y.; Xie, L.; Li, J.; Yang, H. A fuzzy hierarchical strategy for improving frequency regulation of battery energy storage system. J. Mod. Power Syst. Clean Energy 2021, 9, 689–698. [Google Scholar] [CrossRef]
  26. Jin, Y.; Zhao, Z.; Miao, S.; Wang, Q.; Sun, L.; Lu, H. Explosion hazards study of grid-scale lithium-ion battery energy storage station. J. Energy Storage 2021, 42, 102987. [Google Scholar]
  27. Dwivedi, A.; Kumar, R.; Goel, V.; Rana, S.; Kumar, R.; Kumar, A. A comprehensive review on heat pipe-assisted hybrid battery thermal management strategies: Opportunities, challenges and its future aspects. J. Energy Storage 2025, 112, 115475. [Google Scholar] [CrossRef]
  28. Li, Y.; Arnold, S.; Husmann, S.; Presser, V. Recycling and second life of MXene electrodes for lithium-ion batteries and sodium-ion batteries. J. Energy Storage 2023, 60, 106625. [Google Scholar] [CrossRef]
  29. Palanisamy, M.; Boddu, V.; Shirage, P.; Pol, V. Discharge state of layered P2-type cathode reveals unsafe than charge condition in thermal runaway event for sodium-ion batteries. ACS Appl. Mater. Interfaces 2021, 13, 31594–31604. [Google Scholar] [PubMed]
  30. Zhang, F.; Wang, P.; Yi, M. Design optimization of forced air-cooled lithium-ion battery module based on multi-vents. J. Energy Storage 2021, 40, 102781. [Google Scholar]
  31. Sawhney, M.A.; Wahid, M.; Muhkerjee, S.; Griffin, R.; Roberts, A.; Ogale, S.; Baker, J. Process-Structure-Formulation Interactions for enhanced sodium ion battery Development: A review. ChemPhysChem 2022, 23, 202100860. [Google Scholar]
  32. Bernardi, D.; Pawlikowski, E.; Newman, J. A general energy-balance for battery systems. J. Electrochem. Soc. 1985, 132, 5–12. [Google Scholar] [CrossRef]
Figure 1. Physical diagram of SIB.
Sustainability 18 06960 g001
Figure 2. Internal electrochemical reaction in SIB during the charging and discharging processes.
Sustainability 18 06960 g002
Figure 3. Constant-temperature test platform for SIBs during charging and discharging processes.
Sustainability 18 06960 g003
Figure 4. The diagram of the thermocouple arrangement on the surface of the battery.
Sustainability 18 06960 g004
Figure 5. Voltage curves of SIB at different ambient temperatures and charge rates.
Sustainability 18 06960 g005
Figure 6. Voltage curves at different ambient temperatures and discharge rates.
Sustainability 18 06960 g006
Figure 7. Temperature rise curves at different ambient temperatures and charge rates.
Sustainability 18 06960 g007
Figure 8. Temperature rise curves at different ambient temperatures and discharge rates.
Sustainability 18 06960 g008
Figure 9. Charge/discharge internal resistance changes with SOC in SIBs.
Sustainability 18 06960 g009
Figure 10. The entropy heat coefficient of the SIB with different SOC.
Sustainability 18 06960 g010
Figure 11. The entropy heat coefficient of the LIB with different SOCs.
Sustainability 18 06960 g011
Figure 12. Geometric model and mesh generation for a single SIB.
Sustainability 18 06960 g012
Figure 13. Grid independence test result for a single SIB.
Sustainability 18 06960 g013
Figure 14. Temperature distribution of a single SIB at different discharge rates.
Sustainability 18 06960 g014
Figure 15. Comparison of experiment and simulation temperature for a single SIB.
Sustainability 18 06960 g015
Figure 16. Photograph and simulation model of the SIB pack.
Sustainability 18 06960 g016
Figure 17. Mesh generation of the SIB pack.
Sustainability 18 06960 g017
Figure 18. Grid independence validation result for the SIB pack.
Sustainability 18 06960 g018
Figure 19. Comparison of experiment and simulation results for SIB pack at 2 C discharge rate.
Sustainability 18 06960 g019
Figure 20. Schematic of the cell arrangement configuration design within the SIB pack.
Sustainability 18 06960 g020
Figure 21. Temperature distribution of the SIB pack for orthogonal numerical groups S1–S16.
Sustainability 18 06960 g021
Figure 22. Air cooling performance of the SIB pack for groups S0–S16.
Sustainability 18 06960 g022
Figure 23. Velocity contours for the optimal groups.
Sustainability 18 06960 g023
Table 1. Basic parameters of sodium iron phosphate battery.
ParameterValueUnit
Dimension (diameter × height)18 × 65mm
Weight0.0366kg
Nominal capacity1300mAh
Nominal voltage3.1V
Charge cut-off voltage3.95V
Discharge cut-off voltage1.5V
Maximum charge rate1C
Maximum discharge rate3C
Operating temperature−40~80°C
Table 2. Main technical parameters of test equipment.
DesignationModelParameter
Battery test systemNEWARE-CT-4008-5V60A (Neware Technology Limited; Shenzhen, China)Voltage: 0~5 V
Current: 0~60 A
Accuracy: ±0.05% FS
Multi-channel temperature collectorNEWARE-CA-1U-VT-TX (Neware Technology Limited; Shenzhen, China)Temperature: −25~110 °C
Accuracy: ±1 °C
TemperatureZHONGZHI-CZ-CPJ3-1000D (Guangzhou Saipuli Instrument Co., Ltd., Guangzhou, China)Temperature: −40~150 °C
Accuracy: ±0.5 °C
Table 3. Material parameters of sodium iron phosphate battery.
DesignationMaterialsDensity (kg/m3)Specific Heat Capacity (J/(kg·K))Thermal Conductivity (W/(m·K))
Positive poleAluminum2719871202.40
Negative poleAluminum2719871202.40
AnodeNaNi1/3Fe1/3Mn1/3O25400445094.67
CathodeHard carbon18501320132.00
DiaphragmPP/PE/PP49219780.334
ElectrolyteNaPF6 salt and carbonate ester solvent236918400.6
HousingsStainless steels7750502.415.10
Table 4. Properties of the air and battery cell.
PropertyBattery CellAir
Density (kg/m3)2063.01571.1650
Specific heat (J/(kg·K))2130.44841005
Thermal conductivity (W/(m·K))klon = 17.591160.0267
ktran = 3.528
Dynamic viscosity (kg/(m·s))1.86 × 10−5
Table 5. Orthogonal simulation scheme based on the L16(44) array.
No.Control Factors
Cells ArrangementCell Distance (mm)Inlet Velocity (m/s)Air Channel Shape
S0In-line30.5U
S1In-line31U
S2In-line52T
S3In-line73I
S4In-line94Z
S5Staggered-A32I
S6Staggered-A51Z
S7Staggered-A74U
S8Staggered-A93T
S9Staggered-B33Z
S10Staggered-B54I
S11Staggered-B71T
S12Staggered-B92U
S13Staggered-C34T
S14Staggered-C53U
S15Staggered-C71Z
S16Staggered-C92I
Table 6. Orthogonal simulation results of SIB pack.
No.Highest Temperature of Single Cell (°C)Maximum Temperature Difference of Single Cell (°C)Average Temperature Difference of SIB Pack (°C)
S036.37020.19773.6285
S132.86220.18792.6913
S232.61860.17414.4087
S327.96040.12601.0833
S430.90300.26563.9356
S528.61240.14460.9689
S636.62140.25616.6288
S728.03120.13100.9635
S831.65070.17684.4646
S932.93770.30125.7281
S1027.42600.12590.9063
S1135.59850.17976.0161
S1229.53160.13531.4650
S1329.50200.13842.5244
S1428.72270.15071.4060
S1532.14500.28944.8662
S1630.09230.12601.2440
Table 7. Indicators of highest temperature of individual cells within the SIB pack.
LevelsControl Factors
abcd
K1j31.086130.978633.793629.7869
K2j31.228931.347230.726932.3425
K3j31.373530.933830.317928.5228
K4j30.115530.544428.965633.1518
Rj1.25800.80284.82804.6290
Table 8. Indicators of maximum temperature difference of individual cells within the SIB pack.
LevelsControl Factors
abcd
K1j0.18840.19300.18740.1512
K2j0.17710.17670.18590.1672
K3j0.18550.18150.18870.1306
K4j0.17610.17590.16520.2781
Rj0.01230.01710.02350.1475
Table 9. Indicators of average temperature difference of the SIB pack.
LevelsControl Factors
abcd
K1j3.02972.97824.14511.6315
K2j3.25653.33752.92724.3535
K3j3.52893.23233.17051.0506
K4j2.51022.77732.08255.2897
Rj1.01870.56022.06264.2391
Table 10. Air cooling performance of group S5 at different discharge rates.
Discharge Rate/CHighest Temperature of Single Cell (°C)Maximum Temperature Difference of Single Cell (°C)Average Temperature Difference of SIB Pack (°C)
0.525.24470.00980.0656
125.97440.14360.2614
228.61240.14460.9689
Disclaimer/Publisher’s Note: The statements, opinions and data contained in all publications are solely those of the individual author(s) and contributor(s) and not of MDPI and/or the editor(s). MDPI and/or the editor(s) disclaim responsibility for any injury to people or property resulting from any ideas, methods, instructions or products referred to in the content.