1. Introduction
Inorganic and organic pollutants in lakes pose a crucial health hazard for both humans and the environment [
1,
2]. Contaminants of concern in lacustrine environments include metals (e.g., arsenic, cadmium, chromium, mercury, nickel), petroleum hydrocarbons and microplastics, which may accumulate in sediments and interact with the overlying water column [
3,
4]. Heavy metals such as mercury can be ingested by fish and enter the food chain [
1,
5]. Moreover, organic contaminants can represent contaminants of first-order importance for the health of natural ecosystems due to their chemical properties [
6]. The quantitative characterization of those contaminants could provide crucial tools for contaminated lake remediation and improve water and sediments chemical quality [
7]. The accurate characterization of these contaminants requires the vertical profiling of sediments, high-resolution chemical–physical analyses, and spatially representative sampling strategies [
8,
9,
10,
11]. Conceptual Site Models (CSMs) are fundamental tools for understanding the environmental characteristics of contaminated sites, providing a multidisciplinary framework that integrates geological, hydrogeological, chemical, and biological information [
12]. By synthesizing data from multiple sources, CSMs facilitate the interpretation of contaminant distribution, support risk assessment, and guide sustainable remediation strategies [
13,
14,
15]. Traditional CSMs typically rely on recent site investigations, including borehole data, soil and sediment chemical analyses, geophysical surveys, and groundwater monitoring, often focusing on the qualitative characterization of contamination [
16,
17,
18].
Advances in geostatistical techniques and three-dimensional (3D) modeling have improved the ability to interpolate and visualize contaminant distribution within sediment or water bodies and soil layers, providing more robust CSMs that capture both lateral and vertical heterogeneity [
19,
20] and giving stronger tools for sites management.
Despite these advances, several gaps remain in current CSM practice. First, historical datasets and records are commonly employed for environmental reconstructions [
21]; however, contaminated sites are typically excluded from such applications. In fact, historical information such as that pertaining to sediment cores, bathymetric surveys and past chemical analyses is underutilized or considered incompatible with modern investigations and is thus seen to be useless. Such data, if properly recovered, integrated and validated, could provide invaluable insights into the temporal evolution of contamination and natural attenuation processes [
22]. Second, conventional CSMs frequently overlook the quantitative estimation of contaminant mass within environmental matrices, considering only mass balance approaches and limiting our ability to assess the potential for natural attenuation and to support predictive modeling of contaminant dynamics. This is despite the fact that it could be a powerful tool for site remediation and management [
23,
24]. Third, lacustrine and other water bodies are often only qualitatively represented, and their bathymetric information is rarely exploited to inform eventual contaminant presence; meanwhile, distribution or sediment volume calculations are frequently used only for morphological studies [
25,
26]. Furthermore, usually, these sites do not have any CSMs, missing an important tool in site characterization and subsequent remediation and management procedures.
The present study aims to address these gaps by demonstrating a sustainable approach for constructing a comprehensive, enhanced CSM that integrates both historical and recent datasets; this has never been done for contaminated sites. Specifically, this work aims to valorize previously underused historical information alongside targeted modern investigations which are typically available for contaminated sites to develop a 3D geodatabase, which is subsequently extended into a four-dimensional (4D) framework capturing temporal evolution. The methodology aims to reconstruct a high-resolution 3D model for the Mantua Lakes (Lake di Mezzo, Lake Inferiore, and Lake Vallazza, Italy), including the water volume above the lakebed, combining sediment stratigraphy, bathymetry, and contaminant distributions. Furthermore, we present a novel approach for estimating contaminant load within environmental volumes of sediments, combining bathymetric features and widespread geometry reconstruction tools, such as the Voronoi polygons; the purpose here is to provide quantitative insights into ongoing natural attenuation processes and supporting sustainable site management.
2. Materials and Methods
The methodological approach relied on the integration of heterogeneous and multi-temporal datasets within a single georeferenced digital environment, hereafter referred to as a desk-based platform. This workflow enabled the systematic recovery, harmonization, and valorization of historical data, preventing the loss of legacy information and allowing its integration with newly acquired datasets to support the reconstruction of a continuously updated CSM. Historical investigations conducted between 2006 and 2018 provided bathymetric, geological, and chemical data for the Mantua Lakes system. These datasets were complemented by a new investigation campaign carried out between June 2024 and February 2025, which included additional geological boreholes and updated chemical analyses of surface water and sediments. All available data were standardized and georeferenced within a GIS environment (QGIS 3.22; UTM Zone 32N), ensuring spatial consistency and enabling their combined use within a unified analytical framework.
2.1. Bathymetric Reconstruction
Bathymetric reconstruction represents the first step in defining the morphological framework of the study area and provides the basis for subsequent volumetric and stratigraphic analyses. A historical bathymetric map dating back to 2006 was retrieved from an archival source in PDF format, subsequently digitized and georeferenced within the GIS environment. The map represented the bathymetry of the lakes as derived from echo-sounding surveys. Although not intended to represent current conditions, this dataset proved to be essential for reconstructing the general morphology of the lakebed and for estimating the water column thickness at each sampling location. The bathymetric data were manually digitized within the QGIS environment, starting from the historical map which was derived from the 2006 survey. The original dataset was clipped and georeferenced using GIS tools, achieving a satisfactory alignment with satellite imagery of the three lakes. In order to reconstruct the lakebed morphology, two vector datasets with different geometries were created: a point shapefile representing depth measurements and a line shapefile representing isobaths. A total of 64 isobaths with an interval of 0.5 m were digitized, and a point cloud was subsequently generated along these lines, resulting in 458 points. The selected point density ensured an adequate representation of bathymetric variability while maintaining computational efficiency. Both points and lines were attributed with consistent depth values. Bathymetric reconstruction was performed using the inverse distance weighting (IDW) interpolation method, based on both the point dataset and the digitized isobaths. The interpolation was carried out using four neighboring points and a grid resolution of 3.3 m × 4.9 m in the horizontal directions, producing a continuous raster model of the lakebed. Isobaths at 1 m intervals were subsequently derived from the interpolated raster and showed good agreement with the original dataset, qualitatively confirming the reliability of the interpolation. The raster model was then vectorized and clipped using a mask corresponding to the boundaries of the three lakes. The resulting bathymetric model aimed to provide a reliable representation of the lakebed’s morphology.
It was used to constrain the geometry of the 3D geological model and to support the volumetric calculations of the contaminated sediments.
2.2. Three-Dimensional Geological Modelling of the Lake System
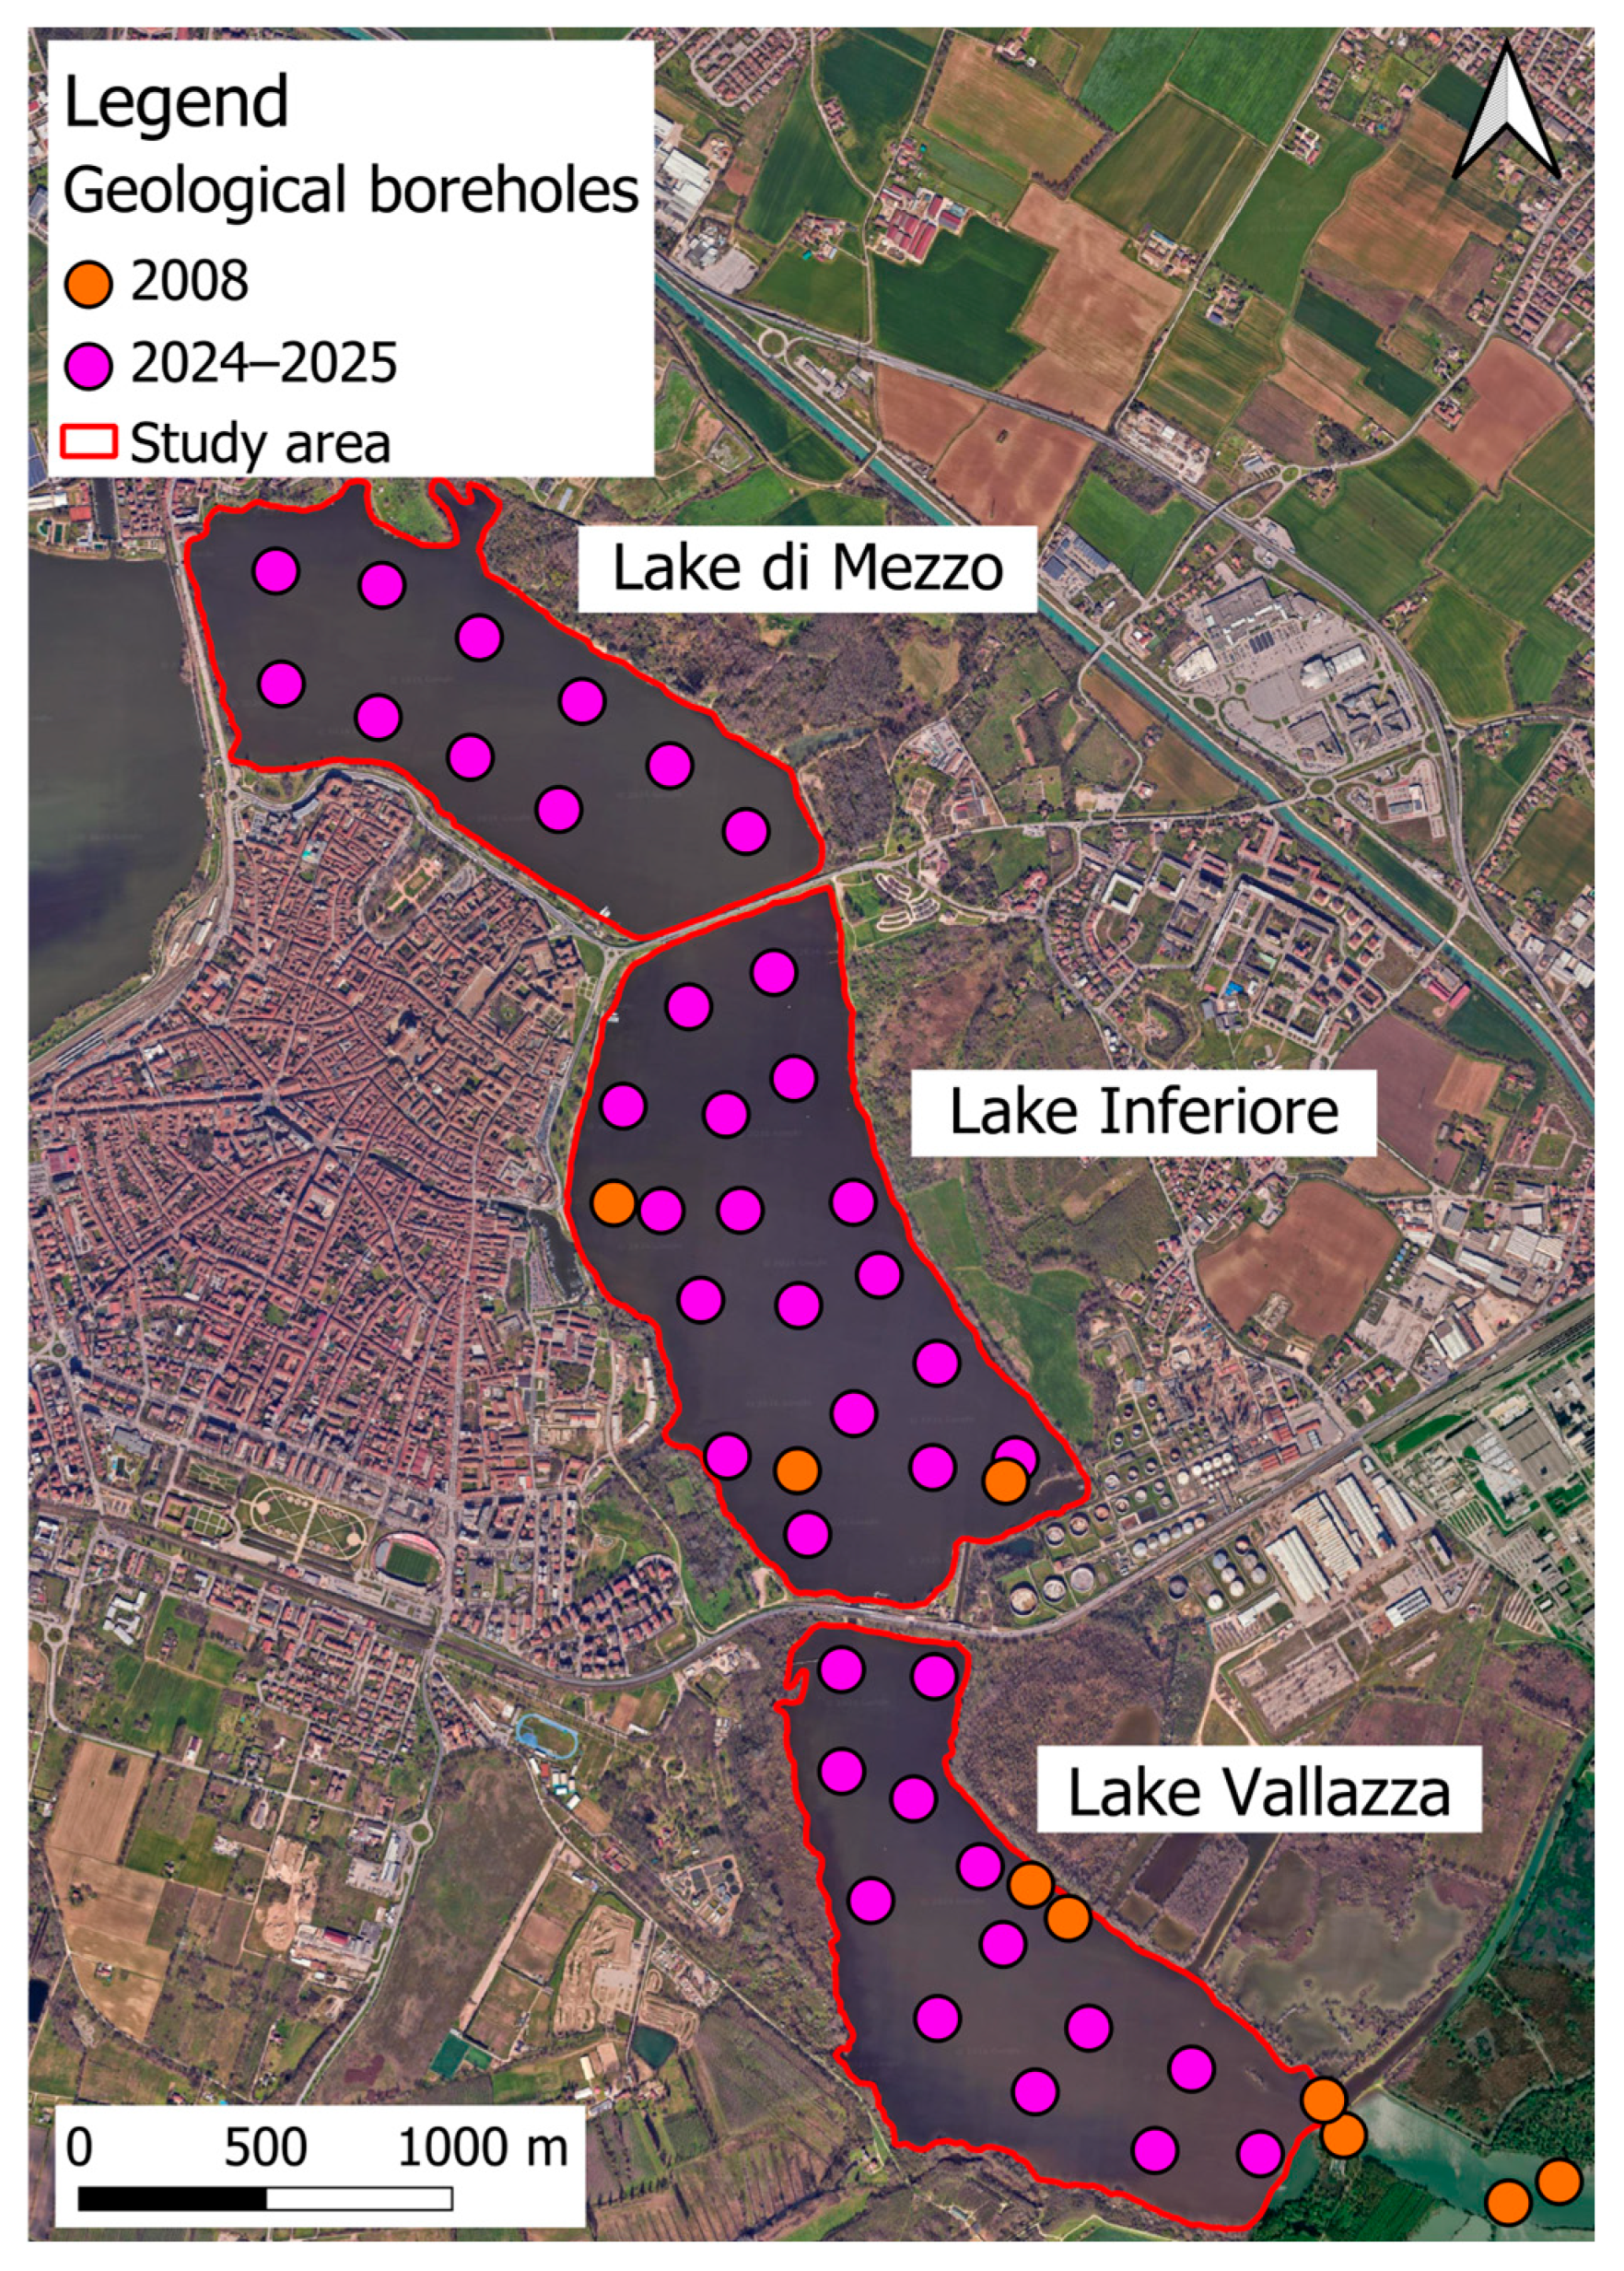
The 3D geological model was developed to reconstruct the stratigraphic architecture of the lake system and to provide a quantitative basis for sediment volume estimation. The stratigraphic information was derived from a total of 55 boreholes, including 15 historical cores collected in 2008 with variable depths ranging from 1 to 3 m, and 40 cores drilled during the 2024–2025 campaign (10 at Lake di Mezzo, 17 at Lake Inferiore, and 13 at Lake Vallazza), with maximum depths reaching approximately 3 m (
Figure 1).
The model was implemented in RockWorks20 following the onlap principle, which reconstructs stratigraphic relationships based on the vertical ordering of geological units. Georeferenced stratigraphic data were imported into the modelling environment, and a voxel-based grid with a resolution of 20 m × 20 m × 0.1 m was defined to discretize the subsurface. Interpolation of stratigraphic surfaces was performed using an inverse distance weighting (IDW) algorithm, combined with smoothing and high-fidelity filtering procedures [
27]. This local deterministic method ensures exact interpolation at control points, resulting in zero interpolation error at borehole locations. Model parameters were calibrated through iterative testing to ensure consistency with observed stratigraphic relationships. Bathymetric data were used to constrain the upper surface of the model, effectively linking the stratigraphic units to the water column and delineating the sediment–water interface. The resulting 3D geomodel was clipped to the study area boundary and used to reconstruct the spatial distribution of sedimentary units, generate 2D geological sections, and support volumetric calculations of sediments and overlying water bodies.
2.3. Sediment Chemical Characterization and Contaminant Mass Estimation
Lakebed sediment samples from both historical (2008) and recent (2024–2025) investigations were used to perform a multi-temporal assessment of contamination patterns and to evaluate the evolution of sediment quality over time. The 2008 dataset included sediment samples collected at regular vertical intervals of 25 cm, while the 2024–2025 campaign adopted a comparable sampling resolution to ensure consistency between datasets. Measured concentrations of arsenic, cadmium, chromium, mercury, nickel and heavy petroleum hydrocarbons (HPHs) were analyzed along selected representative point pairs (e.g., points A–A′, B–B′ and C–C′,
Figure 2) to provide insights into the evolving decontamination dynamics within the vertical profiles of lakebed sediments. Chemical analyses of the sediment samples were performed by external accredited laboratories, according to standardized protocols (EPA 3050B:1996 and EPA 6020B:2014), ensuring methodological consistency and comparability of results. Metal concentrations were determined after EPA 3050B acid digestion and inductively coupled plasma–mass spectrometry (ICP-MS) analysis (EPA 6020B); therefore, the results represent acid-extractable metal concentrations. Quality control (QC) procedures were applied in accordance with EPA methods; detailed QC results are not provided.
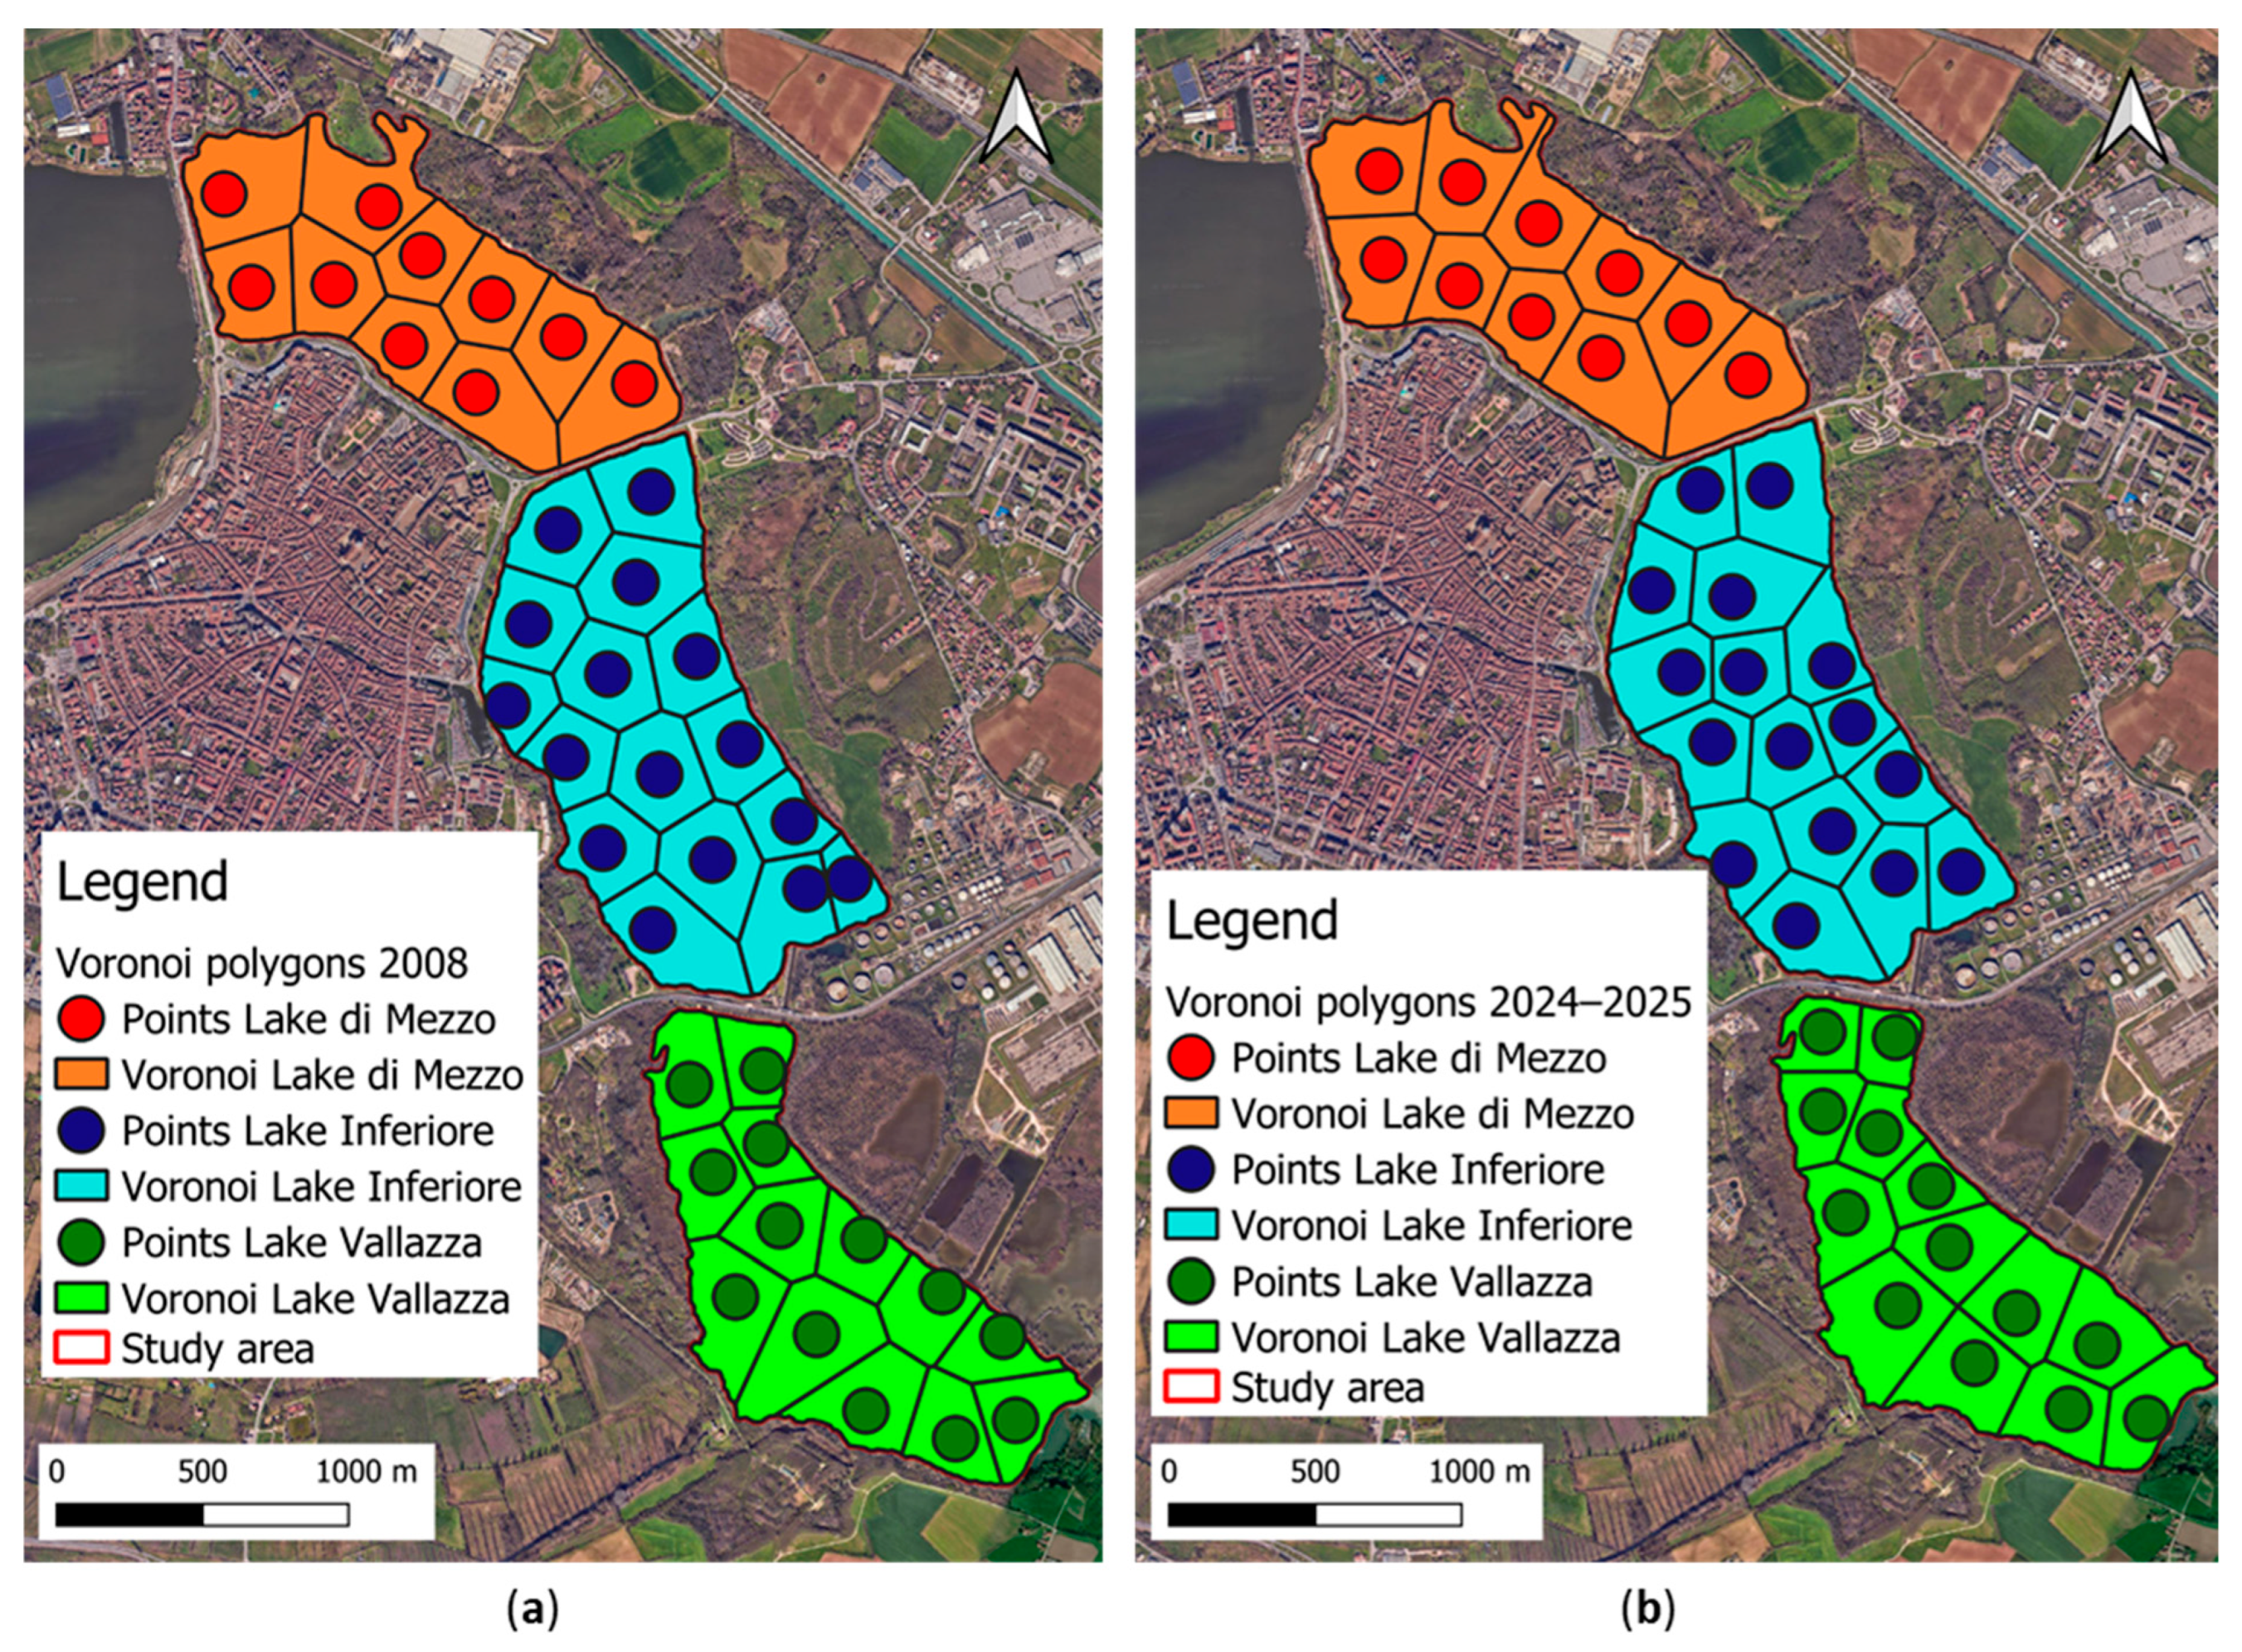
To enable a robust comparison between the two campaigns at a broader spatial scale, a harmonization procedure was applied. This involved selecting an equivalent number of sampling locations and identifying matching depth intervals, resulting in 39 pairs of georeferenced points distributed across the three lake basins. Each pair represents locations with comparable depth and spatial context, allowing a consistent multi-temporal comparison. For quantitative spatial analysis, Voronoi polygons were generated in QGIS using the Voronoi Polygon Generation Tool to define areas of influence for each of the 39 points in both campaigns (
Figure 2).
The polygons were constructed purely on geometric principles, such that each point was assigned a representative spatial domain encompassing all locations closer to it than to any other point. Within each polygon, the measured contaminant concentrations for arsenic, cadmium, chromium, mercury, nickel and heavy petroleum hydrocarbons (HPHs) were assumed to be uniform, representing a conservative, precautionary estimate of spatial distribution. Vertically, the polygons were extended to cover all sampled horizons down to 3 m depth, subdivided into 12 layers of 25 cm each to match the sampling intervals. The volume of influence for each layer was calculated using the QGIS Volumetric Calculation Tool (VCT), which determines the volume between two raster surfaces within a defined polygonal boundary. The VCT allowed us to calculate the volume inside multiple polygons based on a DEM layer, providing surface to surface analysis and giving back a cut/fill output. For each polygon, the sediment column was subdivided into 12 discrete layers of 25 cm thickness, corresponding to the vertical sampling intervals. The lower boundary of the first layer coincides with the lakebed surface defined by the bathymetry raster, while the upper boundaries of successive layers are constrained incrementally 25 cm above the previous one, following the bathymetric surface. In this way, the sediment volume at each vertical interval is directly linked to the actual lakebed topography, ensuring that the estimated volumes reflect the true geometry of the sediment column. In this framework, the upper and lower surfaces define the vertical constraints of the calculated volume, while the continuous interpolated surface connecting their boundary points represents the lateral constraint. This approach allows the definition of a closed geometric solid, ensuring a coherent three-dimensional representation for volumetric calculations. Sediment mass (
Mls) for each layer was calculated according to established literature approaches [
28] as the product of bulk density (
BD) and layer volume (
Vi):
Bulk density was assumed equal to 1200 kg/m
3 based on literature values reported for fine-grained lacustrine sediments under similar depositional environments [
29,
30,
31,
32,
33]. This assumption was necessary due to the absence of site-specific bulk density measurements across the investigated stratigraphic units.
It is acknowledged that sediment bulk density may vary with depth, grain size, and organic matter content; however, in the absence of spatially resolved measurements, a constant value was adopted to ensure methodological consistency and enable first-order mass balance calculations within the Conceptual Site Model framework. The selected bulk density (1200 kg/m
3) represents an average within the range of values reported in the literature for lacustrine sediments with comparable characteristics (800–1600 kg/m
3) [
29,
30,
31,
32,
33]. Although sediment bulk density may vary depending on lithology, organic matter content, and compaction, the adopted value was considered a representative approximation for the relatively homogeneous shallow sediments investigated in this study. Variations in bulk density would proportionally affect the estimated contaminant masses but would not influence the observed spatial distribution patterns or the temporal comparison between the two monitoring campaigns.
The mass of each contaminant (
CTM) was subsequently determined by multiplying the sediment mass of the corresponding horizon by the measured analyte concentration (
):
This workflow aimed to provide a spatially consistent, multi-temporal quantification of sediment-associated contaminants, providing a robust basis for evaluating trends in contaminant redistribution and ongoing natural attenuation processes across the three lake systems.
2.4. Surface Water Sampling and Analysis
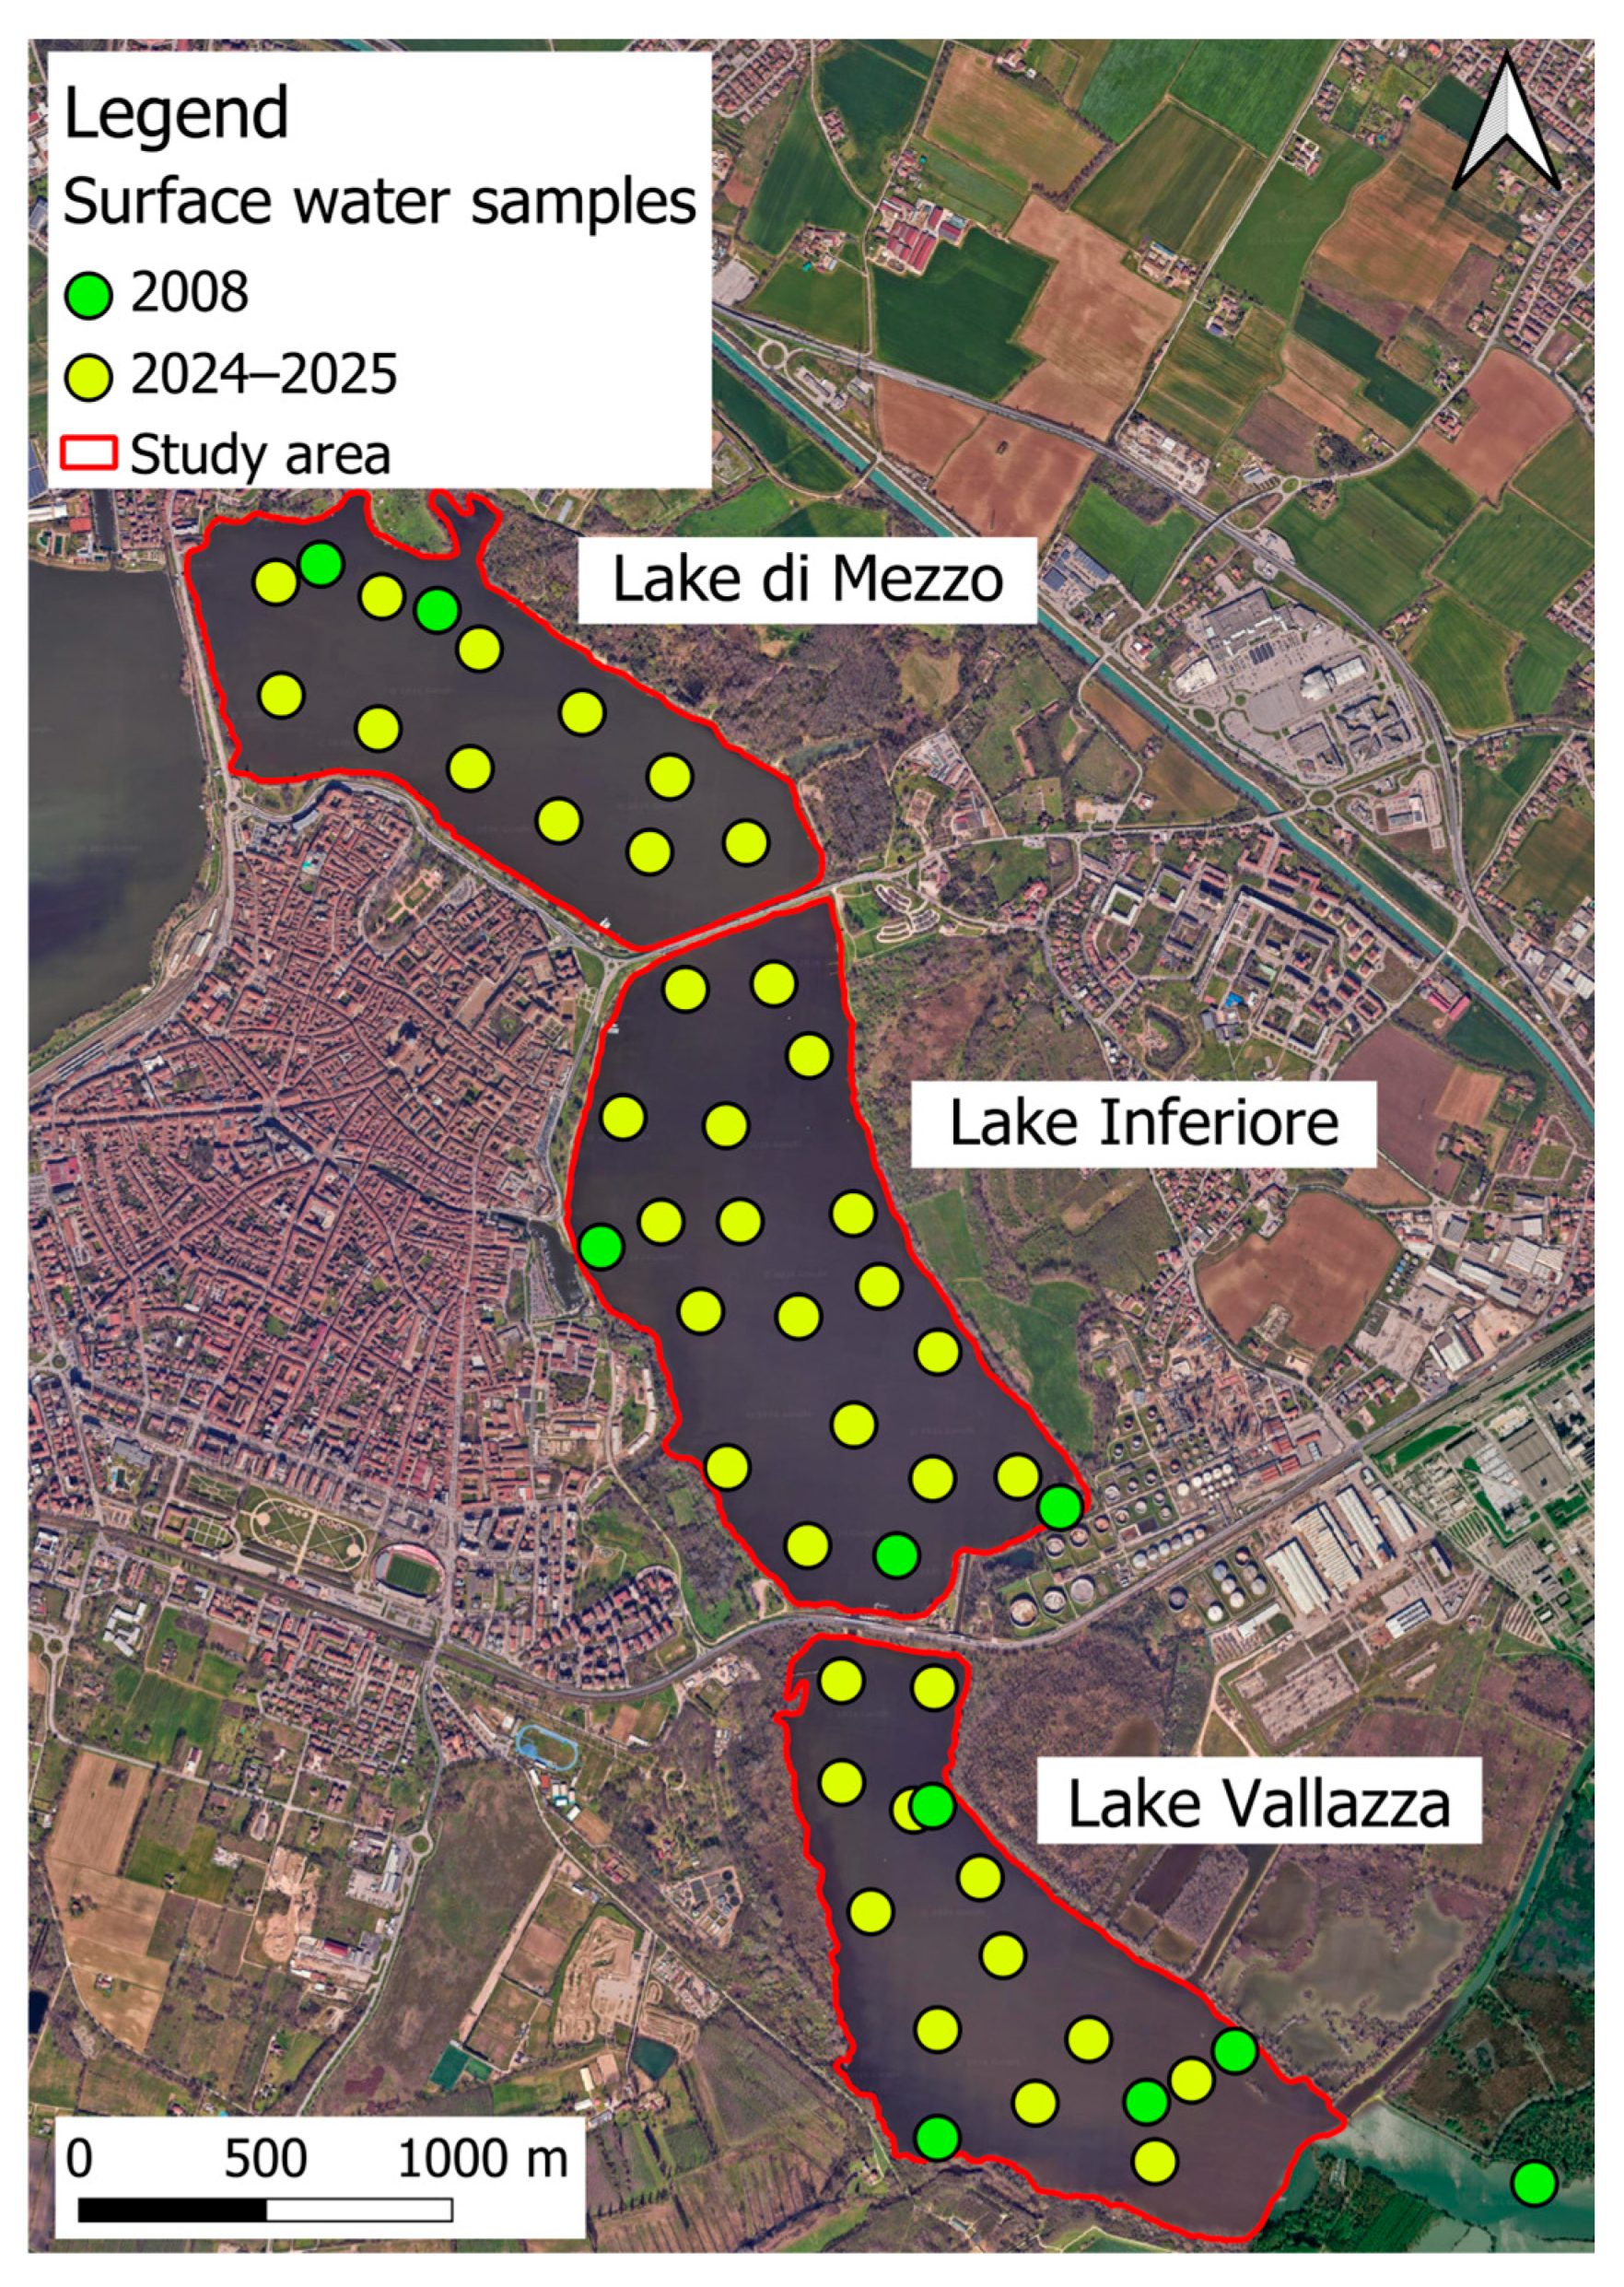
Surface water samples from the 2008 (n = 9) and 2024–2025 (n = 40) monitoring campaigns were used to evaluate temporal trends in water quality within the study area (
Figure 3).
Chemical analyses of surface water samples were performed by accredited external laboratories according to standardized analytical protocols (EPA 5030C:2003 + EPA 8260D:2018 and EPA 3510C:1996 + EPA 8270E:2018), ensuring the methodological consistency and comparability of the analytical results between the two monitoring campaigns. The analysis specifically targeted the same key contaminants identified in the sediment investigation, ensuring methodological coherence and enabling an integrated assessment of contaminant distribution and potential mobility between the sediments and the overlying water column. Due to the limited spatial correspondence between the sampling locations in the two datasets, a direct point-by-point comparison was not feasible. Therefore, a descriptive, data-driven, and georeferenced comparative approach was adopted, focusing on the distribution and mean values of contaminant concentrations for each campaign. This approach was designed to investigate the dynamics of contaminant accumulation and natural attenuation, including the potential for bioattenuation processes, providing a system-scale perspective on the evolution of water quality and its interaction with underlying sediments.
3. Results
3.1. Bathymetric Patterns of the Lake System
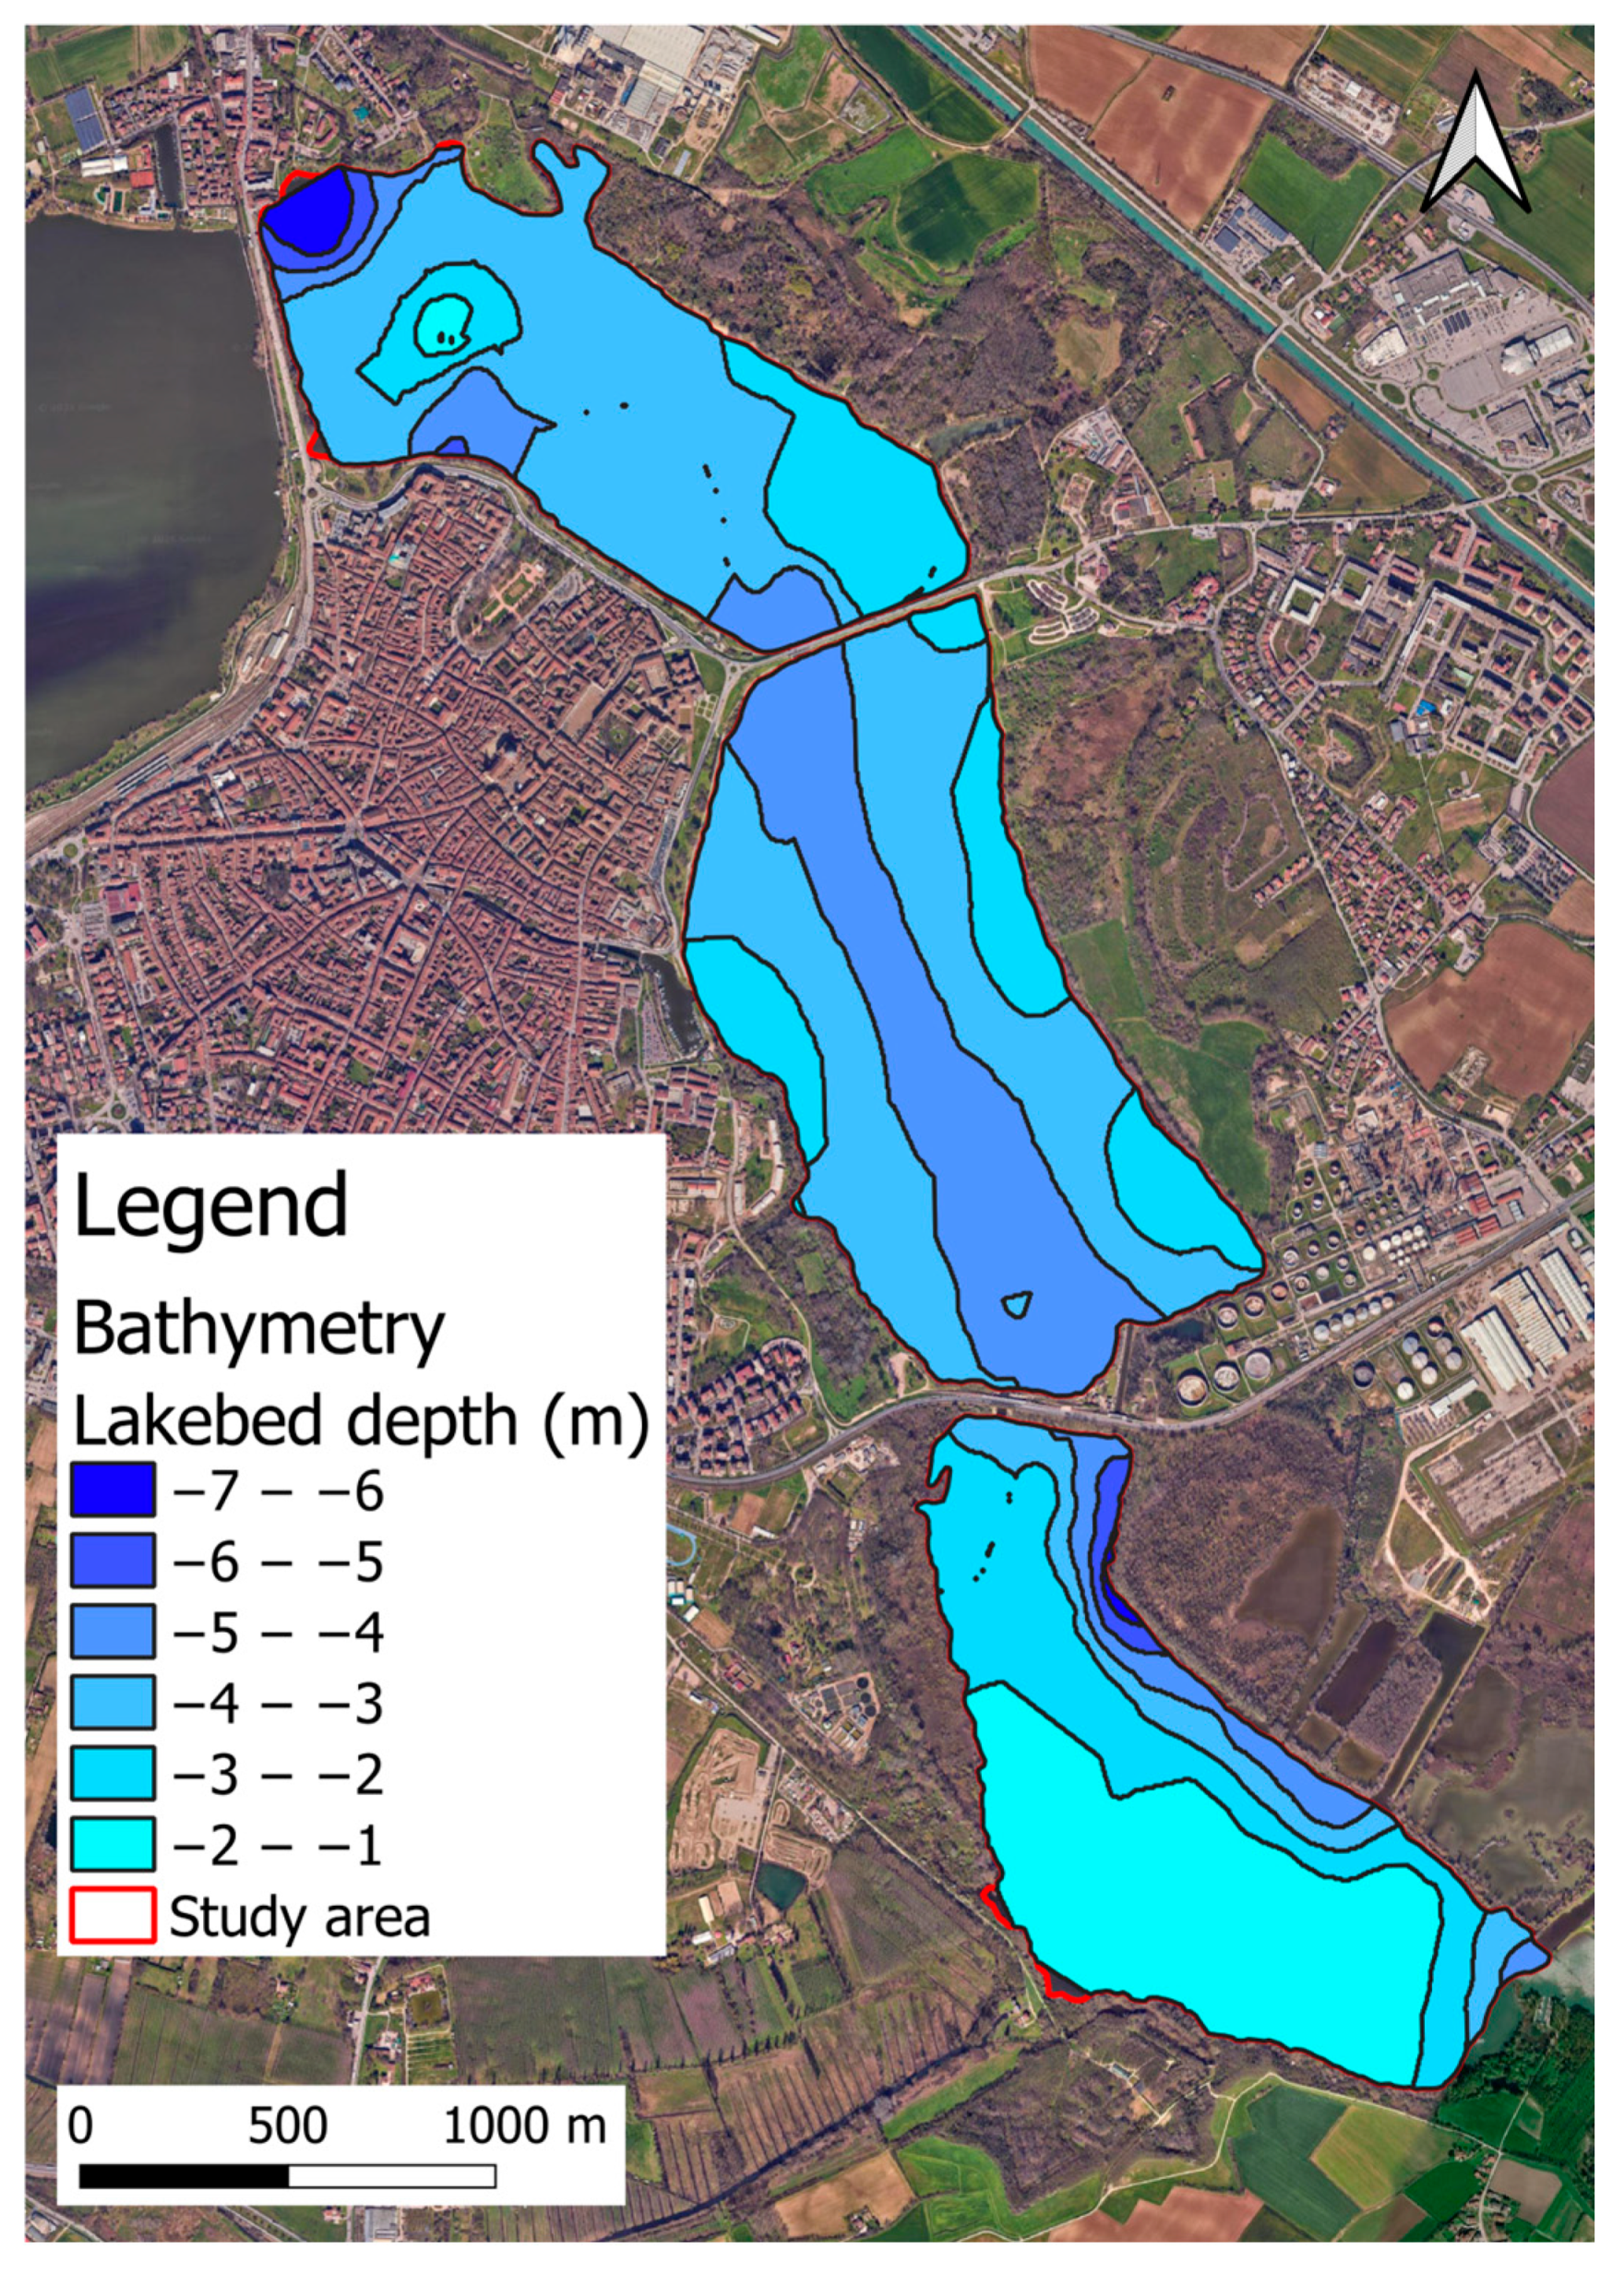
The raw data and the reconstructed bathymetry (
Figure 4) highlight distinct morphological patterns among the three lakes, reflecting significant spatial variability in lakebed geometry.
Lake di Mezzo exhibits the most heterogeneous morphology, with marked depth variability across the basin. The northwestern sector reaches depths exceeding 6 m, whereas the southeastern portion is considerably shallower (approximately 2 m). The central area is characterized by intermediate depths around 3 m, resulting in a highly irregular bathymetric configuration. In contrast, Lake Inferiore displays a more regular and symmetric morphology. The marginal zones are consistently shallow, with average depths of approximately 2 m, while the central sector deepens progressively to about 4 m, defining a relatively uniform basin geometry. Lake Vallazza shows a markedly different pattern, characterized by extensive shallow areas (approximately 1 m deep), which are typically associated with the development of aquatic vegetation. Notably, this lake also hosts the deepest point within the system, reaching approximately 7 m in its northeastern sector. This pronounced depth variability suggests localized morphological controls superimposed on generally shallow conditions.
Overall, the bathymetric reconstruction reveals a progressive increase in morphological complexity from Lake Inferiore to Lake di Mezzo and Lake Vallazza, providing a key framework for interpreting sediment distribution and thickness variations across the system.
3.2. Stratigraphic Architecture of the Mantua Lakes
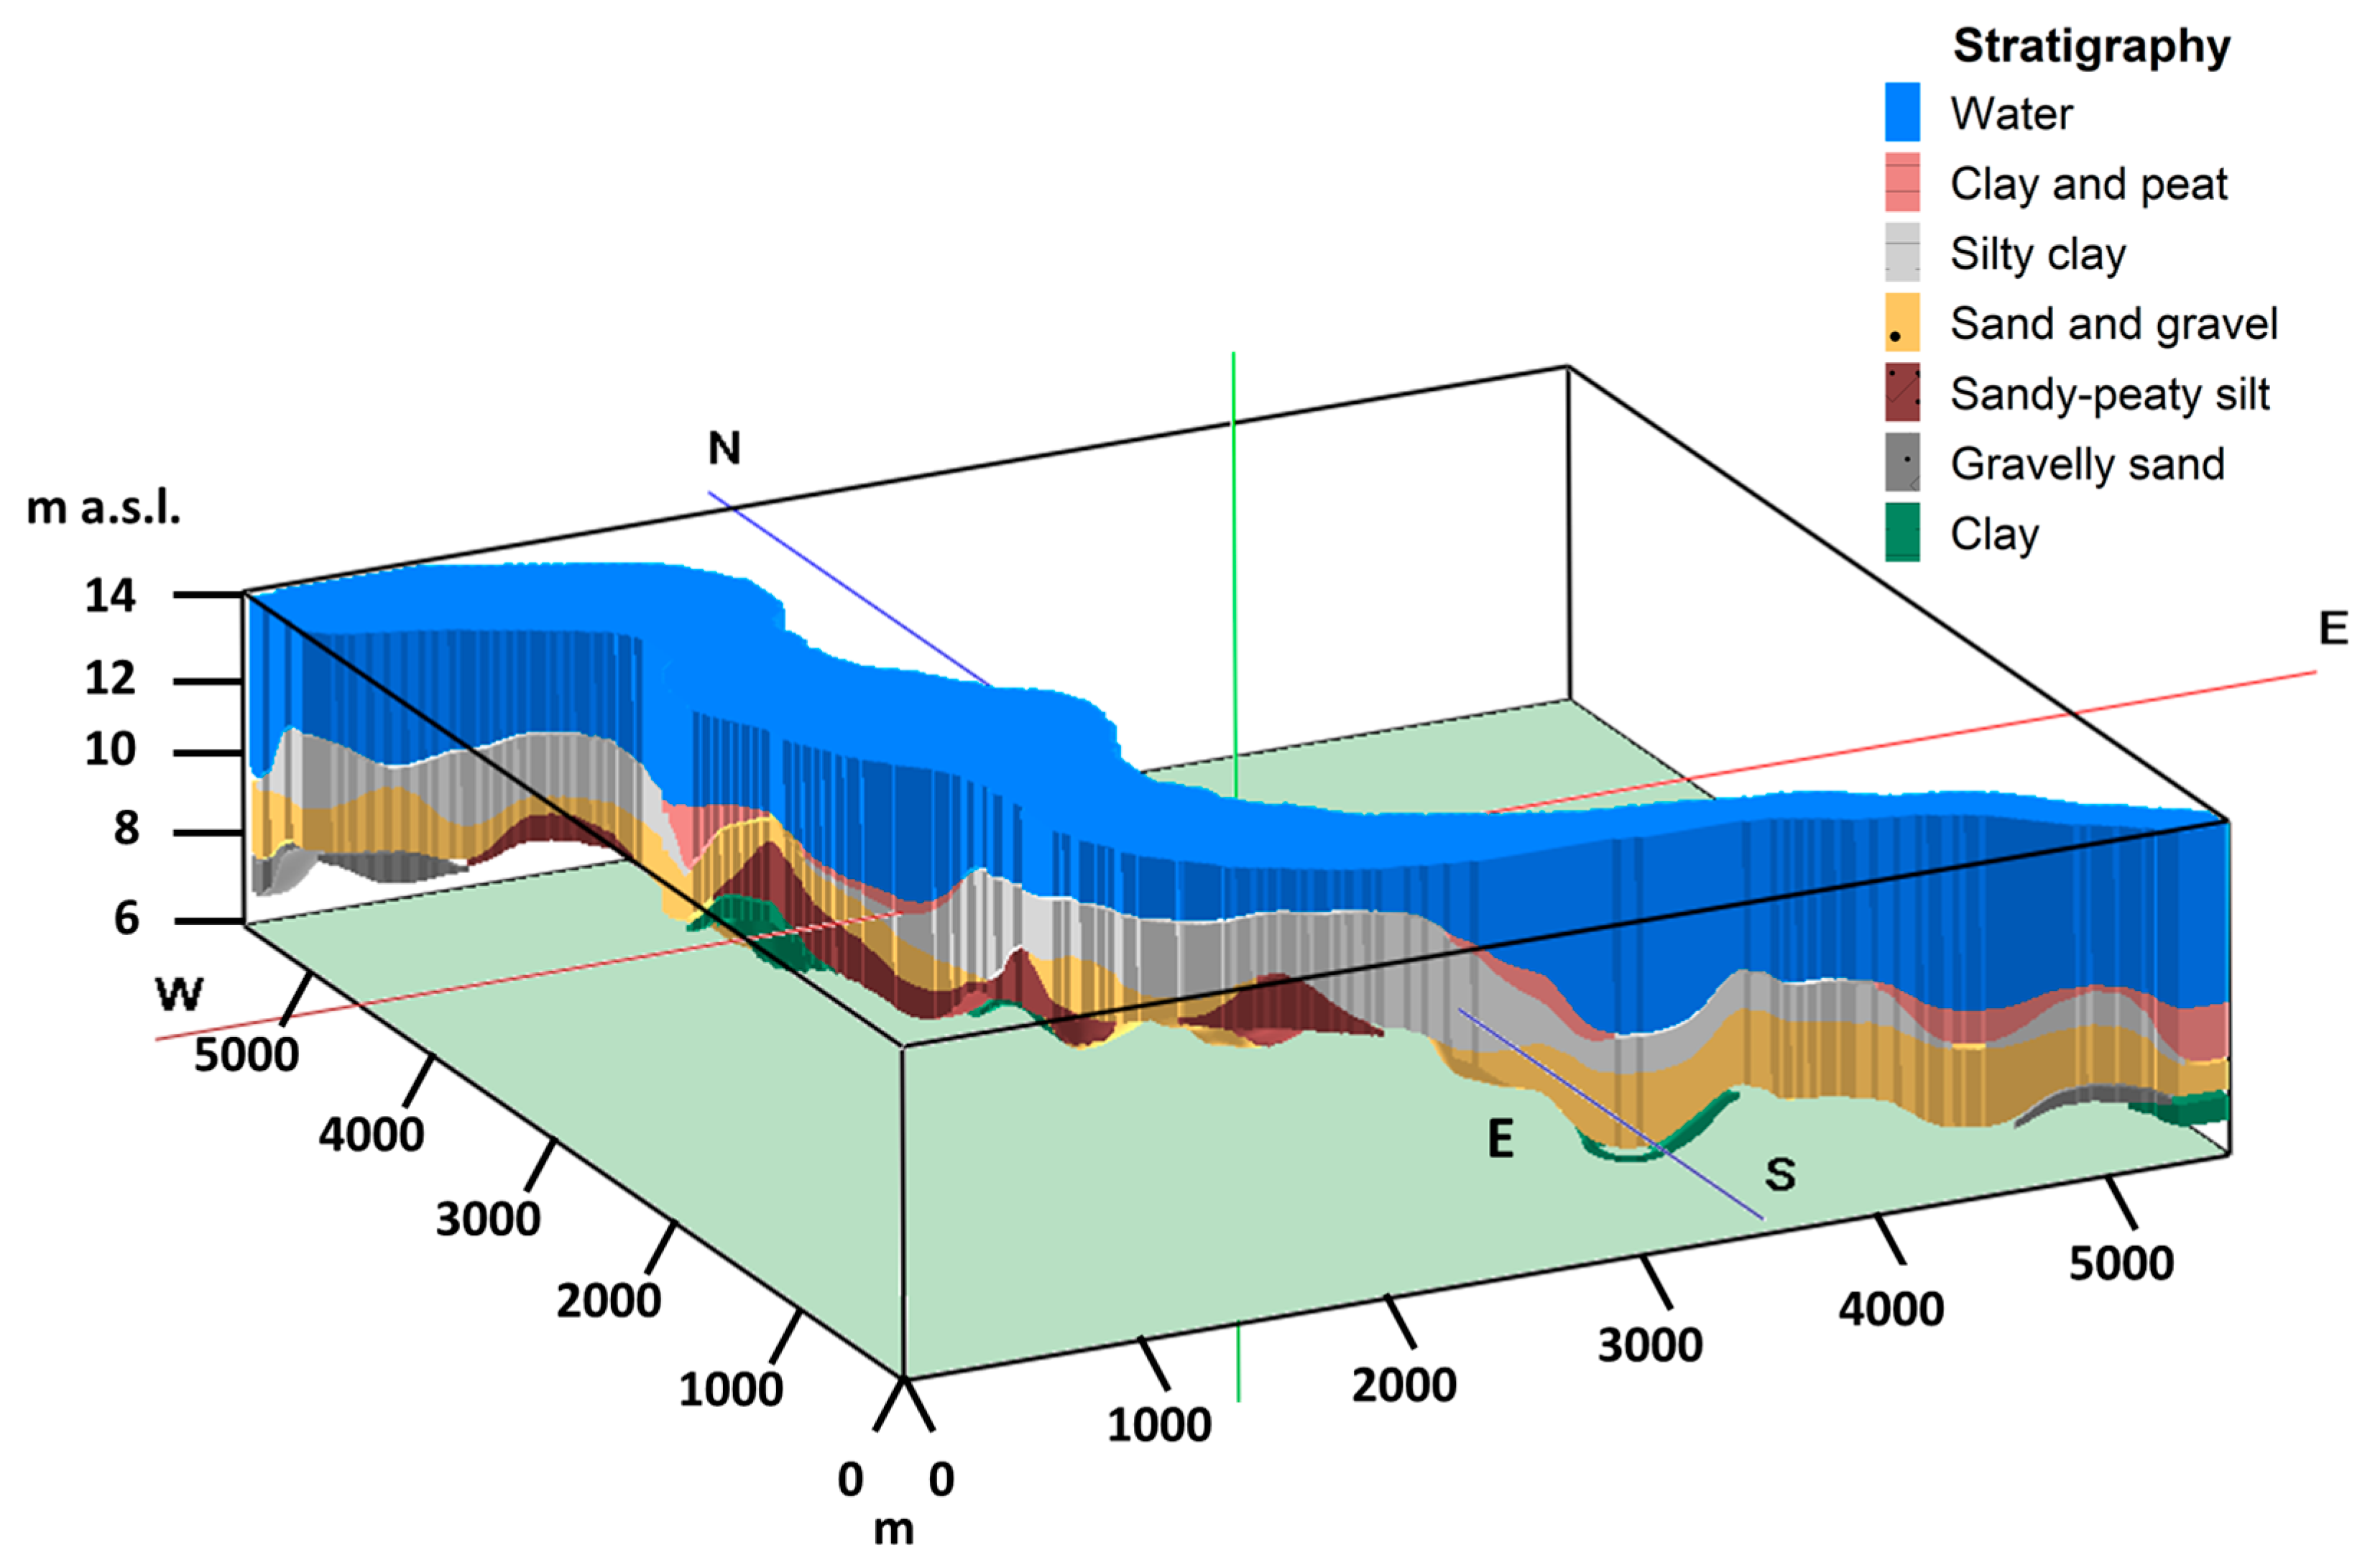
The updated 3D geological model (
Figure 5) provides a comprehensive reconstruction of the stratigraphic architecture of the Mantua Lake system.
The model consists of seven stratigraphic units, including the overlying water column, the thickness of which varies between approximately 2 and 7 m. Given the constant elevation of the lake surface (14 m a.s.l.), these variations directly reflect the underlying bathymetric morphology, with a general increase in water column thickness toward the southern sectors of the study area. Among the sedimentary units, silty clay and sand and gravel represent the most laterally continuous bodies across the entire system. Their distribution reveals a clear spatial trend: silty clay deposits tend to be thicker in the northern sectors, whereas sand and gravel deposits increase in thickness toward the south. In several locations, these two units account for the entire investigated sediment thickness (up to 3 m), indicating their dominant role in the stratigraphic framework. Lenticular and discontinuous units provide further insight into local depositional variability. The clay and peat unit represents the most extensive of these bodies, occurring predominantly in the southern portion of Lake Inferiore and extending toward the southern sector of the study area, generally at shallow depths. The sandy–peaty silt unit is restricted to localized occurrences within Lake Inferiore, while gravelly sand appears sporadically in Lake di Mezzo and along the Mincio River. Minor clay lenses are confined to the fluvial sector.
These results highlight a stratigraphic architecture controlled by both laterally continuous depositional processes and localized sedimentary inputs, reflecting the complex interplay between lacustrine and fluvial dynamics within the system.
3.3. Contaminant Concentration Distribution and Temporal Trends
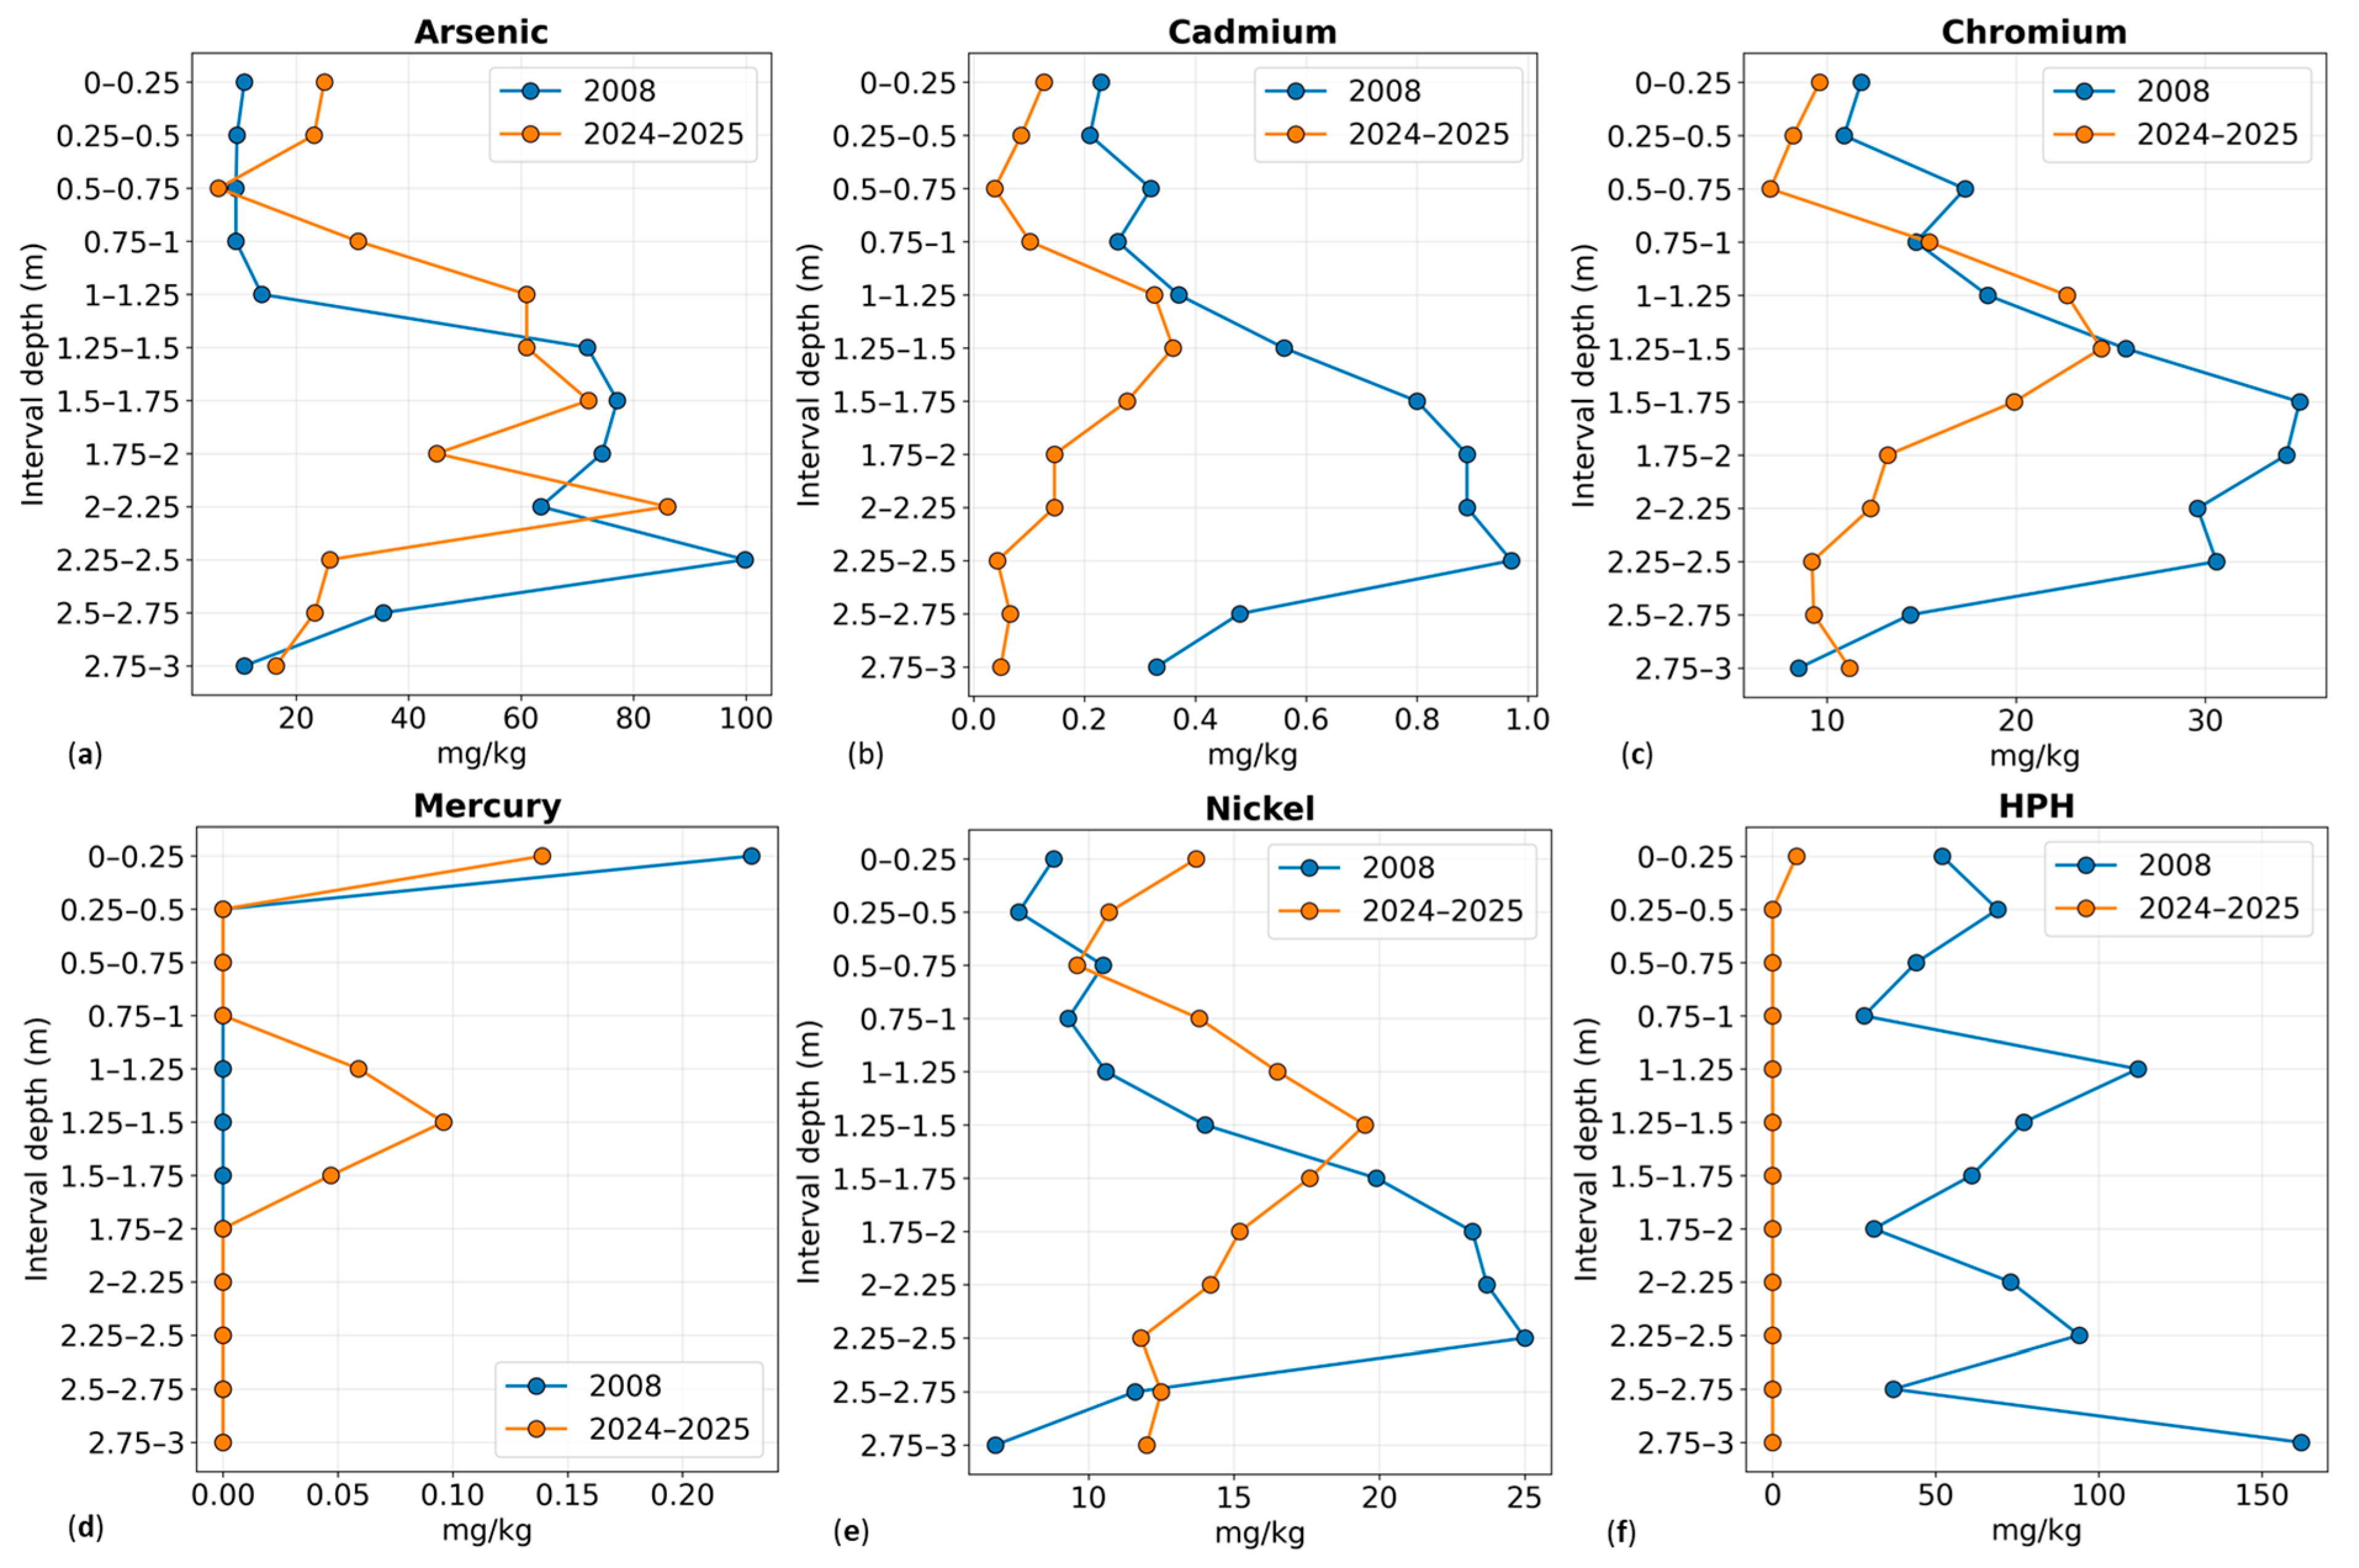
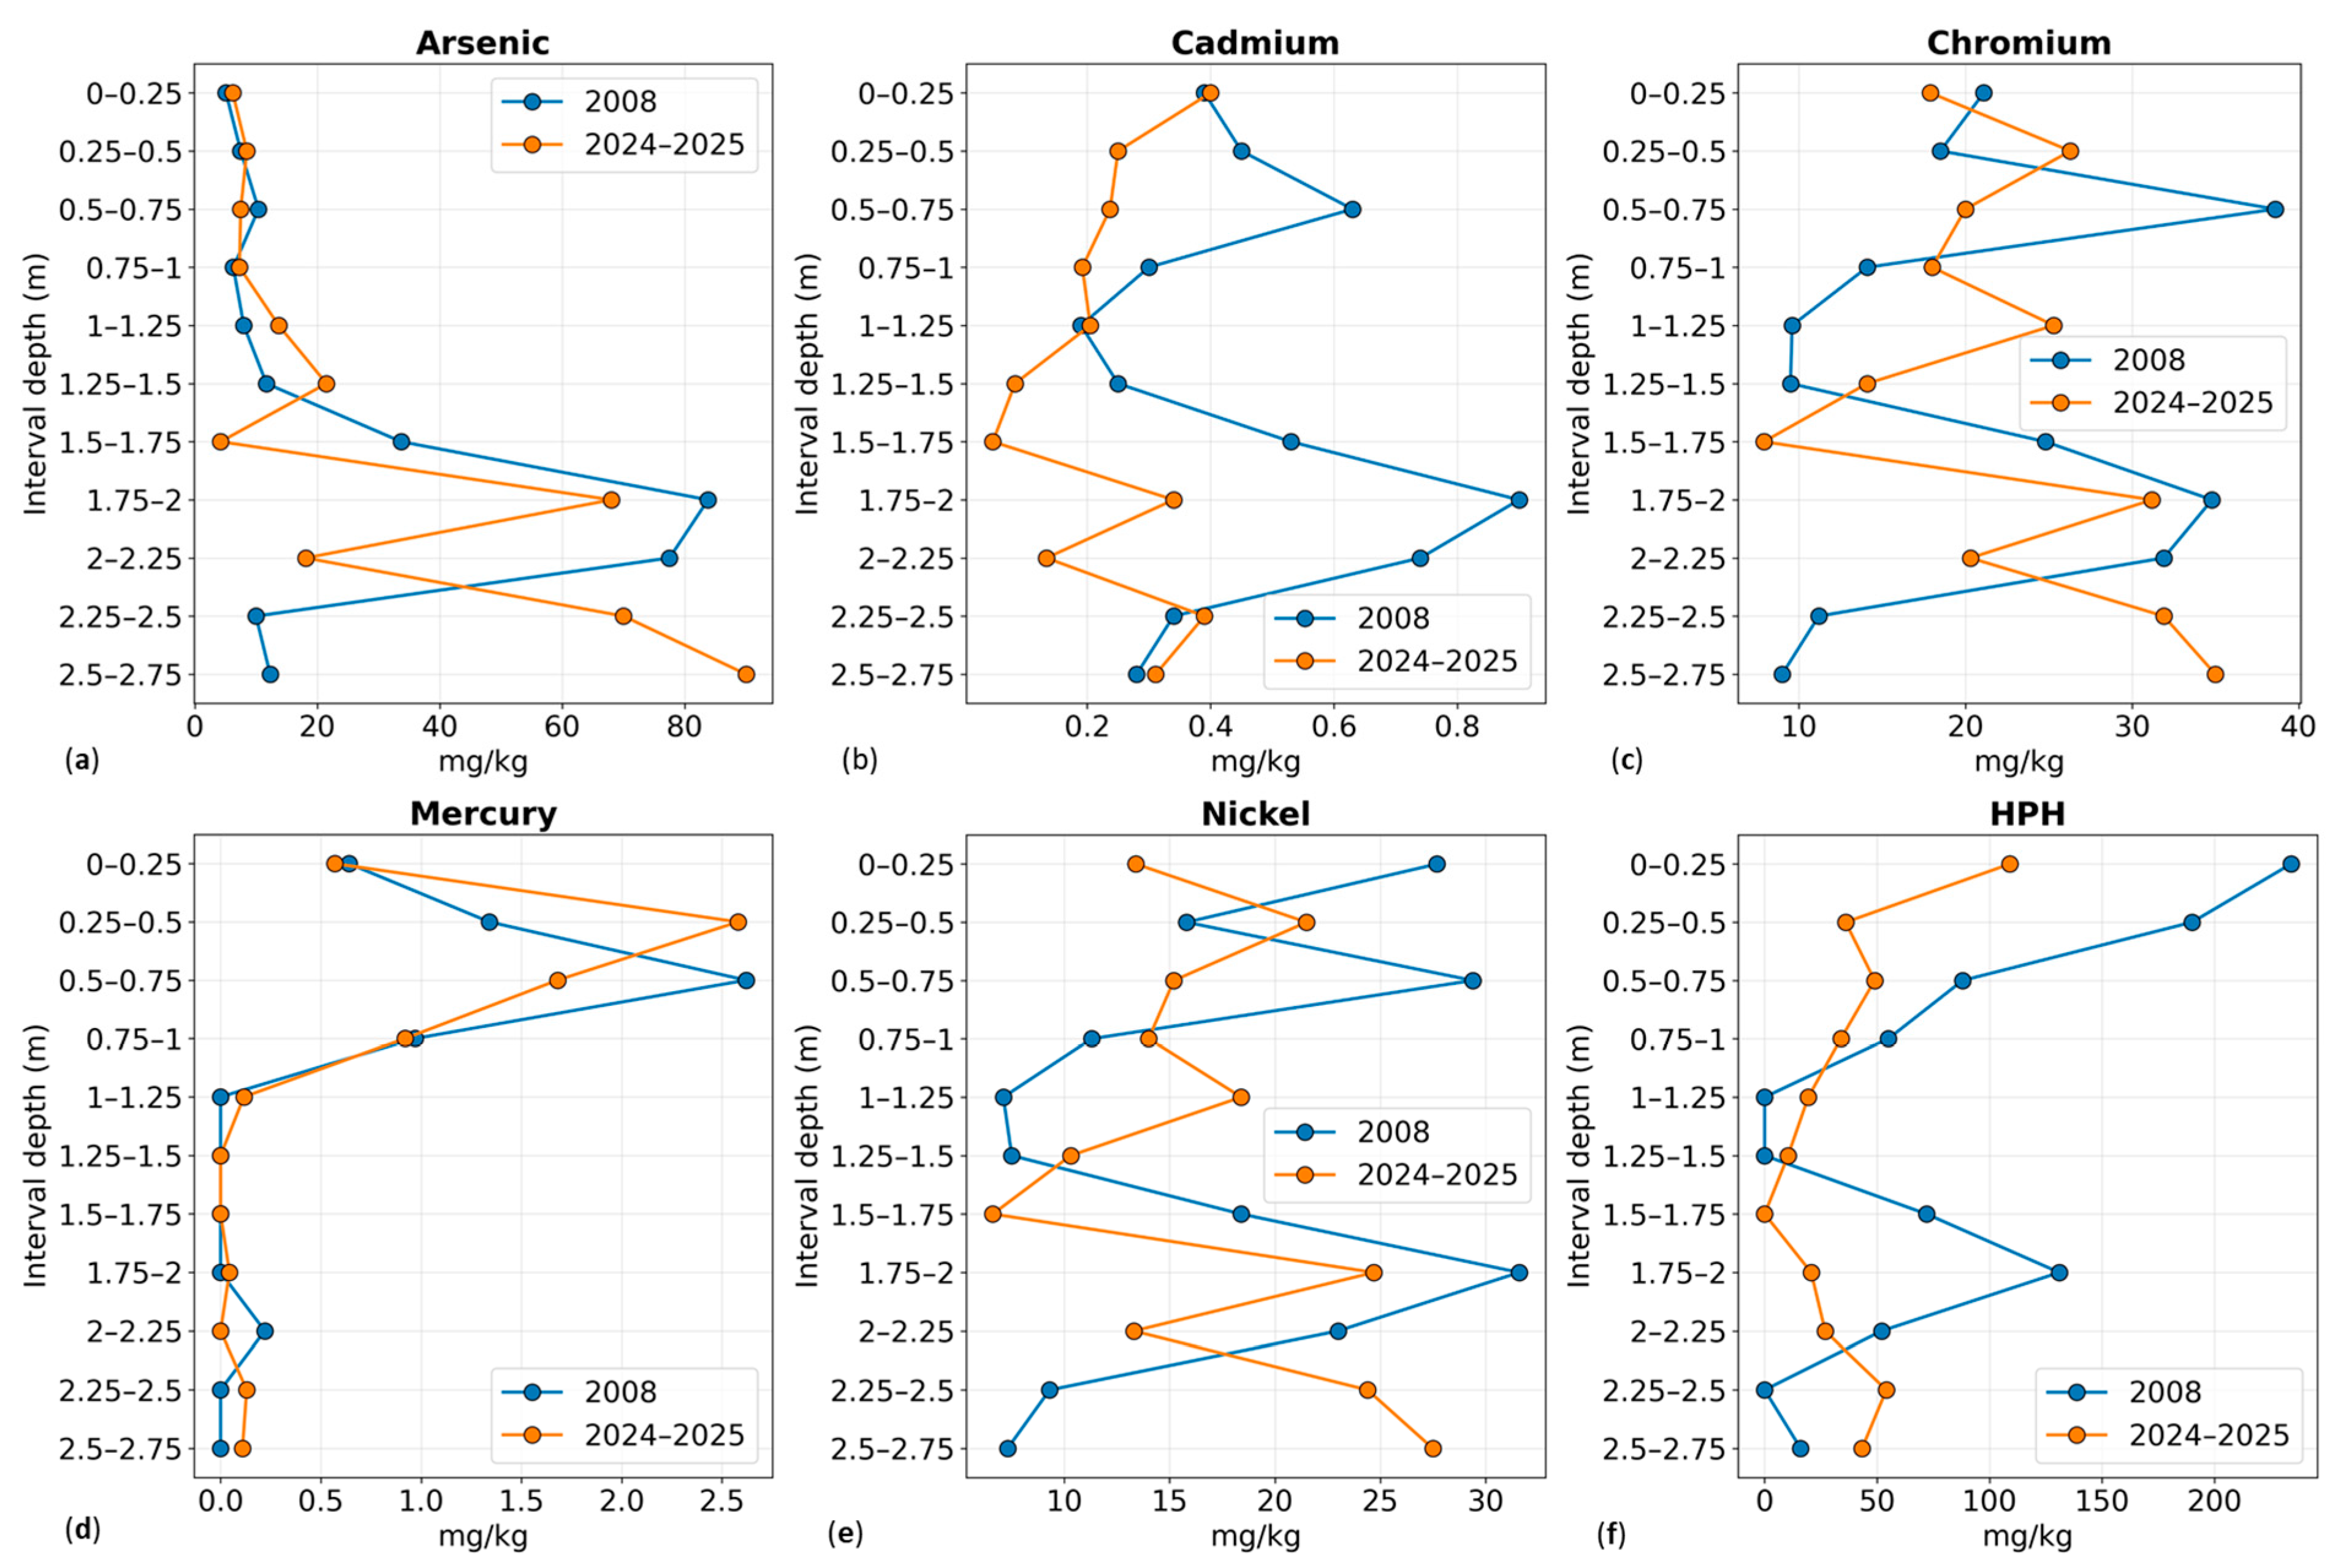
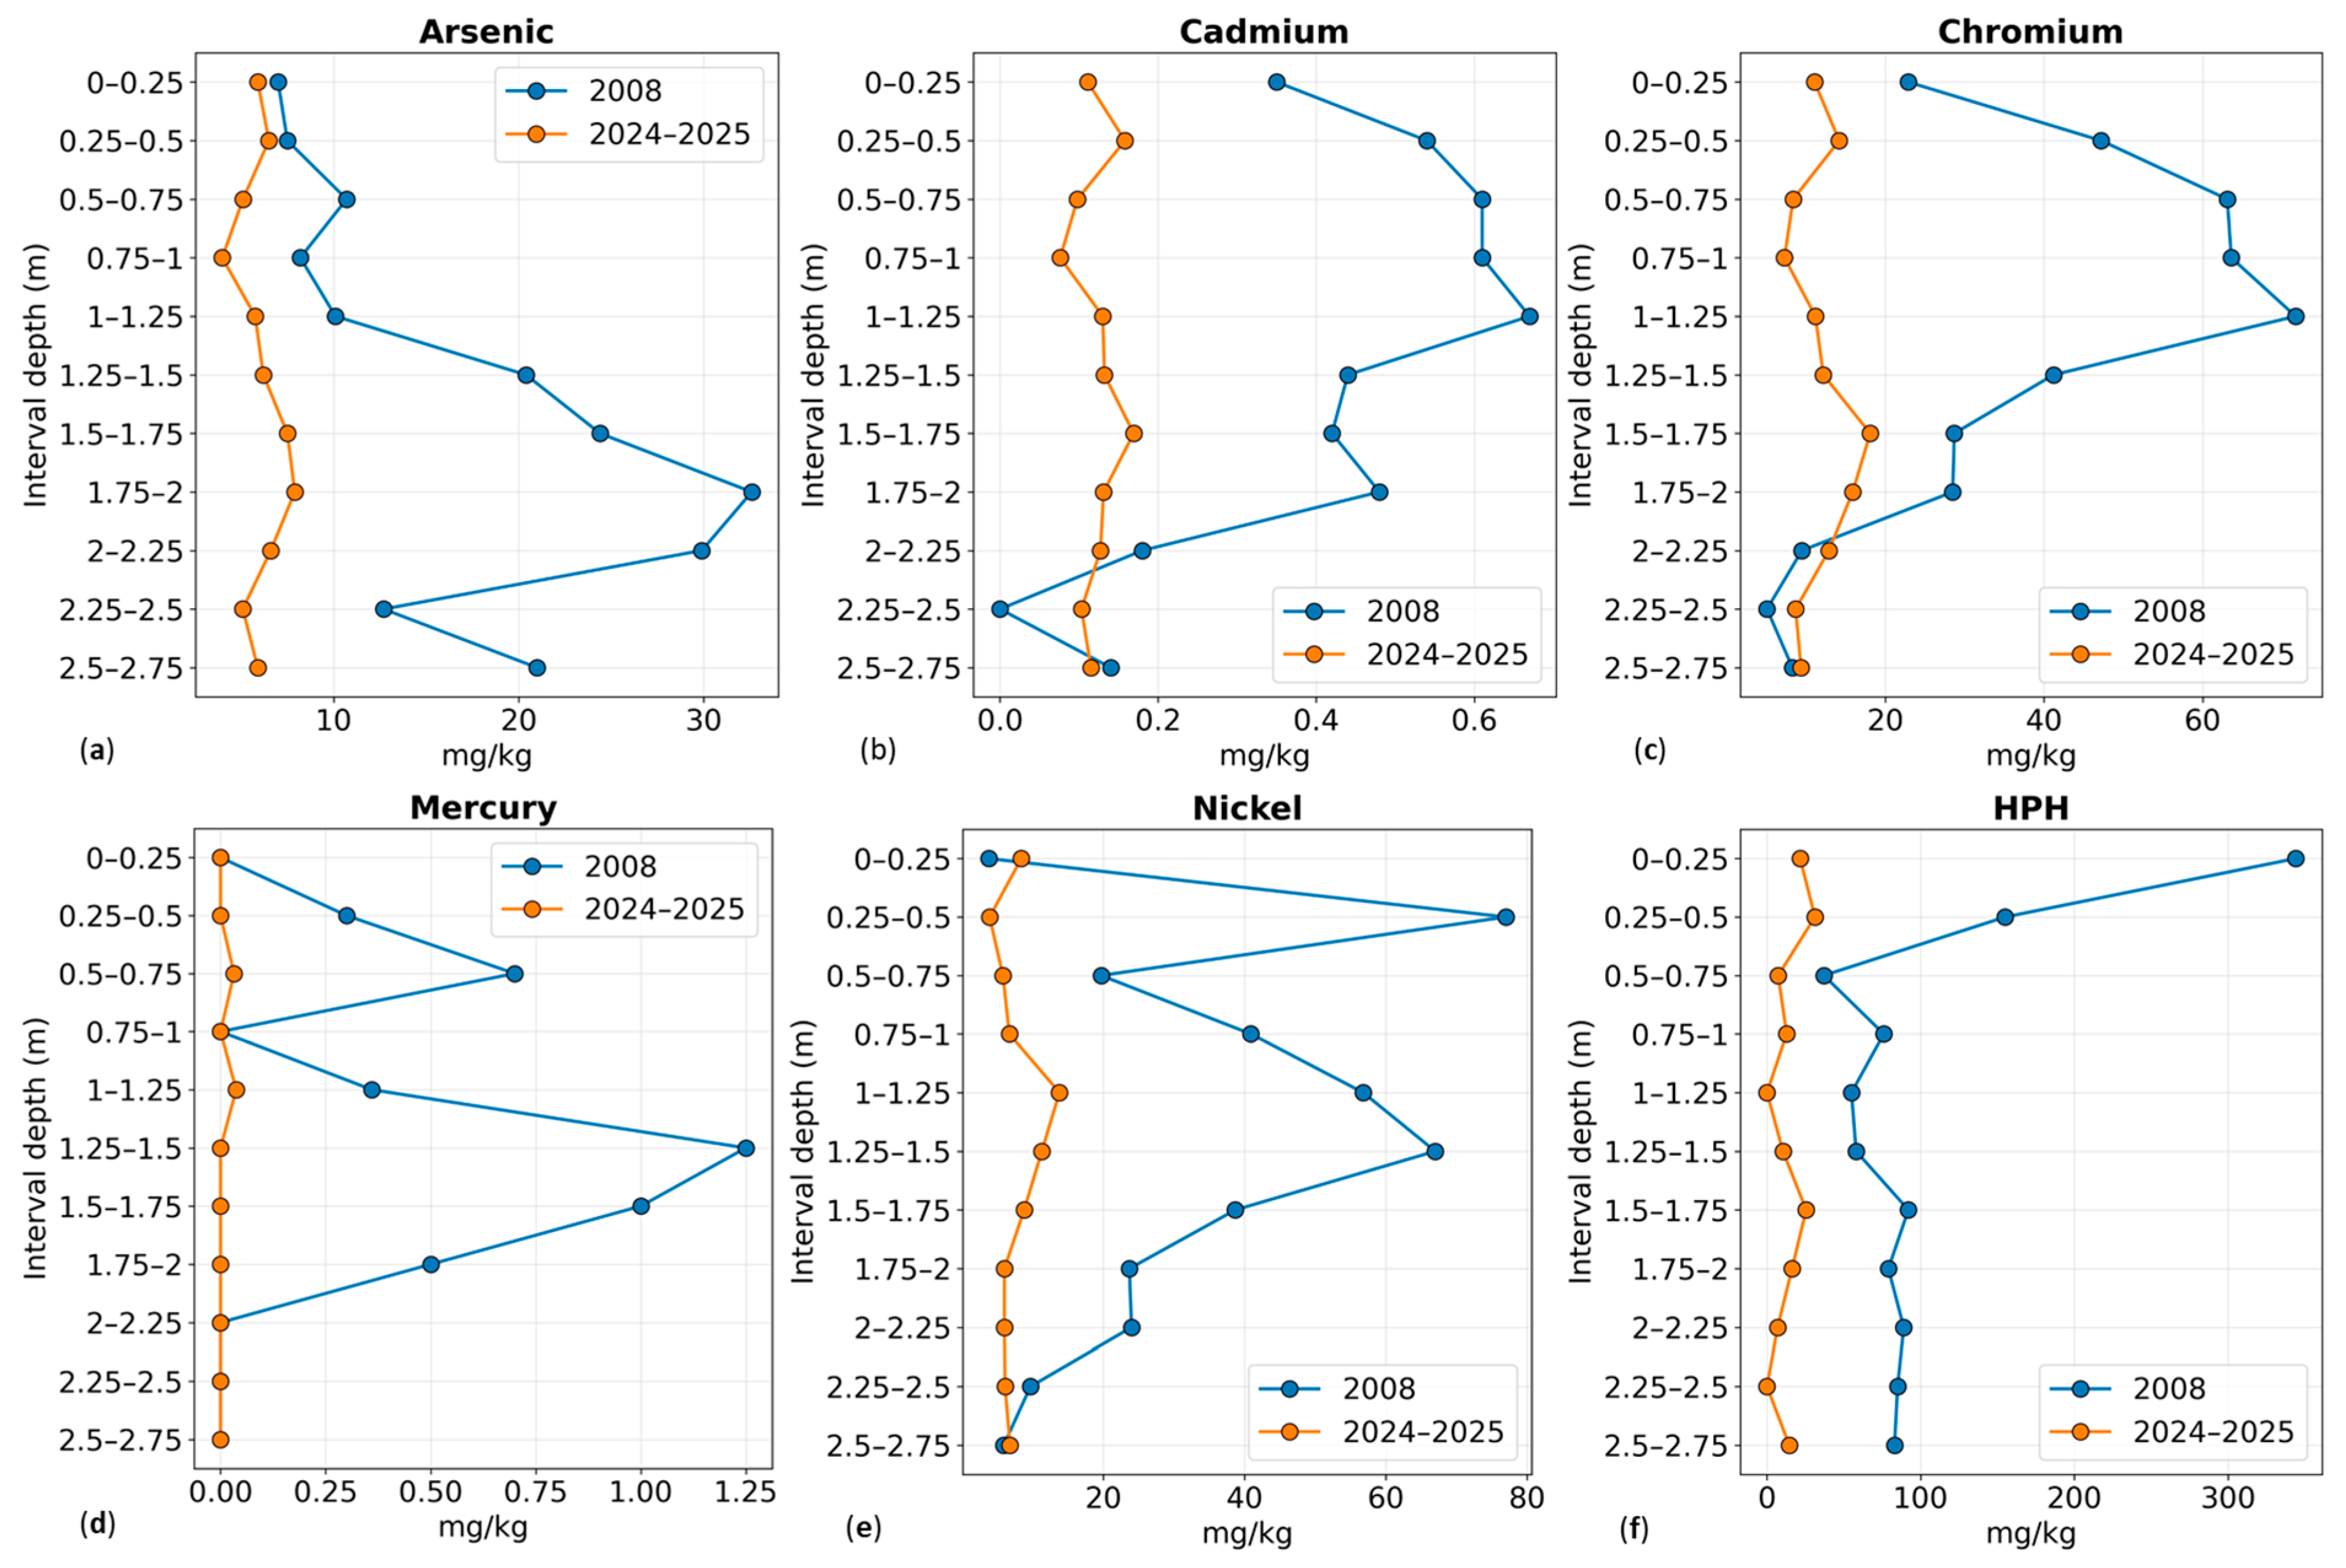
The reconstructed vertical concentration profiles (
Figure 6,
Figure 7 and
Figure 8) provide key insights into the distribution of contaminants within the sediment column and their temporal evolution between the 2008 and 2024–2025 campaigns.
Arsenic concentrations generally exhibit an increasing trend with depth, indicating limited mobility and a low tendency for upward migration toward the overlying water column. This vertical distribution suggests a condition of relative stabilization of arsenic within deeper sediment layers. The comparison between corresponding sampling points from the two campaigns (e.g., A–A′, B–B′, C–C′) highlights a consistent reduction in concentrations across all depth intervals, supporting a progressive attenuation over time. Cadmium concentrations are consistently low and display relatively uniform vertical profiles. However, a marked decrease is observed in the 2024–2025 dataset compared to 2008, with lower concentrations at all investigated depths. Chromium, mercury, and nickel show more heterogeneous vertical distributions, characterized by irregular patterns along the sediment profiles. Despite this variability, a general reduction in concentrations is observed in most locations when comparing the two campaigns. Mercury, in particular, exhibits higher concentrations in the upper sediment layers (0–0.75 m), followed by a decrease with depth, with occasional localized peaks at intermediate depths. Heavy petroleum hydrocarbons (HPHs) display higher concentrations in the upper sediment layers, suggesting a potential interaction with the overlying water column. Nevertheless, vertical profiles clearly indicate a substantial reduction in concentrations across all depth intervals in the 2024–2025 dataset compared to 2008, pointing to significant attenuation processes (
Figure 6,
Figure 7 and
Figure 8).
Overall, the vertical profiles highlight a general decrease in contaminant concentrations over time combined with depth-dependent distribution patterns that reflect both historical deposition and ongoing geochemical processes within the sediment column.
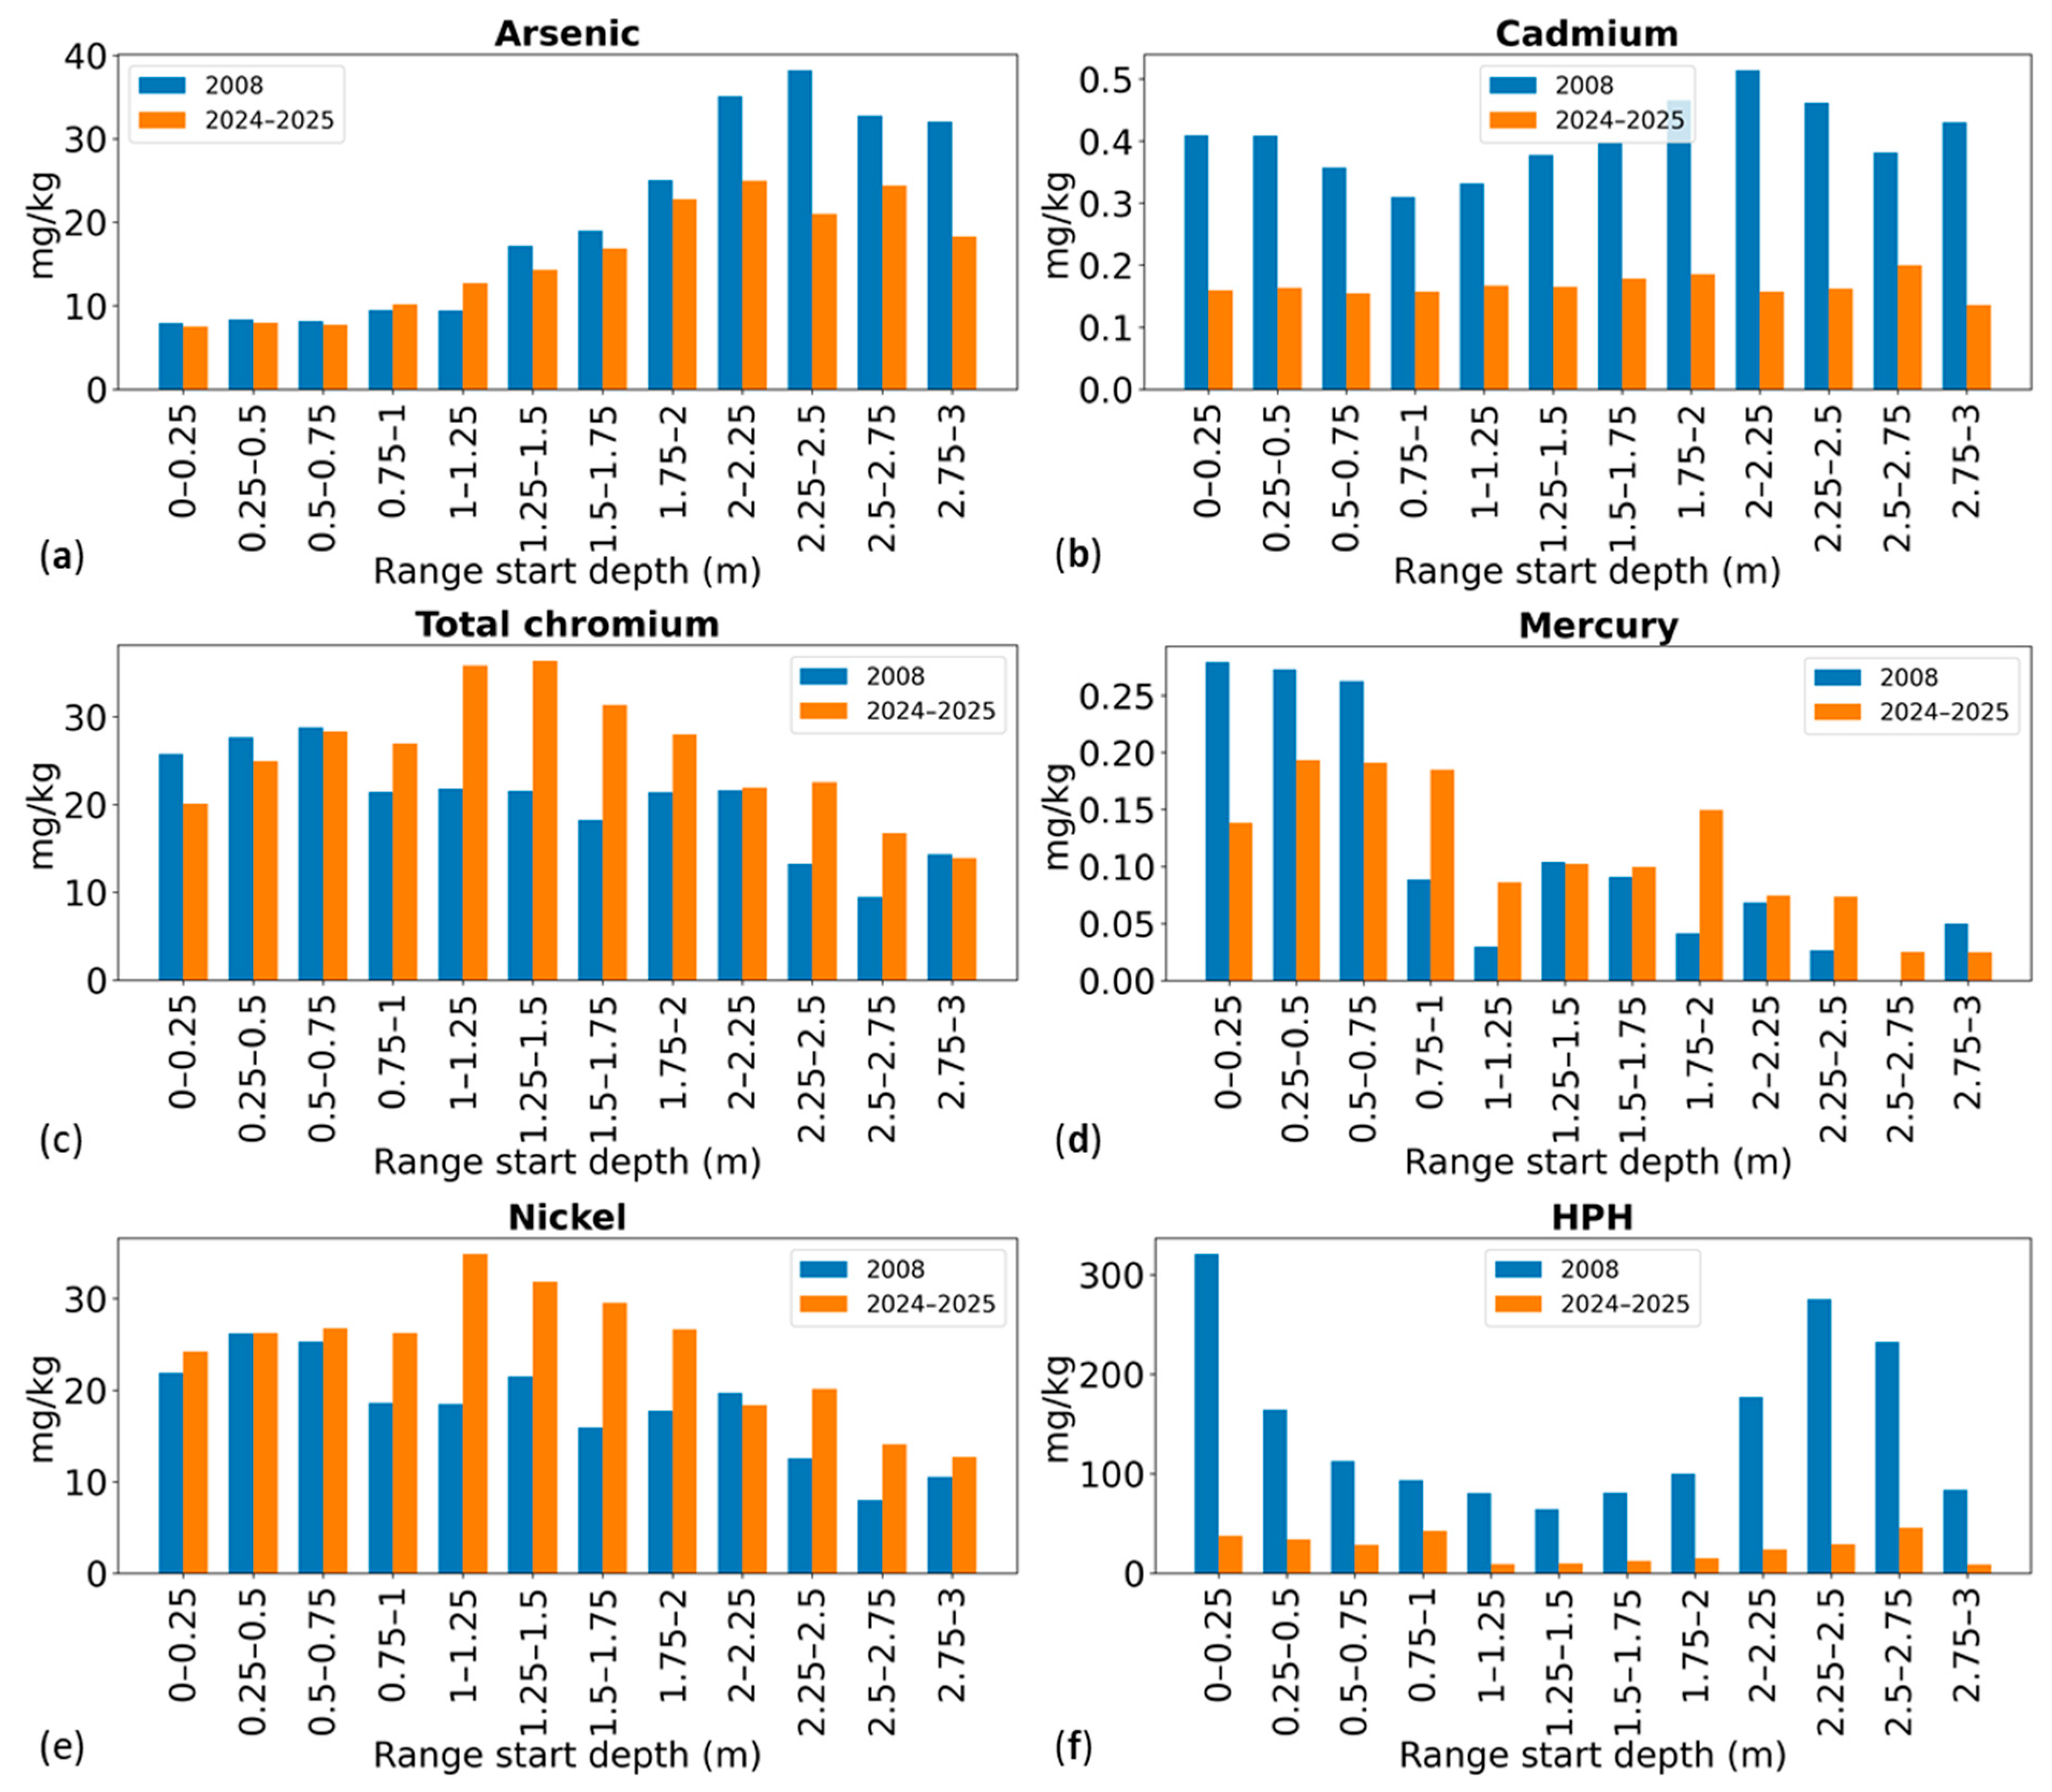
The comparison of mean concentrations for each 25 cm depth interval (
Figure 9) confirms the trends observed in the vertical profiles and provides a quantitative assessment of temporal changes in sediment quality. Arsenic shows comparable concentration levels between the two campaigns, although a reduction in peak values is observed. In 2008, the highest concentrations occur between 2.0 and 2.75 m, reaching 38.22 mg/kg, whereas in the 2024–2025 dataset the maximum value decreases to 24.42 mg/kg and the peak interval shifts slightly upward (1.5–2 m). Cadmium exhibits a significant decrease in concentrations in the recent dataset. The maximum value recorded in 2024–2025 (0.20 mg/kg) is lower than the minimum value observed in 2008 (0.31 mg/kg), indicating a clear overall reduction. Chromium displays different vertical trends between the two campaigns. In 2008, concentrations decrease with depth; meanwhile, in the 2024–2025 dataset, a more regular distribution is observed, with slightly increasing values downward and a peak between 1 and 2 m (maximum 34.88 mg/kg). Mercury shows similar vertical patterns in both datasets, with higher concentrations in the upper layers and decreasing values with depth. However, a slight reduction in overall concentrations is observed in the 2024–2025 campaign. Nickel shows a pattern close to chromium even with slightly lower concentrations. In 2024–2025, a more regular distribution of the concentrations is observed; they reach the highest values between 1 and 2 m deep. HPH concentrations exhibit the most pronounced decrease over time. In 2008, concentrations reached values up to 320.64 mg/kg, whereas in the recent dataset the maximum value is significantly lower (46.83 mg/kg). Moreover, the lowest concentration measured in 2008 exceeds the highest value recorded in 2024–2025, indicating a substantial reduction in hydrocarbon contamination.
The analysis of water samples reveals trends consistent with those observed in sediments. Arsenic concentrations show a marked decrease in mean values, from 17.6 μg/L in 2008 to 2.4 μg/L in 2024–2025. Similarly, HPH concentrations decrease significantly, from 362.5 μg/L to 27.3 μg/L. For all other investigated parameters, concentrations were either below the detection limits or consistently very low, remaining below the threshold values established by current environmental regulations. This indicates the absence of significant contamination for these compounds within the water column. Overall, these results highlight a substantial improvement in water quality over time and further support the interpretation of ongoing natural attenuation processes within the lake system.
3.4. Contaminant Mass Distribution and Temporal Trends
The total mass of sediments within the three lake basins is approximately 7.3 million tons.
Table 1 reports the calculated total mass of each contaminant for the 2008 and 2024–2025 campaigns, along with the percentage variation over time. Overall, the mass of all measured contaminants in 2024–2025 is lower than in 2008 except for nickel, reflecting the trends previously observed in concentration profiles. Despite their environmental relevance, contaminant masses constitute only a small fraction of the total sediment mass, with a maximum contribution of 0.021%.
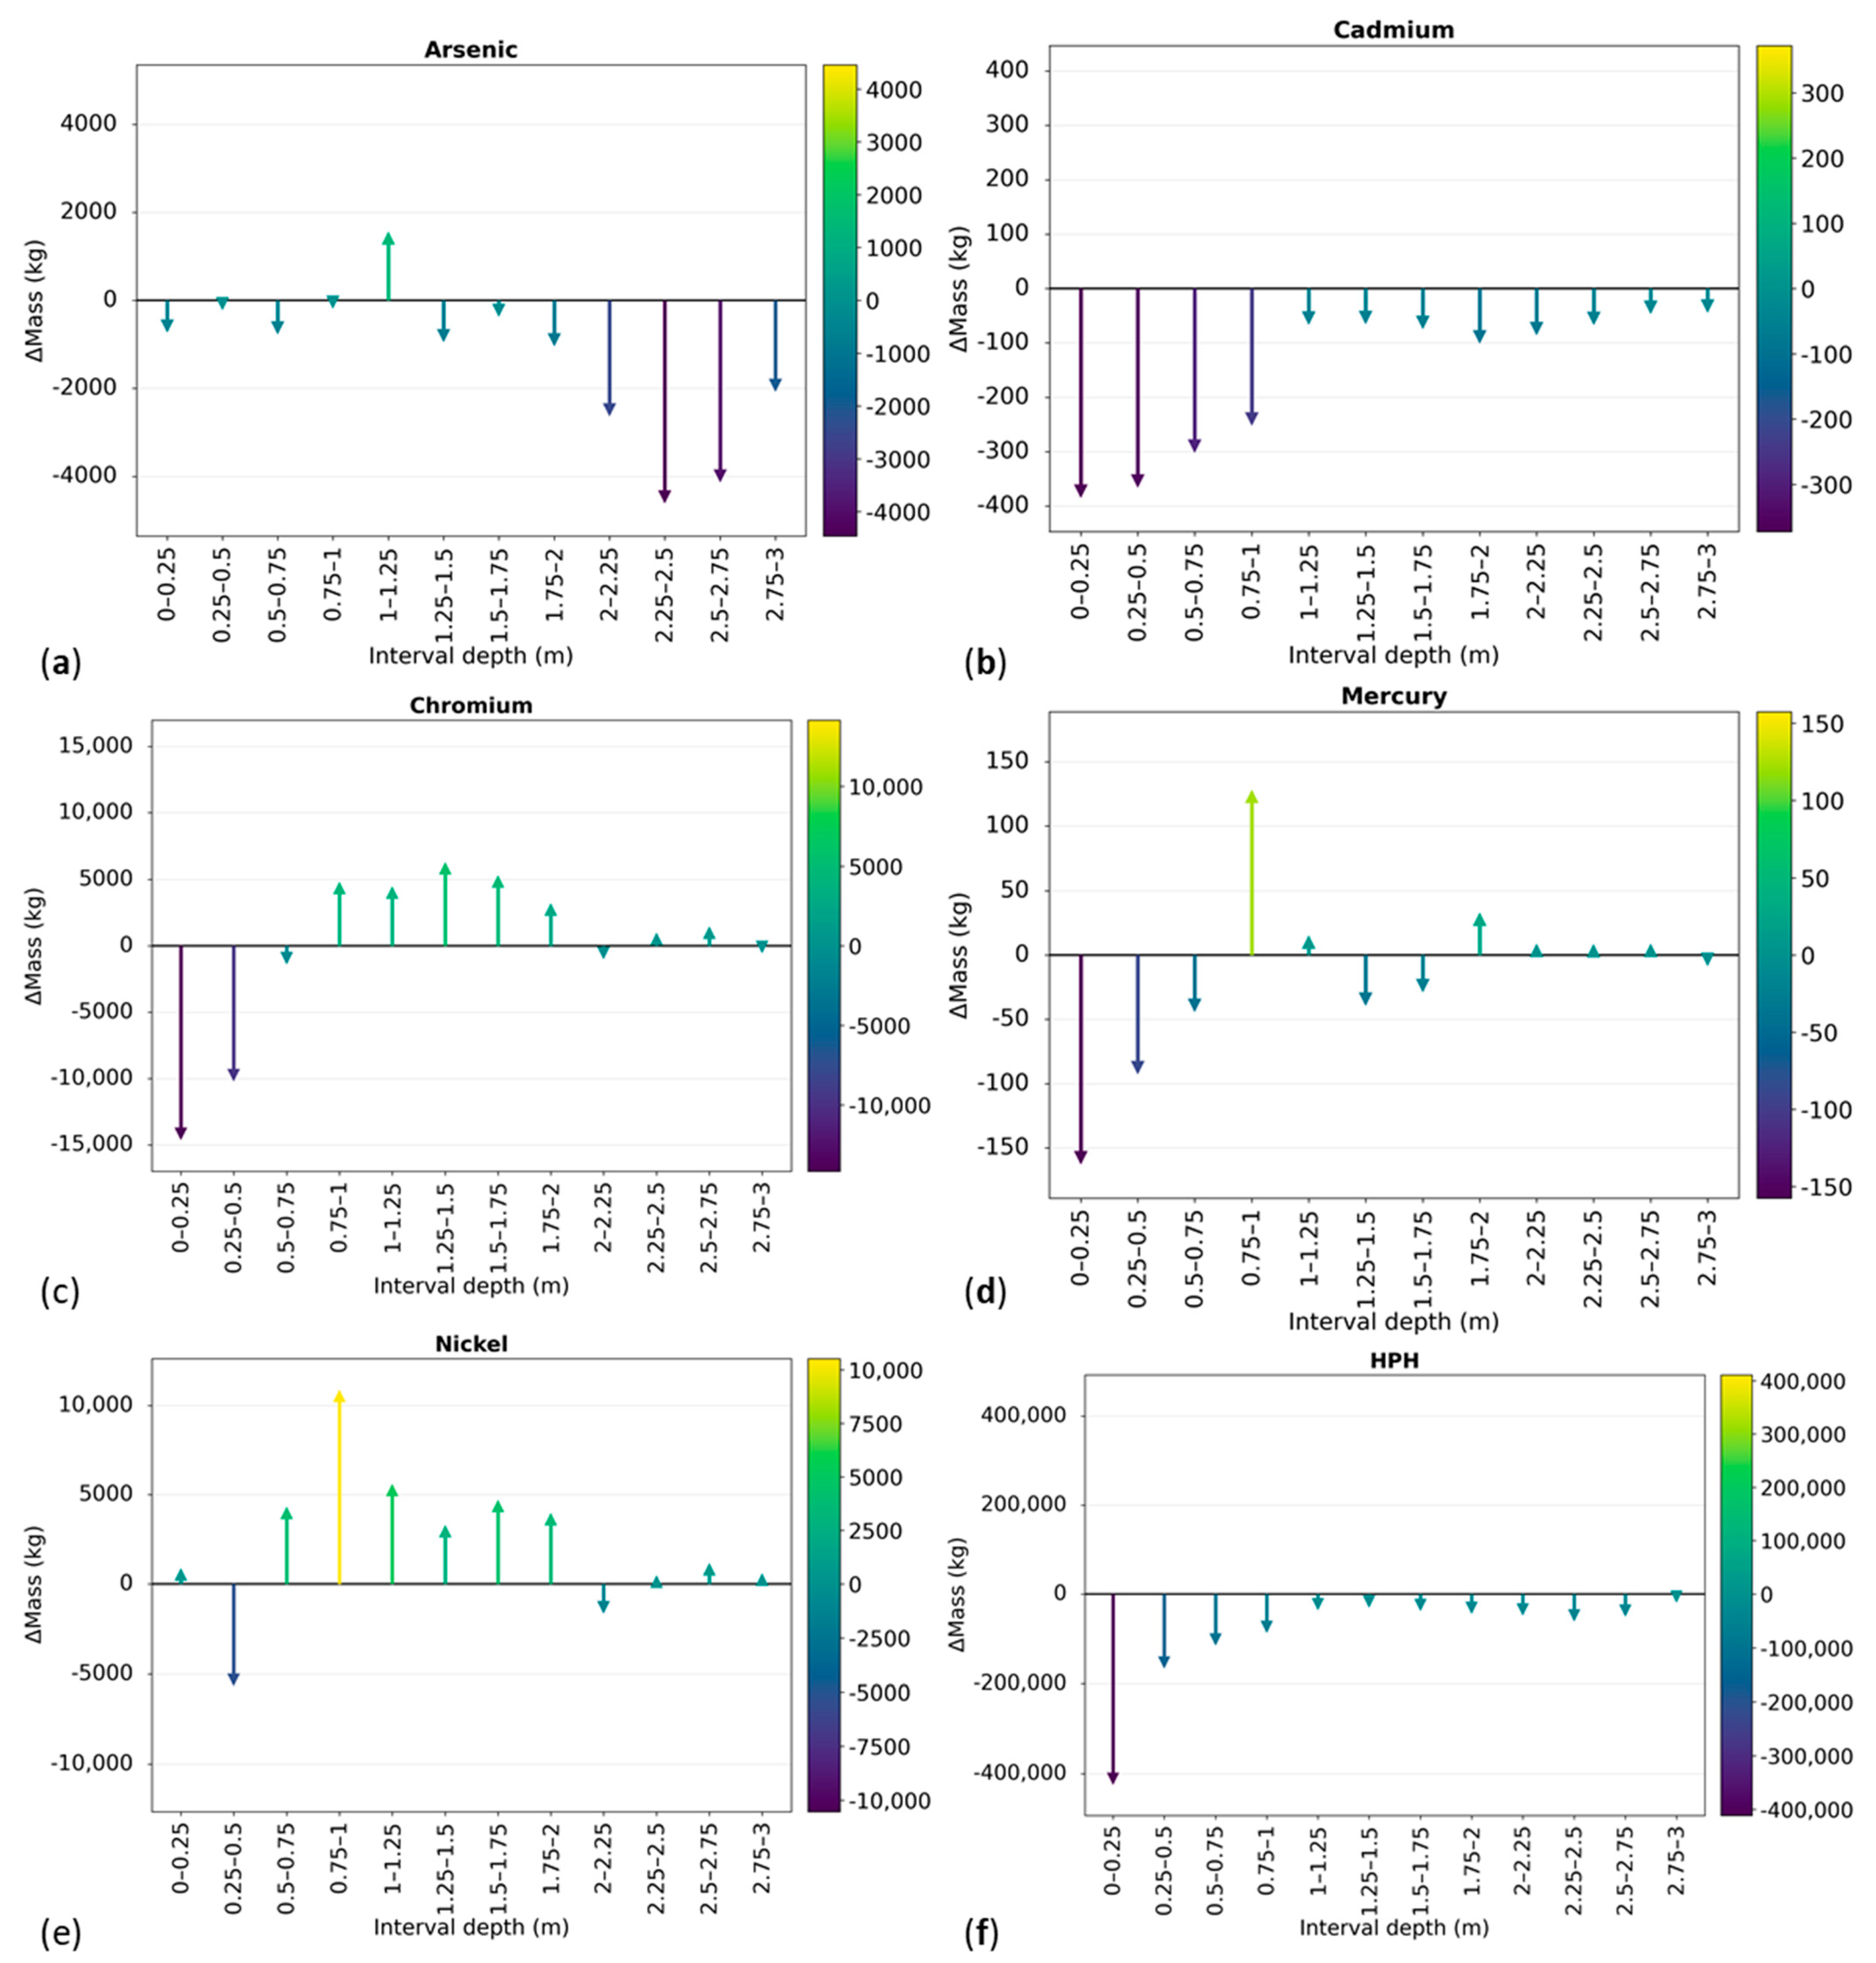
The analysis of contaminant mass along the vertical sediment profiles reveals clear indications of ongoing natural attenuation processes within the lake system (
Figure 10). Arsenic shows limited variation in the upper two meters of sediment: a minor localized increase (~1400 kg) occurred between 1.0 and 1.25 m, followed by a pronounced decrease in deeper layers, with a maximum reduction of ~4330 kg between 2 and 3 m. This pattern suggests limited vertical mobility of arsenic and a substantial stabilization of the element within the buried sediments, consistent with a scenario of progressive sequestration and reduced risk of upward migration to the overlying water column. Cadmium exhibits a uniform decrease throughout all layers, most notably in the upper meter. This systematic reduction supports the hypothesis of contaminant attenuation, potentially driven by sediment burial, geochemical immobilization, and limited remobilization. HPH display a sharp reduction in the uppermost layer (0–0.25 m), with smaller decreases at deeper horizons. The persistence of HPH in deeper sediments alongside the marked reduction near the surface aligns with partial natural biodegradation and dilution processes, highlighting the potential for bioattenuation under favorable microbial and geochemical conditions. Chromium, mercury and nickel show mixed patterns, with notable reductions in the upper three layers (0–0.75 m) and minor increases in intermediate depths, reflecting the complex interplay of sediment layering, geochemical partitioning, and historic contaminant deposition. These trends indicate that the lake sediments are experiencing progressive contaminant stabilization, with surface layers undergoing more rapid attenuation.
The observed decreases in contaminant mass over the 16–17-year interval corroborate the notion that natural processes—including sediment burial, chemical stabilization, and microbial bioattenuation—contribute to the long-term reduction in contaminant bioavailability and potential environmental risk.
4. Discussion
The integration of historical and recent data enabled the development of a three-dimensional (3D) geological model of the Mantua Lakes (Lake di Mezzo, Lake Inferiore, and Lake Vallazza), preserving otherwise partially lost information. These data represent a significant enrichment of the Conceptual Site Model (CSM) towards remediation processes, capturing stratigraphic details, sediment thicknesses, and lateral distribution of lithological bodies that would have remained uncharacterized using only recent surveys [
17,
34,
35,
36].
Although different geostatistical and modelling approaches exist for volumetric estimation, the scope of this study is not to perform a comparative assessment among alternative methods, but rather to demonstrate the applicability of a geology-constrained surface reconstruction framework for submerged environments. Established approaches for subaerial applications include the reconstruction of 3D geological models constrained by digital elevation models (DEMs) [
37], the use of remote sensing techniques for lake volume estimation [
38], and classical cut/fill methods for terrestrial volumetric calculations [
39,
40]. These methodologies are well consolidated in their respective domains, but their direct extension to submerged systems remains less explored. In this context, the present work extends these practices to underwater environments, enabling the estimation of lake water and lakebed sediment volumes through a consistent geology-constrained approach. This allows the VCT framework to be applied in a novel context and provides, to the best of our knowledge, the first integrated reconstruction of lakebed and waterbody volumes for the Mantua Lakes system. A direct comparison with alternative modelling strategies could further strengthen the quantitative assessment of methodological performance. However, such an analysis would require a dedicated study design and lies beyond the scope of the present methodological application.
The approach adopted for contaminant mass estimation, based on assigning a uniform value to each Voronoi polygon associated with a sampling point, represents an innovative methodology. Voronoi polygons are well-established geometric tools which are widely used in spatial analysis and environmental applications for partitioning continuous space based on discrete observation points [
41,
42]. In this study, Voronoi tessellation is used as a spatial discretization framework to associate measured contaminant concentrations with corresponding influence defined by sampling locations. This approach is integrated within a volumetric reconstruction framework to estimate contaminant mass distributions by coupling polygon-based concentration assignments with geometry-derived volume calculations. It is acknowledged that sedimentary systems are inherently heterogeneous, and that contaminant concentrations may vary significantly at both horizontal and vertical scales [
4,
5]. Consequently, the assumption of uniform concentration within each Voronoi polygon represents a first-order simplification. The present study is not intended to provide a fully resolved geostatistical interpolation of contaminant fields, but rather to develop a consistent and reproducible framework for the first-order quantification of contaminant masses within a geometry-constrained Conceptual Site Model. In this context, the Voronoi tessellation was adopted as a pragmatic spatial discretization tool to link point-based chemical measurements with volumetric estimates derived from the reconstructed sediment geometry, minimizing the introduction of additional modelling assumptions associated with geostatistical parameterization [
41,
42]. It is recognized that this simplification may not fully capture fine-scale spatial variability; therefore, future work will focus on incorporating geostatistical interpolation techniques to better represent concentration gradients in dynamic sedimentary environments. Rather than introducing a new Voronoi formulation, the contribution lies in its application within a 3D/4D Conceptual Site Model for contaminated sediment systems, enabling a consistent spatial linkage between chemical measurements and reconstructed sediment volumes. The term 3D/4D Conceptual Site Model adopted in this study does not refer to a fully dynamic numerical simulation, but rather to a spatiotemporal reconstruction framework integrating heterogeneous datasets collected over time. In addition to the comparison between the two main temporal reference states (2008 and 2024–2025), the model incorporates multi-source datasets that are intrinsically distributed in space and time, including historical bathymetry, sediment records, and chemical measurements from multiple campaigns. This structure allows the reconstruction of temporally constrained system states and supports the interpretation of contaminant mass evolution within a unified conceptual framework. Importantly, the model is inherently extendable: each new monitoring campaign can be directly integrated into the same framework, enabling progressive refinement of the temporal resolution and the reconstruction of additional intermediate states. In this perspective, the proposed approach represents an updatable and near-real-time adaptable environmental modelling framework, rather than a static two-time-point comparison. This allows the extrapolation of spatial patterns and contaminant mass distributions to future temporal conditions, as additional monitoring data become available. This method allows indirect parameterization of geogenic, anthropogenic, and microbiological processes contributing to contaminant reduction within the sediments, offering a first attempt to model dynamic attenuation processes in a lacustrine environment, without considering a classical mass balance approach [
43,
44,
45]. Although the 2008 and 2024–2025 datasets were collected using standardized analytical procedures (EPA 3050B and EPA 6020B), temporal comparisons may still be affected by differences in sampling resolution, analytical sensitivity, and survey design. To mitigate these effects, data harmonization procedures were applied, and results were interpreted at consistent spatial and volumetric aggregation scales. Nevertheless, residual methodological uncertainty cannot be fully excluded and may contribute to part of the observed variability. However, the consistency of depth-dependent trends, spatial distribution patterns, and mass balance changes across independent lines of evidence suggests that the identified temporal variations are not solely attributable to methodological bias.
The three-dimensional geological reconstruction of the Mantua Lakes was developed within the CSM framework to provide an integrated representation of the study area and its main geological and geomorphological features. The resulting geological model and grid surfaces were used to constrain and support the bathymetric reconstruction based on field-derived data, thereby improving the estimation of total contaminant loads in sediments and water bodies. A detailed quantitative analysis of the relationships between geological features and the observed vertical and horizontal patterns of contaminant enrichment and depletion is beyond the scope of this study, as it would require a substantially more extensive and spatially resolved geochemical dataset, as also indicated in the literature [
46]. Future investigations should integrate high-resolution geochemical sampling with sedimentological and geostatistical analyses to better resolve the links between sedimentary architecture and contaminant distribution, and to improve the discrimination between geogenic and anthropogenic sources. The present study is based on total (bulk) concentrations of contaminants in sediments and does not include information on their specific chemical forms or speciation. As a result, the potential influence of different species on contaminant mobility, bioavailability, and reactivity cannot be directly assessed. Future studies should incorporate speciation analyses (e.g., sequential extraction procedures or advanced spectroscopic techniques) to better constrain contaminant behavior and improve the mechanistic understanding of their environmental fate. In fact, our main interest was to derive the contaminant load in the environmental matrices, focusing on their depletion, and giving a pragmatic tool to the stakeholders for site management. While it may result in local overestimation, it provides a robust quantitative framework to evaluate ongoing natural attenuation (MNA) processes on a real site.
MNA is a set of physical, chemical and biological processes such as biodegradation, dispersion, dilution, sorption, volatilization, and (bio)chemical stabilization that act to reduce the mass, toxicity, mobility, volume, or concentration of contaminants in soils and groundwater [
47]. MNA processes are well documented in scientific literature [
48,
49]. Ref. [
50] proposed a 50 cm step sediment analysis over 7 years, resulting in MNA constants for degradation rate calculations. In this work, we improved the analysis detail, with a 25 cm step sampling over 17 years. The availability of two monitoring campaigns did not lead us to calculate the MNA constants for degradation rates of contaminants but to obtain the total amount of mass. This allowed us to return the contamination scenario evolution for the CSM of the Mantua Lakes, demonstrating the environmental significance of the sustainable methodology and giving the opportunity to infer on contaminants origin. Comparison of the 2008 and 2024–2025 datasets clearly evidences natural attenuation effects for arsenic, cadmium, chromium, mercury and heavy petroleum hydrocarbons (HPHs), highlighting the method’s utility in identifying contaminant-reduction trends and assessing the long-term stability of sediment-bound contaminants.
HPH and cadmium concentrations and masses show marked differences between 2008 and 2024, consistent with an overall decreasing trend that, in the absence of targeted remediation actions, is plausibly attributable to natural attenuation processes (e.g., MNA). The spatially coherent distribution of this decline across the three lakes further supports the hypothesis that site-wide environmental conditions are conducive to MNA-driven reductions for these elements. A similar interpretation can only be partially extended to arsenic and mercury, where decreasing trends are restricted to specific sediment depth intervals, suggesting more heterogeneous and depth-dependent controls on their mobility and preservation.
Total chromium exhibits increasing concentration despite a slight decrease in its estimated total mass. Conversely, nickel shows increases in both concentration and estimated total mass during the investigated period, demonstrating the capability of the adopted approach to capture not only attenuation but also progressive contamination signals. These upward trends are likely driven by a combination of geogenic and anthropogenic inputs, including natural diagenetic release from sediments, changes in geochemical speciation and mobility, and potential contributions from upstream industrial activities, which are known to be widespread in the surrounding area. However, the current dataset does not allow a robust quantification of the relative contribution of these processes, and therefore no definitive attribution can be made. Future investigations integrating source apportionment tools and high-resolution geochemical or isotopic tracers would be necessary to disentangle the dominant controls on nickel enrichment. Historical data were particularly critical in reconstructing vertical concentration profiles, which otherwise could not have been resolved, providing insights into the temporal evolution of contaminant distribution within the sediment column and, indirectly, within the overlying water column [
51,
52,
53]. This methodology led us to evaluate the possible interaction between water bodies and sediments [
53,
54], even considering the contamination perspective and thus eventual contamination scenarios. The observed trends in contaminant concentrations and estimated masses in both water and surface sediments are data-driven and suggest a dominant role of monitored natural attenuation (MNA) processes, particularly in the water column, together with sediment–water interactions that may contribute to the redistribution of contaminants into the sediment compartment, where further natural attenuation processes may occur over time. The observed temporal decrease in contaminant concentrations should be interpreted in a data-driven framework as the result of multiple co-occurring processes, including MNA within both water and sediment compartments, potential variations in external contaminant inputs, and sediment reworking and transport processes affecting the spatial redistribution of contaminants over time. The next step, in terms of geochemical behavior, would be investigating the factors influencing the degradation processes, especially considering the presence of possible degradation zones patterns along the 3 m of sediments investigated and match it with geochemical and microbiological features for contaminant degradation in situ [
55], integrating experimental knowledge [
56,
57] on a real site. This approach represents an evolution of conventional 3D CSMs into a four-dimensional (4D) framework by integrating historical datasets and estimating contaminant mass within sediment volumes. The integration of multidisciplinary datasets within a 3D/4D Conceptual Site Model represents a key aspect of the proposed approach and provides significant environmental relevance for the characterization and management of complex contaminated lacustrine systems. The use of historical datasets plays a crucial role in constraining the digital reconstruction of both lakebed geometry and associated contaminant distributions. This temporal constraint improves the robustness of the model and enables a more reliable estimation of contaminant mass variations over time, supporting a quasi-4D interpretation of system evolution. The proposed methodology allows the integration of past and present observations into consistent volumetric reconstruction; this is particularly valuable for identifying long-term contamination trends. This, in turn, provides a solid basis for evaluating natural attenuation processes and for supporting the design and optimization of future remediation strategies. The proposed approach contributes to sustainable site characterization and environmental management by combining geometric reconstruction, historical information, and contaminant mass estimation within a unified modelling framework.
Bathymetric data were used to reconstruct lakebed morphology, inferring a lot about the possible original morphology. Being artificial lakes, the original trace of River Mincio is probably represented by the continuous area at 4 m depth, characterizing all the three lakes, especially Lake Inferiore. Beyond their common use for delineating lakebed morphology [
58,
59,
60], were leveraged to parameterize contaminant load quantitatively, offering unique insights into natural decontamination processes and informing sustainable site management strategies for the remaining critical contaminants.
However, the bathymetric dataset used in this study did not include hydrodynamic information such as flow velocity, water-level fluctuations, or water replenishment and exchange dynamics. Consequently, a dedicated hydrodynamic model could not be developed within the present framework. This limitation restricts a more detailed interpretation of contaminant transport processes and water–sediment interactions, particularly in terms of mass balance and redistribution mechanisms. Nevertheless, the integrated geological, bathymetric, and geochemical approach adopted in this study remains effective in reconstructing spatial contaminant distribution patterns and temporal trends across the investigated system. Future improvements of the Conceptual Site Model should incorporate hydrodynamic data and modelling approaches to achieve a more comprehensive characterization of system dynamics and contaminant fate.
The methodology could be further extended by coupling the enhanced CSM approach with numerical modeling or machine learning algorithms, which are already used in contamination issues laboratory studies [
61,
62]; this could transform the model into a predictive tool for contaminant dynamics and remediation outcomes. The integration of such a methodology within a more complex framework, integrating geological, geochemical and microbiological knowledge, would represent a powerful tool for contaminated sites management, especially considering communications with stakeholders. The present study demonstrates that the valorization of historical data, combined with innovative mass estimation approaches, provides a sustainable path toward a comprehensive CSM. This methodology maximizes the use of available information, reduces the need for additional invasive investigations, and offers a solid basis for long-term environmental management, monitoring, and remediation planning.
5. Conclusions
This study presents a 3D/4D Conceptual Site Model (CSM) of the Mantua Lakes system (Italy) based on the integration of multi-temporal datasets collected over ~20 years, including bathymetry, geological constraints, and chemical monitoring data. The systematic use of historical information enabled a temporally constrained reconstruction of morphological and contaminant evolution, significantly improving model robustness and spatial completeness. Historical bathymetric data also supported the digitally constrained estimation of sediment accumulation processes and water column dynamics within a 4D framework. The volumetric reconstruction indicates a total lake system volume increasing from 6.06 × 10⁶ m3 (2008) to 6.12 × 10⁶ m3 (2024), reflecting net sedimentary and geometric adjustments. Correspondingly, total sediment mass shows a slight increase from 7.27 × 10⁹ kg to 7.35 × 10⁹ kg.
Chemical comparisons across the two monitoring campaigns confirm the persistence of contaminant signatures in buried sediments and support the interpretation of the lakebed as an archive of historical contamination. Contaminant mass balance analysis reveals strongly heterogeneous trends, with significant reductions in Cd (−58.1%) and HPH (−76.6%), moderate decreases in As (−14.6%) and Cr (−1.6%), and an increase in Ni (+14.4%), while Hg shows overall depletion. These variations indicate non-uniform attenuation dynamics controlled by sediment stratification, geochemical partitioning, and legacy deposition. Vertical profiles confirm a clear depth-dependent attenuation pattern, with the strongest reductions occurring in the upper 0–1 m of sediments, consistent with burial, dilution, and partial degradation processes. HPH exhibits the most pronounced surface depletion, whereas As and Cd show progressive stabilization at depth, indicating reduced mobility and effective sequestration within the sediment matrix. Contaminant fate is primarily governed by sedimentation-driven burial, which acts as the dominant long-term attenuation mechanism. The sediments behave as a stratified archive of historical contamination, reflecting legacy anthropogenic inputs and ongoing natural attenuation processes.
The integration of historical bathymetric data with GIS-based volumetric reconstruction (VCT approach) enabled a spatially and temporally constrained quantification of contaminant mass distribution. This provides a robust baseline for assessing long-term contaminant evolution and supports future development of geostatistical and process-based modelling approaches. The resulting framework improves the understanding of contaminant fate, burial processes, and legacy pollution, offering a stronger basis for future risk assessment and management strategies in contaminated aquatic systems.





 ,
,