Article

A Technical Feasibility Assessment Using Reservoir Simulation for CO2 Storage in Sarmatian Formations of the Getic Platform, Romania


by
Daniela Doina Neagu
1,
Liviu Dumitrache
2,*,
Silvian Suditu
2,
Gheorghe Branoiu
1,
Timur-Vasile Chis
2,
Cristian Nicolae Eparu
2,
Ioana Gabriela Stan
2,
Alina Petronela Prundurel
2 and
Petronela Cristina Simion
3,*
1
Petroleum Geology and Reservoir Engineering Department, Petroleum-Gas University of Ploiesti, 100680 Ploieşti, Romania
2
Well Drilling, Extraction and Transport of Hydrocarbons Department, Petroleum-Gas University of Ploiesti, 100680 Ploieşti, Romania
3
Department of Entrepreneurship and Management, Faculty of Entrepreneurship, Business Engineering and Management, National University of Science and Technology Politehnica Bucharest, 060042 Bucharest, Romania
*
Authors to whom correspondence should be addressed.
Sustainability 2026, 18(14), 6932; https://doi.org/10.3390/su18146932
Submission received: 25 May 2026 / Revised: 15 June 2026 / Accepted: 2 July 2026 / Published: 8 July 2026

Abstract

Carbon capture and storage (CCS) represents a critical technology for achieving climate neutrality targets, particularly for regions with significant industrial CO2 emissions. This study presents a comprehensive numerical simulation assessment of CO2 geological storage potential in the Sarmatian formations of the Getic Platform, Romania, located near the Turceni power plant—one of Europe’s largest thermal power facilities. Using ECLIPSE 300 compositional simulator with the CO2STORE option, we developed reservoir dynamic models incorporating geological properties, fluid characteristics, and pressure–volume–temperature (PVT) data specific to the Sarmatian aquifer system. Multiple injection scenarios were evaluated, including configurations with 3, 4, and 5 injection wells at varying inter-well distances (2000–10,000 m). The simulations covered a 20-year injection period followed by 300 years of monitoring. While previous assessments have provided static capacity estimates for Sarmatian formations, this study presents the first dynamic simulation-based evaluation of multi-well injection scenarios and long-term CO2 trapping behavior in this geological setting, directly linked to the Turceni Power Plant emissions profile. Results demonstrate that the study area (Zone V) can accommodate the target CO2 injection rate of 2.07 × 10⁶ Sm3/day using five injection wells, with final reservoir pressure increasing only 7–9 bar above initial conditions, well below fracture pressure thresholds (~280 bar). Long-term simulations reveal favorable CO2 trapping behavior, with significant portions immobilized through residual and dissolution trapping mechanisms. The static storage capacity was estimated at 2.44 × 10¹⁴ kg CO2. These findings support the technical feasibility of large-scale CO2 storage in Romanian Sarmatian formations, providing quantitative evidence for CCS implementation strategies in the region.

1. Introduction

The escalating atmospheric concentration of carbon dioxide (CO2) and its contribution to global climate change represents one of humanity’s most pressing environmental challenges [1,2]. The Intergovernmental Panel on Climate Change (IPCC) has identified Carbon Capture, Utilization, and Storage (CCUS) as an essential technology for achieving climate neutrality, projecting it to contribute approximately 15% of cumulative emission reductions necessary for Net Zero objectives [3]. According to recent analyses, fossil fuels continue to account for approximately 80% of global energy needs, contributing roughly 89% of the 3.63 billion tons of annual CO2 emissions [4]. This reality underscores the urgent need for effective carbon management strategies that can bridge the transition to renewable energy systems while maintaining energy security.
Romania faces particular challenges in its decarbonization pathway, with significant CO2 emissions from thermal power generation concentrated in the Oltenia region. The Turceni Power Plant, located in Gorj County on the banks of the Jiu River, ranks among Europe’s largest lignite-fired thermal power facilities with historical installed capacity of 2310 MW [5]. In 2019, Turceni Power Plant ranked third in Romania for CO2 emissions, generating approximately 3.3 MtCO2 annually. The proximity of substantial CO2 emission sources to potential geological storage formations creates favorable conditions for CCS implementation [6].
The Getic Platform, a major geological province in southern Romania, contains extensive Miocene–Pliocene sedimentary sequences including the Sarmatian formations that offer promising CO2 storage potential [7]. These formations, characterized by thick aquifer intervals with favorable porosity and permeability characteristics, represent untapped capacity for geological carbon sequestration. The platform’s structural configuration, with sedimentary cover resting on Precambrian crystalline basement, provides multiple potential reservoir–seal combinations suitable for long-term CO2 containment [8].
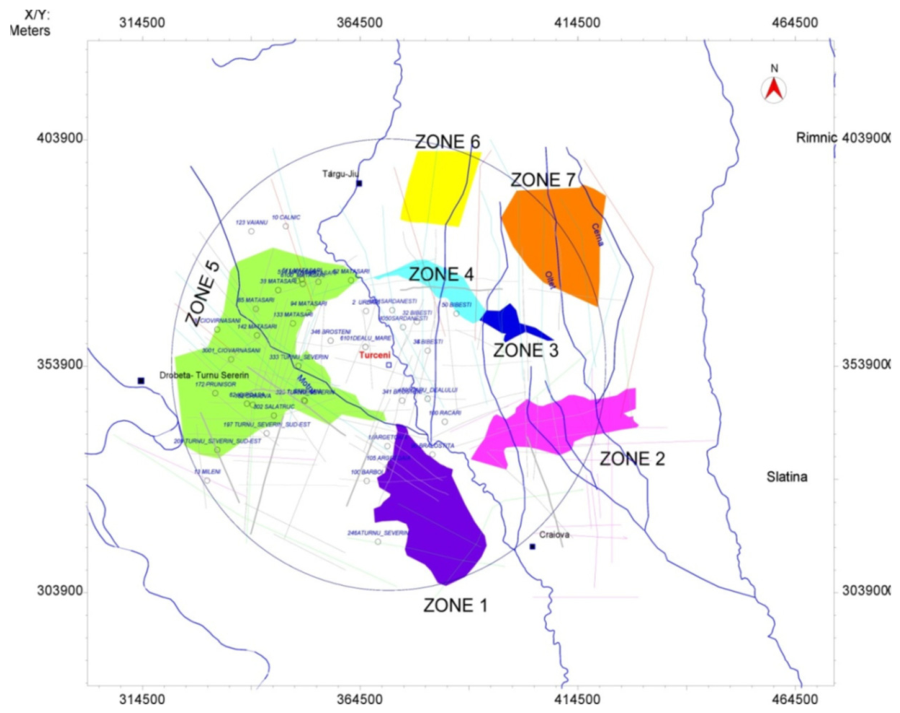
This study presents a comprehensive numerical simulation assessment of CO2 storage feasibility in the Sarmatian formations of the Getic Platform (designated Zone V or Area V in the Romanian CCS Demo Project framework, as presented in Figure 1). Using the ECLIPSE 300 (Schlumberger, Slb presently, Houston, USA, version 2014.1) compositional simulator with the specialized CO2STORE option, we evaluate injection scenarios, storage capacity, and long-term CO2 behavior to provide quantitative technical support for CCS implementation in Romania.
The geological storage of CO2 represents a mature technology with demonstrated success across multiple large-scale projects worldwide. The history of CCUS dates back to the 1970s, with the first large-scale project beginning operation in 1972 at the Kelly Snyder oil field in West Texas, USA [4]. The 1996 Norway Sleipner gas field project marked a significant milestone in dedicated CO2 storage, successfully storing nearly one million tons of CO2 annually in deep saline formations [10]. As of 2022, there are 196 commercial CCUS infrastructure projects worldwide at varying stages of development, with an average CO2 capture capacity of 243.9 Mt/a, although only 30 projects are currently operational [11].
CO2 geological storage relies on multiple trapping mechanisms that evolve over different time scales. Structural and stratigraphic trapping provides immediate physical containment beneath impermeable cap rocks. Residual trapping immobilizes CO2 in pore spaces through capillary forces. Solubility trapping occurs as CO2 dissolves in formation fluids, while mineral trapping represents the most permanent form through conversion to stable carbonate minerals over geological time scales [3,12]. Volpi et al. [13] demonstrated the importance of comprehensive geophysical characterization for storage site assessment, integrating high-resolution seismic surveys, vertical seismic profiles, and electrical resistivity tomography to optimize injection well placement and identify potential leakage pathways.
Injectivity considerations significantly impact CCS project feasibility. Yusof et al. [14] experimentally quantified CO2 injectivity impairment induced by salt precipitation and fines migration, finding direct correlations between brine salinity and injectivity reduction—with impairment ranging from 6% at 6000 ppm to 27.3% at 100,000 ppm salinity. Zoeir et al. [15] developed pore-scale simulations demonstrating that internal media structure, pore-to-throat ratios, and contact angle variations critically influence residual CO2 saturation and trapping efficiency.
Research on CO2 storage in Eastern European geological contexts has expanded significantly. Studies in the Transylvanian Basin have identified depleted gas fields with total CO2 storage capacity potential of approximately 2.30 Gt [6]. Multiple assessments have covered fields across South Romania, including sites in the Getic Basin (Bradu-Albota, Silistea, Babeni, Balteni), the Moesian Platform, and the Pannonian Basin [16]. Cormos and Dinca [17] evaluated post-combustion capture technologies for Romanian power plants, demonstrating technical feasibility of integrating CCS with existing thermal generation infrastructure. The Sarmatian formations, characterized by significant thickness variations (24–130 m for individual complexes) and porosity ranging from 2.3% to 24%, present favorable characteristics for CO2 storage [7,18].
Numerical simulation methodologies for CO2 storage assessment have evolved substantially. The ECLIPSE 300 compositional simulator with CO2STORE option represents an industry-standard tool specifically designed for modeling CO2-brine-rock systems under typical storage conditions (12–100 °C and up to 600 bar) [19]. The CO2STORE module calculates mutual solubilities of CO2 and H2O following the Spycher and Pruess procedure, based on fugacity equilibration between phases, with water fugacity obtained by Henry’s law and CO2 fugacity calculated using a modified Redlich–Kwong equation of state [20]. This approach enables accurate representation of phase behavior including CO2-rich gas phase, H2O-rich liquid phase, and potential solid phase precipitation involving salts (NaCl, CaCl2, CaCO3).
Li et al. [21] investigated CO2 sequestration in low-permeability reservoirs through CO2-EOR operations, finding storage capacities of 0.003–1.16 kg/m3 with positive net carbon storage achievable when reservoir oil gravity exceeds 35° API. Paltsev et al. [22] modeled CCUS deployment scenarios projecting 38–76 Gt CO2 cumulative mitigation by 2100, with hard-to-abate industrial sectors representing primary near-term opportunities. These studies collectively inform the simulation approach and validation framework applied in the present investigation.
Policy frameworks significantly influence CCS deployment trajectories. Terjanika et al. [23] analyzed EU member states’ legislative frameworks for CCUS, identifying Sweden, Croatia, and Belgium as leaders with comprehensive policy scores. The European Union’s climate neutrality objectives and evolving carbon pricing mechanisms under the EU Emissions Trading System create increasingly favorable economic conditions for CCS implementation [24,25]. Romania’s strategic position, with over 30 potential storage sites in depleted hydrocarbon reservoirs offering combined capacity exceeding 514 Mt CO2, positions the country advantageously for CCS development [6].

2. Materials and Methods

2.1. Study Area and Geological Setting

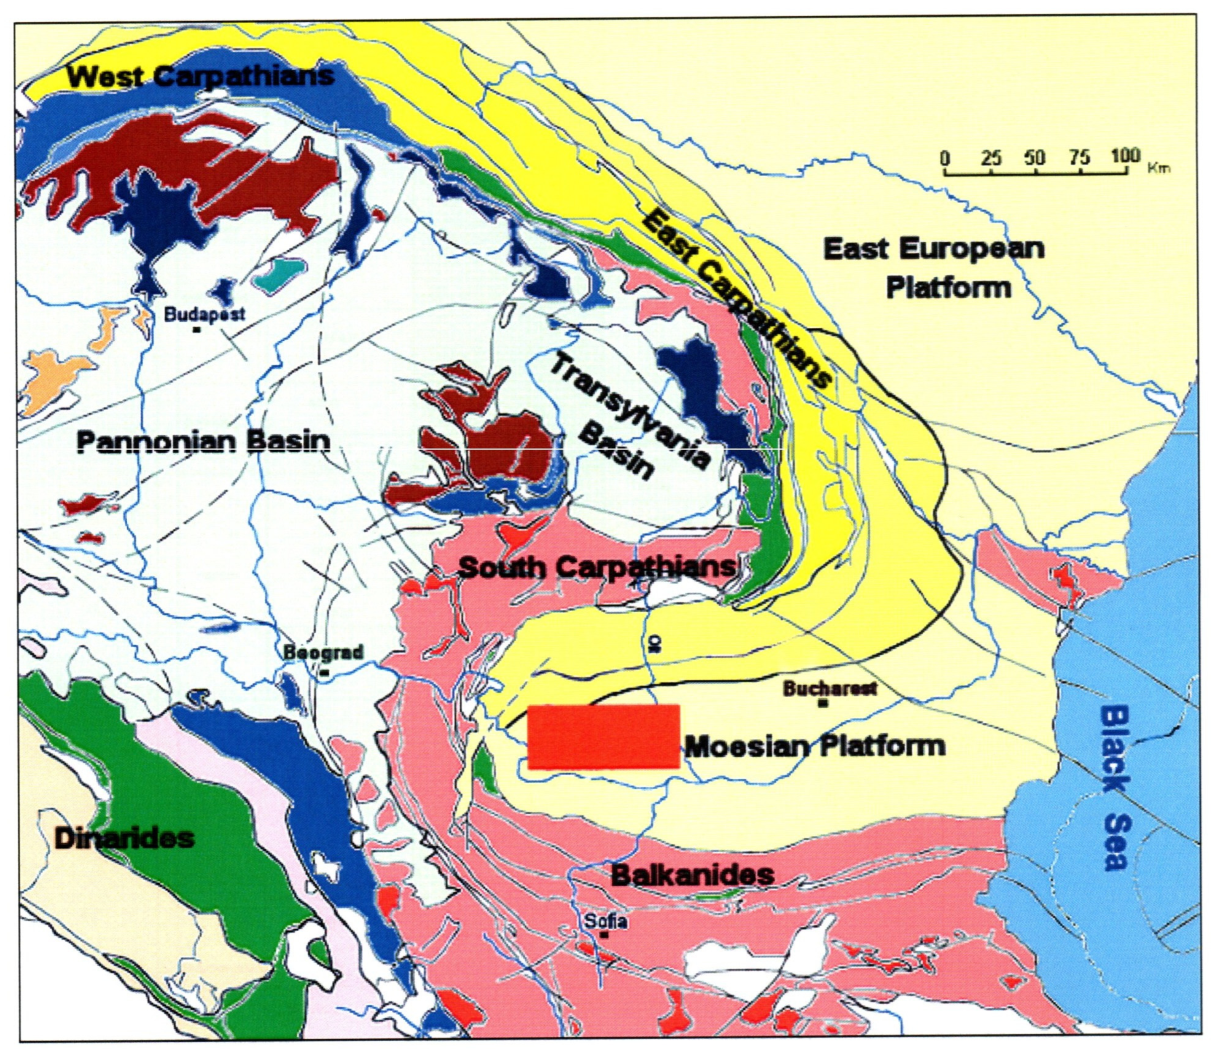
The study area (designated Area V) is located on the Getic Platform in southwestern Romania, approximately 50 km from the Turceni Power Plant. The Getic Platform, belonging to the larger Moesian Platform (Figure 2), consists of thick Mio-Pliocene, Mesozoic and Paleozoic sedimentary cover resting on the Precambrian crystalline schist basement [7,8]. The target formations comprise the Sarmatian aquifer system, which includes multiple reservoir horizons, representing vertically stacked storage opportunities within a thick sedimentary sequence.
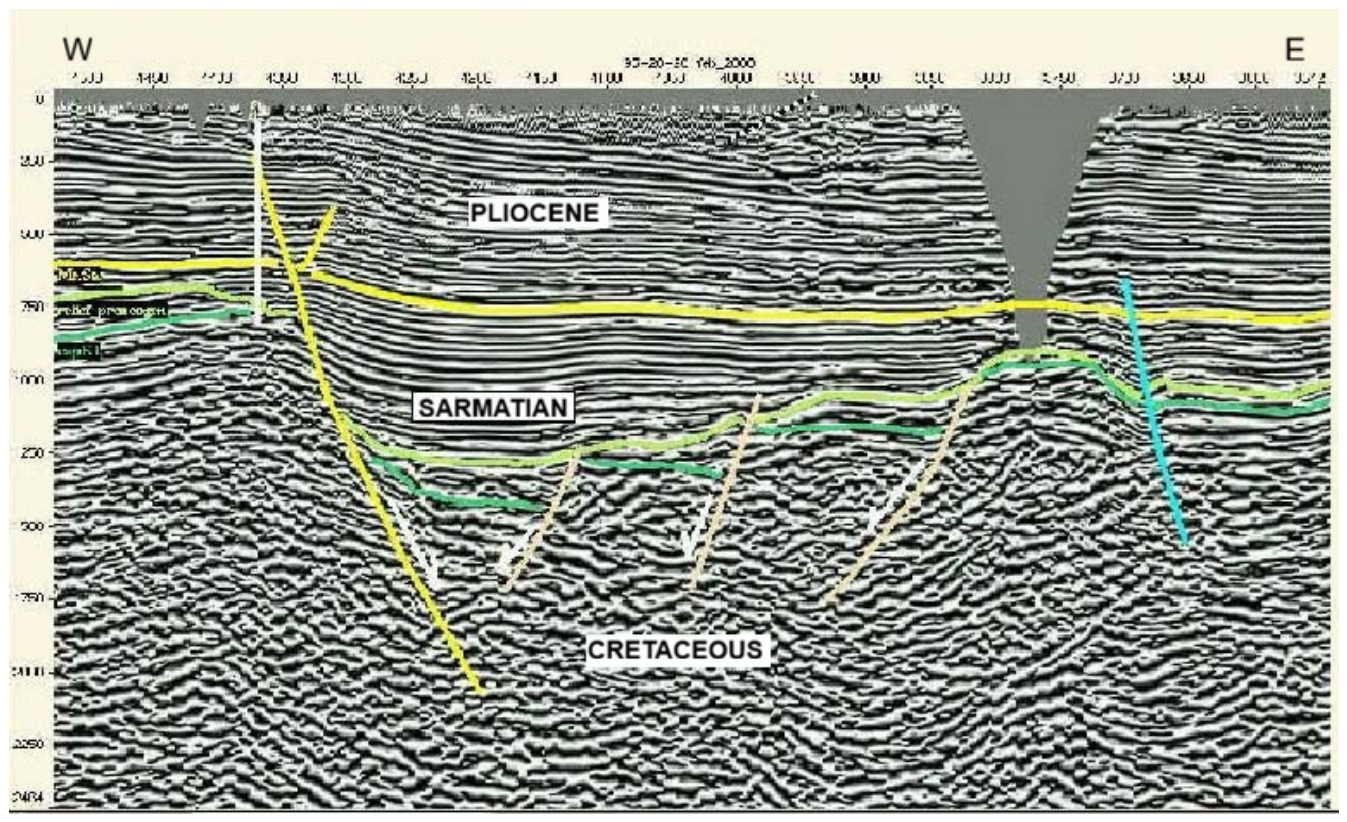
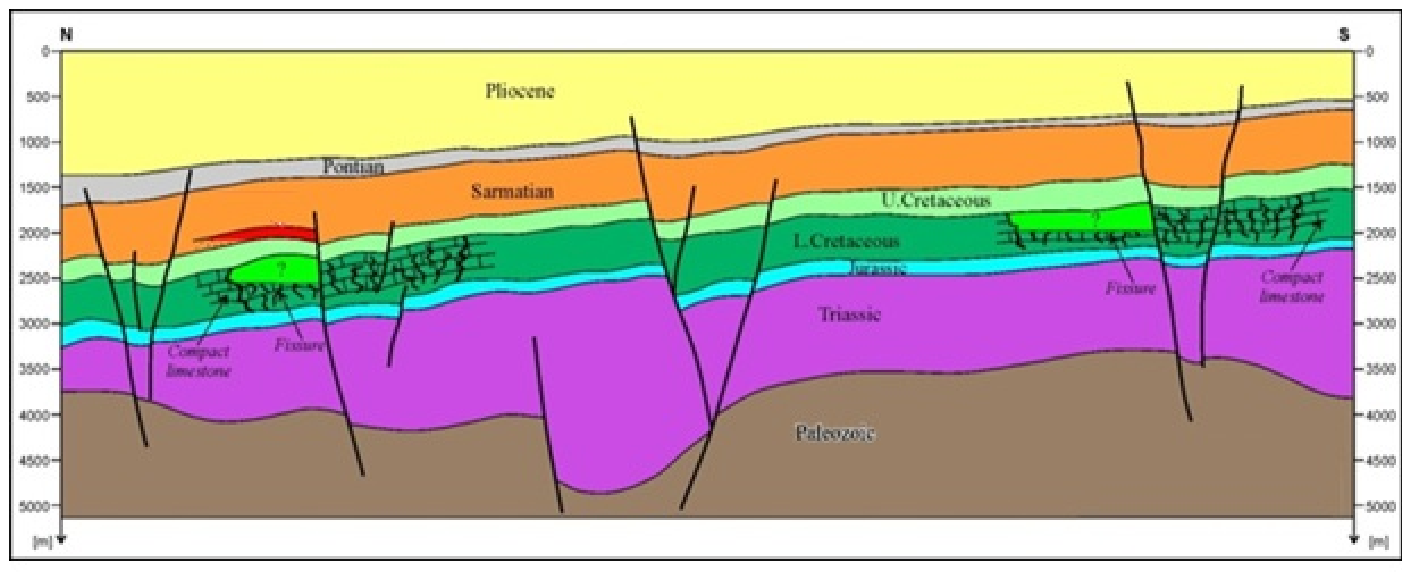
Based on the analysis of available data, the deep-saline formations of Sarmatian age in the Getic Platform were selected for investigation and modeling the potential of CO2 storage capacity. As per Figure 3 and Figure 4, this formation presents good reservoirs at depths ranging from 1000 to 3000 m, consisting of sandstones, conglomerates and sands alternating with clays. The reservoirs have good porosities and permeabilities and are protected by intra-Sarmatian and overlying Sarmatian clay formations.
In the Getic Platform, the Sarmatian formations (displaying thicknesses from 0 to 3000 m) generally maintain a conformable relationship with the underlying Badenian, though it locally overlies mid-Cretaceous tectonic units unconformably. Apart from the region situated west of the Timoc Fault, the upper boundary shows stratigraphic continuity with the Meotian in nearly all locations. In the Eastern sector, the formation either lies conformably upon the Badenian or rests discordantly over Upper Burdigalian deposits, while its contact with the overlying Meotian remains conformable everywhere. Proximal facies of Lower Sarmatian consist of coarse clastic rocks with occasional sandstone and mudstone layers to the north, along with localized skeletal carbonates. To the south, across the Central and Western sectors, this basal sequence grades laterally into a succession of sands and dark marlstones, reaching thicknesses of 1000 m, which were deposited without interruption over Badenian marls. The upper sequence (Upper Sarmatian) is characterized by laminated marlstones in the Western sector, transitioning into silt-rich arenites toward the east. In the Eastern sector, thick sandy units and paraconglomerates, interbedded with marlstone and tuffaceous beds, represent another set of strongly transgressive deposits. In the Bâlteni–Ţicleni subsurface area, south of the Pericarpathian Fault, the Sarmatian has been subdivided into four distinct members: (1) a basal unit of syntectonic sands; (2) a lower member composed of sandy marlstones; (3) a middle sandstone unit (up to 600 m thick) which is post-tectonic and becomes unconformable toward the south; and (4) an upper unit of dark shales (50–500 m) exhibiting source rock potential [8,27,28,29,30].
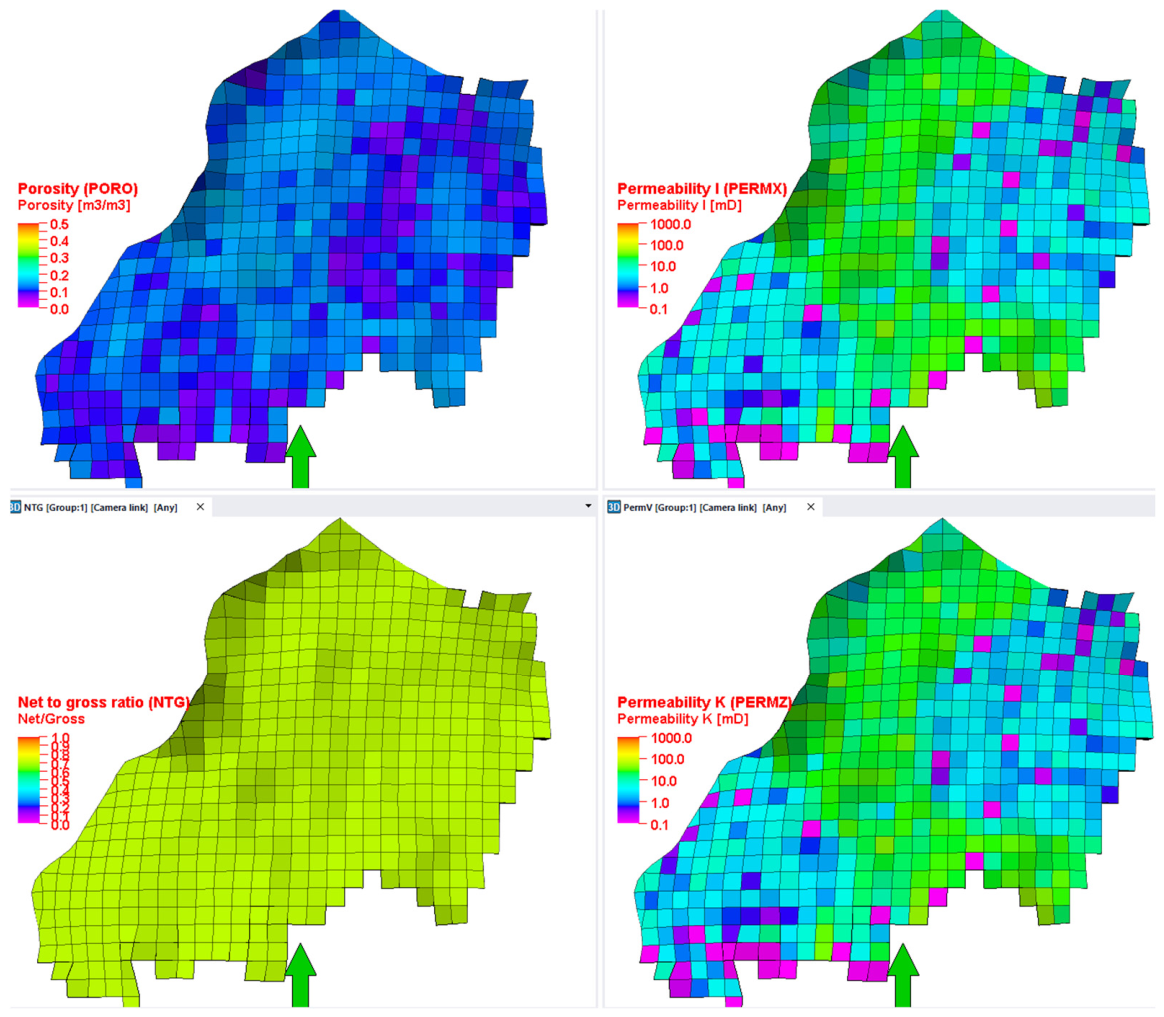
The Sarmatian formations in the study area exhibit favorable petrophysical properties for CO2 storage. The effective porosity, determined as the product of total porosity and net-to-gross ratio (NTG = 0.7), ranges from 3% to 21% with an average of 12%. Horizontal permeability, derived from core data on the neighboring Piscuri-Hurezani structure, ranges from 0 to 50 mD, with typical values between 1.16 and 45 mD. The distributions of these properties are presented in Figure 5. The total thickness of the interest zone is approximately 300 m, providing substantial pore volume for CO2 accommodation [24].
The petrophysical model was validated through history-matched porosity-permeability relationships from the neighboring Piscuri-Hurezani structure, which shares the same Sarmatian depositional system. Where direct core measurements were unavailable, porosity-permeability transforms derived from these analog data were applied. We acknowledge that the absence of core data from within the study area itself represents a source of uncertainty; sensitivity analyses on key parameters (injection pressure coefficients of 0.80, 0.85, and 0.90; well spacing of 2000–10,000 m) were therefore conducted to bound the expected performance envelope, as discussed in Section 3.
Formation water chemistry reflects typical saline aquifer conditions, with NaCl comprising 7.5% and CaCl2 comprising 1.5% of dissolved salts. These salinity levels were incorporated into the simulation model through the CO2STORE SOLID option, which accounts for salt precipitation during CO2 injection and its potential impact on injectivity. Initial water saturation throughout the formation is 100%, confirming the aquifer nature of the target storage complex [24].

2.2. Reservoir Pressure and Temperature Characterization

In the absence of direct pressure measurements in the Sarmatian formations (which have not been targets for hydrocarbon exploitation), reservoir pressure (Pp) was calculated using a hydrostatic gradient approach. The pressure gradient (Gp) was established at 0.11–0.12 bar/m based on correlation with adjacent oil structures, yielding the relationship Pp = Gp × H, where H represents depth. At the average reservoir depth of approximately 2000 m, this corresponds to reservoir pressures of 156–222 bar depending on specific well locations [24].
Temperature distribution was modeled using a geothermal gradient approach, with a surface temperature (T0) of 10 °C and depth-dependent variation calibrated to measurements of 28 °C at 600 m and 130 °C at 4000 m depth, yielding a gradient of approximately 3 °C/100 m. Fracture pressure gradient was estimated at Gf = 0.18 bar/m using the relationship Gf = Gp + (Glit − Gp) × (ν/(1 − ν)), incorporating lithostatic gradient (Glit = 2.1–2.18 bar/10 m) and Poisson coefficient (ν = 0.4–0.44) data from local statistical compilations. Maximum injection pressure was constrained to 0.85 × Gf × H to maintain safe operating margins below fracture initiation thresholds, resulting in bottom-hole pressure limits of 217–309 bar depending on well depth as per Table 1 [24].
In Table 2 below, a summary of the essential geological and fluid model parameters is presented: data sources, assumptions, and uncertainty ranges.

2.3. Simulation Software and Modeling Approach

Dynamic reservoir simulations were performed using ECLIPSE 300, a compositional numerical simulator developed by Schlumberger, with the specialized CO2STORE option activated [18,19]. This configuration enables accurate modeling of CO2-H2O mutual solubilities under typical storage conditions, following the thermodynamic framework of Spycher and Pruess. The CO2STORE module considers three phases: a CO2-rich phase (labeled gas), an H2O-rich phase (labeled liquid/water), and a solid phase for salt precipitation. Fluid components specified using the COMPS keyword include CO2, H2O, NaCl, and CaCl2.
The static geological model was constructed in Petrel 2014.2 software and exported directly to ECLIPSE format, including grid coordinates (COORD), corner-point depths (ZCORN), effective porosity (PORO), horizontal permeability (PERMX/PERMY), and active cell indicators (ACTNUM). The dynamic model comprises 74 simulation layers across three major vertical zones, with vertical resolution varying from 0.25 m to 15.24 m. Global grid dimensions of 2000 × 2000 m were employed, with local grid refinement (LGR) ranging from 100 × 100 m to 500 × 500 m near injection wells to capture detailed CO2 plume behavior [24].
Relative permeability functions for the water–CO2 system were derived from literature correlations appropriate for sandstone formations, as per Table 3. The water relative permeability curve spans from Krw = 0 at connate water saturation (Sw = 0.30) to Krw = 1.0 at Sw = 1.0, while gas relative permeability increases from Krg = 0 at Sg = 0 to Krg = 1.0 at Sg = 0.70. Rock compressibility was determined from Hall’s and van der Knaap’s correlations for unconsolidated sandstones, yielding Cr = 5 × 10⁻⁵ bar−1 at 120 bar reference pressure based on mean porosity of 22.7% and burial depth of 800 m. Water compressibility was set at Cw = 4.5 × 10⁻⁵ bar−1 [24].

2.4. Simulation Scenarios

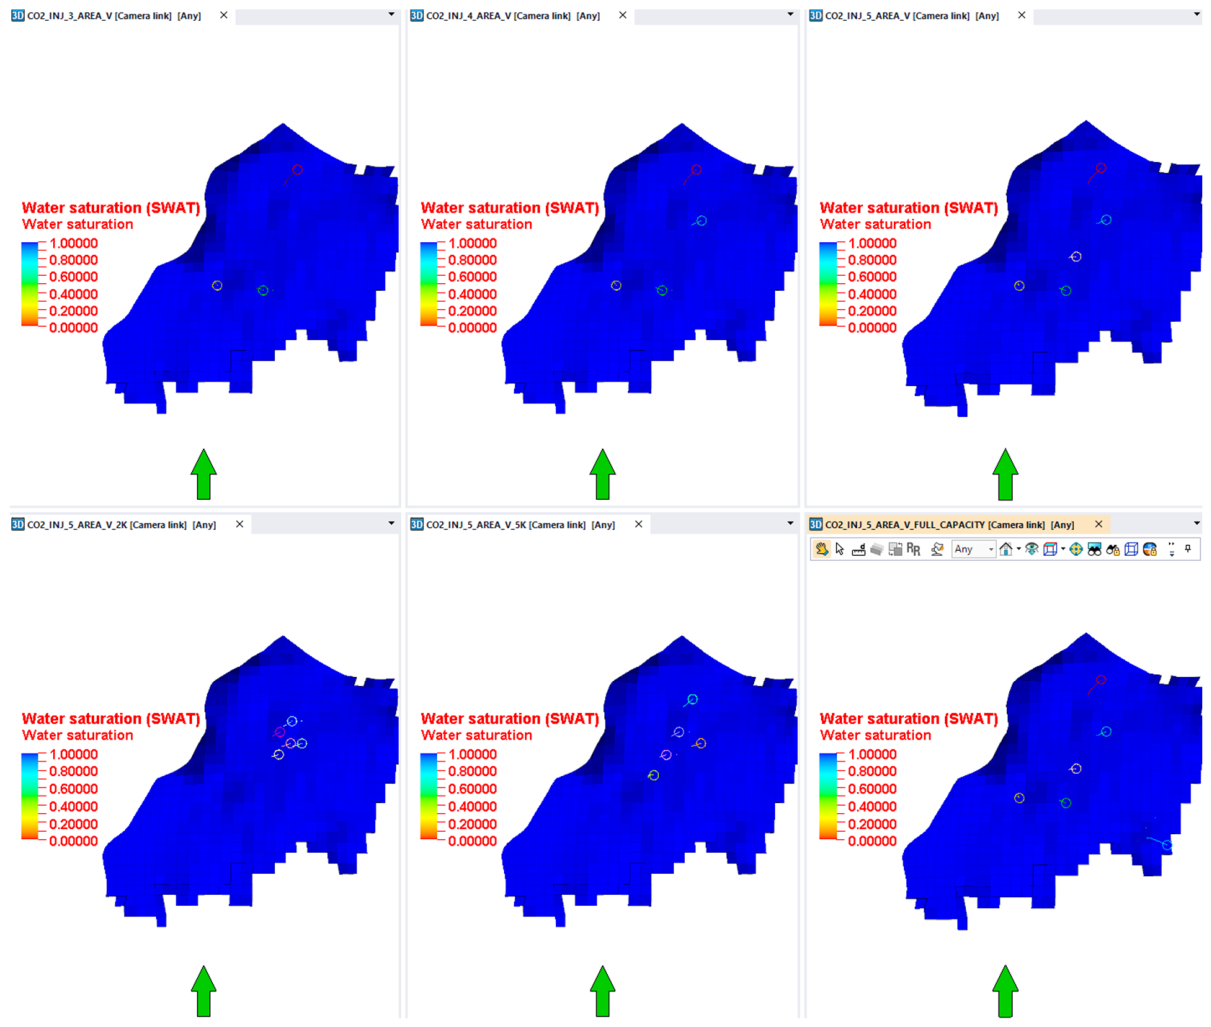
Multiple injection scenarios were designed to evaluate system performance under varying configurations. As per Figure 6, the primary scenarios include (1) CO2_INJ_3_AREA_V with 3 injection wells; (2) CO2_INJ_4_AREA_V with 4 injection wells; (3) CO2_INJ_5_AREA_V with 5 injection wells at approximately 10,000 m spacing; (4) CO2_INJ_5_AREA_V_5K with 5 wells at 5000 m spacing; (5) CO2_INJ_5_AREA_V_2K with 5 wells at 2500 m spacing; and (6) CO2_INJ_5_AREA_V_PSEUDO_OB incorporating a horizontal pseudo-production well to simulate open boundary conditions [24].
All scenarios employed a target CO2 injection rate of 2.07 × 10⁶ Sm3/day (equivalent to approximately 3.3 Mt/year), corresponding to the annual CO2 emissions from Turceni Power Plant. The simulation timeline comprises injection starting 1 January 2025, continuing for 20 years through 2045, followed by a 300-year monitoring period extending to 2345. This extended timeframe enables assessment of long-term CO2 fate including pressure dissipation, plume stabilization, and trapping mechanism evolution [24].

3. Results

3.1. Injection Performance and Well Behavior

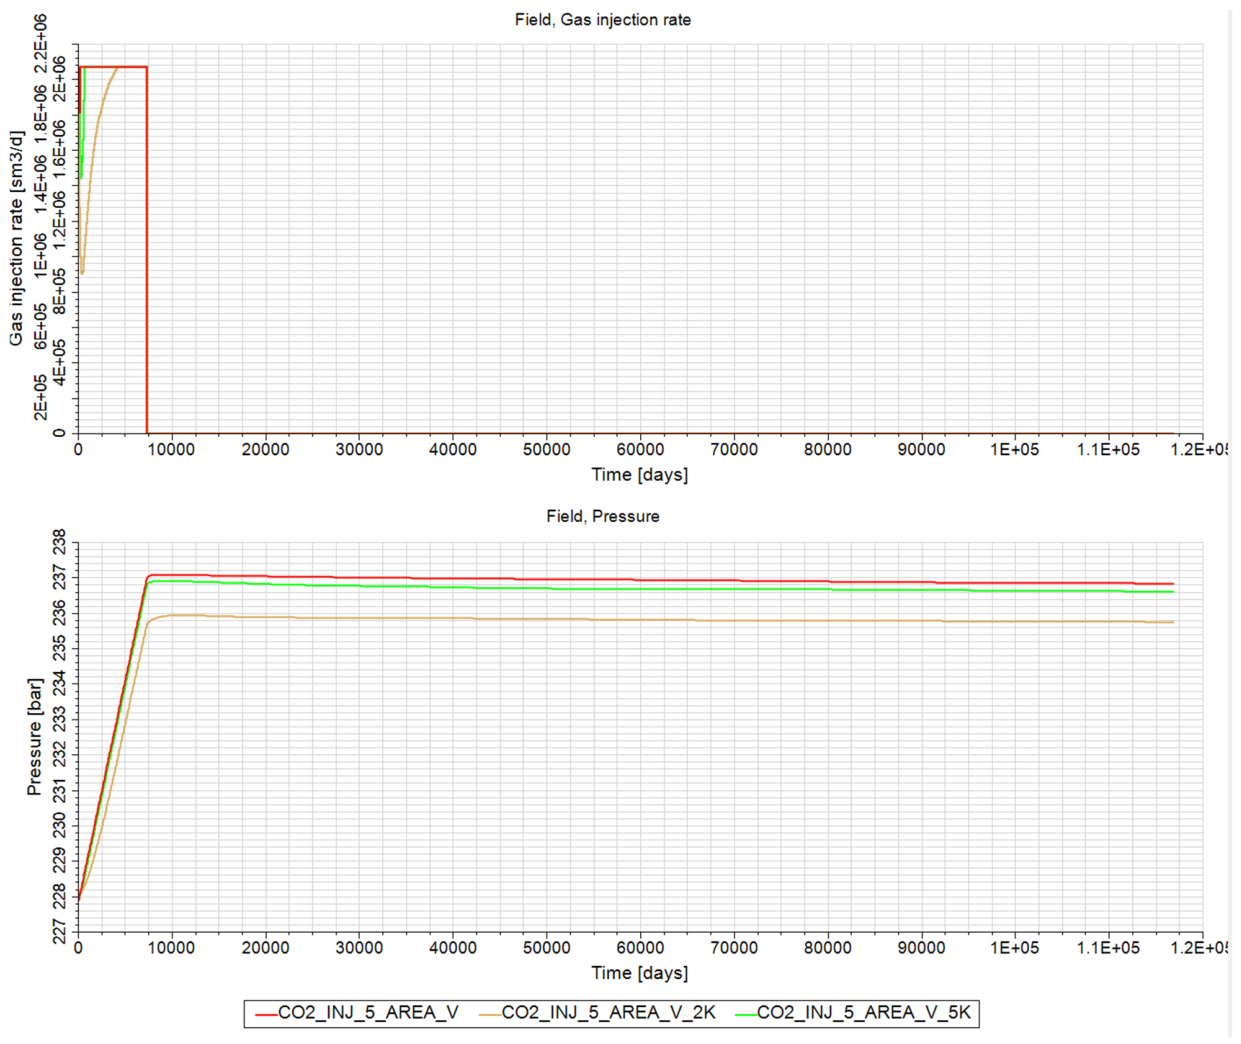
The simulation results demonstrate that the target CO2 injection rate can be successfully achieved using 5 injection wells (scenarios CO2_INJ_5_AREA_V and variants), while configurations with 3 or 4 wells proved insufficient to accommodate the full injection volume. Table 4 and Figure 7 summarize the dynamic parameters across the primary five-well scenarios at key time points during the injection (2025, 2045) and post-injection monitoring (2345) periods.
The field pressure evolution shows a modest increase of approximately 7–9 bar over the 20-year injection period, from initial values of 227–228 bar to final injection-phase pressures of 235–237 bar.
This pressure buildup remains well below the estimated minimum fracture pressure of 280 bar (calculated for the shallowest perforation at 1635 m depth), confirming safe operating conditions throughout the injection program.
Moreover, it can be noticed that between years 2045 and 2345 the field pressure drops slightly due to the different trapping mechanisms (solubility and mineral) which are still active. The reservoir’s large pore volume (total pore volume at reference pressure: 44 × 106 RM3) provides substantial accommodation capacity for the injected CO2 volume [24].
Injectivity indices varied among wells depending on their structural position and local reservoir quality. Well INJ2N, located at the shallowest depth (top perforation 1417 m), exhibited the lowest injectivity indices across multiple scenarios, while wells in structurally deeper positions (INJ4N at 2019 m) showed superior injectivity.
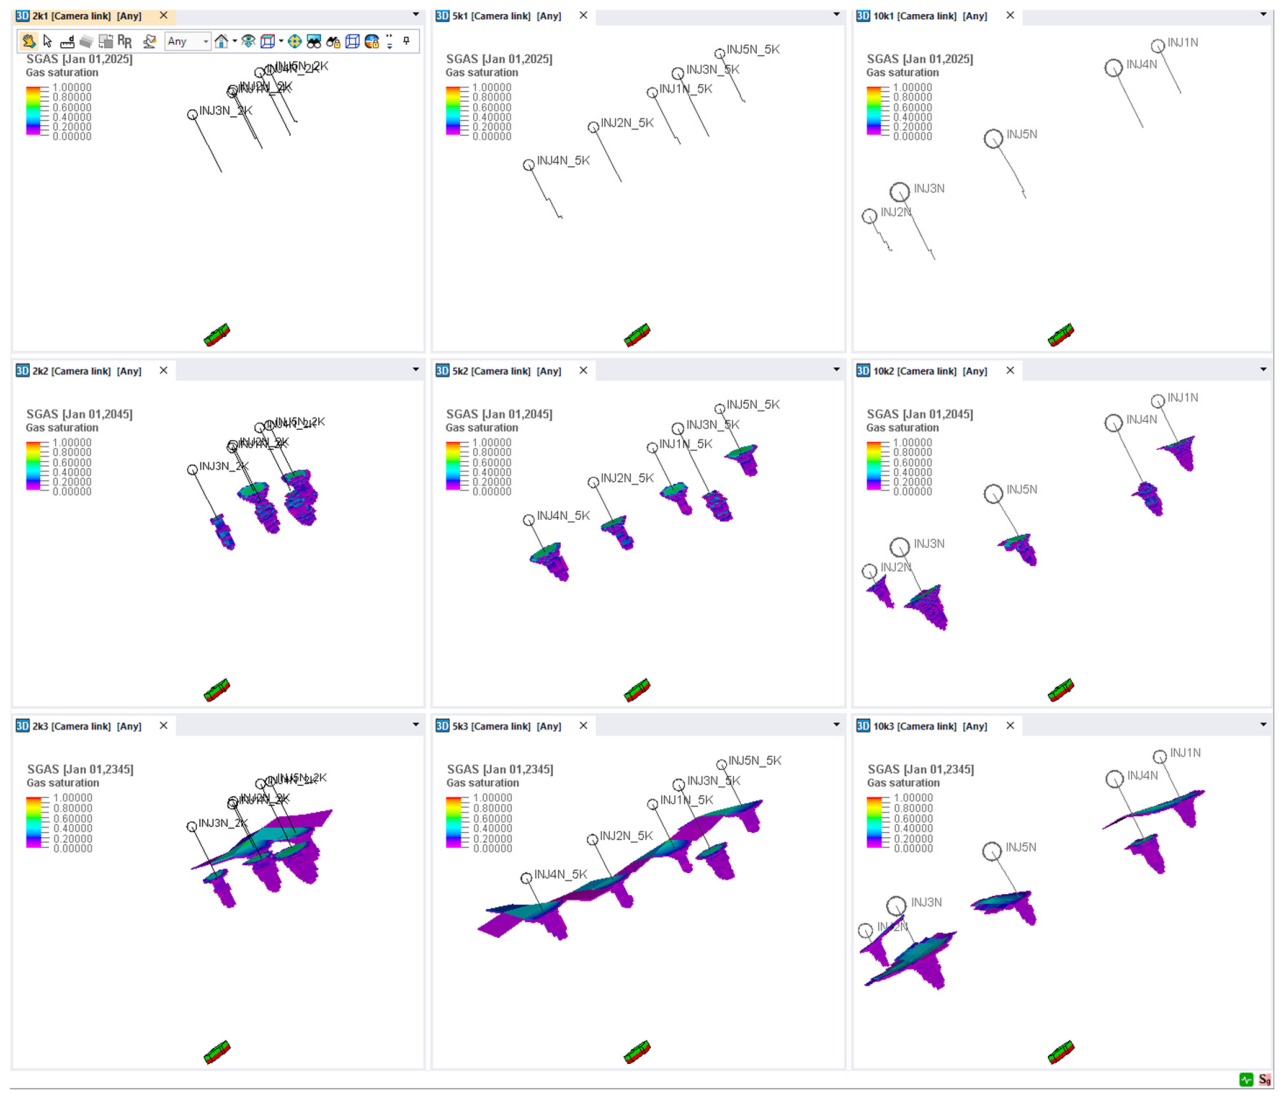
Notably, as per Figure 7, the sensitivity analysis revealed that inter-well distance (ranging from 2000 m to 10,000 m) did not significantly influence individual well injectivity indices, although it affected injection pressure distributions and CO2 plume overlap patterns as in Figure 8 and Figure 9 [24].
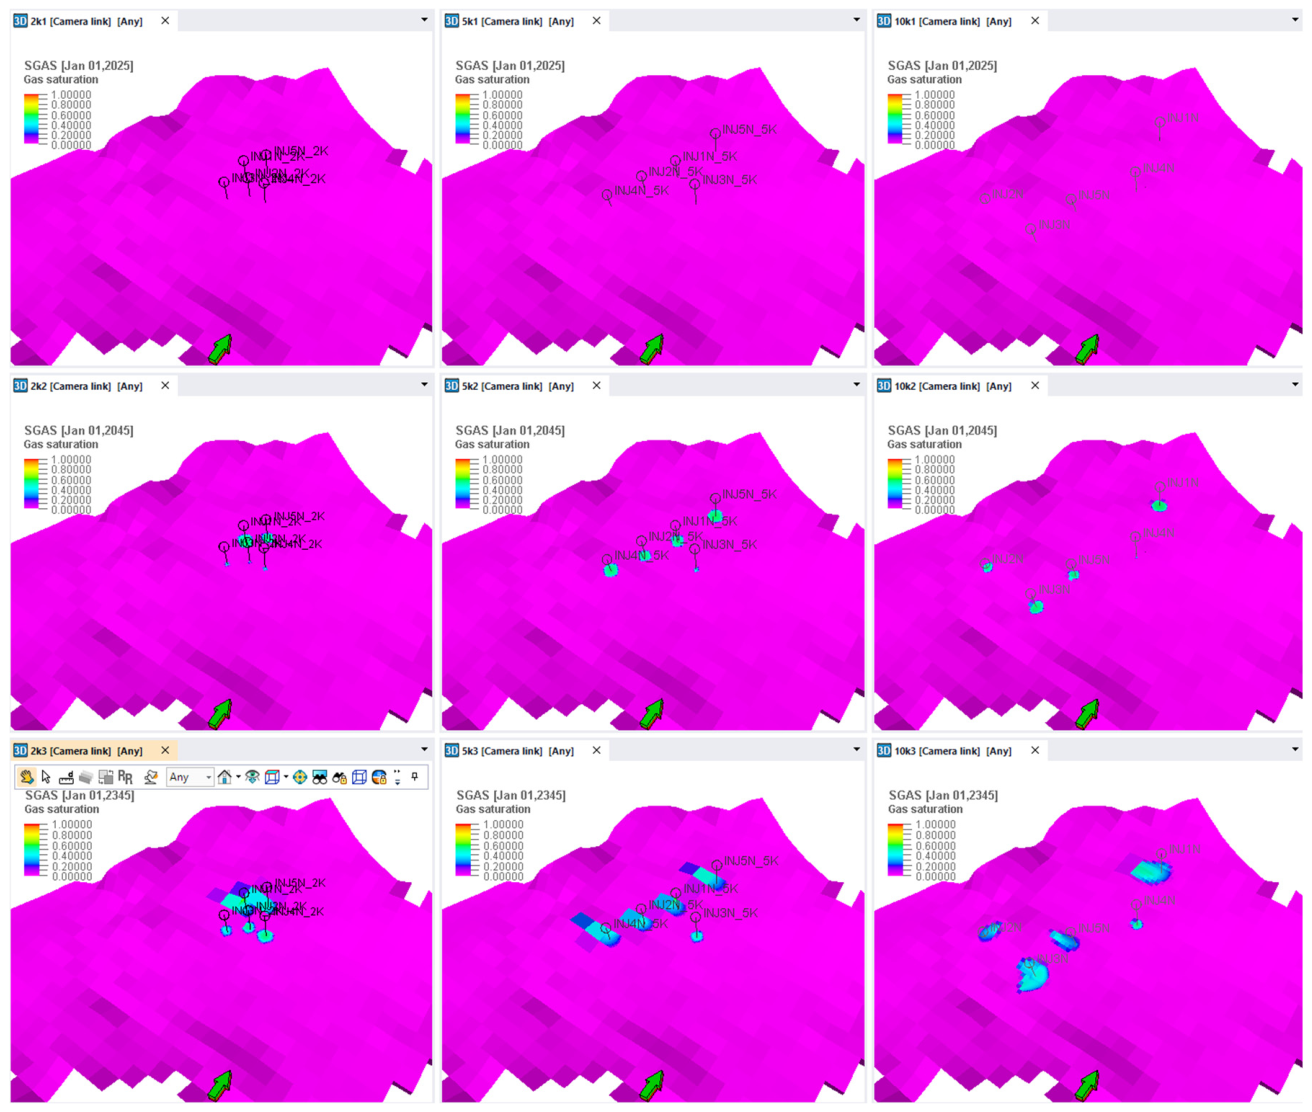
Figure 8 shows the spatial CO2 saturation distribution for the primary five-well scenarios of wells spacing 2 km, well spacing 5 km and well spacing 10 km at key time points during the injection (2025, 2045) and post-injection monitoring (2345). The view presented has a more areal focus.
If the cells fully saturated with water are filtered out (cells colored in magenta), with a condition such as if CO2 saturation > 0.01, then the true spatial CO2 saturation distribution, or the CO2 plume, can be presented, and this is what is shown in Figure 9 for the same five-well scenarios and key time points of the injection (2025, 2045 and 2345).
One can notice that there are notable differences between the distributions in lines 2 and 3 of Figure 9 above, respectively between years 2045 and 2345. There are two main significant reasons for this to happen. The first is gravitational segregation: CO2 component is lighter than water and it will rise spatially. The latter is the solubility of the CO2 component in water.
Analysis of Well Configuration Performance: The superior performance of the 5-well configuration—and the failure of 3- and 4-well arrangements to accommodate the full target injection rate—can be understood through the interplay of three physical mechanisms: injectivity limits, pressure interference, and plume coverage.
Injectivity constraints in the 3- and 4-well configurations: The target injection rate of 2.07 × 10⁶ Sm3/day corresponds to approximately 3.3 MtCO2/year. With only 3 or 4 wells, the per-well injection rate required to meet this target exceeds the local injectivity capacity of the Sarmatian formations at the available pressure differential (i.e., the margin between reservoir pressure and the fracture pressure limit). This is particularly acute for wells in structurally shallower positions (e.g., INJ2N at 1417 m top perforation), where the lower reservoir pressure (156 bar) provides a narrower safe injection window. The five-well configuration distributes the total target rate across more injection points, reducing the per-well rate to within the formation’s injectivity envelope and keeping bottom-hole pressures below the 0.85 × Gf × H safety threshold at all locations.
Well spacing and pressure interference: The sensitivity analysis across inter-well distances of 2000 m, 5000 m, and 10,000 m revealed a notable result: individual well injectivity indices did not vary significantly with spacing. This counterintuitive finding reflects the large pore volume of the Sarmatian aquifer (44 × 106 RM3 at reference pressure) and its high lateral connectivity, which together provide sufficient pressure dissipation even at closer well spacing. However, spacing did influence the spatial distribution of injection pressures and the degree of CO2 plume overlap. At 2000 m spacing, pressure interference between adjacent wells produced locally elevated pressures (up to 292 bar at individual wells, compared to 244 bar at 10,000 m spacing), though these remained below fracture thresholds. At 10,000 m spacing, plumes developed largely independently during the injection phase, maximizing the contact area between CO2 and formation water—a factor that likely contributes to the higher dissolved CO2 fraction observed in the wider-spacing scenario (1.18 × 10⁸ kg-mol dissolved for 5 K spacing vs. 0.95 × 10⁸ kg-mol for 2 K spacing; Table 5).
Plume migration and practical implications: The plume evolution patterns (Figure 8 and Figure 9) illustrate that wider well spacing promotes more distributed CO2 placement, which is beneficial for both pressure management and trapping efficiency: greater CO2–water contact area enhances dissolution trapping, while reduced plume overlap minimizes the risk of a connected mobile CO2 phase accumulating at structural highs. From a project design perspective, these results suggest that well spacing should be optimized to balance three competing objectives: (i) minimizing surface footprint and pipeline infrastructure costs (favoring tighter spacing), (ii) maximizing per-well injectivity and minimizing pressure interference (favoring wider spacing), and (iii) promoting dissolution trapping through increased CO2–water contact (favoring wider spacing). For the Sarmatian formations in Zone V, the 5000–10,000 m range appears to offer a favorable compromise, though site-specific factors—including surface access, existing infrastructure, and detailed structural mapping—would ultimately determine optimal well placement. More broadly, the integration of storage-side optimization (well count, spacing, and placement) with capture-side technology selection—such as the comparative evaluation of CO2 separation pathways (e.g., adsorption-based vs. absorption-based capture) recently demonstrated by Mohamad et al. [31] for biomass-to-biogas systems—represents an important direction for holistic CCUS project design, ensuring that capture and storage subsystems are co-optimized rather than developed in isolation.

3.2. Storage Capacity Assessment

Storage capacity was evaluated at two distinct levels: theoretical static capacity and practically achievable dynamic capacity. The analytical static capacity calculation employed the volumetric approach: Static Capacity = VB × NTG × Φ × (1 − Swirr) × ρCO2, where VB = 4.9 × 10¹² m3 (bulk volume from simulation), NTG = 0.711, Φ = 0.1232 (average porosity), Swirr = 0.2 (irreducible water saturation), and ρCO2 = 710 kg/m3 (CO2 density at reservoir conditions). This calculation yields a theoretical static storage capacity of 2.4 × 10¹⁴ kg CO2 (244 Gt) [24]. This value represents the total pore volume available for CO2 storage under ideal conditions, i.e., if the entire connected pore space within the modeled domain could be accessed and filled. It is best understood as an upper-bound resource estimate rather than a development-planning figure.
Practically achievable dynamic capacity was assessed through dynamic simulation over 100 years of continuous injection (extended scenario) and resulted in cumulative storage of 5.13 × 10¹⁰ Sm3 (equivalent to approximately 10.16 × 10¹⁰ kg CO2, 102 Mt), representing a fraction (0.01–0.04%) of the theoretical static capacity. This difference reflects practical constraints including well placement, injection rate limitations, and pressure buildup considerations. For the 20-year base case injection period, the cumulative injected volume reached approximately 1.51 × 10¹⁰ Sm3 (roughly 3.0 × 10¹⁰ kg CO2), demonstrating that the storage complex can accommodate decades of emissions from the Turceni Power Plant [24].
To contextualize these results against industrial emission volumes, the Turceni Power Plant emits approximately 3.3 MtCO2 per year [5]. The 20-year dynamic simulation therefore accommodates the equivalent of approximately 9 years of Turceni’s current emissions, while the 100-year extended scenario accommodates approximately 31 years. It should be noted that these figures correspond to a single storage zone (Zone V); the Getic Platform contains six additional prospective zones identified in the Romanian CCS Demo Project framework (Figure 1), suggesting that the aggregate practical storage capacity across the platform could accommodate Turceni-scale emissions for well over a century.
At the national level, Romania’s estimated total CO2 storage capacity in depleted hydrocarbon reservoirs and saline aquifers exceeds 514 Mt [6]. The practical dynamic capacity demonstrated in this study for Zone V alone (~30 Mt over 20 years, ~102 Mt over 100 years) represents a meaningful contribution to this national portfolio—approximately 6–20% of the total estimated national capacity from a single storage zone. These comparisons underscore the industrial relevance of the Sarmatian formations within Romania’s broader decarbonization strategy and highlight the value of a multi-zone, hub-and-cluster approach to CCS deployment in the Oltenia region.

3.3. Long-Term CO2 Behavior and Trapping Mechanisms

The 300-year monitoring simulation provides insights into long-term CO2 fate within the storage formation. Table 5 presents the distribution of CO2 among different trapping mechanisms at the end of the monitoring period (year 2335). The results show significant portions of injected CO2 immobilized through residual (trapped gas) and dissolution (dissolved in water) mechanisms, with remaining mobile gas phase CO2 contained within the structural closure [24].
As per Figure 9, the CO2 saturation plume evolution shows characteristic behavior consistent with literature observations [11,12]. During the injection phase, CO2 migrates radially from injection wells, with plume geometry influenced by formation heterogeneity and structural dip. Post-injection, buoyancy-driven migration continues until the plume reaches structural highs or becomes immobilized through residual trapping. The scenario with wider well spacing (CO2_INJ_5_AREA_V_5K) showed greater dissolved CO2 fractions (1.18 × 10⁸ kg-mol versus 0.95 × 10⁸ kg-mol for 2K spacing), likely reflecting increased contact area between CO2 and formation water during migration [24].
Pressure dissipation during the monitoring period proceeded gradually, with field pressure stabilizing at 236–237 bar by year 2335, only marginally above initial conditions. This behavior indicates effective pressure communication with the broader aquifer system, supporting long-term containment without excessive pressure accumulation that could threaten caprock integrity. The pseudo-production well scenario (PSEUDO_OB) confirmed that even with open boundary conditions simulating pressure relief pathways, CO2 plume migration remained contained within the modeled domain [24].

4. Discussion

4.1. General

This study provides a comprehensive quantitative assessment of the potential for permanent CO2 storage in deep saline reservoirs of Sarmatian age located in the Getic Platform, Southern Romania. The assessment based on published geological information on the Getic Platform and numerical simulations includes (1) the stratigraphic and structural framework of the Sarmatian interval; (2) petrophysical characteristics of Sarmatian reservoirs in the region; (3) regional seal effectiveness and tectonic setting; (4) static and dynamic reservoir modeling; (5) determination of storage capacity; (6) analysis of the long-term CO2 behavior and trapping mechanisms; and (7) injection simulation scenarios.
In the studied area, which includes a part of the western sector of the Moesian Platform, Sarmatian subsidence and clastic input were particularly strong, resulting in thick stacked deltaic and shallow marine successions, widespread development of high-quality arenitic reservoirs, and a high concentration of medium to large hydrocarbon accumulations. Moreover, this geological major unit accounts for a dominant share of the Getic Oil Province discovered gas and a significant proportion of its oil resources, which indirectly confirms the efficiency of the reservoir–seal systems.
In the Getic Platform, the Sarmatian is dominated by deltaic systems (upper and lower delta plain, delta front), shoreface and littoral facies, and locally shelf edge and shallow marine sand bodies. Reservoir rocks/formations occur as stacked sandstone and sandy conglomerate bodies (often grouped into numbered pay zones, Sa I to Sa X), channelized sandstones and distributary channels, mouth bars, shoreface bars and sheet-like bodies with variable lateral continuity. This depositional context results in laterally extensive but internally heterogeneous sandstone packages and vertical alternations of high-quality sand with marls and silty mudstones. Such architecture is generally favorable for CO2 storage, allowing large, connected volumes for injection, multiple levels of internal baffling, and partial compartmentalization, which may help in pressure management and plume control.
Published regional data for Sarmatian reservoirs in the assessed region indicate the following:
Porosity: typically in the range 20–33% for Sarmatian sandstones, with local values up to 45–47% in high quality, weakly cemented sands.
Permeability: ranges from 23 mD to 2500 mD, with common values in the tens to hundreds of mD range. Very high permeabilities (hundreds–thousands of mD) are reported in certain delta front and shoreface sand bodies.
Productive thickness: individual Sarmatian pay zones commonly show 20–100 m cumulative net sandstone thickness at field scale (including multi-layer stacks).
These petrophysical ranges are highly favorable for CO2 injection because high porosities ensure substantial storage capacity per unit rock volume, and high permeabilities and net thickness provide excellent injectivity, supporting industrial-scale CO2 rates with less risk of excessive pressure build up.
In the Getic Platform, the primary seals for Sarmatian reservoirs are intra-Sarmatian marls and claystones, Pontian and Pliocene regional mudstone seals (up to 500–600 m), and additional Miocene seals. The combination of intraformational and regional seals results in a robust multi-seal system, which is a strong positive factor for long-term CO2 containment. Regarding structural sealing and faults, these features rely heavily on faulted anticlines and combined structural–stratigraphic traps (e.g., erosional truncation, pinch outs against marls).
A key aspect relevant to CO2 storage in the region is the existence of long-lived hydrocarbon accumulations, which shows that many of the bounding faults behave as effective sealing faults (at least under historical pressure regimes). However, CO2 injection will increase pore pressure, so the reactivation potential of these faults must be assessed geomechanically by determination of the in situ stress field and fault orientation and calculation of fault slip tendency and fracture pressure thresholds.
The findings of this study align with observations from other CO2 storage assessments in similar geological settings. The achieved storage efficiency (ratio of stored CO2 volume to pore volume) falls within ranges reported for saline aquifer storage projects globally [10,21]. The modest pressure buildup relative to fracture thresholds compares favorably with experience at operational sites including Sleipner, where careful pressure management has maintained safe injection conditions over decades [9].
The trapping mechanism distribution observed—with significant residual and dissolution trapping contributions—reflects the physics-based modeling incorporated in the CO2STORE simulation framework. These results are consistent with laboratory and field observations indicating that 20–40% of injected CO2 can become residually trapped during post-injection redistribution [13,14]. The contribution of dissolution trapping (approximately 15–20% of total stored CO2) aligns with theoretical predictions for saline formations with similar salinity levels [4,11].
Compared to recent assessments of Romanian storage sites, including work on the Bibești-Bulbuceni structure in the Meotian formations [6], the Sarmatian formations evaluated here offer complementary storage capacity within the broader regional CCS infrastructure framework. The technical feasibility demonstrated supports consideration of multiple geological horizons for optimized storage network development, potentially enabling hub-and-cluster approaches connecting multiple emission sources to distributed storage complexes [22,23].
Several sources of uncertainty affect the simulation results and should inform interpretation. The primary data quality limitations include (1) petrophysical properties derived from well logs with limited calibration data, particularly the absence of core analysis from within the study area requiring reliance on analog data from neighboring structures; (2) absence of direct pressure measurements in the Sarmatian formations necessitating calculated pressure profiles; (3) relative permeability functions based on literature correlations rather than special core analysis; and (4) fluid property characterization from analog fields rather than formation-specific samples [24].
Sensitivity analyses conducted on injection pressure coefficients (0.80, 0.85, 0.90) and well spacing (2000–10,000 m) provide bounds on expected performance variability. The reservoir pressure response remained below fracture thresholds across all scenarios evaluated, suggesting robust safety margins despite input parameter uncertainties. For improved confidence in project planning, acquisition of site-specific data through appraisal drilling, including pressure measurements, core analysis, and fluid sampling, would be recommended as standard practice [24].

4.2. Long-Term Storage Security Considerations

While the simulation results demonstrate favorable pressure behavior and trapping efficiency, a critical assessment of long-term containment security must address four interrelated factors: caprock integrity, potential leakage pathways, geomechanical stability, and the inherent uncertainty of multi-century predictions.
Caprock integrity: The Sarmatian storage complex benefits from a robust multi-seal system comprising intra-Sarmatian marls and claystones, Pontian and Pliocene regional mudstone seals reaching 500–600 m thickness, and additional Miocene seals at low depth. The maximum simulated pressure increase of 7–9 bar above initial conditions (final field pressure 235–237 bar) remains well below the estimated minimum fracture pressure of ~280 bar, corresponding to a safety margin of approximately 43–45 bar. This margin is maintained across all scenarios tested, including the tighter well-spacing configurations (2000 m) that produced the highest local injection pressures (up to 292 bar at individual wells). However, we note that the fracture pressure estimate relies on a calculated gradient (Gf = 0.18 bar/m) rather than direct in situ stress measurements (e.g., leak-off tests or mini-frac data), which represents a source of uncertainty that should be addressed through appraisal well testing prior to any operational commitment.
Potential leakage pathways: Three categories of potential leakage pathways warrant consideration: (i) Fault-related leakage—The Getic Platform is characterized by faulted anticlines and combined structural–stratigraphic traps. The presence of long-lived hydrocarbon accumulations in the region provides indirect evidence that many bounding faults act as effective seals under natural pressure regimes. However, CO2 injection will elevate pore pressure, and the reactivation potential of these faults has not been quantitatively assessed in this study. Determination of the in situ stress field (magnitude and orientation of principal stresses), fault orientation relative to the stress tensor, and calculation of slip tendency and fracture pressure thresholds would be required for a complete geomechanical risk assessment. (ii) Wellbore leakage—The injection wells themselves represent potential leakage pathways if not properly completed and abandoned. While outside the scope of this reservoir simulation study, well integrity—including casing design, cement placement, and post-injection abandonment procedures—constitutes a critical component of storage security that should be addressed in subsequent engineering studies. (iii) Caprock discontinuities—The lateral continuity of the Pontian–Pliocene regional seal has been inferred from seismic data, but sub-seismic-scale features (e.g., small-offset faults, fracture swarms) could provide undetected migration pathways. High-resolution seismic acquisition and attribute analysis would reduce this uncertainty.
Geomechanical stability: Beyond caprock fracturing, injection-induced pressure changes can trigger fault reactivation or induced seismicity. The modest pressure buildup observed in our simulations (ΔP < 10 bar field-wide) suggests a low risk of large-scale geomechanical failure, consistent with operational experience at sites such as Sleipner where similar pressure management has been maintained over decades [9]. Nevertheless, the absence of a coupled geomechanical model in this study means that stress arching, poroelastic effects, and potential shear failure along pre-existing faults have not been explicitly evaluated. We recommend that future work incorporate coupled reservoir–geomechanical simulation using the in situ stress data that would be acquired during appraisal drilling.
Uncertainty of 300-year predictions: The 300-year monitoring period simulated in this study extends well beyond the temporal scope over which reservoir models are typically validated. The primary sources of prediction uncertainty include (i) relative permeability functions derived from literature correlations rather than site-specific special core analysis (SCAL); (ii) the absence of direct pressure and fluid samples from the Sarmatian formations; (iii) the assumption of uniform brine chemistry, which affects dissolution trapping rates; and (iv) the omission of mineral trapping kinetics, which become increasingly significant over centennial-to-millennial timescales. The CO2STORE module captures residual and solubility trapping but does not simulate geochemical reactions (mineralization), meaning that the long-term immobilization predicted here may be conservative—mineral trapping would provide additional permanent storage capacity over geological time. Conversely, the assumption of an intact multi-seal system throughout the 300-year period is optimistic in the absence of a coupled geomechanical assessment. We therefore present these results as a technically grounded feasibility assessment rather than a definitive prediction, and we emphasize that progressive reduction of these uncertainties through site-specific data acquisition is a prerequisite for advancing to the storage development phase.

5. Conclusions

This study presents a comprehensive numerical simulation assessment of CO2 geological storage feasibility in the Sarmatian formations of the Getic Platform, Romania. Using ECLIPSE 300 compositional simulator with the CO2STORE option, multiple injection scenarios were evaluated covering 20 years of injection and 300 years of post-injection monitoring. The key findings support the technical viability of large-scale CO2 storage in this geological setting and provide quantitative parameters for project planning.
The principal conclusions are as follows:
  • Storage Capacity: The Sarmatian formations offer substantial storage potential with static capacity estimated at 2.44 × 10¹⁴ kg CO2. Dynamic simulations confirm that the 20-year target injection volume (approximately 3.0 × 10¹⁰ kg CO2 at 2.07 × 10⁶ Sm3/day) can be successfully accommodated using five injection wells.
  • Safe Operating Conditions: Reservoir pressure increase during injection remains modest (7–9 bar), well below the fracture pressure threshold of approximately 280 bar. This safety margin is maintained across all evaluated scenarios, supporting confidence in long-term containment integrity.
  • Favorable Trapping Behavior: Long-term simulations demonstrate effective CO2 immobilization through multiple trapping mechanisms. At the end of the 300-year monitoring period, significant fractions are immobilized as residually trapped gas (approximately 45%) and dissolved CO2 (approximately 15–20%), with remaining mobile phase contained within structural closures.
  • Well Configuration Flexibility: While five injection wells are required to achieve the target rate, spacing between wells (2000–10,000 m) can be optimized based on site-specific considerations without significantly impacting overall storage performance.
  • Regional CCS Potential: The results support Romania’s potential as a significant player in European CCS development, with the Sarmatian formations representing one component of the country’s estimated 514 Mt CO2 storage capacity in depleted reservoirs and saline aquifers.
Future work should focus on reducing key uncertainties through acquisition of site-specific data, particularly direct pressure measurements, core samples for petrophysical and geomechanical characterization, and formation fluid samples for accurate brine chemistry modeling. Integration with surface infrastructure planning, including capture technology selection and pipeline routing from Turceni Power Plant, would advance project development toward implementation readiness. The demonstrated technical feasibility positions this storage complex as a candidate for detailed appraisal in Romania’s decarbonization strategy.

Author Contributions

Conceptualization, G.B. and T.-V.C.; methodology, D.D.N.; software, S.S.; validation, L.D., G.B. and C.N.E.; formal analysis, I.G.S. and P.C.S.; investigation, A.P.P.; resources, D.D.N.; data curation, G.B.; writing—original draft preparation, L.D. and G.B.; writing—review and editing, G.B. and P.C.S.; visualization, P.C.S.; supervision, S.S.; project administration, G.B.; funding acquisition, S.S. All authors have read and agreed to the published version of the manuscript.

Funding

This research was funded by financing contract GICS no. 30799/11.12.2024 from PetroleumGas University of Ploiesti, entitled “Cercetari privind reducerea emisiilor gazelor cu effect de sera in procesul de exploatare al zacamintelor/depozitelor de gaze naturale” (Research on the reduction in greenhouse gas emissions in the exploitation process of natural gas reservoirs/deposits).

Institutional Review Board Statement

Not applicable.

Informed Consent Statement

Not applicable.

Data Availability Statement

The data presented in this study are available on request from the corresponding authors. (The data are not publicly available due to privacy or ethical restrictions.)

Acknowledgments

The authors sincerely thank Constantin Sava for his valuable scientific discussions, technical guidance, and support during the Romanian CCS Demo Project.

Conflicts of Interest

The authors declare no conflicts of interest.

Abbreviations

The following abbreviations are used in this manuscript:
PpReservoir pressure
GpPressure gradient
HDepth
T0Surface temperature
GfFracture pressure gradient
GlitLithostatic pressure gradient
νPoisson coefficient
KrwWater relative permeability
KrgGas relative permeability
SwWater saturation
SgGas saturation
CrRock compressibility
CwWater compressibility
VBBulk volume
NTGNet to gross ratio
ΦAverage porosity
SwirrIrreducible water saturation
ρCO2CO2 density at reservoir conditions

References

  1. Okafor, C.C.; Madu, C.N.; Nwoye, A.V.; Nzekwe, C.A.; Otunomo, F.A.; Ajaero, C.C. Research on Climate Change Initiatives in Nigeria: Identifying Trends, Themes and Future Directions. Sustainability 2025, 17, 3995. [Google Scholar] [CrossRef]
  2. European Commission. European Green Deal: Delivering the European Green Deal. Available online: https://commission.europa.eu/strategy-and-policy/priorities-2019-2024/european-green-deal_en (accessed on 25 February 2026).
  3. Metz, B.; Davidson, O.; de Coninck, H.; Loos, H.C.; Meyer, L. (Eds.) IPCC Special Report on Carbon Dioxide Capture and Storage; Cambridge University Press: Cambridge, UK, 2005. [Google Scholar]
  4. Zhang, S.; Shen, Y.; Zheng, C.; Xu, Q.; Sun, Y.; Huang, M.; Li, L.; Yang, X.; Zhou, H.; Ma, H.; et al. Recent advances, challenges, and perspectives on carbon capture. Front. Environ. Sci. Eng. 2024, 18, 75. [Google Scholar] [CrossRef]
  5. Turceni Power Station. Global Energy Monitor. Available online: https://www.gem.wiki/Turceni_power_station (accessed on 1 February 2026).
  6. Federația Patronală Petrol și Gaze (FPPG). PwC. CCS Study Romania. 2022. Available online: https://ccs.fppg.ro/ (accessed on 1 February 2026).
  7. Paraschiv, D. Geologia Zăcămintelor de Hidrocarburi Din România; Institutul Geologic al României: Bucharest, Romania, 1975; Volume 1, pp. 194–202. [Google Scholar]
  8. Paraschiv, D. Moesian Platform and Its Hydrocarbon Reservoirs; Editura Academiei RSR: Bucharest, Romania, 1979. [Google Scholar]
  9. Sava, C. GETICA CCS Romanian Demo Project. Presented at the 6th CO2GeoNet Open Forum, Venice, Italy, 9–11 May 2011; Available online: http://www.cgseurope.net/UserFiles/file/Open%20Forum%202011/PDF-presentations/1-12_Sava.pdf (accessed on 2 February 2026).
  10. Furre, A.; Eiken, O.; Alnes, H.; Vevatne, J.N.; Kiær, A.F. 20 Years of Monitoring CO2-injection at Sleipner. Energy Procedia 2017, 114, 3916–3926. [Google Scholar] [CrossRef]
  11. Global CCS Institute. Global Status of CCS 2022; Global CCS Institute: Melbourne, Australia, 2022. [Google Scholar]
  12. Osman, A.I.; Hefny, M.; Abdel Maksoud, M.I.A.; Elgarahy, A.M.; Rooney, D.W. Recent advances in carbon capture storage and utilisation technologies: A review. Environ. Chem. Lett. 2021, 19, 797–849. [Google Scholar]
  13. Volpi, V.; Bellezza, C.; Civile, D.; Accaino, F.; Barison, E.; Corubolo, P.; Farina, B.; Forlin, E.; Giorgi, M.; Giustiniani, M.; et al. An integrated geophysical approach to characterise the behaviour of a fault zone in relation to fluid migration during CO2 geological storage. Geosciences 2026, 16, 63. [Google Scholar] [CrossRef]
  14. Yusof, M.A.M.; Neuyam, Y.A.S.; Ibrahim, M.A.; Saaid, I.M.; Idris, A.K.; Mohamed, M.A. Experimental study of CO2 injectivity impairment in sandstone due to salt precipitation and fines migration. J. Pet. Explor. Prod. Technol. 2022, 12, 2191–2202. [Google Scholar] [CrossRef]
  15. Zoeir, A.; Riazi, M.; Cortés, F.B.; Kazemzadeh, Y. Pore scale simulation of phase trapping in artificial porous media prototypes. J. Pet. Explor. Prod. Technol. 2025, 15, 193. [Google Scholar] [CrossRef]
  16. Sava, C.S.; Constantin, C.; Anghel, S.; Proca, A.; Tomescu, C.; Dudu, A.; Samoila, I. State of the CCS Activities in Romania. In Proceedings of the AAPG Hedberg Conference, Vancouver, BC, Canada, 16–19 August 2009. [Google Scholar]
  17. Cormos, C.C.; Dinca, C. Techno-economic and environmental implications of decarbonization process applied for Romanian fossil-based power generation sector. Energy 2021, 220, 119734. [Google Scholar]
  18. Mircescu, C.V.; Bucur, I.I.; Pleș, G. Upper Jurassic—Lower Cretaceous limestones from the easternmost Getic Carbonate Platform (Southern Carpathians, Romania). Microfacies, microfossils and depositional environments. In Proceedings of the EGU General Assembly 2022, Vienna, Austria, 23–27 May 2022. EGU22-4119. [Google Scholar] [CrossRef]
  19. Schlumberger. ECLIPSE Technical Description 2014.1. Available online: http://www.ipt.ntnu.no/~kleppe/TPG4150/EclipseReferenceManual.pdf (accessed on 18 December 2025).
  20. Spycher, N.; Pruess, K. CO2-H2O mixtures in the geological sequestration of CO2. II. Partitioning in chloride brines at 12–100 °C and up to 600 bar. Geochim. Cosmochim. Acta 2005, 69, 3309–3320. [Google Scholar]
  21. Fan, Z.; Tian, M.; Li, M.; Mi, Y.; Jiang, Y.; Song, T.; Cao, J.; Liu, Z. Assessment of CO2 Sequestration Capacity in a Low-Permeability Oil Reservoir Using Machine Learning Methods. Energies 2024, 17, 3979. [Google Scholar] [CrossRef]
  22. Paltsev, S.; Morris, J.; Kheshgi, H.; Herzog, H. Hard-to-abate sectors: The role of industrial carbon capture and storage (CCS) in emission mitigation. Appl. Energy 2021, 300, 117322. [Google Scholar]
  23. Terjanika, V.; Pubule, J.; Blumberga, D.; Zarins, E. Policy instruments for CO2 valorisation support. E-Prime Adv. Electr. Eng. Electron. Energy 2023, 4, 100181. [Google Scholar] [CrossRef]
  24. Yang, L.; Wu, X.; Huang, B.; Li, Z. Sustainable industrial energy supply systems with integrated renewable energy, CCUS, and energy storage. Sustainability 2025, 17, 712. [Google Scholar] [CrossRef]
  25. Task 2.2.4–2.3.6 Technical Reports: Dynamic Modelling, Fracture Pressure Evaluation, Capacity Assessment, Injectivity Assessment, Development Scenarios, Sensitivity Analysis, and Long-term Behavior of CO2. In Romanian CCS Demo Project; Internal Technical Documentation; European Association of Geoscientists & Engineers: Bunnik, The Netherlands, 2015.
  26. Matresu, J.; Dinu, C. Paleozoic extensional basins in the western part of the Moesian Platform. Buchar. Geosci. Forum 2004, 3, 63–70. [Google Scholar]
  27. Matresu, J.; Rabagia, T. Tectonic evolution of western part of the Moesian Platform—Implications on the exploration of hydrocarbons. In Proceedings of the AAPG Annual Meeting, Houston, TX, USA, 10–13 March 2002; Available online: https://www.searchanddiscovery.com/documents/2003/matresu/index.htm (accessed on 1 February 2026).
  28. Stoica-Negulescu, E.R. Romanian Oil and Gas from Geophysics to Petroleum Systems; Editura Vergiliu: Bucharest, Romania, 2015; 97p. [Google Scholar]
  29. Branoiu, G. General Framework of Exploration-production Activities in Romania; Editura Universitatii Petrol-Gaze din Ploiesti: Ploiesti, Romania, 2019. [Google Scholar]
  30. Popescu, B.M. The Getian Petroleum Province (Romania). Arch. Sci. 2024, 73, 1–43. [Google Scholar]
  31. Mohamad, N.H.E.M.E.; Mubarak, M.M.; Aldalati, N.M.A.; Alsadi, R.O.; Lakkimsetty, N.R. Design and evaluation of biomass-to-biogas systems integrated with carbon capture technologies for sustainable energy solutions. Interactions 2026, 247, 82. [Google Scholar] [CrossRef]
Figure 1. Location of the seven prospective zones (areas) for CO2 geological storage in deep saline Sarmatian reservoirs in the Getic Platform ([9]).
Sustainability 18 06932 g001
Figure 2. Regional geologic map of the Carpathian Orogen and surrounding platforms indicating the studied area (red rectangle) [26].
Sustainability 18 06932 g002
Figure 3. Interpreted seismic profile illustrating the CO2 storage potential (great thickness, large spatial extension, depth of over 1000 m, Pliocene seal rocks continuous and with great thickness) of the Sarmatian formations in the studied area [27]. Used with permission from SearchandDiscovery.com, whose permission is required for further use.
Sustainability 18 06932 g003
Figure 4. Geological cross-section illustrating the CO2 storage potential for the Sarmatian formations of the Getic Platform [28].
Sustainability 18 06932 g004
Figure 5. Static properties distribution.
Sustainability 18 06932 g005
Figure 6. The primary simulation scenarios.
Sustainability 18 06932 g006
Figure 7. Dynamic parameters across the primary five-well scenarios throughout the injection (2025, 2045) and post-injection monitoring (2345).
Sustainability 18 06932 g007
Figure 8. Spatial CO2 saturation distribution for the primary 5-well scenarios at key time points during the injection (2025, 2045) and post-injection monitoring (2345).
Sustainability 18 06932 g008
Figure 9. CO2 plume distribution for the primary five-well scenarios at key time points during the injection (2025, 2045) and post-injection monitoring (2345).
Sustainability 18 06932 g009
Table 1. Injection well parameters for the five-injector base case scenario.
WellTop Perforation (m)Injection Pressure (bar)Reservoir Pressure (bar)
INJ1N1916293211
INJ2N1417217156
INJ4N1774271195
INJ5N2019309222
Table 2. Summary of essential geological and fluid model parameters: data sources, assumptions, and uncertainty ranges.
ParameterValue(s) UsedData SourceKey AssumptionUncertainty Range/
Comment
Porosity (effective)3–21% (avg. 12%)Well logs from study area; core data from neighboring Piscuri-Hurezani structureNTG = 0.711 applied uniformly±2–3 porosity units; no core from within study area itself
Horizontal permeability0–50 mD (typical 1.16–45 mD)Core data from Piscuri-Hurezani structurePorosity-permeability transform applied where core absentOrder-of-magnitude uncertainty where only log-derived
Reservoir pressure (Pp)156–222 bar (at ~2000 m)Calculated via hydrostatic gradient (Gp = 0.11–0.12 bar/m)Gradient calibrated from adjacent oil structuresNo direct pressure measurements in Sarmatian formations
Water compressibility (Cw)4.5 × 10⁻⁵ bar−1Standard brine correlationUniform value applied±10%
Brine salinityNaCl 7.5%; CaCl2 1.5%Analog field dataUniform composition assumedNo formation-specific samples
CO2 density (ρCO2)710 kg/m3PVT model (ECLIPSE 300)At ~200 bar, ~70 °C±5%
Table 3. Relative permeability data for water–CO2 system.
SwKrwSgKrg
0.300.00000.000.0000
0.460.00240.160.0004
0.610.03900.310.0241
0.770.19750.470.1406
0.920.62430.620.4848
1.001.00000.701.0000
Table 4. Summary of dynamic simulation results for five-injector scenarios.
ScenarioYearInjection Pressure (bar)Field Pressure (bar)Injection Rate (106 Sm3/d)
CO2_INJ_5_AREA_V_2K2025254–282228.00.22–0.64
CO2_INJ_5_AREA_V_2K2045259–292235.90.15–0.75
CO2_INJ_5_AREA_V_2K23450235.70
CO2_INJ_5_AREA_V_5K2025214–2632280.22–0.59
CO2_INJ_5_AREA_V_5K2045231–284236.90.15–0.68
CO2_INJ_5_AREA_V_5K23450236.60
CO2_INJ_5_AREA_V2025180–258228.00.23–0.69
CO2_INJ_5_AREA_V2045173–244237.10.14–0.85
CO2_INJ_5_AREA_V23450236.90
Table 5. CO2 distribution among trapping mechanisms after 300-year monitoring period.
ScenarioDissolved (kg-mol)Trapped Gas (kg-mol)Mobile Gas (kg-mol)
CO2_INJ_5_AREA_V1.01 × 1082.88 × 1082.48 × 108
CO2_INJ_5_AREA_V_2K0.95 × 1082.55 × 1082.14 × 108
CO2_INJ_5_AREA_V_5K1.18 × 1082.85 × 1082.27 × 108
Disclaimer/Publisher’s Note: The statements, opinions and data contained in all publications are solely those of the individual author(s) and contributor(s) and not of MDPI and/or the editor(s). MDPI and/or the editor(s) disclaim responsibility for any injury to people or property resulting from any ideas, methods, instructions or products referred to in the content.