Article

Development and Evaluation of Corn Starch Films Incorporating Red Cabbage Extract as Non-Contact Freshness Indicators for Minced Chicken

by
Zacharoula I. Kalyva
,
Ioanna S. Kosma
* and
Anastasia V. Badeka
*
Laboratory of Food Chemistry, Department of Chemistry, University of Ioannina, 45110 Ioannina, Greece
*
Authors to whom correspondence should be addressed.
Sustainability 2026, 18(14), 6928; https://doi.org/10.3390/su18146928
Submission received: 29 May 2026 / Revised: 27 June 2026 / Accepted: 6 July 2026 / Published: 8 July 2026

Abstract

The present study investigates the development of corn starch-based films incorporating red cabbage extract (RCE) as natural colorimetric freshness indicators for minced chicken. This work addresses the need for safe, natural, and non-contact freshness indicators by integrating anthocyanin-rich RCE into corn starch films and evaluating their response to spoilage-related pH changes in poultry. Although anthocyanin-based films have been previously reported, their application as non-contact indicators for minced chicken—validated simultaneously through microbiological, physicochemical, and volatile compound analyses—has received limited attention. Corn starch films (CSFs), without and with RCE at different concentrations, were prepared and evaluated for thickness, mechanical properties, moisture content, and water solubility. The colorimetric response of CSF + RCE specimens to pH changes associated with meat spoilage was evaluated under refrigerated storage. The spoilage of minced chicken was independently monitored through microbiological analyses [total viable count (TVC), Pseudomonas, Brochothrix thermosphacta, Enterobacteriaceae, lactic acid bacteria (LAB), yeasts and molds] and physicochemical measurements [pH, total volatile basic nitrogen (TVB-N) and volatile compound profile]. Both microbiological and physicochemical indicators confirmed the onset of spoilage between the 5th and 7th days of storage, with unacceptable pH, TVB-N, and microbial levels being observed on the 7th day. The films exhibited visible though limited color changes in response to spoilage-related pH shifts. While the narrow pH range of poultry spoilage constrained the intensity of visual differences, the results demonstrate the potential of RCE-based films to be considered preliminary non-contact indicators and to support more sustainable food systems by enabling real-time freshness monitoring and potentially reducing unnecessary food waste. This study also highlights the need for future work incorporating objective colorimetric measurements (e.g., CIELab) and structural characterization to optimize indicator sensitivity.

1. Introduction

In the age of information and the global economy, modern consumers’ demands for high-quality and safe food are constantly increasing. The primary purpose of food packaging is to protect the product from the external environment and maintain its quality [1,2]. Traditional packaging can no longer meet existing requirements, which is why it is necessary to develop new, innovative packaging with improved functionality. Such packaging is both active and smart, due to its ability to improve quality and inform the consumer about it, respectively [2,3]. Specifically, there are three smart packaging technologies that have been developed in recent decades: indicators, sensors, and data carriers [1,2,4].
Freshness indicators are among the least extensively developed categories of smart packaging. Their purpose is to inform consumers about product quality through the basic function of indicators, which change color in response to a change in pH. For such packaging to be commercialized in the European Union, it must comply with strict safety requirements, particularly the absence of chemical migration from the indicator to the food matrix [5,6,7,8]. In the United States, Japan, and Australia, smart food packaging with freshness indicator technology, which mainly contains chemical rather than natural compounds as indicators, has already been used [1].
Due to the potential health risks to consumers and the toxicity of synthetic dyes, research has focused on finding natural dyes that are sensitive to pH changes, so that they can be used as colorimetric indicators in smart food packaging. The most important compounds of these pigments are anthocyanins, curcumin, and chlorophyll [9]. Among these categories, anthocyanins exhibit a noticeable color change at the pH of meat spoilage (pH = 6.2–6.8), which is why they were used in this study. Anthocyanins are the most common natural pigment and are found in a variety of fruits, vegetables, and plants that exhibit blue, red, or purple hues (red cabbage, sweet potatoes, blueberries, raspberries, grapes, etc.). Studies have shown that anthocyanins obtained from red cabbage (Brassica oleracea) extract are more resistant and stable than those from other extracts [10], and their interaction with polysaccharides increases their stability due to the hydrogen bonds formed and electrostatic interactions [11,12,13]. Several studies have incorporated red cabbage anthocyanins into biopolymer films for pH-responsive applications [REFS], yet their performance as non-contact indicators for minced poultry—validated through microbiological, physicochemical, and volatile analyses—remains insufficiently explored. In the present study, such interactions are discussed based on literature data, without implying direct structural verification.
An edible film is any type of thin layer of material used to coat a food product to extend its shelf life [14,15]. The ingredients used to make edible films and coatings are classified into three categories: hydrocolloids (such as proteins, polysaccharides, and alginates), lipids (such as fatty acids, acylglycerol, and waxes), and composite materials (films made from both hydrocolloids and lipids) [14]. Regarding the packaging of fresh meat, the film must have low water vapor permeability and a medium oxygen barrier (so that the form of oxyhemoglobin prevails and the production of metmyoglobin is prevented), while cooked and cured meat requires a high/absolute oxygen barrier [16,17,18,19,20].
Corn starch was chosen as the basis for the preparation of edible films due to the stability it provides for anthocyanins. Starch is a natural polysaccharide consisting of 20–25% amylose and 75–80% amylopectin. The amylose/amylopectin ratio has been shown to affect the physical and chemical properties of starch [21,22]. When starch is mixed with water, gelatinization occurs, i.e., the irreversible swelling of starch granules and gel formation [22,23]. The films produced are translucent or transparent, odorless and tasteless; have a high gas barrier and relatively good mechanical properties; but are highly permeable to water vapor [15,21,22]. In addition to their functional properties, starch-based films are increasingly attracting interest as biodegradable, renewable, and low-impact materials, in line with current sustainability goals in food packaging. Replacing petroleum-derived plastics with plant-based polymers, such as starch, helps reduce environmental burden and supports circular economy strategies.
Since meat is one of the main sources of protein in the human diet and is consumed in high quantities, it was chosen as a substrate to study the action of the films, in order to determine whether the consumer can detect the deterioration of the product through the color change of the films. Meat is one of the most vulnerable food categories because, during storage, various microorganisms and endogenous enzymes develop, which causes changes in the chemical composition of the food. There are four main mechanisms of meat spoilage: microbiological spoilage, enzymatic autolysis, and the oxidation of lipids and proteins [24,25,26,27]. Degradation of proteins and other nitrogen compounds because of the previous spoilage mechanisms causes accumulation of organic amines, quantified as total volatile basic nitrogen (TVB-N), which leads to an increase in pH, which is used as an index of meat spoilage. Since the color change of anthocyanins is directly linked to pH, their incorporation into films provides a mechanistic basis for freshness monitoring.
Although anthocyanin-based indicators have been widely studied, their application as non-contact freshness indicators for minced chicken—combined with microbiological, pH, TVB-N, and volatile compound validation—has received limited attention. Moreover, the narrow pH range associated with poultry spoilage presents a challenge for visual detection, highlighting the need to evaluate the practical sensitivity of such films. Smart indicators that visually signal spoilage can also contribute to reducing food waste, enabling consumers and retailers to make more informed decisions about product freshness.
In this perspective, the present study aimed to develop a smart, non-contact, natural-origin freshness indicator for the direct monitoring of minced chicken quality characteristics during refrigerated storage. Natural products [red cabbage extract (RCE) as an indicator and corn starch for film production] were chosen as the basis of these films, as it was considered that the high anthocyanin content in RCE detects small pH variations, which would be easily observable through color changes of the films during storage and spoilage. The exclusive use of natural, plant-derived components further enhances the sustainability profile of the proposed system, offering a safer and more environmentally responsible alternative to synthetic chemical indicators. Previous studies [26] focused mainly on film characterization or pH-dependent color transitions under controlled laboratory conditions, while the present study evaluates anthocyanin-based indicators in a non-contact configuration inside real meat packages and validates their response against microbiological, physicochemical, and VOC spoilage indicators. In addition, a chemical indicator (methyl red) was included as a methodological control to compare the responsiveness of natural and synthetic indicators. The prepared films were applied as indicators on polystyrene plates with burger-sized samples of minced chicken, and their color change was tested during storage of meat at 4 ± 1 °C for 7 days. Shelf life was defined based on microbiological thresholds commonly applied to minced poultry, particularly TVC values exceeding 7 log CFU/g [27]. Although quantitative colorimetry (CIELab) was not conducted, this study provides an assessment of visual color changes with a view to feasibility, and this limitation is explicitly acknowledged and discussed.

2. Materials and Methods

2.1. Chemicals and Reagents

The red cabbage used for the extraction of anthocyanins was purchased from a local greengrocer in the city of Ioannina. Commercial corn starch (Keramaris, Sindos, Thessaloniki, Greece) was used for the preparation of the films. The chemical reagents used in this study were as follows: ethanol, 99% (Fisher Chemical, Loughborough, UK); hydrochloric acid, 37% (Sigma Aldrich, Steinheim, Germany); DPPH (TCI Europe N.V, Zwijndrecht, Belgium); methanol (Merck kGaA, Darmstadt, Germany); gallic acid (Merck kGaA, Darmstadt, Germany); Folin–Ciocalteu reagent (Merck kGaA, Darmstadt, Germany); Na2CO3 (Merck kGaA, Darmstadt, Germany); glacial acetic acid, 100% (Merck kGaA, Darmstadt, Germany); ammonia solution, 25% (Merck kGaA, Darmstadt, Germany); NaOH (Merck kGaA, Darmstadt, Germany); glycerol, ≥99% (Fisher Chemical, Loughborough, UK); methyl red (Merck kGaA, Darmstadt, Germany); magnesium oxide, ≥98% (Carl Roth, Karlsruhe, Germany); H3BO3 (Carl Roth, Karlsruhe, Germany); 4-methyl-2-pentanone (Merck kGaA, Darmstadt, Germany). The microbiological reagents used were as follows: buffered peptone water (Biolife, Italiana S.r.l., Milano, Italy), Plate Count Agar (PCA; CODE NCM0010A; NEOGEN Culture Media, Heywood, UK), Pseudomonas Agar Base (Code CM0559; Oxoid, Basingstoke, UK), Pseudomonas C-N Supplement (SR0102E; OXOID, Basingstoke, UK), STAA Agar Base (Code CM0881; OXOID, Basingstoke, UK), STA Selective Supplement (SR0162E; OXOID, Basingstoke, UK), Rose Bengal Chloramphenicol Agar Base (RBCA; CODE LAB036; NEOGEN Culture Media, Heywood, UK), Chloramphenicol (Code NCM4051-0.5; NEOGEN Culture Media, Heywood, UK), Violet Red Bile Glucose Agar (VRBGA; CODE NCM0041A; NEOGEN Culture Media, Heywood, UK), de Man Rogosa και Sharpe’s (MRS; CODE 281 NCM0190A; NEOGEN Culture Media, Heywood, UK). All reagents were of analytical grade and used without further purification.

2.2. Preparation and Evaluation of Red Cabbage Extract

2.2.1. Extraction of Anthocyanins

The extraction of anthocyanins was carried out according to the method described by Demirdöven et al. [28] and Prietto et al. [26] with minor modifications. Specifically, 10 g of red cabbage was added to a beaker, along with 30 mL of acidified ethanol [85 mL of pure ethanol and 15 mL of 1.5 N HCl], and the mixture was placed in an ultrasonic bath (Sonorex Super RK510H, Bandelin, Berlin, Germany), in the dark for 1 h at 30 °C. After 1 h, filtration was performed by pleated filter paper, and the supernatant was stored in a dark-colored vial. A second extraction of the residue with 20 mL of acidified ethanol was performed under the same conditions. The combined extracts were stored in the freezer, at −20 °C, for further use. The extraction procedure was selected based on previously validated methods for maximizing anthocyanin recovery from Brassica oleracea.

2.2.2. Determination of Antioxidant Activity (AA) of Red Cabbage Extract

The AA of the red cabbage extract (RCE) was assessed by measuring the % inhibition of the DPPH radical, according to the method described by Ademoyegun et al. [29] with minor modifications. In a 3.5 mL plastic cuvette, 0.1 mL of RCE and 2.9 mL of 0.1 mM DPPH solution were added and left in the dark for 30 min at ambient temperature. The absorbance at 517 nm was then measured against methanol as a blank using a spectrophotometer (Infinite M Nano, Tecan GmbH, Grödig, Austria). The % inhibition of the DPPH radical was calculated from the equation
% A A = A 0 A S A 0 × 100 ,
where A0 is the absorbance of the pure DPPH solution and AS is the absorbance of the RCE. All determinations were run in triplicate. The measurements are provided as mean values ± standard deviations.

2.2.3. Determination of Total Phenolic Content in Red Cabbage Extract

The total phenolic content (TPC) in the RCE was determined according to the Folin–Ciocalteu method [30]. A volume of 0.2 mL of RCE (diluted 4 times with H2O) was added to a 5 mL volumetric flask along with 0.2 mL of Folin–Ciocalteu reagent and 2.4 mL of d.H2O and left for 5 min in a dark place. Subsequently, 0.4 mL of 20% Na2CO3 (w/v) was added, and the volume was filled up with d.H2O. The solutions were left in the dark for 2 h, and their absorbance was measured at 765 nm against a blank solution using a UV–Vis spectrophotometer (Infinite M Nano, Tecan GmbH, Grödig, Austria). Standard solutions of gallic acid were used for the quantification of TPC in RCE (20–250 ppm). All determinations were run in triplicate. The measurements are provided as mean values ± standard deviations.

2.2.4. Evaluation of Red Cabbage Extract Color Change as a Function of pH

Firstly, buffer solutions of CH3COOH/CH3COONa (KaCH3COOH = 1.8 × 10⁻⁵, pH = 4.74) and NH3/NH4Cl (KbNH3 = 1.8 × 10⁻⁵, pH = 9.26) were prepared, followed by the addition of appropriate volumes of acid (CH3COOH and HCl) or base (NaOH and NH3) to the initial buffer solutions in order to prepare different stock solutions for each of the values of the pH range 1 to 12. Subsequently, 100 μL of neutralized RCE [obtained by adding 1.5 M NaOH to achieve pH = 7] and 300 μL of each stock solution at different pH levels were added to test tubes to evaluate the color change of the primary extract.
Color changes of the extract were evaluated visually under standardized lighting conditions (D65 illumination) against a white background. Although quantitative colorimetry was not available during the experimental period, visual assessment was used as a feasibility-oriented approach and is acknowledged as a limitation.

2.3. Preparation of Film Spoilage Indicators

2.3.1. Corn Starch Films (CSFs)

CSFs were prepared according to the casting technique [26]. A total of 5 g of corn starch and 100 mL of distilled H2O were added to a beaker, placed on a magnetic stirrer (AREX Heating Magnetic Stirrer, VELP Scientifica, Usmate Velate, MB, Italy) and left under stirring for 20 min. Subsequently, 1.5 g of glycerol was added as a plasticizer, and stirring was continued under heating until the temperature reached 85 ± 5 °C for at least 40 min. Finally, 38 mL of the starch solution was poured onto plastic dishes of diameter d = 14.1 cm, an amount suitable based on preliminary tests. The dishes were placed in a temperature-controlled chamber (WTB BINDER, Labortechnik GmbH, Tuttlingen, Germany) at 40 °C for 48 h until they were completely dry. After 48 h, the films were detached from the dishes and stored in PA/PE bags under vacuum until further use.

2.3.2. Corn Starch Films with an Integrated Red Cabbage Extract Indicator

CSFs with an integrated red cabbage extract indicator (CSF + RCE) were prepared by the same procedure as previously reported, except that when the temperature reached 85 ± 5 °C, the heating was stopped until the temperature dropped to 50 °C, and then an appropriate amount of RCE (previously neutralized with NaOH 1.5 M to pH = 5) was added to obtain solutions containing 10% and 20% extract (v/v, natural indicator). The solutions were left under stirring for 10 min, and the above-mentioned amount was added to the plastic dishes and allowed to dry.
The addition of RCE (10% and 20% v/v) did not visibly interfere with the gelatinization process of starch. Gel formation, viscosity, and film-forming ability remained comparable to the control CSF, consistent with previous reports on anthocyanin–starch interactions.

2.3.3. Corn Starch Films with an Integrated Methyl Red Indicator

Films with the chemical indicator containing 5% v/v methyl red (CSF + MRI) were prepared as a methodological control to detect the deterioration of chicken mince samples more rapidly. The same experimental procedure as for the preparation of CSF + RCE specimens was followed.
Methyl red (MRI) films were prepared solely as methodological controls to confirm the presence of volatile amines during spoilage. These films were not intended for food-contact applications due to migration concerns but served as a benchmark for rapid color response.

2.4. Film Measurements

2.4.1. Film Thickness

The film thickness was determined by a digital micrometer (Electronic Outside Micrometer, IS 13109 INSIZE Co., Ltd., Suzhou, China). A total of 6–10 different, random points on the film’s surface were measured. The measurements are provided as mean values ± standard deviations.

2.4.2. Mechanical Properties

At least 5–10 specimens of each material were cut in the form of rectangles (1.5 cm × 10 cm). Measurements were performed using a Model 4411 Instron Dynamometer (Instron Engineering Corp., Canton, MA, USA). In the method used, the crosshead speed was 15 mm/min, and the grab distance was 5 cm. The properties determined were load at break (N), % elongation at break, tensile strength at break (stress) (MPa), and Young’s modulus (MPa).

2.4.3. Moisture Content and Water Solubility of Films

Determination of moisture content (MC) and water solubility (WS) was conducted according to the method by Zhang et al. [31] with some modifications. MC in films was determined by the gravimetric method. For each sample, three square specimens (2 cm × 2 cm) were dried at 105 °C for 2 h. The weight of the samples before drying (M1) and after drying (M2) was measured, respectively. For the determination of WS, three dried samples (2 cm × 2 cm) were weighed (M2) and then immersed in a beaker containing 50 mL of d.H2O for 2 h with gentle stirring. The samples were removed from the beaker and dried at 105 °C for 2 h and weighed (M3). The MC and WS of the samples were calculated as follows:
M C = M 1 M 2 M 1 × 100
W C = M 2 M 3 M 2 × 100
All determinations were run in triplicate. The measurements are provided as mean values ± standard deviations.

2.4.4. Determination of Antioxidant Activity of Films

The antioxidant activity of the films was determined according to the method by Wang et al. [32] with some modifications. At first, 30 mg of each type of film was cut and placed in test tubes with 4.5 mL of 0.1 mM DPPH solution and was then left in the dark at ambient temperature for 30 min. Then the absorption was measured at 517 nm against a methanol blank using a UV–Vis spectrophotometer (Infinite M Nano, Tecan GmbH, Grödig, Austria). Calculations were the same as in Section 2.2.2. All determinations were run in triplicate. The measurements are provided as mean values ± standard deviations.

2.4.5. Determination of Total Phenolic Content in Films

TPC in films was measured according to the method by Wang et al. [32] with some modifications. A 250 mg piece of each film was cut and placed in centrifuge tubes along with 5 mL of methanol. This was followed by centrifugation for 15 min, at 20 °C at 3000 rpm. Then, 0.2 mL of the supernatant solution, 2.4 mL of d.H2O, and 0.2 mL of Folin–Ciocalteu reagent were added to a 5 mL volumetric flask and kept in a dark place for 5 min. Finally, 0.4 mL of 20% Na2CO3 was added, and the flask volume was filled to the top with distilled H2O. The solutions were left in the dark for 2 h, and their absorbance at 765 nm was measured against the blank solution using a UV–Vis spectrophotometer (Infinite M Nano, Tecan GmbH, Grödig, Austria). Standard solutions of gallic acid were used for the quantification of TPC in films (20–250 ppm). All determinations were run in triplicate. The measurements are provided as mean values ± standard deviations.

2.5. Minced Chicken Meat Samples Packaging Preparation

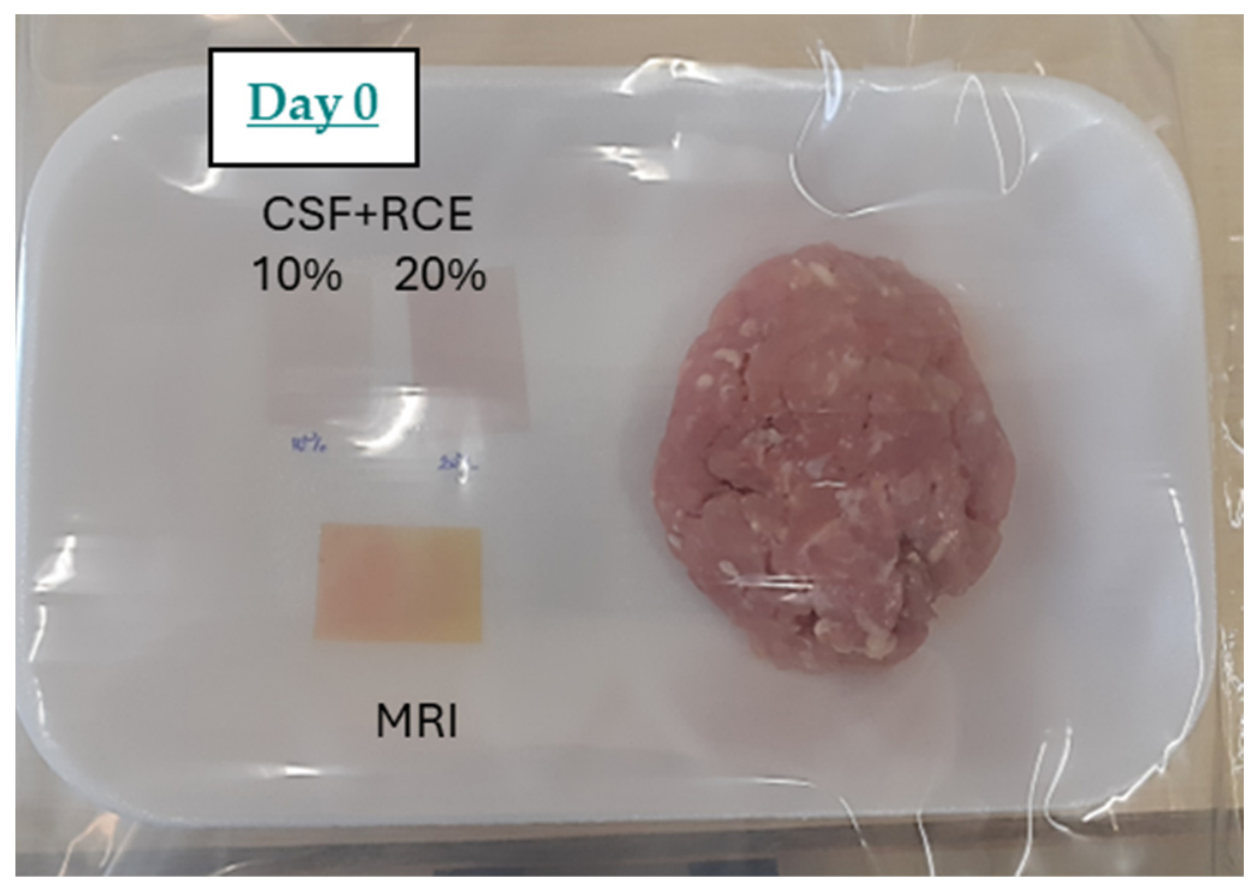
Minced chicken meat (50% breast and 50% thigh), which was obtained from the industry “Pindos SA”, located in Ioannina, was transported to the Food Chemistry Laboratory of the University of Ioannina under refrigeration in an isothermal bag in 30 min. The minced chicken meat was divided into portions of 150 g, which were formed into the shape of a burger and placed in polystyrene (PS; 270 × 170 × 45 mm) trays along with rectangular pieces of the prepared corn starch films (CSF + 10%RCE, CSF + 20%RCE and CSF + 5%MRI) in order to detect whether the microbial spoilage of the minced meat is consistent with the color change of the films and whether ultimately these films can be used as smart packaging. Finally, the discs were enclosed in PA/PE bags (Figure 1), which are characterized by a high barrier to volatile compounds, in order to trap the volatile amines produced during meat spoilage and to observe the color change of films more easily, under aerobic conditions and refrigerator storage (4 °C ± 1 °C). Control tests with empty packaging confirmed that the polystyrene and PA/PE materials did not induce any color change in the indicator films. Sampling was carried out on days 0, 3, 5, and 7.

2.6. Microbiological Analysis of Packaged Meat Samples

Microbiological analysis of the meat samples was performed according to the official methods of analysis of the International Commission on Microbiological Specification for Foods [33]. A sample (10 g) of minced chicken was transferred under aseptic conditions into a Stomacher bag (Seward Medical, Worthing, West Sussex, UK) containing 90 mL of sterile peptone water at 0.1% w/v and homogenized for 120 s at ambient temperature using a Lab Blender Stomacher (Seward Medical, London, UK). For microbial enumeration, 0.1 mL samples of serial dilutions of minced meat homogenates were spread on the surface of dry media. Total viable counts (TVCs) were determined using PCA after incubation for 2 days at 30 °C. Pseudomonads were determined on the selective Pseudomonas Agar Base with the addition of antibiotic Pseudomonas C-N Supplement SR0102E after incubation for 2 days at 30 °C. Brochothrix thermosphacta was determined on STAA Agar Base with the addition of antibiotic STA Selective Supplement SR0162E after incubation for 2 days at 30 °C. Yeasts and molds were enumerated using RBCA and Chloramphenicol as an antibiotic; the colony counting of yeasts was performed after incubation at 30 °C for 2 days and that of molds after incubation at 30 °C for 5 days. Enterobacteriaceae were determined on VRBGA after incubation for 1 day at 37 °C. Lactic acid bacteria (LAB) were determined on MRS after incubation for 3 days at 37 °C.

2.7. Physicochemical Analysis of Packaged Meat Samples

2.7.1. Determination of pH

A total of 10 g of minced chicken meat was completely homogenized with 90 mL of distilled H2O. The pH was measured by using an electronic pH-meter (pH-Z-METER, HD 3456.2, Delta OHM, Padova, Italy) at room temperature. All determinations were run in triplicate. The measurements are provided as mean values ± standard deviations.

2.7.2. Determination of TVB-N

TVB-N was determined according to Assanti et al. [34] and Sun et al. [35] with some modifications. Specifically, 10 g of minced chicken meat was completely homogenized with 100 mL of d.H2O. Subsequently, 5 mL of the supernatant was mixed with 5 mL of MgO 5% (w/v) in a Kjeldahl distillation flask, while 10 mL of H3BO3 2% (w/v) was added to an Erlenmeyer flask. Then, steam distillation, using a Kjeldahl unit (UDK 129 Distillation Unit, Velp Scientifica, Italy), was performed for 5 min, and the collected distillate was titrated with HCl at 0.01 N. The titration of the blank was performed by the procedure mentioned above, except that instead of 5 mL of filtrate, 5 mL of deionized water was added. The TVB-N was calculated using Equation (3):
T V B N m g 100 g = ( V 1 V 2 ) × C × 14 m × 0.05 × 100
where V1 and V2 are the volumes of HCl consumed for the titration of the sample and blank, respectively; C is the concentration of HCl; m is the weight of the sample; 14 is the molecular weight of N2; and 0.05 is the reduction factor of TVB-N content from 5 mL to 100 mL of the filtrate. All determinations were run in triplicate. The measurements are provided as mean values ± standard deviations.

2.7.3. Semi-Quantification of Volatile Compounds of Packaged Meat Samples

The volatile profile of the samples was determined using Headspace Solid-Phase Microextraction with Gas Chromatography–Mass Spectrometry (HS-SPME/GC-MS). We used an Agilent 7890A gas chromatograph coupled with an Agilent mass spectrometer, model 5973C (Agilent Technologies, Santa Clara, CA, USA); an Agilent DB-5MS capillary column (5% Pheny-methylpolysiloxane; 60 m × 0.320 mm × 1.00 μm; Agilent Santa Clara, CA, USA); Carboxen/Polydimethylsiloxane (CAR/PDMS) 75 μm fiber (Supelco, Bellefonte, PA, USA); and 4-methyl-2-pentanone internal standard (Merck kGaA, Darmstadt, Germany). Helium was used as the carrier gas at a flow rate of 1.5 mL/min. The injection port was equipped with a 0.75 mm i.d. liner (Supelco, Bellefonte, PA, USA) suitable for SPME analysis in split mode (split ratio = 2:1) at 260 °C.
A total of 3 g of minced chicken and 20 μL of 4-methyl-2-pentanone as internal standard at a final concentration of 26.67 ppb were placed in a 20 mL vial. Then, the vial was airtightly sealed with a perforated aluminum stopper that had a polytetrafluoroethylene (PTFE)/silicone septum. The sealed vial was placed in a thermostatic water bath at 50 °C for 15 min for equilibration, and the fiber was exposed for another 15 min to the headspace. The fiber was then removed from the vial and injected into the injection port of the gas chromatograph. The initial oven temperature was 40 °C, followed by a temperature increase at a rate of 10 °C/min to 110 °C, then the temperature increased to 160 °C at a rate of 5 °C/min, and finally the temperature was increased to 260 °C at a rate of 10 °C/min, where it was maintained for 3 min. The interface temperature was set to 270 °C. The mass scan range was 29–350 m/z. The MS source and quadrupole temperatures were 230 °C and 150 °C, respectively. Peak identification was performed by comparing the eluting compounds’ mass spectra with the Wiley Library (Wiley, 7-NIST 05, J. Wiley & Sons Ltd., West Sussex, UK) and by calculating the relative retention indices (RIs) using n-alkane (C8–C20) standards (Fluka, Buchs, Switzerland). All determinations were run in triplicate. The measurements are provided as mean values ± standard deviations.

2.8. Statistical Analysis

Experiments were replicated twice (biological replicates consisted of independently prepared samples), while analyses were run in triplicate (corresponding to technical replicates) for each sampling day per treatment. All analyses are presented as mean values ± standard deviation. The statistical processing of the data was performed using the statistical software package SPSS version 25.0 Statistics (IBM, Armonk, NY, USA) [36]. The comparison of the means of the values of the parameters studied was performed by one-way ANOVA and Tukey’s multiple range test. Based on the test of variance (one-way ANOVA), it was determined whether the p-value was less (alternative hypothesis) than or greater than 0.05 (null hypothesis).

3. Results and Discussion

3.1. Characterization of RCE

3.1.1. Antioxidant Activity and Total Phenolic Content in RCE

The results obtained were as follows: % RSA = 48.20 ± 3.96 and 236.10 ± 3.43 mg gallic acid/100 g of red cabbage.
According to the literature, the antioxidant activity (%AA) of red cabbage is close to 60% immediately after harvesting, while this percentage decreases during storage. Obviously, antioxidant activity is directly affected by variety, cultivation techniques, climate, storage conditions, etc. [37]. In the present study, both AA and TPC were lower than those reported in the literature, which may be due to the variety of cabbage and/or the storage conditions. TPC in red cabbage extract, according to previous studies, ranged from 366.30 ± 3.60 to 393.10 ± 10.80 mg gallic acid/100 g of fresh sample [38].
These differences highlight the natural variability of anthocyanin-rich matrices and reinforce the importance of characterizing each extract before incorporation into film-forming solutions.
It should also be noted that IC50 values, as well as the extraction yield and the purity of individual anthocyanins, were not determined in this study, as the aim was to evaluate the extract’s functionality as a pH-responsive indicator rather than performing full phytochemical characterization or quantifying antioxidant potency.

3.1.2. Evaluation of RCE Color Changes at Different pH Values

The color changes of anthocyanins as a function of pH depend on the extraction source (e.g., red cabbage and beetroot), its variety, and the extraction method.
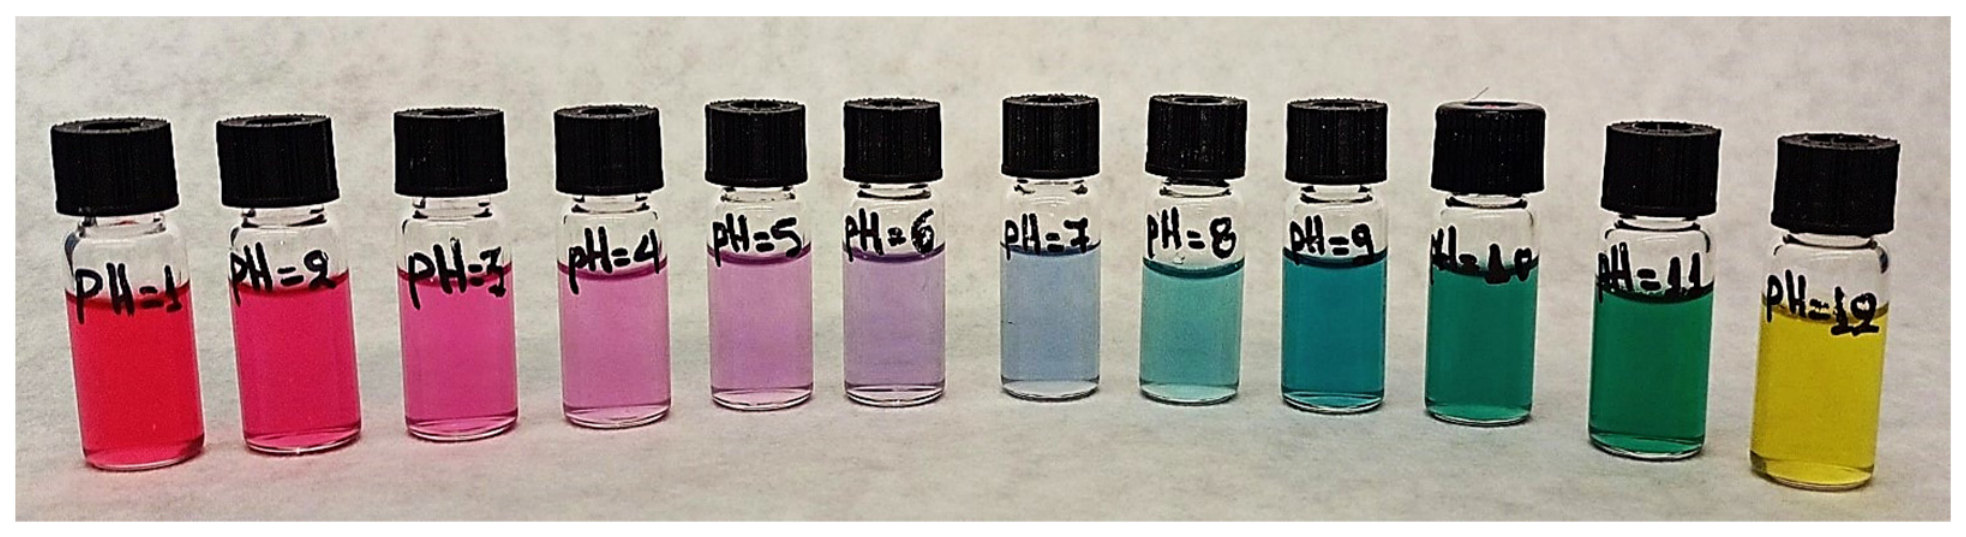
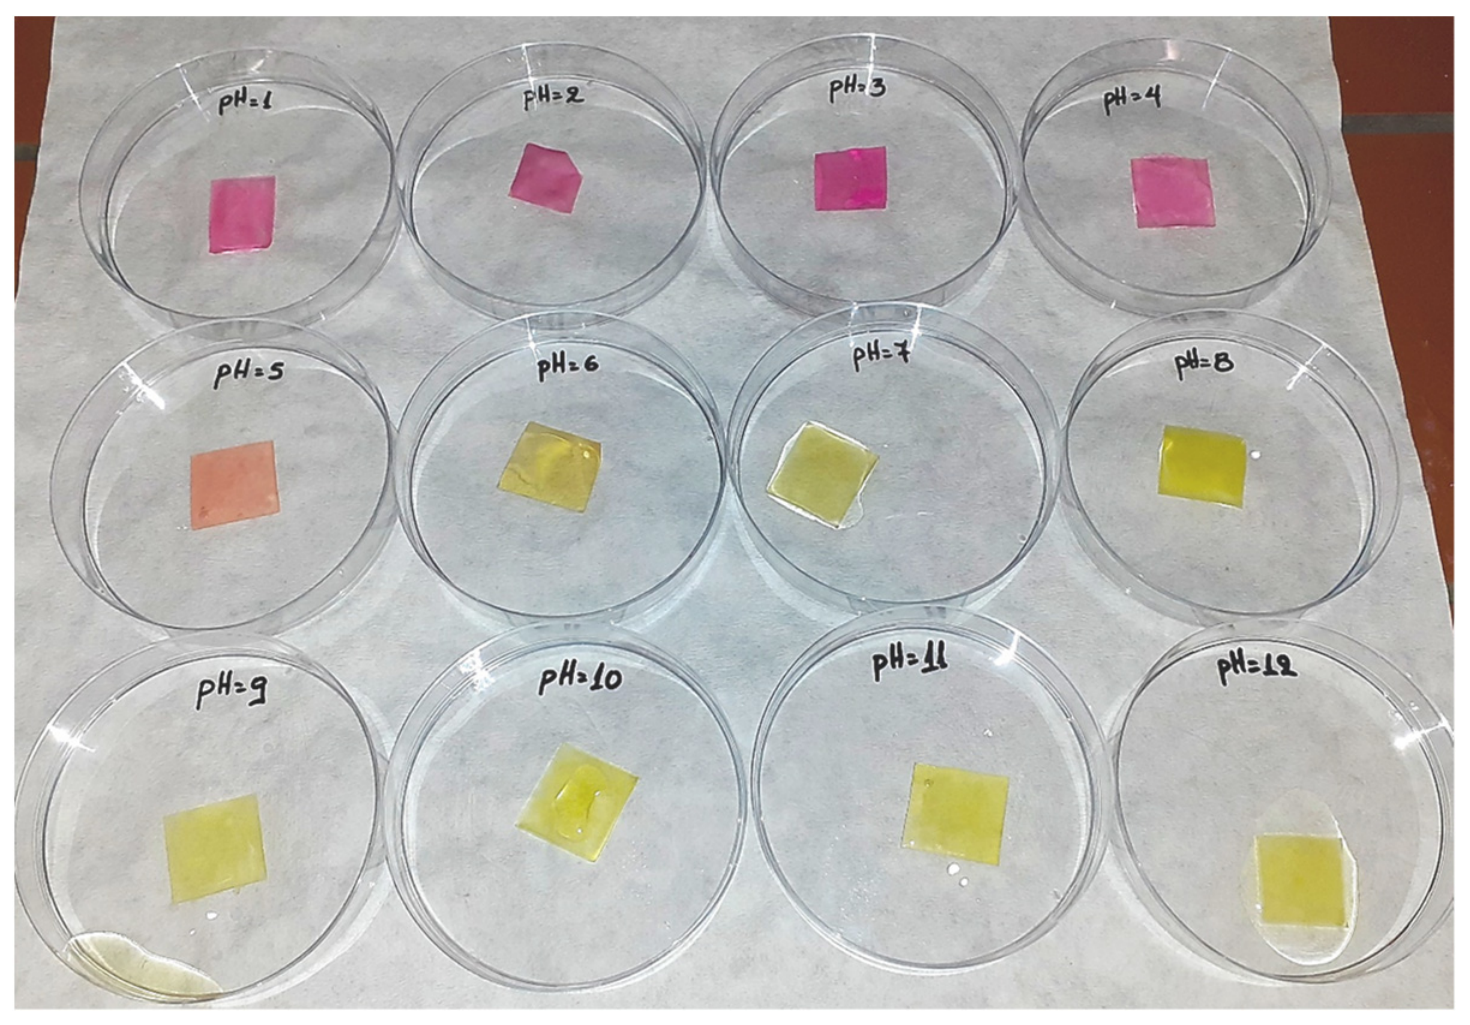
Specifically, the color changes of anthocyanins in RCE at different pH values are presented in Figure 2. The above color variations confirm what was mentioned above about anthocyanins and how their color changes under different pH conditions [39].
At pH < 2, the color of the extract is red due to the formation of the flavylium cation. At pH 2–7, the chemical structure of a quinone base and the purple/blue color dominate, while at pH > 7, chalcone is formed, and the color changes to green and yellow.
Importantly, the pH range associated with poultry spoilage (approximately 5.4–6.8) is relatively narrow, which inherently limits the magnitude of visible color transitions. This explains why the color differences observed between pH 5 and 7 were subtle. Although instrumental colorimetry (e.g., CIELab) was not available during the experimental period, visual assessment was performed under standardized lighting conditions and is recognized as a limitation of the present feasibility study.

3.2. Characterization of the Prepared Film Spoilage Indicators

3.2.1. Visual Observation of the Films

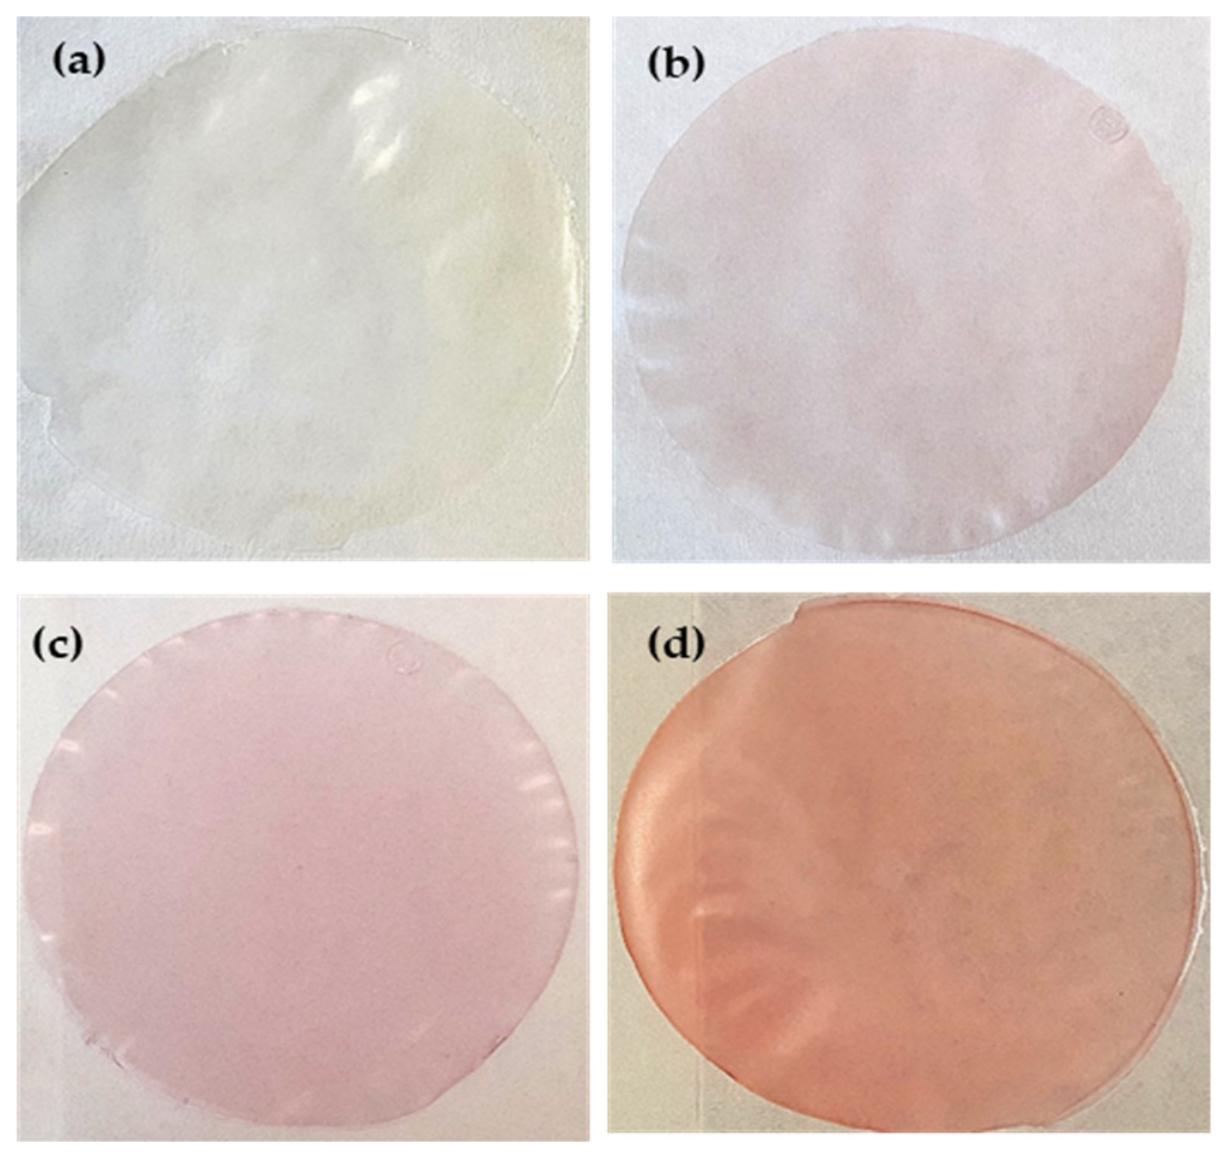
The prepared CSFs with the addition of RCE as a natural indicator and MRI as a chemical indicator are shown in Figure 3.
CSFs with and without added indicators were generally homogeneous and translucent. Between the CSF + 10%RCE and CSF + 20%RCE specimens, the latter ones show a more intense color due to the higher added anthocyanin extract content, while CSF + 5%MRI has the characteristic red color of the indicator. The uniform distribution of RCE within the starch matrix suggests good miscibility between the extract and the polymer solution. However, mechanistic interpretations regarding hydrogen bonding or electrostatic interactions cannot be confirmed in the absence of structural analyses (FTIR, SEM, and XRD).

3.2.2. Color Evaluation of Films Under Conditions of Different pH

The investigation of the color change of the films as a function of pH was carried out in order to determine whether the color of the film follows the chromatic variation of RCE and to identify which film is the most suitable for use as an indicator for detecting meat spoilage.
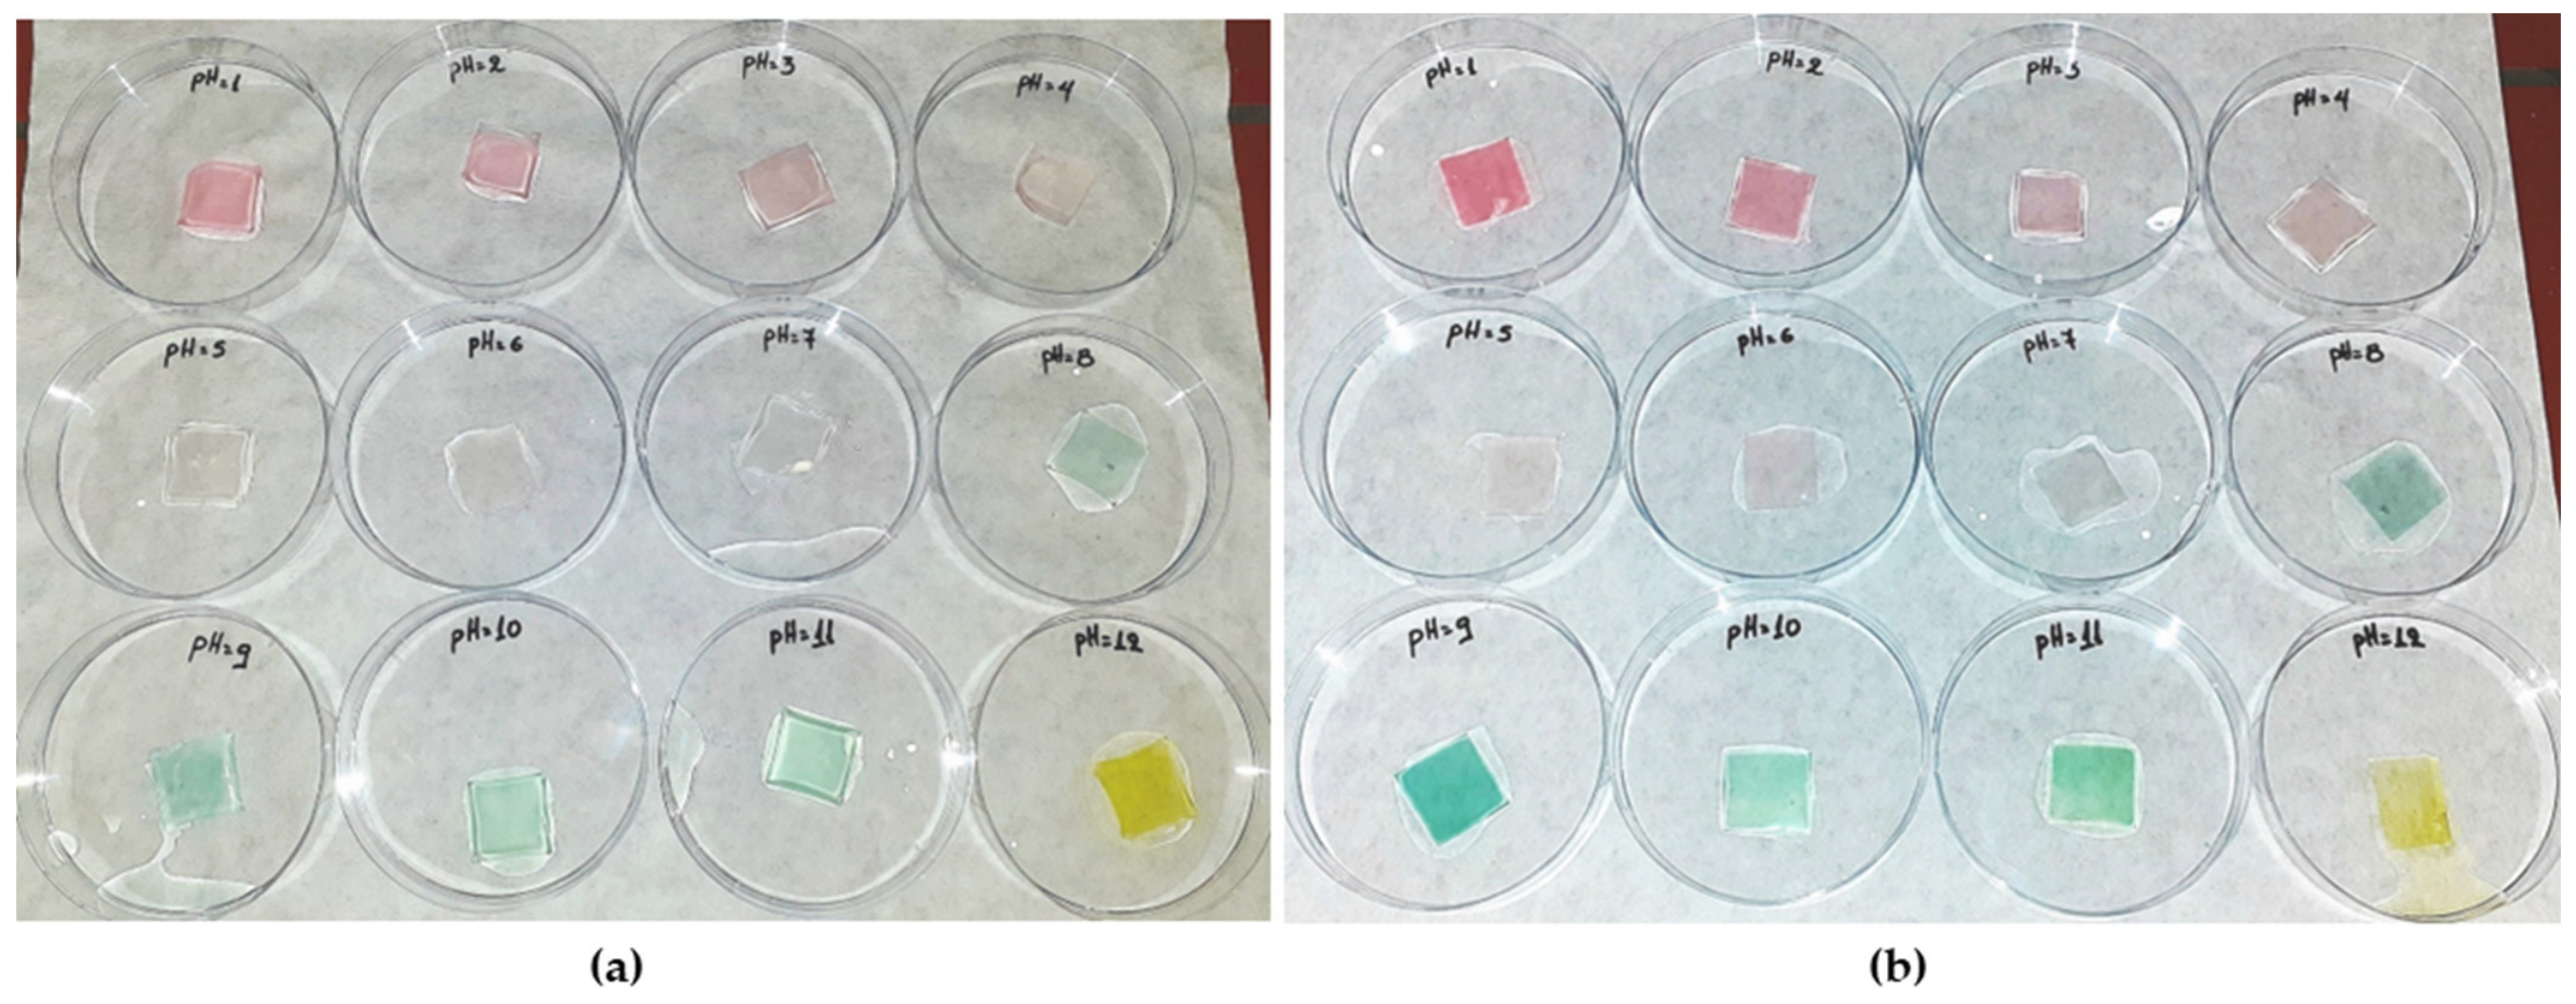
The color changes of the films with incorporated natural (RCE) and chemical (MRI) indicators as a function of pH are shown in Figure 4 and Figure 5, respectively.
As shown in Figure 4, the color changes observed are the same in both cases of CSF + 10%RCE and CSF + 20%RCE, but in the latter, the colors at different pH values appear more intense, so the amount of RCE added seems to be more suitable for application in smart food packaging materials. Furthermore, at meat spoilage pH (6.2–6.8), CSF + 20%RCE specimens show a more noticeable color change from pale pink to colorless/gray compared with CSF + 10%RCE.
However, the visual differences between pH 5 and 7 remained subtle, confirming the researcher’s observation. This is expected given the limited structural transformation of anthocyanins within this narrow pH interval.
The films with an integrated chemical indicator (Figure 5) showed no significant color variation, but the most noticeable difference was at the pH values where meat spoilage occurs.
For this reason, they were used as methodological control indicators, so that the accumulation of volatile amines in the packaging environment during aerobic storage could be immediately observed. These films were prepared only for the above-mentioned reason and not for application as a contact freshness indicator, due to the great concern about chemical migration in products intended for human consumption. This comparison allowed us to benchmark the responsiveness of natural anthocyanins against a synthetic pH indicator with a sharper transition range. The reliance on visual inspection represents a methodological limitation. Future studies should incorporate instrumental colorimetry (CIELab) to quantify subtle chromatic transitions within the narrow spoilage-related pH range.

3.2.3. Film Thickness

Film thickness falls within the limits of films intended for food packaging (10–300 μm). As can be seen in Table 1, the CSFs have the lowest thickness compared with the other films. The increase in thickness observed in CSF + RCE and CSF + MRI may be due to the addition of RCE, which alters the starch-to-solvent ratio and introduces ethanol traces, which may influence gelatinization behavior, polymer interactions, and film microstructure; therefore, the mechanical properties cannot be interpreted as direct starch-to-starch comparisons. The observed differences likely reflect the combined effects of anthocyanins and changes in the casting environment. Prietto et al. [26], in their study, prepared corn starch films with incorporated anthocyanin extract from red cabbage. The thickness of the corn starch film ranged from 102 to 112 μm, and the thickness increased to 112–126 μm with the addition of extract. Furthermore, Ghasemlou et al. [40], who prepared corn starch films integrated with various essential oils, recorded that the thickness of the plain film was found to be equal to 151 ± 4 μm, and an increase was observed with the addition of the oils. In summary, the findings of the present study are in accordance with the literature, where in any type of biodegradable film, the addition of extra components, such as extract or essential oils, results in an increase in the thickness of the films.

3.2.4. Mechanical Properties

Mechanical properties comprise a group of important parameters for films’ characterization and provide information about the resistance of these materials to deformation.
Regarding the load at break of each specimen, similar values and statistically non-significant differences (p > 0.05) were observed for CSF (8.9 ± 2.5 N), CSF + 10%RCE (8.2 ± 1.6 N), and CSF + 20%RCE (9.7 ± 1.1 N) specimens, but not for CSF + 5%MRI (14.5 ± 2.1 N), which showed increased resistance at the breaking point, i.e., a higher force applied until collapse occurred.
Concerning % elongation at break, CSF + 5%MRI specimens (26.52 ± 5.06%) showed the lowest value, followed by CSFs (37.21 ± 7.66%), CSF + 10%RCE (70.25 ± 7.12%), and CSF + 20%RCE (78.06 ± 5.48%). It seems that the addition of the MRI has a negative effect on the elasticity of films, probably because this compound cannot form durable bonds with corn starch. Although anthocyanins can form hydrogen bonds with starch, these interactions may disrupt the native starch–starch network, reducing tensile strength while increasing flexibility. This explains why CSF + RCE specimens exhibited lower tensile strength but higher elongation at break compared to CSF.
The tensile strength at break was higher in CSF + 5%MRI specimens (9.551 ± 1.352 MPa), followed by CSFs (7.323 ± 2.062 MPa), CSF + 20%RCE (5.678 ± 0.655 MPa), and CSF + 10%RCE (5.206 ± 0.996 MPa), respectively. In general, higher tensile strength implies higher durability of the material. Therefore, the addition of RCE reduces the strength of the films, while the addition of MRI makes them more durable. This is probably due to the enhanced interactions between corn starch and anthocyanins; the elasticity of the material is increased, causing more deformation upon collapse, whereas for CSF + 5%MRI, the opposite occurs.
Regarding Young’s modulus, the films follow the same pattern as for strength. A high value of Young’s modulus indicates greater rigidity or less elasticity of the material. Therefore, the CSF + 5%MRI specimens (589.07 ± 92.80 MPa) are the most rigid. In conclusion, the addition of RCE modifies mechanical behavior by increasing elasticity at the expense of tensile strength. These trends are consistent with previous reports in starch–anthocyanin systems [26], where phenolic compounds may disrupt interactions between native starches, reduce crystallinity, and increase chain mobility, leading to lower tensile strength and higher elongation. Such effects have been described in starch membranes incorporating anthocyanins or other polyphenolic extracts, providing a plausible explanation for the mechanical behavior observed here without implying direct structural verification.
More detailed structural information about the prepared films cannot be extracted, since FTIR and SEM analyses were not conducted in the present study, as the main purpose of this research study was not the total characterization of the films but the study of their action as spoilage indicators of minced chicken meat.

3.2.5. Moisture Content (MC) and Water Solubility (WS)

Table 1 depicts the values of MC and WS of the samples. Both moisture and solubility are important factors in choosing films for food packaging, so a detailed check and study must be performed to find the right material to correspond to the specific food product requirements.
In the present study, the addition of MRI causes a decrease in moisture and solubility of corn starch films, while the addition of RCE increases these values in proportion to the incorporated amount in the films. This variation also reflects the type of compounds added to each case. Upon incorporation of RCE, the hydrophilic compounds in the total mixture and consequently the moisture and solubility ratios increase, with CSF + 20%RCE showing the highest values (%MC = 12.58 ± 0.22 and %WS = 26.37 ± 1.18). In contrast, when the less hydrophilic compound MRI is added, the moisture content and water solubility are decreased. Prietto et al. [26] concluded the same, showing that the addition of anthocyanins increases the % MC and % WS of films, and they mentioned that this percentage also depends on their extract source and in particular that the films with black bean extract had higher solubility compared with the films containing red cabbage anthocyanins.
Based on the above results, due to their high MC and WS, CSF + 20%RCE specimens were considered unsuitable for food contact, so it was decided to study their use only as smart packaging/non-contact films for the detection of meat spoilage and not as active packaging. Under a non-contact configuration, migration is expected to be negligible, consistent with EU Regulation 10/2011 [7] and definitions of non-contact intelligent packaging systems.

3.2.6. Antioxidant Activity and Total Phenolic Content in Films

The purpose of measuring AA and TPC in films was to provide an estimate of phenolic-related reducing capacity, acknowledging that TPC does not exclusively reflect phenolic retention after film formation. These measurements were not intended to assess antioxidant effects on meat quality. As shown in Table 1, AA significantly increased in films where RCE was incorporated. Compared with pure RCE (%AA = 48.20 ± 3.96), there is a noticeable decrease in %AA in the films due to the lower content in the extract added and the processing conditions (high temperature, aerobic conditions, exposure to light, etc.) during the preparation of films. CSF + 5%MRI specimens showed negligible AA, since the additive used is a purely chemical indicator with no antioxidant activity.
Cheng et al. [41], who prepared films from modified starch incorporated with red cabbage extract at different concentrations (0–40%), recorded similar observations as above; i.e., the AA of the films increased in proportion to the percentage of the extract added. Musso et al. [42] prepared gelatin films incorporated with two different extracts of red cabbage, with water and ethanol as solvents, and concluded that the films with alcohol extract had higher AA.
Regarding TPC in the films, an increase was observed in CSFs with RCE, due to the anthocyanins contained. On the contrary, CSF + 5%MRI showed the highest phenolic content compared with the other films. This can be explained by the fact that the Folin–Ciocalteu method is not selective for phenolic components alone but also identifies other compounds that react with this reagent, such as aminobenzoic acid. Methyl red is a diazonium salt of aminobenzoic acid, so it was co-identified in the analysis.
Ribeiro Sanches et al. [43] agree with the findings of the present study; they prepared corn starch films with whey and red cabbage extract in different concentrations and studied their phenolic content. Their results showed that the higher the ratio of extract (30–70%), the higher the phenolic content in the films, which ranged between 3.23 and 20.55 mg gallic acid/g film.

3.3. Microbiological and Physicochemical Changes in Minced Chicken During Storage

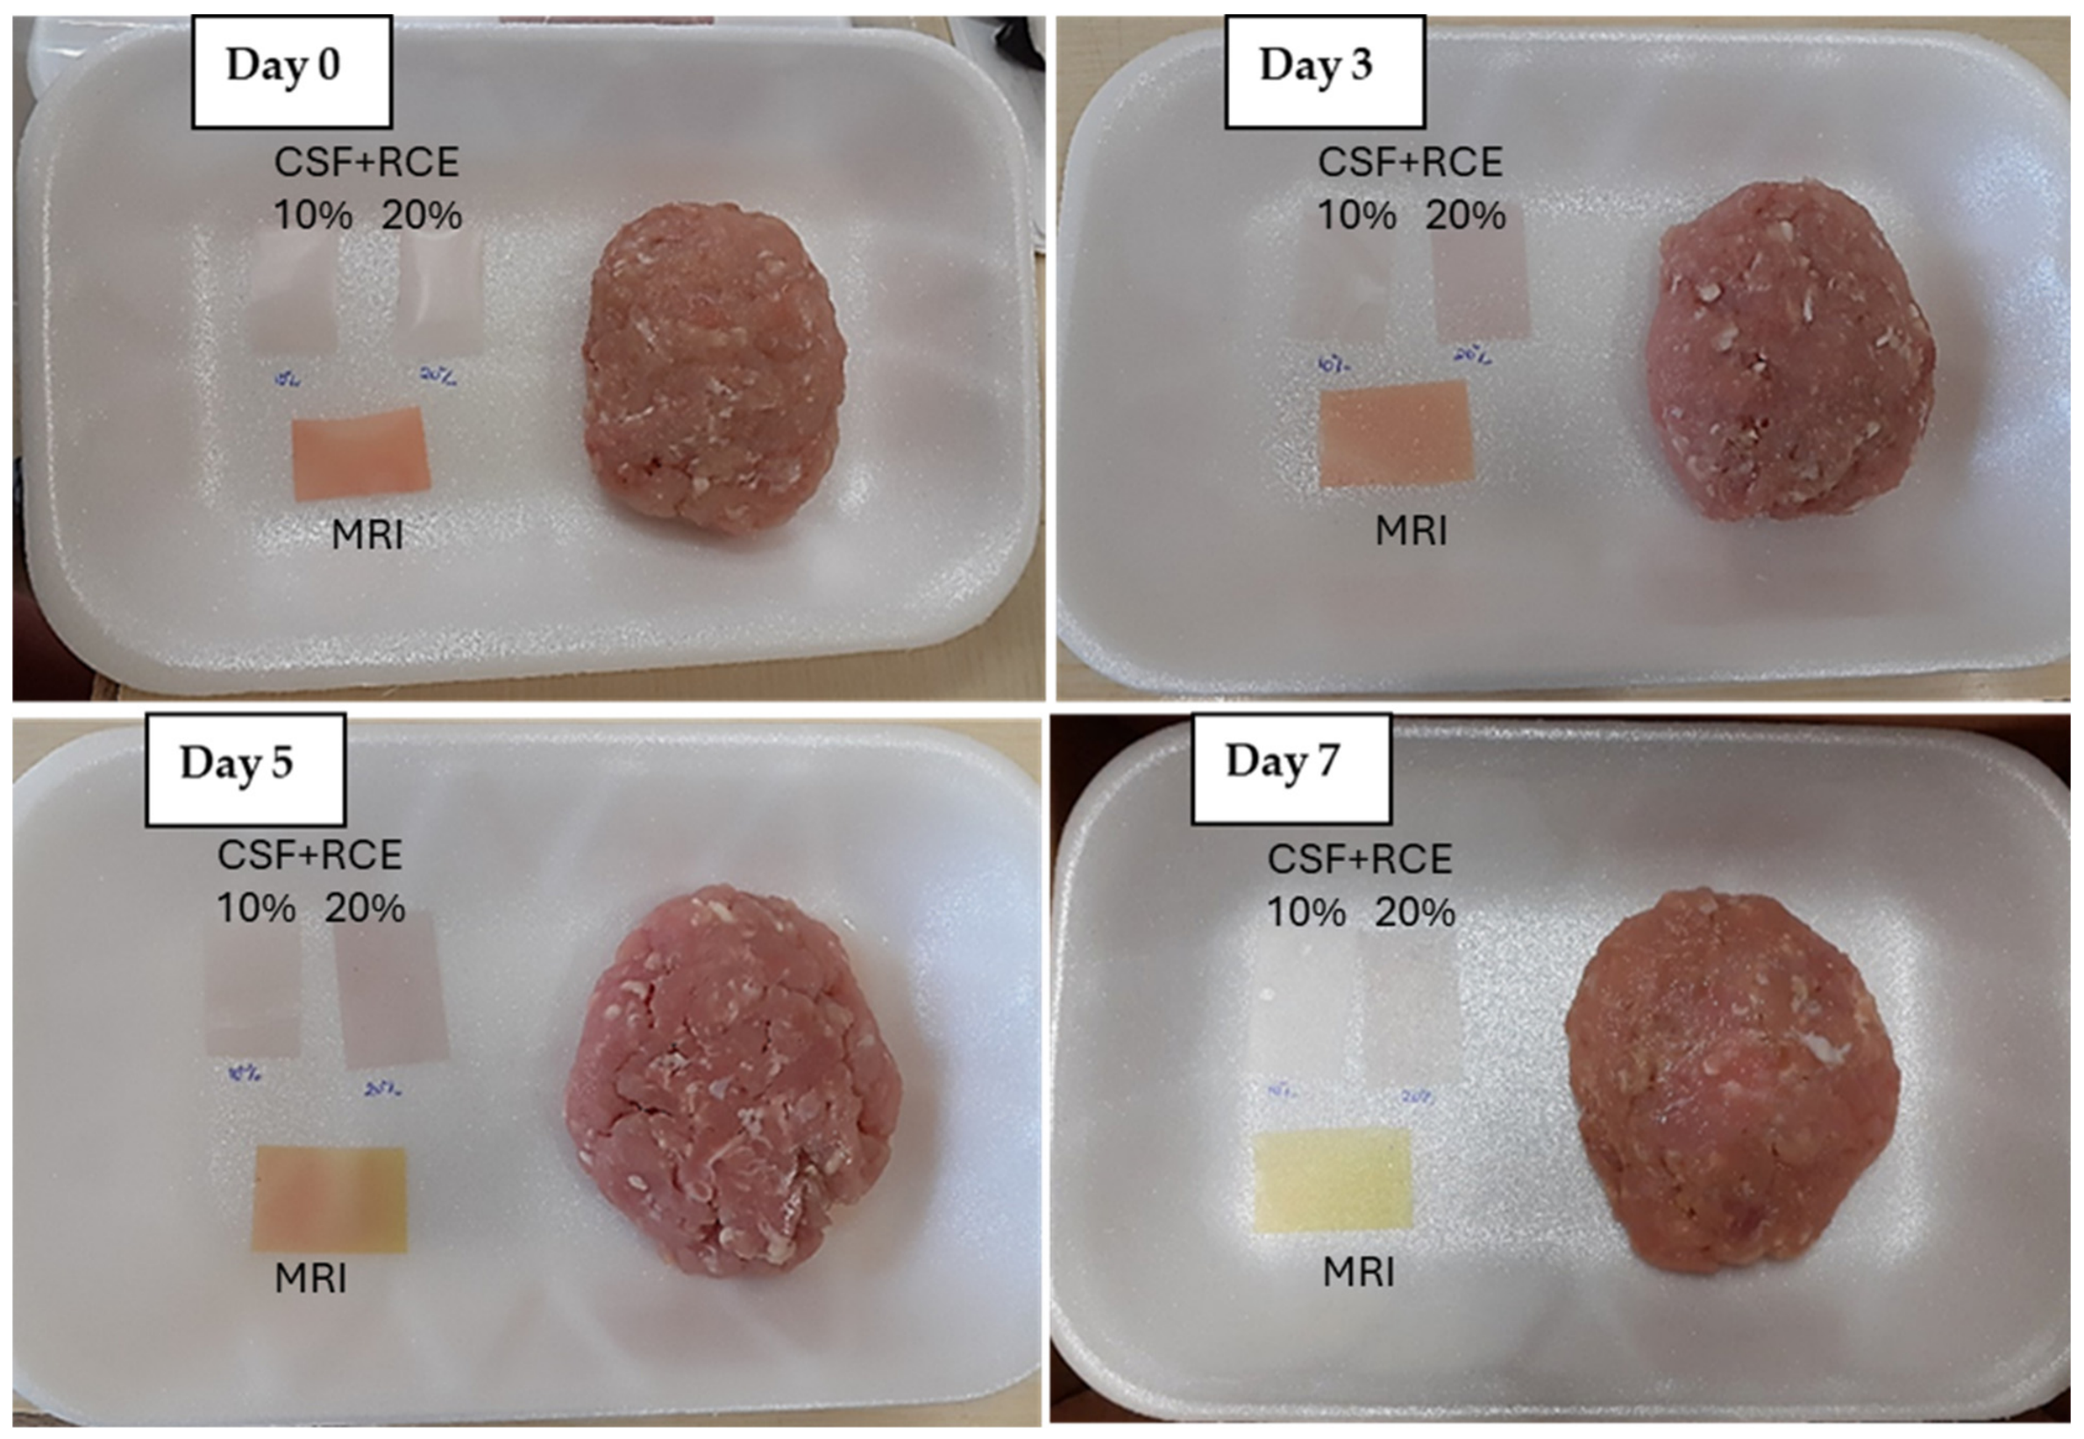
To better understand the color response of the indicators, it is important to note that the observed color transitions are directly due to pH increases associated with the accumulation of volatile basic nitrogen compounds and other VOCs in the headspace associated with spoilage. Although this relationship is mechanistically consistent, it was evaluated qualitatively in the present study due to the absence of instrumental colorimetry. Figure 6 shows the color changes of films during the storage of minced chicken. The films’ color changes provide a primary estimation of the beginning of the samples’ deterioration. Such early visual cues are particularly valuable from a sustainability perspective, as they can help prevent unnecessary food disposal by offering a more accurate assessment of freshness compared with fixed-date labeling.
As shown in Figure 6, on day 0 and day 3, no color change was observed in any film. On the 5th day, only CSF + 5%MRI showed an obvious change, with its color showing a yellow tinge. On the 7th day of storage, a color change was observed in all three film types. The CSF + 10%RCE films became discolored, while CSF + 20%RCE showed a pale blue tinge, and CSF + 5%MRI changed entirely to yellow. Therefore, on the 7th day, the packaged sample was completely deteriorated, the pH approaching 7 according to the color of the CSF + RCE specimens, while the initial spoilage occurred between the 5th and 7th days of storage, probably on the 6th day.

3.3.1. Microbiological Analyses

To verify whether the color change of films is reliable and whether it can be used as an indicator in smart packaging, without misleading the consumer with false indications, the following microbiological and physicochemical analyses were carried out.
The main microorganisms that cause meat spoilage are the following: Pseudomonas spp., Br. thermosphacta, Enterobacteriaceae, LAB, yeasts, and molds. In Table 2, the population of the microorganisms studied in minced chicken meat samples is given.
According to Regulation (EC) No. 2073/2005 [44] on microbiological criteria for foodstuffs, the acceptable limits for enumerated colonies of TVC in minced meat samples are 5.70–6.70 log cfu/g, while the maximum acceptable limit is 7.00 log cfu/g. The initial total viable counts (TVCs) increased from 5.59 ± 0.01 log cfu/g on day 0 to levels exceeding 7 log CFU/g by days 5–7, indicating the onset of spoilage according to commonly accepted limits for minced poultry. According to Balamatsia et al. [45] and Chouliara et al. [46], the initial population in TVCs was 4.9 log cfu/g and 4.28 ± 0.35 log cfu/g, respectively. The relatively high initial microbial load recorded in the present study is consistent with minced poultry products, which typically exhibit rapid microbial proliferation due to increased surface area, oxygen exposure, and mechanical disruption during grinding.
Enterobacteriaceae are a family of aerobic or facultative anaerobic Gram-negative bacteria. They can grow easily in aerobic environments and are used as a hygiene indicator of the production process of various meat products. According to the recommendations of the International Commission on Microbiological Specifications for Foods (ICMSF) [47], a general rule of thumb for food is that when the Enterobacteriaceae population exceeds 4 log cfu/g, it is undoubtedly unacceptable. On day 0, the population of Enterobacteriaceae was recorded as equal to 2.02 ± 0.09 log cfu/g, indicating the good quality of fresh meat. Other researchers reported initial populations equal to 2.27 log cfu/g [34], 2.3 log cfu/g [46], and 2.23 log cfu/g [48], similar to those of the present study. During storage, the Enterobacteriaceae population also increased and, on the 7th day (3.81 ± 0.03 log cfu/g), approached the upper limit acceptable according to the ICMSF.
Br. thermosphacta is a Gram-positive, facultative anaerobic bacterium identified as the main spoilage microorganism in meat and fish products packaged in modified atmosphere (MAP), due to its resistance to low pH, low temperature, and high salt content. Under aerobic storage conditions, metabolic products, which give an unpleasant odor to the meat, are produced. The initial population of Br. thermosphacta in minced chicken was 5.13 ± 0.06 log cfu/g. Literature data showed that the initial colonies of Br. thermosphacta in minced chicken samples were 2.55 log cfu/g [45], 2.8 log cfu/g [49], and 1.47 log cfu/g [34], much lower than those of the present study. This discrepancy is probably due to preservation of the product under high oxygen concentration or under bad MAP conditions. Between the 3rd and 5th day, there was no statistically significant increase (p > 0.05) in counted colonies, while on the 7th day, the population of microorganisms reached the maximum value of 6.87 ± 0.02 log cfu/g.
Pseudomonads are a group of cold-tolerant, Gram-negative, aerobic microorganisms that attack foods with a high water content, such as red meat, poultry, fish, and dairy products. In the present study, the initial population of Pseudomonads in minced chicken was found to be equal to 3.86 ± 0.07 log cfu/g and recorded an increasing trend with a significant statistical difference (p < 0.05) during sample storage but did not exceed the upper limit of 7 log cfu/g until the 7th day. In accordance with the present study, Chouliara et al. [46] reported that on day 0, the Pseudomonas population was equal to 3.38 ± 0.18 log cfu/g, and on the 6th day, 6.28 ± 0.50 log cfu/g, while Balamatsia et al. [45] recorded an initial population of 4.2 log cfu/g, whereas on the 7th day, the limit of 7 log cfu/g was marginally exceeded.
Although Pseudomonas spp. are generally superior competitors under aerobic conditions, B. thermosphacta can proliferate rapidly in protein-rich substrates and may dominate early stages of spoilage depending on slaughter hygiene, processing conditions, and storage temperature. The presumptive identification was based on selective media and colony morphology, consistent with ICMSF guidelines.
LAB, a group of facultative anaerobic microorganisms, are classified as important meat spoilage microorganisms that can grow under aerobic packaging, vacuum, and/or MAP conditions, giving acidic flavors, buttery odors, and altered texture [50]. Between days 0 and 3, there was no statistically significant increase (p > 0.05) in the counted population; the maximum value was 3.38 ± 0.03 log cfu/g and was recorded on day 7. Balamatsia et al. [51] reported that in chicken fillet samples, the colonies of lactic bacteria on day 0 were 2.73 ± 0.28 log cfu/g, while on day 8, they were 3.85 ± 0.61 log cfu/g; the corresponding values recorded by Patsias et al. [49] were 2.7 ± 0.3 log cfu/g (day 0) and 4.3 ± 0.2 log cfu/g (day 8).
Yeasts are aerobic microorganisms, so in the presence of oxygen, they can cause spoilage on the surface of meat and poultry. Following the same pattern with other microorganisms, yeasts show an increasing trend in their population during the days of sample storage, with a maximum value of 5.18 ± 0.06 log cfu/g recorded on the 7th day.
According to microbial analyses and shelf life criteria used, the sample deteriorated between the 5th and 7th days of refrigerated storage, which is confirmed by the color change of the films in the smart packaging. This agreement between microbial thresholds and the response of visual indicators demonstrates the potential of natural starch-based indicators to support more sustainable food systems, enabling real-time freshness monitoring and reducing avoidable food waste.

3.3.2. Physicochemical Analyses (pH, TVB-N) of Minced Chicken Meat

The changes in pH and TVB-N of the samples during storage are shown in Table 2. A meat sample is considered fresh when its pH ranges from 5.7 to 6.1 [49,50]. During the 3rd day, the minced meat was considered fresh, while on the 5th day, there was a marginal increase in pH above the theoretically maximum freshness value of 6.15 ± 0.01. Finally, on the 7th day, the pH value increased significantly to 6.71 ± 0.03, a value characteristic of the deterioration of the sample and its attack by microorganisms. Because the color response of anthocyanins is pH-dependent, the interpretation of changes in pH is directly linked to the color changes described in Section 3.3. Although the absolute change was modest, this trend reflects the metabolic activity of spoilage microorganisms and the accumulation of basic nitrogenous compounds. pH is one of the main factors indicating the growth of microorganisms and spoilage of meat samples, due to the metabolic products generated during bacterial growth. Specifically, in meat, Br. thermosphacta consumes glucose, various amino acids, and nitrogen compounds for its growth and produces acetic acid, lactic acid, isobutyric acid, isovaleric acid, 2-methylbutyric acid, ethanol, diacetyl, acetoin, and 2,3-butanediol as spoilage products, causing a decrease in pH. Furthermore, LAB act in the same way by lowering pH through lactic acid production as a result of their metabolism. In the opposite direction, Enterobacteriaceae and Pseudomonas produce biogenic amines as spoilage products, causing an increase in pH value.
The initial TVB-N value of minced chicken (breast and thigh) was 17.30 ± 2.97 mg N2/100 g (Table 2), while the maximum amount was recorded on the 7th day of storage and was equal to 44.06 ± 2.57 mg N2/100 g. According to the present and other studies [36,44,52], the range of TVB-N in chicken samples varies, maybe due to the type of meat, the conditions of slaughter and distribution, the packaging conditions, etc.
The parallel increase in pH and TVB-N is consistent with proteolysis and deamination reactions carried out by Pseudomonas, B. thermosphacta, and Enterobacteriaceae. These microorganisms degrade amino acids and nucleotides, producing ammonia, trimethylamine, dimethylamine, and other volatile bases that contribute to the TVB-N fraction.

3.3.3. Volatile Compound Analysis of Minced Chicken Meat

Volatile compounds (VOCs) are metabolic products of microorganisms produced during storage. The main groups of VOCs detected in the minced chicken samples are alcohols, aldehydes, ketones, and esters (Table 3).
The volatile profile of minced chicken evolved markedly during storage. On day 0, the dominant compounds were alcohols and aldehydes, associated with lipid oxidation and fresh meat aroma. As storage progressed, increases were observed in compounds such as hexanal, 1-octen-3-ol, and other secondary lipid oxidation products. These changes reflect both microbial metabolism and oxidative degradation of unsaturated fatty acids. The presence of 1-octen-3-ol is characteristic of fungal and bacterial activity and is commonly associated with spoilage odors.
Microorganisms such as Pseudomonas spp., Carnobacterium spp., Br. thermosphacta, and Enterobacteriaceae are responsible for the production of ketones and aldehydes in meat. The ketones detected in the chicken mince samples were acetone, butanone, acetoin (3-hydroxy-2-butanone), 2,3-butanedione, and 2-pentanone. Acetoin is produced during the catabolism of glucose by Carnobacterium spp., Lactobacillus, and Br. thermosphacta under aerobic conditions and by the microbial degradation of aspartic acid. Acetoin is characterized as the ketone most frequently produced in meat during storage due to microbial spoilage, and with 2,3-butanedione, it is the main compound involved in the development of a buttery odor in spoiled meat [52].
In principle, long-chain aldehydes with high unsaturation give a fatty taste to spoiled meat, while short-chain aldehydes are characterized by their more intense and acidic odors. Only two aldehydes, 2-methylbutanal and 3-methylbutanal, were detected in the chicken mince samples. Both compounds were identified from the 3rd day onwards. The change in their concentrations is consistent with the unpleasant odor that meat acquires during aerobic storage, where the apple flavor (3-methylbutanal) fades and the undesirable rancid odor (2-methylbutanal) prevails.
Esters are produced through the esterification of various alcohols and carboxylic acids present in meat, under the action of the esterase enzyme. Generally, esters impart pleasant, sweet, and fruity odors to the substrates in which they are contained. However, in the presence of various microorganisms, such as pseudomonads and in particular P. fragi, these odors can be altered and converted into undesirable, intense fruity odors (e.g., spoiled fruit) in meat [53,54]. Ethyl acetate, methyl butanoate, and ethyl butanoate were detected in samples. According to the literature, microorganisms such as P. fragi, Pseudomonas spp., Sh. putrefaciens, and Moraxella contribute to the production of ethyl acetate in the presence of oxygen; P. fragi to that of methyl butyrate; and P. fragi, Pseudomonas spp., Br. thermosphacta, and Carnobacterium spp. to that of ethyl butyrate [55,56].
It should be noted that the specific concentrations of ammonia and low-molecular-weight amines in the headspace were not quantified in this study, as they are poorly retained by CAR/PDMS fibers and may not be efficiently extracted under the selected HS-SPME conditions. Therefore, the response threshold (LOD/LOQ) of the indicator films for these compounds could not be determined.

4. Conclusions

This study evaluated corn starch films incorporating red cabbage extract as natural non-contact freshness indicators for ground chicken stored under aerobic refrigeration. The films exhibited visible color changes that generally followed the pH changes associated with spoilage, while microbiological, TVB-N, and volatile analyses confirmed the progression of spoilage between days 5 and 7. This correspondence demonstrates the potential of anthocyanin-based films to support real-time freshness monitoring.
CSF + 20%RCE membranes showed the strongest color response within the pH range of deterioration (6.2–6.8), while CSF + 10%RCE membranes showed weaker but detectable changes. The synthetic indicator (CSF + 5%MRI) showed a more pronounced transition and served as a methodological control for volatile amine accumulation. Due to their high moisture content and solubility, RCE-based films were deemed unsuitable for direct food contact applications but suitable for use as non-contact indicators.
Despite the encouraging results, it is important to consider some limitations of the present study. Quantitative colorimetry (i.e., CIELab) was not possible during the experimental period, resulting in color changes being assessed exclusively by visual observation. Furthermore, structural characterization of films (FTIR, SEM and XRD) or kinetic release studies were not performed, which limited the possibility of an in-depth mechanistic interpretation of the results. At the same time, the detection of ammonia and low-molecular-weight amines in the headspace was affected by the limitations of the CAR/PDMS fiber used in the HS-SPME technique; therefore, the detection threshold (LOD/LOQ) of the films was not established. Although these factors do not question the viability of the proposed approach, they highlight points that can be improved in the future at a methodological level.
In future research, it would be appropriate to include the use of instrumental colorimetry, more extensive structural analyses, kinetic release studies, and controlled exposure experiments to define sensitivity ranges for specific spoilage volatiles, as well as consumer acceptance and recognition tests, in order to further confirm the effectiveness and practical applicability of natural anthocyanin-based indicators. Overall, the results of this work strengthen the prospect of utilizing plant-derived starch-based markers as viable solutions for smart food packaging applications, contributing to improvement in product freshness monitoring and reduction in food waste.

Author Contributions

Conceptualization, A.V.B.; methodology, Z.I.K.; software, Z.I.K.; validation, Z.I.K. and I.S.K.; formal analysis, Z.I.K.; investigation, Z.I.K., A.V.B. and I.S.K.; data curation, Z.I.K. and I.S.K.; writing—original draft preparation, I.S.K. and Z.I.K.; writing—review and editing, I.S.K. and A.V.B.; supervision, A.V.B. and I.S.K.; project administration, A.V.B. All authors have read and agreed to the published version of the manuscript.

Funding

This research study received no external funding.

Institutional Review Board Statement

Not applicable.

Informed Consent Statement

Not applicable.

Data Availability Statement

The data presented in this study is available upon request from the corresponding author.

Conflicts of Interest

The authors declare no conflicts of interest.

References

  1. Müller, P.; Schmid, M. Intelligent Packaging in the Food Sector: A Brief Overview. Foods 2019, 8, 16. [Google Scholar] [CrossRef] [Scilit] [PubMed]
  2. Ghaani, M.; Cozzolino, C.A.; Castelli, G.; Farris, S. An Overview of the Intelligent Packaging Technologies in the Food Sector. Trends Food Sci. Technol. 2016, 51, 1–11. [Google Scholar] [CrossRef] [Scilit]
  3. Vilela, C.; Kurek, M.; Hayouka, Z.; Röcker, B.; Yildirim, S.; Antunes, M.D.C.; Nilsen-Nygaard, J.; Pettersen, M.K.; Freire, C.S.R. A Concise Guide to Active Agents for Active Food Packaging. Trends Food Sci. Technol. 2018, 80, 212–222. [Google Scholar] [CrossRef] [Scilit]
  4. Kalpana, S.; Priyadarshini, S.R.; Maria Leena, M.; Moses, J.A.; Anandharamakrishnan, C. Intelligent Packaging: Trends and Applications in Food Systems. Trends Food Sci. Technol. 2019, 93, 145–157. [Google Scholar] [CrossRef] [Scilit]
  5. European Parliament and of the Council. Regulation (EC) No 1935/2004 of the European Parliament and of the Council of 27 October 2004 on Materials and Articles Intended to Come into Contact with Food and Repealing Directives 80/590/EEC and 89/109/EEC; European Parliament and of the Council: Brussels, Belgium, 2004; Volume 338. [Google Scholar]
  6. European Commission. Commission Regulation (EC) No 2023/2006 of 22 December 2006 on Good Manufacturing Practice for Materials and Articles Intended to Come into Contact with Food (Text with EEA Relevance); European Commission: Brussels, Belgium, 2006; Volume 384. [Google Scholar]
  7. European Commission. Commission Regulation (EU) No 10/2011 of 14 January 2011 on Plastic Materials and Articles Intended to Come into Contact with Food Text with EEA Relevance; European Commission: Brussels, Belgium, 2011; Volume 012. [Google Scholar]
  8. European Commission. Commission Regulation (EC) No 450/2009 of 29 May 2009 on Active and Intelligent Materials and Articles Intended to Come into Contact with Food (Text with EEA Relevance); European Commission: Brussels, Belgium, 2009; Volume 135. [Google Scholar]
  9. Wu, D.; Zhang, M.; Chen, H.; Bhandari, B. Freshness Monitoring Technology of Fish Products in Intelligent Packaging. Crit. Rev. Food Sci. Nutr. 2021, 61, 1279–1292. [Google Scholar] [CrossRef] [Scilit] [PubMed]
  10. Ghareaghajlou, N.; Hallaj-Nezhadi, S.; Ghasempour, Z. Red Cabbage Anthocyanins: Stability, Extraction, Biological Activities and Applications in Food Systems. Food Chem. 2021, 365, 130482. [Google Scholar] [CrossRef] [Scilit] [PubMed]
  11. Ma, Q.; Lu, X.; Wang, W.; Hubbe, M.A.; Liu, Y.; Mu, J.; Wang, J.; Sun, J.; Rojas, O.J. Recent Developments in Colorimetric and Optical Indicators Stimulated by Volatile Base Nitrogen to Monitor Seafood Freshness. Food Packag. Shelf Life 2021, 28, 100634. [Google Scholar] [CrossRef] [Scilit]
  12. Dehghani, S.; Hosseini, S.V.; Regenstein, J.M. Edible Films and Coatings in Seafood Preservation: A Review. Food Chem. 2018, 240, 505–513. [Google Scholar] [CrossRef] [Scilit] [PubMed]
  13. Mohamed, S.A.A.; El-Sakhawy, M.; El-Sakhawy, M.A.-M. Polysaccharides, Protein and Lipid -Based Natural Edible Films in Food Packaging: A Review. Carbohydr. Polym. 2020, 238, 116178. [Google Scholar] [CrossRef] [Scilit] [PubMed]
  14. Umaraw, P.; Verma, A.K. Comprehensive Review on Application of Edible Film on Meat and Meat Products: An Eco-Friendly Approach. Crit. Rev. Food Sci. Nutr. 2017, 57, 1270–1279. [Google Scholar] [CrossRef] [Scilit] [PubMed]
  15. Hammam, A.R.A. Technological, Applications, and Characteristics of Edible Films and Coatings: A Review. SN Appl. Sci. 2019, 1, 632. [Google Scholar] [CrossRef] [Scilit]
  16. Kumar, L.; Ramakanth, D.; Akhila, K.; Gaikwad, K.K. Edible Films and Coatings for Food Packaging Applications: A Review. Environ. Chem. Lett. 2022, 20, 875–900. [Google Scholar] [CrossRef] [Scilit]
  17. Matloob, A.; Ayub, H.; Mohsin, M.; Ambreen, S.; Khan, F.A.; Oranab, S.; Rahim, M.A.; Khalid, W.; Nayik, G.A.; Ramniwas, S.; et al. A Review on Edible Coatings and Films: Advances, Composition, Production Methods, and Safety Concerns. ACS Omega 2023, 8, 28932–28944. [Google Scholar] [CrossRef] [Scilit] [PubMed]
  18. Schumann, B.; Schmid, M. Packaging Concepts for Fresh and Processed Meat—Recent Progresses. Innov. Food Sci. Emerg. Technol. 2018, 47, 88–100. [Google Scholar] [CrossRef] [Scilit]
  19. Panou, A.; Karabagias, I.K. Biodegradable Packaging Materials for Foods Preservation: Sources, Advantages, Limitations, and Future Perspectives. Coatings 2023, 13, 1176. [Google Scholar] [CrossRef] [Scilit]
  20. Wang, B.; Yu, B.; Yuan, C.; Guo, L.; Liu, P.; Gao, W.; Li, D.; Cui, B.; Abd El-Aty, A.M. An Overview on Plasticized Biodegradable Corn Starch-Based Films: The Physicochemical Properties and Gelatinization Process. Crit. Rev. Food Sci. Nutr. 2022, 62, 2569–2579. [Google Scholar] [CrossRef] [Scilit] [PubMed]
  21. Ojogbo, E.; Ogunsona, E.O.; Mekonnen, T.H. Chemical and Physical Modifications of Starch for Renewable Polymeric Materials. Mater. Today Sustain. 2020, 7–8, 100028. [Google Scholar] [CrossRef] [Scilit]
  22. Bekhit, A.E.-D.A.; Holman, B.W.B.; Giteru, S.G.; Hopkins, D.L. Total Volatile Basic Nitrogen (TVB-N) and Its Role in Meat Spoilage: A Review. Trends Food Sci. Technol. 2021, 109, 280–302. [Google Scholar] [CrossRef] [Scilit]
  23. Papuc, C.; Goran, G.V.; Predescu, C.N.; Nicorescu, V. Mechanisms of Oxidative Processes in Meat and Toxicity Induced by Postprandial Degradation Products: A Review. Compr. Rev. Food Sci. Food Saf. 2017, 16, 96–123. [Google Scholar] [CrossRef] [Scilit] [PubMed]
  24. Lund, M.N.; Heinonen, M.; Baron, C.P.; Estévez, M. Protein Oxidation in Muscle Foods: A Review. Mol. Nutr. Food Res. 2011, 55, 83–95. [Google Scholar] [CrossRef] [Scilit] [PubMed]
  25. Paczkowski, S.; Schütz, S. Post-Mortem Volatiles of Vertebrate Tissue. Appl. Microbiol. Biotechnol. 2011, 91, 917–935. [Google Scholar] [CrossRef] [Scilit] [PubMed]
  26. Prietto, L.; Mirapalhete, T.C.; Pinto, V.Z.; Hoffmann, J.F.; Vanier, N.L.; Lim, L.-T.; Guerra Dias, A.R.; da Rosa Zavareze, E. pH-Sensitive Films Containing Anthocyanins Extracted from Black Bean Seed Coat and Red Cabbage. LWT 2017, 80, 492–500. [Google Scholar] [CrossRef] [Scilit]
  27. European Commission. Commission Regulation (EC) No 1565/2000 of 18 July 2000 Laying down the Measures Necessary for the Adoption of an Evaluation Programme in Application of Regulation (EC) No 2232/96 of the European Parliament and of the Council (Text with EEA Relevance); European Commission: Brussels, Belgium, 2000; Volume 180. [Google Scholar]
  28. Demirdöven, A.; Özdoğan, K.; Erdoğan-Tokatlı, K. Extraction of Anthocyanins from Red Cabbage by Ultrasonic and Conventional Methods: Optimization and Evaluation. J. Food Biochem. 2015, 39, 491–500. [Google Scholar] [CrossRef] [Scilit]
  29. Ademoyegun, O.T.; Akin-Idowu, P.E.; Ibitoye, D.O.; Adewuyi, G.O. Phenolic Contents and Free Radical Scavenging Activity in Some Leafy Vegetables. Int. J. Veg. Sci. 2013, 19, 126–137. [Google Scholar] [CrossRef] [Scilit]
  30. do Nascimento Alves, R.; Lorranne Santos Lima, T.; da Silva Chaves, K.; de Albuquerque Meireles, B.R.L. Biodegradable Films with Brassica Oleracea Capitata Extract as a Quality Indicator in Sheep Meat. J. Food Process. Preserv. 2021, 45, e14997. [Google Scholar] [CrossRef] [Scilit]
  31. Zhang, Z.; Tang, H.; Cai, K.; Liang, R.; Tong, L.; Ou, C. A Novel Indicator Based on Polyacrylamide Hydrogel and Bromocresol Green for Monitoring the Total Volatile Basic Nitrogen of Fish. Foods 2023, 12, 3964. [Google Scholar] [CrossRef] [Scilit] [PubMed]
  32. Wang, C.; Lu, Y.; Li, Z.; An, X.; Gao, Z.; Tian, S. Preparation and Performance Characterization of a Composite Film Based on Corn Starch, κ-Carrageenan, and Ethanol Extract of Onion Skin. Polymers 2022, 14, 2986. [Google Scholar] [CrossRef] [Scilit] [PubMed]
  33. ICMSF; Christian, J.H.B.; Roberts, T.A. Microorganisms in Foods 2. Sampling for Microbiological Analysis: Principles and Specific Applications, 2nd ed.; Blackwell Scientific Publications: Oxford, UK; University of Toronto Press: Toronto, ON, Canada, 1986; ISBN 978-0-632-01567-2. [Google Scholar]
  34. Assanti, E.; Karabagias, V.K.; Karabagias, I.K.; Badeka, A.; Kontominas, M.G. Shelf Life Evaluation of Fresh Chicken Burgers Based on the Combination of Chitosan Dip and Vacuum Packaging under Refrigerated Storage. J. Food Sci. Technol. 2021, 58, 870–883. [Google Scholar] [CrossRef] [Scilit] [PubMed]
  35. Sun, Y.; Fu, M.; Li, Z.; Peng, X. Evaluation of Freshness in Determination of Volatile Organic Compounds Released from Pork by HS-SPME-GC-MS. Food Anal. Methods 2018, 11, 1321–1329. [Google Scholar] [CrossRef] [Scilit]
  36. IBM Corp. IBM SPSS Statistics for Windows, Version 25.0; IBM Corp.: Armonk, NY, USA, 2017. [Google Scholar]
  37. Leja, M.; Kamińska, I.; Kołton, A. Phenolic Compounds as the Major Antioxidants in Red Cabbage. Folia Hortic. 2010, 22, 19–24. [Google Scholar] [CrossRef] [Scilit]
  38. Chun, O.K.; Smith, N.; Sakagawa, A.; Lee, C.Y. Antioxidant Properties of Raw and Processed Cabbages. Int. J. Food Sci. Nutr. 2004, 55, 191–199. [Google Scholar] [CrossRef] [Scilit] [PubMed]
  39. Abedi-Firoozjah, R.; Yousefi, S.; Heydari, M.; Seyedfatehi, F.; Jafarzadeh, S.; Mohammadi, R.; Rouhi, M.; Garavand, F. Application of Red Cabbage Anthocyanins as pH-Sensitive Pigments in Smart Food Packaging and Sensors. Polymers 2022, 14, 1629. [Google Scholar] [CrossRef] [Scilit] [PubMed]
  40. Ghasemlou, M.; Aliheidari, N.; Fahmi, R.; Shojaee-Aliabadi, S.; Keshavarz, B.; Cran, M.J.; Khaksar, R. Physical, Mechanical and Barrier Properties of Corn Starch Films Incorporated with Plant Essential Oils. Carbohydr. Polym. 2013, 98, 1117–1126. [Google Scholar] [CrossRef] [Scilit] [PubMed]
  41. Cheng, M.; Yan, X.; Cui, Y.; Han, M.; Wang, Y.; Wang, J.; Zhang, R.; Wang, X. Characterization and Release Kinetics Study of Active Packaging Films Based on Modified Starch and Red Cabbage Anthocyanin Extract. Polymers 2022, 14, 1214. [Google Scholar] [CrossRef] [Scilit] [PubMed]
  42. Musso, Y.S.; Salgado, P.R.; Mauri, A.N. Smart Gelatin Films Prepared Using Red Cabbage (Brassica Oleracea L.) Extracts as Solvent. Food Hydrocoll. 2019, 89, 674–681. [Google Scholar] [CrossRef] [Scilit]
  43. Ribeiro Sanches, M.A.; Camelo-Silva, C.; da Silva Carvalho, C.; Rafael de Mello, J.; Barroso, N.G.; Lopes da Silva Barros, E.; Silva, P.P.; Pertuzatti, P.B. Active Packaging with Starch, Red Cabbage Extract and Sweet Whey: Characterization and Application in Meat. LWT 2021, 135, 110275. [Google Scholar] [CrossRef] [Scilit]
  44. European Commission. Commission Regulation (EC) No 2073/2005 of 15 November 2005 on Microbiological Criteria for Foodstuffs (Text with EEA Relevance); European Commission: Brussels, Belgium, 2005; Volume 338. [Google Scholar]
  45. Balamatsia, C.C.; Patsias, A.; Kontominas, M.G.; Savvaidis, I.N. Possible Role of Volatile Amines as Quality-Indicating Metabolites in Modified Atmosphere-Packaged Chicken Fillets: Correlation with Microbiological and Sensory Attributes. Food Chem. 2007, 104, 1622–1628. [Google Scholar] [CrossRef] [Scilit]
  46. Chouliara, E.; Karatapanis, A.; Savvaidis, I.N.; Kontominas, M.G. Combined Effect of Oregano Essential Oil and Modified Atmosphere Packaging on Shelf-Life Extension of Fresh Chicken Breast Meat, Stored at 4 °C. Food Microbiol. 2007, 24, 607–617. [Google Scholar] [CrossRef] [Scilit] [PubMed]
  47. Institute of Medicine (US); National Research Council (US). Committee on the Review of the Use of Scientific Criteria and Performance Standards for Safe Food. In Scientific Criteria to Ensure Safe Food; National Academies Press (US): Washington, DC, USA, 2003; ISBN 978-0-309-08928-9. [Google Scholar]
  48. Tsafrakidou, P.; Sameli, N.; Bosnea, L.; Chorianopoulos, N.; Samelis, J. Assessment of the Spoilage Microbiota in Minced Free-Range Chicken Meat during Storage at 4 C in Retail Modified Atmosphere Packages. Food Microbiol. 2021, 99, 103822. [Google Scholar] [CrossRef] [Scilit] [PubMed]
  49. Patsias, A.; Chouliara, I.; Badeka, A.; Savvaidis, I.N.; Kontominas, M.G. Shelf-Life of a Chilled Precooked Chicken Product Stored in Air and under Modified Atmospheres: Microbiological, Chemical, Sensory Attributes. Food Microbiol. 2006, 23, 423–429. [Google Scholar] [CrossRef] [Scilit] [PubMed]
  50. Iulietto, M.F.; Sechi, P.; Borgogni, E.; Cenci-Goga, B.T. Meat Spoilage: A Critical Review of a Neglected Alteration Due to Ropy Slime Producing Bacteria. Ital. J. Anim. Sci. 2015, 14, 4011. [Google Scholar] [CrossRef] [Scilit]
  51. Balamatsia, C.C.; Rogga, K.; Badeka, A.; Kontominas, M.G.; Savvaidis, I.N. Effect of Low-Dose Radiation on Microbiological, Chemical, and Sensory Characteristics of Chicken Meat Stored Aerobically at 4 °C. J. Food Prot. 2006, 69, 1126–1133. [Google Scholar] [CrossRef] [Scilit] [PubMed]
  52. Beauclercq, S.; Mignon-Grasteau, S.; Petit, A.; Berger, Q.; Lefèvre, A.; Métayer-Coustard, S.; Tesseraud, S.; Emond, P.; Berri, C.; Le Bihan-Duval, E. A Divergent Selection on Breast Meat Ultimate pH, a Key Factor for Chicken Meat Quality, Is Associated With Different Circulating Lipid Profiles. Front. Physiol. 2022, 13, 935868. [Google Scholar] [CrossRef] [Scilit] [PubMed]
  53. Hertanto, B.S.; Nurmalasari, C.D.A.; Nuhriawangsa, A.M.P.; Cahyadi, M.; Kartikasari, L.R. The Physical and Microbiological Quality of Chicken Meat in the Different Type of Enterprise Poultry Slaughterhouse: A Case Study in Karanganyar District. IOP Conf. Ser. Earth Environ. Sci. 2018, 102, 012051. [Google Scholar] [CrossRef] [Scilit]
  54. Silva, C.M.G.; Glória, M.B.A. Bioactive Amines in Chicken Breast and Thigh after Slaughter and during Storage at 4±1 °C and in Chicken-Based Meat Products. Food Chem. 2002, 78, 241–248. [Google Scholar] [CrossRef] [Scilit]
  55. Casaburi, A.; Piombino, P.; Nychas, G.-J.; Villani, F.; Ercolini, D. Bacterial Populations and the Volatilome Associated to Meat Spoilage. Food Microbiol. 2015, 45, 83–102. [Google Scholar] [CrossRef] [Scilit] [PubMed]
  56. Bleicher, J.; Ebner, E.E.; Bak, K.H. Formation and Analysis of Volatile and Odor Compounds in Meat—A Review. Molecules 2022, 27, 6703. [Google Scholar] [CrossRef] [Scilit] [PubMed]
Figure 1. Storage of minced chicken meat samples.
Sustainability 18 06928 g001
Figure 2. Color changes of anthocyanins of RCE at different pH values.
Sustainability 18 06928 g002
Figure 3. Circular films of: (a) corn starch (CSF); (b) corn starch with incorporated red cabbage extract at 10% (CSF + 10%RCE); (c) corn starch with integrated red cabbage extract at 20% (CSF + 20%RCE); (d) corn starch with methyl red indicator incorporated at 5% (CSF + 5%MRI).
Sustainability 18 06928 g003
Figure 4. Color variations of (a) CSF + 10%RCE and (b) CSF + 20%RCE at different pH values.
Sustainability 18 06928 g004
Figure 5. Color change of CSF + 5%MRI at different pH values.
Sustainability 18 06928 g005
Figure 6. Color changes of film indicators across storage days.
Sustainability 18 06928 g006
Table 1. Mechanical properties and other physicochemical parameters of films.
Treatment
ParameterCSFCSF + 10%RCECSF + 20%RCECSF + 5%MRI
Thickness (μm)81.37 ± 9.10 A105.12 ± 7.36 B114.00 ± 17.41 B101.37 ± 13.02 B
Load at Break (N)8.9 ± 2.5 A8.2 ± 1.6 A9.7 ± 1.1 A14.5 ± 2.1 B
% Elongation at Break37.21 ± 7.66 B70.25 ± 7.12 C78.06 ± 5.48 C26.52 ± 5.06 A
Tensile Strength at Break (MPa)7.32 ± 2.06 B5.21 ± 0.10 A5.68 ± 0.66 A, B9.55 ± 1.35 C
Young’s Modulus (MPa)373.45 ± 75.75 B142.66 ± 37.44 A115.87± 16.23 A589.07 ± 92.80 C
Moisture Content (%)10.92 ± 0.52 A, B11.05 ± 1.25 A, B12.58 ± 0.22 B9.64 ± 0.30 A
Water Solubility (%)19.52 ± 1.51 A, B21.59 ± 1.03 B26.37 ± 1.18 C17.33 ± 0.65 A
Antioxidant Activity (%)5.21 ± 0.37 B8.08 ± 0.24 C8.39 ± 1.21 C0.10 ± 0.01 A
Total Phenolic Content (mg Gallic Acid/g film)3.68 ± 0.31 A4.36 ± 0.58 A, B5.66 ± 0.49 B, C5.83 ± 0.58 C
Values (mean ± SD) with different superscript letters in the same row indicate statistically significant differences (p < 0.05, Tukey’s test).
Table 2. Population counts of developed microorganisms (log cfu/g), pH, and TVB-N of minced chicken during storage.
Storage DayTVCsEnterobacteriaceaeBr. thermosphactaPseudomonadsLABYeast–MoldspHTVB-N (mg/100 g)
05.59 ± 0.01 A2.02 ± 0.09 A5.13 ± 0.06 A3.86 ± 0.07 A2.57 ± 0.06 A3.34 ± 0.12 A5.89 ± 0.02 A17.30 ± 2.97 A
36.82 ± 0.01 B3.10 ± 0.04 B6.19 ± 0.12 B5.05 ± 0.04 B2.64 ± 0.02 A3.87 ± 0.03 B5.97 ± 0.01 B23.20 ± 1.98 B
56.87 ± 0.03 B3.24 ± 0.07 B6.20 ± 0.01 B5.61 ± 0.01 C3.04 ± 0.01 B4.43 ± 0.05 C6.15 ± 0.01 C35.50 ± 2.97 C
77.82 ± 0.05 C3.81 ± 0.03 C6.87 ± 0.02 C6.65 ± 0.05 D3.38 ± 0.03 C5.18 ± 0.06 D6.71 ± 0.03 D44.06 ± 2.57 D
Values (mean ± SD) with different superscript letters in the same column indicate statistically significant differences (p < 0.05, Tukey’s test).
Table 3. Semi-quantitative determination of VOCs (μg/kg) in chicken mince samples during storage.
Storage Day
VOCsRilit *Riexp **0357
ethanol48249572.22 ± 16.7 A240.97 ± 41.12 B279.80 ± 2.47 B57.47 ± 10.25 A
1-propanol554550-12.26 ± 2.99 B11.83 ± 0.89 B-
2-methyl-1-propanol609619-6.22 ± 0.28 A45.08 ± 8.76 B72.43 ± 5.67 C
3-methyl-1-butanol727730-123.01 ± 4.45 B294.41 ± 5.76 C402.08 ± 9.11 D
2-methyl-1-butanol732745-29.03 ± 2.85 B120.70 ± 0.83 C137.83 ± 1.53 D
butanone58359937.13 ± 5.21 A32.86 ± 6.88 A55.76 ± 8.27 A200.57 ± 11.09 B
3-hydroxy-2-butanone709712-110.47 ± 27.15 B209.86 ± 15.95 C91.30 ± 10.51 B
acetone503510--70.97 ± 6.18 B84.15 ± 5.39 B
2,3-butanedione613622--49.84 ± 6.61 B39.58 ± 0.94 B
2-pentanone686677--6.31 ± 0.93 B13.65 ± 0.74 C
3-methylbutanal655650-34.26 ± 3.78 B28.85 ± 0.52 B24.27 ± 6.45 B
2-methylbutanal664672-9.41 ± 0.84 B12.93 ± 0.51 B, C15.63 ± 2.41 C
ethyl acetate628647-113.44 ± 21.02 B93.71 ± 6.14 B107.48 ± 4.90 B
methyl butanoate735751-31.97 ± 4.46 B29.31 ± 10.06 B36.46 ± 2.96 B
ethyl butanoate 798802-16.14 ± 1.92 A17.98 ± 9.43 A13.40 ± 3.74 A
A–D Values (mean ± SD) with different superscript letters in the same line indicate statistically significant differences (p < 0.05, Tukey’s test). * Experimental retention indices values based on the calculations using the standard mixture of alkanes. ** Retention indices of the identified compounds according to the literature data cited in the NIST MS library.
Disclaimer/Publisher’s Note: The statements, opinions and data contained in all publications are solely those of the individual author(s) and contributor(s) and not of MDPI and/or the editor(s). MDPI and/or the editor(s) disclaim responsibility for any injury to people or property resulting from any ideas, methods, instructions or products referred to in the content.