Article

Integrating Smart Port System and Blue Economy Principles for the Sustainable Maritime Development of an Island Region in Indonesia: A Bayesian Network Approach

1
Graduate Program in Regional and Rural Planning and Development, Faculty of Economic and Management, IPB University, Kampus IPB Dramaga, Bogor 16680, Indonesia
2
Department of Resource and Environmental Economics, Faculty of Economic and Management, IPB University, Kampus IPB Dramaga, Bogor 16680, Indonesia
3
Graduate Program in Tropical Ocean Economics, Faculty of Economic and Management, IPB University, Kampus IPB Dramaga, Bogor 16680, Indonesia
4
Department of Aquatic Resources Management, Faculty of Fisheries and Marine Sciences, IPB University, Kampus IPB Dramaga, Bogor 16680, Indonesia
5
Department of Fisheries Socio-Economics, Faculty of Fisheries and Marine Science, Universitas Riau, Pekanbaru 28293, Indonesia
*
Author to whom correspondence should be addressed.
Sustainability 2026, 18(13), 6923; https://doi.org/10.3390/su18136923
Submission received: 1 May 2026 / Revised: 15 June 2026 / Accepted: 2 July 2026 / Published: 7 July 2026

Abstract

The global maritime sector is undergoing rapid transformation, creating an urgent need to align digital port technologies with a sustainable development framework. However, existing research on smart ports and the blue economy is fragmented and predominantly driven by deterministic approaches that overlook systemic complexity and uncertainty. This study develops a smart port system model grounded in blue economy principles, using a Bayesian network to analyze causal relationships among operational, environmental, and governance variables under uncertainty. The model incorporates key factors including port operational efficiency, logistics reliability, environmental compliance systems, coastal employment, and regulatory enforcement. The findings indicate that operational and logistical factors are the primary drivers of the system, while environmental and socioeconomic variables strongly shape sustainability outcomes. Scenario analysis shows that coordinated interventions targeting these key variables generate the greatest improvements in Smart Port–Blue Economy integration. Sensitivity analysis further identifies coastal economic output, regional competitiveness, and marine ecosystem health as the most responsive outcome variables. The research offers lessons for policymakers to enhance port management by integrating logistics and technological considerations with blue economy principles to design adaptive and resilient policies, particularly in island regions.

1. Introduction

In recent years, the global maritime sector has developed rapidly, driven by growing demands for operational efficiency, logistics digitalization, and environmental sustainability. Ports, as key nodes in international trade networks, function not only as transit points for goods but also as complex ecosystems integrating digital technologies, artificial intelligence, and data analytics to support real-time decision-making [1,2,3]. Their strategic role in sustaining global supply chain operations and enhancing logistics connectivity and efficiency has become increasingly critical as interactions among maritime supply chain actors grow more complex [4]. Within this context, the smart port concept has emerged as a strategic approach to improving the efficiency, transparency, and competitiveness of global maritime logistics systems [5,6,7]. At the same time, mounting pressure on marine resource sustainability has driven the rise in the blue economy paradigm, which emphasizes the optimal use of marine resources without undermining ecosystem balance and long-term sustainability [8,9]. These pressures underscore the maritime sector’s contribution to emissions and environmental impacts in coastal areas, reinforcing the need for more environmentally friendly and efficient operational practices [10,11,12,13,14,15,16]. Integrating these two approaches is increasingly crucial, particularly for island regions that depend heavily on the maritime sector as a primary engine of economic development while remaining highly vulnerable to environmental pressures and limited connectivity.
The growing literature shows that smart port research has advanced rapidly, especially in operational digitalization, logistics efficiency, and the reduction in environmental impacts. Multiple studies highlight the role of technologies such as the Internet of Things (IoT), big data, and artificial intelligence in significantly improving port performance [2,14,16,17,18,19,20,21,22]. Other works emphasize smart ports’ contributions to energy efficiency and carbon emission reduction as part of sustainable port development [6,21,23,24]. Meanwhile, blue economy research has focused on sustainable coastal and marine resource governance, including social justice, environmental conservation, and inclusive economic growth [9,25,26,27]. Although some studies connect this concept to port systems through green port and sustainable port frameworks, such integration remains partial and does not fully capture the systemic interconnections among technological, environmental, and socioeconomic dimensions [28,29].
Most smart port studies concentrate on optimizing operational efficiency and digital transformation without explicitly embedding blue economy–based sustainability principles into their analytical frameworks [30]. Conversely, blue economy studies tend to be macro-level and normative, offering limited operationalizable models for technology-based port systems [8,9,25]. In addition, port system analyses have predominantly relied on deterministic models such as Artificial Neural Networks (ANNs), Support Vector Machines (SVMs), and deep learning. While these methods deliver strong predictive performance, they constrain the capacity to capture uncertainty, causal relationships, and interactions among variables in complex, dynamic systems [31,32]. As a result, the models produced cannot adequately represent cross-dimensional linkages among operational performance, environmental sustainability, and governance, particularly in island regions with distinctive systemic characteristics.
This research aims to develop a smart port system model for Indonesia’s island regions, grounded in blue economy principles and using a Bayesian Belief Network (BBN) approach. It seeks to: (1) identify key variables across operational, environmental, and governance dimensions of port systems; (2) construct a probabilistic model that captures causal relationships among these variables under uncertainty; and (3) assess the model’s ability to enhance port performance sustainably. In doing so, it bridges the gap between technology-driven smart port transformation and blue economy–oriented sustainability, offering an integrated, systems-based analytical framework.
This framework is particularly relevant for Indonesia, the world’s largest archipelagic state, which relies heavily on its maritime domain for economic survival and social cohesion. Many regions in Indonesia depend on the maritime sector for development, making the integration of Smart Ports and the Blue Economy—sustainable use of ocean resources for economic growth, improved livelihoods, and healthy marine ecosystems—an urgent necessity rather than a policy option [33]. Yet, implementation is complicated by a persistent digital divide and infrastructure gap between advanced regions such as Java and island regions like Sumatra, regulatory fragmentation, and limited human capital capable of operating in a highly digitized and eco-conscious economy, all while avoiding widespread job displacement.
Nonetheless, integrating Smart Ports with the Blue Economy offers transformative potential for progressive coastal policies in developing countries like Indonesia. It is a key pathway to unlocking Indonesia’s archipelagic advantages—transforming ports from simple logistical gateways into active guardians of marine ecosystems and powerful engines of sustainable, inclusive growth for coastal communities.
This research advances both scientific understanding and policy practice by developing an integrative framework that links technological, environmental sustainability, and governance dimensions within a probabilistic port system model. It offers a more comprehensive conceptual contribution by unifying smart port and blue economy perspectives into a single framework that simultaneously accounts for causal relationships and uncertainty. The resulting model provides a stronger basis for strategic decision-making in the development of adaptive, efficient, and sustainable ports. Although designed in the context of archipelagic regions, the approach has broader relevance and potential for global application, particularly in port systems confronting similar challenges related to digital transformation, operational complexity, and maritime sustainability requirements.

2. Literature Review

The concept of smart ports emerged to address the need for greater efficiency and transparency in the increasingly complex global maritime logistics system. This transformation drives a shift from conventional ports to integrated digital-based systems, in which technologies such as the Internet of Things (IoT), big data analytics, artificial intelligence (AI), and automation play a central role in supporting port operations [1,18,20,21,22]. The implementation of these technologies enables the optimization of processes such as vessel scheduling and logistics flow management, reducing vessel turnaround times and ultimately increasing overall port productivity. Beyond improving operational efficiency, smart ports also enhance service quality and transparency through digital systems such as the Port Community System (PCS) and AI-based management, and studies show that port digitalization can reduce supply chain uncertainty and improve interregional connectivity, particularly in archipelagic countries [6,10].
Parallel to the development of smart ports, the blue economy concept has evolved into a development paradigm that emphasizes a balance among economic growth, environmental conservation, and social welfare in the use of marine resources. Unlike traditional approaches that prioritize economic exploitation, the blue economy focuses on the sustainable management of marine resources through inclusive, ecosystem-based governance [8]. In this context, indicators such as marine ecosystem health, coastal employment, and coastal economic output are crucial elements in assessing the success of blue economy implementation. Numerous studies confirm that strengthening environmental compliance systems is a key factor in maintaining the sustainability of marine ecosystems, particularly in coastal areas vulnerable to economic pressures [9,34]. At the same time, increasing employment opportunities in coastal areas is a critical indicator for promoting inclusive economic growth and reducing regional disparities [25,35,36,37,38,39].
Although the Smart Port, Green Port, Eco-Port, and Blue Economy frameworks all promote sustainable maritime development, they differ substantially in scope and focus. Green Port and Eco-Port frameworks primarily emphasize environmental performance, pollution reduction, resource efficiency, and ecological management within port operations [6,11,23]. In contrast, the Smart Port concept centers on digital transformation, automation, artificial intelligence, and operational efficiency to improve port performance and logistics competitiveness [1,2,28,29]. The Blue Economy extends sustainability beyond environmental protection by including coastal employment, maritime value creation, social inclusion, and long-term economic resilience [8,24]. Despite extensive literature in these areas, most studies have examined these dimensions separately. Few have modeled their interdependencies within a unified framework. Previous applications of Bayesian Belief Networks in ports have mostly addressed operational performance, logistics efficiency, safety, or risk assessment [40,41,42,43]. Few address interactions among technological, environmental, governance, and socioeconomic dimensions. Therefore, this study contributes theoretically by developing an integrated Smart Port–Blue Economy framework. It also contributes methodologically by employing a Bayesian Network to capture causal relationships among operational efficiency, logistics reliability, environmental compliance, regulatory enforcement, coastal employment, and regional competitiveness within a single probabilistic model.
Bayesian Belief Networks (BBNs) offer such an adaptive approach to modeling complex systems that incorporate uncertainty. Based on probability theory, BBNs enable the analysis of causal relationships between variables and the integration of empirical data and expert knowledge within a single modeling framework [5,44,45,46]. The primary advantage of BBNs lies in their ability to perform probabilistic inference, scenario analysis, and sensitivity analysis, which are highly relevant for decision-making in dynamic, uncertain systems. In the context of port systems, this approach enables the simultaneous analysis of interactions among operational, environmental, and governance variables, thereby providing a more holistic basis for integrating smart port development with blue economy objectives.

3. Research Methods

3.1. Location of Study

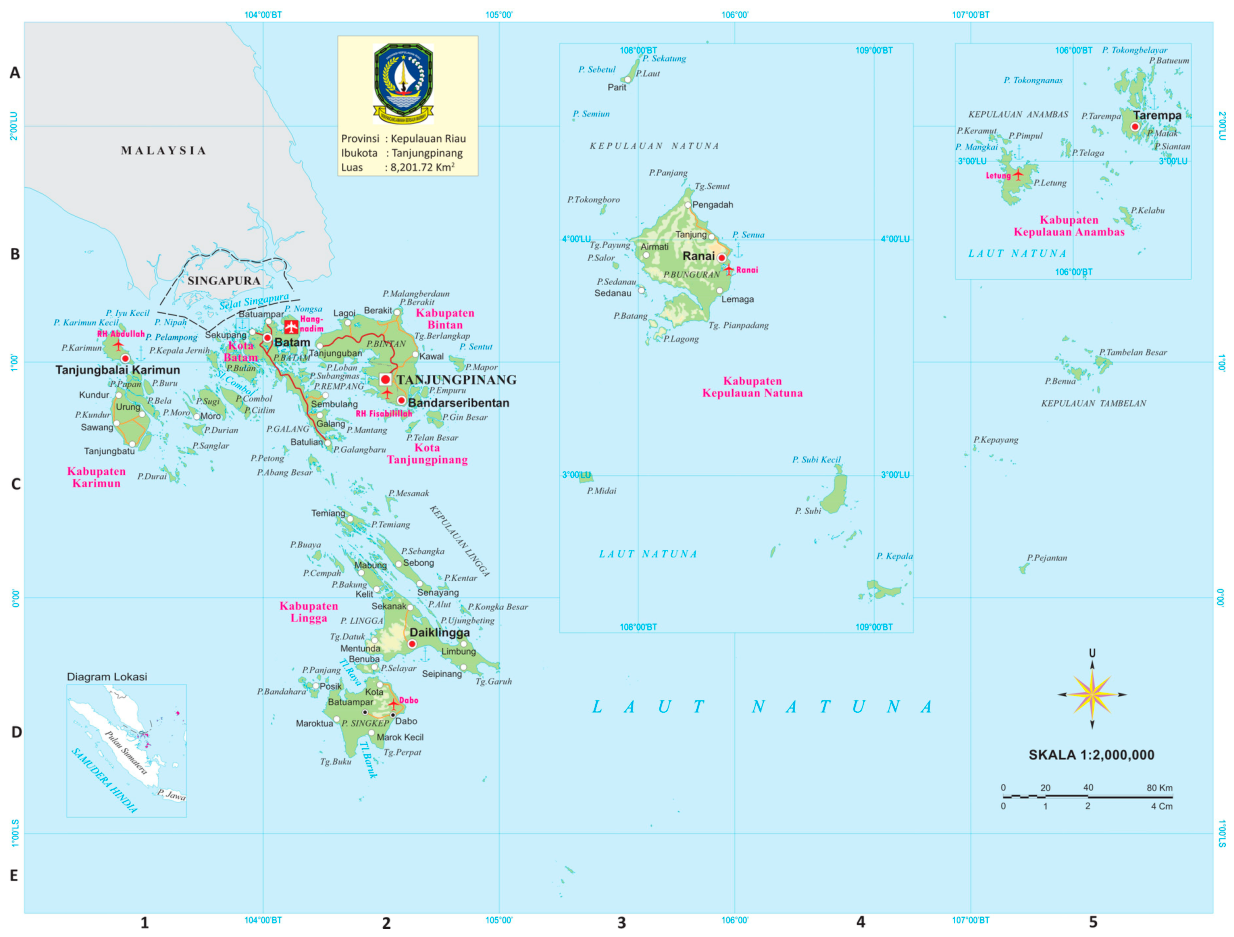
The Riau Islands Province plays a strategic role in supporting Indonesia’s vision as a global maritime axis, thanks to its abundant maritime potential and geographic location as an archipelagic region along major international shipping routes (Figure 1). The province is situated near key global maritime corridors, including the Malacca Strait, the South China Sea, and the Karimata Strait, and shares maritime boundaries with Singapore and Malaysia. This strategic positioning places the Riau Islands within one of the busiest international trade networks, making it a critical gateway for maritime transport and logistics in Southeast Asia [47,48,49]. From a maritime economic perspective, ports located along major shipping lanes tend to benefit from higher distribution efficiency and stronger economic competitiveness [30]. Within this regional context, Batam emerges as a key maritime hub, where port infrastructure functions not only as a transportation facility but also as a driver of regional economic growth by facilitating the movement of goods and people across islands [48,50].
The Riau Islands Province was selected as the study area because of its strategic location along major international shipping routes and its strong reliance on maritime connectivity for economic development. Batam serves as one of the region’s principal maritime gateways, facilitating passenger and cargo movements between Indonesia and neighboring countries while supporting inter-island transportation across the archipelago. At the same time, ongoing efforts to modernize ports and transform the digital landscape have increased the relevance of Smart Port initiatives in the region. These characteristics make the Riau Islands an appropriate case for examining the interactions among operational efficiency, governance, environmental sustainability, and socioeconomic development within a Smart Port–Blue Economy framework. Despite its strategic advantages, the port system in the Riau Islands still faces structural challenges, particularly logistical inefficiencies and limited port capacity, which constrain its potential to operate as an international trade hub. These conditions highlight the need for an integrated approach that combines operational efficiency, digital transformation, and sustainability principles to enhance the performance and competitiveness of port systems in archipelagic regions.

3.2. Research Design and Analytical Framework

This study adopts a quantitative probabilistic approach using Bayesian Belief Networks (BBN) to model complex port systems. BBN enables the explicit representation of uncertainty and causal relationships while integrating empirical data with expert knowledge, making it suitable for scenario and sensitivity analysis [5,45,46]. This approach effectively captures the non-linear interactions and uncertainties inherent in modern port systems that integrate digital technologies and sustainability principles. In this research, the port system is conceptualized as a multidimensional system shaped not only by operational efficiency and logistics connectivity but also by environmental sustainability and maritime economic performance. Therefore, BBN provides a more appropriate framework than deterministic models for capturing interdependencies among variables, particularly in archipelagic contexts characterized by limited data, environmental variability, and complex system interactions.
Consistent with established applications of Bayesian Belief Networks in environmental management, sustainability assessment, and policy analysis, the network structure in this study was developed through a structured expert elicitation process supported by empirical evidence and secondary data sources, rather than relying solely on automated structural learning algorithms. This approach was adopted because the primary objective was to represent theoretically grounded, context-specific, and policy-relevant causal relationships among smart port and blue economy variables, many of which involve latent governance, environmental, and socioeconomic dimensions that are difficult to infer exclusively from observational data. To enhance model robustness and reduce potential subjectivity, expert judgments were systematically triangulated with empirical indicators from international databases, logistics performance statistics, and regional maritime reports. Consequently, the resulting DAG structure reflects not only expert knowledge but also evidence-based validation of the causal relationships characterizing the Smart Port–Blue Economy system in the Riau Islands context.
The analytical framework for this research was developed by adapting the Bayesian Network model to port systems, integrating various dimensions of performance and connectivity into a single analytical framework. The Bayesian Belief Network approach emphasizes the use of a Directed Acyclic Graph (DAG) structure and probabilistic estimation based on a combination of empirical data and expert judgment. Based on this approach, this research develops an analytical framework for a Blue Economy-based Smart Port System capable of simultaneously integrating port technology dimensions with sustainability principles within a single probabilistic model.

3.3. Variable Identification and Conceptual Structure

This study classifies the variables into two main dimensions, Smart Port and Blue Economy, which interact conceptually to shape an efficient and sustainable port system. The Smart Port dimension encompasses the technological and operational aspects of the port, including digitalization, operational efficiency, logistics connectivity, and the quality of infrastructure and services. The variables in this dimension serve as the primary factors determining the technical performance and efficiency of the port system.
Meanwhile, the Blue Economy dimension encompasses sustainability aspects, including efficient resource utilization, reduced environmental impact, and contributions to inclusive maritime economic growth. This dimension serves as an evaluative framework for assessing the sustainability quality of the developed port system. This study represents the relationship between these two dimensions using a Directed Acyclic Graph (DAG), in which each variable is a node and the relationships among variables are modeled as edges, allowing the model to capture causal linkages and quantify interdependencies within a complex, uncertain system. In this model, the Smart Port variables serve as driving factors that influence system performance, while the Blue Economy variables reflect the sustainability outcomes generated by the system. The main output of the model is the performance of Blue Economy-based Smart Ports.
Although the Bayesian Belief Network (BBN) framework in this study integrates empirical indicators and expert-based knowledge, this study acknowledges that the Directed Acyclic Graph (DAG) structure and Conditional Probability Tables (CPTs) are partially dependent on expert judgment obtained through focus group discussions (FGDs). To reduce subjectivity, the study adopted a triangulation mechanism by combining secondary datasets from UNCTAD, the World Bank, logistics performance indicators, and regional maritime reports with iterative expert validation. The experts were asked not only to define causal relationships but also to verify whether the assigned probabilities reflected observed conditions in the Riau Islands port system.
The weighting process prioritized empirical indicators whenever quantitative data were available, while expert judgment was primarily used to estimate probabilistic relationships for latent and governance-related variables that could not be directly observed. In cases where discrepancies emerged between empirical indications and expert assessments, the final CPT values were determined through consensus-based iterative discussions during the FGD sessions.

3.4. Data Collection and Preprocessing

This study uses a combination of secondary and primary data. It draws secondary data from credible international sources, including UNCTAD, the World Bank, and the Global Competitiveness Report, which researchers widely use to analyze port systems and maritime connectivity. This data includes port performance indicators, logistics connectivity, and economic and environmental variables. This study collects primary data through expert-based focus group discussions (FGDs) involving experts in ports, maritime logistics, and maritime economics to support model development and validation (Table 1). The FGD involved This study employs this approach to ensure the validity of the model structure and the relationships among variables, especially under conditions of limited empirical data.
Before modeling, the data were preprocessed, including handling missing values and discretizing variables. This study uses mean and mode imputation for missing data and discretizes continuous variables into categorical levels (e.g., low, medium, and high) to improve interpretability and reflect the limited availability of quantitative observations. Categorical states are also commonly used in expert-based Bayesian models to support the elicitation of conditional probabilities during focus group discussions.

3.5. Bayesian Belief Network Modeling

This study develops a model based on Bayes’ Theorem, enabling the calculation of conditional probabilities among variables in the network.
P ( A B ) = P B A · P ( A ) P ( B )
This equation expresses the probability of event A, conditioned on event B, which serves as the basis for constructing the Bayesian model. For systems involving multiple variables, the joint probability distribution is defined as follows:
P X 1 , X 2 , , X n = 1 n P ( X 1 P a r e n t | ( X i ) ) ( i = 1,2 , , n )
where Parent(Xi) denotes the parent nodes of Xi, this formulation enables the model to capture the interdependencies among variables within a complex system.
This study conducts the model development process in two main stages: structure learning and parameter learning. Structure learning identifies the relationships among variables based on theoretical foundations and findings from focus group discussions (FGDs). In contrast, parameter learning estimates the probabilities in the Conditional Probability Table (CPT) using both empirical data and expert judgment. This approach ensures model robustness under limited data conditions while maintaining a realistic representation of the system.
This study further extends this theoretical foundation into a Bayesian Belief Network (BBN) framework. The BBN method consists of two main components: qualitative and quantitative. The qualitative component employs a Directed Acyclic Graph (DAG) to define relationships among variables. In contrast, the quantitative component employs a Conditional Probability Table (CPT) to quantify initial conditions and probabilistic relationships within the system.
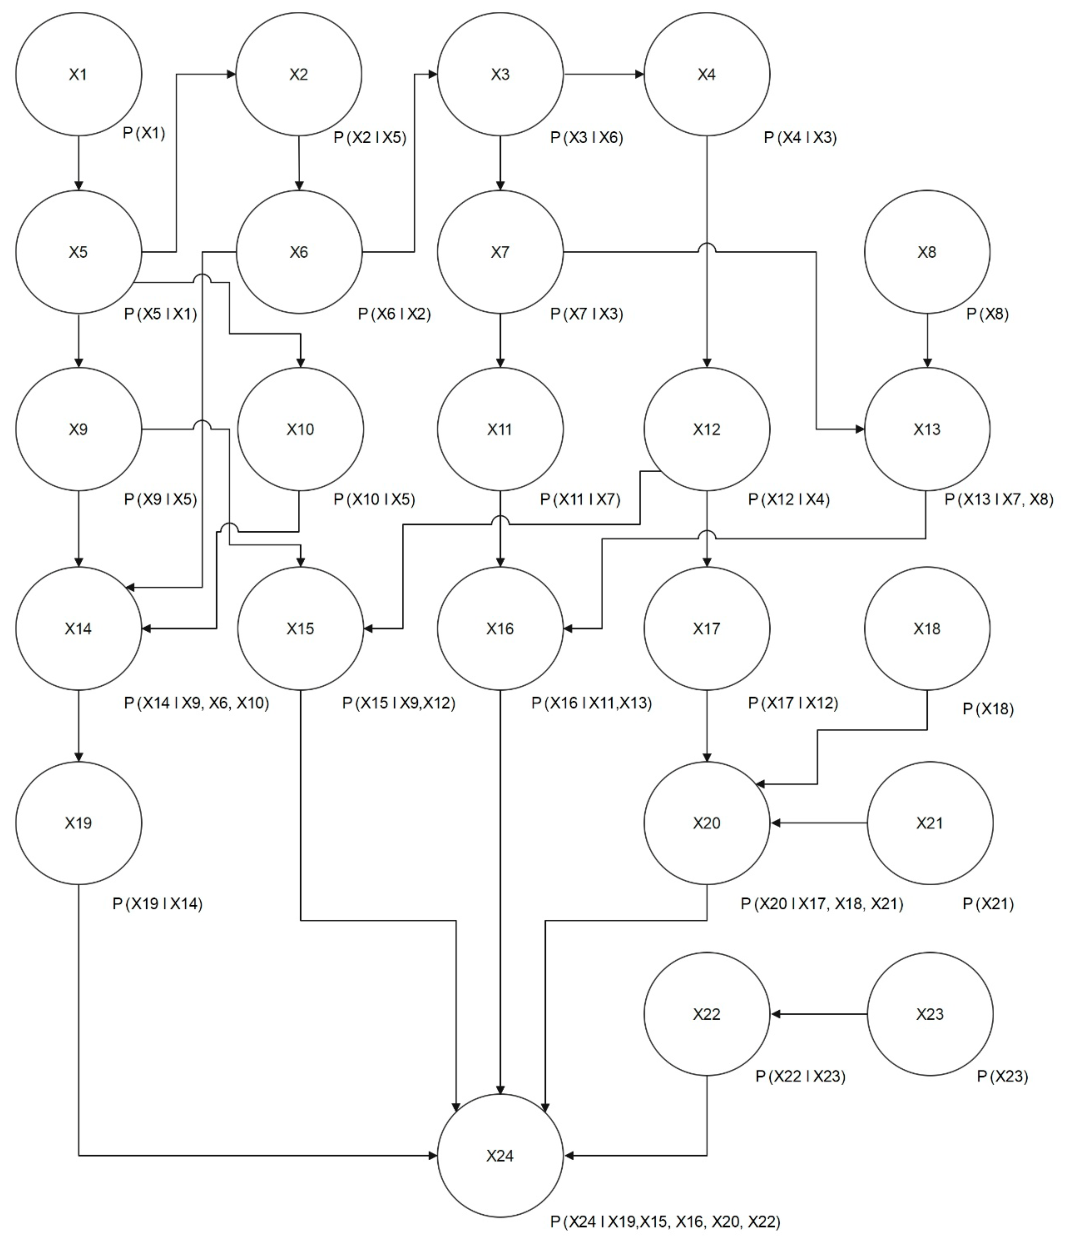
As shown in Figure 2, the direction of the arrow from X1 to X5 indicates that the probability of variable X5 depends on the value of X1. Similarly, the probability of X13 depends on variables X7 and X8, as well as other relationships within the network. In this DAG structure, X1, X8, X18, X21, and X23 are classified as parent variables because they do not depend on other variables, whereas the remaining variables function as child nodes. When X24 serves as the target variable, the model expresses the mathematical representation of the DAG structure as follows:
Pr   ( X 24 )   =   Pr ( X 24 | X 19 , X 15 , X 16 , X 20 , X 22 ) Pr ( X 19 )   Pr ( X 15 )   Pr ( X 16 )   Pr ( X 20 )   Pr ( X 22 )
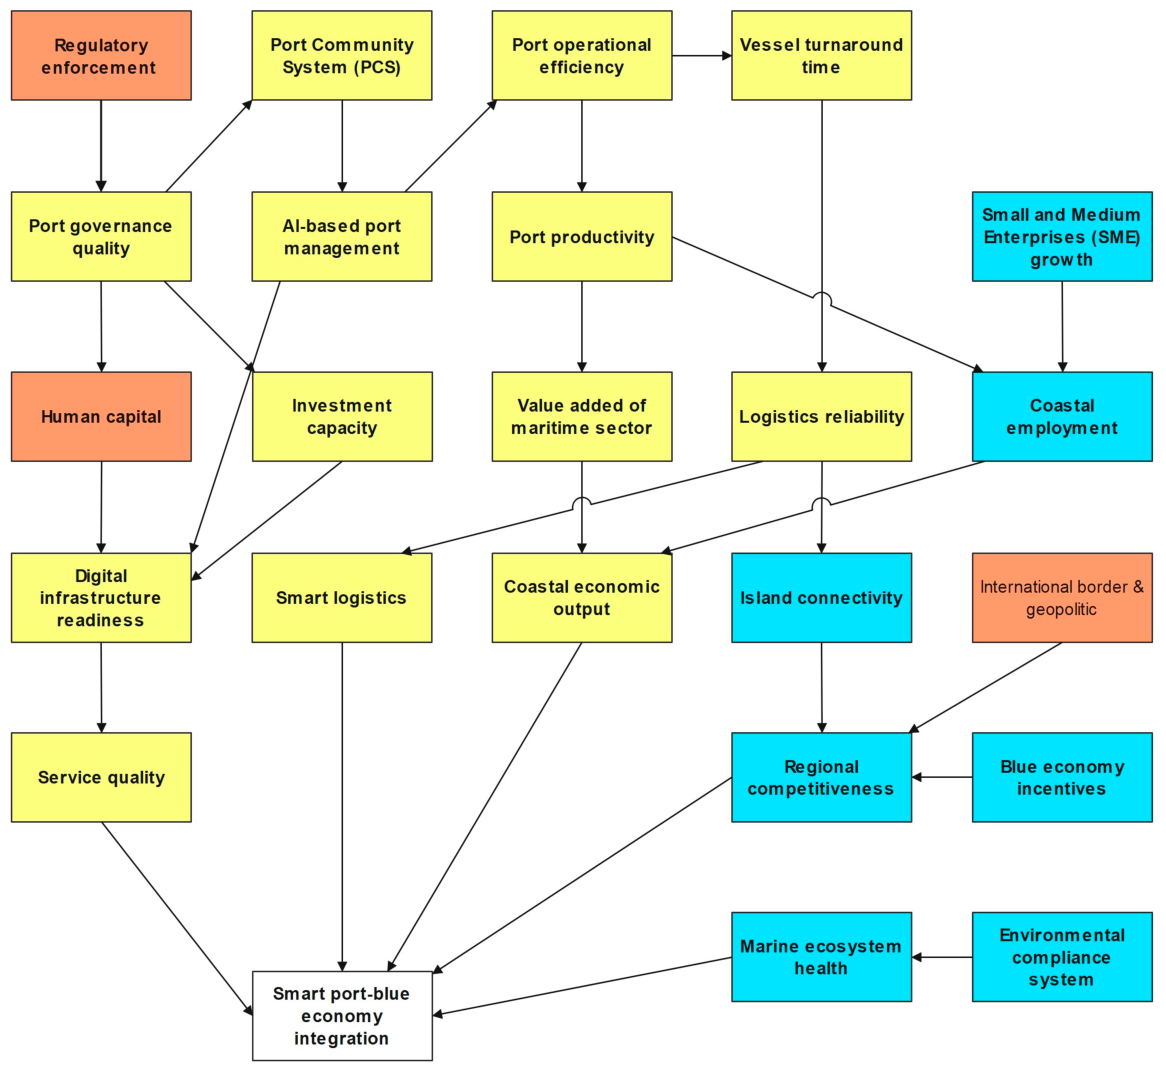
Based on the previously described methodology and literature review, this study develops a Directed Acyclic Graph (DAG) that incorporates a set of variables deemed influential in constructing a smart port model grounded in blue economy principles. The model visualizes the relationships among these variables through the DAG structure presented in Figure 3. In this figure, yellow indicates variables associated with the smart port aspect, blue denotes variables related to the blue economy aspect, and brown highlights the overlapping area that reflects the interconnection between the two dimensions.
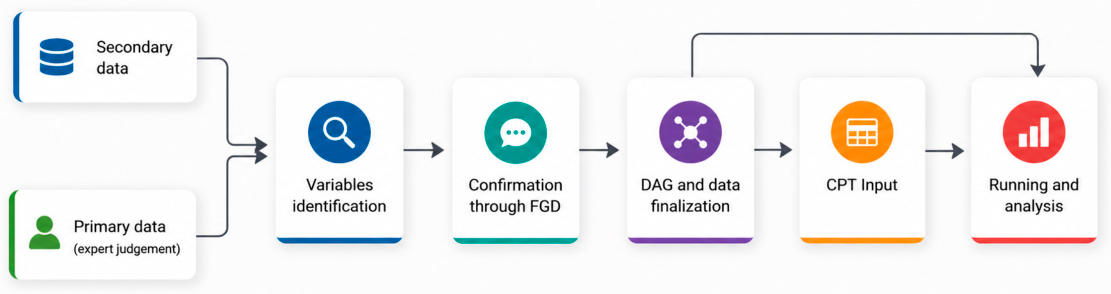
This study collects data through focus group discussions (FGDs) involving eight participants, including experts in port management, maritime logistics, marine economics, transportation, environmental management, fisheries and marine affairs, regional planning agencies, infrastructure, and information technology. The participants contribute by discussing and formulating relationships among variables within the DAG structure, validating the secondary data used, and refining the model based on their expertise and understanding of the smart port system grounded in blue economy principles. Figure 4 presents the systematic data collection and analysis process.
This study compiles the experts’ validated inputs into Conditional Probability Tables (CPTs) and analyzes them using the Genie Bayes Fusion Academic software (version 4.1) (https://www.bayesfusion.com/genie/) (accessed on 13 February 2026). In this study, the CPTs represent the probabilistic relationships among variables associated with the smart port system based on blue economy principles. At the same time, Table 2 provides a detailed description of the measurement mechanisms for each variable.
This study measures using multiple scenarios, including baseline conditions and more stringent ones, with categorical levels such as low, medium, and high. This approach captures respondents’ and experts’ perceptions and assessments of system conditions more comprehensively. In addition, the study does not rely solely on subjective judgments but integrates relevant secondary data to enhance the validity of the results.
During the focus group discussions (FGDs), experts actively provide input on the relationships among variables and assign probability values to each Conditional Probability Table (CPT). The study conducts this assessment systematically to ensure consistency and a realistic representation of real-world conditions.
Table 3 presents CPT of node 1 with respect to Regulatory enforcement. This node reflects the extent to which authorities implement port regulations and policies consistently and effectively [52]. This study classifies the variable into three categories: weak, moderate, and strong. When respondents assess that regulatory enforcement operates firmly and consistently, the model increases the probability assigned to the strong category while maintaining a total probability distribution of 100%.
The Port Community System (PCS) reflects the level of integration and interoperability among port stakeholders’ information systems. In this model, Port governance quality influences PCS [53]. This study evaluates PCS using three categories: low, medium, and high. As digital integration and data exchange increase, the model assigns a higher probability to the high category. The values of CPT from node 2 (PCS) to port governance quality are presented in Table 4.
CPT values of node 3 linking port operational efficiency to AI-based port management are presented in Table 5. This variable reflects the efficiency of port operational processes in supporting the flow of goods and vessels. In this model, AI-based port management influences port operational efficiency [12,20,21]. This study classifies the variable into three categories: poor, medium, and good. When operations achieve optimal efficiency, such as reduced waiting times and minimal operational bottlenecks, the model assigns a higher probability to the good category.
Vessel turnaround time (Table 6) measures the speed of vessel handling from arrival to departure. In this model, port operational efficiency influences vessel turnaround time [12,15,18,21]. This study classifies the variable into three categories: poor, medium, and good. Shorter vessel service times lead the model to assign a higher probability to the good category.
Port governance quality reflects the effectiveness of port management in terms of managerial practices and coordination [8,16,20,30,45]. Referring to Table 7, in this model, regulatory enforcement influences the level of port governance quality. This study classifies the variable into three categories: poor, medium, and good. Transparent and efficient governance increases the model’s probability of assigning a higher rating to the good category.
This variable assesses the extent to which port authorities and operators implement artificial intelligence–based technologies in port operations [12,20,21]. As shown in Table 8, in this model, the Port Community System (PCS) influences AI-based port management. This study classifies the variable into three categories: low, medium, and high. Extensive and effective implementation of AI leads the model to assign a higher probability to the high category high.
Referring to the information presented in Table 9, port productivity represents the level of output generated by the port relative to the resources used [19,28]. In this model, port operational efficiency influences port productivity. This study classifies the variable into three categories: low, medium, and high. Higher productivity leads the model to assign a greater probability to the high category.
Based on the information provided in Table 10, this variable measures the growth dynamics of small and medium enterprises (SMEs) associated with port activities [33]. This study classifies the variable into three categories: low, medium, and high. When port activities significantly stimulate SME development, the model assigns a higher probability to the high category.
As indicated in Table 11, human capital reflects the quality and capacity of the workforce within the port system [30,33]. In this model, port governance quality influences the level of human capital. This study classifies the variable into three categories: low, medium, and high. A skilled and adaptive workforce leads the model to assign a higher probability to the high category.
This variable reflects the port’s ability to attract and manage investment. In this model, port governance quality influences investment capacity [30,33]. This study classifies the variable into three categories: low, medium, and high. A conducive investment environment leads the model to assign a higher probability to the high category, as illustrated in Table 12.
This variable reflects the maritime sector’s contribution to economic value added. This study classifies the variable into three categories: low, medium, and high. Greater economic contributions lead the model to assign a higher probability to the high category, based on the information presented in Table 13.
Logistics reliability reflects the consistency and dependability of the port logistics system [14,54]. This variable is classified into three categories: low, medium, and high—as shown in Table 14. A stable and timely logistics system leads the model to assign a higher probability to the high category, with all probability values normalized to sum to 100%.
The coastal employment variable represents the contribution of port activities to job creation in coastal areas [26,27]. In the CPT structure, each cell reflects the combined responses of two parent nodes, SME growth and port productivity, under different conditions of coastal employment, as presented in Table 15. Thus, the probability of employment absorption does not operate independently but depends on the dynamics of SME growth and the level of port productivity. When respondents assess that both factors perform well and support job creation in coastal areas, the model assigns a higher probability to the high category, while adjusting the remaining categories so that the total probability sums to 100%.

3.5.1. Node 14: Digital Infrastructure Readiness

The digital infrastructure readiness variable reflects the level of preparedness of digital infrastructure in supporting the implementation of a smart port system [12,17,20,21]. Within the CPT structure, each cell represents the combined influence of three parent nodes—AI-based port management, human capital, and investment capacity—on digital infrastructure readiness. Thus, digital infrastructure readiness does not operate independently but depends on the level of technology adoption, the quality of human resources, and the available investment capacity. This study classifies the variable into three categories: poor, medium, and good. When all three supporting factors reach optimal conditions, the model assigns a higher probability to the good category and adjusts the remaining categories so that the total probability sums to 100%. Table A1 provides the detailed CPT values for this variable.
The smart logistics variable in this study captures the level of digital technology adoption in port logistics systems, including automation, data integration, and AI-based platforms [19,30,54,55]. Within the CPT structure, each cell reflects the combined influence of two parent nodes, human capital and logistics reliability, on smart logistics conditions. Thus, the probability of successful smart logistics implementation depends on the quality of human resources and the reliability of the logistics system. When respondents assess that both factors perform well and support digital integration, the model assigns a higher probability to the high category, while adjusting the remaining categories so that the total probability sums to 100% are presented on Table 16.
Referring to the information presented in Table 17, the coastal economic output variable indicates the level of economic activity generated in coastal areas as a consequence of port presence and performance [13,14]. Within the CPT framework, each cell represents the combined influence of two parent nodes, coastal employment and value added of the maritime sector, on coastal economic output conditions. This relationship indicates that the magnitude of coastal economic output depends on the maritime sector’s ability to create value added and absorb labor. When both factors reach high levels, the model assigns a higher probability to the high category of coastal economic output, while adjusting the remaining categories to keep the total probability at 100%.
Table 18 presents CPT of node 17 with respect to Island connectivity. Island connectivity reflects the level of inter-island connectivity facilitated by the port system [13,14]. This study classifies the variable into three categories: poor, medium, and good. Effective connectivity ensures smooth distribution of goods and mobility across regions, leading the model to assign a higher probability to the good category, while adjusting the remaining categories so that the total probability sums to 100%.
This variable represents the level of risk arising from geopolitical factors and international border conditions [5]. Referring to Table 19, this study classifies the variable into three categories: high, medium, and low risk. When geopolitical conditions are stable and support international trade, the model assigns a higher probability to the low-risk category while adjusting the remaining categories to ensure the total probability sums to 100%.
Service quality reflects the level of port service experienced by users, including speed, accuracy, and reliability [18,30,53]. This study classifies the variable into three categories: poor, medium, and good, as presented in Table 20. Responsive and efficient services lead the model to assign a higher probability to the good category, while adjusting the remaining categories so that the total probability sums to 100%.

3.5.2. Node 20: Regional Competitiveness

Table A2 presents the CPT for this variable. The regional competitiveness variable reflects a region’s competitiveness, shaped by the strategic role of ports in supporting economic activities and connectivity [5,20,45]. Within the CPT framework, each cell represents the combined influence of three parent nodes: international border and geopolitics, island connectivity, and blue economy incentives on regional competitiveness conditions. This relationship indicates that regional competitiveness depends not only on internal factors but also on geopolitical stability, the quality of interregional connectivity, and policy support grounded in blue economy principles. This study classifies the variable into three categories: poor, medium, and good. When these three factors are favorable, the model assigns a higher probability to the good category, while adjusting the remaining categories so that the total probability sums to 100%.
Based on the information presented in Table 21, blue economy incentives reflect the level of policy support and incentives that promote the implementation of blue economy principles [25,33]. This study classifies the variable into three categories: low, medium, and high. Strong incentives stimulate investment and sustainable innovation, leading the model to assign a higher probability to the high category, while adjusting the remaining categories so that the total probability sums to 100%.
According to the information provided in Table 22, marine ecosystem health reflects the sustainability condition of marine ecosystems influenced by port activities [10,14,52]. This study classifies the variable into three categories: poor, medium, and good. A healthy ecosystem indicates that port operations incorporate environmental considerations, leading the model to assign a higher probability to the good category, while adjusting the remaining categories so that the total probability sums to 100%.
As shown in Table 23, this variable reflects the level of compliance with environmental standards and regulations in port operations [6,22,52]. This study classifies the variable into three categories: weak, moderate, and strong. Strong compliance systems lead the model to assign a higher probability to the strong category, while adjusting the remaining categories so that the total probability sums to 100%.

3.5.3. Node 24. Smart Port–Blue Economy Integration

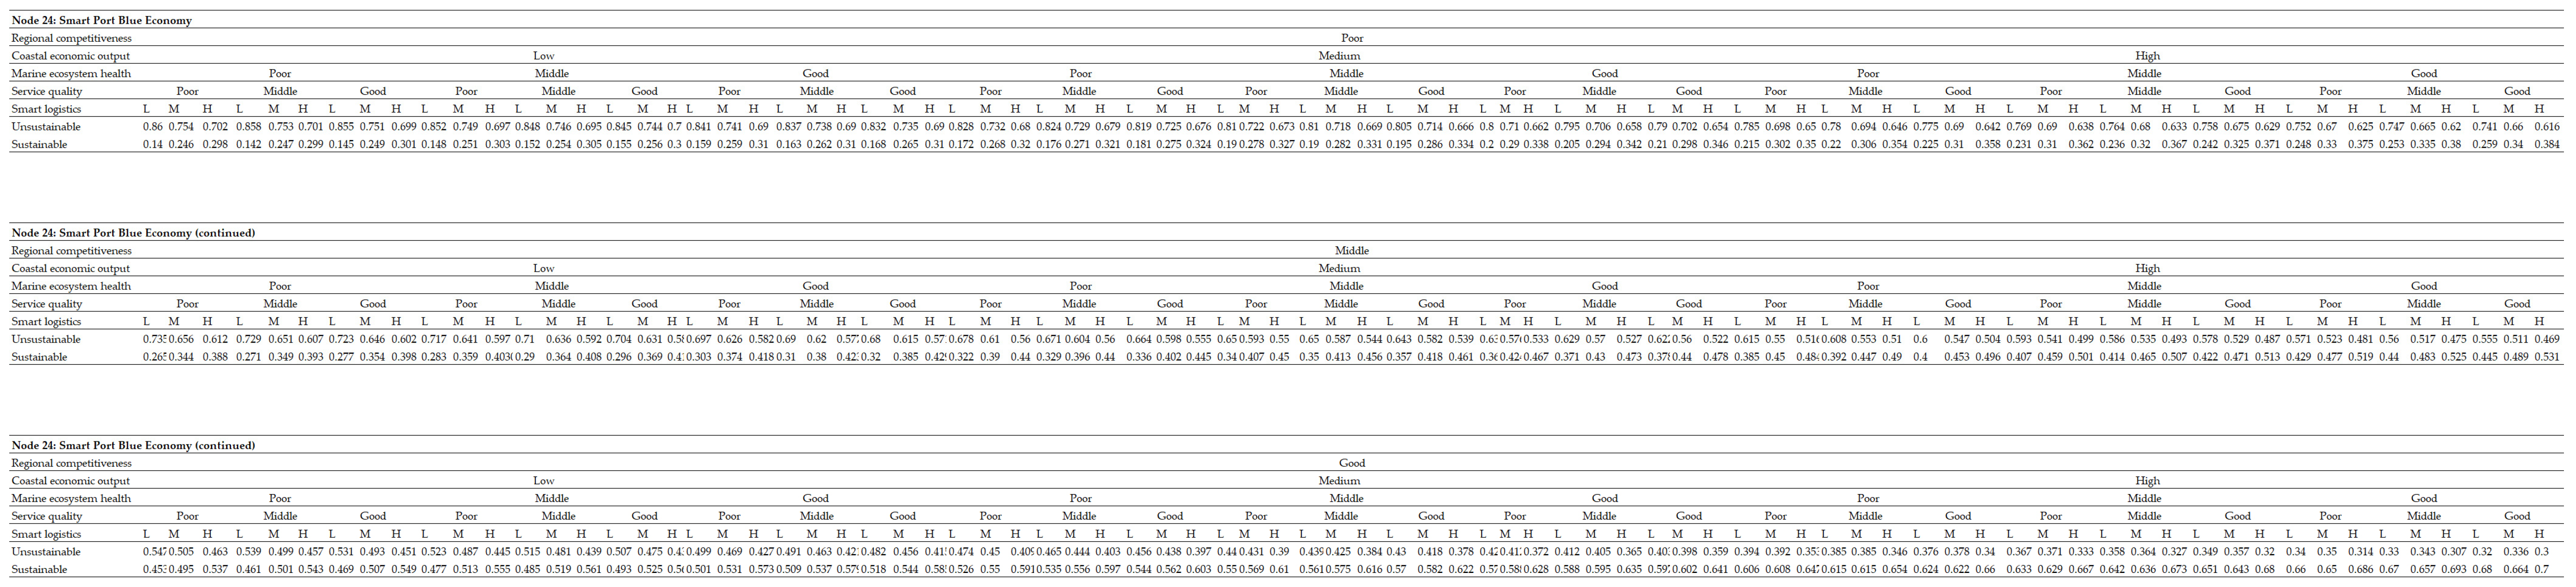
Figure A1 presents this variable as an output node that represents the level of success in integrating the smart port system with blue economy principles. This study evaluates the variable using two categories: unsustainable and sustainable. When the port system achieves a balance between operational efficiency and environmental sustainability, the model assigns a higher probability to the sustainable category and adjusts the remaining category so that the total probability sums to 100%. This variable also serves as a final indicator reflecting the success of port transformation toward an intelligent and sustainable system.
The CPT values presented in Table 1, Table 8, Table 18, Table 21 and Table 23 represent probabilities for single nodes and therefore do not involve interactions with other variables. The study structures the remaining tables as cross-tabulations to capture relationships and interactions between two or more nodes within the system. For example, Table 3 illustrates the relationship between the Port Community System (PCS) and port governance quality, where respondents evaluate how changes in PCS affect the categories of port governance quality. When PCS becomes more integrated, respondents estimate the probability that governance quality falls within low, medium, or high levels. The study consistently applies this assessment mechanism across other Table 4, Table 5, Table 6, Table 7, Table 8, Table 9, Table 11, Table 12, Table 13, Table 14, Table 18, Table 20 and Table 22, each of which represents interactions among variables within the developed Bayesian framework.
The CPT values in Table 14 result from an assessment involving three interacting nodes: coastal employment, SME growth, and port productivity. The study organizes the results into a 3 × 3 matrix, where each cell represents the combined condition of SME growth and port productivity on coastal employment. For instance, when both SME growth and port productivity are low, the model assigns a 0.7 probability to the low-coastal-employment category. This interpretation applies consistently across all cells in the table. The study applies a similar approach to Table 15, Table 16 and Table 17.
Table A1 introduces greater complexity by incorporating four interrelated nodes: digital infrastructure readiness, AI-based port management, human capital, and investment capacity. The study presents the results in a 4 × 4 matrix, where each cell represents the combined influence of AI-based port management, human capital, and investment capacity on digital infrastructure readiness. For example, when all three variables are high, the model assigns a probability of 0.8 to the high category of digital infrastructure readiness. This interpretation applies to all combinations within the table, and the study uses the same approach in Table A2.
The highest level of complexity appears in Figure A1, which incorporates five key interacting nodes: Smart Port–Blue Economy, regional competitiveness, coastal economic output, marine ecosystem health, service quality, and smart logistics. The study presents the results in a 4 × 4 matrix, where each cell represents the combined conditions of the input variables (regional competitiveness, coastal economic output, marine ecosystem health, service quality, and smart logistics) on the target variable Smart Port–Blue Economy. This approach enables a more comprehensive analysis of multidimensional relationships among variables within the blue economy-based port system.
The target variable, Smart Port–Blue Economy Integration, was simplified into two states (Unsustainable and Sustainable) to keep the Bayesian Network tractable, given the many variables involved. Experts noted that system conditions usually converged toward either favorable or unfavorable outcomes, so a binary approach enhanced interpretability. Although this may oversimplify sustainability’s complexity, results should be seen as indicating overall trends, not full details.

4. Results

4.1. Strength Analysis

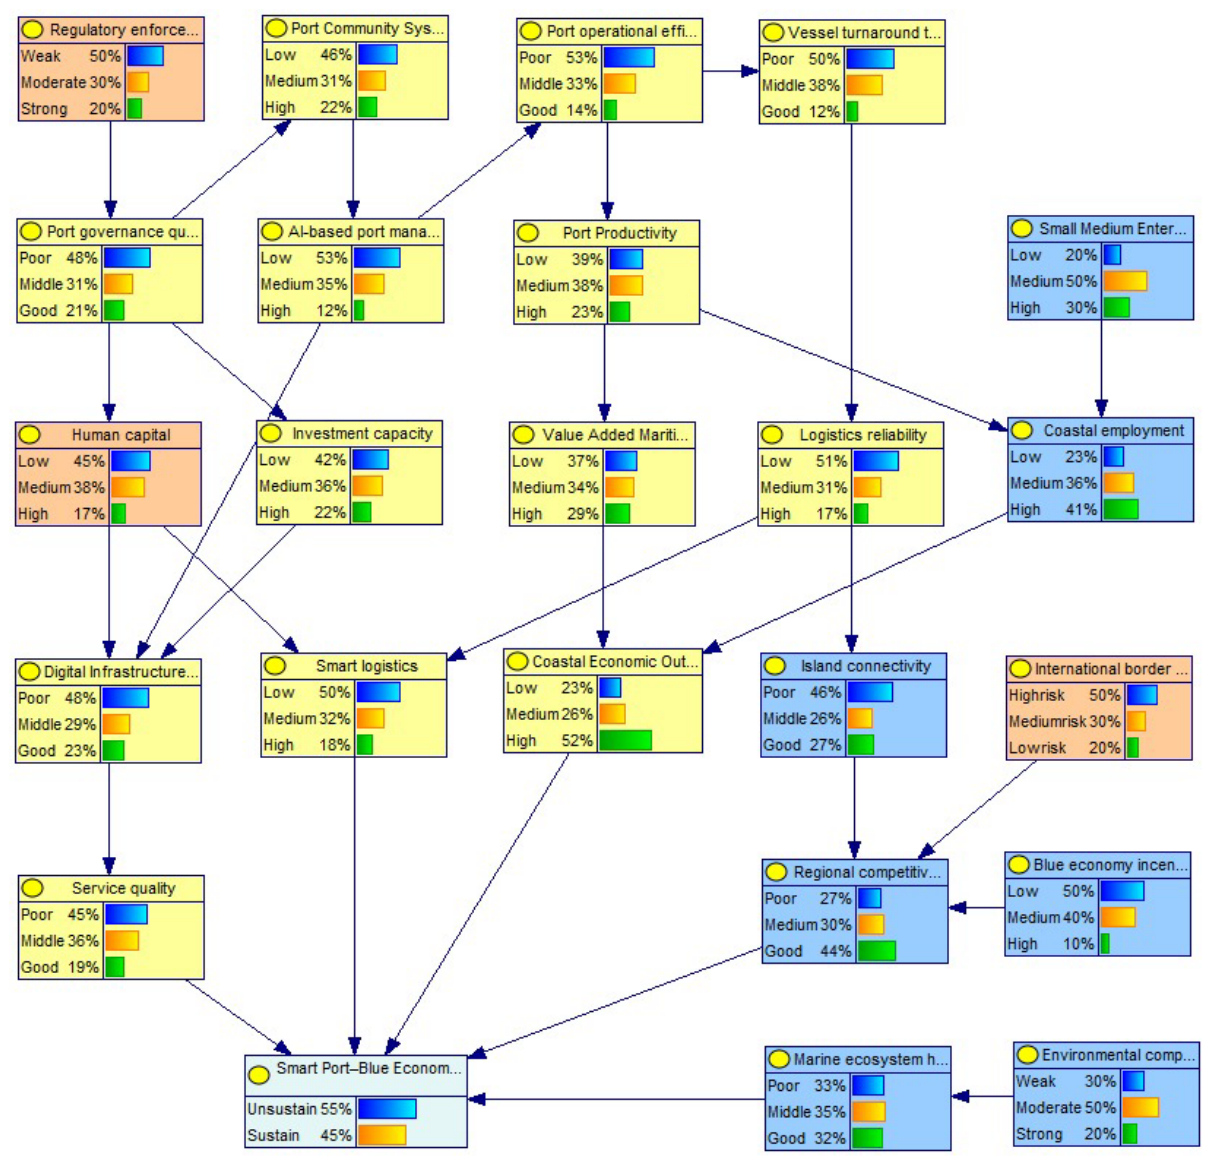
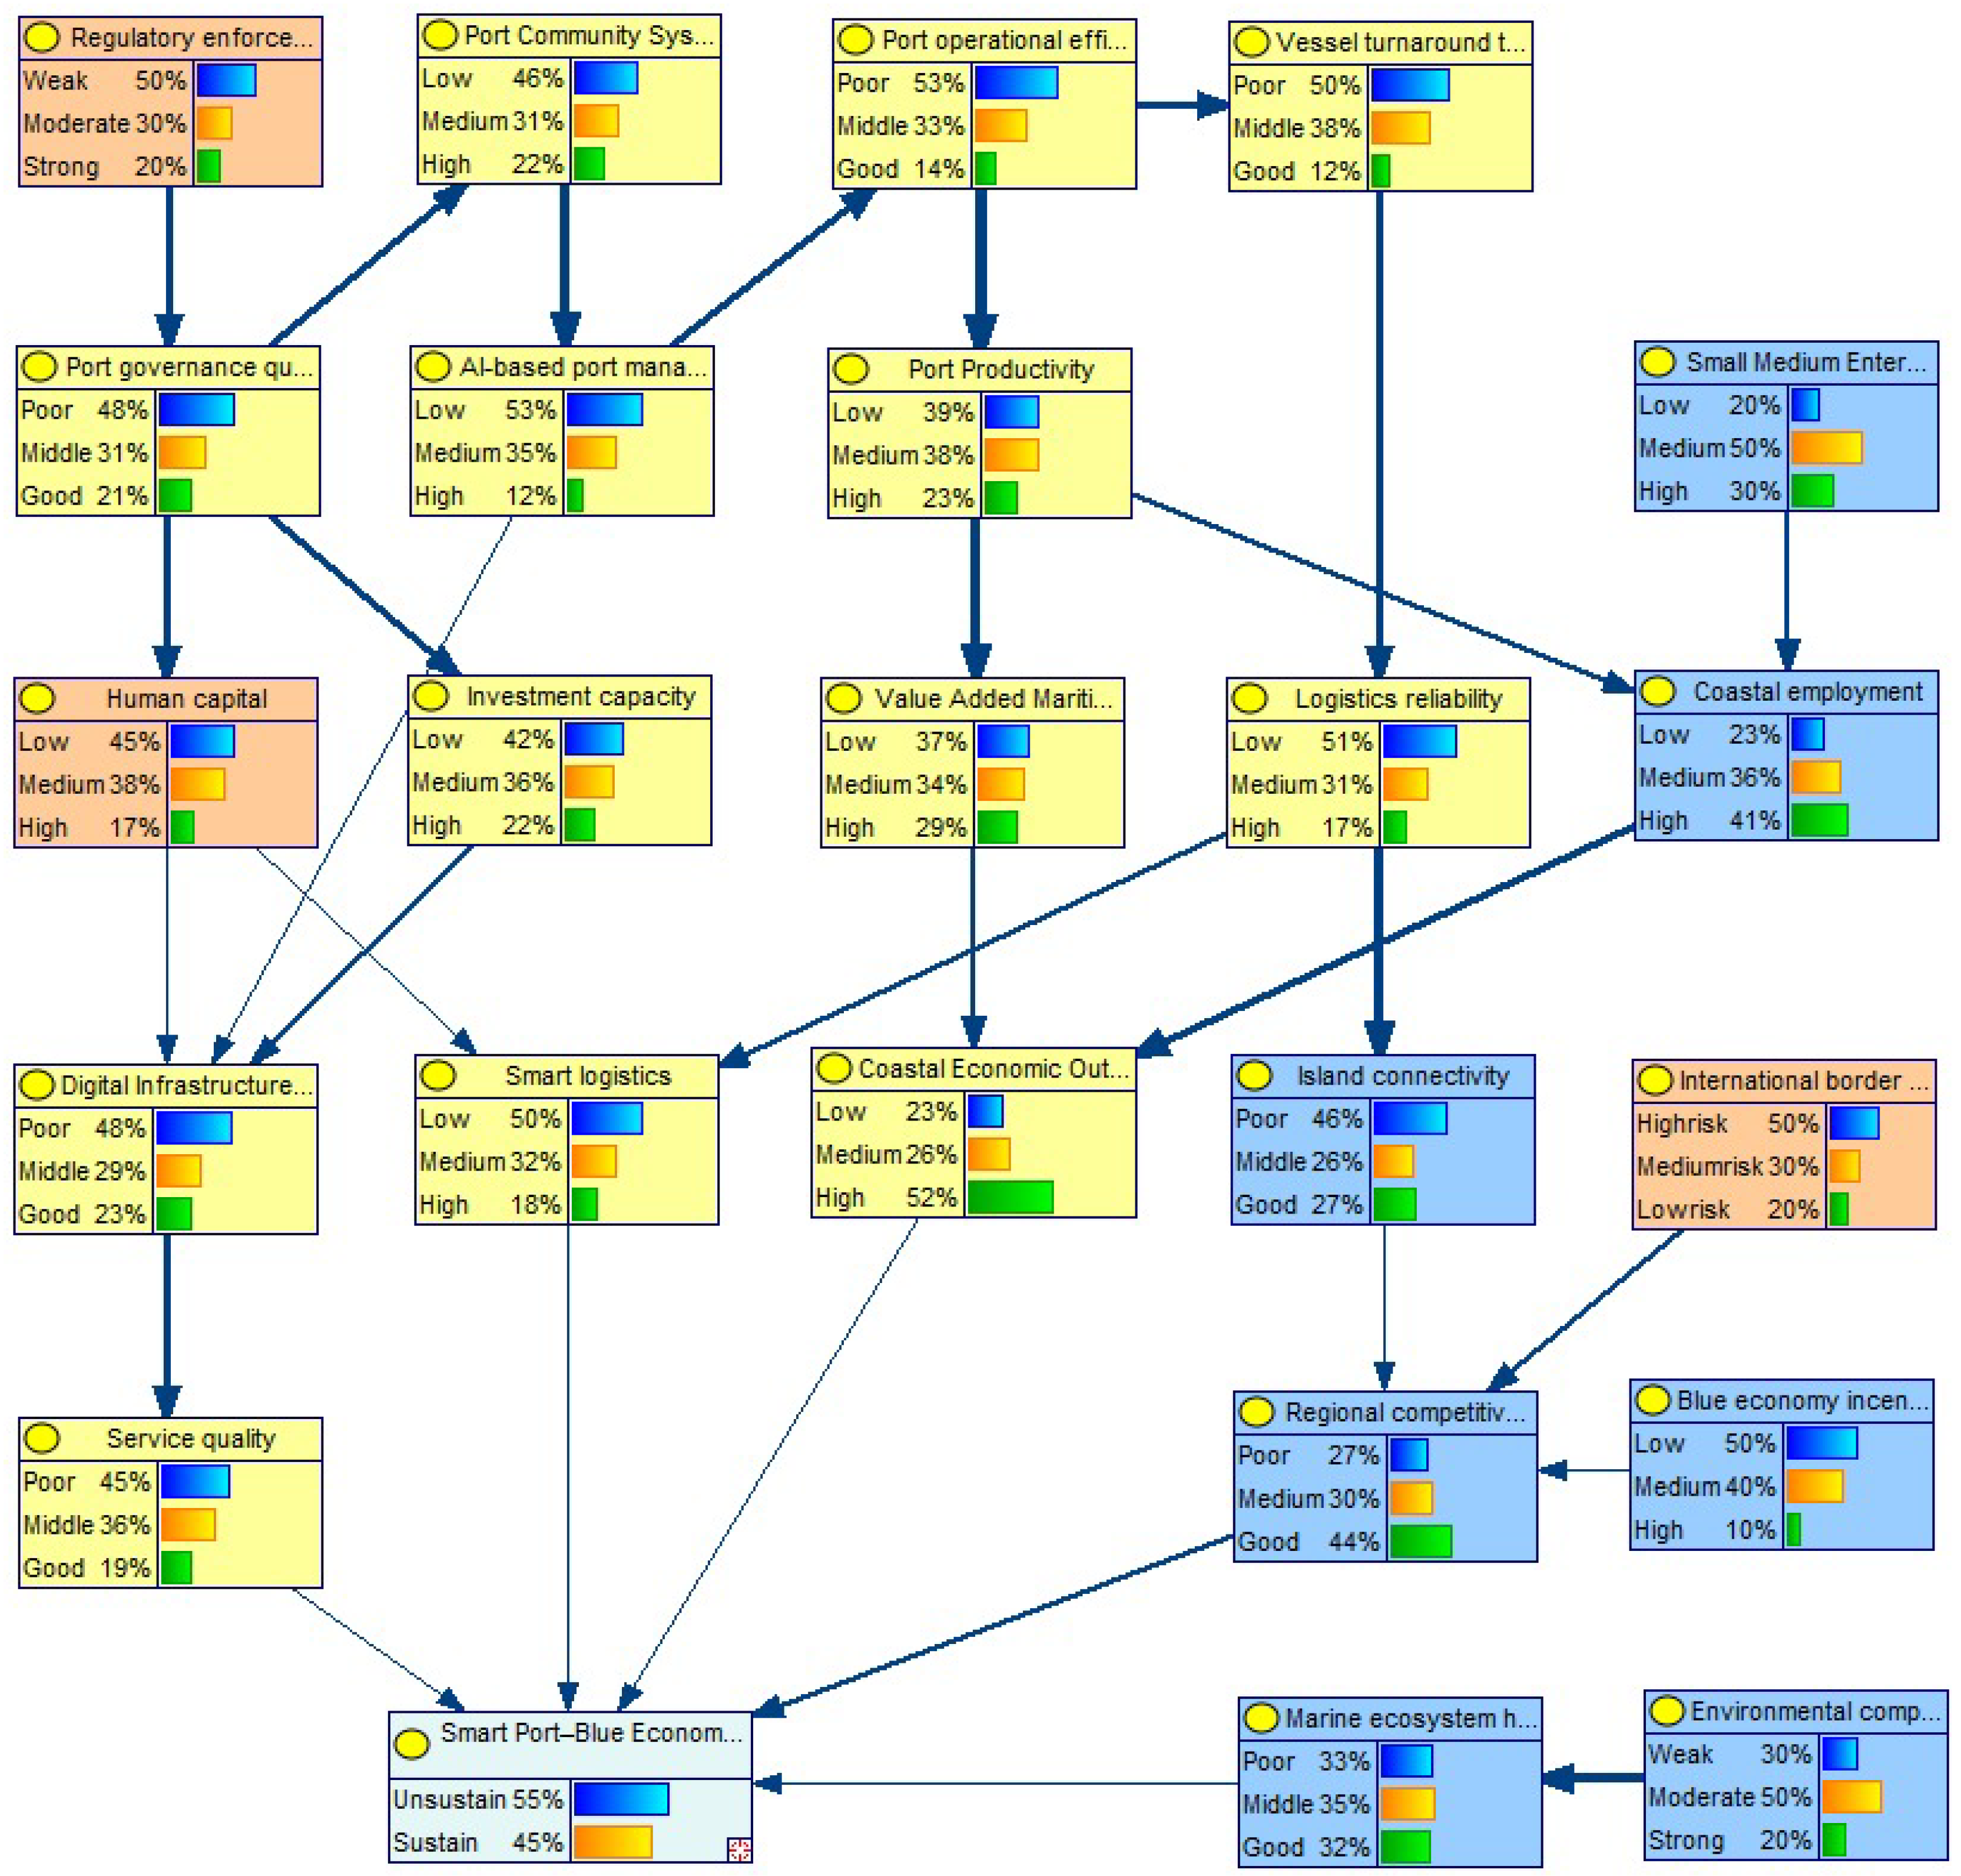
The Bayesian Network model requires the specification of prior probabilities for each variable, which this study represents as conditional probabilities by assigning Conditional Probability (CP) values to each node (Figure 5).
Figure 5 presents the initial probability structure of the smart port system based on blue economy principles. For example, the model assigns a 50% probability to the parent node Regulatory enforcement, reflecting relatively weak regulatory enforcement in the Riau Islands Province. Meanwhile, several other parent nodes, such as Small and Medium Enterprise (SME) growth, international border and geopolitics, blue economy incentives, and environmental compliance system, remain at moderate to low levels. The interactions among variables within the Bayesian network generate an initial probability of 55% for the unsustainable category of the smart port–blue economy system. This result indicates that the current port system still faces significant challenges in achieving a balance between operational efficiency and environmental sustainability.
After determining the prior probabilities for each node, the analysis proceeds to evaluate the influence of each variable on the target variable, namely Smart Port–Blue Economy integration, using influence strength analysis. In GeNIe Academic 5.0, the model visualizes the strength of interactions among variables through arc thickness, where thicker arcs indicate stronger influence [5,45,46]. As shown in Figure 6, several smart port variables, such as regulatory enforcement, port community system (PCS), port operational efficiency, port governance quality, port productivity, logistics reliability, and digital infrastructure readiness, exert relatively strong influence on their downstream nodes. Similarly, blue economy variables, including coastal employment, regional competitiveness, and the environmental compliance system, also demonstrate a strong influence within the network.
For example, regulatory enforcement significantly influences port governance quality, while port operational efficiency plays a critical role in enhancing port productivity and reducing vessel turnaround time. These patterns indicate that these variables serve as key drivers of the performance of a sustainable smart port system.
The study also quantifies the influence strength of each node using Euclidean distance, with detailed results presented in Table 24.
As shown in Table 24, within the smart port dimension, port operational efficiency and logistics reliability exhibit the highest average influence values. Port operational efficiency strongly influences port productivity in the BBN model, with an average value of 0.52 and a maximum of 0.66. This finding confirms that improving operational efficiency directly enhances port performance, particularly through optimized service time and more effective resource utilization [7,14,16,22,30].
The next highest influence occurs in the relationship between logistics reliability and island connectivity, with an average value of 0.44 and a maximum of 0.57. This result highlights the critical role of reliable logistics systems in strengthening inter-island connectivity, especially in archipelagic regions that depend heavily on efficient goods distribution and mobility. This finding aligns with previous studies that emphasize the importance of integrated and reliable logistics systems for enhancing regional connectivity and reducing spatial disparities [3,28].
Within the blue economy dimension, the environmental compliance system and coastal employment exhibit the highest influence values. The environmental compliance system strongly affects marine ecosystem health, with an average value of 0.47 and a maximum of 0.60. This finding underscores the critical role of environmental compliance in maintaining the sustainability of marine ecosystems as a core component of the blue economy framework [6,9]. Given that environmental compliance reflects adherence to environmental regulations in port operations, its strong influence on marine ecosystem health suggests that policy interventions targeting this variable can effectively enhance the sustainability performance of smart port systems.
The results indicate that the next-highest influence occurs in the relationship between coastal employment and coastal economic output, with an average of 0.30 and a maximum of 0.50. This result indicates that increased employment opportunities in coastal areas significantly contribute to higher economic output, both through rising household income and the expansion of marine-based economic activities. In the maritime economy, coastal labor is a key driver of sectors such as fisheries, maritime logistics, and small-scale marine enterprises, directly influencing productivity and value creation. This finding aligns with studies emphasizing that employment generation in marine sectors is essential for promoting inclusive and sustainable economic growth in coastal regions [3,27].
The highest influence score in the cross-dimensional aspect (Smart Port–Blue Economy interface) occurs in the relationship between regulatory enforcement and port governance quality. This result indicates that effective regulatory enforcement plays a critical role in strengthening governance structures within port systems, particularly by ensuring compliance, transparency, and accountability across port-related activities. Strong enforcement also enhances institutional capacity and reduces inefficiencies associated with weak governance, thereby promoting more coordinated and sustainable port management. This finding aligns with previous studies emphasizing that robust regulatory frameworks and effective enforcement mechanisms are key determinants of port governance performance and institutional effectiveness [23,28].
Furthermore, within the blue economy context, strengthened governance through regulatory enforcement ensures that port operations comply with environmental standards and sustainable maritime practices. As such, regulatory enforcement functions as a critical bridging mechanism that connects institutional governance in smart ports with broader sustainability objectives in the blue economy framework. This result also implies that policy interventions targeting regulatory strengthening can generate systemic impacts across both operational and environmental dimensions of port systems.
The influence strength analysis further identifies the variables with the highest scores as priority nodes for what-if analysis, a key advantage of the Bayesian Belief Network approach. This approach allows the study to simulate targeted interventions and systematically evaluate their effects on the target variable. Consequently, scenario analysis provides a deeper understanding of how changes in key drivers significantly impact overall system performance, including improvements in regional competitiveness. This capability supports evidence-based decision-making under uncertainty and facilitates the exploration of policy scenarios in complex maritime systems [2,19,21,44].

4.2. Scenario Analysis

This study uses scenario analysis to assess the impact of interventions on variables influencing the target variable, namely Smart Port–Blue Economy Integration. This approach allows dynamic evaluation of changes in system probabilities resulting from the provision of evidence at specific nodes in the Bayesian network. The five most influential variables represent three key aspects, as outlined in Table 24: port operational efficiency, logistics reliability, environmental compliance systems, coastal employment, and regulatory enforcement. The study selects these variables because they exhibit the highest influence values and function as key drivers within the system.
The scenario analysis is conducted in stages, by designating certain nodes as evidence (scored 100) to observe changes in other nodes, particularly the target variable.
In the first step, the model sets the port operational efficiency node to 100% as evidence. The status used is “good,” which reflects optimal port operational conditions, characterized by increased productivity, efficient ship service times, and minimal idle time. In this context, operational efficiency is a fundamental factor in improving logistics performance and reducing transportation costs, ultimately strengthening the competitiveness of the port system.
In the second step, the model sets the logistics reliability node to a “high” status, while retaining the initial probabilities of the other nodes. This condition represents a reliable logistics system, characterized by on-time delivery, consistent service, and minimal distribution disruptions. Logistics reliability is a key element in supporting island connectivity, as it reduces supply chain disruptions and enhances interregional integration.
In the third step, both the port operational efficiency and the logistics reliability nodes were established simultaneously as evidence. This scenario depicts a mature smart port, where a reliable, integrated logistics system supports operational efficiency. This combination reflects the synergy between improving the port’s internal performance and its external connectivity, which together strengthen the maritime transportation system and drive overall supply chain efficiency.
In the fourth step, the model sets the environmental compliance system node to 100% with a “strong” status. This condition reflects the existence of an effective environmental management system, including compliance with environmental regulations, pollution control, and the implementation of green port practices. This system plays a crucial role in maintaining the health of the marine ecosystem and ensuring that port activities do not cause environmental degradation.
In the fifth step, the model sets the coastal employment node as evidence with a “high” status. This condition reflects a significant increase in employment opportunities in coastal areas, driven by maritime economic activities such as fisheries, seafood processing, and logistics services. High coastal employment rates reflect economic inclusiveness and directly contribute to increased income and the well-being of local communities.
In the sixth step, both the environmental compliance system and the coastal employment nodes were established simultaneously as evidence. This scenario represents the balanced implementation of blue economy principles, where coastal economic growth goes hand in hand with marine environmental protection. This synergy between ecological and socioeconomic aspects demonstrates that sustainability focuses not only on conservation but also on the creation of inclusive economic value.
In the seventh step, the study sets the regulatory enforcement node to 100% with a “strong” status. This condition reflects effective regulatory enforcement, including compliance with port policies, oversight of operational activities, and consistency in rule implementation. Strong regulatory enforcement strengthens port governance quality and enhances coordination among stakeholders.
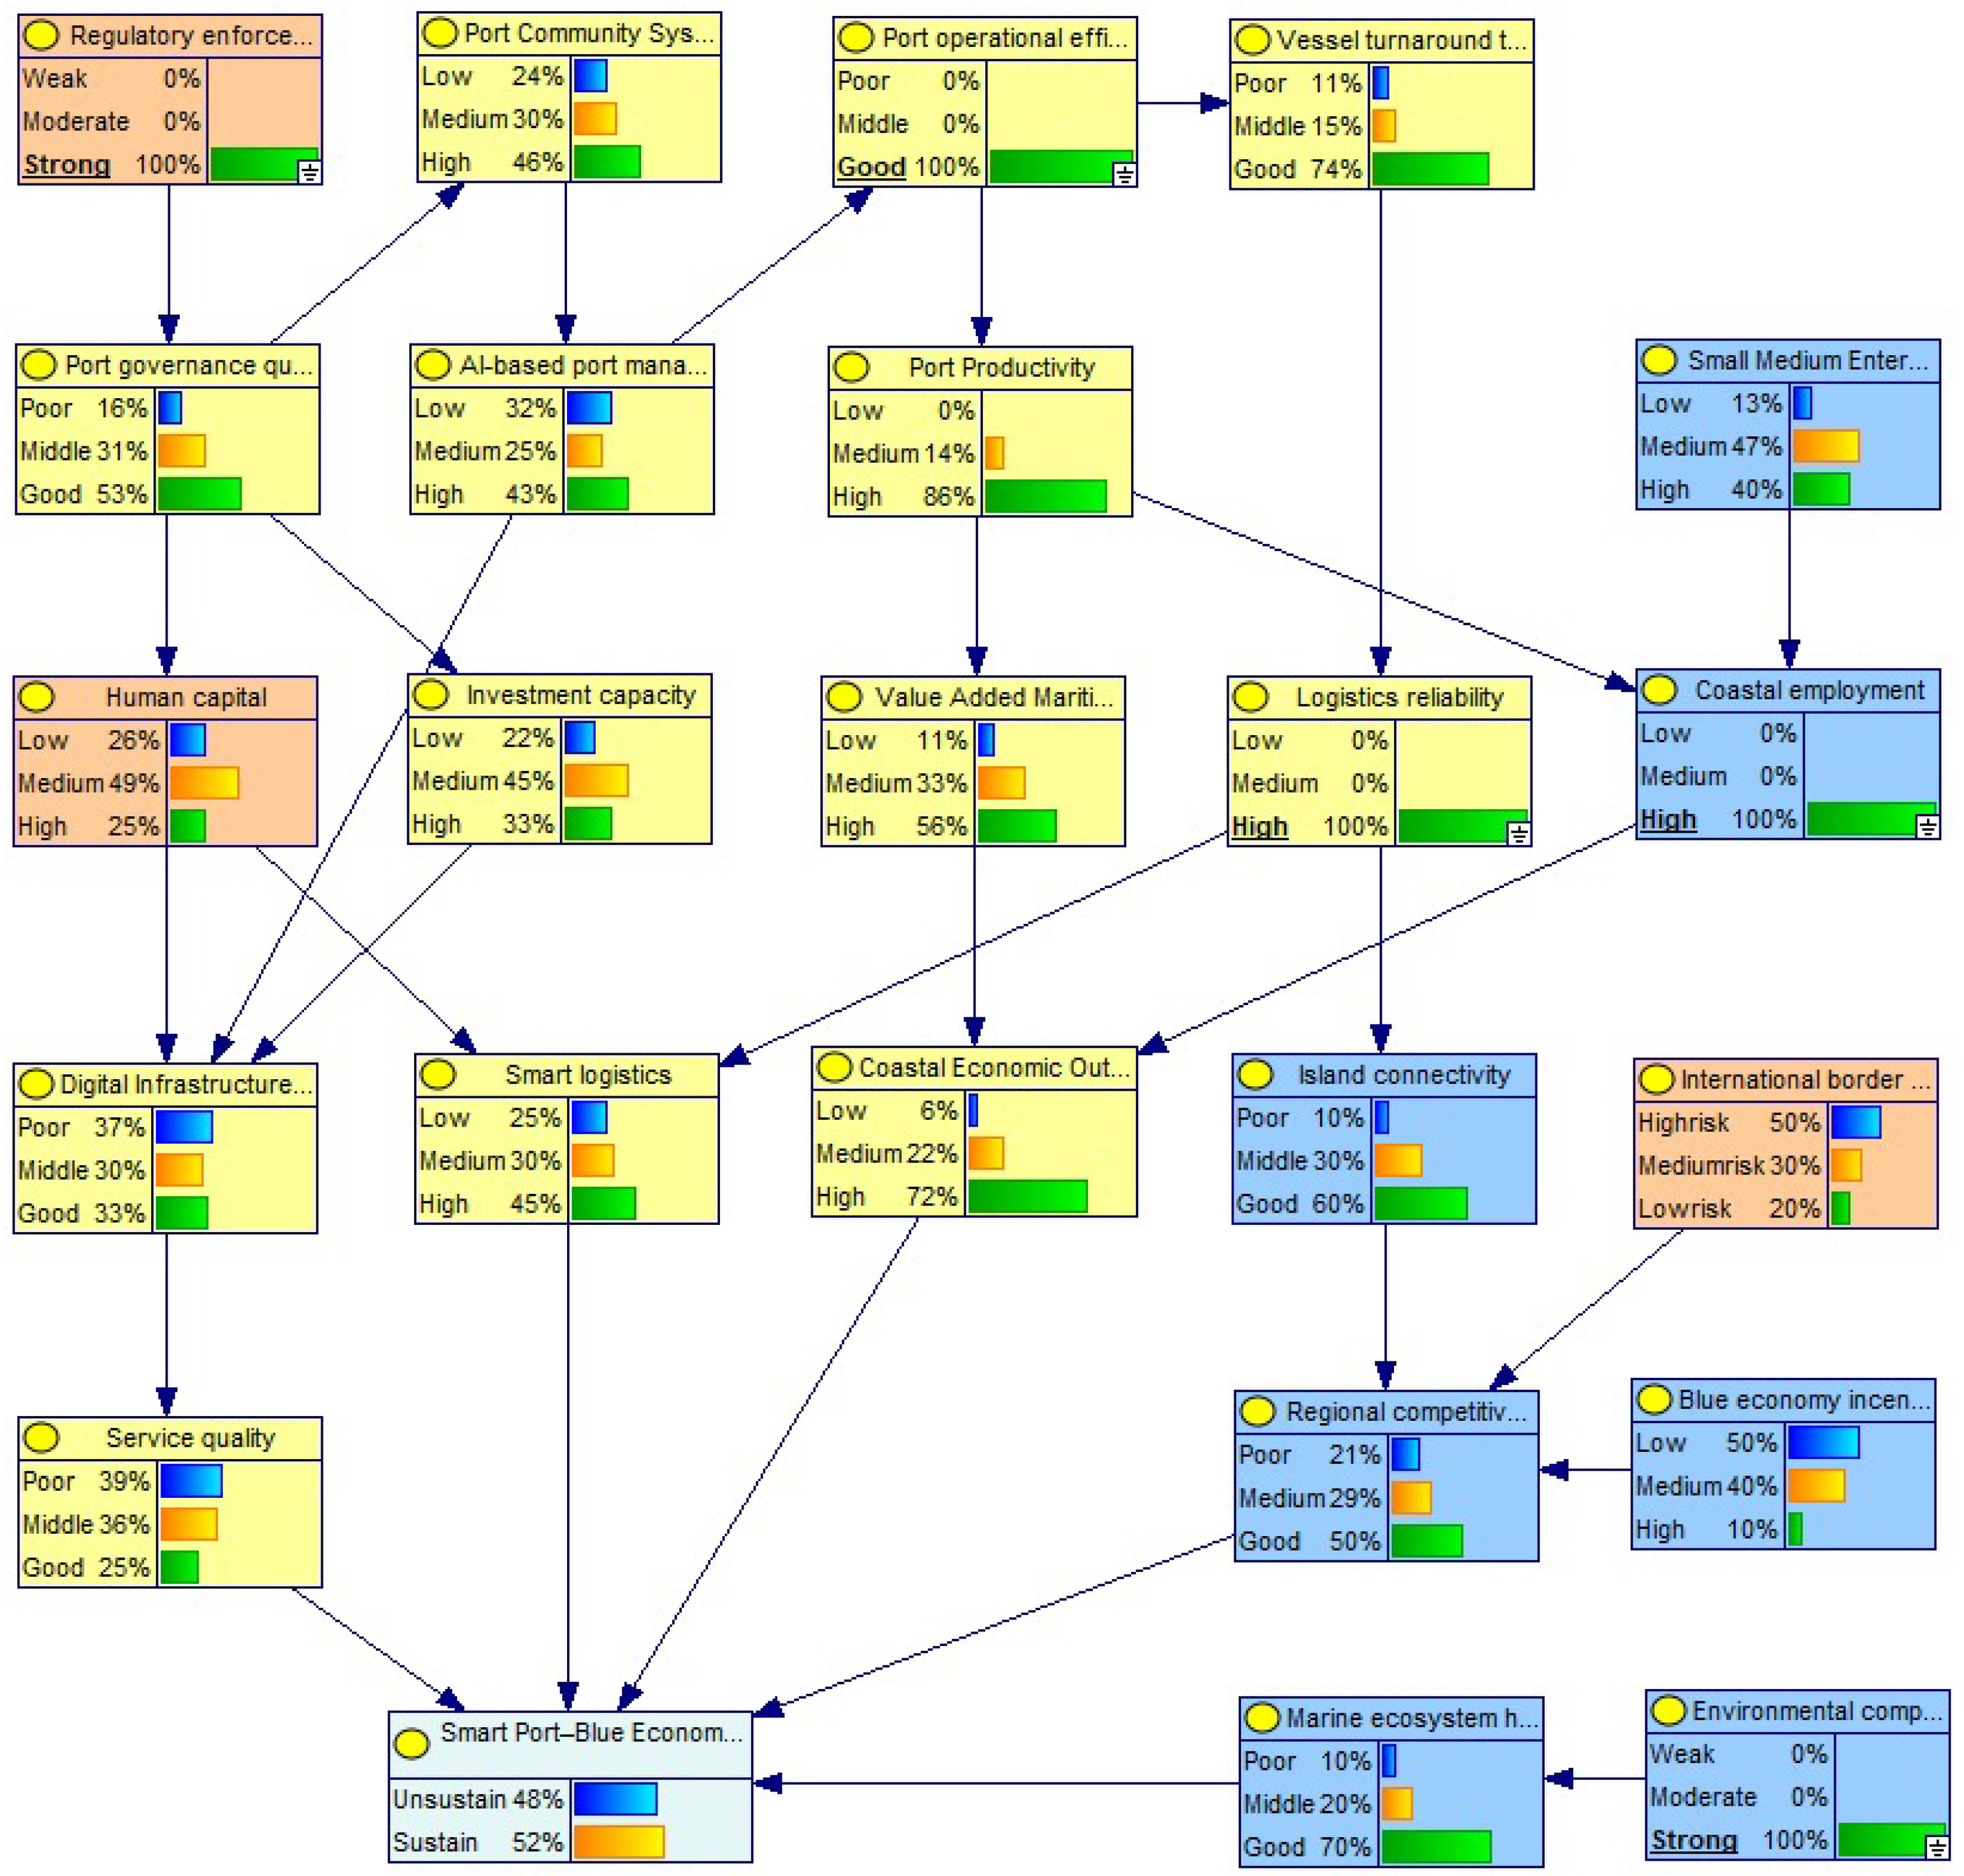
In the final stage, the model simultaneously sets all key nodes (port operational efficiency, logistics reliability, environmental compliance system, coastal employment, and regulatory enforcement) as evidence. This scenario represents the full integration of smart ports and the blue economy, where operational efficiency, logistics reliability, environmental sustainability, economic inclusiveness, and strong governance interact synergistically. This condition reflects a port system that is not only technically and economically superior, but also ecologically and socially sustainable. Figure 7 illustrates this stage, where the model sets all five key nodes to their maximum values, and Table 24 presents the overall results of the scenario analysis.
The results of the scenario analysis in Table 25 show that interventions on key variables have different impacts on the system, both partially and simultaneously. In general, increasing the values of each variable serves as evidence that it can increase the probability of the target variable “Smart Port–Blue Economy integration” albeit with varying degrees of influence.
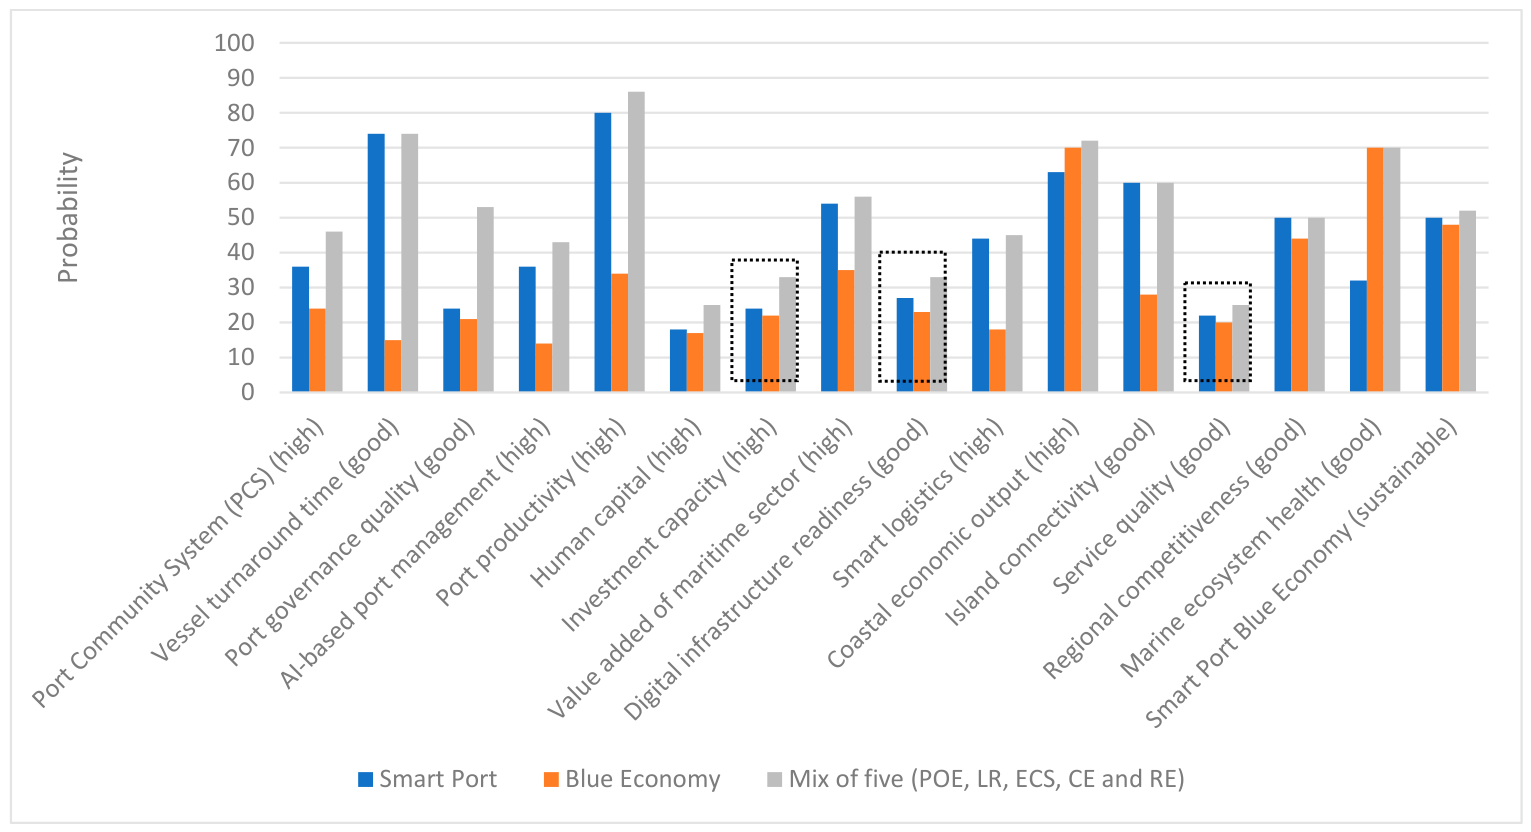
Regarding the smart port aspect, interventions on port operational efficiency (POE) result in significant improvements in several derived variables, particularly port productivity, which increases from 23% to 80%. This confirms that operational efficiency is the primary driver of port performance. Meanwhile, interventions in logistics reliability (LR) demonstrate a strong impact on island connectivity (from 27% to 60%) and smart logistics (from 18% to 43%), indicating the critical role of logistics reliability in strengthening connectivity within the archipelago. When these two variables are combined (POE and LR), a stronger synergistic effect occurs, for example, in vessel turnaround time, which increases sharply by up to 74%, as well as consistent improvements in other performance variables. This demonstrates that the integration of operational efficiency and logistics reliability is the primary foundation for smart port development.
In the context of the blue economy, interventions in the environmental compliance system (ECS) have a dominant impact on marine ecosystem health, which increased from 32% to 70%. This indicates that environmental compliance is a key factor in maintaining the sustainability of marine ecosystems. On the other hand, an increase in coastal employment (CE) has a direct impact on coastal economic output, which rose from 52% to 70%, reflecting the close relationship between job creation and coastal economic growth. When these two variables are combined (ECS and CE), a balance between the ecological and economic dimensions is evident, where both marine ecosystem health and coastal economic output are at high levels (70%). This reaffirms that an effective blue economy approach must be able to simultaneously integrate environmental sustainability and economic inclusivity.
Across dimensions, interventions in regulatory enforcement (RE) demonstrate a highly significant impact on port governance quality, which increases from 21% to 50%. This reinforces previous findings that regulatory enforcement is a key factor in improving port governance quality. Additionally, RE also enhances investment capacity and digital infrastructure readiness, indicating that strong governance can create a more conducive environment for investment and digital transformation.
In the combined scenario involving the five key variables (POE, LR, ECS, CE, and RE), the probability of Smart Port–Blue Economy Integration increases from 45% to approximately 52%. Although the numerical increase appears moderate, within a probabilistic complex-system framework, this shift indicates a meaningful systemic transition under conditions characterized by strong structural inertia, institutional rigidity, and limited infrastructure readiness.
Therefore, the findings should not be interpreted as evidence of immediate large-scale transformation, but rather as an indication that integrated interventions across operational, environmental, and governance dimensions can gradually improve sustainability outcomes in archipelagic port systems. This implies that policy efforts should focus on coordinated, long-term reforms rather than isolated operational measures. The relatively moderate increase also suggests that long-term sustainability transformation requires structural improvements extending beyond operational interventions, including institutional strengthening, infrastructure investment, human capital development, and regional policy alignment.
Overall, these results confirm that a piecemeal approach is insufficient to achieve the integration of smart ports and the blue economy. Instead, holistic and integrated interventions across all aspects are required to produce a significant impact on the sustainability of port systems in archipelagic regions. Thus, future port development strategies must be designed by considering the interconnections among key variables within the system comprehensively, rather than on a sectoral basis.

4.3. Sensitivity Analysis

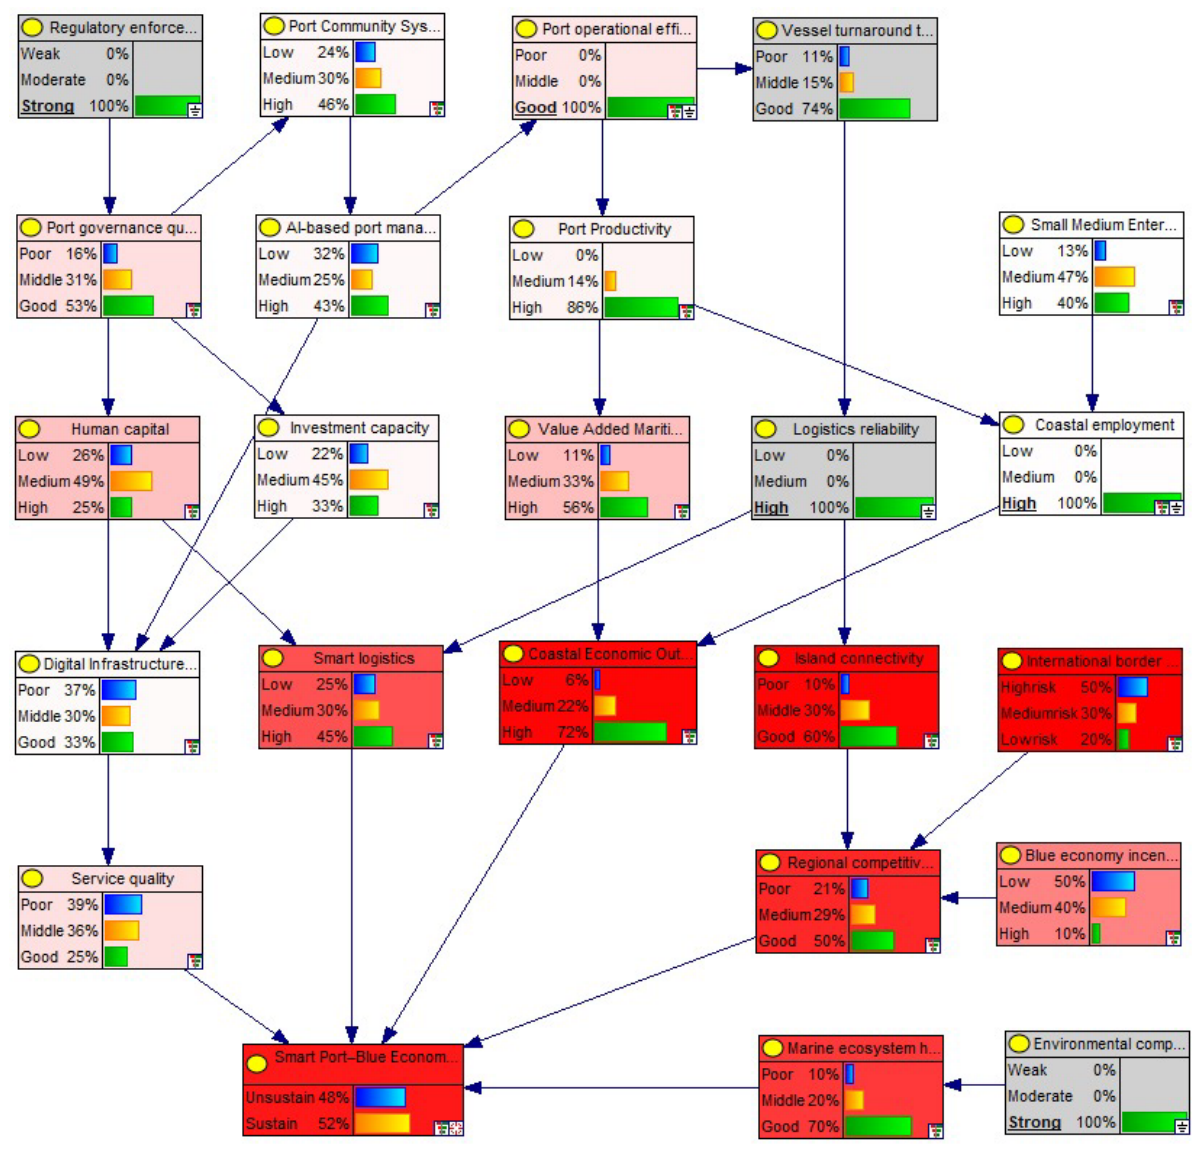
A sensitivity analysis was conducted to evaluate the extent to which changes in certain variables affect the probability of the target variable, namely Smart Port–Blue Economy Integration. Within the Bayesian Network framework, this analysis serves to identify the variables most responsive to parameter changes (sensitive nodes), so that they can be positioned as strategic intervention points (leverage points) within the system. Using the GeNIe Modeler software (Academic Version 5.0), sensitivity levels are visualized through color gradients, where red nodes indicate high sensitivity to changes in probability, as shown in Figure 8.
Based on this visualization, variables such as coastal economic output, regional competitiveness, island connectivity, and Smart Port–Blue Economy Integration themselves exhibit the highest sensitivity levels (marked by a dominant red color). This indicates that these variables are downstream outcome nodes significantly influenced by changes in upstream variables (upstream drivers), such as port operational efficiency, logistics reliability, coastal employment, and the environmental compliance system. In this context, small changes in upstream variables can result in significant changes in outcome variables, reflecting the characteristics of a probabilistic-based complex system [46].
Specifically, coastal economic output and marine ecosystem health show significant increases in the optimal scenario, underscoring the critical role of integrating economic and environmental aspects within the blue economy framework. Furthermore, high sensitivity in regional competitiveness and island connectivity indicates that port performance and logistics systems are key factors in enhancing the competitiveness of island regions [33,52].
Overall, the results of this sensitivity analysis indicate that outcome variables such as coastal economic output, regional competitiveness, and Smart Port–Blue Economy Integration are critical points in the system that are strongly influenced by key variables in the smart port, blue economy, and cross-dimensional aspects. Therefore, effective policy interventions need to focus on upstream variables that have a broad influence on the system, such as improving port operational efficiency, logistics reliability, environmental compliance, and strengthening governance through regulatory enforcement.
To assess the robustness of the Bayesian Network model against uncertainty in expert-derived probability estimates, a CPT perturbation analysis varied the CPT values of the five most influential nodes by ±10% while preserving the original network structure. The resulting changes in the probability of the target node, Smart Port–Blue Economy Integration, are presented in Table 26.
The results indicate a high degree of model robustness. Across all perturbation scenarios, the probability of Smart Port–Blue Economy Integration remained relatively stable, with maximum deviations ranging from 0.026 to 1.009 percentage points relative to the baseline of 44.876%. The largest change was observed for Logistics Reliability, while the Environmental Compliance System exhibited the smallest variation. Despite moderate perturbations in CPT values, the direction of the results, the relative importance of key variables, and the overall policy implications remained unchanged.
These findings confirm that the model is not overly sensitive to moderate uncertainty in expert-derived probabilities and that the study’s principal conclusions are robust across alternative CPT configurations. Therefore, the Bayesian Network provides a reliable basis for analyzing Smart Port–Blue Economy interactions and informing policy-oriented decision-making under uncertainty.
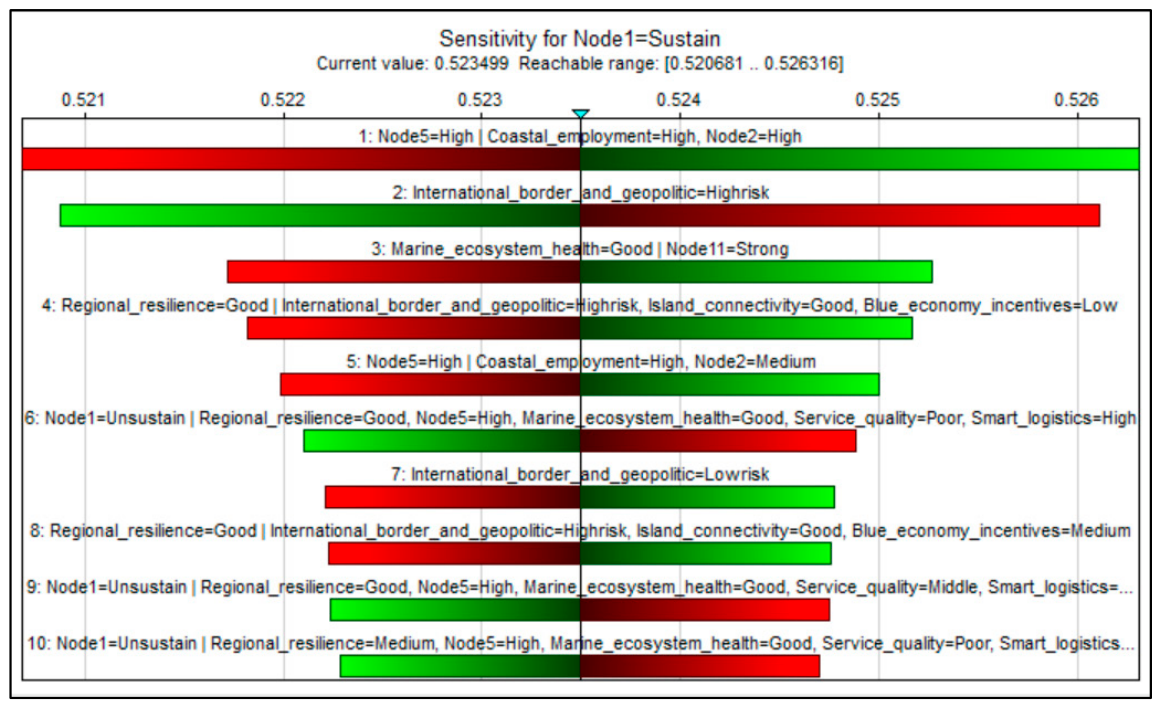
As illustrated in Figure 9, the marine ecosystem health variable has a significant influence on the probability of Smart Port–Blue Economy Integration, particularly when it is in a “good” condition and supported by a strong environmental compliance system. This combination consistently drives an increase in the probability of integration, as reflected by the positive direction of influence (green) in the diagram. Conversely, a decline in marine ecosystem quality or weak environmental compliance tends to reduce the probability of system sustainability, as indicated by the negative direction of influence (red). The probability of the target variable falls within a specific range, reflecting its sensitivity to changes in these variables.
The probability of Smart Port–Blue Economy Integration stands at approximately 52%. Additionally, the Tornado diagram also shows that the international border and geopolitics variables have a very strong influence, under both high- and low-risk conditions, on changes in the target probability. This indicates that external factors such as geopolitical stability and border dynamics play a crucial role in determining the success of smart port and blue economy integration, particularly in the context of an archipelagic region.
Furthermore, the combination of variables such as regional resilience, island connectivity, and blue economy incentives also exhibits a fairly high sensitivity, underscoring the importance of synergy between regional connectivity, policy support, and regional resilience in driving system integration. Meanwhile, the variables of service quality and smart logistics emerge as supporting factors that either strengthen or weaken the influence of the main variables, depending on the conditions prevailing within the system. Overall, these results indicate that the success of smart port–blue economy integration is not only determined by internal port factors but is also significantly influenced by external and environmental factors, thus requiring an adaptive and cross-sectoral policy approach.


5. Discussion and Policy Implications

5.1. Discussion

Sustainable port activities that take into account the coastal environment are considered crucial for driving economic sectors. The complexity, dynamism, and clarity of the issues require a comprehensive, systematic perspective and solutions to achieve the desired development. The results of this study confirm that integrating smart ports and the blue economy is inherently systemic and shaped by cross-dimensional interactions among operational performance, environmental sustainability, and governance. From the smart port perspective, the dominant roles of port operational efficiency and logistics reliability as primary drivers align with previous studies that identify these factors as key determinants of supply chain performance and trade competitiveness [28]. In this model, improvements in operational efficiency not only enhance productivity but also propagate to downstream variables such as regional connectivity and economic output, reinforcing the argument that smart port transformation provides the foundational layer for system integration.
From the blue economy perspective, variables such as environmental compliance systems and coastal employment play a crucial role in ensuring system sustainability. Environmental compliance directly contributes to improved marine ecosystem health, while coastal employment significantly influences coastal economic output, highlighting the importance of inclusive economic development in coastal regions. This finding is consistent with the blue economy framework, which emphasizes the balance between economic growth and environmental conservation [3,27]. However, the results also reveal a structural trade-off between improvements in marine ecosystem health and infrastructure development, where port expansion and intensified maritime activities may increase environmental pressure, requiring a careful balance between ecological protection and economic growth.
The role of cross-dimensional variables, particularly regulatory enforcement, provides an important theoretical contribution by demonstrating that governance functions as a bridging mechanism connecting technological systems with sustainability objectives. Strong regulatory enforcement enhances compliance, transparency, and institutional capacity, thereby indirectly strengthening system integration through improved governance quality [23]. Figure 10 further shows that several structural variables exhibit only marginal changes across scenarios. For example, human capital shows minimal variation, with values of 18% in the Smart Port and Blue Economy scenarios, and increases only slightly to 25% under the combined scenario. Similarly, digital infrastructure readiness shows limited improvement (27%, 23%, and 33%), while service quality remains relatively stagnant (22%, 20%, and 25%). Investment capacity also demonstrates constrained growth (24%, 22%, and 33%), indicating that improvements remain modest even under integrated interventions.
These limited changes reflect the structural rigidity of key variables within archipelagic systems, where multiple interdependent factors interact under conditions of uncertainty. Human capital development requires long-term investment in education and skills, while digital infrastructure depends on substantial capital investment, system integration, and regulatory support. Institutional reform and managerial capacity shape service quality, while risk, regulatory uncertainty, and limited economies of scale constrain investment capacity. These structural constraints explain why partial interventions produce only marginal improvements in the probability of Smart Port–Blue Economy Integration.
The integrated intervention scenario raises the likelihood of Smart Port–Blue Economy Integration, but key barriers remain: human capital, digital infrastructure readiness, and investment capacity. These are structural constraints that short-term operational or regulatory fixes cannot solve. Operational factors may change quickly in response to policy, but improving human capital requires sustained investments in education, technical training, and institutional learning. Likewise, expanding digital infrastructure requires long-term capital expenditures, technology upgrades, and coordination across organizations. Investment capacity depends on overall economic conditions, investor confidence, and access to financing. Transitioning to sustainable smart ports is not just a technical or management issue; it is a long-term process demanding coordinated investment in people, technology, and finance. Policymakers must pair immediate efficiency measures with strategic long-term programs to build workforce capabilities, expand digital infrastructure, and boost investment resources, securing lasting smart port development.
Conversely, integrated scenarios involving key variables—port operational efficiency, logistics reliability, environmental compliance systems, coastal employment, and regulatory enforcement—have the greatest impact and show strong synergistic effects. This finding supports the system integration perspective in port development, which emphasizes coordinated, cross-sectoral, and multi-stakeholder approaches to achieve sustainable transformation [23].
In a broader context, these findings highlight the complexity of port development in archipelagic regions, where geographical fragmentation, connectivity limitations, and environmental vulnerability create systemic constraints and trade-offs. Integrating smart ports and blue economy principles offers a strategic pathway to enhance regional competitiveness while maintaining ecological sustainability; however, this integration requires long-term, coordinated, and multidimensional interventions. This study has limitations, particularly the reliance on expert judgment and context-specific modeling. Future research should incorporate broader empirical data, integrate spatial and temporal approaches, and test the model across different archipelagic contexts to enhance generalizability and theoretical contributions.

5.2. Policy Implications

The findings of this study suggest that policymakers should prioritize integrated interventions over isolated sectoral initiatives when promoting Smart Port–Blue Economy Integration. Given the influence of Port Operational Efficiency (POE) and Logistics Reliability (LR) on overall system performance, efforts should focus on improving port operational processes, reducing vessel turnaround time, enhancing cargo handling efficiency, and strengthening inter-island logistics networks. Investments in smart logistics systems, multimodal transport integration, and real-time operational monitoring can support more reliable and efficient maritime services, particularly in archipelagic regions where connectivity remains a critical challenge.
The significant role of the Environmental Compliance System (ECS) highlights the need to strengthen environmental governance within port operations. Policymakers should promote environmental performance monitoring, emission control mechanisms, waste management systems, and green port certification programs. These measures can support marine ecosystem health and the long-term sustainability of maritime economic activities while reinforcing alignment between port development and blue economy objectives.
The findings also underscore the importance of Coastal Employment (CE) as a key outcome of the blue economy. Port development policies should be designed to generate broader socioeconomic benefits for coastal communities. This may include supporting maritime-related small and medium enterprises, expanding vocational training programs, promoting local workforce participation in port activities, and facilitating value-added maritime industries that create employment opportunities while maintaining environmental sustainability.
Furthermore, Regulatory Enforcement (RE) emerged as a critical leverage point connecting governance, operational performance, and environmental sustainability. Strengthening regulatory enforcement requires integrated governance frameworks involving port authorities, logistics operators, customs agencies, environmental institutions, and local governments. Clear regulatory standards, transparent monitoring mechanisms, and stronger institutional coordination are essential for the effective implementation of smart port and blue economy initiatives.
Overall, the results indicate that sustainable port transformation in archipelagic regions requires a holistic policy approach that addresses operational efficiency, logistics reliability, environmental compliance, and regulatory effectiveness, thereby supporting coastal economic inclusion. Such an integrated strategy is expected to generate broader impacts on coastal economic output, regional competitiveness, and the long-term sustainability of maritime development.

6. Conclusions

This study develops a Bayesian Network-based framework to analyze the integration of smart port and blue economy concepts in supporting sustainable maritime development in archipelagic regions. The results indicate that the system is shaped by the dynamic interaction among operational efficiency, environmental sustainability, and institutional governance. Variables such as Port Operational Efficiency (POE) and Logistics Reliability (LR) emerge as key drivers in the smart port aspect, while the Environmental Compliance System (ECS) and Coastal Employment (CE) play a significant role in the blue economy aspect. Additionally, Regulatory Enforcement (RE) serves as a crucial linking variable in strengthening governance and integrating the technological and sustainability dimensions.
The results of the scenario analysis indicate that integrated interventions targeting key variables have the most significant impact on enhancing Smart Port–Blue Economy Integration, compared to partial interventions. This underscores the importance of a holistic and cross-sectoral development approach in port development. Meanwhile, sensitivity analysis indicates that outcome variables such as coastal economic output, regional competitiveness, and the overall sustainability of the system are highly responsive to changes in upstream variables, thereby underscoring the importance of prioritizing interventions at leverage points within the system.
From a policy perspective, these findings indicate that improving port performance cannot be achieved through sectoral or piecemeal approaches. Integrated efforts are needed that encompass improving operational efficiency, strengthening logistics systems, ensuring compliance with environmental regulations, expanding coastal employment opportunities, and strengthening regulatory enforcement. This approach is increasingly relevant in the context of archipelagic regions facing challenges of limited connectivity and environmental vulnerability.
Although the proposed framework offers broader conceptual relevance for sustainable port development, the empirical configuration of this study remains context-specific to the Riau Islands Province. The unique characteristics of archipelagic regions, including fragmented geography, maritime dependence, digital infrastructure disparities, and geopolitical exposure, substantially influence the network structure and probabilistic relationships within the model. Consequently, direct generalization to large continental hub ports or highly industrialized maritime economies should be undertaken cautiously. Future studies are encouraged to apply the framework across different geographical and institutional settings to evaluate model transferability and improve comparative validation.
Overall, this study offers both theoretical and practical contributions by proposing a systemic and probabilistic modeling approach to understanding the interactions between smart port development and blue economy principles. The framework developed can serve as a decision-support tool for policymakers and stakeholders in designing more effective, integrated, and sustainable maritime development strategies.

Author Contributions

Conceptualization, A.F.; methodology, A.F.; software, T.R. and A.F.; validation, A.F., K.S. and G.Y.; formal analysis, T.R. and K.S.; investigation, T.R.; resources, K.S.; data curation, A.F. and T.R.; writing—original draft preparation, T.R. and K.S.; writing—review and editing, A.F. and T.R.; visualization, T.R. and K.S.; supervision, A.F. and G.Y.; project administration, T.R. and K.S.; funding acquisition, A.F. All authors have read and agreed to the published version of the manuscript.

Funding

This research is funded by the Indonesian Endowment Fund for Education (LPDP) on behalf of the Indonesian Ministry of Higher Education, Science and Technology and managed under the EQUITY Program (Contract No: 4297/B3/DT.03.08/2025 and No: 42011/IT3/HK.07.00-4/P/B/2025).

Institutional Review Board Statement

Ethics review and approval were waived for this study by the Institutional Committee in accordance with the Indonesian National Health Research Ethics Guidelines (https://kepkn.kemkes.go.id/assets/img/keppkn/file/BUKU_PEDOMAN_DAN_STANDAR_ETIK_PENELITIAN_DAN_PENGEMBANGAN_KESEHATAN_NASIONAL(KEPKN).pdf, accessed on 30 June 2026), as the study was based on expert consultations conducted to support system modeling and policy recommendations, without intervention or experimentation involving human subjects or the collection of personally identifiable information.

Informed Consent Statement

Informed consent for participation was obtained from all subjects involved in the study.

Data Availability Statement

The original contributions presented in this study are included in the article. Further inquiries can be directed to the corresponding author.

Acknowledgments

This research is funded by the Indonesian Endowment Fund for Education (LPDP) on behalf of the Indonesian Ministry of Higher Education, Science and Technology and managed under the EQUITY Program (Contract No: 4297/B3/DT.03.08/2025 and No: 42011/IT3/HK.07.00-4/P/B/2025).

Conflicts of Interest

The authors declare no conflicts of interest.

Appendix A

Table A1. Input data used for CPT node 14.
Node 14: Digital Infrastructure Readiness
AI-based port managementLMH
Human capitalLMHLMHLMH
Investment capacityLMHLMHLMHLMHLMHLMHLMHLMHLMH
poor0.800.600.100.600.200.200.300.250.150.200.250.100.100.200.100.200.200.100.150.050.100.050.100.050.200.100.05
middle0.200.300.200.200.400.300.200.200.300.300.200.300.400.250.300.250.200.300.250.300.200.300.200.200.200.200.15
good0.000.100.700.200.400.500.500.550.550.500.550.600.500.550.600.550.600.600.600.650.700.650.700.750.600.700.80
Note: L = Low; M = Medium; H = High.
Table A2. Input data used for CPT node 20.
Node 20: Regional Competitiveness
International border & geopoliticsHRMRLR
Island connectivityPMGPMGPMG
Blue economy incentivesLMHLMHLMHLMHLMHLMHLMHLMHLMH
Poor0.700.400.200.300.300.250.250.200.300.200.150.100.100.000.150.200.250.150.200.150.100.050.150.050.100.100.00
Middle0.300.300.200.300.250.300.300.350.200.300.350.400.400.500.300.300.200.250.300.300.250.300.150.200.200.150.20
Good0.000.300.600.400.450.450.450.450.500.500.500.500.500.500.550.500.550.600.500.550.650.650.700.750.700.750.80
Notes: HR = High Risk; MR = Medium Risk; LR = Low Risk. P = Poor; M = Medium; G = Good.
Figure A1. Input data used for CPT node 24.
Sustainability 18 06923 g0a1

References

  1. Heilig, L.; Schwarze, S.; Voß, S. An Analysis of Digital Transformation in the History and Future of Modern Ports. In Proceedings of the 50th Hawaii International Conference on System Sciences, Hilton Waikoloa Village, HI, USA, 4–7 January 2017; pp. 1341–1350. [Google Scholar]
  2. Molavi, A.; Lim, G.J.; Race, B. A framework for building a smart port and smart port index. Int. J. Sustain. Transp. 2019, 14, 686–700. [Google Scholar] [CrossRef]
  3. UNCTAD. Review of Maritime Transport; United Nations Publications: New York, NY, USA, 2023. Available online: https://shop.un.org/ (accessed on 20 April 2026).
  4. Caldeirinha, V.; Nabais, J.L.; Pinto, C. Port Community Systems: Accelerating the Transition of Seaports toward the Physical Internet—The Portuguese Case. J. Mar. Sci. Eng. 2022, 10, 152. [Google Scholar] [CrossRef]
  5. Ji, Y.; Lu, J.; Su, W.; Xie, D. Assessing Port Connectivity from the Perspective of the Supply Chain: A Bayesian Network-Based Integrated Approach. Sustainability 2025, 17, 6643. [Google Scholar] [CrossRef]
  6. Puig, M.; Wooldridge, C.; Darbra, R.M. Identification and selection of Environmental Performance Indicators for sustainable port development. Mar. Pollut. Bull. 2014, 81, 124–130. [Google Scholar] [CrossRef] [PubMed]
  7. Coșofreț, D.; Volintiru, O.; Avram, R.; Popa, A.; Deliu, F.; Popa, C. Integrated Logistics and Energy Performance Assessment of Container Ships for Sustainable Maritime Operations. Sustainability 2026, 18, 4279. [Google Scholar] [CrossRef]
  8. Voyer, M.; Quirk, G.; Mcilgorm, A.; Azmi, K.; Quirk, G.; Mcilgorm, A.; Azmi, K. Shades of blue: What do competing interpretations of the Blue Economy mean for oceans governance? J. Environ. Policy Plan. 2018, 20, 595–616. [Google Scholar] [CrossRef]
  9. Lee, K.; Noh, J.; Seong, J. The Blue Economy and the United Nations’ sustainable development goals: Challenges and opportunities. Environ. Int. 2020, 137, 105528. [Google Scholar] [CrossRef] [PubMed]
  10. Parhamfar, M.; Sadeghkhani, I.; Adeli, A.M. Towards the application of renewable energy technologies in green ports: Technical and economic perspectives. IET Renew. Power Gener. 2023, 17, 3120–3132. [Google Scholar] [CrossRef]
  11. Roh, S.; Thai, V.V.; Wong, Y.D. Towards Sustainable ASEAN Port Development: Challenges and Opportunities for Vietnamese Ports. Asian J. Shipp. Logist. 2016, 32, 107–118. [Google Scholar] [CrossRef]
  12. González-Cancelas, N.; Guil López, J.J.; Vaca-Cabrero, J.; Camarero-Orive, A. Toward Smart and Sustainable Port Operations: A Blue Ocean Strategy Approach for the Spanish Port System. J. Mar. Sci. Eng. 2025, 13, 872. [Google Scholar] [CrossRef]
  13. Hossain, T.; Adams, M.; Walker, T.R. Role of sustainability in global seaports. Ocean Coast. Manag. 2021, 202, 105435. [Google Scholar] [CrossRef]
  14. Twrdy, E.; Zanne, M. Improvement of the sustainability of ports logistics by the development of innovative green infrastructure solutions. Transp. Res. Procedia 2020, 45, 539–546. [Google Scholar] [CrossRef]
  15. Kotowska, I. Policies Applied by Seaport Authorities to Create Sustainable Development in Port Cities. Transp. Res. Procedia 2016, 16, 236–243. [Google Scholar] [CrossRef]
  16. Chen, J.; Huang, T.; Xie, X.; Lee, P.T.-W.; Hua, C. Constructing Governance Framework of a Green and Smart Port. J. Mar. Sci. Eng. 2019, 7, 83. [Google Scholar] [CrossRef]
  17. Basulo-Ribeiro, J.; Pimentel, C.; Teixeira, L. What is known about smart ports around the world? A benchmarking study. Procedia Comput. Sci. 2024, 232, 1748–1758. [Google Scholar] [CrossRef]
  18. Behdani, B. Port 4.0: A conceptual model for smart port digitalization. Transp. Res. Procedia 2023, 74, 346–353. [Google Scholar] [CrossRef]
  19. Pham, T.Y. A smart port development: Systematic literature and bibliometric analysis. Asian J. Shipp. Logist. 2023, 39, 57–62. [Google Scholar] [CrossRef]
  20. Zou, Y.; Xiao, G.; Li, Q.; Biancardo, S.A. Intelligent Maritime Shipping: A Bibliometric Analysis of Internet Technologies and Automated Port Infrastructure Applications. J. Mar. Sci. Eng. 2025, 13, 979. [Google Scholar] [CrossRef]
  21. Ugrinov, S.; Ćoćkalo, D.; Bakator, M.; Stanisavljev, S. Literature review of integrating sustainability and digital innovation in waterway transport and maritime logistics. J. Appl. Eng. Sci. 2025, 23, 359–373. [Google Scholar] [CrossRef]
  22. Errachdi, H.; Felis, I.; Madrid, E.; Martínez, R. Bridging the Gap: Challenges and Opportunities of IoT and Wireless Sensor Networks in Marine Environmental Monitoring. In Proceedings of the ECSA 2023; MDPI: Basel, Switzerland, 2023; Volume 58, p. 102. [Google Scholar] [CrossRef]
  23. Acciaro, M.; Ghiara, H.; Cusano, M.I. Energy management in seaports: A new role for port authorities. Energy Policy 2014, 71, 4–12. [Google Scholar] [CrossRef]
  24. Lam, J.S.L.; Yap, W.Y. A Stakeholder Perspective of Port City Sustainable Development. Sustainability 2019, 11, 447. [Google Scholar] [CrossRef]
  25. Smith-Godfrey, S. Defining the Blue Economy. Marit. Aff. J. Natl. Marit. Found. India 2016, 12, 58–64. [Google Scholar] [CrossRef]
  26. James, N.; Blythe, J.; Sandrine, C.; Campero, C. Blue growth and blue justice: Ten risks and solutions for the ocean economy. Mar. Policy 2021, 125, 104387. [Google Scholar] [CrossRef]
  27. World Bank Group. The Potential of the Blue Economy Increasing Long-Term Benefits of the Sustainable Use of Marine Resources for Small Island Developing States and Coastal Least Developed Countries; United Nations: New York, NY, USA, 2017. Available online: http://hdl.handle.net/10986/26843 (accessed on 25 April 2026).
  28. Notteboom, T.E.; Rodrigue, J.-P. Port regionalization: Towards a new phase in port development. Marit. Policy Manag. 2005, 32, 297–313. [Google Scholar] [CrossRef]
  29. Yigitcanlar, A.T.; Foth, M. Can cities become smart without being sustainable? A systematic review of the literature. Sustain. Cities Soc. 2018, 45, 348–365. [Google Scholar] [CrossRef]
  30. Nguyen, P.N.; Pham, T.Y. Assessing the impact of digital transformation on port efficiency and market positioning in Southeast Asia container port system. Asian J. Shipp. Logist. 2026, 42, 15–23. [Google Scholar] [CrossRef]
  31. Mosavi, A.; Ozturk, P.; Chau, K.W. Flood prediction using machine learning models: Literature review. Water 2018, 10, 1536. [Google Scholar] [CrossRef]
  32. Caldeirinha, V.; Felício, J.A.; Pinho, T.; Rodrigues, R. Fuzzy-Set QCA on Performance and Sustainability Determinants of Ports Supporting Floating Offshore Wind Farms. Sustainability 2024, 16, 2947. [Google Scholar] [CrossRef]
  33. World Bank. Oceans for Prosperity: Reforms for a Blue Economy in Indonesia; World Bank: Washington, DC, USA, 2021. Available online: https://www.worldbank.org/en/news/press-release/2021/03/25/sustainable-ocean-economy-key-for-indonesia-prosperity (accessed on 25 April 2026).
  34. Elliott, M.; Borja, Á.; McQuatters-Gollop, A.; Mazik, K.; Birchenough, S.; Andersen, J.H.; Painting, S.; Peck, M. Force majeure: Will climate change affect our ability to attain Good Environmental Status for marine biodiversity? Mar. Pollut. Bull. 2015, 95, 7–27. [Google Scholar] [CrossRef] [PubMed]
  35. Sahjaya, A.; Yusliandi, R.; Siregar, L.D.L. Tinjauan Literatur: Peranan Blue Economy dalam Meningkatkan Pendapatan Masyarakat Pesisir Melalui Sumber Daya Perikanan di Sumatera Utara. J. Manuhara Pus. Penelit. Ilmu Manaj. Bisnis 2025, 3, 17–27. [Google Scholar] [CrossRef]
  36. Aprizal, A.; Wiranatakusuma, D.B.; Razak, D.A. The Nexus Between Blue Economy and Sustainable Development: A Systematic Literature Review and Mapping Study. J. Econ. Res. Soc. Sci. 2025, 9, 47–64. [Google Scholar] [CrossRef]
  37. Hamzah, A. Strategi Implementasi Ekonomi Biru Berbasis Pelabuhan Perikanan Di Provinsi Banten. Pros. Semin. Nas. Perikan. Indones. 2022, 23, 295–305. [Google Scholar] [CrossRef]
  38. Rahmayanti, E.; Aryanie, I.; Munawarah; Malik, I.; Haura, G.A. Blue Economy: Perspektif dalam Peningkatan Nilai Ekonomi Indonesia. J. Penelit. Ekon. Akunt. 2025, 9, 47–60. [Google Scholar] [CrossRef]
  39. Prayuda, R. Strategi Pengembangan Konsep Blue Economy dalam Pemberdayaan Masyarakat Di Wilayah Pesisir. Indones. J. Int. Relat. 2020, 3, 46–64. [Google Scholar] [CrossRef]
  40. Hänninen, M. Bayesian networks for maritime traffic accident prevention: Benefits and challenges. Accid. Anal. Prev. 2014, 73, 305–312. [Google Scholar] [CrossRef] [PubMed]
  41. Molina Serrano, B.; González-Cancelas, N.; Soler-Flores, F.; Awad-Nuñez, S.; Camarero Orive, A. Use of Bayesian Networks to Analyze Port Variables in Order to Make Sustainable Planning and Management Decision. Logistics 2018, 2, 5. [Google Scholar] [CrossRef]
  42. Fan, L.; Wang, M.; Yin, J. The impacts of risk level based on PSC inspection deficiencies on ship accident consequences. Res. Transp. Bus. Manag. 2019, 33, 100464. [Google Scholar] [CrossRef]
  43. Hossain, N.U.I.; Nur, F.; Hosseini, S.; Jaradat, R.; Marufuzzaman, M.; Puryear, S.M. A Bayesian network based approach for modeling and assessing resilience: A case study of a full service deep water port. Reliab. Eng. Syst. Saf. 2019, 189, 378–396. [Google Scholar] [CrossRef]
  44. Ariyani, N.; Fauzi, A. Unlocking Sustainable Rural Tourism to Support Rural Development: A Bayesian Approach to Managing Water-Based Destinations in Indonesia. Sustainability 2024, 16, 5506. [Google Scholar] [CrossRef]
  45. Suhendarwan, B.; Fauzi, A. Bayesian Network Analysis of Policing Governance: Implications for Mining and Regional Sustainability. Sustainability 2026, 18, 1217. [Google Scholar] [CrossRef]
  46. Gal, Y.; Ghahramani, Z. Dropout as a Bayesian Approximation: Representing Model Uncertainty in Deep Learning. In Proceedings of the 33rd International Conference on Machine Learning, New York, NY, USA, 19–24 June 2016; PMLR: San Francisco, CA, USA, 2016; Volume 48, Available online: https://proceedings.mlr.press/v48/gal16.html (accessed on 28 April 2026).
  47. Damanik, S.P.; Alfiantri, R.; Farriyadini, M. Navigasi Strategis: Analisis SWOT Kebijakan Maritim Global di Provinsi Kepulauan Riau. J. Relasi Publik 2024, 2, 1–8. [Google Scholar] [CrossRef]
  48. Amir, R. Challenges and Potential of Blue Economy in Supporting Sustainable Development in Luwu Raya. Neo J. Econ. Soc. Humanit. 2025, 4, 259–269. [Google Scholar] [CrossRef]
  49. Sholeh, C.; Kurnianingsih, F.; Firman, F.; Azizi, O.R.; Setiawan, R. Kebijakan dan Tata Kelola Maritim Provinsi Kepulauan Riau Menuju Poros Maritim Dunia. Minist. J. Birokrasi Pemerintahah Drh. 2023, 5, 1–18. [Google Scholar] [CrossRef]
  50. Sari, Y.A.; Pamadi, M. The Smart Port Concept of Batu Ampar Port in Batam. IOP Conf. Ser. Earth Environ. Sci. 2019, 343, 012095. [Google Scholar] [CrossRef]
  51. Geospatial Information Agency of Indonesia. Atlas of Riau Islands by Geospatial Information Agency of Indonesia. 2022. Available online: https://commons.wikimedia.org/wiki/File:Atlas_SMP_BIG_-_Kepulauan_Riau.svg (accessed on 28 April 2026).
  52. Felício, J.A.; Rodrigues, R.; Caldeirinha, V. Green Shipping Effect on Sustainable Economy and Environmental Performance. Sustainability 2021, 13, 4256. [Google Scholar] [CrossRef]
  53. Caldeirinha, V.; Felício, J.A.; Salvador, A.S.; Nabais, J.; Pinho, T. The impact of port community systems (PCS) characteristics on performance. Res. Transp. Econ. 2020, 80, 100818. [Google Scholar] [CrossRef]
  54. Caldeirinha, V.; Felício, J.A.; Pinho, T. Role of Cargo Owner in Logistic Chain Sustainability. Sustainability 2023, 15, 10018. [Google Scholar] [CrossRef]
  55. Lopes, L.S.; Nabais, J.L.; Pinto, C.; Caldeirinha, V.; Pinho, T. Essential Competencies in Maritime and Port Logistics: A Study on the Current Needs of the Sector. Sustainability 2025, 17, 2378. [Google Scholar] [CrossRef]
Figure 1. Research Location. Source: Atlas of Riau Islands by Geospatial Information Agency of Indonesia [51].
Sustainability 18 06923 g001
Figure 2. DAG Structure.
Sustainability 18 06923 g002
Figure 3. DAG structure diagram of the consensus results.
Sustainability 18 06923 g003
Figure 4. Workflow of Focus Group Discussions (FGDs), data collection, and analysis (adapted from [45,46]).
Sustainability 18 06923 g004
Figure 5. Initial system probabilities generated by the Bayesian Belief Network (BBN).
Sustainability 18 06923 g005
Figure 6. Key influence structure within the Bayesian Belief Network (BBN)-based DAG.
Sustainability 18 06923 g006
Figure 7. Evidence variable settings in the scenario analysis.
Sustainability 18 06923 g007
Figure 8. Identification of sensitive nodes based on the designation of other nodes as evidence.
Sustainability 18 06923 g008
Figure 9. Sensitivity indicators from the scenario analysis.
Sustainability 18 06923 g009
Figure 10. Comparative changes in structural variables under different scenarios.
Sustainability 18 06923 g010
Table 1. Participants of FGD.
ParticipantNumber of PeopleRole
Riau Islands Port EnterpriseOne personManage and develop port services in the Riau Islands region to increase local revenue and improve maritime transportation services.
Department of Energy and Mineral Resources Riau Islands ProvinceTwo personsRegulate government affairs in the fields of energy (electricity, oil and gas) and the management of mineral resources and mining.
Department of Transportation Riau Islands ProvinceTwo personsImplement policies in the fields of land, sea, and air transportation to ensure smooth inter-island connectivity.
Department of Communication and Informatics Riau Islands ProvinceTwo personsManaging public communications, statistical information, cryptography, and information technology development (e-government) in the region.
Department of Marine Affairs and Fisheries Riau Islands ProvinceThree personsManaging marine resources, empowering fishermen, aquaculture, and monitoring marine resources.
Department of Environment and Forestry Riau Islands ProvinceThree personsResponsible for environmental protection, waste management, and forest conservation within the province.
Department of Investment and Integrated One-Stop Services Riau Islands ProvinceTwo personsFacilitating investment and managing integrated licensing in a transparent and efficient manner.
Department of Public Works, Spatial Planning, and Land Affairs Riau Islands ProvinceOne personManaging physical infrastructure such as road construction, bridges, irrigation, and regional spatial planning.
Raja Ali Haji Maritime UniversityTwo personsPublic higher education institutions focused on human resource development and research, particularly in the maritime sector.
Table 2. Measurement framework for each node in the Bayesian network system.
Variable NodesMeasurement
1Regulatory enforcementWeak, Moderate, Strong
2Port Community System (PCS)Low, Medium, High
3Port operational efficiencyPoor, Middle, Good
4Vessel turnaround timePoor, Middle, Good
5Port governance qualityPoor, Middle, Good
6AI-based port managementLow, Medium, High
7Port productivityLow, Medium, High
8Small and Medium Enterprises (SME) growthLow, Medium, High
9Human capitalLow, Medium, High
10Investment capacityLow, Medium, High
11Value added of maritime sectorLow, Medium, High
12Logistics reliabilityLow, Medium, High
13Coastal employmentLow, Medium, High
14Digital infrastructure readinessPoor, Middle, Good
15Smart logisticsLow, Medium, High
16Coastal economic outputLow, Medium, High
17Island connectivityPoor, Middle, Good
18International border & geopoliticsHigh Risk, Medium Risk, Low risk
19Service qualityPoor, Middle, Good
20Regional competitivenessPoor, Middle, Good
21Blue economy incentivesLow, Medium, High
22Marine ecosystem healthPoor, Middle, Good
23Environmental compliance systemWeek, Moderate, Strong
24Smart port–blue economy integrationUnsustainable, Sustainable
Table 3. Input data used for CPT node 1.
Node 1: Regulatory Enforcement
Weak0.50
Moderate0.30
Strong0.20
Table 4. Input data used for CPT node 2.
Node 2: Port Community System (PCS)
Port governance qualityPoorMiddleGood
Low0.700.200.20
Medium0.200.500.30
High0.100.300.40
Table 5. Input data used for CPT node 3.
Node 3: Port Operational Efficiency
AI-based port managementLowMediumHigh
Poor0.700.400.20
Middle0.200.500.40
Good0.100.100.40
Table 6. Input data used for CPT node 4.
Node 4: Vessel Turnaround Time
Port operational efficiencyPoorMiddleGood
Poor0.700.300.20
Middle0.300.500.40
Good0.000.200.40
Table 7. Input data used for CPT node 5.
Node 5: Port Governance Quality
Regulatory enforcementWeakModerateStrong
Poor0.700.300.20
Middle0.200.500.30
Good0.100.200.50
Table 8. Input data used for CPT node 6.
Node 6: AI-Based Port Management
Port Community System (PCS)LowMediumHigh
Low0.800.300.30
Medium0.200.600.30
High0.000.100.40
Table 9. Input data used for CPT node 7.
Node 7: Port Productivity
Port operational efficiencyPoorMiddleGood
Low0.800.300.30
Medium0.200.600.30
High0.000.100.40
Table 10. Input data used for CPT node 8.
Node 8: Small and Medium Enterprises (SME) Growth
Low0.20
Medium0.50
High0.30
Table 11. Input data used for CPT node 9.
Node 9: Human Capital
Port governance qualityPoorMiddleGood
Low0.700.300.10
Medium0.200.550.55
High0.100.150.50
Table 12. Input data used for CPT node 10.
Node 10: Investment Capacity
Port governance qualityPoorMiddleGood
Low0.700.250.50
Medium0.200.500.50
High0.100.250.45
Table 13. Input data used for CPT node 11.
Node 11: Value Added of Maritime Sector
Port productivityLowMediumHigh
Low0.700.200.10
Medium0.200.500.30
High0.100.300.60
Table 14. Input data used for CPT node 12.
Node 12: Logistics Reliability
Vessel turnaround timePoorMiddleGood
Low0.650.400.30
Medium0.200.500.20
High0.150.100.50
Table 15. Input data used for CPT node 13.
Node 13: Coastal Employment
SME growthLMH
Port productivityLMHLMHLMH
Low0.700.200.200.400.200.100.100.100.00
Medium0.300.500.400.400.500.300.300.200.20
High0.000.300.400.200.300.600.600.700.80
Note: L = Low; M = Medium; H = High.
Table 16. Input data used for CPT node 15.
Node 15: Smart Logistics
Human capitalLMH
Logistics reliabilityLMHLMHLMH
Low0.700.600.300.600.300.300.400.300.10
Medium0.300.300.300.300.400.300.300.500.30
High0.000.100.400.100.300.400.300.200.60
Note: L = Low; M = Medium; H = High.
Table 17. Input data used for CPT node 16.
Node 16: Coastal Economic Output
Coastal employmentLMH
Value added of maritime sectorLMHLMHLMH
Low0.600.550.300.400.000.200.150.050.05
Medium0.300.200.200.200.500.200.200.250.20
High0.100.250.500.400.500.600.650.700.75
Table 18. Input data used for CPT node 17.
Node 17: Island Connectivity
Logistics reliabilityLowMediumHigh
Poor0.750.200.10
Middle0.100.500.30
Good0.150.300.60
Table 19. Input data used for CPT node 18.
Node 18: International Border & Geopolitics
High risk0.50
Medium risk0.30
Low risk0.20
Table 20. Input data used for CPT node 19.
Node 19: Service Quality
Digital infrastructure readinessPoorMiddleGood
Poor0.650.350.15
Middle0.300.500.30
Good0.050.150.55
Table 21. Input data used for CPT node 21.
Node 21: Blue Economy Incentives
Low0.50
Medium0.40
High0.10
Table 22. Input data used for CPT node 22.
Node 22: Marine Ecosystem Health
Environmental compliance systemWeekModerateStrong
Poor0.700.200.10
Middle0.200.500.20
Good0.100.300.70
Table 23. Input data used for CPT node 23.
Node 23: Environmental Compliance System
Weak0.30
Moderate0.50
Strong0.20
Table 24. Influence strength scores between parent and child nodes are calculated using the Euclidean distance method.
ParentChildAverageMaximum
1. Smart Port Aspect
Port operational efficiencyPort Productivity0.51520.6557
Logistics reliabilityIsland connectivity0.44450.5766
Port ProductivityValue Added Maritime sector0.41910.5568
Port Community System (PCS)AI-based port management0.40550.4583
Port governance qualityInvestment capacity0.38680.5635
Digital Infrastructure readinessService quality0.37030.5000
Port governance qualityHuman capital0.36650.5220
AI-based port managementPort operational efficiency0.33350.4359
Vessel turnaround timeLogistics reliability0.32960.3606
Port operational efficiencyVessel turnaround time0.32600.4583
Port governance qualityPort Community System (PCS)0.32320.4359
Logistics reliabilitySmart logistics0.25380.4000
Port ProductivityCoastal employment0.24060.4583
AI-based port managementDigital Infrastructure readiness0.20960.6265
Value Added Maritime sectorCoastal Economic Output0.20050.3606
Investment capacityDigital Infrastructure readiness0.15770.7000
Coastal Economic OutputSmart Port-BE Integration0.06830.1620
Smart logisticsSmart Port-BE Integration0.06730.1580
Service qualitySmart Port-BE Integration0.00760.0200
2. Blue Economy Aspect
Environmental compliance systemMarine ecosystem health0.46550.6000
Coastal employmentCoastal Economic Output0.30060.5074
Small Medium Enterprise (SME) growthCoastal employment0.29320.6000
Regional competitivenessSmart Port-BE Integration0.20960.4210
Island connectivityRegional competitiveness0.13780.4500
Blue economy incentivesRegional competitiveness0.11820.5568
Marine ecosystem healthSmart Port-BE Integration0.02270.0560
3. Cross-Dimensional Aspect (Smart Port–Blue Economy Interface)
Regulatory enforcementPort governance quality0.36110.4583
International border and geopoliticsRegional competitiveness0.20240.5000
Human capitalSmart logistics0.18100.3000
Human capitalDigital Infrastructure readiness0.12470.5000
Table 25. Scenario evaluation results based on evidence variables in the BBN model.
VariablePrior Probability (%)Scenario (Set as Evidence with Posterior Probability = 100%)
Smart PortBlue EconomyCross-Dimensional (RE)Mix of Five (POE, LR, ECS, CE and RE)
POE LR Mix of Two (POE and LR) ECS CE Mix of Two (ECS and CE)
Port Community System (PCS) (high)223624362224243146
Vessel turnaround time (good)124035741215151374
Port governance quality (good)212421242121215053
AI-based port management (high)123615361214141643
Port productivity (high)238029802334342486
Human capital (high)171817181717172425
Investment capacity (high)222422242222223233
Value added of maritime sector (high)295432542935353056
Digital infrastructure readiness (good)232723272323232833
Smart logistics (high)182243441818182145
Coastal economic output (high)526353635270705272
Island connectivity (good)273260602728282660
Service quality (good)192220221920202225
Regional competitiveness (good)444550504444444450
Marine ecosystem health (good)323232327032703270
Smart Port–Blue Economy (sustainable)454749504647484552
Table 26. Robustness analysis of Smart Port–Blue Economy Integration under ±10% CPT perturbation scenarios.
Node PerturbedBaseline Sustain (%)+10% CPT (%)−10% CPT (%)Maximum Change (%)
Port Operational Efficiency44,87644,52544,4970.379
Logistics Reliability44,87644,00043,8671.009
Environmental Compliance System44,87644,88744,8500.026
Regulatory Enforcement44,87644,80244,7880.088
Coastal Employment44,87645,43345,1240.557
Disclaimer/Publisher’s Note: The statements, opinions and data contained in all publications are solely those of the individual author(s) and contributor(s) and not of MDPI and/or the editor(s). MDPI and/or the editor(s) disclaim responsibility for any injury to people or property resulting from any ideas, methods, instructions or products referred to in the content.