Article

A Fiber-Reinforced Cement-Based Composite Sealing Material for Compressed Air Energy Storage Caverns: Optimization via Orthogonal Experiments and Performance Validation Under Coupled Thermal–Hydraulic–Mechanical Processes

1
Key Laboratory of Geomechanics and Embankment Engineering of Ministry of Education, Hohai University, Nanjing 210024, China
2
College of Civil Engineering and Transportation, Hohai University, Nanjing 210024, China
3
Dam Safety Management Department, Nanjing Hydraulic Research Institute, Nanjing 210029, China
*
Author to whom correspondence should be addressed.
Sustainability 2026, 18(13), 6839; https://doi.org/10.3390/su18136839 (registering DOI)
Submission received: 18 May 2026 / Revised: 25 June 2026 / Accepted: 30 June 2026 / Published: 6 July 2026

Abstract

The sealing performance of compressed air energy storage (CAES) caverns represents a multi-physics challenge involving coupled thermal–hydraulic–mechanical processes, characterized by complex interacting factors. As a critical determinant of the long-term operational efficiency of CAES facilities, this study developed a fiber-reinforced cement-based composite sealing material through systematic orthogonal experiments investigating four key parameters: water–cement ratio, sand ratio, fly ash–silica fume content, and basalt fiber content. An optimized mixture was formulated with a water–cement ratio (0.36), sand ratio (42%), fly ash–silica fume content (22%), and basalt fiber content (1.0%). Under this optimal mix proportion, the measured permeability coefficient of the sealing layer is 1.92 × 10⁻¹³ cm/s, and the uniaxial compressive strength and tensile strength are 37 MPa and 3.9 MPa, respectively, with a corresponding elastic modulus of 18 GPa. Meanwhile, the P-wave velocity is approximately 2823 m/s, and the porosity is 0.15, achieving balanced performance in permeability, strength, and porosity. The material was validated in a CAES physical model through gas charge–discharge tests under various operational scenarios for the composite sealing layer-lining-surrounding rock system.

1. Introduction

Energy serves as the fundamental basis for all life and human activities. Green renewable energy sources—including wind, solar, tidal, and biomass power—offer significant advantages by reducing greenhouse gas emissions and fossil fuel dependence while providing clean, abundant, and sustainable alternatives [1,2,3,4]. Notably, global installed capacity growth has been predominantly driven by wind and solar power in recent years. China’s wind power capacity is projected to reach 1 billion kW by 2050, meeting 17% of domestic electricity demand and demonstrating renewables’ growing role in clean energy transition [5,6]. However, the inherent intermittency, supply instability, and low energy density of wind and photovoltaic generation create substantial grid integration challenges [7]. Large-scale curtailment of wind/solar power remains a critical issue, jeopardizing grid stability [8]. To address these challenges, Compressed Air Energy Storage (CAES) has emerged as a viable solution [9,10,11].
CAES utilizes compressed air as an energy storage medium, converting surplus electricity during off-peak periods into pressurized air stored in underground caverns. During peak demand, the released air drives turbines to regenerate electricity, effectively enabling grid load balancing and renewable energy utilization [12]. Compared to pumped hydro storage, CAES offers distinct advantages: lower capital/maintenance costs, reduced geographical constraints, and particular suitability for China’s wind/solar-rich but water-scarce “Three Norths” regions [13,14,15,16].
CAES underground caverns exhibit substantial dimensions, typically ranging from hundreds of thousands to tens of millions of cubic meters in volume, and operate under exceptionally high air pressures (5–10 MPa or greater). These systems must meet rigorous sealing specifications, with maximum allowable leakage rates limited to 0.5–1% over a 24 h period [17,18]. Consequently, ensuring CAES cavern stability and sealing performance represents a complex multi-physics challenge involving coupled thermodynamic, permeation (air seepage), and mechanical processes [19,20,21]. The numerous interdependent influencing factors, which vary significantly under operational conditions, serve as critical indicators for both project safety and economic viability—particularly for long-term power plant operation. Despite their importance, current understanding of these phenomena remains incomplete, with limited research available and no comprehensive theoretical framework established in the literature [22].
Allen et al. established critical performance standards for compressed air energy storage chambers, demonstrating that maintaining leakage rates below 1% per charge–discharge cycle is essential for efficient power plant operation [23]. Their findings underscore the necessity of robust structural sealing during cyclic operations. Zhuang et al. specifically investigated unlined hard rock caverns, revealing leakage rates significantly exceeding the 1% threshold—a performance deficit that would incur substantial annual economic losses, thereby disqualifying unlined designs for hard rock applications [24]. Wu et al. advanced the theoretical understanding by developing a comprehensive leakage model that incorporates multiple operational parameters (injection air quality/rate, chamber geometry) and quantifies leakage impacts on internal chamber conditions [25]. Rutqvist et al. identified two fundamental requirements for meeting the 1% leakage standard: (1) maintaining storage pressures between 5 and 8 MPa and (2) achieving concrete lining permeability below 1 × 10⁻¹⁸ m2 [26].
Recent modeling advances have addressed various geological conditions: Chen et al. developed an equivalent boundary seepage model for salt rock formations with weak interlayers, overcoming limitations of conventional equivalent-medium approaches in characterizing bedding plane seepage [27]. Zhong et al. conducted rigorous granite seepage experiments, establishing quantitative relationships between fracture networks (degree/porosity/permeability) and gas migration patterns, including precise calculations of seepage volumes and breakthrough times [28]. Yang’s research team made significant contributions to interbedded salt cavern design through: (1) novel mudstone permeability testing methods, (2) multi-interlayer leakage prediction models, and (3) comprehensive parameter sensitivity analyses for storage site selection [29,30].
In addition to the conventional concrete lining, compressed air energy storage chambers will also set steel plates or high molecular polymer materials as the sealing layer inside. The earliest mature technology for storing high-pressure gas in underground chambers is the LRC (Lined Rock Cavern) technology in Northern Europe, whose chamber structure mainly includes steel lining, sliding layer, concrete lining layer, and surrounding rock. The thickness of the steel lining is generally 10~15 mm, which will transfer the pressure borne through the concrete lining to the surrounding rock, and at the same time can cover the tiny cracks of the concrete lining, making the inside of the chamber form a completely sealed system. However, there are obvious differences between LRC chambers and compressed air energy storage chambers in terms of internal pressure, length of charging and discharging cycles, and temperature stress. Steel plates also have the disadvantages of being prone to fatigue failure and being high-cost, so whether steel lining is suitable for compressed air energy storage chambers still needs further verification. Compared with steel plate sealing layers, high molecular material sealing layers have the advantages of large deformability and low cost, and are a more ideal sealing material. The Japanese compressed air energy storage Kunagawa project used butyl rubber material as the sealing layer for on-site tests, and preliminarily verified the feasibility of high molecular sealing layers [31]. Xia et al. combined multi-field coupling control equations and on-site data to analyze the gas tightness and mechanical properties of high molecular sealing layers under typical operating conditions. The study shows that butyl rubber and fiberglass can be considered as priority sealing layer materials [32,33]. However, the research on high molecular materials is currently limited to indoor tests and has not been promoted and applied in specific compressed air energy storage engineering examples. Its gas leakage characteristics, stress and strain, durability, and influencing factors under long-term operating conditions still lack systematic and complete research.
Both steel plate and polymer-based sealing layers have limitations and have yet to be widely adopted in practical applications. Therefore, there is an urgent need to develop a new sealing material with low permeability, stable properties, and cost-effectiveness to meet the long-term sealing and durability requirements of compressed air energy storage chambers under coupled thermo-mechanical cycling. To address this challenge, an orthogonal experimental approach was employed to investigate the effects of four key factors—water-cement ratio, sand ratio, fly ash/silica fume content, and basalt fiber content—on the physical and mechanical properties of the sealing material. An optimized mix ratio was derived, satisfying the requirements for permeability, strength, and porosity. The newly developed sealing material was then applied to a physical model of a compressed air energy storage chamber. Charge–discharge tests were conducted on the sealing layer-lining-surrounding rock composite structure under various operating conditions. These tests successfully simulated the stress-deformation behavior and temperature variation characteristics of the composite structure during gas storage operations.

2. Selection and Testing of Sealing Layer Materials for Compressed Air Energy Storage Caverns

2.1. Material Selection Strategy

Airtightness is one of the most critical properties of compressed air energy storage caverns, and the sealing of the cavern lining is primarily provided by the sealing layer. The charging and discharging cycle of compressed air energy storage caverns is very short, typically once a day, making the impact of temperature stress more pronounced. Therefore, the sealing layer material for compressed air energy storage caverns must possess high airtightness and durability. The material selection should meet the following requirements [34,35]:
  • Optimize the concrete mix design and incorporate appropriate mineral admixtures (e.g., fly ash, slag powder, silica fume). By filling internal pores, the compactness and airtightness of the concrete can be significantly enhanced to meet the gas permeability coefficient requirements (10–12~10–13 cm/s) for the sealing layer in compressed air energy storage (CAES).
  • Under long-term temperature stress cycle coupling, the sealing layer of the compressed air energy storage cavern must meet the requirements of airtightness and durability to prevent the airtight concrete from cracking under long-term operational conditions. This can be achieved by incorporating fiber materials to enhance the crack resistance of the concrete.
Based on the above material selection requirements, the raw materials chosen for this experiment are shown in Table 1. The particle size distribution curves of various materials are shown in Figure 1. The chemical compositions of cement, fly ash, and silica fume are shown in Table 2.

2.2. Mix Proportioning Test

Based on the aforementioned design principles, this mix proportioning utilizes fly ash and silica fume as admixtures. The pozzolanic effect and microsphere effect of fly ash enhance the density of the concrete. However, the relatively low early strength of fly ash can lead to poor airtightness of the concrete. The addition of silica fume creates a complementary effect with fly ash. The high fineness and high reactivity of silica fume promote the hydration of fly ash, and the secondary hydration of fly ash improves the pore structure of the concrete. Additionally, the rapid self-reaction of silica fume aids in the formation of C-S-H gel, filling voids and enhancing the airtightness of the concrete [36,37,38]. For the sealing layer of the compressed air energy storage cavern, the resistance to cracking under long-term temperature stress cycles is particularly crucial. Therefore, basalt fiber is used to enhance the anti-shrinkage performance of the cement hydration product matrix due to its physical compatibility with cement-based materials, thereby increasing the crack resistance and durability of the sealing layer. The addition of a water reducer can lower the water–cement ratio while ensuring density, and the introduction of numerous microbubbles can block the channels of interconnected capillaries, turning open pores into closed pores. The activation densifier can increase the bond strength between the concrete aggregate and the cementitious material, thereby reducing the gas permeability of the concrete.
This paper optimizes the mix proportioning scheme for the simulated compressed air energy storage sealing layer through orthogonal experimental design methods, configuring a sealing layer material with excellent airtightness through extensive testing. Factors such as water–cement ratio, sand rate, and the dosage of fly ash and silica fume (with a ratio of fly ash to silica fume of 5:1) and basalt fiber are used as influencing factors [39,40,41]. An orthogonal experiment is designed to explore the impact of these factors on the physical and mechanical parameters of the sealing layer material. Based on a 4-factor 5-level orthogonal design scheme L25(54), each factor is set at 5 levels. The experimental scheme is shown in Table 3, and the mix proportioning test design is shown in Table 4. In Table 3, % refers to kg/m3.
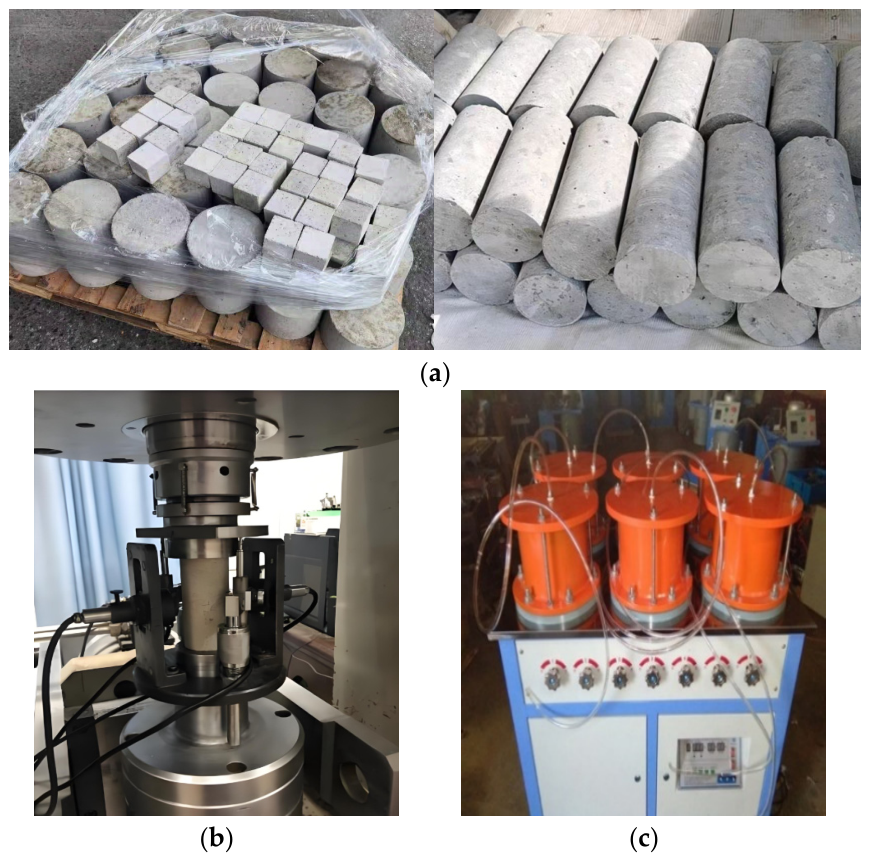
Based on the aforementioned material proportions and design schemes, sealing layer material samples were prepared and tested for relevant physical and mechanical parameters. The physical parameters include wave velocity and porosity. The P-wave velocity test was performed using an ultrasonic testing and analysis instrument. Before the test, the specimen should be kept horizontal. First, the transmitting probe and the receiving probe are brought into contact to obtain the inherent time delay of the system. Vaseline is evenly applied to both ends of the specimen, and the probes are held in contact with the two ends of the specimen by both hands. Then, the test button is pressed to obtain the waveform and acoustic time parameters, and the P-wave velocity of the specimen is calculated. The porosity test was conducted using the water saturation method. The specimens were placed in a vacuum saturation cylinder for vacuum treatment. After being saturated with water for 24 h, the specimens were removed and weighed, and the porosity of each group of materials was calculated. The mechanical parameters include uniaxial compressive strength, tensile strength, shear strength, elastic modulus, and permeability coefficient. For each proportion, three types of samples were prepared: 50 mm × 100 mm cylinders, 50 mm × 25 mm cylinders, and 50 mm × 50 mm × 50 mm cubes, with three samples of each type prepared as parallel control groups. Figure 2 shows the sealing layer material samples and testing instruments. According to the standard for test methods of concrete physical and mechanical properties (GB/T 50081-2019) [42], the uniaxial compressive and tensile strength tests were conducted using the RMT-150B rock mechanics testing system. This system is an electro-hydraulic servo loading platform capable of performing conventional mechanical tests, such as compression on rock or concrete materials. The equipment has an axial loading capacity of up to 1000 kN and can be equipped with a confining pressure module for triaxial tests. Under uniaxial compression conditions, the RMT-150B typically uses displacement control to achieve stable loading. Axial deformation measurements were taken using displacement sensors, and displacement loading was performed at a rate of 0.002 mm/s. The elastic modulus was then determined as the slope of the approximately linear segment of the stress–strain curve in the elastic deformation stage. Under uniaxial tensile conditions, the loading method adopted displacement control, with a loading rate controlled at 0.5 mm/min.
To ensure even dispersion of fibers in the concrete and avoid interference from fiber aggregation caused by preparation, the dry mixing method was used to prepare the airtight concrete. The specific experimental steps are as follows:
  • Aggregate Selection and Mixing: According to the experimental design scheme, select coarse and fine aggregates, and mix the coarse and fine aggregates, fly ash, and silica fume for 1 min;
  • Fiber Incorporation: Evenly sprinkle the fibers and mix for 1 min, then add water and admixtures and mix for 2 min;
  • Molding: Quickly pour the well-mixed material into the mold, move it to the vibration table to vibrate evenly, and after vibration, use a putty knife to smooth the end surface of the sample;
  • Curing: After the specimen hardens for 48 h, demold it, and place the demolded samples in a curing basin filled with water, curing them for 28 days at room temperature (around 20 °C);
  • Testing: After the curing period, conduct the relevant physical and mechanical parameter tests.

2.3. Experimental Results Analysis

2.3.1. Basic Physical Parameter Test Results

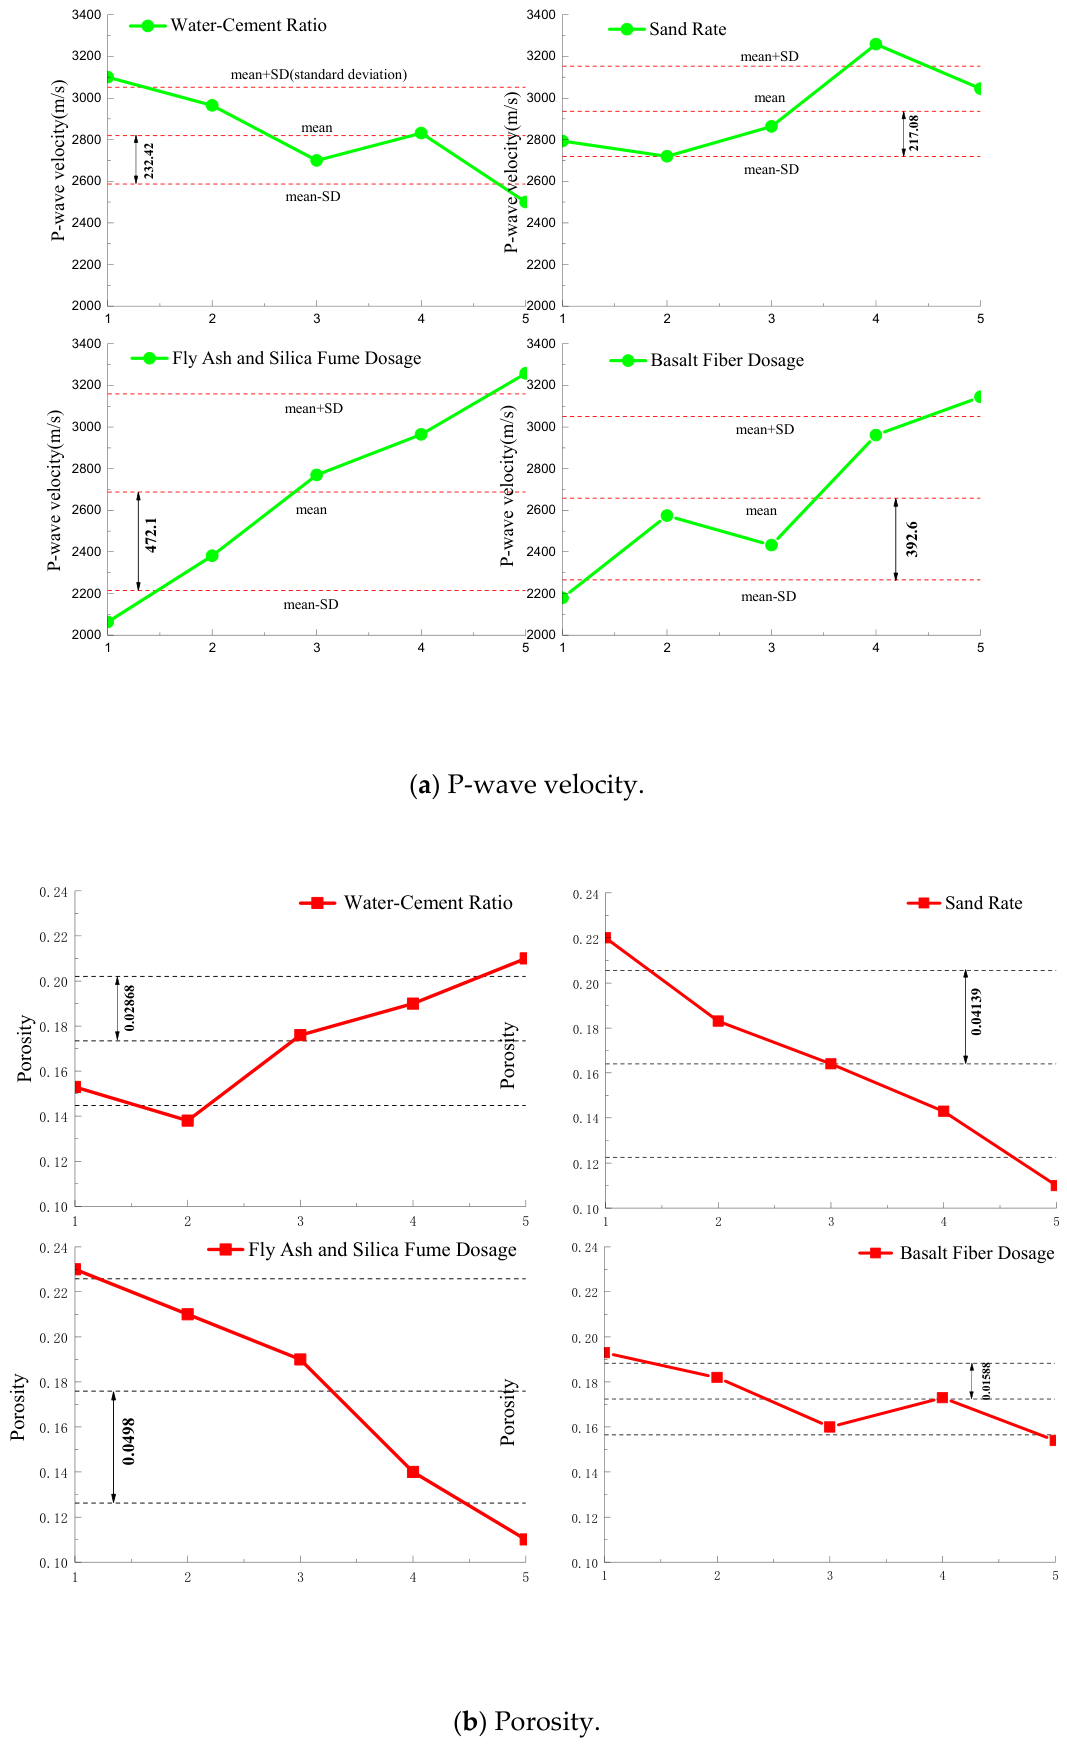
P-wave velocity and porosity can reflect the integrity and uniformity of geotechnical materials. Before conducting the P-wave velocity test, the sample must be kept level. First, the transmitter and receiver probes are contacted to obtain the inherent delay time of the system. Vaseline is evenly applied to both ends of the sample, and the probes are contacted with both ends of the sample using both hands. The test button is clicked to obtain the waveform and acoustic time parameters. The P-wave velocity of the sample is calculated using the following formula. The porosity test is conducted using the saturation method. The sample is placed in a vacuum saturation chamber and vacuum is applied. After 24 h of saturation, the sample is removed and weighed to calculate the porosity of each group of materials. To more intuitively analyze the influence of various factors on P-wave velocity and porosity, graphs are drawn based on the orthogonal test results. From Figure 3, it can be seen that the P-wave velocity increases with the increase in sand rate, the dosage of fly ash and silica fume, and the content of basalt fiber, with the dosage of fly ash and silica fume having the greatest impact on P-wave velocity, followed by the content of basalt fiber. The P-wave velocity decreases with the increase in water–cement ratio, indicating that a higher water–cement ratio results in lower strength and density of the sample. The trend of porosity change is opposite to that of P-wave velocity. Porosity decreases with the increase in sand rate and the dosage of fly ash and silica fume, with the sand rate having the greatest impact on porosity. As the water–cement ratio increases, porosity gradually increases. The formation of pores in concrete is related to water, and reducing the amount of water and lowering the water–cement ratio are effective means of reducing porosity.

2.3.2. Mechanical Parameter Test Results

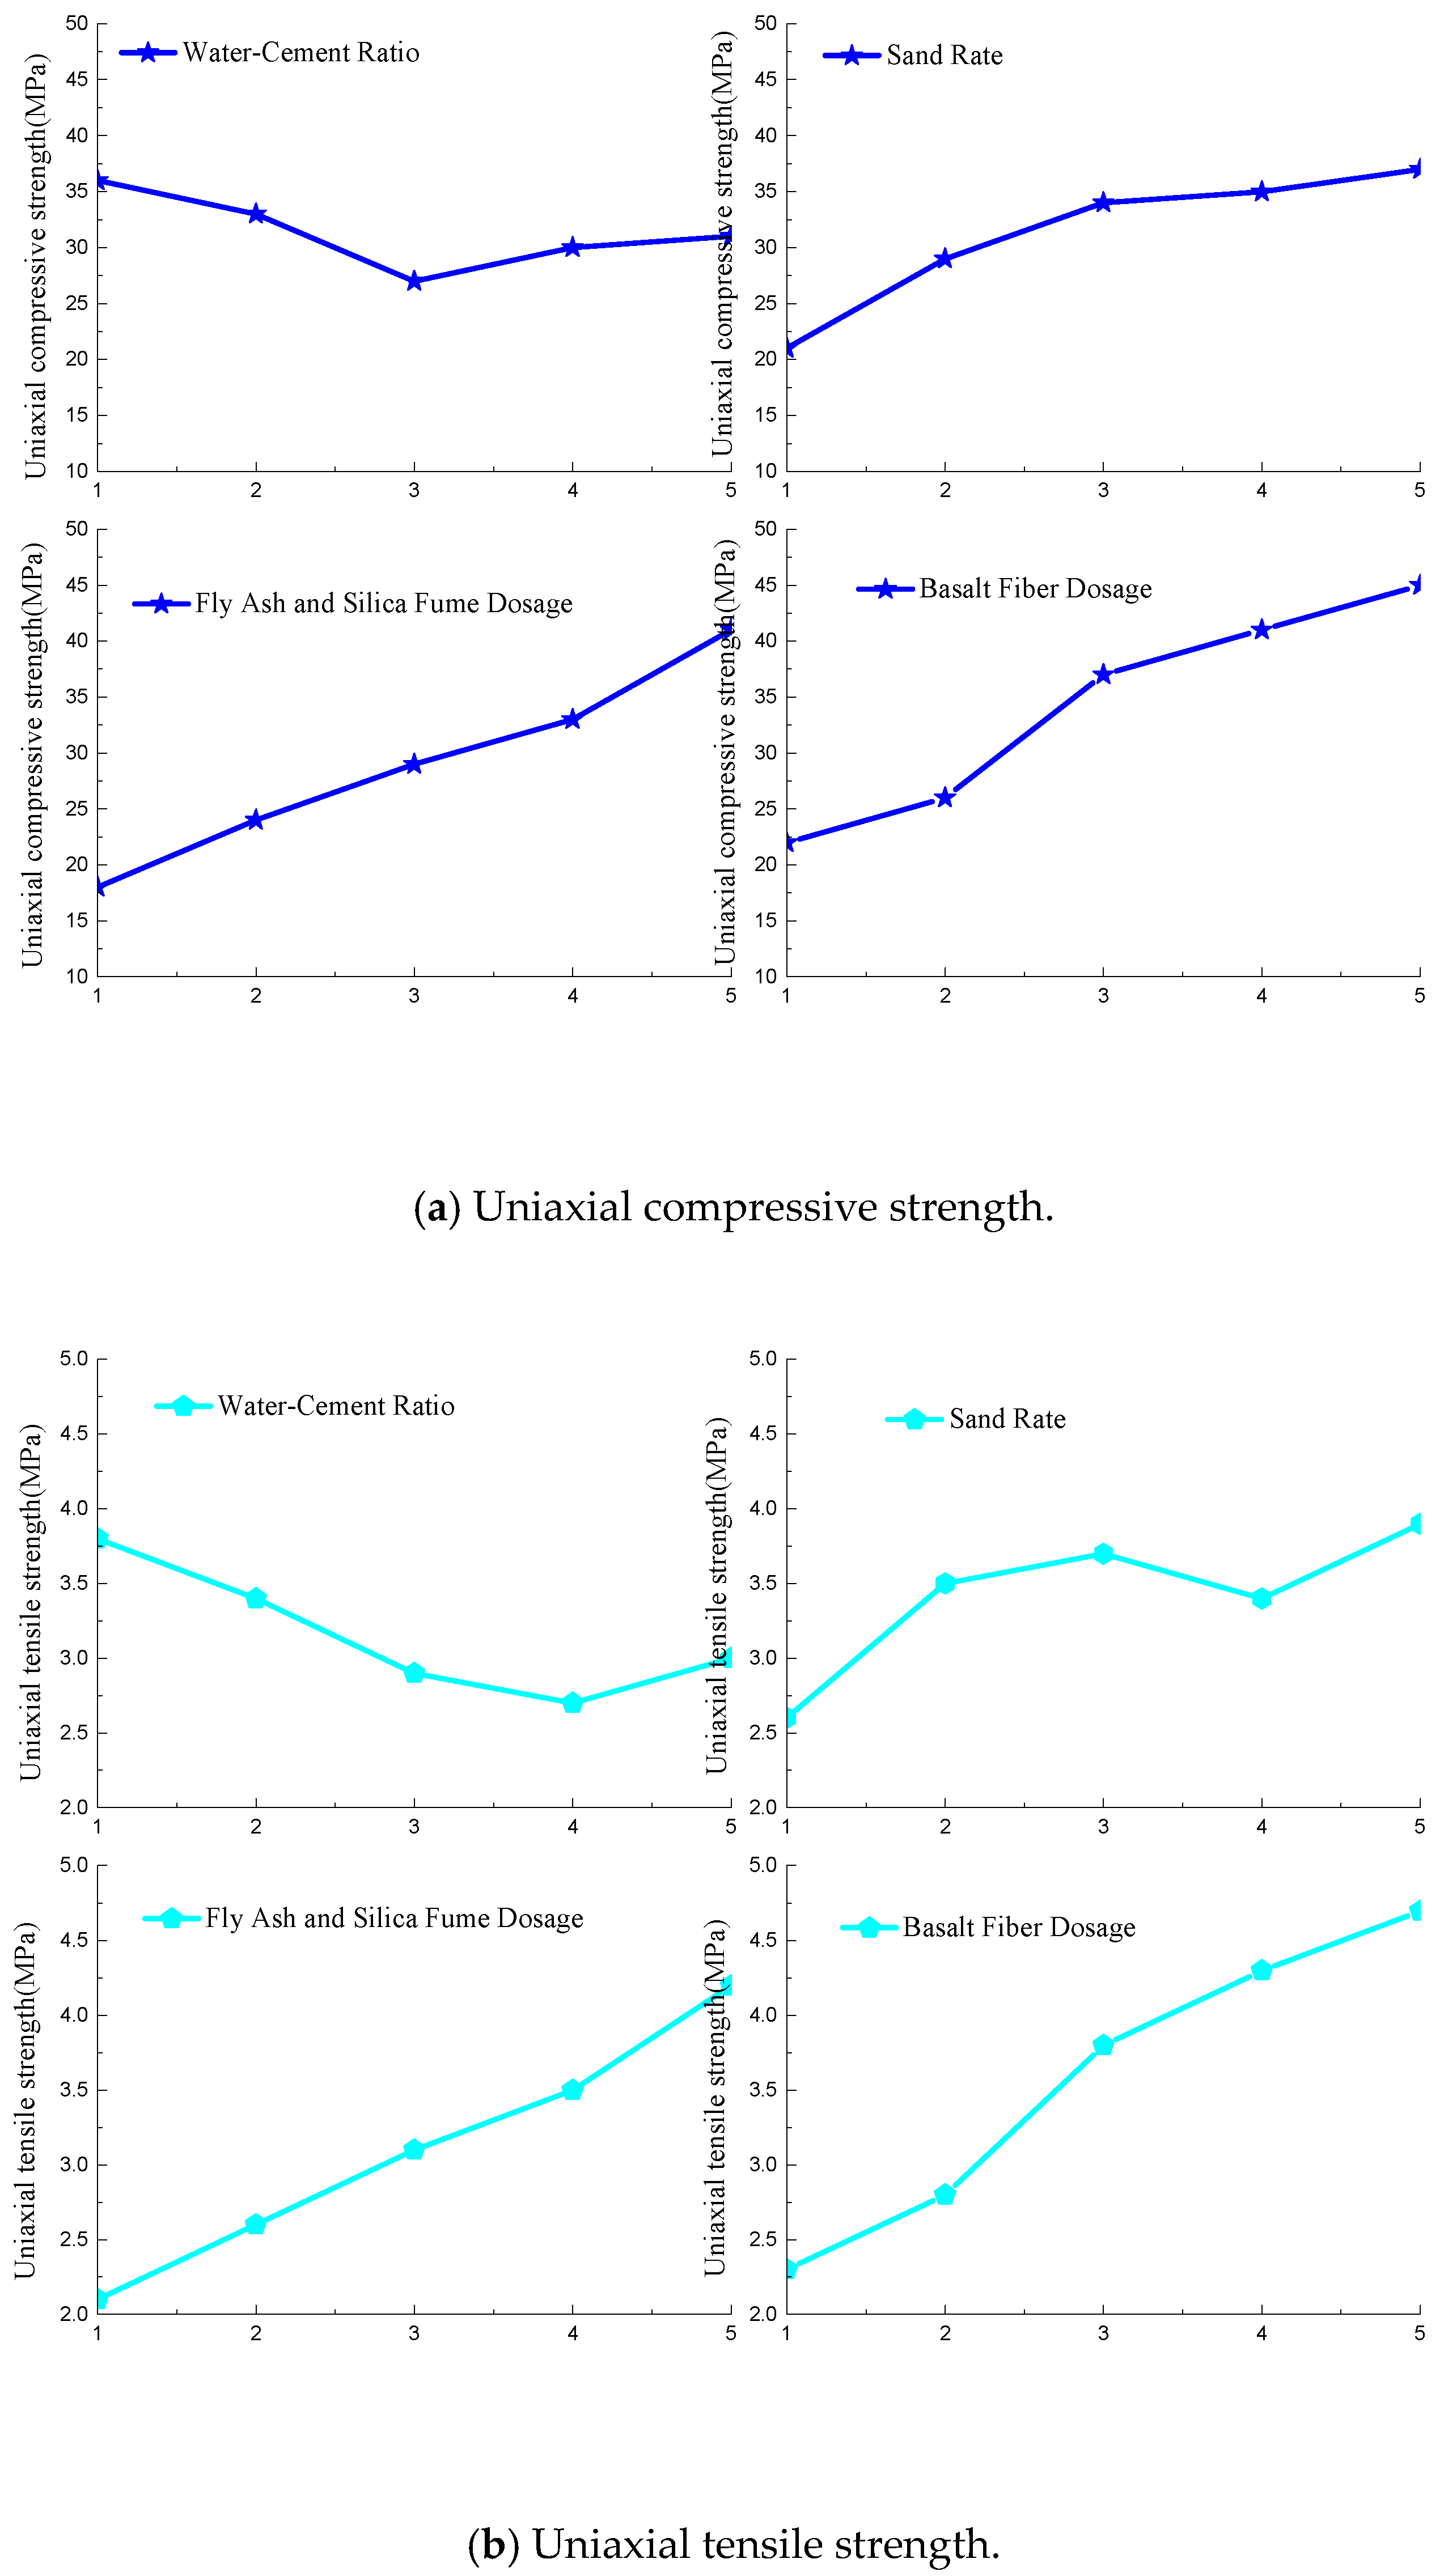
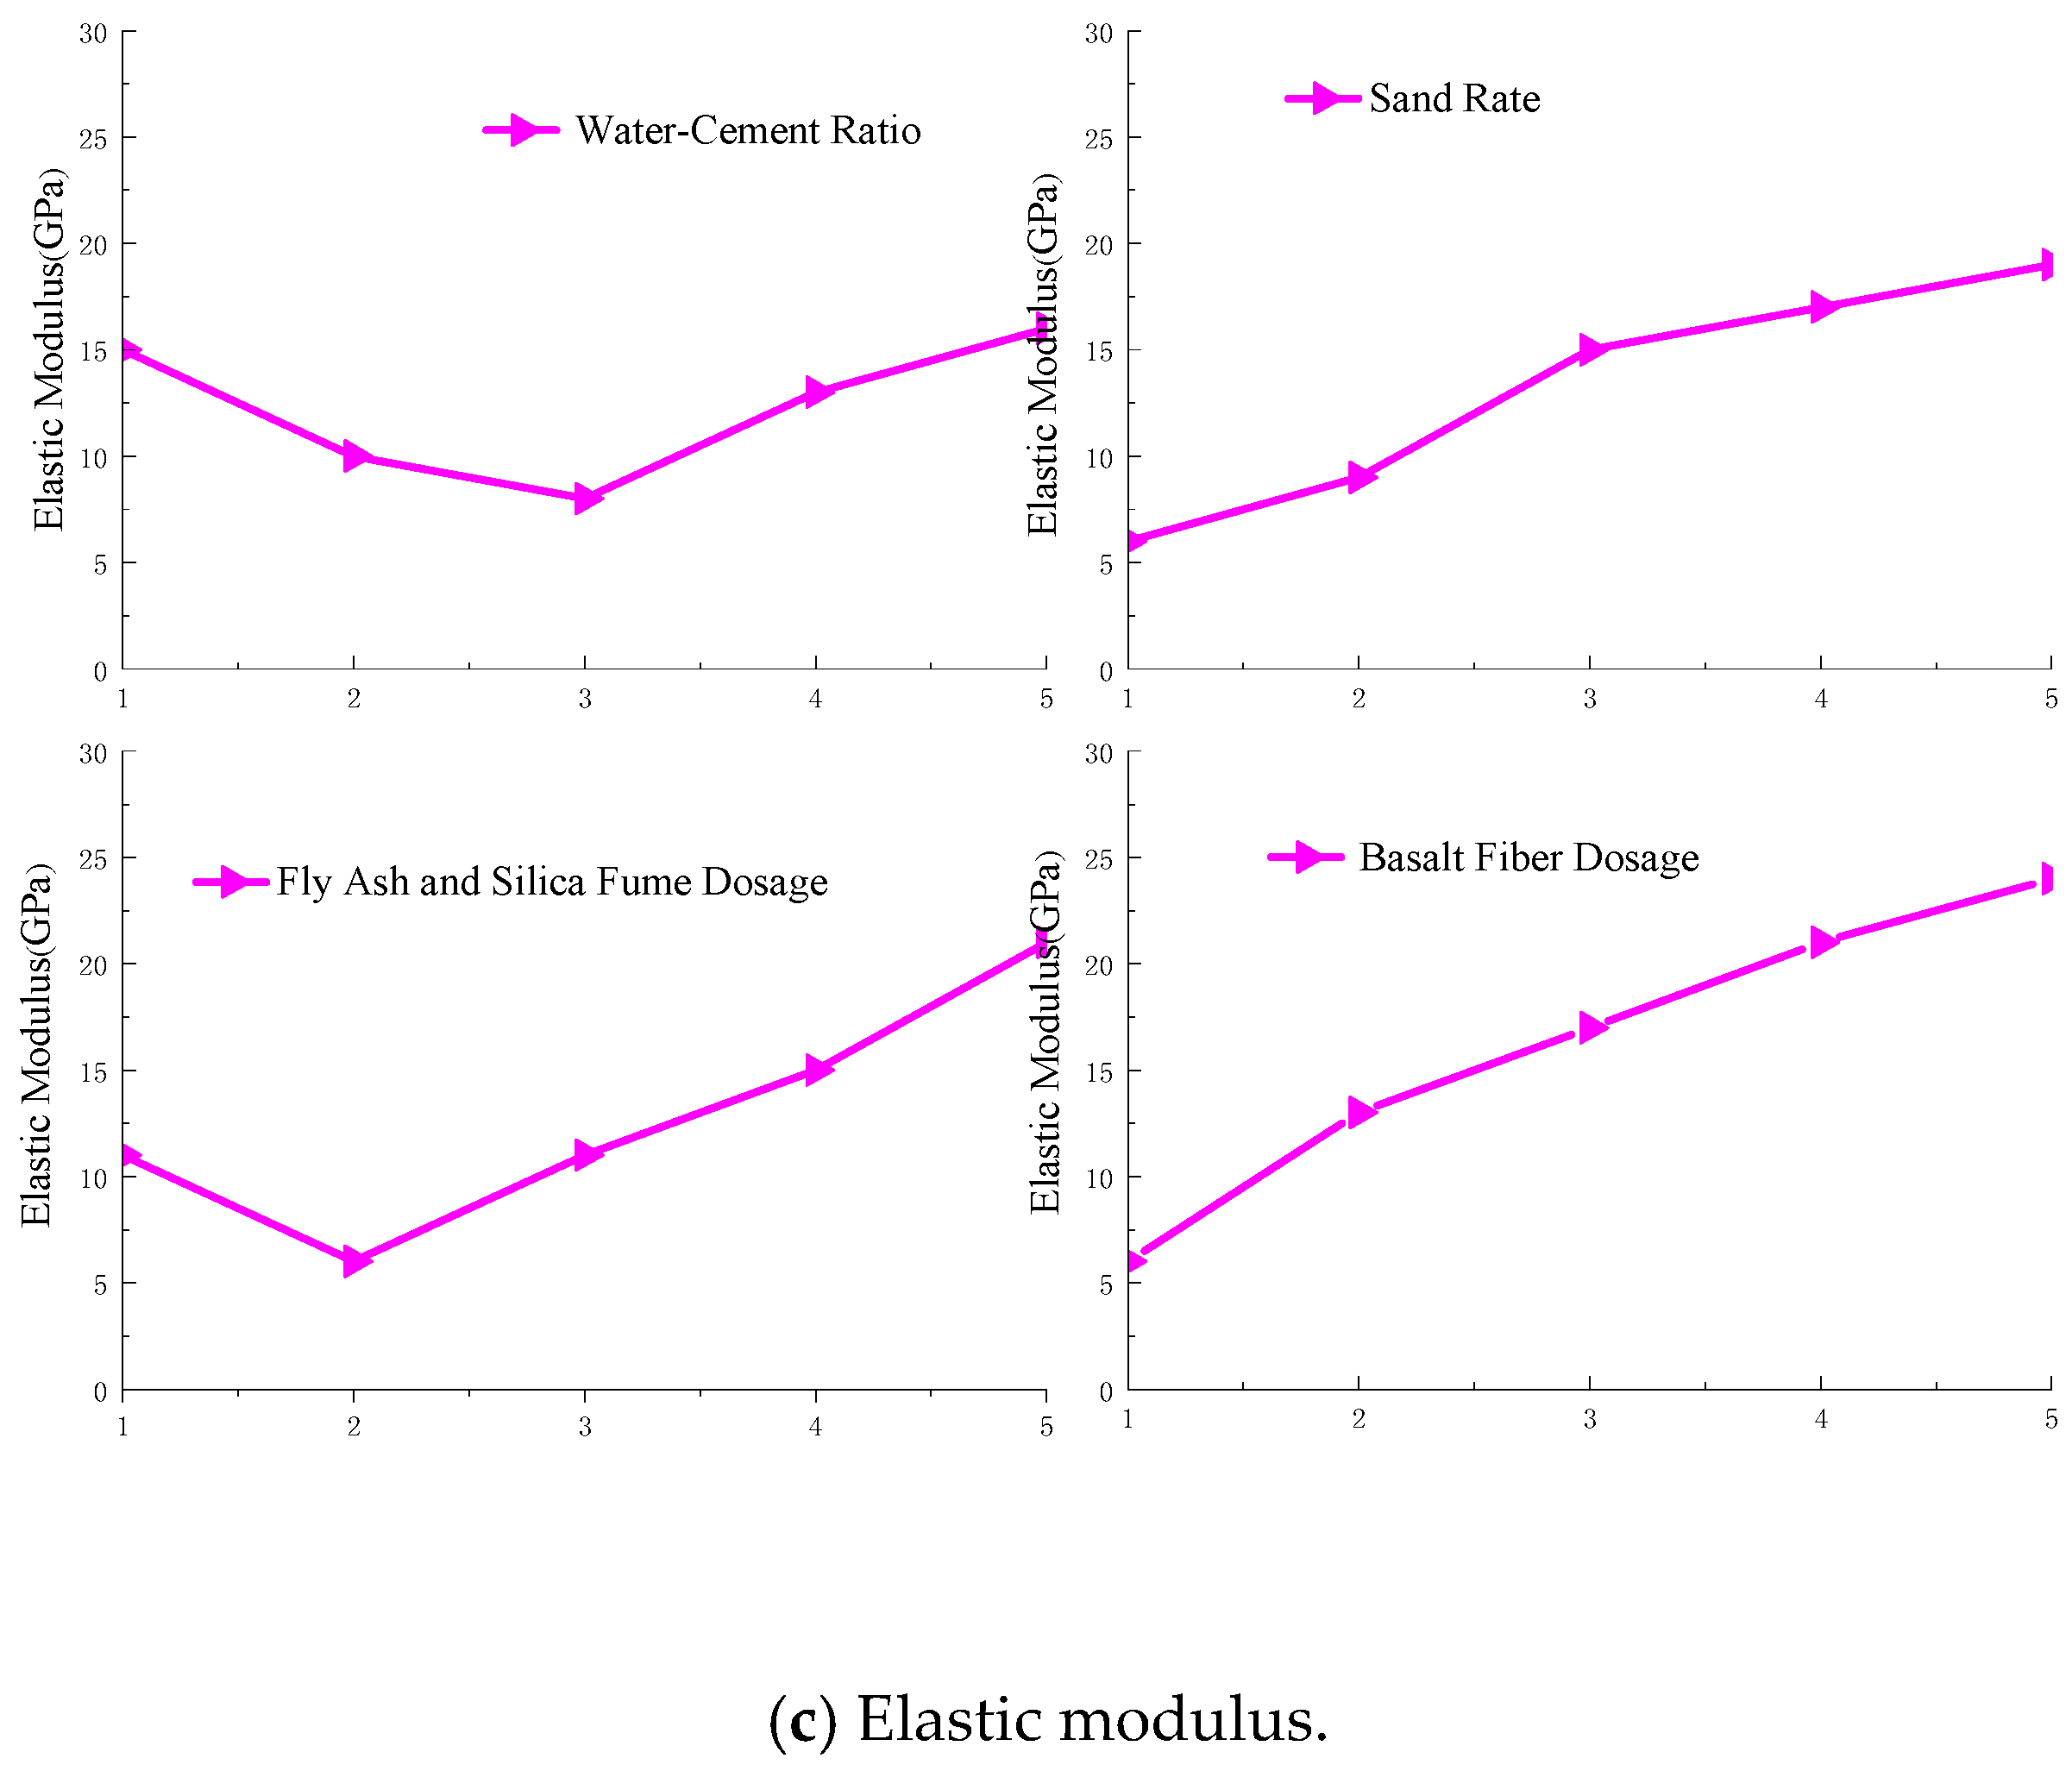
The uniaxial compression test used specimens with a diameter × height of 50 mm × 100 mm. The test employed displacement control to apply axial loading to the material samples, with a loading rate set at 0.05 mm/min. The uniaxial tensile strength of the samples was tested using the Brazilian splitting method, with samples having a diameter × length of 50 mm × 25 mm. To more intuitively analyze the influence of various factors on mechanical parameters, Figure 4 was drawn based on the orthogonal test results. From the figure, it can be seen that the content of basalt fiber, fly ash, and silica fume has a significant influence on the uniaxial compressive strength, tensile strength, and elastic modulus of the samples, followed by the sand rate and water–cement ratio. Taking uniaxial compression as an example, as the content of basalt fiber increases, the uniaxial compressive strength of the samples significantly increases, with a range of 22 MPa to 45 MPa; the content of fly ash and silica fume also has a noticeable enhancing effect on compressive strength, with a range of 18 MPa to 41 MPa; as the water–cement ratio increases, there is a clear decreasing trend in compressive strength, with a range of 30 MPa to 36 MPa. Therefore, when configuring airtight concrete, it is necessary to appropriately reduce the water–cement ratio. The uniaxial tensile strength and elastic modulus also exhibit similar patterns under the influence of the four factors.

2.4. Analysis of Airtightness Influencing Factors

2.4.1. Principle of Airtightness Testing

Gas permeability can be calculated according to Darcy’s law, which is given by:
Q = k x A μ d P d x
In Equation (1), Q is the gas flow rate, cm3/s; x is the distance from the sample to the gas inlet, cm; k x is the intrinsic gas permeability, cm2; A is the sample permeability area, cm2; μ is the gas viscosity coefficient, Pa·s; and P is the pressure change within the sample due to the distance from the gas inlet, Pa.
During the airtightness test of concrete, one end of the concrete column or platform is sealed, and the other end is open. The sealing between the sample and the container is checked, and the pressure of the compressed gas at each stage is controlled using a pressure gauge. Then, the open end is sealed, and the pressure gauge is connected to measure the height change h of the water column in the pressure gauge over a specified time t. This paper analyzed the permeability of materials based on the gas permeability coefficient. The intrinsic gas permeability k x of the test concrete and the concrete permeability coefficient K are calculated using the following formulas:
k x = 2 h P 0 μ P 2 P 0 2 Q A
K = γ a μ k x = 2 h P 0 γ a P 2 P 0 2 Q A
In Equations (2) and (3), K is the air permeability coefficient, cm/s; h is the sample height, cm; γ a is the specific weight of air, 1.205 × 10⁻⁵ N/cm3; P 0 is the gas pressure at the outlet, taken as atmospheric pressure, 0.1 MPa; P is the gas pressure at the inlet, MPa; and A is the sample permeability area, cm2.

2.4.2. Airtightness Test Results

To investigate the influence of water–cement ratio, sand rate, fly ash and silica fume dosage, and basalt fiber content on the airtightness of concrete, airtightness tests were conducted on samples using the pressure difference method. Considering the long-term operational gas storage pressure of the compressed air energy storage cavern, the inlet pressure was set at 10 MPa, and the pressure stabilization time was 6 h. The test instruments are shown in Figure 1, and the single-factor influence results of the orthogonal test are shown in Table 5 (Each group value is the mean of three parallel specimens, and the standard deviation reflects the dispersion of the data). K represents the average value of the sum of the level indicators for each influencing factor, and R is the range. From Table 5, it can be seen that the influence of each factor on the airtightness of concrete is as follows: water–cement ratio > fly ash and silica fume dosage > basalt fiber content > sand rate.
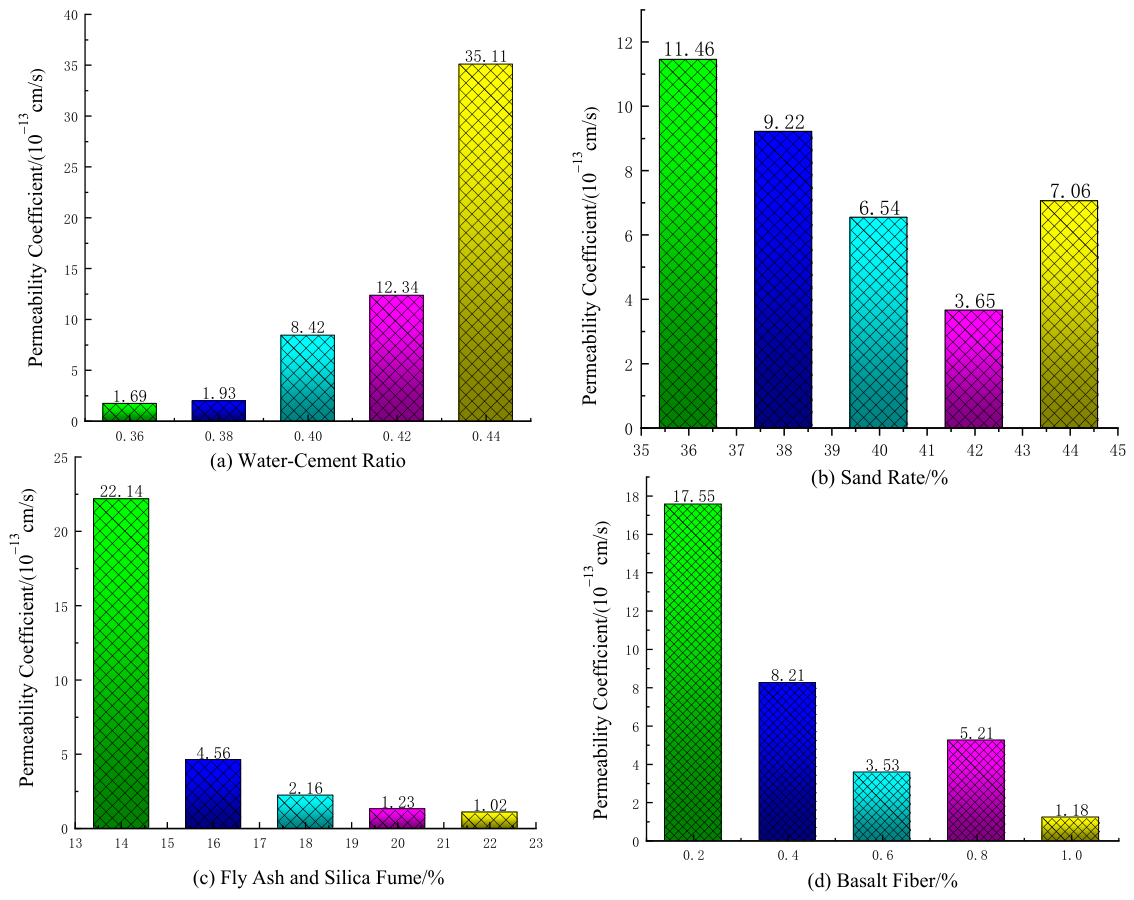
Figure 5 presents the effects of various influencing factors on the permeability coefficient of concrete sealing layers. Figure 5a shows that as the water–cement ratio increases, the permeability coefficient of airtight concrete gradually increases. When the water–cement ratio exceeds 0.44, the permeability coefficient sharply increases to 35.11 × 10⁻¹³ cm/s, leading to a decrease in the airtight performance of the concrete. This is because an excessively high water–cement ratio can result in poor cohesion of the concrete mixture, thereby affecting the density and permeability of the hardened concrete. The formation of pores in concrete is related to water; reducing the water content and lowering the water-cement ratio are the most effective ways to decrease the porosity of concrete. Experiments have proven that under conditions where the water required for cement hydration is met, the permeability coefficient of concrete decreases with a lower water–cement ratio. Figure 5b indicates that as the sand rate increases, the permeability coefficient of the concrete material gradually decreases. This is because the increase in fine aggregate helps improve the workability of the concrete, which is suitable for pumped concrete. Additionally, fine aggregate can reduce the interface area of the concrete, enhancing its workability. However, the sand rate should not be too high to avoid increasing the dry shrinkage of the concrete. The orthogonal test results suggest that a sand rate of 40% to 42% is reasonable and can meet the sealing requirements of the compressed air cavern. Figure 5c shows the impact of fly ash and silica fume dosage on the permeability coefficient of concrete. As the dosage of fly ash and silica fume increases, the permeability of the concrete gradually decreases, especially when the dosage exceeds 16%, at which point the permeability coefficient sharply decreases. This is because the pozzolanic reaction and microsphere effect of fly ash make the concrete denser. However, before hydration, fly ash particles can reduce the bond between cement particles and aggregates, and the relatively low early strength of fly ash is also a reason for the poor airtightness of the concrete. When silica fume is added, it creates a complementary effect with fly ash. The high fineness and high reactivity of silica fume can promote the hydration of fly ash, and the secondary hydration of fly ash can improve the pore structure of the concrete. Moreover, the rapid reaction of silica fume helps in the formation of C-S-H gel, filling voids and enhancing the airtightness of the concrete. The best sealing effect is achieved when the dosage of fly ash and silica fume is between 16% and 22%. Figure 5d shows the impact of basalt fiber content on the permeability coefficient of concrete. As the content of basalt fiber increases, the permeability of the concrete significantly decreases. The addition of fibers can effectively improve the internal pore structure of the concrete and reduce porosity. The best sealing effect is achieved when the basalt fiber content is between 0.6% and 1.0%.
Based on the results of the orthogonal test, the influence of each factor on the permeability coefficient of the concrete sealing layer was analyzed, and the optimal mix proportion was determined to be a water–cement ratio of 0.36, a sand rate of 42%, a dosage of fly ash and silica fume of 22%, and a basalt fiber content of 1.0%. Under this optimal mix proportion, the measured permeability coefficient of the sealing layer is 1.92 × 10⁻¹³ cm/s, and the uniaxial compressive strength and tensile strength are 37 MPa and 3.9 MPa, respectively, with a corresponding elastic modulus of 18 GPa. Meanwhile, the P-wave velocity is approximately 2823 m/s, and the porosity is 0.15.

3. Underground Gas Storage Structure Deformation and Sealing Test

3.1. Test Overview

Taking the −180 m level roadway of the Caozhuang Coal Mine in Shandong as a prototype, to ensure similarity between the similar material and natural rock, a similar material proportion of particle size 0.35~0.5 mm, plaster–sand ratio of 5%, cement–sand ratio of 10%, and water–sand ratio of 35% was selected for the model test [43]. The similarity ratio of the model test was determined to be 1:10, with the maximum outer contour dimensions of the model being 1400 mm × 1400 mm × 700 mm, a cavern diameter of 500 mm, and a mortar layer lining thickness of 50 mm. A 25 mm thick airtight concrete sealing layer was used, with the optimal mix proportion obtained from the aforementioned tests: a water–cement ratio of 0.36, a sand rate of 42%, a dosage of fly ash and silica fume of 22%, and a basalt fiber content of 1.0%. Its main function is to seal the gas and transfer the force to the lining and surrounding rock through deformation (simulating the function of the sealing layer in real situations), without considering its thickness similarity ratio.

3.2. Model Fabrication

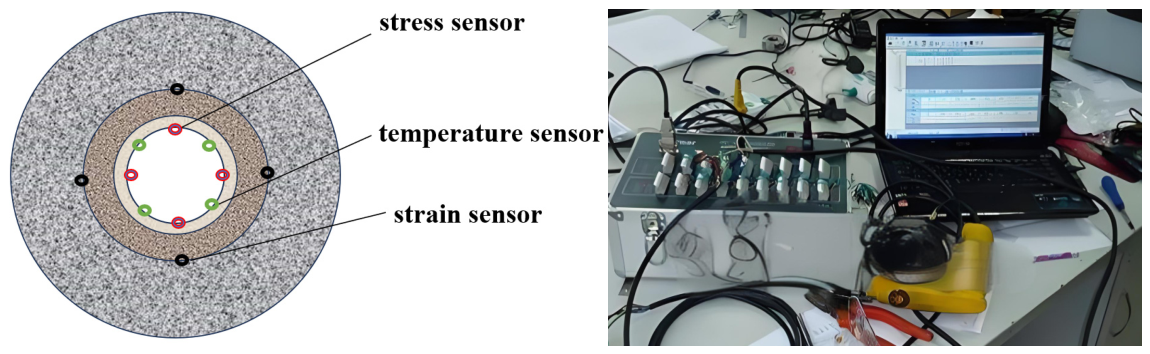
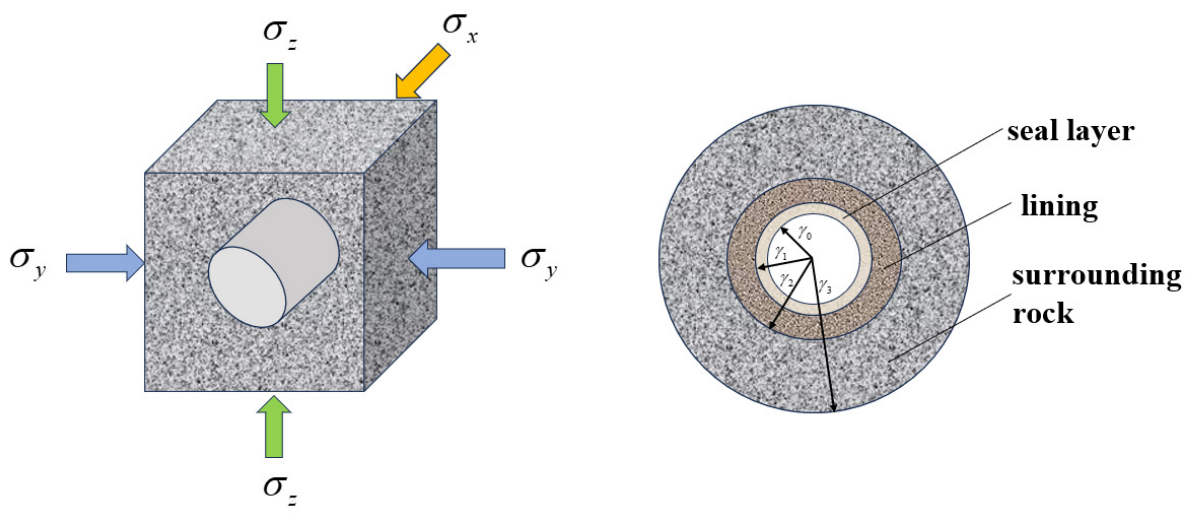
The entire physical model of the compressed air energy storage system is primarily composed of three parts: the surrounding rock, the cement mortar lining (with reinforcement), and the sealing layer (airtight concrete) (see Figure 6) [44,45,46,47]. During the experimental process, a cement mortar lining with a diameter of 500 mm and a wall thickness of 50 mm is first cast and secured to both ends using 25 mm thick sealing flanges with tie bolts. When casting the surrounding rock-like material, the mortar lining, which has been equipped with various monitoring instruments, is fixed in the pre-designed position and cast together with the surrounding rock. Each layer is cast with a thickness of 100 mm, with the casting process carried out in layers until a complete similar model of 1400 mm × 1400 mm × 700 mm is formed. The sensor layout and monitoring system are shown in Figure 7, mainly including stress monitoring, strain monitoring, and temperature monitoring. The aim is to obtain the deformation and loading characteristics of the composite structure of the sealing layer-lining-surrounding rock of the gas storage cavern, as well as the temperature change trend, under repeated charging and discharging conditions.

3.3. Experimental Process and Result Analysis

In the compressed air energy storage model experiment, in order to accurately obtain the key parameters of the low-frequency high- and low-pressure loading and unloading process of compressed air energy storage, two sets of gas storage model experiments were conducted in conjunction with different design conditions (pressure holding tests under different stress combinations, and tests with different cycle numbers under the same stress combination).
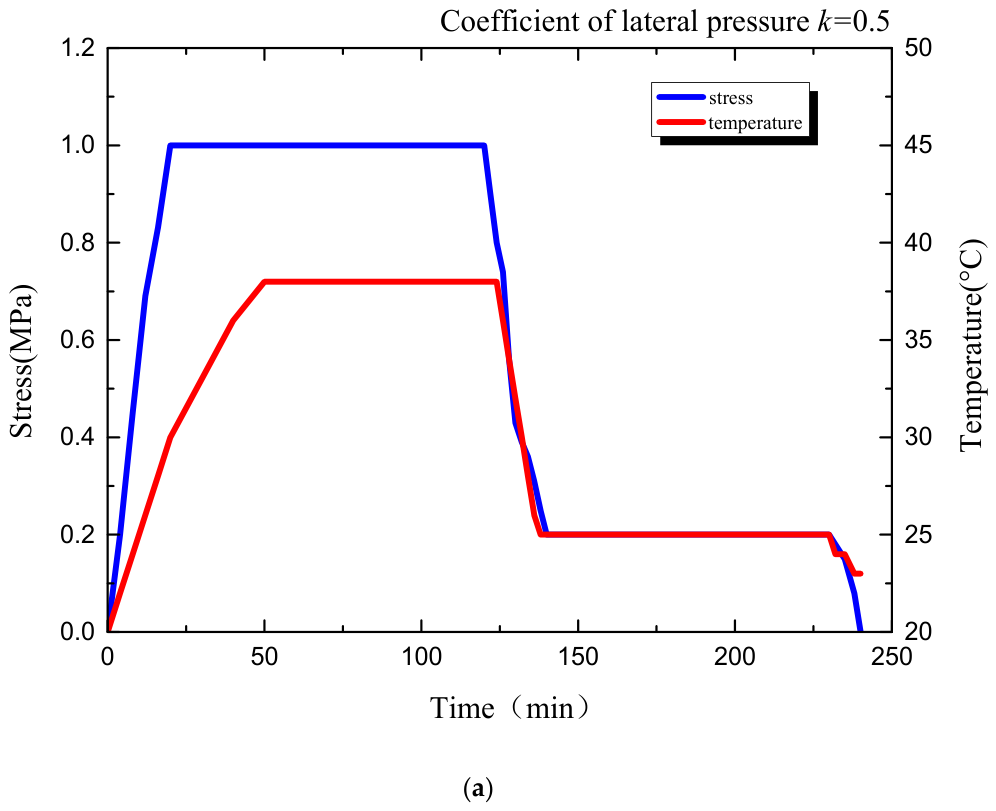
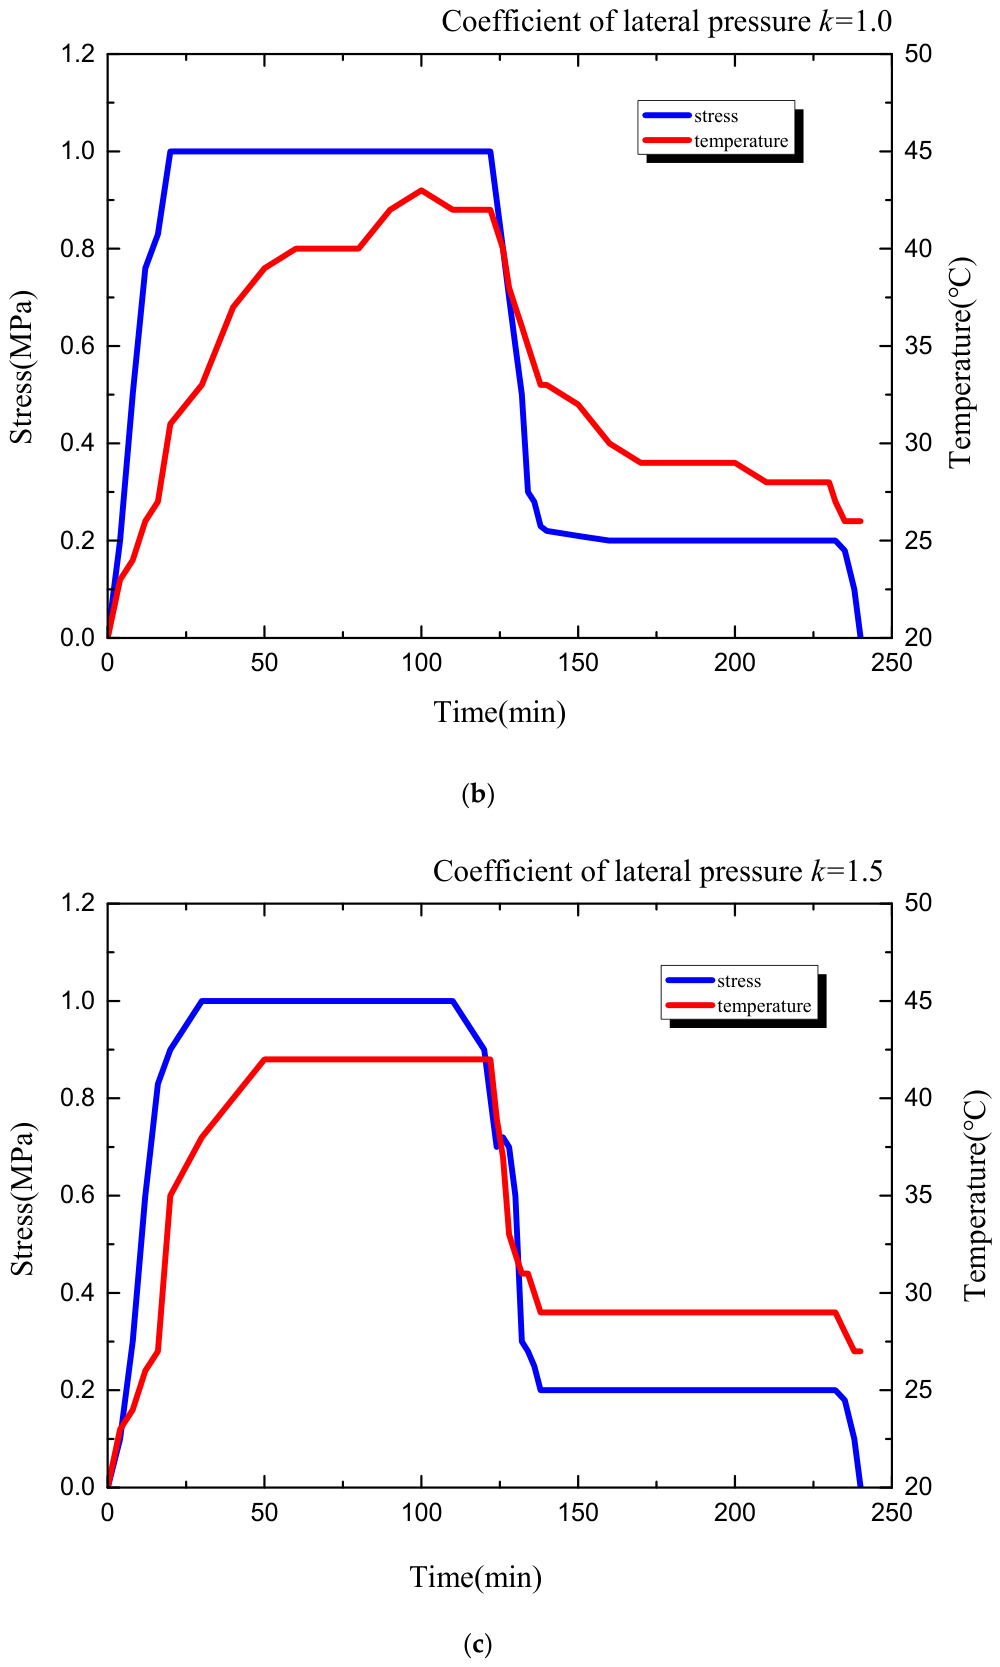
Experiment One: Pressure holding tests under different stress combinations. Different lateral pressure coefficients (0.5, 1.0, 1.5) were set, and air was charged into the cavern. When the stress inside the cavern (gas pressure acting on the tunnel wall) reached 1.0 MPa, the charging was stopped, and the pressure was maintained for 120 min. Then, the air was released until the cavern stress reached 0.2 MPa, and the pressure was maintained for 120 min until the end. By arranging stress sensors and temperature sensors on the outer surface of the sealing layer, the stress and temperature changes on the outer surface of the sealing layer were studied to determine the sealing performance of the sealing layer. The figure shows the stress and temperature change processes during the cavern charging and discharging processes under different lateral pressure conditions. It can be seen from Figure 8 that the charging and discharging processes in the cavern each last for 2 h, and the stress remains essentially unchanged throughout the process, indicating that the sealing layer has good sealing performance. During the charging process, the temperature rises accordingly, and during the charging and pressure-holding process, the temperature will continue to rise for a while until it stabilizes, with higher lateral pressure coefficients resulting in higher temperatures; during the discharging process, the temperature decreases accordingly, and the higher the lateral pressure coefficient, the smaller the temperature drop. This indicates that under normal operating conditions of the compressed air energy storage cavern, the cavern will experience the coupled effects of stress and temperature cycles.
Injecting high-pressure air into the cavern, this adiabatic compression process is the main reason for the temperature rise. Work is done on the gas, increasing its internal energy, which manifests as a temperature increase. The continued temperature rise during the pressure maintenance period is due to thermal inertia and thermal relaxation; the heat generated during the compression process does not instantaneously distribute evenly throughout the entire cavern-seal layer-rock mass system. After injection stops, heat from hotspot areas (such as near the injection point) continues to conduct and convect toward lower-temperature regions (such as the outer surface of the seal layer or deeper rock mass), causing the temperature measured by sensors to continue rising until the entire local area reaches a new thermal equilibrium. At this point, the temperature stabilizes. When releasing high-pressure air from the cavern, the temperature decreases, and the higher the lateral pressure coefficient, the smaller the temperature drop. The reason is that the high-pressure air flowing out of the cavern expands and does work externally, consuming its own internal energy, which causes a sharp drop in temperature. This is the adiabatic expansion effect, which is the main reason for the temperature decrease. Furthermore, the influence of the lateral pressure coefficient is key to revealing the thermal-mechanical coupling. A high lateral pressure coefficient (e.g., 1.5) means that the surrounding rock mass has a strong “hooping” effect on the cavern, with a significant constraining force. During air release, the cavern volume is less likely to contract (rebound). The work done by the expanding air is not only used to reduce its own internal energy (causing cooling) but also to overcome the constraining force of the rock mass. Part of the energy is converted into elastic potential energy of the rock mass, so less energy is used to reduce the internal energy of the air (manifested as a temperature drop), resulting in a smaller observed temperature decrease. In contrast, a low lateral pressure coefficient (e.g., 0.5) means the constraining force of the rock mass is weak. During air release, the cavern wall more easily contracts inward, and the work done by expansion is primarily used to reduce the air’s own internal energy, leading to a very significant temperature drop.
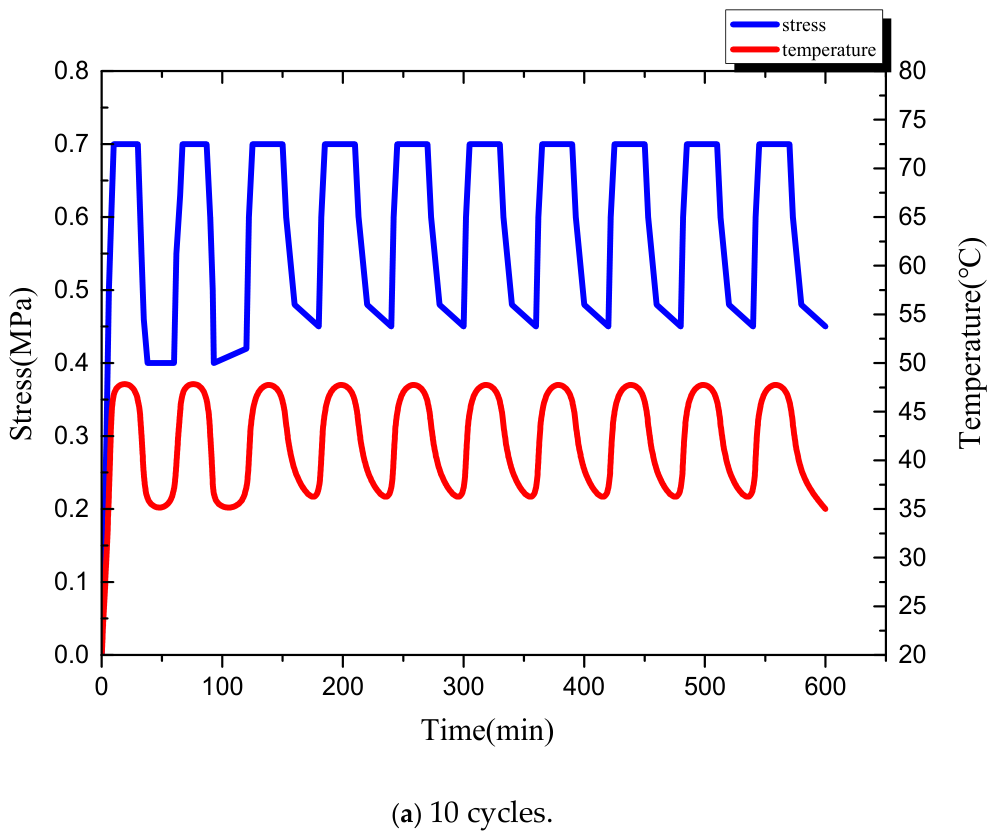
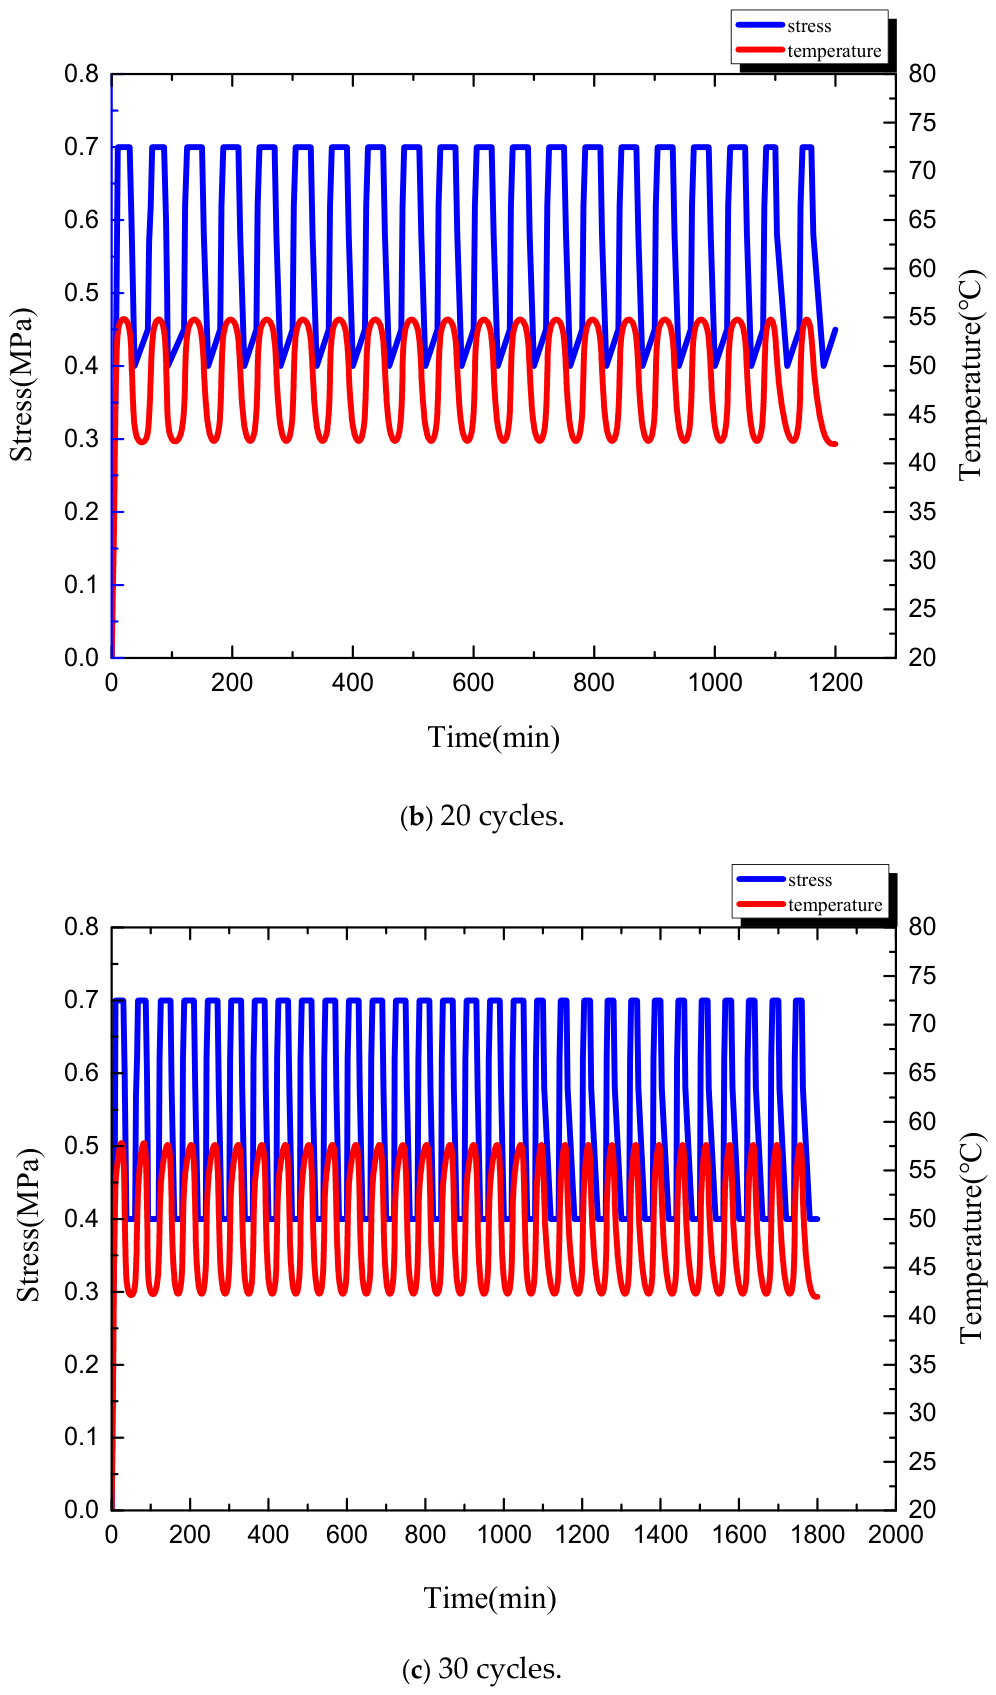
Experiment Two: Cyclic charge and discharge tests under the same stress combination. The lateral pressure coefficient is kept constant at 1.0, and the charge and discharge processes are carried out 10, 20, and 30 times, respectively. A single-cycle process involves first charging air into the cavern until the stress inside the cavern reaches 0.7 MPa, at which point the charging is stopped and the pressure is maintained for 20 min, then the air is released until the cavern stress reaches 0.4 MPa, and the pressure is maintained for 20 min until the end, with the entire single-cycle process lasting 60 min. Figure 9 shows the changes in pressure and temperature during different cyclic charge and discharge processes. It can be seen from the figure that the temperature rises during the charging process and decreases during the discharging process, and the temperature also fluctuates up and down during the cyclic charge and discharge process. This indicates that under long-term operating conditions of compressed air energy storage, the cavern repeatedly experiences the coupled effects of stress and temperature cycles. During the cyclic charge and discharge process, the stress remains at a certain level, indicating that the sealing layer has good sealing performance, which can meet the needs of long-term operation of the compressed air energy storage cavern. In addition, the more cycles there are, the greater the amplitude of temperature change tends to be, indicating that under long-term operating conditions, the number of charge and discharge cycles of the compressed air energy storage cavern can affect the temperature changes inside the cavern, and the longer the operating time, the greater the impact of temperature factors on the sealing and stability of the cavern.
Over multiple cycles, the seal layer and the surrounding rock participate in the thermal cycle and are no longer constant-temperature bodies. In the initial cycles, during air injection, heat transfers from the air to the surrounding rock. During air release, the surrounding rock has not yet fully dissipated the absorbed heat to deeper strata, and its temperature has already slightly increased. When the next injection cycle begins, the initial temperature of the surrounding rock is higher than in the previous cycle. This means the temperature difference between the air and the surrounding rock decreases, and according to Fourier’s law, the rate of heat conduction from the air to the surrounding rock slows down. In subsequent cycles, a “heat retention effect” occurs: as each cycle “injects” a portion of heat into the surrounding rock, the temperature of the surrounding rock gradually accumulates and increases cycle by cycle, forming an expanding “thermal affected zone.” After the surrounding rock temperature rises, its ability to absorb newly generated compression heat as a “heat sink” decreases. Consequently, more heat remains in the air, causing the peak temperature at the end of injection to become higher with each cycle. Similarly, during the pressure maintenance phase after air release, the hotter surrounding rock transfers more heat to the cooler air, causing the temperature to rebound faster and higher. When the next air release begins, the initial temperature of the air is also higher, so the minimum temperature at the end of the air release becomes higher with each cycle. In simple terms, the surrounding rock is “preheated.” Preheated rock is less effective at cooling the air during injection but more effective at heating the air during release. Together, this causes the temperature fluctuation amplitude (the difference between the highest and lowest temperatures) of the air itself to increase as the number of cycles rises.
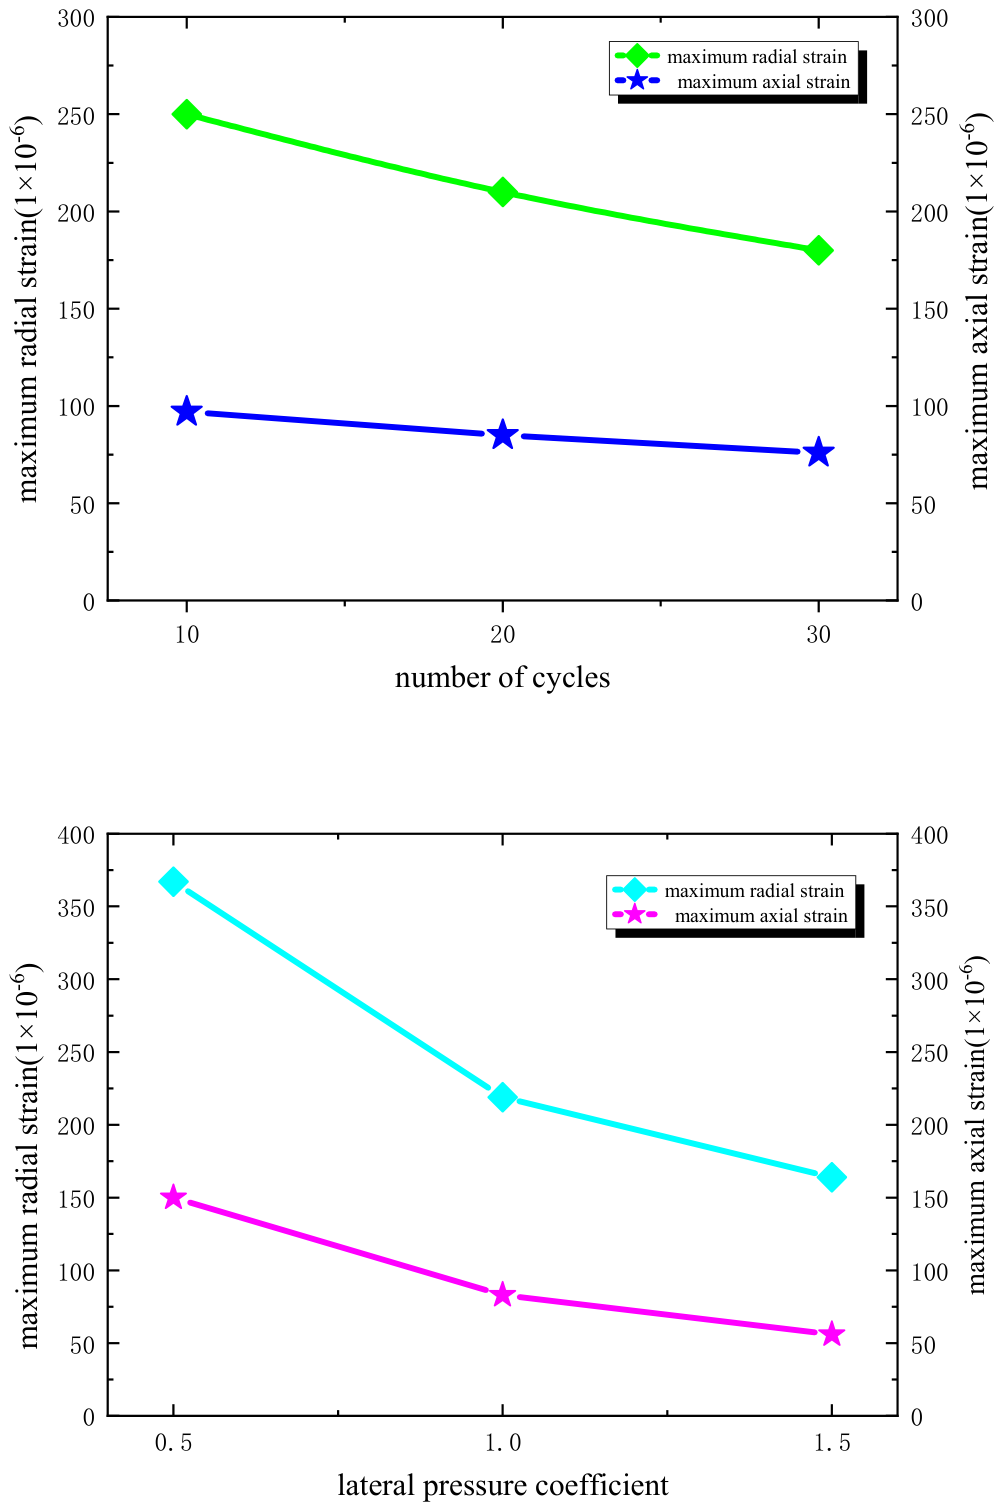
Figure 10 presents the monitoring data from the strain sensors on the outer wall of the lining. The monitoring results show that the deformation of the lining is significantly affected by the internal air pressure, with radial deformation being the primary mode of deformation. As the number of cycles increases, both the maximum axial and radial strains exhibit a downward trend. This indicates that with an increasing number of charge and discharge cycles, the disturbance of air pressure on the lining gradually weakens, reflecting the adaptability of the lining material to cyclic loads. With an increase in the lateral pressure coefficient, both the maximum axial and radial strains on the lining’s outer wall decrease. This is due to the enhanced confinement effect of the surrounding rock on the cavern when the lateral pressure is increased, thereby reducing the deformation of the lining to a certain extent. When the cavern is under high-pressure storage, the strain values inside the lining are higher; under low-pressure storage, the strain values are lower. Changes in the lateral pressure coefficient have a significant impact on both the radial and axial strains of the lining. Under high lateral pressure coefficients, the strain values of the lining are smaller because the confinement effect of the surrounding rock on the cavern is stronger, effectively dispersing the internal stresses of the cavern. Under low lateral pressure coefficients, the confinement effect of the surrounding rock is reduced, and the lining will experience greater deformation.

4. Conclusions

This study optimized the mixed design of a sealing layer for simulated compressed air energy storage (CAES) using an orthogonal experimental design method. Through extensive testing, a sealing material with great air tightness was developed. The engineered sealing material was applied to a physical CAES model, and charge–discharge tests were conducted on the sealing layer-lining-surrounding rock structure under various operating conditions. The key findings are summarized as follows:
  • The content of fly ash and silica fume showed the greatest influence on longitudinal wave velocity, followed by basalt fiber content. Porosity decreased with a higher sand ratio and increased fly ash/silica fume content. Porosity gradually increased with a higher water–cement ratio. Reducing water content and water–cement ratio proved effective in decreasing porosity. Basalt fiber, fly ash, and silica fume have a significant influence on the uniaxial compressive strength, tensile strength, and elastic modulus of the samples.
  • Orthogonal test analysis of factors affecting permeability coefficient yielded the optimal mix: water–cement ratio 0.36, sand ratio 42%, fly ash/silica fume 22%, and basalt fiber 1.0%. Under this optimal mix proportion, the measured permeability coefficient of the sealing layer is 1.92 × 10⁻¹³ cm/s, and the uniaxial compressive strength and tensile strength are 37 MPa and 3.9 MPa, respectively, with a corresponding elastic modulus of 18 GPa. Meanwhile, the P-wave velocity is approximately 2823 m/s, and the porosity is 0.15.
  • Temperature increased during charging and decreased during discharging, exhibiting cyclic variations during repeated charge–discharge processes. Throughout cycling, stress remained stable, demonstrating the sealing layer’s great airtightness for long-term CAES cavern operation. Moreover, temperature fluctuation amplitude tended to increase with more cycles, indicating growing thermal effects on cavern sealing performance and stability.
  • Radial deformation dominated the cavern’s deformation pattern. Increased lateral pressure enhanced surrounding rock confinement, thereby reducing lining deformation. Under high lateral pressure coefficients, smaller lining strain occurred due to stronger rock confinement that effectively distributed internal stresses. Lower lateral pressure coefficients weakened rock confinement, resulting in greater lining deformation.

Author Contributions

Conceptualization, J.X.; methodology, J.X.; software, Y.G.; validation, J.J.; formal analysis, Y.G.; investigation, C.Z. and X.X.; resources, J.X.; writing—original draft preparation, Y.G.; writing—review and editing, J.X.; funding acquisition, J.X. All authors have read and agreed to the published version of the manuscript.

Funding

This research is financially supported by the National Natural Science Foundation of China (Grant No. 42577168).

Institutional Review Board Statement

“Not applicable” for studies not involving humans or animals.

Informed Consent Statement

“Not applicable.” for studies not involving humans.

Data Availability Statement

The original contributions presented in this study are included in the article. Further inquiries can be directed to the corresponding author.

Conflicts of Interest

The authors declare that they have no known competing financial interest or personal relationships that could have appeared to influence the work reported in this paper.

References

  1. Guney, M.S.; Tepe, Y. Classification and assessment of energy storage systems. Renew. Sustain. Energy Rev. 2017, 75, 1187–1197. [Google Scholar] [CrossRef]
  2. Budt, M.; Wolf, D.; Span, R.; Yan, J. A review on compressed air energy storage: Basic principles, past milestones and recent developments. Appl. Energy 2016, 170, 250–268. [Google Scholar] [CrossRef]
  3. Lotfi, H.; Nikkhah, M.H. Multi-objective profit-based unit commitment with renewable energy and energy storage units using a modified optimization method. Sustainability 2024, 16, 1708. [Google Scholar] [CrossRef]
  4. Fotopoulou, M.; Pediaditis, P.; Skopetou, N.; Rakopoulos, D.; Christopoulos, S.; Kartalidis, A. A review of the energy storage systems of non-interconnected European islands. Sustainability 2024, 16, 1572. [Google Scholar] [CrossRef]
  5. Jiang, J.; Guo, P.; Yu, X.; Lin, Q.; Li, Z.; Wu, J.; Wu, J. Stability of lower limit of air pressure in abandoned coal mine roadways during long-term CAES. Front. Ecol. Evol. 2023, 11, 1196749. [Google Scholar] [CrossRef]
  6. Schmidt, F.; Menéndez, J.; Konietzky, H.; Jiang, Z.; Fernández-Oro, J.M.; Álvarez, L.; Bernardo-Sánchez, A. Technical feasibility of lined mining tunnels in closed coal mines as underground reservoirs of compressed air energy storage systems. J. Energy Storage 2024, 78, 110055. [Google Scholar] [CrossRef]
  7. Zhang, S.; Wang, H.; Li, R.; Li, C.; Hou, F.; Ben, Y. Thermodynamic analysis of cavern and throttle valve in large-scale compressed air energy storage system. Energy Convers. Manag. 2019, 183, 721–731. [Google Scholar] [CrossRef]
  8. Bouman, E.A.; Øberg, M.M.; Hertwich, E.G. Environmental impacts of balancing offshore wind power with compressed air energy storage (CAES). Energy 2016, 95, 91–98. [Google Scholar] [CrossRef]
  9. Bu, X.; Huang, S.; Liu, S.; Yang, Y.; Shu, J.; Tan, X.; Chen, H.; Wang, G. Efficient utilization of abandoned mines for isobaric compressed air energy storage. Energy 2024, 311, 133392. [Google Scholar] [CrossRef]
  10. Chen, X.; Wang, J. Stability analysis for compressed air energy storage cavern with initial excavation damage zone in an abandoned mining tunnel. J. Energy Storage 2022, 45, 103725. [Google Scholar] [CrossRef]
  11. Dindorf, R. Study of the energy efficiency of compressed air storage tanks. Sustainability 2024, 16, 1664. [Google Scholar] [CrossRef]
  12. Menéndez, J.; Fernández-Oro, J.M.; Galdo, M.; Álvarez, L.; Bernardo-Sánchez, A. Numerical investigation of underground reservoirs in compressed air energy storage systems considering different operating conditions: Influence of thermodynamic performance on the energy balance and round-trip efficiency. J. Energy Storage 2022, 46, 103816. [Google Scholar] [CrossRef]
  13. Jiang, Z.; Li, P.; Tang, D.; Zhao, H.; Li, Y. Experimental and Numerical Investigations of Small-Scale Lined Rock Cavern at Shallow Depth for Compressed Air Energy Storage. Rock Mech. Rock Eng. 2020, 53, 2671. [Google Scholar] [CrossRef]
  14. Jiang, Z.; Gan, L.; Zhang, D.; Xiao, Z.; Liao, J. Distribution characteristics and evolution laws of liner cracks in underground caverns for compressed air energy storage. Chin. J. Geotech. Eng. 2024, 46, 110–119. [Google Scholar] [CrossRef]
  15. Tong, Z.; Cheng, Z.; Tong, S. A review on the development of compressed air energy storage in China: Technical and economic challenges to commercialization. Renew. Sustain. Energy Rev. 2021, 135, 110178. [Google Scholar] [CrossRef]
  16. Li, W.; Miao, X.; Yang, C. Failure analysis for gas storage salt cavern by thermo-mechanical modelling considering rock salt creep. J. Energy Storage 2020, 32, 102004. [Google Scholar] [CrossRef]
  17. He, W.; Wang, J.; Wang, Y.; Ding, Y.; Chen, H.; Wu, Y.; Garvey, S. Study of cycle-to-cycle dynamic characteristics of adiabatic Compressed Air Energy Storage using packed bed Thermal Energy Storage. Energy 2017, 141, 2120–2134. [Google Scholar] [CrossRef]
  18. Ibrahim, H.; Younès, R.; Ilinca, A.; Dimitrova, M.; Perron, J. Study and design of a hybrid wind–diesel-compressed air energy storage system for remote areas. Appl. Energy 2010, 87, 1749–1762. [Google Scholar] [CrossRef]
  19. Li, T.; Chen, L.; Liu, H.; Cui, S.; Mei, S. Configuration optimization for advanced adiabatic compressed air energy storage considering thermal coupling characteristics. J. Energy Storage 2025, 131, 117249. [Google Scholar] [CrossRef]
  20. Liu, X.; Yang, J.; Yang, C.; Zhang, Z.; Chen, W. Numerical simulation on cavern support of compressed air energy storage (CAES) considering thermo-mechanical coupling effect. Energy 2023, 282, 128916. [Google Scholar] [CrossRef]
  21. Kim, H.-M.; Rutqvist, J.; Ryu, D.-W.; Choi, B.-H.; Sunwoo, C.; Song, W.-K. Exploring the concept of compressed air energy storage (CAES) in lined rock caverns at shallow depth: A modeling study of air tightness and energy balance. Appl. Energy 2012, 92, 653–667. [Google Scholar] [CrossRef]
  22. Glamheden, R.; Curtis, P. Excavation of a cavern for high-pressure storage of natural gas. Tunn. Undergr. Space Technol. 2006, 21, 56–67. [Google Scholar] [CrossRef]
  23. Allen, R.; Doherty, T.; Kannberg, L. Summary of Selected Compressed Air Energy Storage Studies; Pacific Northwest Labs.: Richland, WA, USA, 1984. [Google Scholar]
  24. Zhuang, X.; Huang, R.; Liang, C.; Rabczuk, T. A coupled thermo-hydro-mechanical model of jointed hard rock for compressed air energy storage. Math. Probl. Eng. 2014, 2, 1–11. [Google Scholar] [CrossRef]
  25. Wu, D.; Wang, J.; Hu, B.; Yang, S.-Q. A coupled thermo-hydro-mechanical model for evaluating air leakage from an unlined compressed air energy storage cavern. Renew. Energy 2020, 146, 907–920. [Google Scholar] [CrossRef]
  26. Rutqvist, J.; Kim, H.-M.; Ryu, D.-W.; Synn, J.-H.; Song, W.-K. Modeling of coupled thermodynamic and geomechanical performance of underground compressed air energy storage in lined rock caverns. Int. J. Rock Mech. Min. Sci. 2012, 52, 71–81. [Google Scholar] [CrossRef]
  27. Chen, W.; Tan, X.; Wu, G.; Yang, J. Research on gas seepage law in laminated salt rock gas storage. Chin. J. Rock Mech. Eng. 2009, 28, 1297–1304. [Google Scholar]
  28. Zhong, W.; Tian, Z.; Wang, T.; Wang, Z. Analytic calculation and experimental study on gas seepage dynamics problem of surrounding rock with an internal cavity. Chin. J. Geotech. Eng. 2014, 36, 339. [Google Scholar] [CrossRef]
  29. Yang, C.; Wang, T. Advance in deep underground energy storage. Chin. J. Rock Mech. Eng. 2022, 41, 1729–1759. [Google Scholar] [CrossRef]
  30. Liu, W.; Li, Y.; Yang, C.; Ma, H.; Liu, J.; Wang, B.; Huang, X. Investigation on permeable characteristics and tightness evaluation of typical interlayers of energy storage caverns in bedded salt rock formations. Chin. J. Rock Mech. Eng. 2014, 33, 500–506. [Google Scholar] [CrossRef]
  31. Ishihata, T. Underground compressed air storage facility for CAES-G/T power plant utilizing an airtight lining. News J. Int. Soc. Rock Mech. 1997, 5, 17–21. [Google Scholar]
  32. Zhou, Y.; Xia, C.; Zhang, P.; Zhou, S.; Hu, Y. Air leakage from an underground lined rock cavern for compressed air energy storage through a rubber seal. In Proceedings of the 13th ISRM International Congress of Rock Mechanics, Montreal, QC, Canada, 10–13 May 2015. [Google Scholar]
  33. Zhou, Y.; Xia, C.; Zhou, S.; Zhang, P. Air tightness and mechanical characteristics of polymeric seals in lined rock caverns (LRCs) for compressed air energy storage (CAES). Chin. J. Rock Mech. Eng. 2018, 37, 2685–2696. [Google Scholar]
  34. Hughes, E.; Das, S.; Van Engelen, N.; Lawn, D. Concrete girders retrofitted with basalt fibre fabric–A feasibility study using lab tests and field application. Eng. Struct. 2021, 238, 112223. [Google Scholar] [CrossRef]
  35. Li, W.; Xu, J.; Shen, L.; Li, Q. Dynamic mechanical properties of basalt fiber reinforced concrete using a split Hopkinson pressure bar. Acta Mater. Compos. Sin. 2008, 25, 135–142. [Google Scholar] [CrossRef]
  36. Gao, L.; Adesina, A.; Das, S. Properties of eco-friendly basalt fibre reinforced concrete designed by Taguchi method. Constr. Build. Mater. 2021, 302, 124161. [Google Scholar] [CrossRef]
  37. Chindaprasirt, P.; Jaturapitakkul, C.; Sinsiri, T. Effect of fly ash fineness on microstructure of blended cement paste. Constr. Build. Mater. 2007, 21, 1534–1541. [Google Scholar] [CrossRef]
  38. Durdziński, P.T.; Dunant, C.F.; Haha, M.B.; Scrivener, K.L. A new quantification method based on SEM-EDS to assess fly ash composition and study the reaction of its individual components in hydrating cement paste. Cem. Concr. Res. 2015, 73, 111–122. [Google Scholar] [CrossRef]
  39. Bernal, S.A.; Juenger, M.C.; Ke, X.; Matthes, W.; Lothenbach, B.; De Belie, N.; Provis, J.L. Characterization of supplementary cementitious materials by thermal analysis. Mater. Struct. 2017, 50, 26. [Google Scholar] [CrossRef]
  40. Li, Y.-F.; Hung, J.-Y.; Syu, J.-Y.; Chang, S.-M.; Kuo, W.-S. Influence of sizing of basalt fiber on the mechanical behavior of basalt fiber reinforced concrete. J. Mater. Res. Technol. 2022, 21, 295–307. [Google Scholar] [CrossRef]
  41. Sagar, B.; Sivakumar, M. Study on basalt fiber reinforced concrete: Mechanical and microstructural properties and analytical modelling of compressive stress-strain curves. Eur. J. Environ. Civ. Eng. 2023, 27, 2088–2115. [Google Scholar] [CrossRef]
  42. GB/T 50081-2019; Standard for Test Methods of Concrete Physical and Mechanical Properties. China Architecture & Building Press: Beijing, China, 2019.
  43. Fu, Q.; Zhang, Z.; Xu, W.; Zhao, X.; Zhang, L.; Wang, Y.; Niu, D. Flexural behavior and prediction model of basalt fiber/polypropylene fiber-reinforced concrete. Int. J. Concr. Struct. Mater. 2022, 16, 31. [Google Scholar] [CrossRef]
  44. Wu, Y.; Zhang, K.; Zhang, X.; Hu, L.; Ding, J.; Huang, Z.; Wang, L.; Fang, H. Experimental study on deformation characteristics of composite structure for underground gas storage in abandoned roadways. J. Min. Saf. Eng. 2024, 41, 1299–1310. [Google Scholar] [CrossRef]
  45. Guo, C.; Zhang, K.; Pan, L.; Cai, Z.; Li, C.; Li, Y. Numerical investigation of a joint approach to thermal energy storage and compressed air energy storage in aquifers. Appl. Energy 2017, 203, 948–958. [Google Scholar] [CrossRef]
  46. Kim, H.-M.; Park, D.; Ryu, D.-W.; Song, W.-K. Parametric sensitivity analysis of ground uplift above pressurized underground rock caverns. Eng. Geol. 2012, 135, 60–65. [Google Scholar] [CrossRef]
  47. Kim, H.-M.; Rutqvist, J.; Jeong, J.-H.; Choi, B.-H.; Ryu, D.-W.; Song, W.-K. Characterizing excavation damaged zone and stability of pressurized lined rock caverns for underground compressed air energy storage. Rock Mech. Rock Eng. 2013, 46, 1113–1124. [Google Scholar]
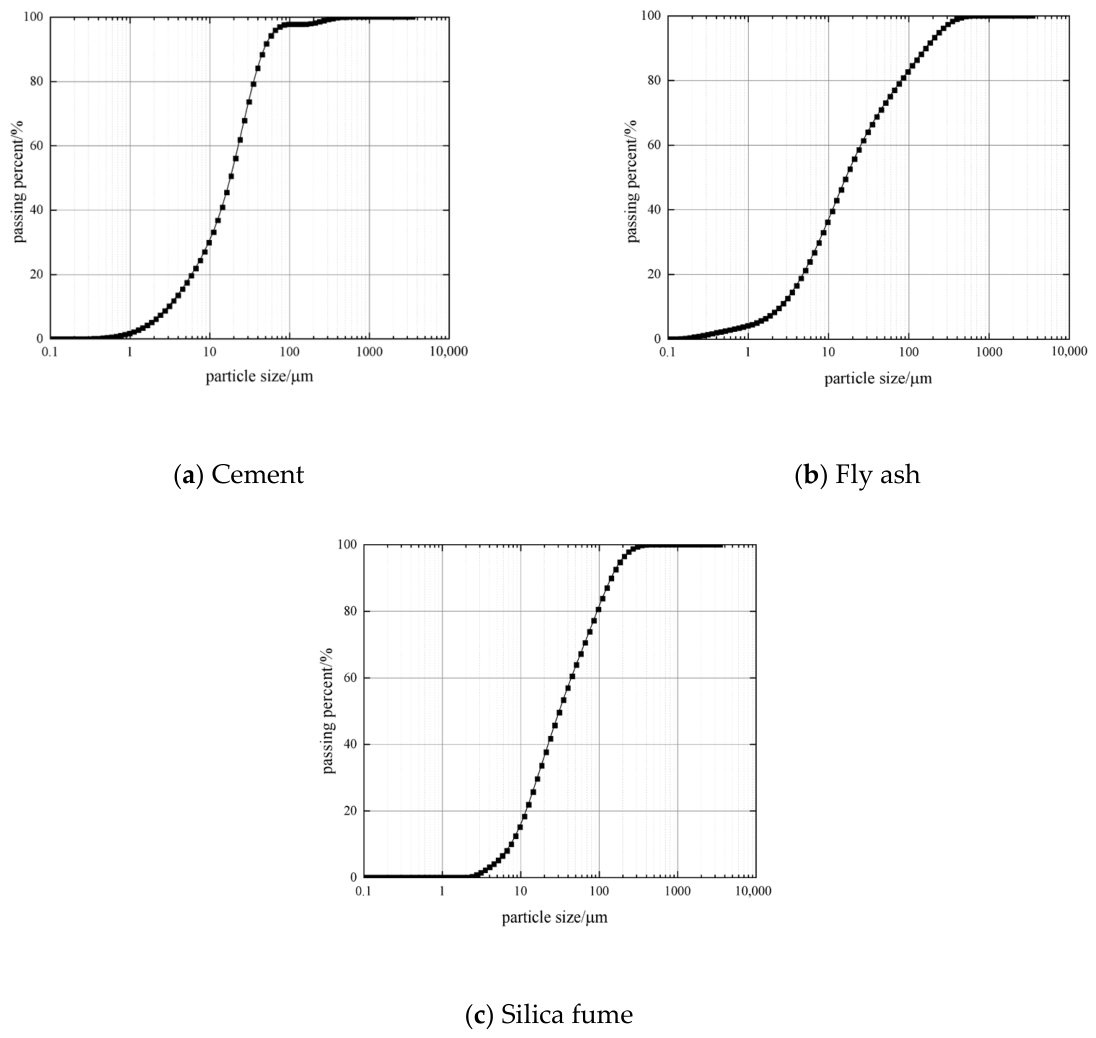
Figure 1. Particle size distribution curves of various materials.
Sustainability 18 06839 g001
Figure 2. Compressed air energy storage sealing layer material samples and testing instruments. (a) Sealing layer samples, (b) RMT-150B testing instrument, (c) SHQ type air permeability coefficient determination device.
Sustainability 18 06839 g002
Figure 3. Sensitivity analysis of P-wave velocity and porosity.
Sustainability 18 06839 g003
Figure 4. Sensitivity analysis of main mechanical parameters.
Sustainability 18 06839 g004aSustainability 18 06839 g004b
Figure 5. Impact of various factors on the permeability of concrete sealing layers.
Sustainability 18 06839 g005
Figure 6. Schematic diagram of the surrounding rock-lining-sealing layer structure.
Sustainability 18 06839 g006
Figure 7. Schematic diagram of the monitoring system layout for the compressed air energy storage similar model.
Sustainability 18 06839 g007
Figure 8. Stress and temperature change patterns during a single charge and discharge process in the pressure-holding test.
Sustainability 18 06839 g008aSustainability 18 06839 g008b
Figure 9. Pressure and temperature change processes during different cyclic charge and discharge processes.
Sustainability 18 06839 g009aSustainability 18 06839 g009b
Figure 10. Strain change patterns on the outer wall of the lining under different cycle numbers and lateral pressure coefficients.
Sustainability 18 06839 g010
Table 1. Raw materials for airtight concrete.
MaterialParameters
CementP·O 42.5 grade cement produced by a cement factory, the ignition loss of this cement is 1.72%.
AggregateCoarse aggregate is limestone gravel with a bulk density of 2620 kg/m3, a bulk density of 1590 kg/m3, and a clay content of 0.8%; Fine aggregate is medium-coarse sand with a bulk density of 2760 kg/m3, a bulk density of 1530 kg/m3, a clay content of 0.3%, and a fineness modulus of 2.8. All aggregates are continuously graded.
AdmixtureThe admixtures include fly ash and silica fume. The fly ash is Grade II fly ash from a nearby power plant with a density of 2236 kg/m3 and a fineness of 14.6%; The 28-day activity index of the silica fume is approximately 105%. Silica fume has a small particle size and complements the fly ash, improving the pore structure of the concrete and enhancing its airtightness.
AdditivesHigh-efficiency low-foaming water reducer FDN and activation densifier SY are used.
Basalt FiberDensity of 2.70 g/cm3, diameter of 0.2 mm, length of 6–14 mm, tensile strength of 2200 MPa, and elastic modulus of 80.3 GPa.
WaterTap water with a pH of approximately 7
Table 2. The main chemical components of cement, fly ash, and silica fume.
MaterialsMass Fraction/%
CaOSiO2Al2O3Fe2O3MgOTiO2SO3P2O5
Cement50.0926.389.614.343.160.872.1-
Fly ash5.743242.50.93-0.8-
Silica fume0.1296.711.310.10.22-0.05-
Table 3. Experimental scheme.
NumberWater-Cement RatioSand Rate/%Fly Ash and Silica Fume Dosage/%Basalt Fiber Dosage/%
10.3636140.2
20.3838160.4
30.4040180.6
40.4242200.8
50.4444221.0
Table 4. Mix proportioning test design.
Test NumberA Water–Cement RatioB Sand Rate/%C Fly Ash and Silica Fume Dosage/%D Basalt Fiber Dosage/%
A11 (0.36)1 (36)1 (14)1 (0.2)
A21 (0.36)2 (38)3 (18)4 (0.8)
A31 (0.36)3 (40)5 (22)2 (0.4)
A41 (0.36)4 (42)2 (16)5 (1.0)
A51 (0.36)5 (44)4 (20)3 (0.6)
A62 (0.38)1 (36)5 (22)4 (0.8)
A72 (0.38)2 (38)2 (16)2 (0.4)
A82 (0.38)3 (40)4 (20)5 (1.0)
A92 (0.38)4 (42)1 (14)3 (0.6)
A102 (0.38)5 (44)3 (18)1 (0.2)
A113 (0.40)1 (36)4 (20)2 (0.4)
A123 (0.40)2 (38)1 (14)5 (1.0)
A133 (0.40)3 (40)3 (18)3 (0.6)
A143 (0.40)4 (42)5 (22)1 (0.2)
A153 (0.40)5 (44)2 (16)4 (0.8)
A164 (0.42)1 (36)3 (18)5 (1.0)
A174 (0.42)2 (38)5 (22)3 (0.6)
A184 (0.42)3 (40)2 (16)1 (0.2)
A194 (0.42)4 (42)4 (20)4 (0.8)
A204 (0.42)5 (44)1 (14)2 (0.4)
A215 (0.44)1 (36)2 (16)3 (0.6)
A225 (0.44)2 (38)4 (20)1 (0.2)
A235 (0.44)3 (40)1 (14)4 (0.8)
A245 (0.44)4 (42)3 (18)2 (0.4)
A255 (0.44)5 (44)5 (22)5 (1.0)
Table 5. Analysis of single-factor influence results from the orthogonal test.
NumberA Water-Cement Ratio/Permeability Coefficient/(10−13 cm/s)B Sand Rate/Permeability Coefficient/(10−13 cm/s)C Fly Ash and Silica Fume/Permeability Coefficient/(10−13 cm/s)D Basalt Fiber/Permeability Coefficient/(10−13 cm/s)
K11.69 (0.09)11.46 (0.76)22.14 (1.09)17.55 (1.35)
K21.93 (0.12)9.22 (0.52)4.56 (0.33)8.21 (0.58)
K38.42 (0.68)6.54 (0.27)2.16 (0.18)3.53 (0.25)
K412.34 (0.8)3.65 (0.09)1.23 (0.05)5.21 (0.39)
K535.11 (2.23)7.05 (0.42)1.02 (0.03)1.18 (0.09)
R33.42 (2.31)7.81 (0.61)21.12 (1.06)16.37 (1.26)
Note: Standard deviations are given in parentheses.
Disclaimer/Publisher’s Note: The statements, opinions and data contained in all publications are solely those of the individual author(s) and contributor(s) and not of MDPI and/or the editor(s). MDPI and/or the editor(s) disclaim responsibility for any injury to people or property resulting from any ideas, methods, instructions or products referred to in the content.