1. Introduction
The energy transition stands out as one of the most relevant challenges currently faced by OECD member countries. In order with the global imperative, the European Commission has released a comprehensive set of directives to guide the EU energy sector toward sustainability and carbon neutrality goals. The primary goal includes reducing greenhouse gas emissions by at least 55% by the year 2030 and achieving net-zero emissions by 2050. These goals demand a significant increase in renewable energy deployment and energy efficiency improvements [
1]. To achieve these targets, the European Union has committed to achieving a minimum of 42.5% renewable energy in its gross final energy consumption by 2030 [
2].
In the year 2023, Slovenia achieved a 25.07% share of renewables in gross final energy consumption. Heating using biomass made the largest contribution, followed by already installed hydropower and an accelerated installation of solar energy, while the transport sector remained behind with only 10.6% renewable energy penetration. The updated National Energy and Climate Plan (NECP) targets at least 33% renewables by 2030, distributed across electricity, heating and cooling and transport sectors. To reduce emissions, the NECP plan is to install additional solar and wind power, a gradual shutdown of the Šoštanj coal-fired power plant, following the complete coal exit by 2033, and during this time, also expanding district heating [
3].
In 2023, Slovenia’s primary energy supply consisted mainly of liquid fuels, nuclear energy, and renewables, with rapid photovoltaic installation. Slovenia’s national projections indicate a cumulative installed solar capacity between 1800 and 3500 MW and 150 MW of installed wind power by 2030 [
4,
5]. Transition to renewable energy sources (RES) positively influences decarbonisation goals, but at the same time, it presents a problem from a grid operation point of view and has a huge impact on the electricity market due to the intermittent and geographically constrained nature of renewable energy sources. The variability and difficult predictability of solar and wind generation complicates the balance between electricity production and demand, increases stress on transmission infrastructure, and requires the electricity market to adapt to highly fluctuating generation patterns [
6]. The effects of hard predictable RES have become more and more visible in European day-ahead electricity markets, where high renewable installation has contributed to growing price volatility and an increased number of hours with negative electricity prices [
7,
8].
Energy storage integration into the power grid is progressively acknowledged as a must-have solution to sort out the surplus electrical system energy and ease the rising negative hours trend. Among the numerous technologies available, pumped hydro storage (PHS) stands out as the most established and highest capacity method. As the share of non-dispatchable renewables grows, the role of PHS is expected to become even more important. PHS systems typically achieve round-trip efficiencies between 70% and 85% [
9,
10,
11,
12,
13]. Efficiency and other general PHS systems characteristics are shown in
Table 1.
PHS operates by using surplus electricity during periods of low demand to pump water from a reservoir on low ground to a high ground upper reservoir, storing energy in the form of potential energy. When electricity demand and prices increase, the stored water is released through turbines to generate electricity [
14]. This operational principle enables time-shifting and load levelling, supporting grid stability and improving the economic and technical feasibility of renewable energy integration [
15]. In real-world applications, PHS plants typically exploit off-peak electricity prices for pumping and deliver fast, dispatchable power during high-price periods, mitigating the intermittency of renewable generation and responding directly to market signals [
6].
Since RES penetration is rising, recent literature is placing increasingly more weight on the importance of optimizing PHS operation under economic and market constraints. Abdelfattah et al. [
13] showed that optimization of PHS can greatly reduce system operating costs by shifting produced energy from low-demand to high-demand periods, even when considering PHS’s operational/technical parameter limitations of storage volume limits and restricted start-ups. This concludes that the economic value of PHS strongly depends on operational schedule strategies instead of relying only on installed capacity.
The economic viability of PHS has also been examined in deregulated electricity markets. Da Silva et al. [
16] studied the influence of PHS in the Brazilian power system and showed that PHS plants can be economically competitive with natural gas thermoelectric plants for peak demand, particularly for longer daily operating durations, if electricity market designs adequately value flexibility services. Results show the relevance of economic operational optimization for PHS in systems experiencing increasing price volatility.
Analyses from real power systems additionally support the operational benefits of PHS. Lozano Medina et al. [
17] investigated the integration of a PHS plant in Gran Canaria and demonstrated its ability to stabilise an isolated power system with high RES penetration while reducing dependence on fossil fuel generation. Despite this study focusing primarily on system-level performance, it confirms the flexibility potential of PHS in renewable-dominated environments.
Day-ahead scheduling approaches, combining PHS with variable RES generation, have also been researched. Results show the potential of pumped storage to support short-term system balancing under market-based dispatch frameworks [
18]. Zhang et al. [
18] developed a day-ahead generation scheduling framework in which PHS is coordinated with wind power to minimize total system operating costs under technical and reservoir constraints. Their approach shows the importance of hourly scheduling decisions for pumped storage operation in systems with high RES penetration, showing that PHS can effectively absorb surplus electricity generated by RES and provide short-term balancing services. Although the optimization is formulated as an economic dispatch problem rather than a price-driven market optimization, the study clearly shows that the economic and operational value of PHS is highly relevant to short-term scheduling on a day-ahead time schedule. This insight is directly relevant for electricity markets, where price formation reflects similar short-term supply/demand dynamics.
Other studies have investigated coordinated operation and capacity sizing of wind–photovoltaic–PHS systems using MILP-based and multi-objective optimization approaches [
19,
20,
21]. Zisos et al. [
22] showed the influence of uncertainty and storage capacity on system performance in hybrid renewable–PHS configurations. While these studies provide valuable insights into long-term planning and hybrid system design, they mainly focus on capacity optimization and system integration rather than short-term, price-driven operation based on real electricity market data.
In addition to economic and operational optimization, recent literature has also highlighted the importance of technical feasibility in scheduling models. Marini et al. [
23] showed that optimization-based scheduling approaches may produce mathematically optimal but technically unfeasible solutions when switching behavior and time discretization effects are not adequately considered. Their analysis demonstrated that such formulations may lead to unrealistic operational patterns, including excessive switching or infeasible system states. This methodological perspective is also relevant for short-term operation models of storage systems, where frequent mode changes may occur in response to volatile market signals.
At the market level, there are various studies which investigated both electricity price dynamics and penetration levels associated with renewables in electricity markets. Prokhorov and Dreisbach [
7] estimated that it is possible that up to 21% of electricity spot market prices per hour in the German-Luxembourg market may turn negative under high penetration levels. Brancucci Martinez-Anido et al. [
24] found that higher levels of wind penetration decrease average electricity spot market prices but increase overall electricity spot price volatility in a similar manner when generation flexibility is constrained. These results are in line with recent observations, which show that in 2024, the European electricity market with high penetration levels has registered a drastic increase in negative price events, where countries in northern Europe recorded 580 negative price hour events up to June 2024 [
8].
The same rising trend was noticed in Slovenia in the year 2024.
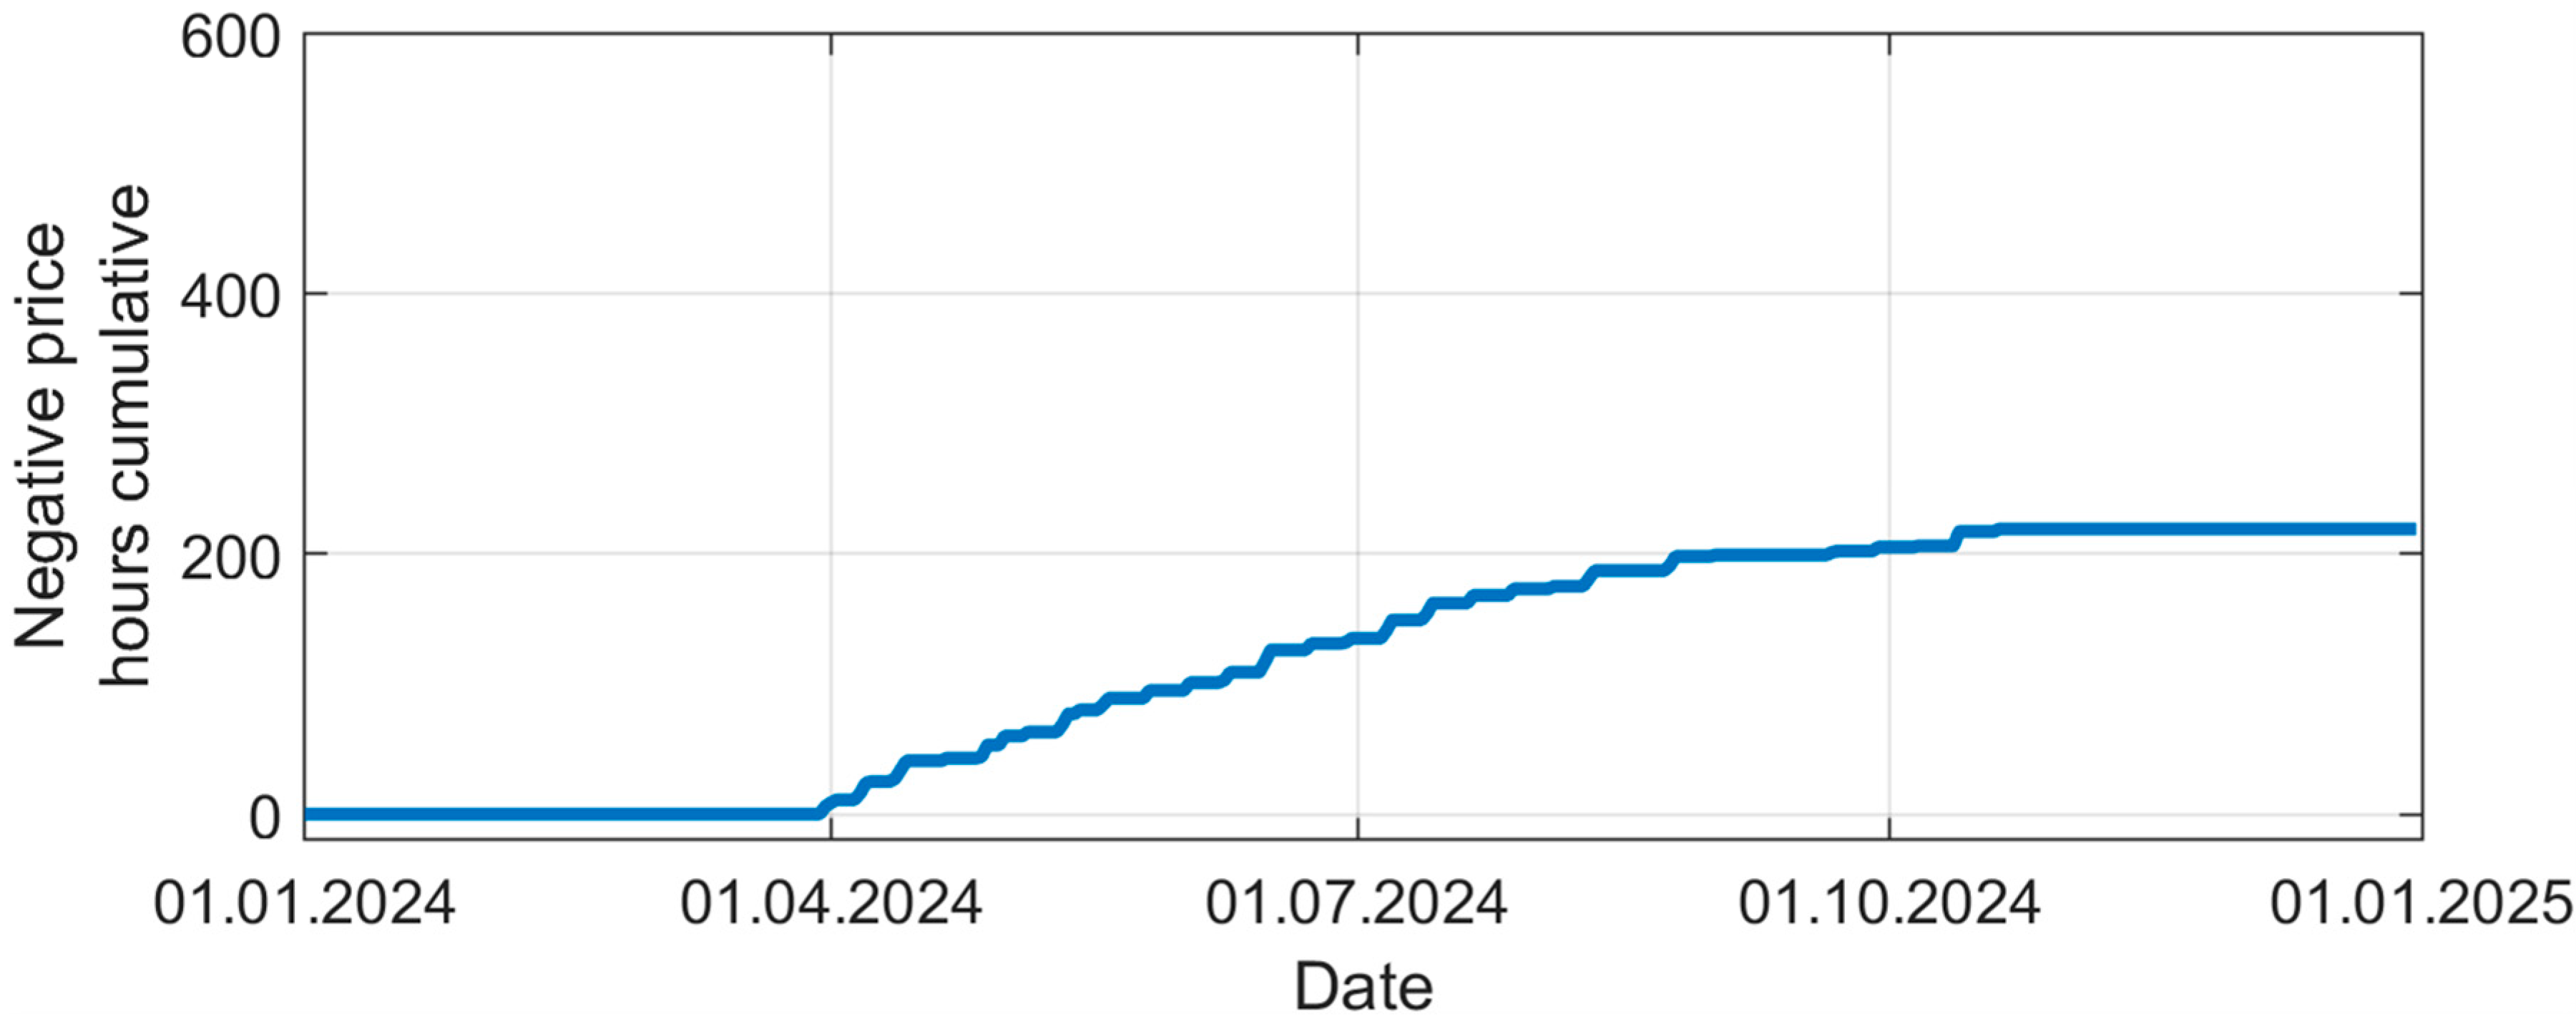
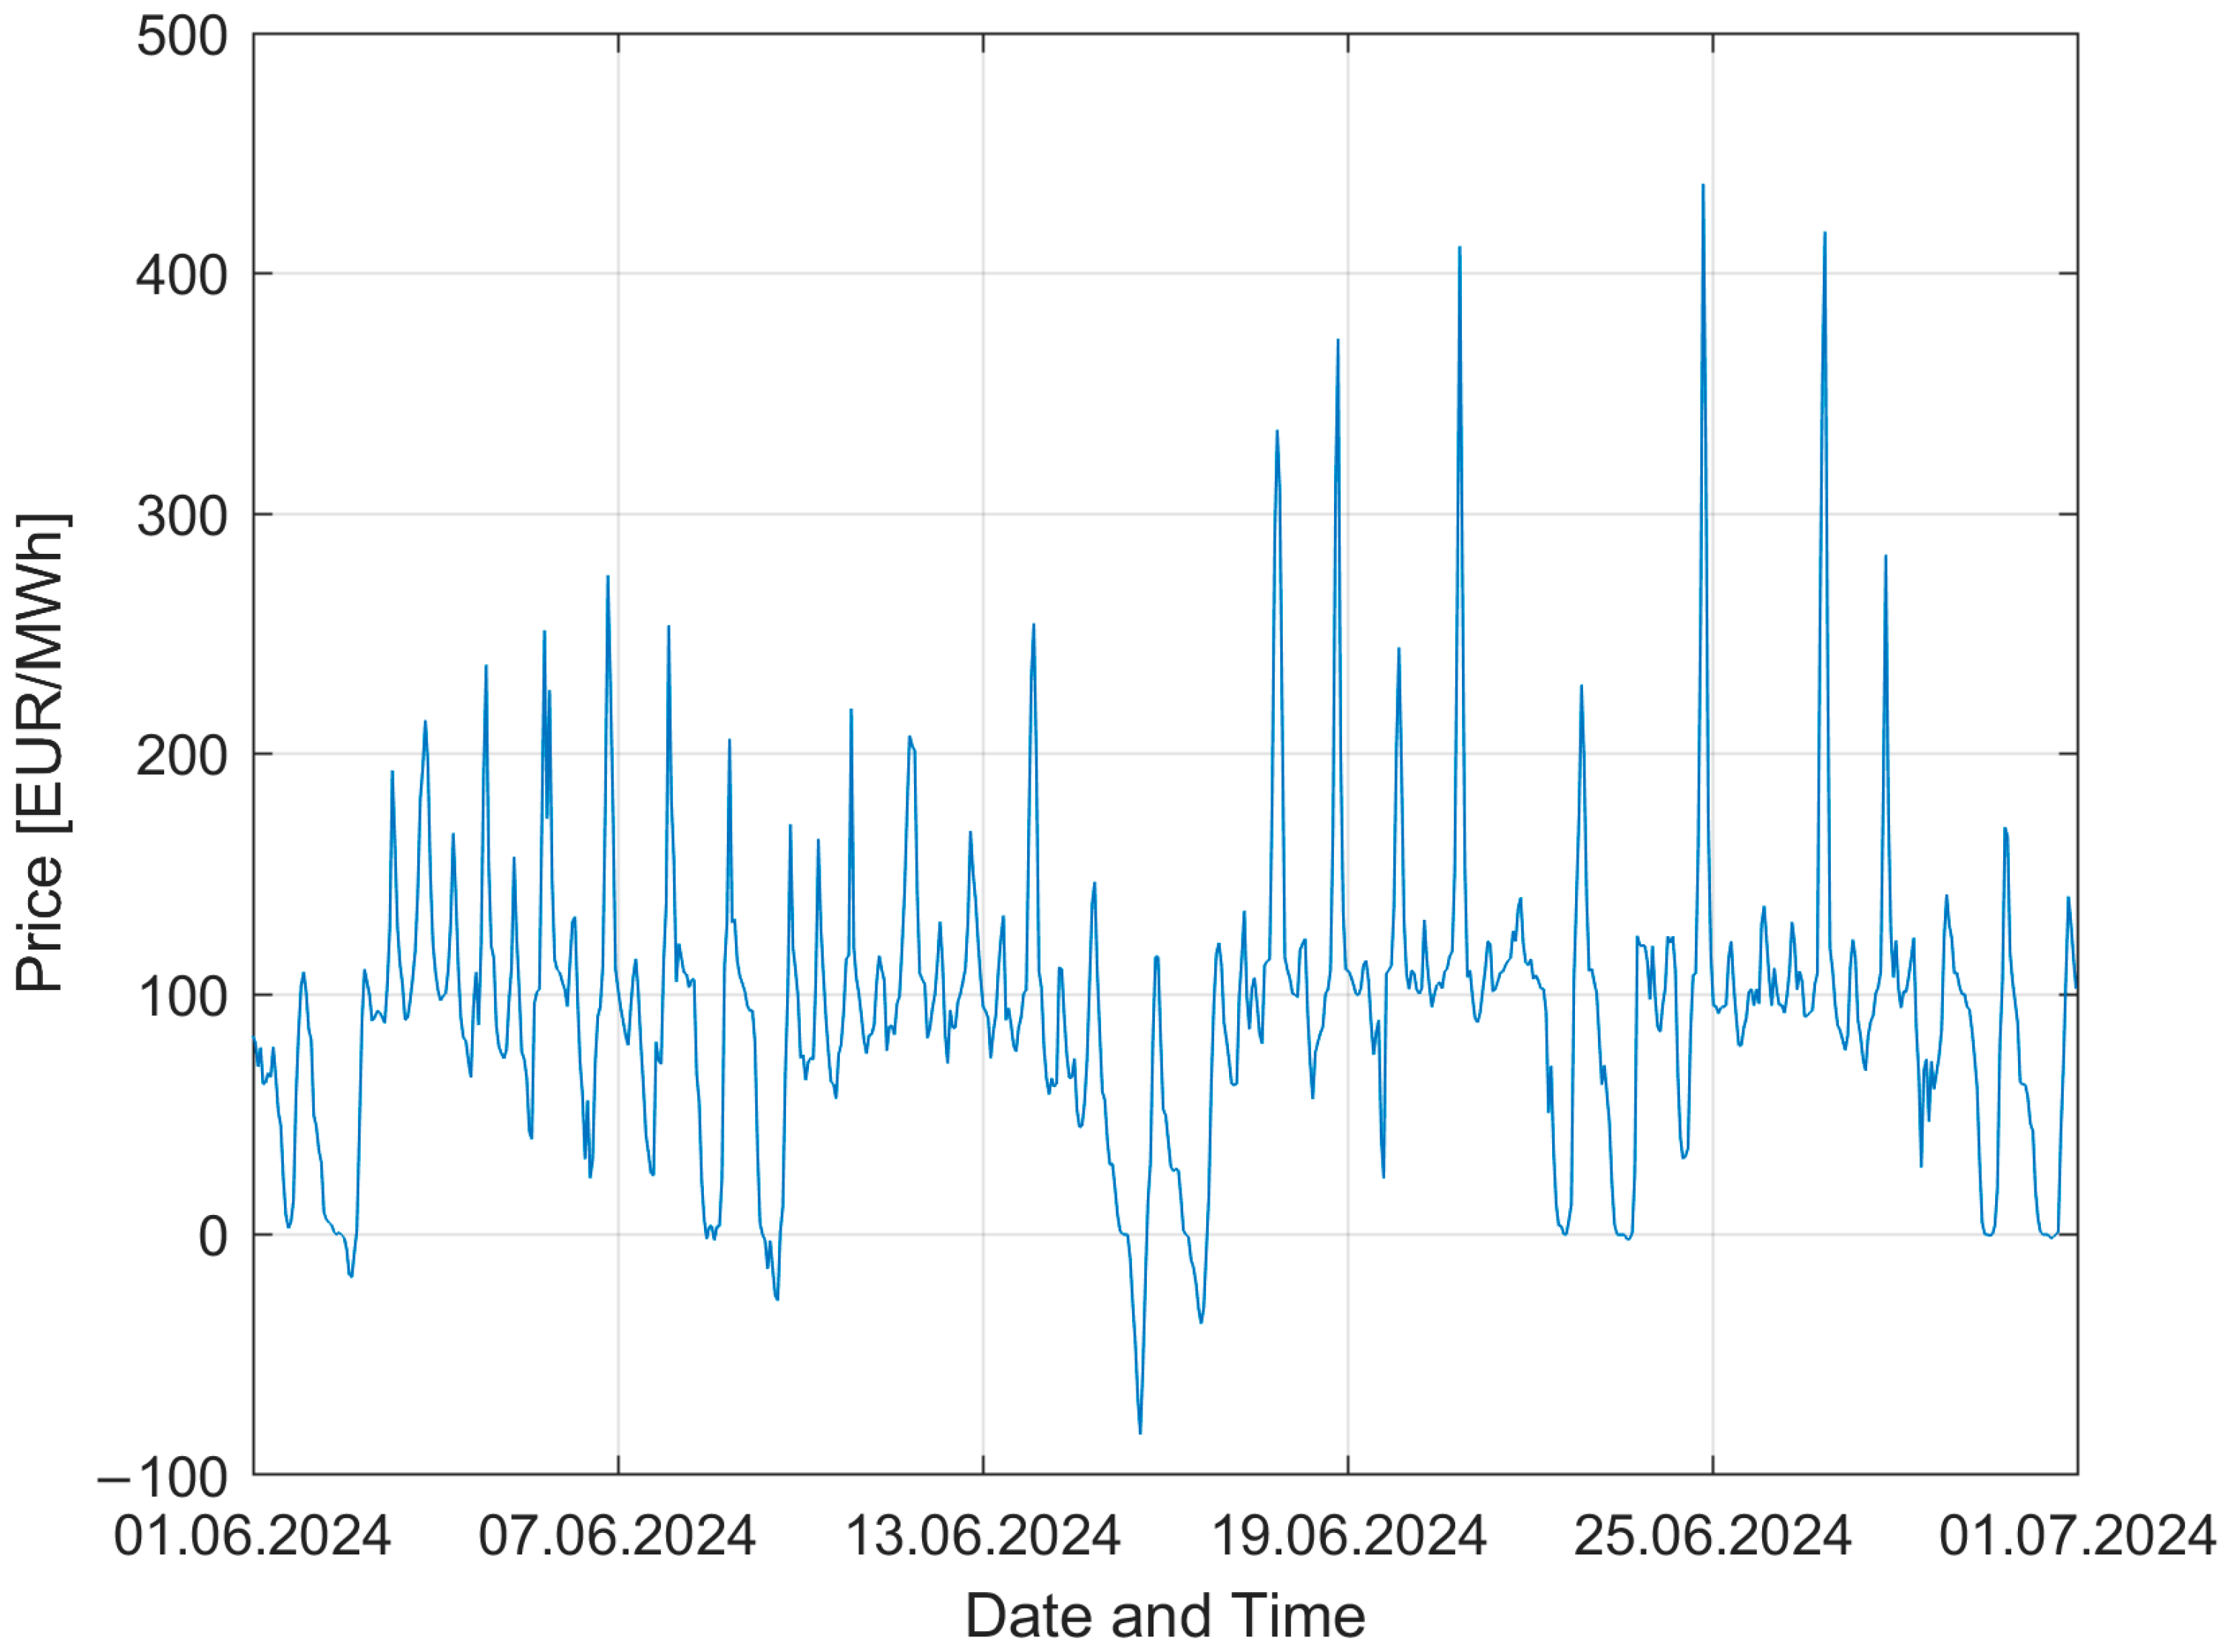
Figure 1 [
25] illustrates the cumulative number of hours with negative day-ahead electricity prices observed in Slovenia during 2024. Although the total number of negative-price hours (219 h) remains lower than in countries with higher installed renewable capacity (580 h until June 2024), the steadily increasing cumulative trend indicates growing price volatility in the Slovenian electricity market. This development reflects the rising penetration of variable renewable energy sources and highlights the increasing importance of flexible generation and energy storage solutions capable of absorbing surplus electricity and responding effectively to short-term market signals.
Despite the numerous studies on PHS and energy storage integration, a research gap remains in the context of short-term, price-driven operational optimization of PHS under real market conditions. Many existing studies focus on capacity sizing, hybrid system design, or long-term system planning, while fewer specifically address hourly operational optimization of PHS based on actual day-ahead electricity prices and realistic operational constraints.
Accordingly, this study addresses the research question of how real 2024 day-ahead electricity price dynamics influence the optimal daily scheduling and annual market-based revenue potential of the planned Kozjak pumped-storage hydropower plant. The fundamental idea underlying this paper was presented at the SDEWES Conference [
26]. The main contributions of the paper are as follows:
a full-year operational optimization of a large planned PHS plant under real 2024 Slovenian day-ahead market conditions,
an analysis of how short-term price volatility, including negative-price events, affects pumping and generating decisions throughout the year and
a quantitative interpretation of startup behavior and seasonal operational variability under realistic technical constraints.
In this context, the term electricity price-driven optimization refers to a modeling approach in which hourly electricity prices act as the primary driver of operational decisions.
A Mixed-Integer Linear Programming (MILP) model is used to optimize hourly pumping and electricity generating schedule using real day-ahead electricity prices for the year 2024 in order to maximize PHS’s income. The model relies on technical and operational constraints, including turbine and pump installed capacities, calculated round-trip efficiency, energy storage limits and restricted start-up frequencies.
This study was conducted independently and is based exclusively on publicly available data. It was not prepared in cooperation with the investor or project developer of the PHS Kozjak project [
27], and it does not include any confidential technical, financial, commercial, or strategic information related to the project. All assumptions, calculations, interpretations, and conclusions presented in this paper are, therefore, solely those of the authors.
2. Materials and Methods
The power generation system examined in this study incorporates a PHS plant designed to operate both in pumping mode for energy storage and turbine mode for electricity generation. The main objective of this analysis is to determine the optimal operation strategy based on the day-ahead electricity prices of the PHS system using the MILP algorithm across a defined time span, in this case, one year, with simulation resolution set to hourly intervals.
The MILP algorithm is a well-established and powerful tool for solving complex optimization problems across numerous fields, including energy dispatch, production planning, logistics, and operational scheduling. Its reliability stems from its ability to iteratively search for the global optimum while managing a mix of continuous and discrete variables. Compared to artificial intelligence (AI) or hybrid intelligence-based algorithms, MILP is relatively simple to code and implement, offers higher precision, and is less computationally intensive. It has been widely applied in energy system optimization, particularly for minimizing total system costs and optimizing resource allocation [
6,
28,
29].
In this work, the MILP model is implemented in MATLAB
® 2024b. The optimization problem is solved using MATLAB function
intlinprog and the model formulation includes the definition of decision variables, integer constraints, linear equations, inequality constraints and the objective function, which represents the cost minimization goal for the PHS plant operation [
6].
The objective function of the optimization model includes only market-based operating terms, namely, electricity revenues from turbine operation and electricity purchase costs for pumping. In this way, the optimization identifies the schedule that minimizes net operating cost or, equivalently, maximizes the market-based operating result under the given hourly day-ahead prices. The formulation is based on the hourly binary operating decisions for turbine and pump modes, together with the corresponding efficiencies, and can be expressed as follows:
where
is the electricity price at hour
,
and
are binary operating variables,
and
are the rated pump and turbine powers, and
and
are the corresponding efficiencies.
The objective is written in minimization form because the optimization solver requires a minimization problem. Accordingly, the objective function is formulated as net operating cost, so that its minimization is equivalent to maximizing the market-based operating result.
A detailed monetary quantification of operation and maintenance (O&M) costs, including startup and shutdown cycling costs, was not incorporated. This simplification is intentional, as the primary objective of the analysis is to compare the relative operational behavior of different scheduling strategies rather than to perform a full techno-economic evaluation. Accurate cost coefficients for start–stop wear, thermal fatigue, and cycling-induced degradation are highly plant-specific and typically proprietary, varying with unit age, design, and maintenance practices. Using generalized or estimated values would introduce uncertainties larger than the expected marginal economic effect, thereby reducing the robustness and reproducibility of the model results.
Instead, cycling effects are accounted for indirectly through constraints on maximum startup frequencies, which is a commonly applied modeling approach when precise degradation cost parameters are unavailable. This ensures that operational limitations are respected without relying on uncertain economic assumptions, while still enabling meaningful comparison between the investigated scenarios.
The operational cost functions used in this study are, therefore, based on generalized formulations commonly applied in the literature for modeling variable operating costs and efficiency-related losses of pumped-storage hydropower plants. These functions are not derived from site-specific O&M data, as no validated and up-to-date cost estimates have been published for the PHS Kozjak project.
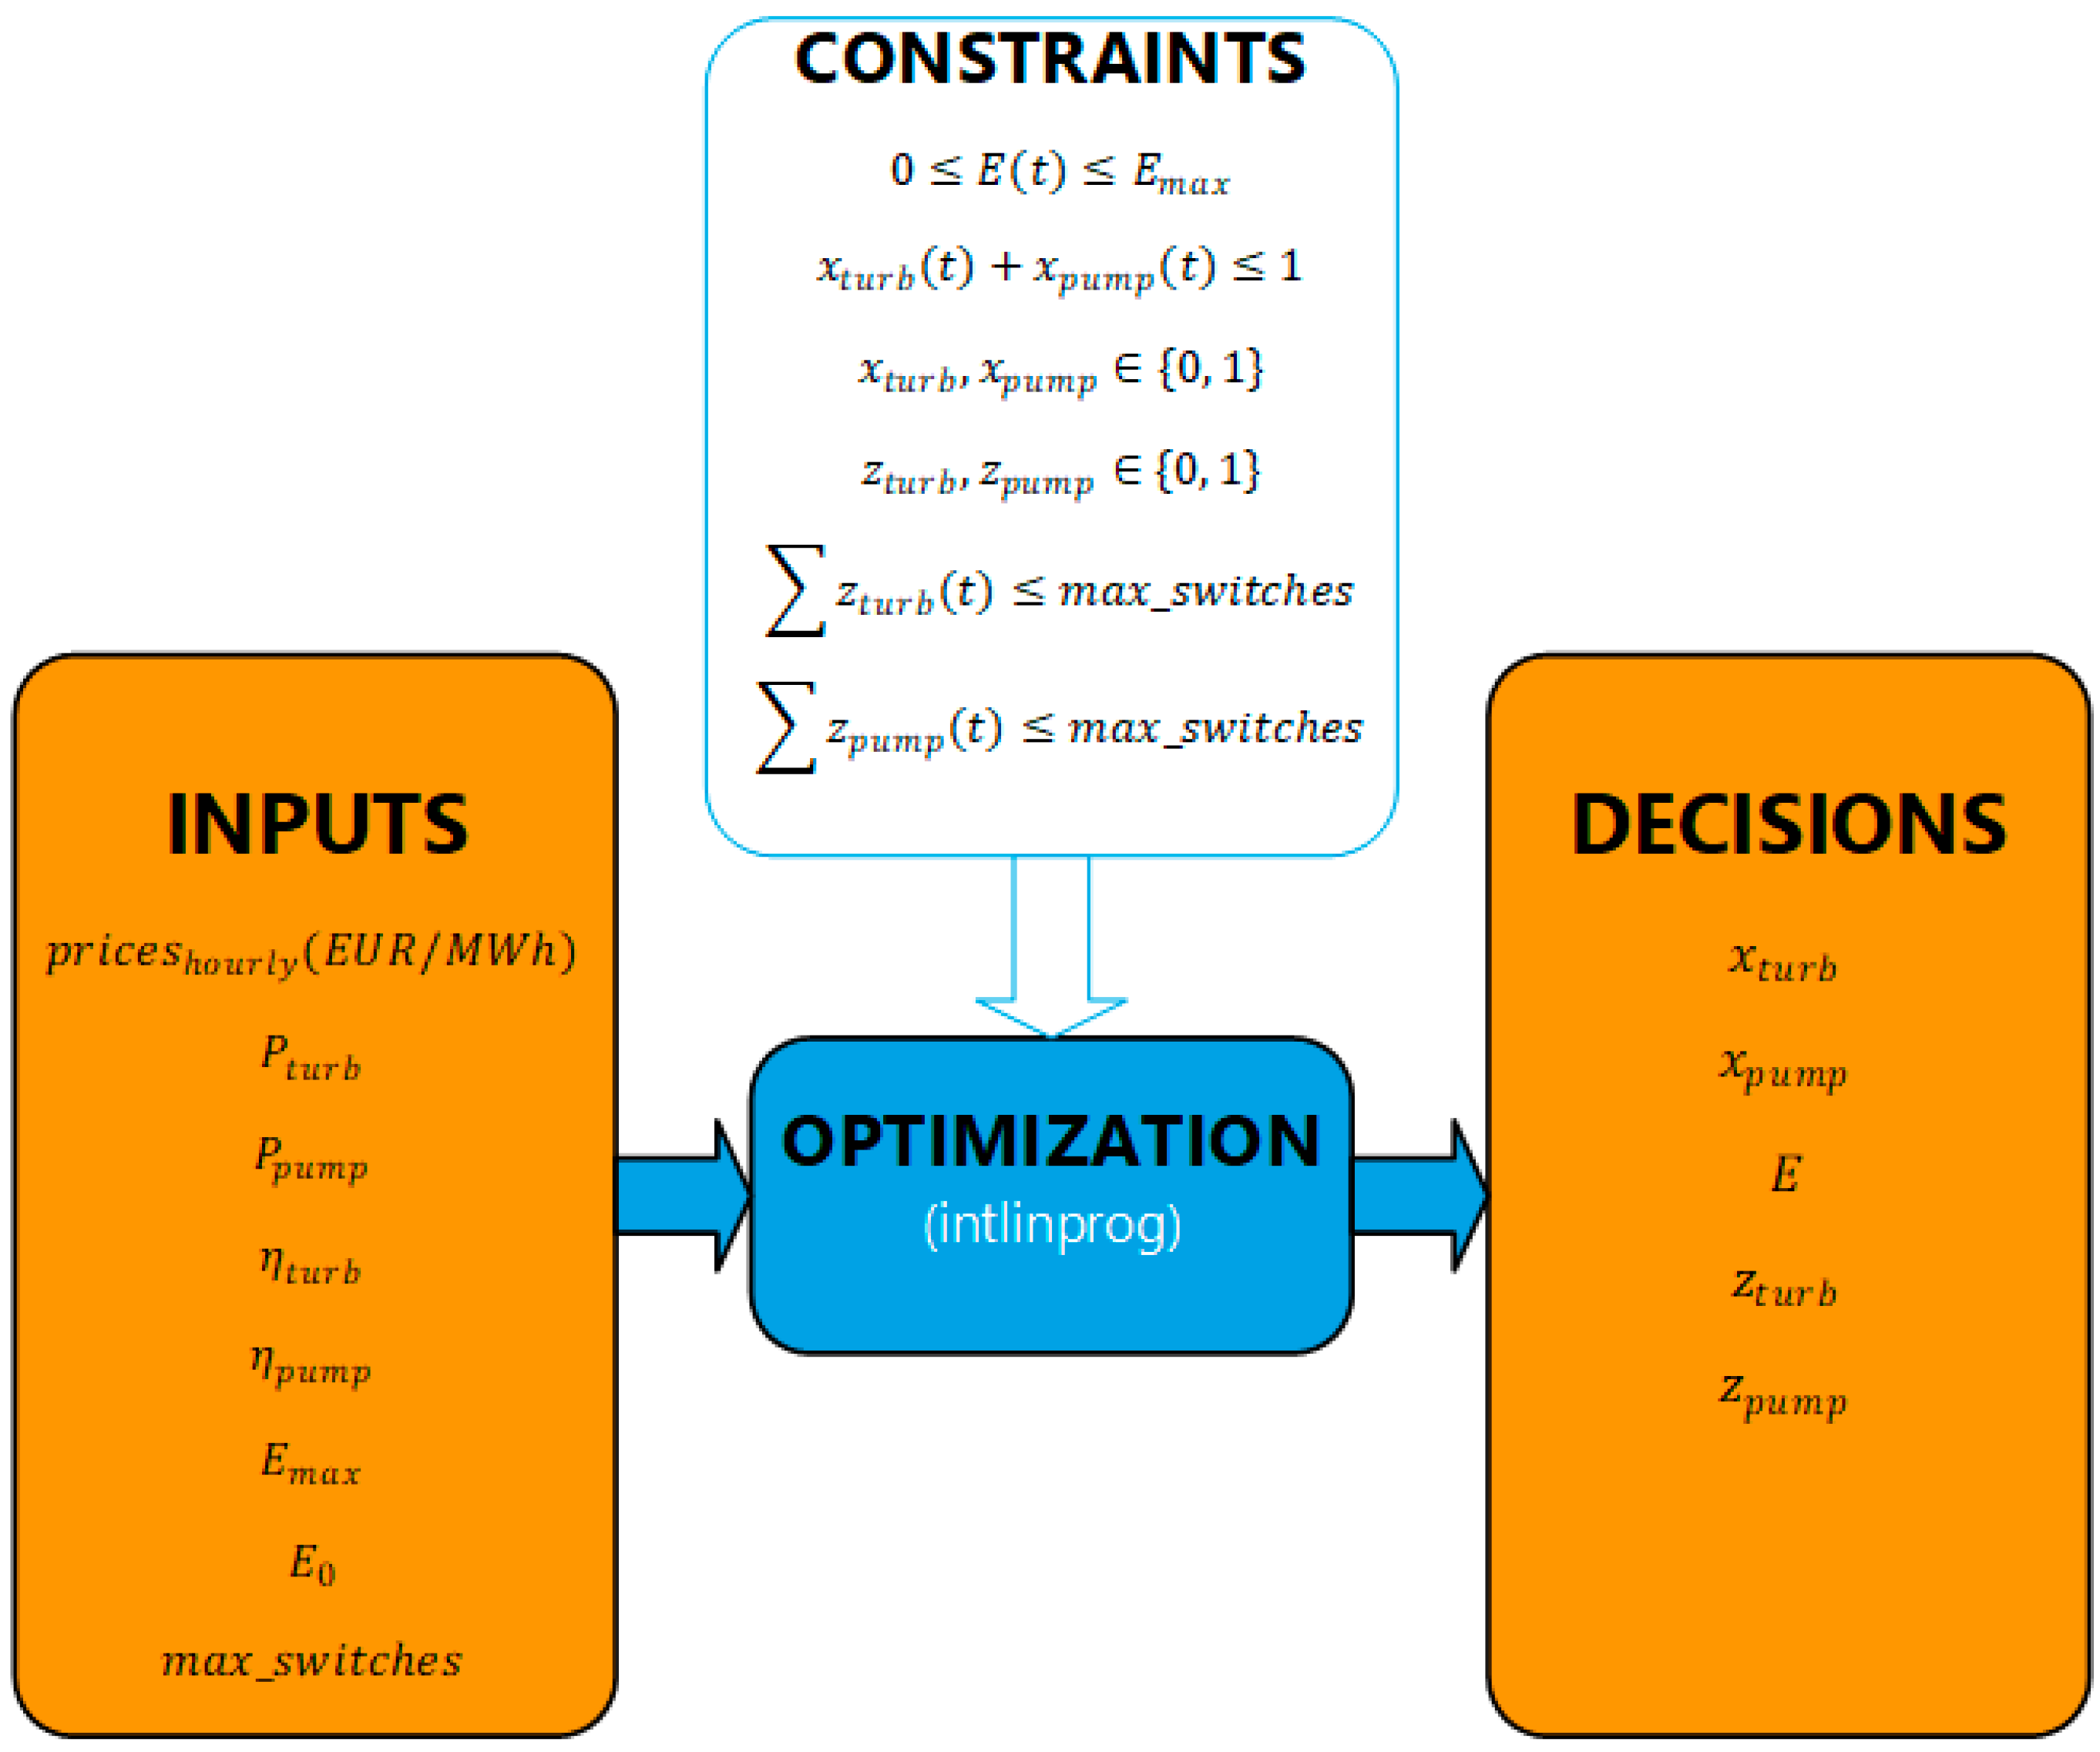
The MILP framework considers a range of inputs and constraints (as seen in
Figure 2), such as
hourly day-ahead electricity market prices [EUR/MWh] for the year 2024 [
25],
installed turbine (
) and pump (
) capacities [MW] as defined in Slovenia’s national infrastructure plans [
27],
turbine and pump efficiencies (
and
) [
12],
initial (
) and maximum (
energy storage levels [MWh], derived from upper reservoir volume and hydraulic head [
27],
daily limits on the number of turbine and pump startups (. In this study, the number of startups was limited to a maximum of 12 per day for both the turbine and the pump, respectively,
energy balance equations () ensuring that water movement and energy storage remain physically consistent,
simulation time resolution set at one hour [
25].
These parameters shape the physical and economic constraints of the system and help evaluate trade-offs between market-based revenue generation and operational constraints. Decision variables in the MILP model include the following:
a binary variable indicating whether the turbine is active at hour ,
a binary variable indicating whether the pump is operating at hour ,
a continuous variable representing the energy level stored in the reservoir at hour ,
binary startup indicators ( and ) for the turbine and pump to track daily switch events.
These variables allow the model to simulate different operation schedules and assess their economic viability while respecting operational constraints such as startup frequency and capacity limits.
Startup events are defined as transitions from an inactive to an active state of the turbine or pump between two consecutive hourly time steps. In the model, these events are represented by additional binary startup variables, which distinguish a continued operation from a new start.
The introduction of a daily startup limit is motivated by the need to avoid excessive switching and to improve the technical realism of the optimized schedules. As highlighted in the literature, optimization-based scheduling approaches may produce mathematically optimal yet technically unfeasible solutions if switching behavior is not adequately controlled, particularly when time discretization is used [
23].
In the present study, the maximum number of daily starts was set to 12, separately for the turbine and the pump, to act as a conservative operational safeguard and prevent unrealistic operating patterns.
The MILP solver executes a structured sequence of computational steps to solve the optimization problem. These include:
Preprocessing. Reduction in problem complexity by eliminating redundant variables and constraints, tightening bounds, and improving numerical stability [
30,
31,
32].
Initial Relaxation. Solving a linear programming (LP) version of the problem, ignoring integer constraints, to find a base solution [
6].
Mixed-Integer Preprocessing. Further tightening of the LP solution space to improve efficiency in subsequent steps [
33].
Cut Generation. Introduction of additional constraints to better guide the search for integer solutions [
34,
35].
Heuristics. Use of heuristic algorithms like Relaxation Induced Neighbourhood Search (RINS) and Rounding and Strong Branching (RSS) to identify near-optimal integer-feasible solutions [
36,
37].
Branch and Bound. Systematic partitioning of the problem into subproblems using variable branching, narrowing in on the optimal integer solution [
38,
39].
The MILP solver concludes its operation based on user-defined stopping criteria, including the following [
6]:
maximum elapsed computation time,
tolerance thresholds for objective value gaps,
maximum number of integer solutions,
exhaustion of viable search nodes in the branch-and-bound process.
The MILP-based approach enables the systematic scheduling of PHS operation under real-world day-ahead electricity market conditions. The simulation model incorporates a range of technical and operational characteristics based on national infrastructure planning documents and published sources.
Table 2 provides an overview of the parameters applied in the optimization process, including installed capacities, initial energy level and energy storage limits, efficiencies, operational restrictions, and temporal resolution. This structured input setup supports the reproducibility of results and allows for a consistent interpretation of the model’s output.
In addition to the technical parameters presented in
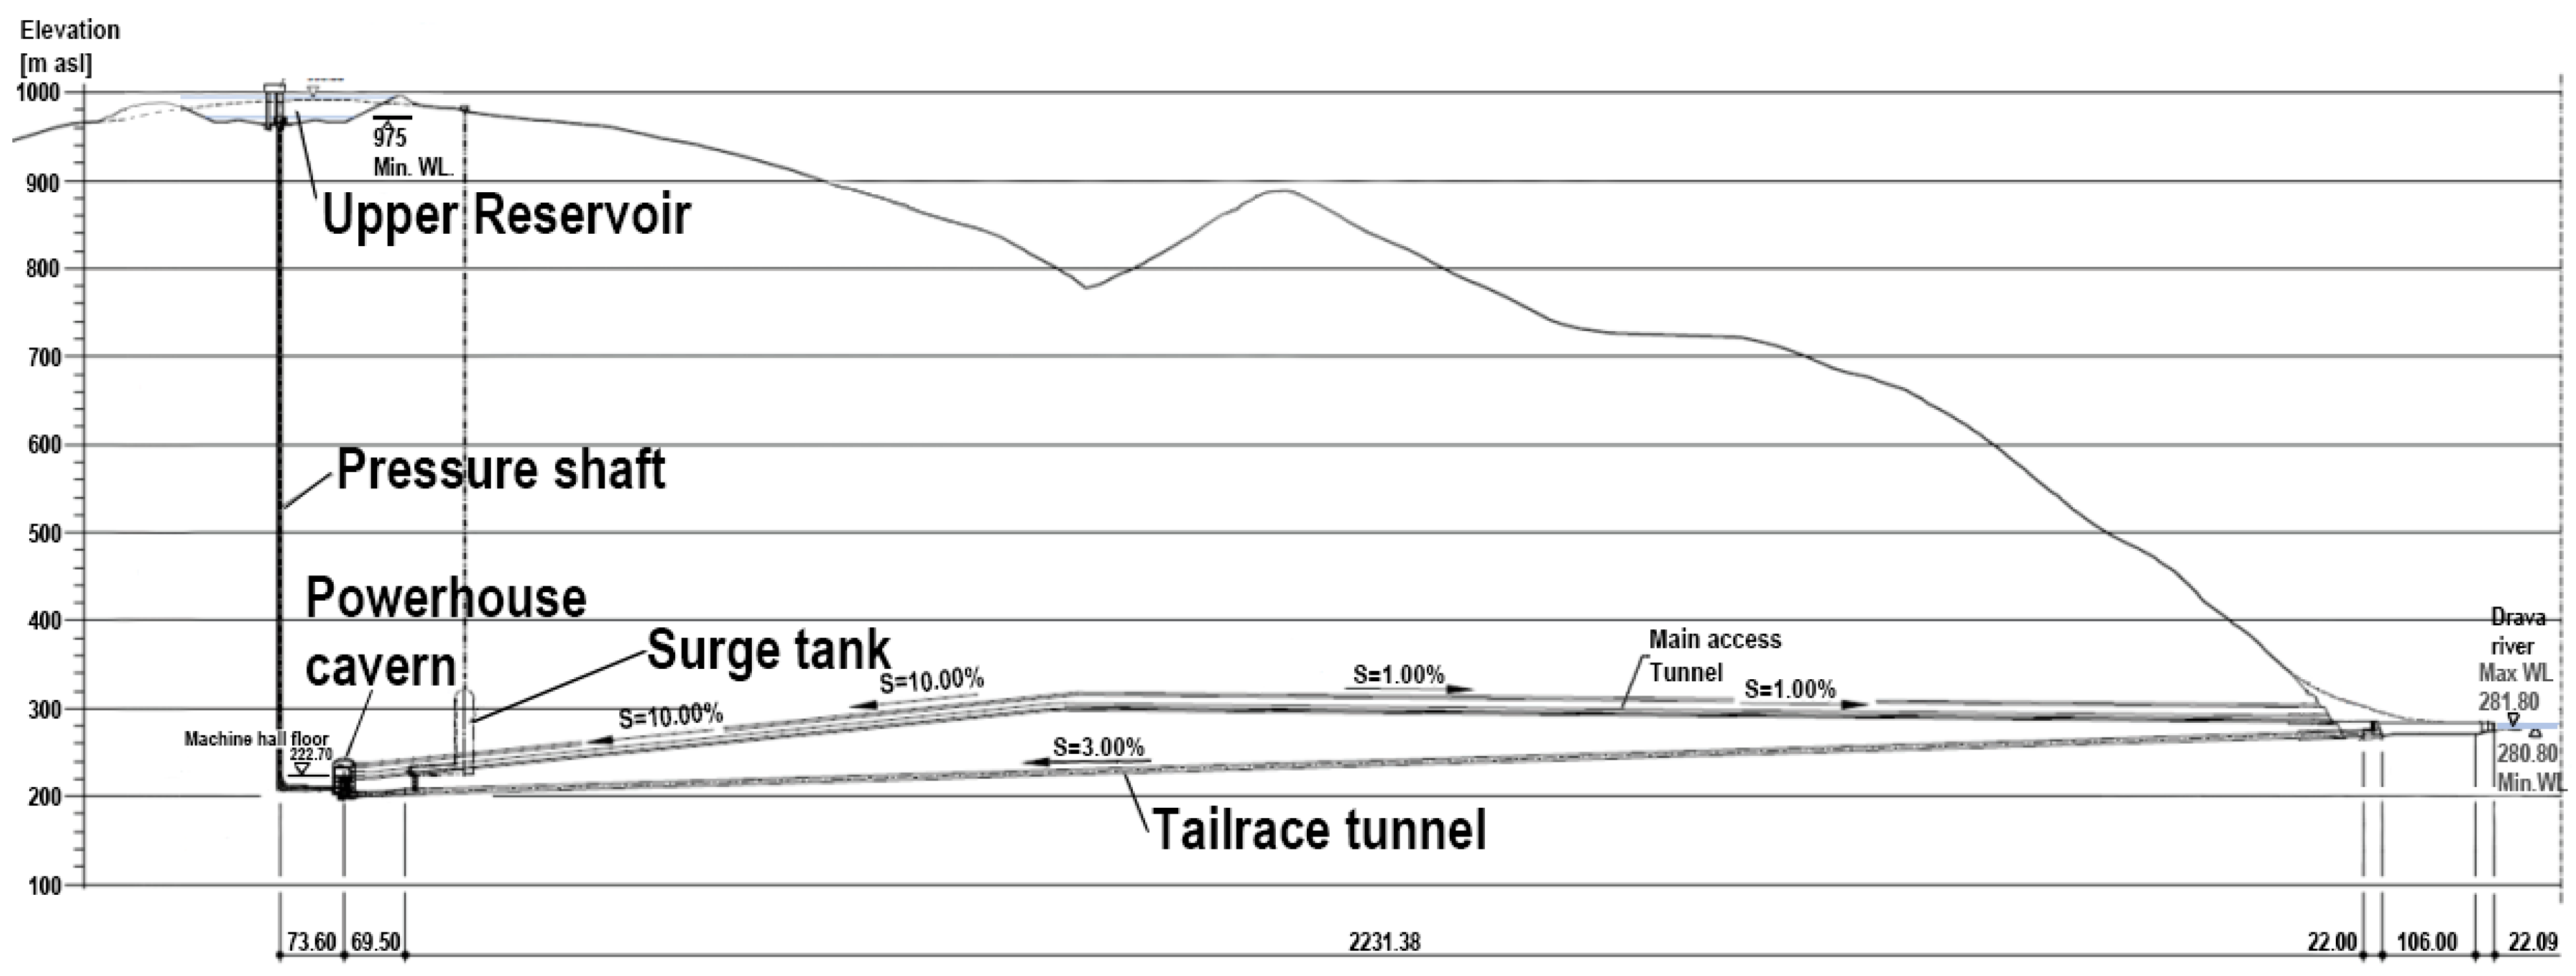
Table 2, it is important to contextualize the physical layout of the analyzed pumped-storage hydropower plant. The PHS Kozjak project is designed as a large-scale underground system integrated into the mountainous terrain of Kozjak above the Drava River.
The system consists of an upper reservoir located at a higher elevation and a lower connection to the Drava River, linked through a system of tunnels and a vertical pressure shaft. The powerhouse is positioned in an underground cavern.
The connection between the upper reservoir and the powerhouse is realized through a pressure shaft of approximately 800 m in length, followed by a horizontal tunnel system with a total length of 2.2 km.
A schematic representation of the plant layout and its spatial integration into the terrain is shown in
Figure 3. It illustrates the main structural elements of the system, including the reservoir, pressure shaft, underground powerhouse, and connection to the river.
It should be noted that detailed hydraulic transients, head losses in tunnels, and dynamic start-up processes are not explicitly modeled in this study. Instead, the system is represented through aggregated parameters such as efficiency and storage capacity, which are sufficient for the short-term economic optimization considered in this work.
In this study, the pumped-storage hydropower plant is modeled as a price-taking unit. This assumption is commonly applied in operational optimization studies, particularly when the primary objective is to evaluate scheduling behavior under given market price signals rather than to simulate the plant’s endogenous impact on the electricity market.
The model assumes a fixed-speed pump-turbine configuration. Fixed-speed units represent the conventional design used in many European pumped-storage plants and are, therefore, consistent with the generic technical parameters applied in this study. Although variable-speed technology enables extended operating ranges, improved part-load performance, and the provision of frequency regulation services even during the pumping phase—capabilities that could significantly increase revenue potential—accurate modeling of such functionality would require detailed efficiency curves, control characteristics, and operational boundaries that are currently not available for this specific site. The results presented here should, therefore, be interpreted as representative of a fixed-speed configuration, with the acknowledgement that the adoption of variable-speed technology could further enhance the economic and operational performance of the plant.
4. Conclusions
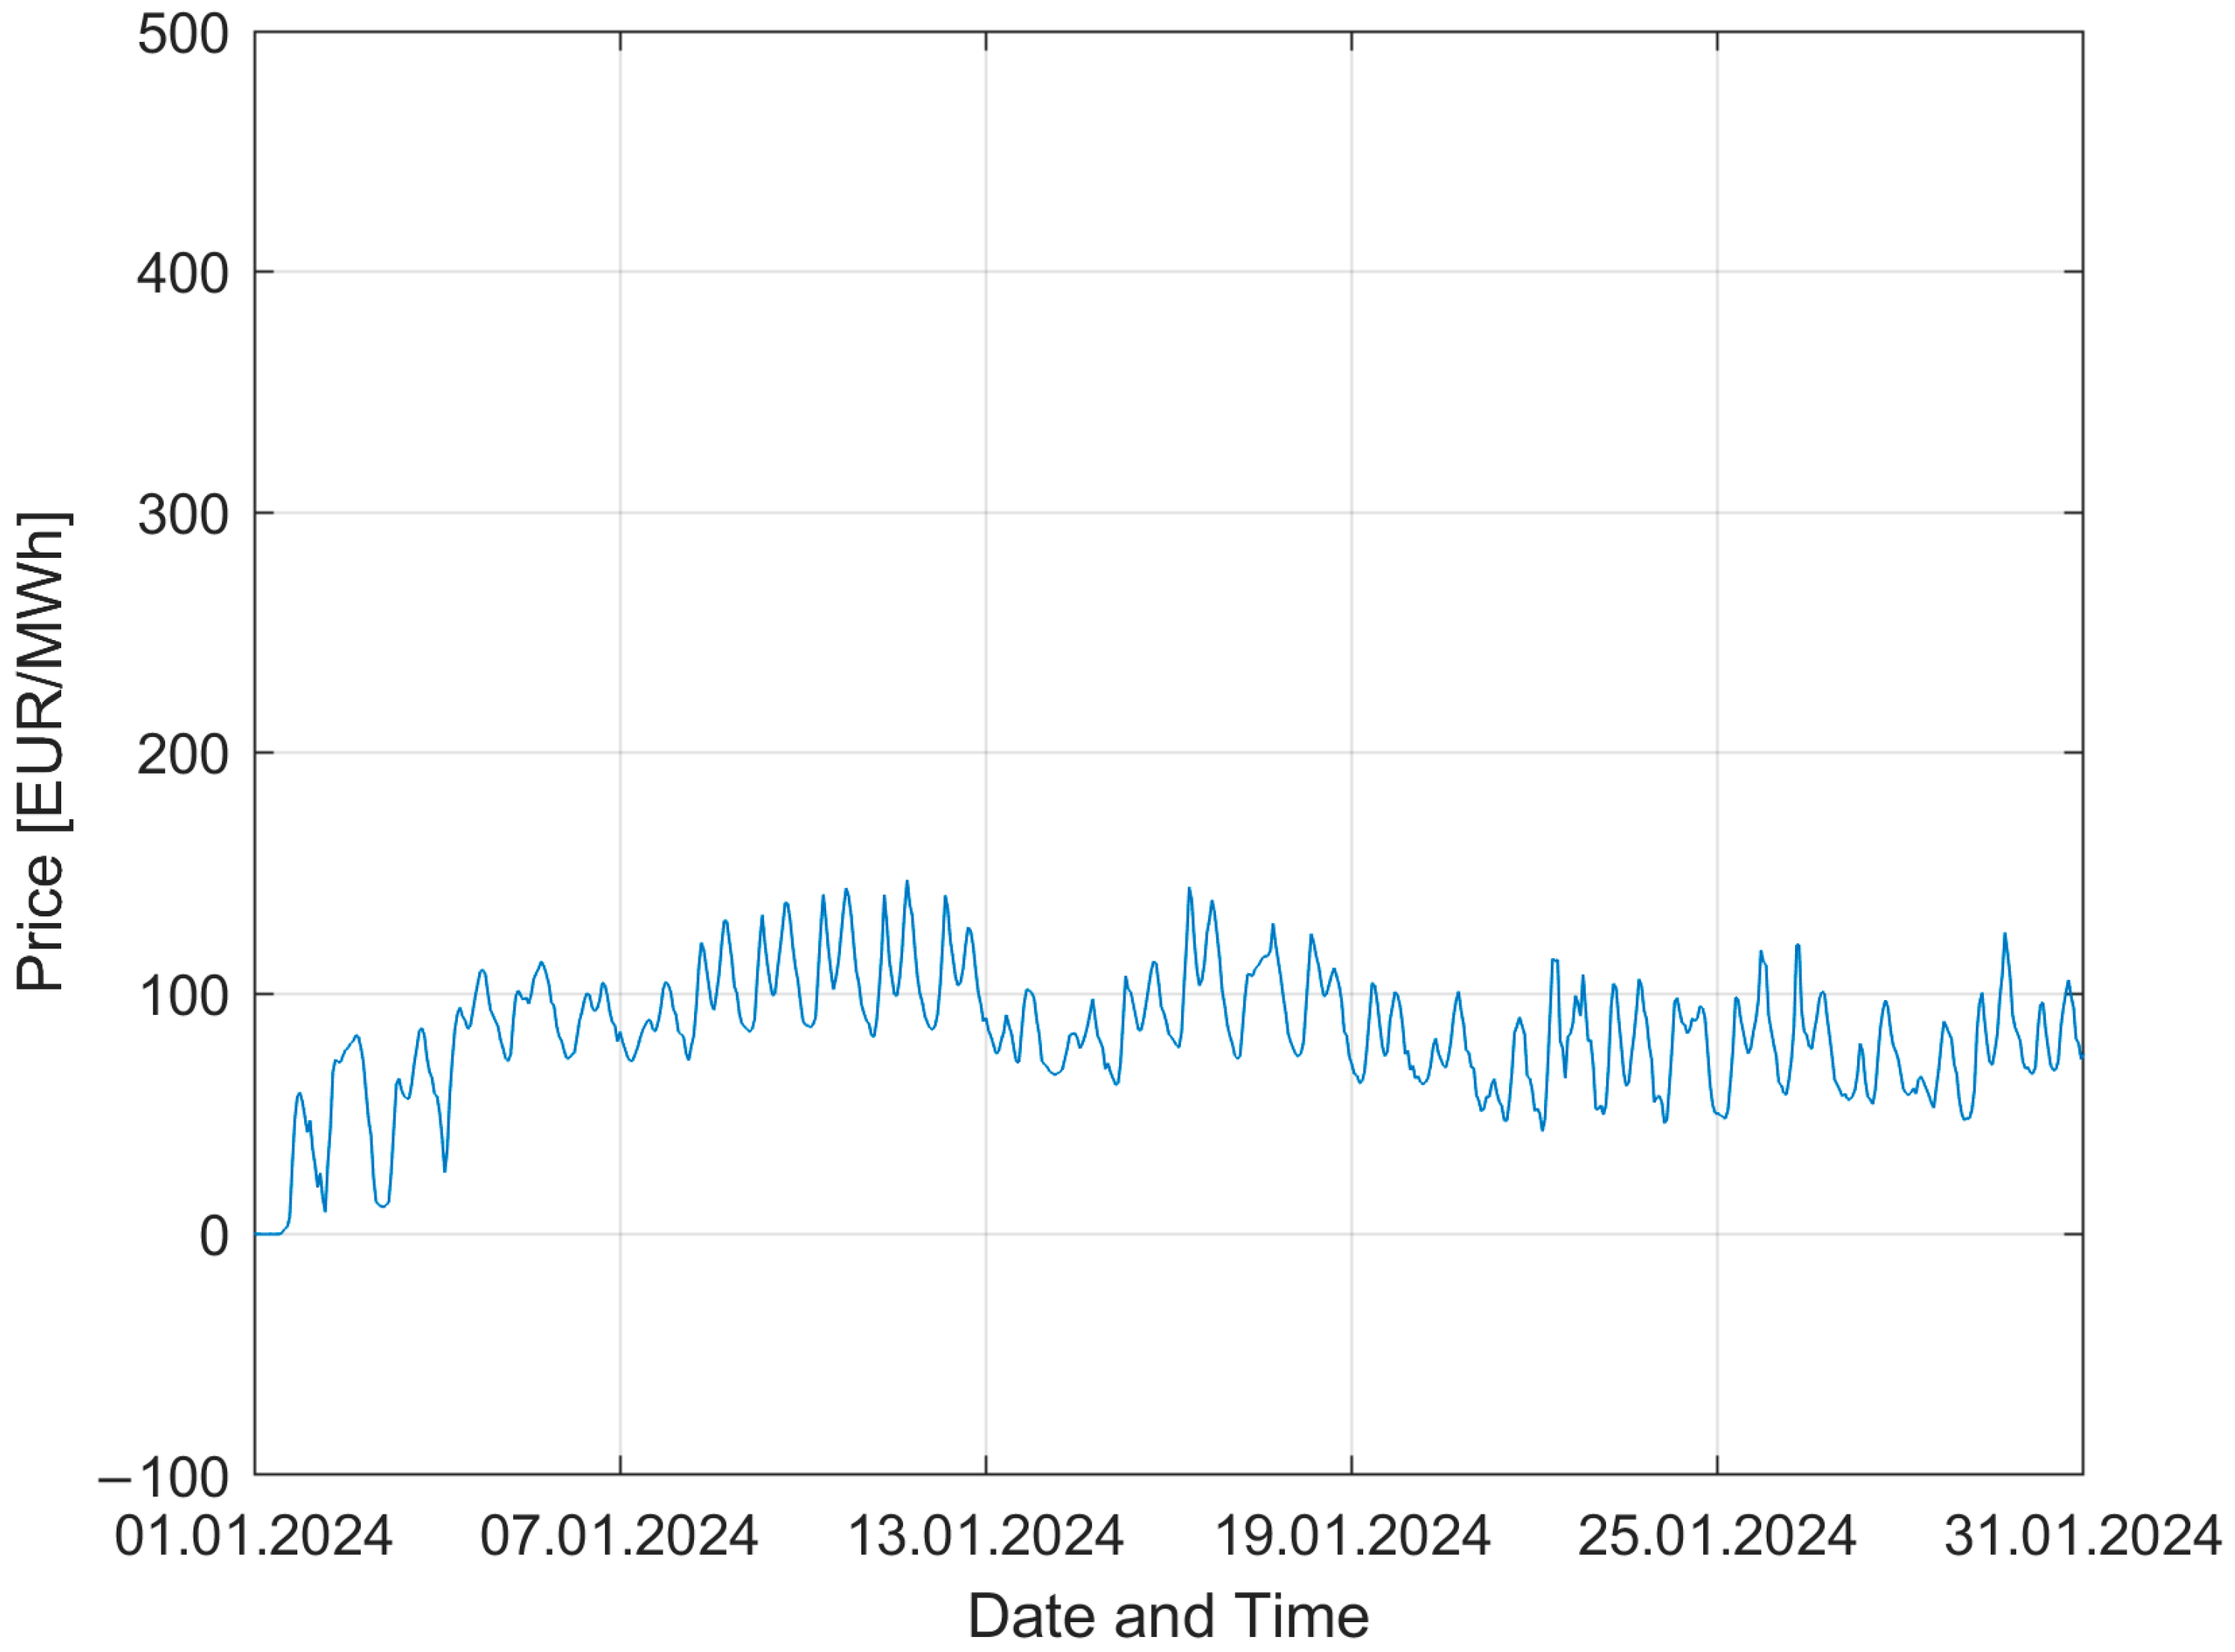
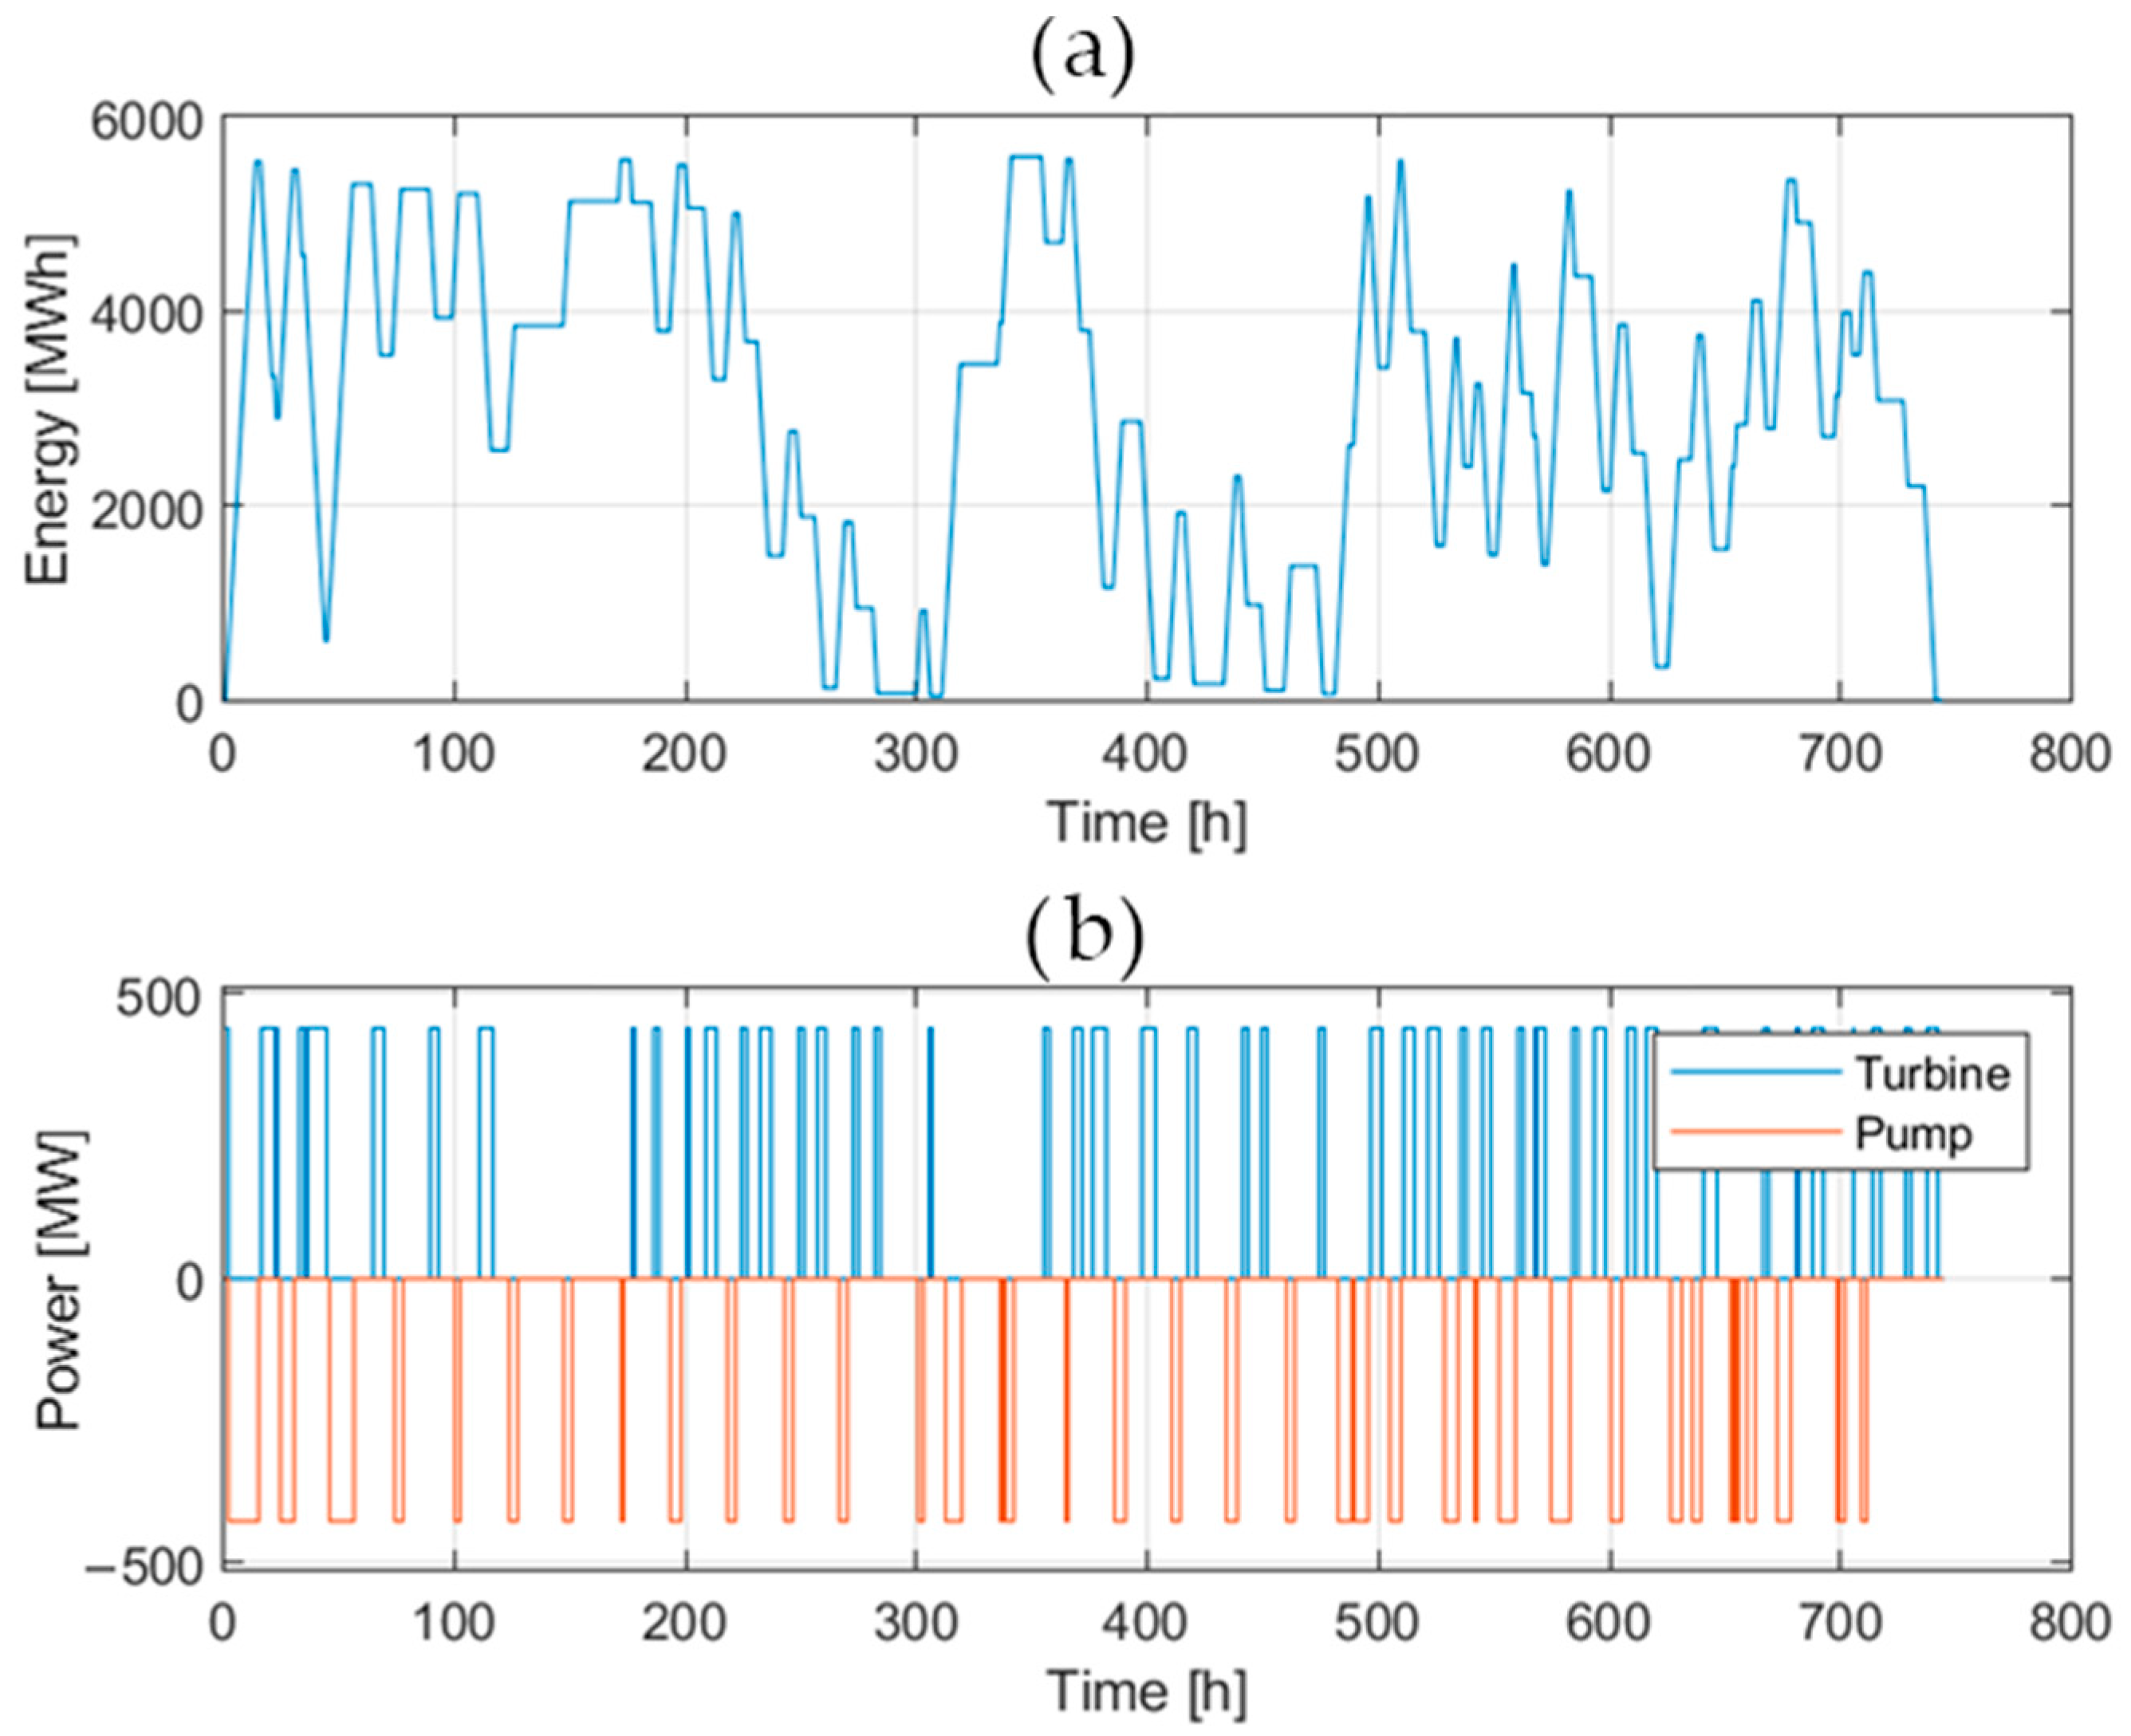
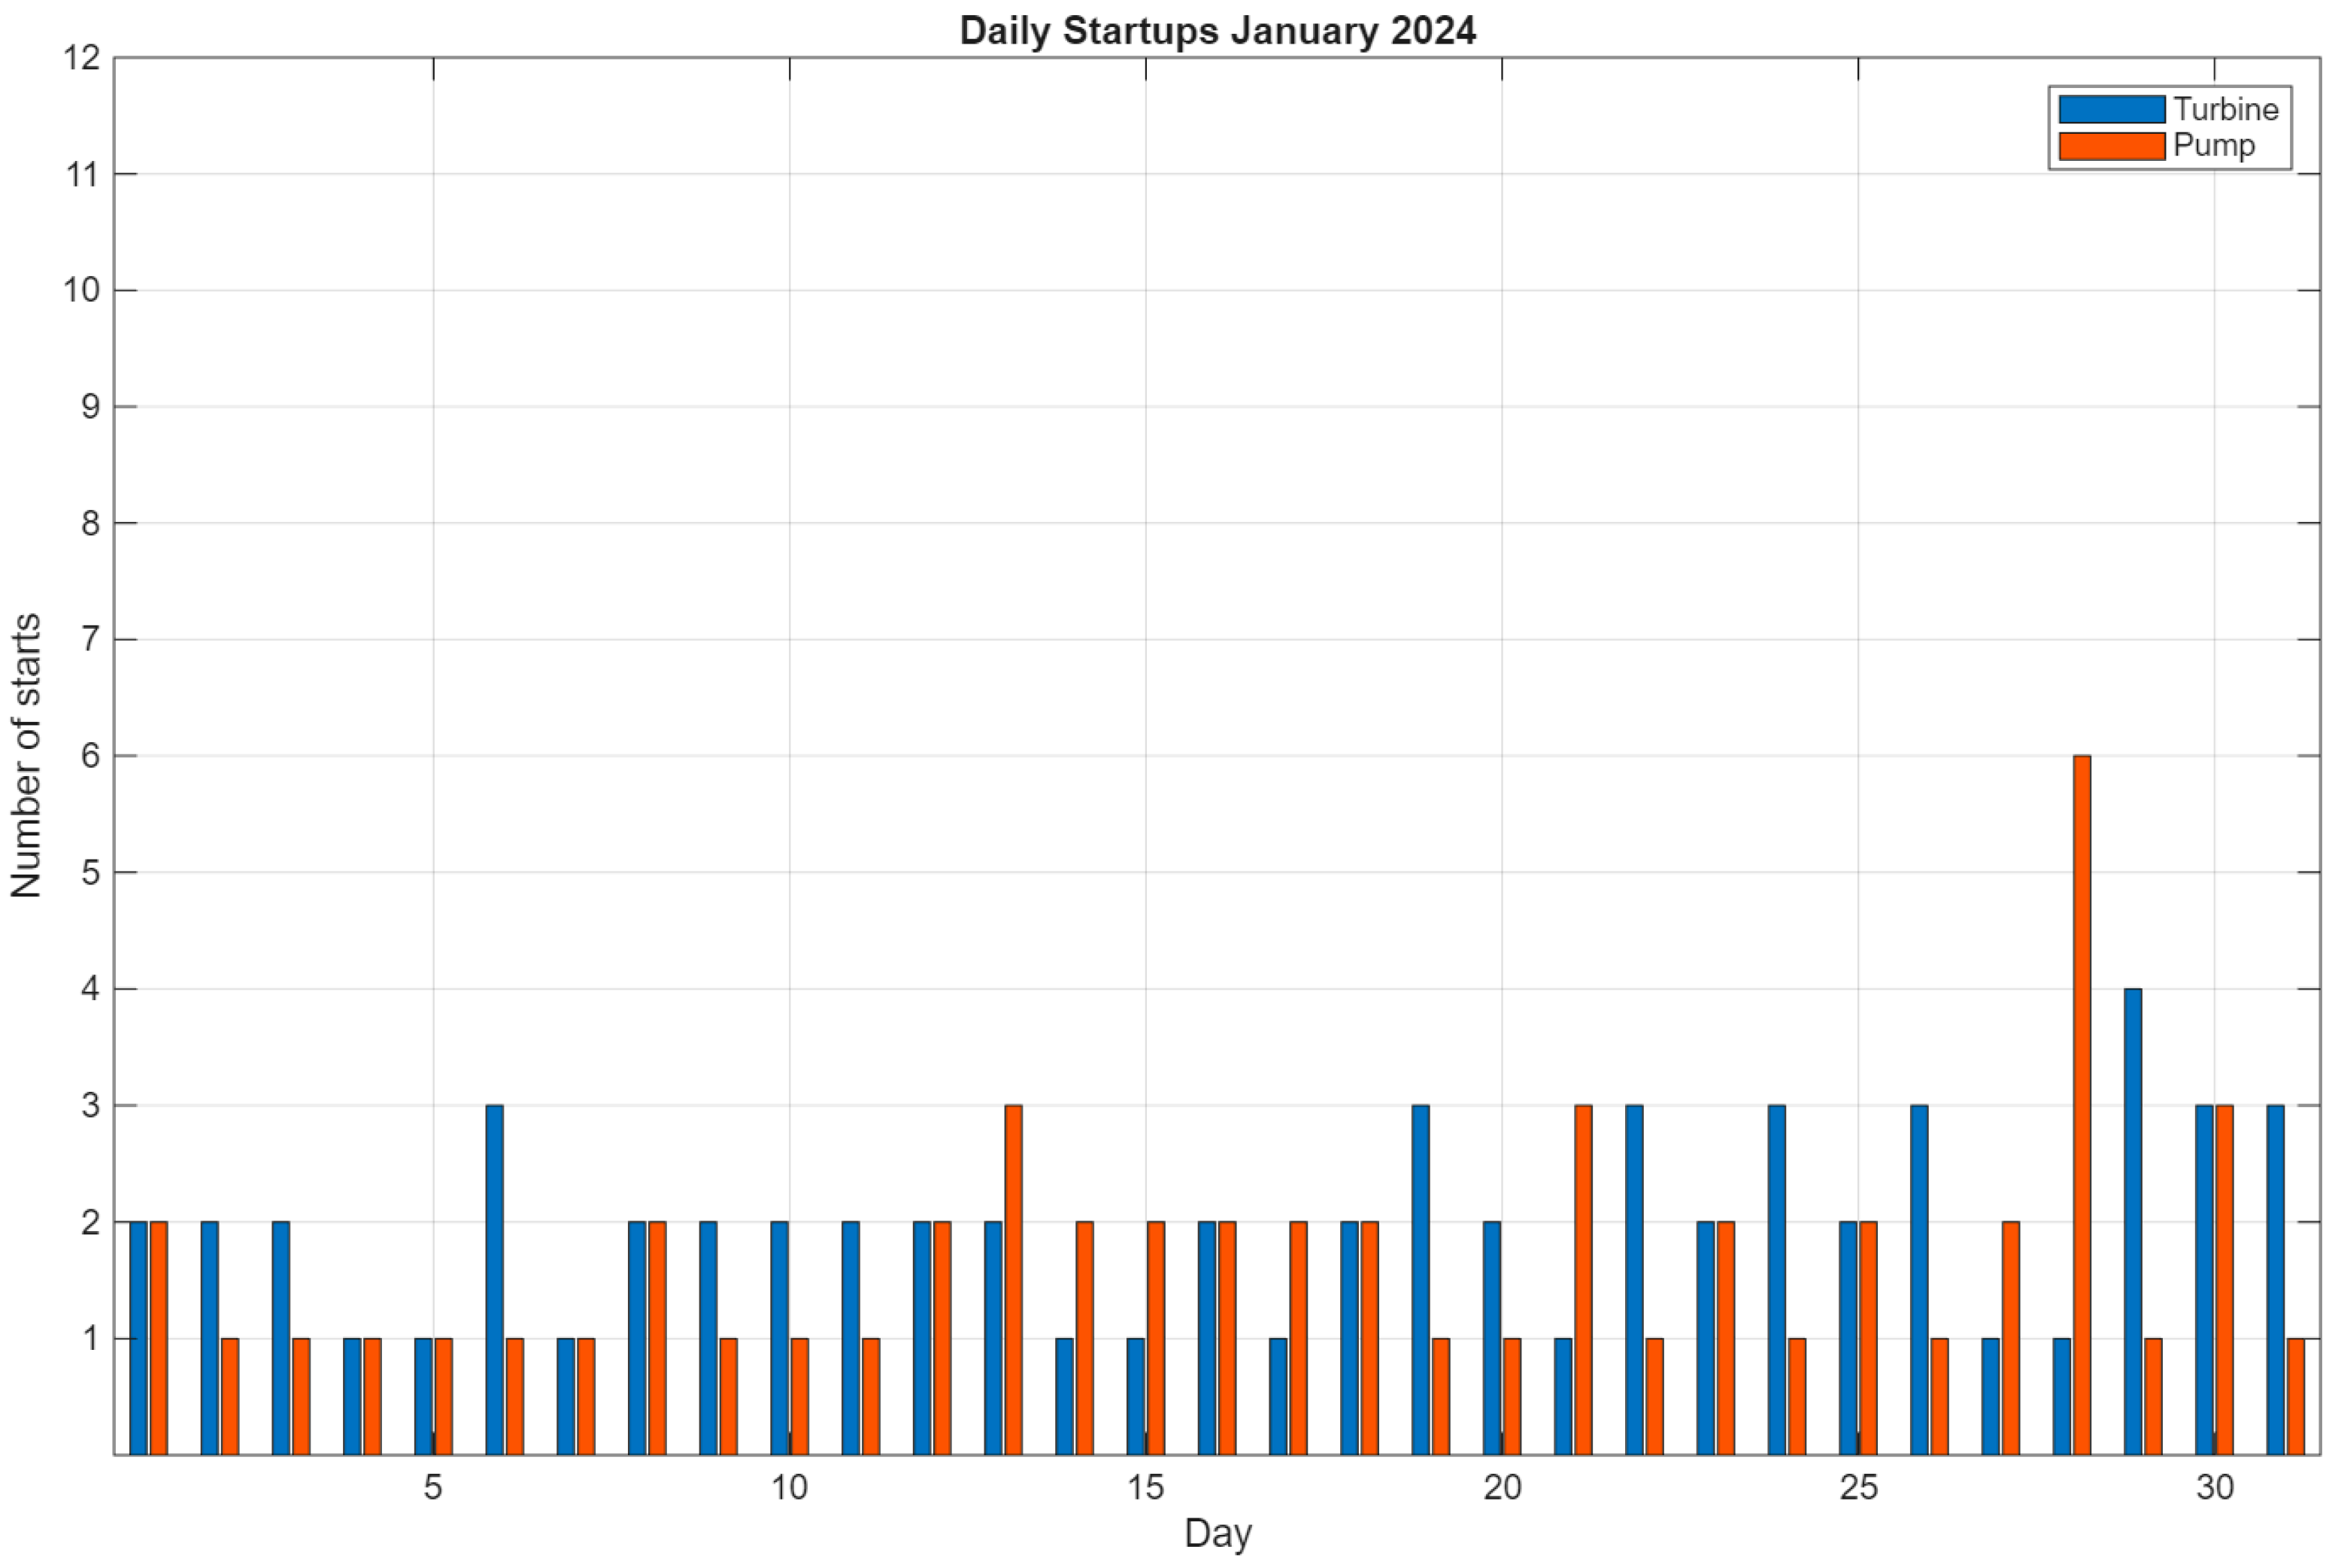
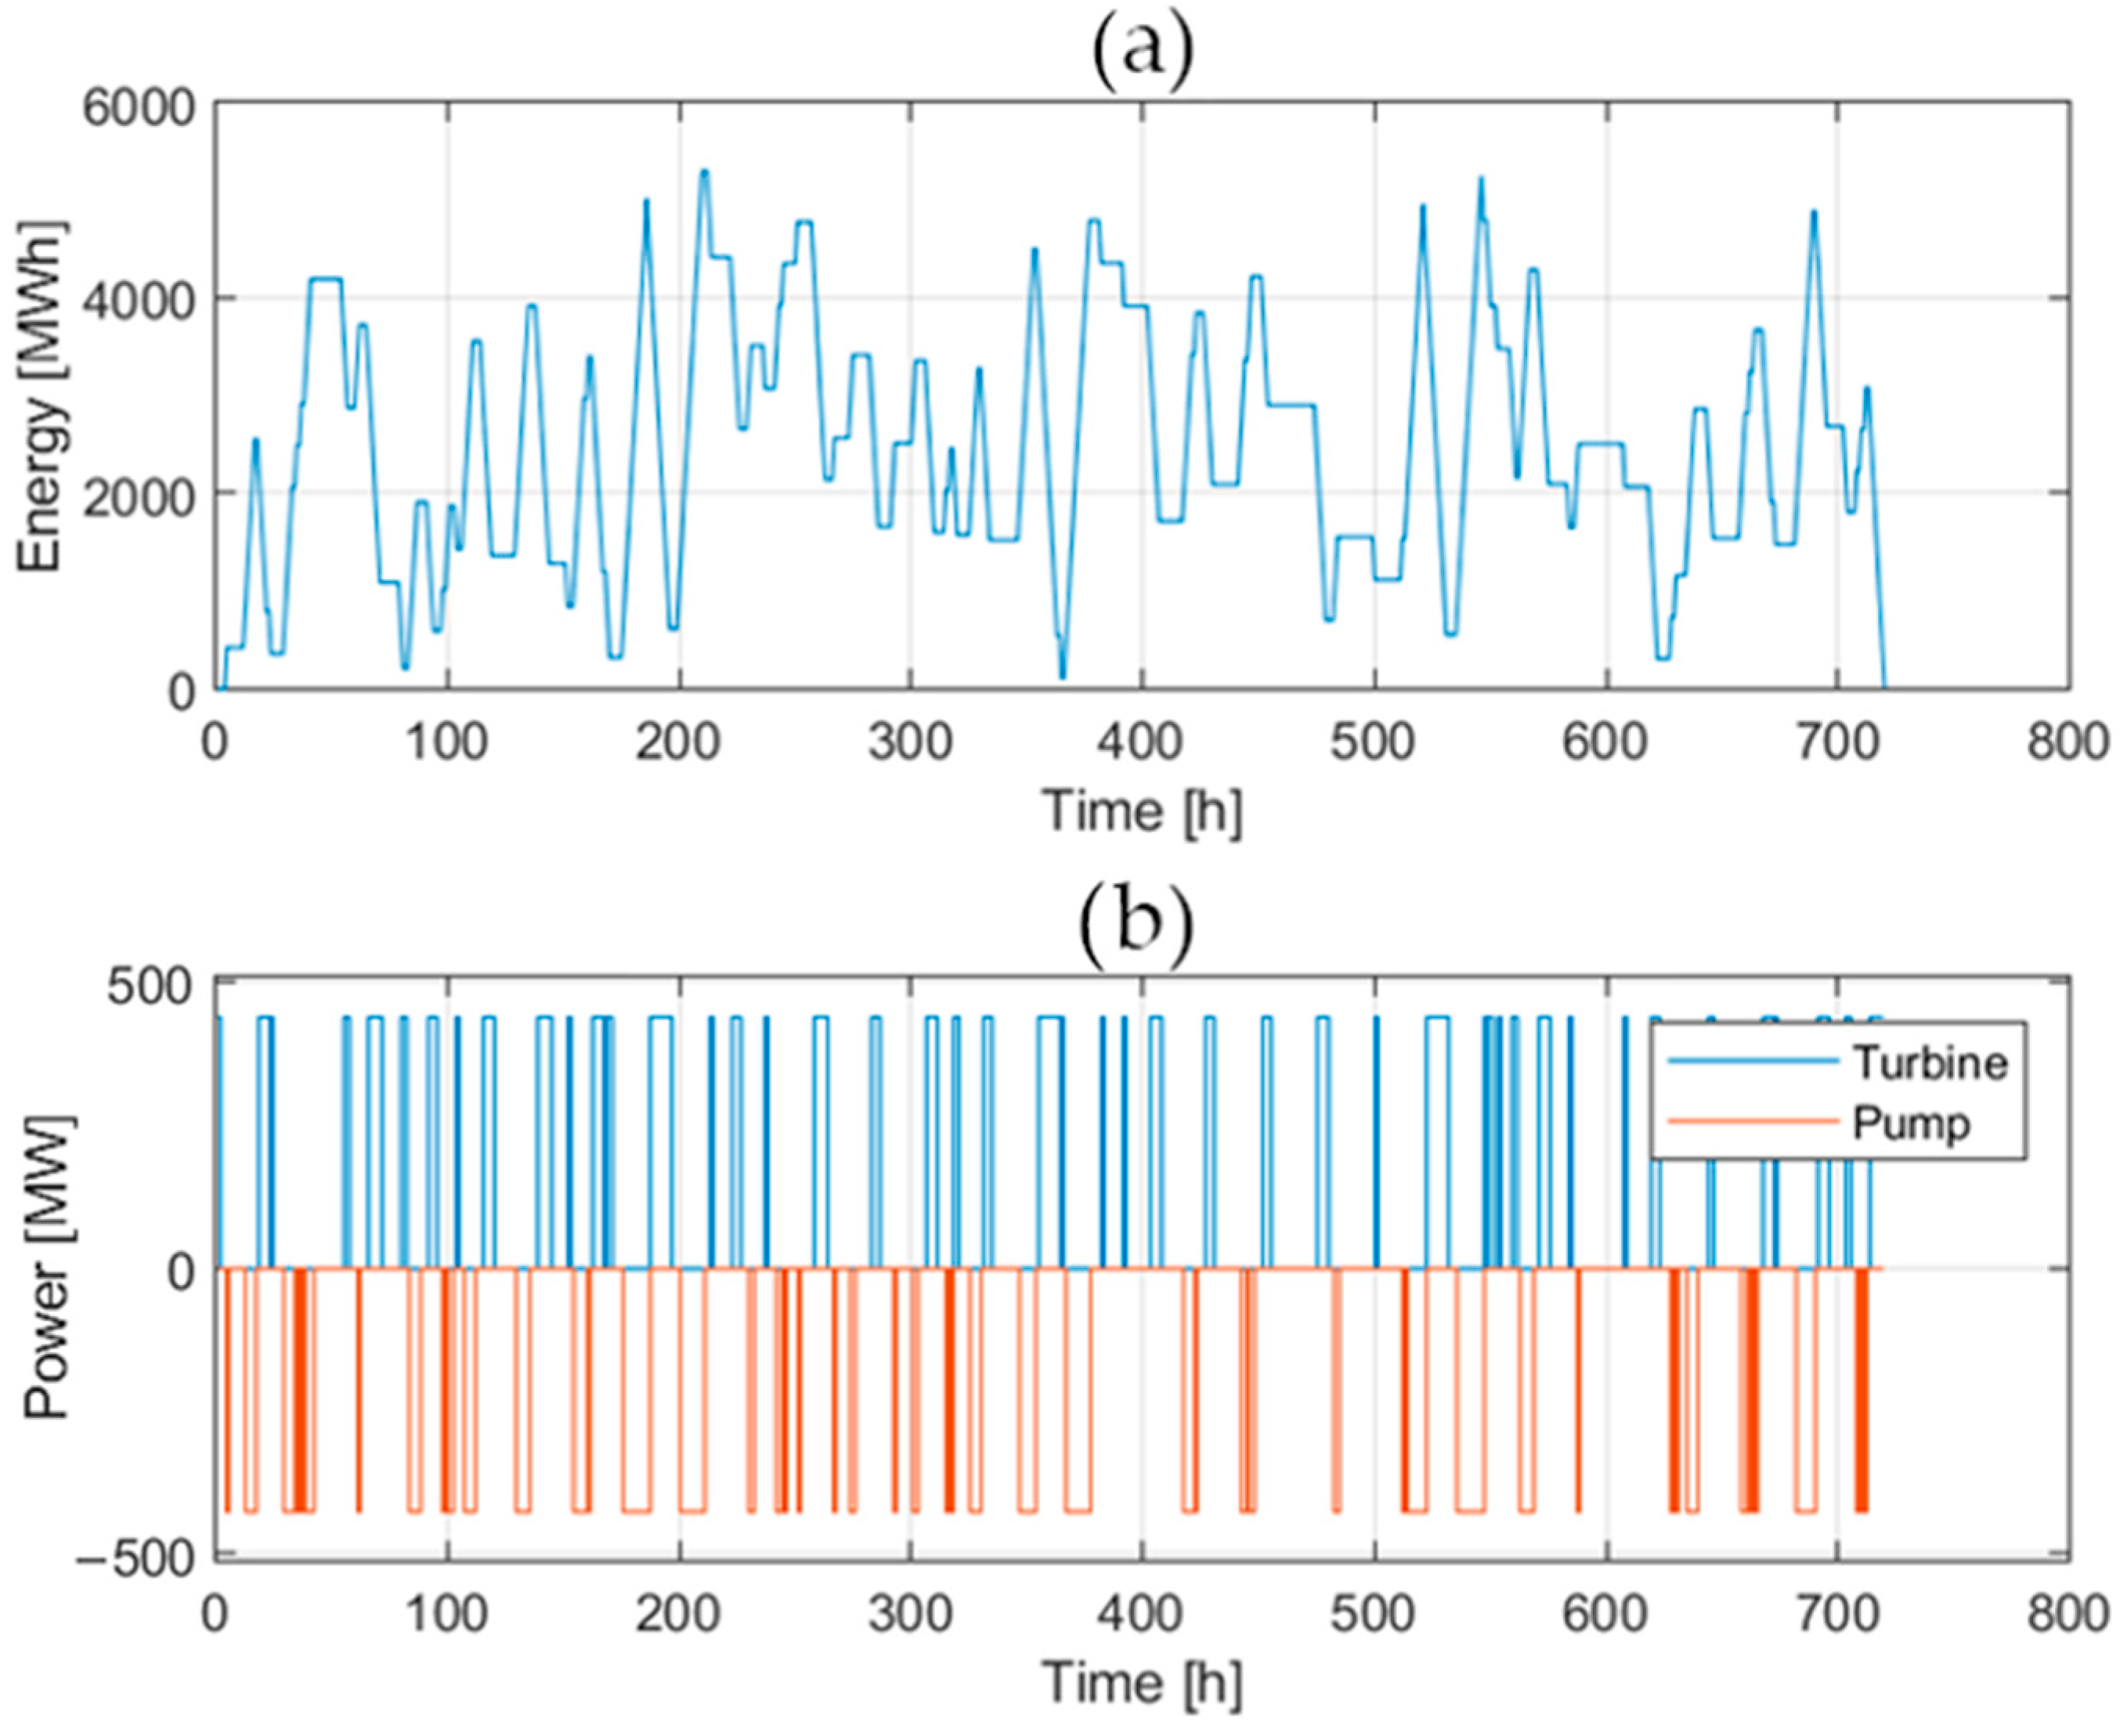
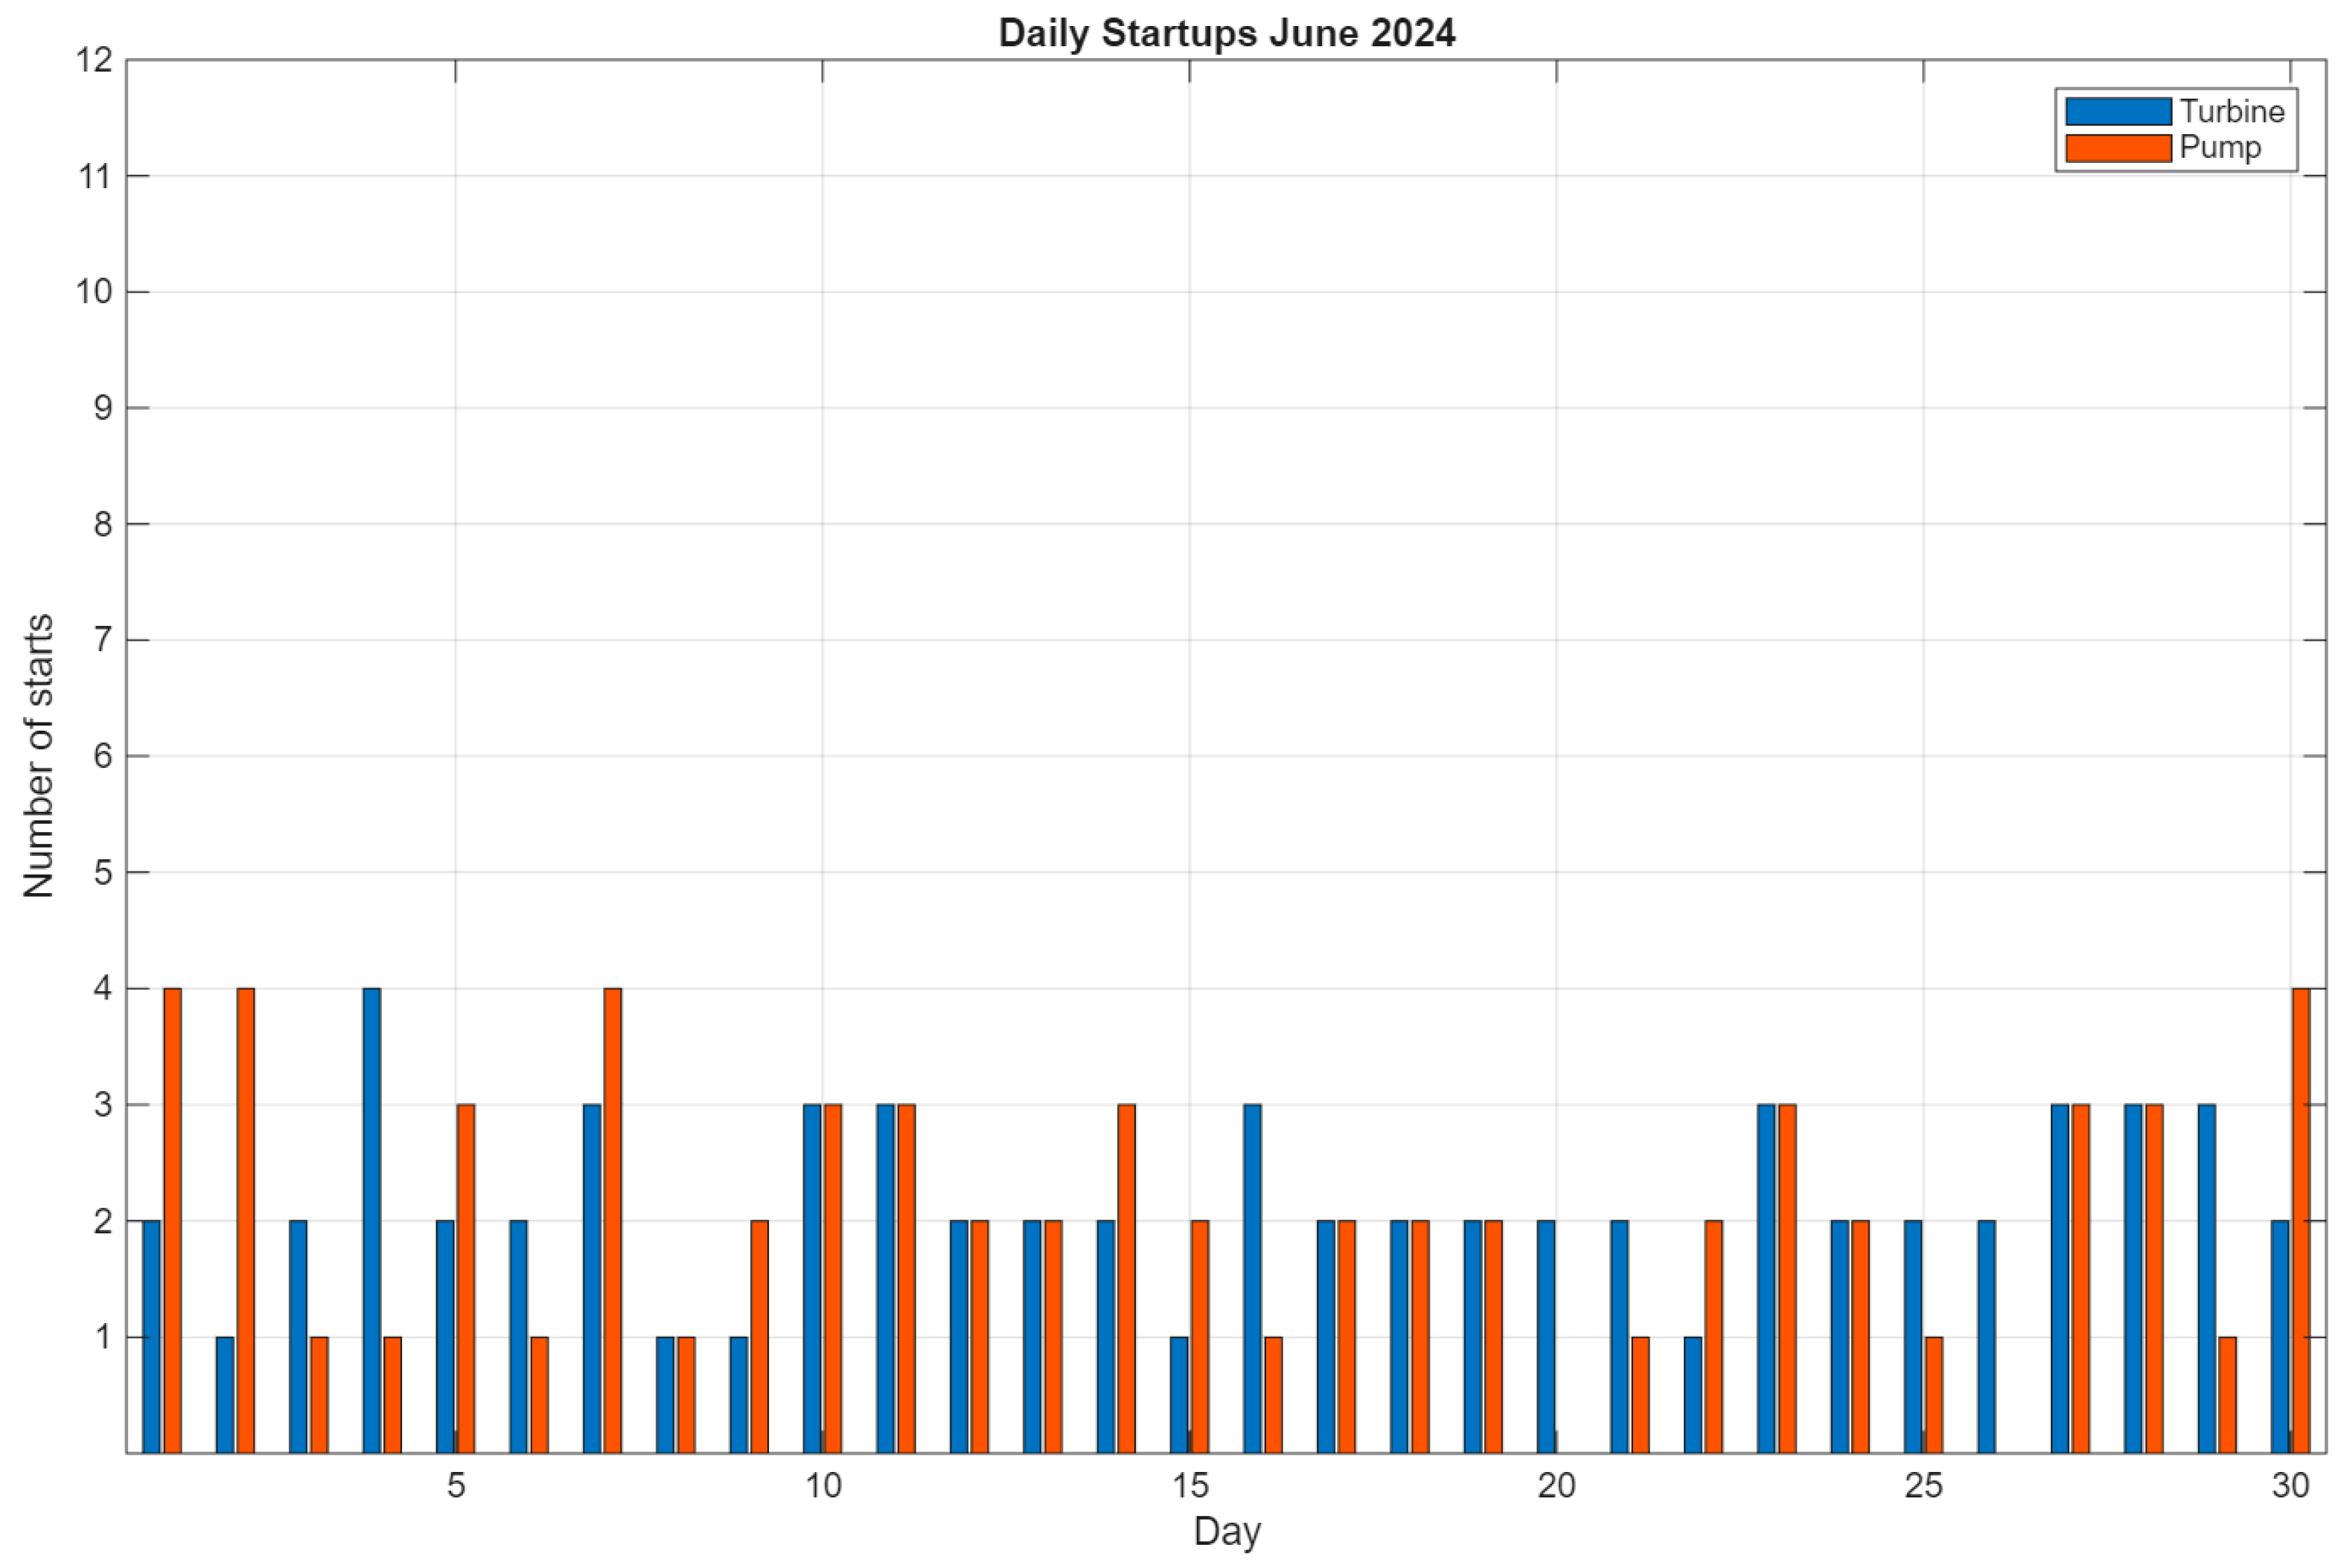
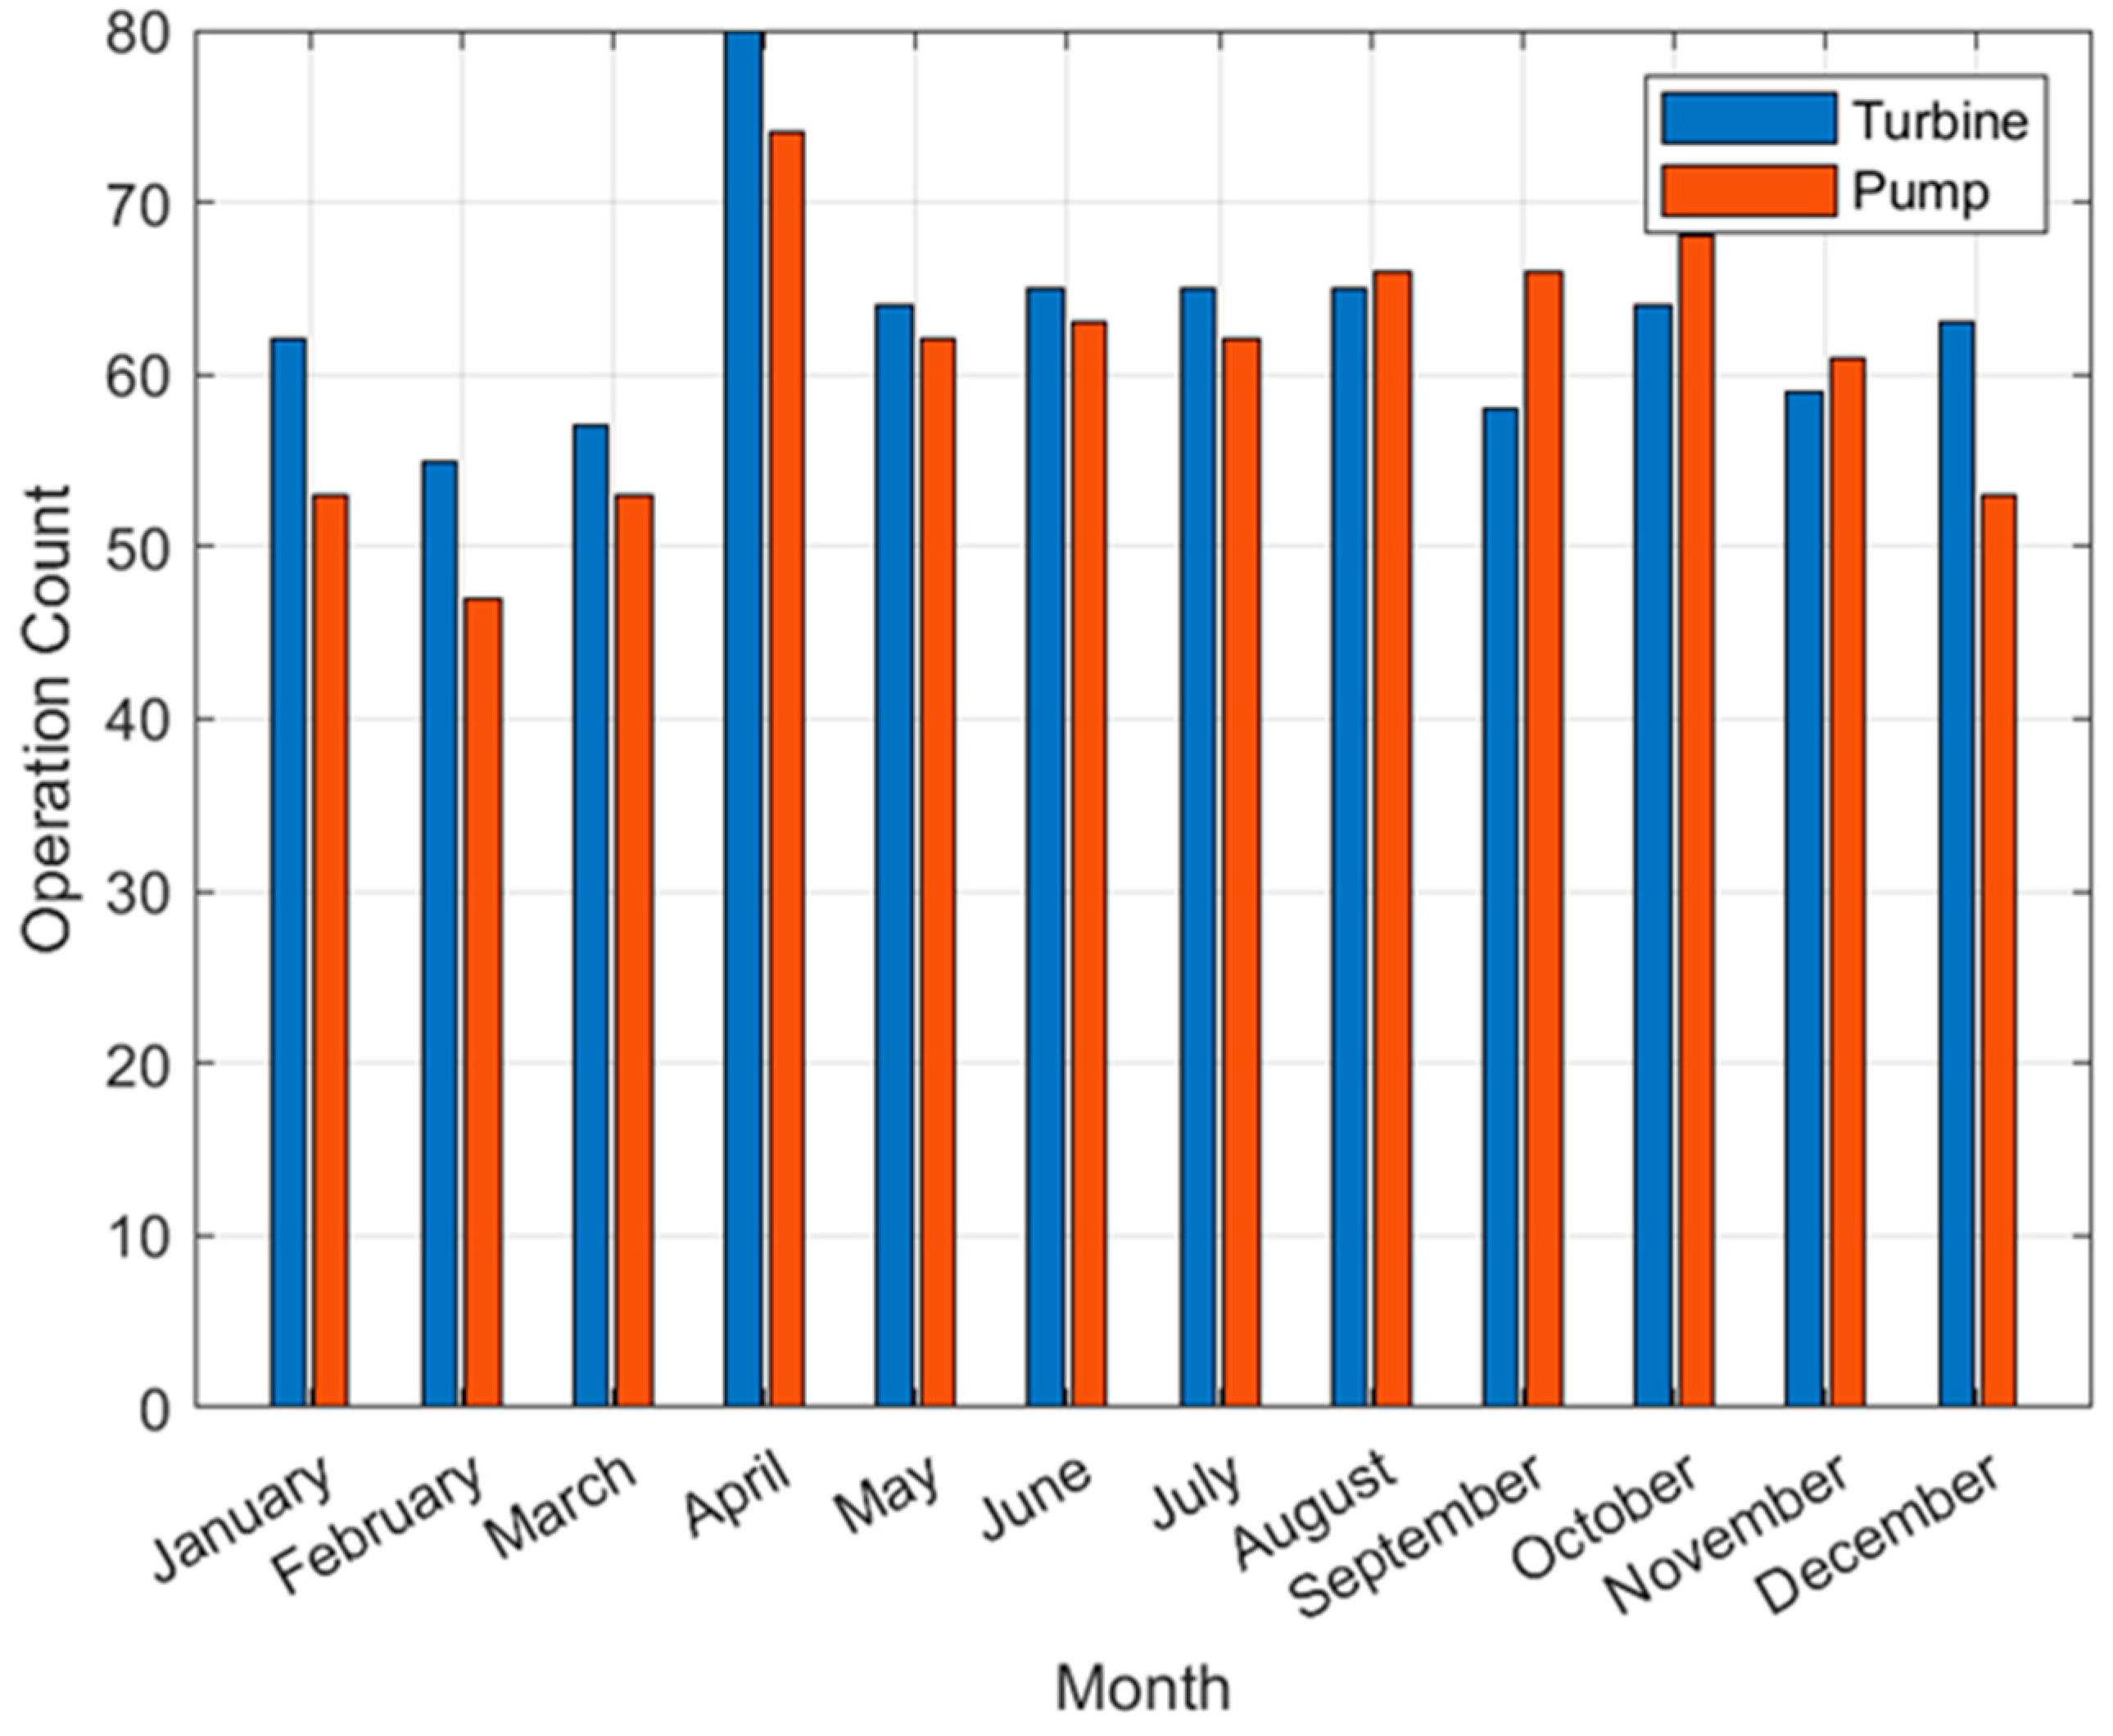
This research suggests that a 439.6 MW turbine and 426 MW pump power capacity PHS is operationally profitable under 2024 day-ahead market conditions on the Slovenian day-ahead electricity market, using realistic technological limitations like a maximum daily startup of twelve for a turbine and pump, respectively. A review of daily startup distributions shows that the imposed limit of 12 starts per day was not reached for either the turbine or the pump in the analyzed months. For example, in June, daily startup counts remained well below the imposed threshold; to better visualize this, the Y-axis limit for
Figure 6 and
Figure 10 was purposely set to 12. This confirms that the startup constraint primarily served as a preventive operational safeguard and did not actively restrict the optimized schedules in the analyzed 2024 case.
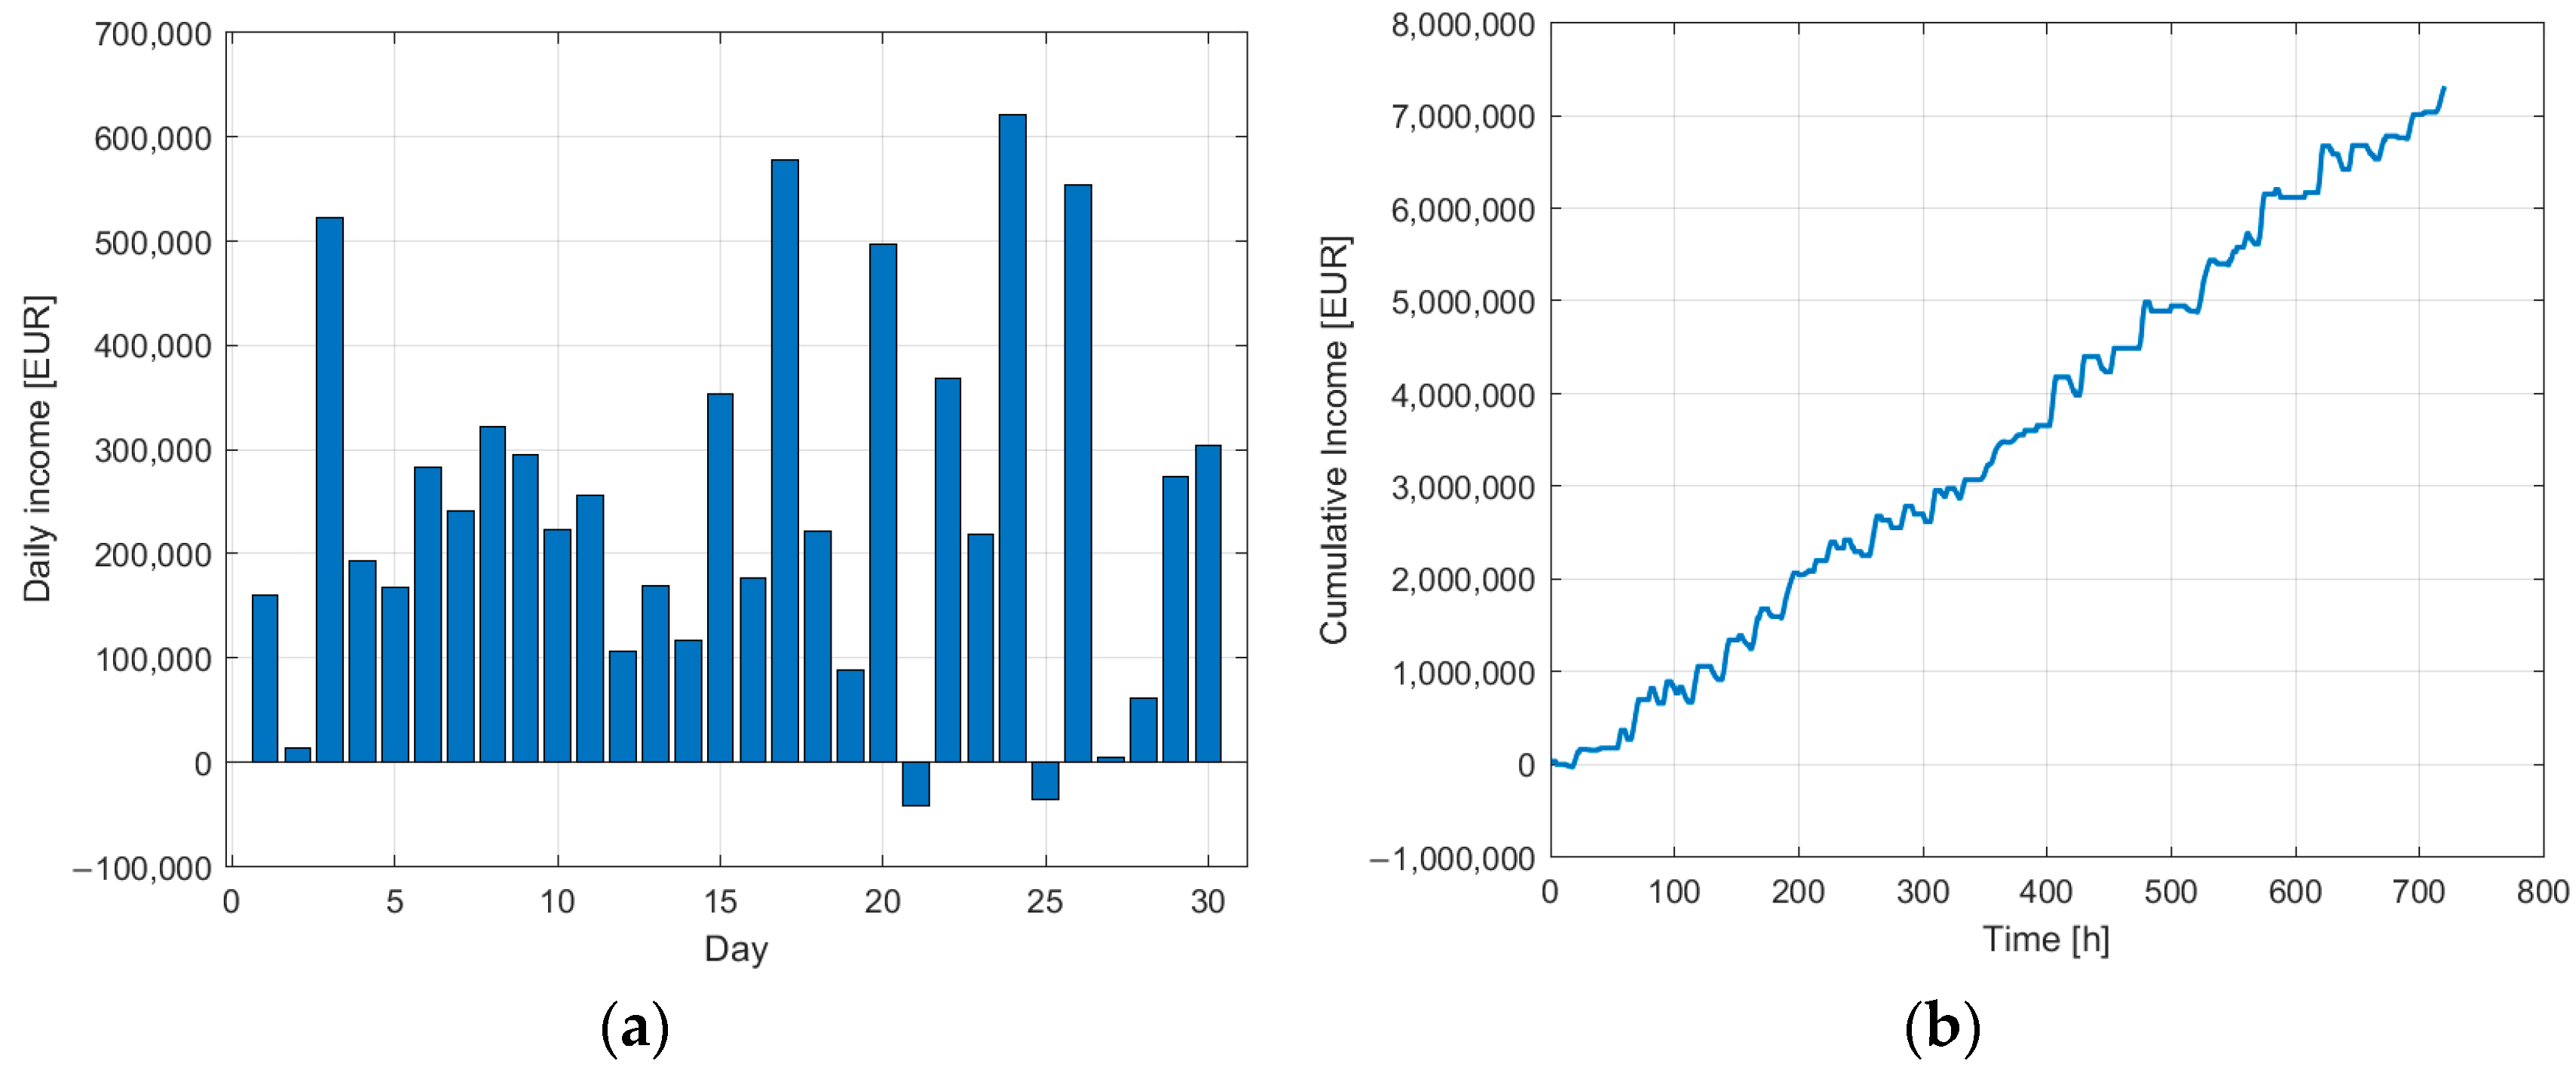
The system managed to produce 845 GWh of energy and consume 1.167 GWh of energy using the MILP-based year-round optimization based on 2024 day-ahead hourly prices, generating a yearly income of 64.2 million EUR. Considering that Slovenia’s final electricity consumption in 2024 amounted to 12,456 GWh, the calculated production of the Kozjak pumped-storage hydropower plant represents 6.8% of the country’s annual electricity consumption.
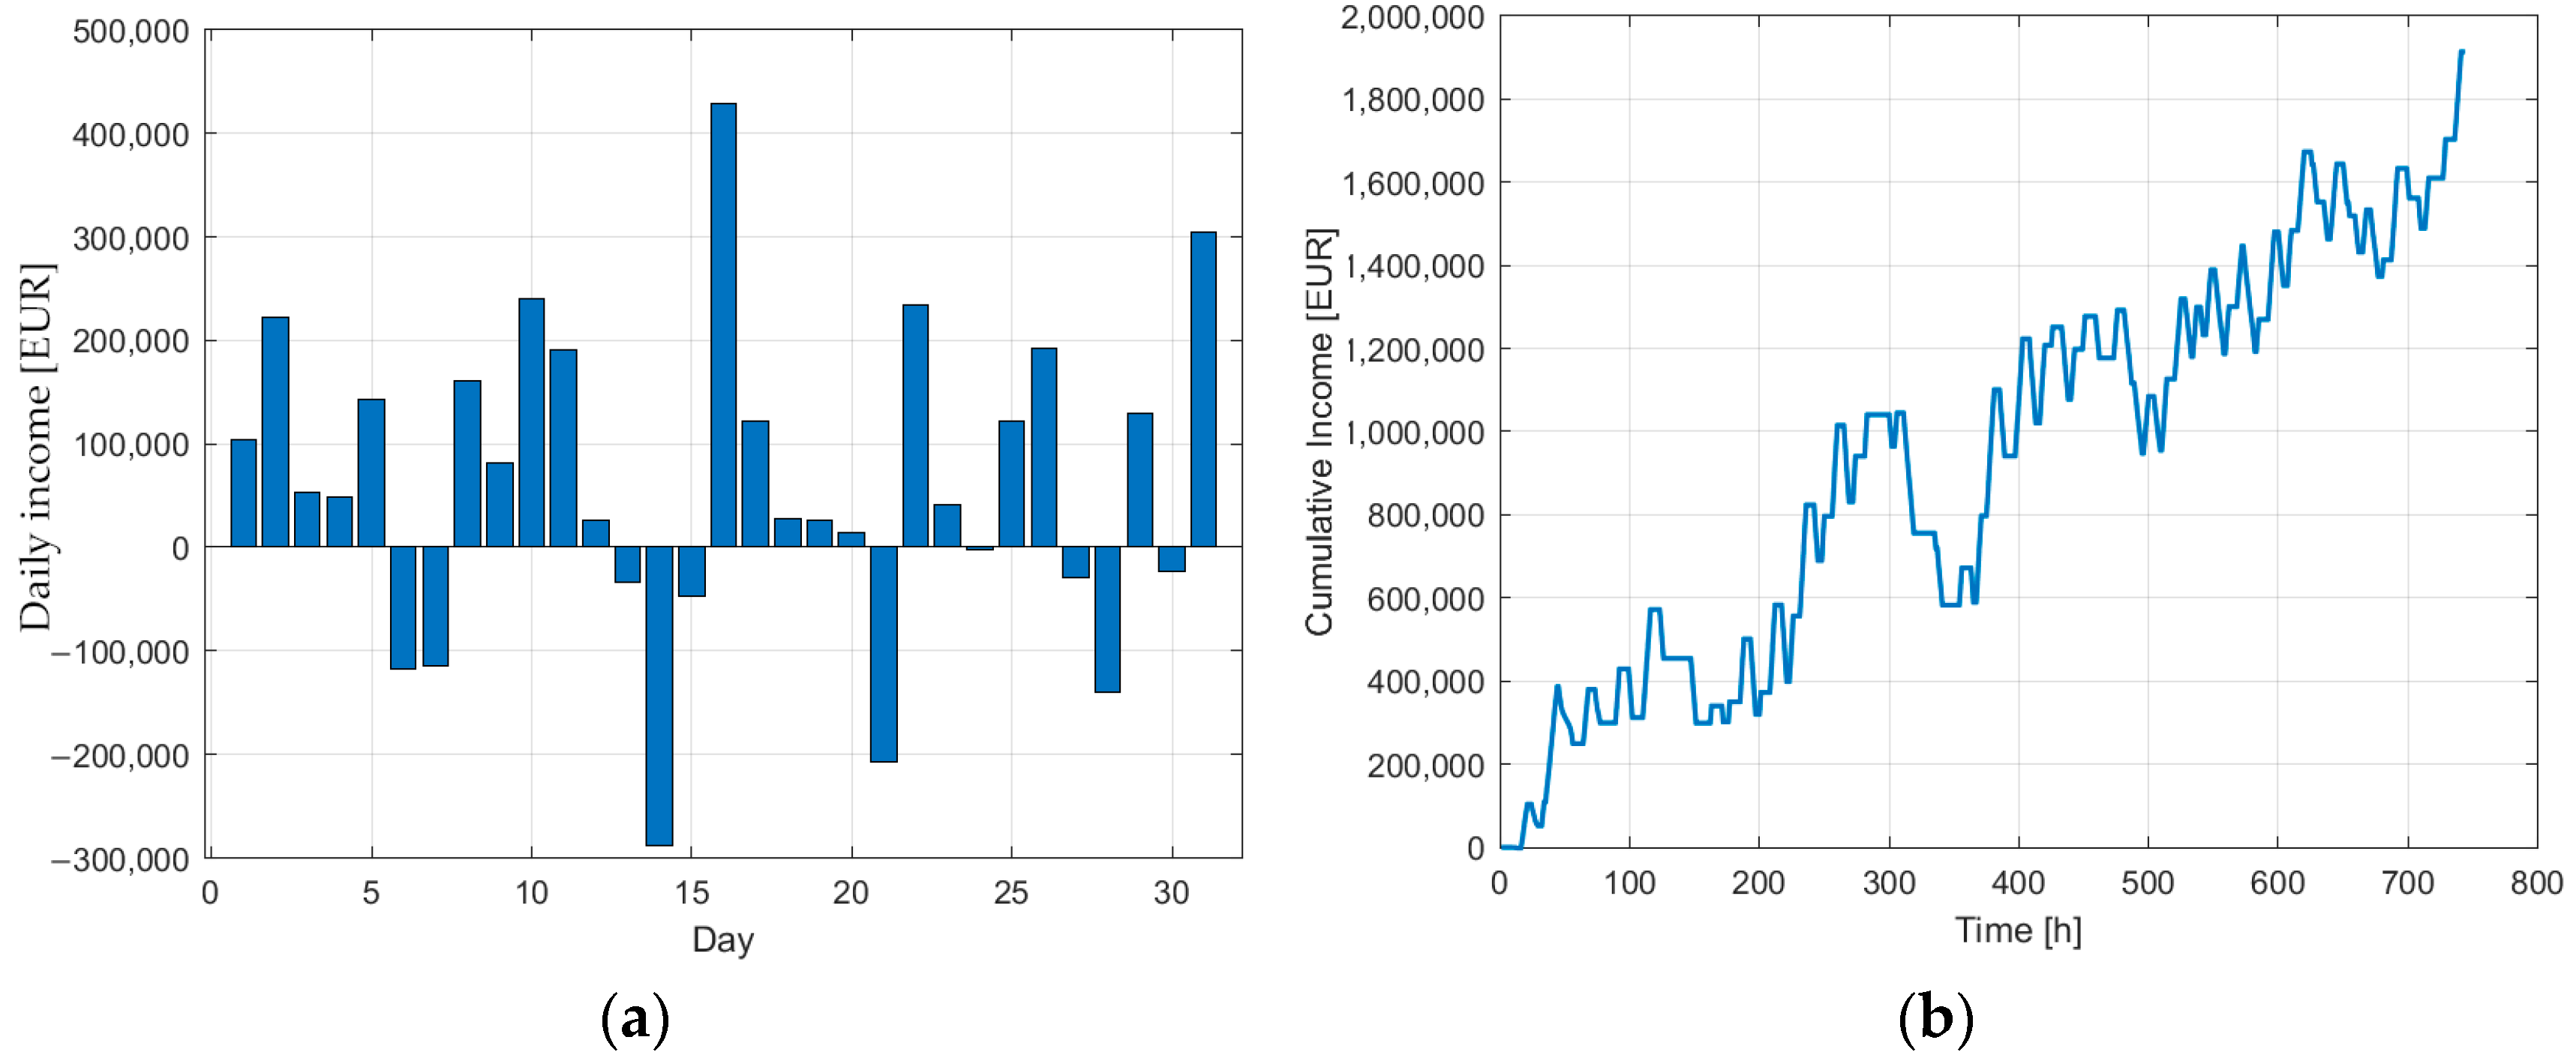
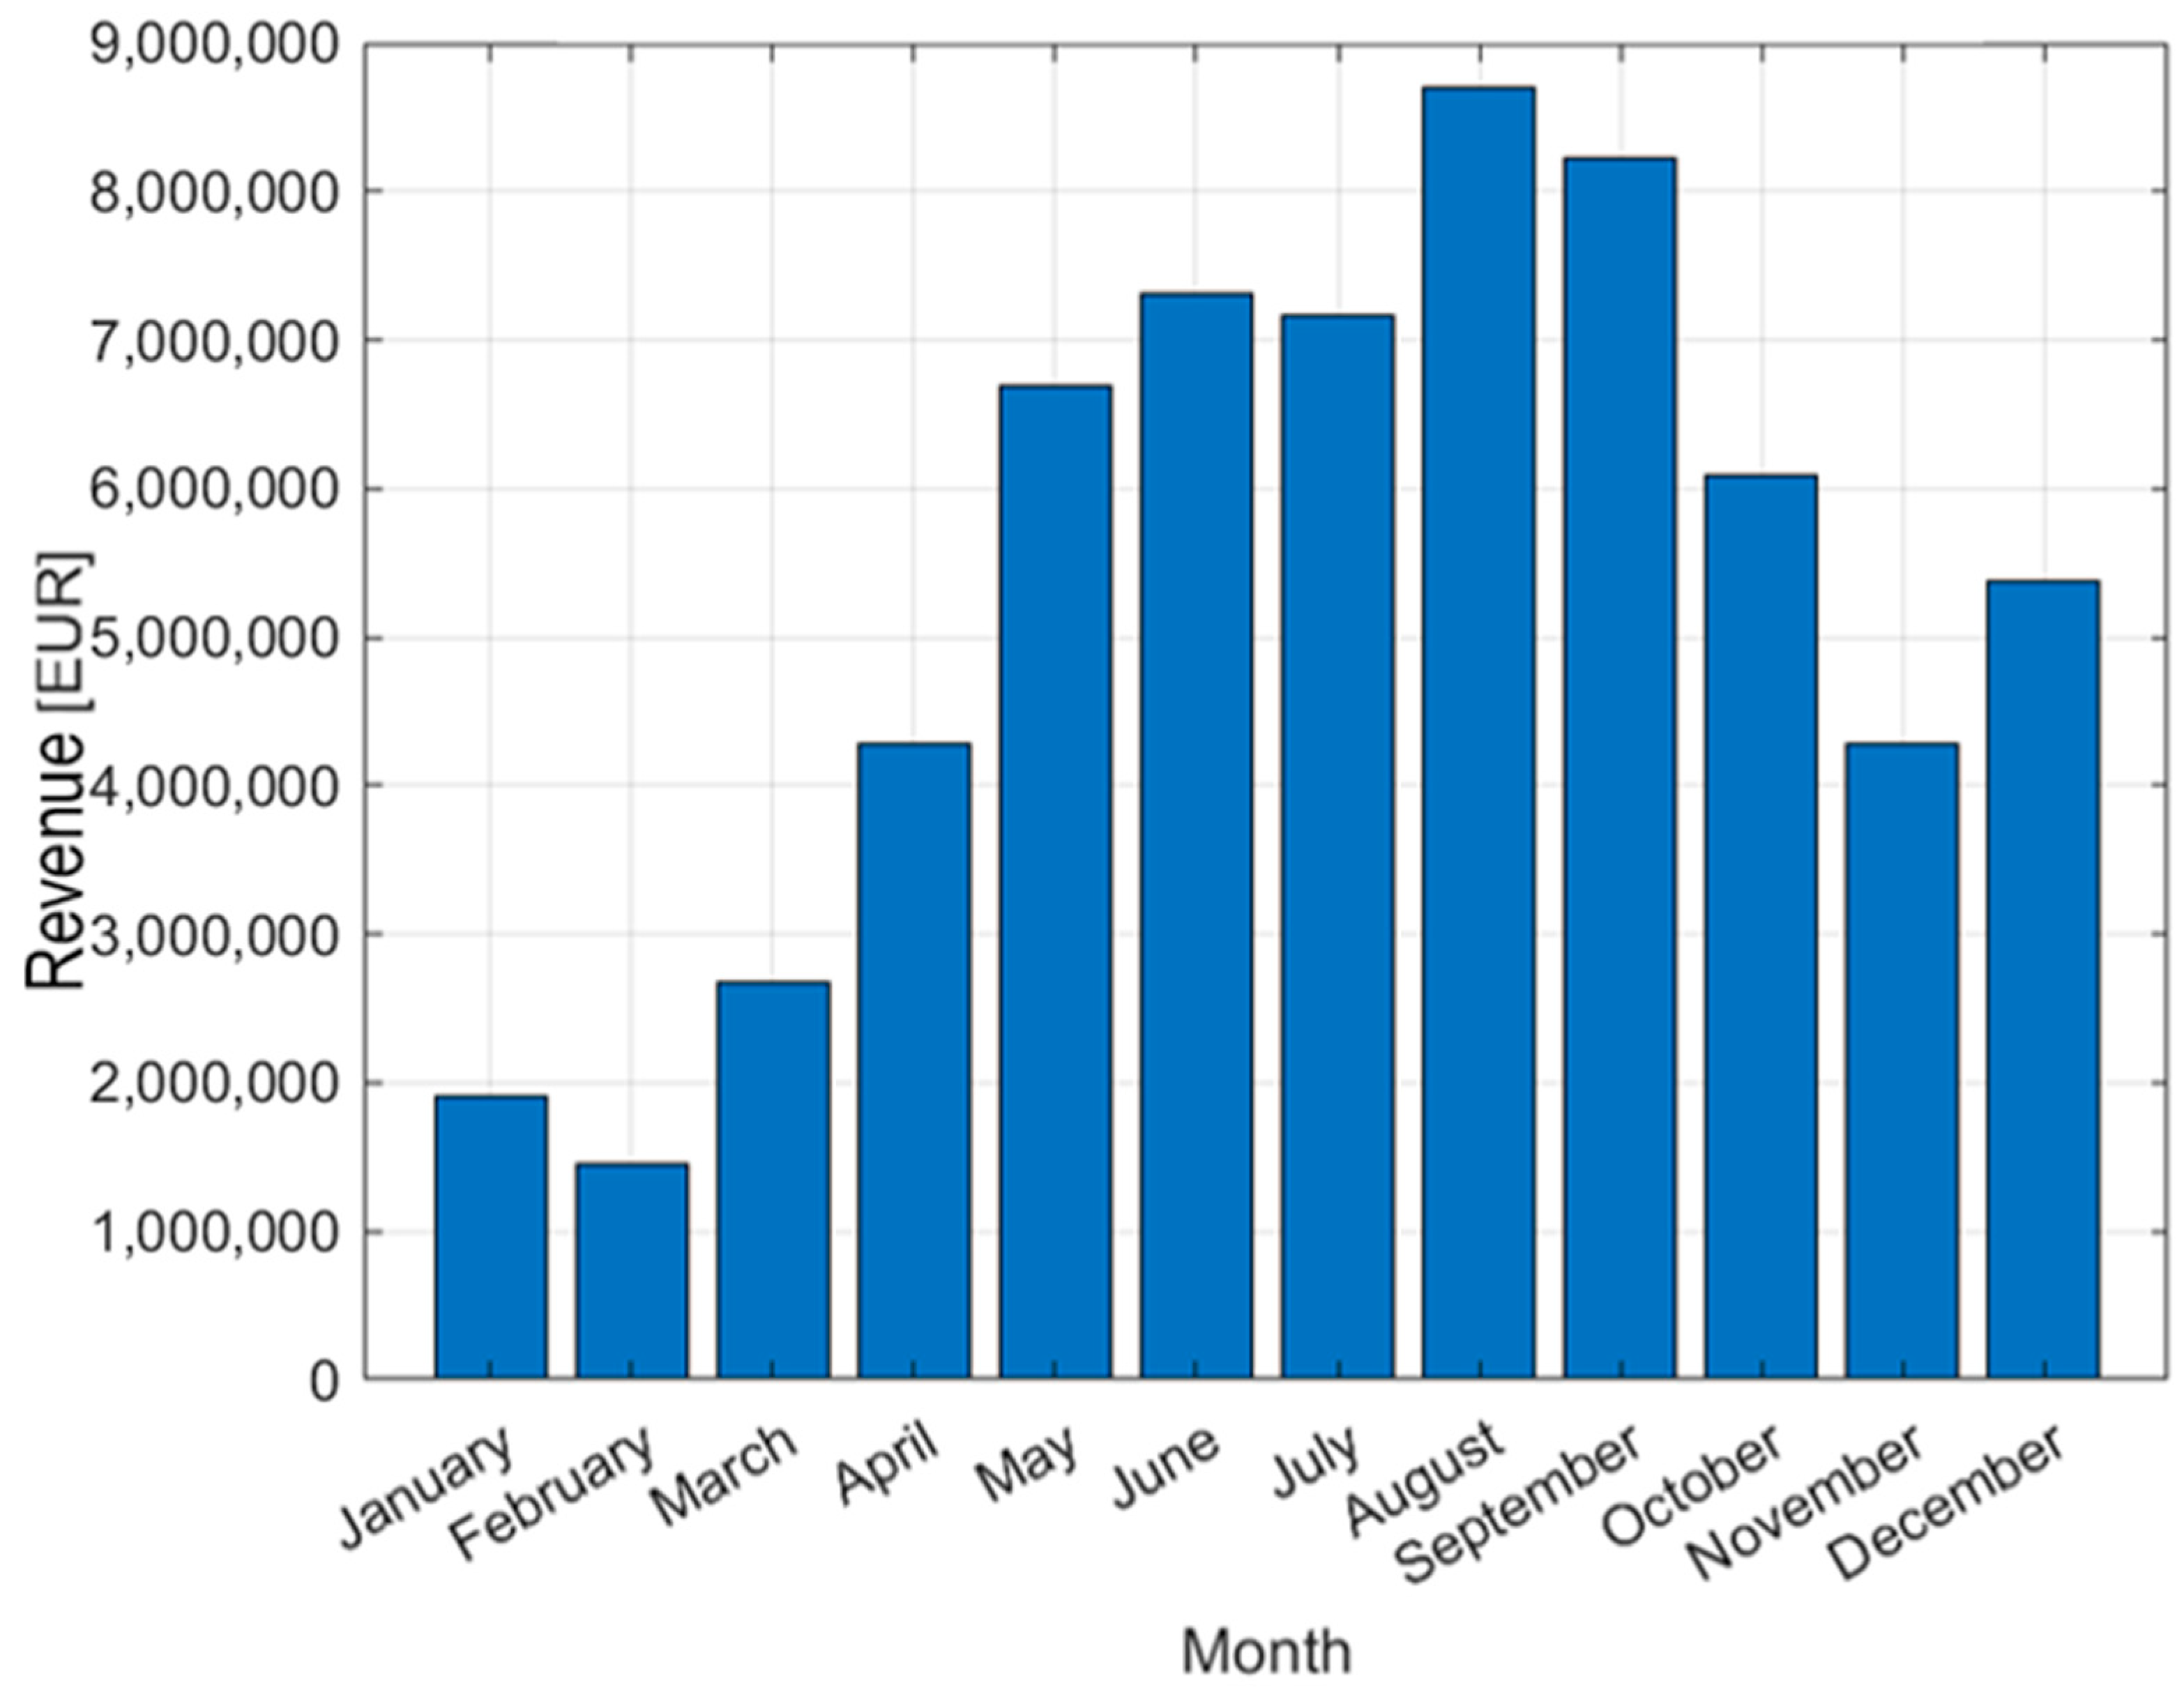
The analysis establishes a high correlation between volatility in the electricity market, particularly negative pricing occurrences, and the economic attractiveness of operating PHS. Summer periods (from May to September, with mid-day solar surplus production) account for over 60% of the yearly revenue due to a higher number of negative and positive price hours with high peak-to-peak prices. Winter is still marginally positive but provides fewer opportunities for cheap pumping. A specifically interesting outcome is that of August’s peak revenue, with the same operational hours as in January, but four times the revenue, gaining from the greater peaks.
From the optimized results and installed capacity, two performance indicators were calculated: turbine utilization time was derived from operational turbine hours and was 24.4%, and energy utilization, calculated from energy produced and rated power of the turbines, was 22.0%.
The results are limited to one year of day-ahead electricity prices and selected technical assumptions. Sensitivity analyses, hydraulic losses, start-up and shutdown costs, cycle wear, ancillary services, balancing markets, reserves, and capacity mechanisms were not included. Therefore, the study demonstrates positive price-arbitrage revenue under the analyzed 2024 market conditions, but it does not represent a full techno-economic assessment or a complete evaluation of the wider system value of the project.
Taking into account the growing proportion of renewable energy in Slovenia and the EU, with 219 h of negative pricing in 2024 alone, there is clear evidence for the need for flexible and scalable storage. The MILP methodology was found suitable for creating the dispatch schedules and analysing the interaction of operational constraints and market behavior.
From a sustainability perspective, this study contributes to the technical and economic dimensions of sustainable energy systems. Pumped-storage hydropower shifts electricity consumption to periods of low prices and surplus generation, and provides dispatchable generation during periods of higher demand. This means that integrating PHS into the power system positively impacts power system flexibility and, due to the rising trend of RES, has a positive impact on their integration. The presented optimization framework, therefore, supports sustainable energy planning by linking renewable energy deployment, grid flexibility, and market-based operation of large-scale energy storage.