1. Introduction
Tourism is closely related to regional economic growth, cultural exchange, and the improvement of destination service functions. Studies on China’s tourism development have shown that tourism growth is associated with regional economic development, industrial integration, and the spatial organization of tourist-source markets [
1,
2,
3,
4]. Earlier research on urban tourism space and transport–tourism interaction further indicates that tourism development is not only determined by the existence of attractions, but also by the way attractions are connected with markets, cities, services, and transport systems [
5,
6]. In addition, tourism service capacity and the quality of tourism labor influence the actual reception and operation of destinations, especially in regions where tourism depends heavily on face-to-face services and local cultural communication [
7,
8]. Therefore, evaluating regional tourism development requires attention to resource endowment, transport conditions, service capacity, and socio-economic support rather than focusing on scenic re-sources alone.
At the empirical level, tourism and transport studies in China have increasingly used accessibility indicators to explain differences in scenic-area development and tourism economic linkages. Research on the Three Gorges region, metropolitan tourist attractions, scenic-area transport accessibility, and tourism transport–tourism economy coordination has shown that travel time, transport network conditions, and regional development foundations jointly affect the accessibility and spatial interaction of tourism destinations [
9,
10,
11,
12]. Similar accessibility problems have also been discussed in village systems, periurban parks, and other spatial service contexts, suggesting that accessibility analysis is useful for identifying unequal access to spatial opportunities under different supply, demand, and traffic conditions [
13,
14]. Although not directly focused on tourism accessibility, point-area representation research shows that the way spatial objects are represented may influence the interpretation of regional spatial patterns, while travel-time uncertainty research further indicates that accessibility and equity assessments can be affected by un-certainty in travel costs [
15,
16]. These studies provide methodological and empirical sup-port for examining tourism accessibility in complex mountainous and plateau regions.
The concept of accessibility has a long tradition in geography, planning, and transport studies. Hansen [
17] provided an early operational definition by linking accessibility with the potential of opportunities available at a given location. Later studies further clarified that accessibility is not a single measurement concept, but a group of indica-tors with different theoretical assumptions, data requirements, and policy implications [
18,
19]. In practice, accessibility can be measured through distance, travel time, cumulative opportunities, potential accessibility, spatial interaction models, and catchment-based methods [
20,
21]. Wilson [
22] placed gravity-type models within the broader family of spatial interaction models, emphasizing that interaction potential is shaped jointly by the “mass” of opportunities and the impedance between origins and destinations. In addition, the two-step floating catchment area method and its improved Gaussian forms have been widely used in medical, childcare, and park green-space accessibility research because they can incorporate supply scale, demand scale, and distance decay in one framework [
23,
24,
25]. These methods show that accessibility is not only a technical measurement of distance, but also a way to evaluate the relationship between spatial opportunities and population demand.
Tourism accessibility research has expanded rapidly with the development of GIS, road-network analysis, POI data, online tourism data, and multi-source socio-economic datasets. Liao and Zhang [
26] found that A-level scenic spots in Guangdong Province showed clear spatial clustering and that accessibility was closely associated with regional socio-economic conditions. Wang et al. [
27] showed that the spatial distribution of high-quality tourist attractions in Shandong Province was jointly constrained by resource endowment, socio-economic development, and transport conditions. Zhang and Long [
28] used online tourism platform data to evaluate the attraction and spatial pattern of China’s world cultural and natural heritage tourism resources, indicating that tourism attraction is not only related to resource value but also to development conditions and spatial organization. Tao et al. [
29] further examined the coupling relationship between tourist-attraction accessibility and tourism demand in Anhui Province and found that accessibility improvement can promote better supply–demand coordination, although marginal mountainous areas may remain disadvantaged. Studies on Sichuan Province and high-speed rail tourism also suggest that transport accessibility can reshape the spatial distribution of tourist attractions and tourism flows [
30,
31]. However, most existing studies focus on relatively developed provinces, single-province spatial structures, or the spatial distribution of scenic spots themselves. Less attention has been paid to large cross-regional plateau areas where tourism resources, population distribution, economic capacity, and transport barriers are strongly uneven.
As accessibility measurement has become more refined, scholars have increasingly emphasized its equity implications. Accessibility is not only a matter of transport efficiency; it is also related to distributive justice, social exclusion, and spatial opportunity [
32,
33]. Transport equity studies argue that infrastructure improvements may produce uneven benefits across places and social groups, and that accessibility indicators can provide an important basis for evaluating the fairness of transport policies and investment outcomes [
34,
35]. In empirical research, the Gini coefficient, Theil index, Lorenz curve, coefficient of variation, and accessibility-based supply–demand comparison have been used to reveal whether spatial opportunities are concentrated in a small number of areas or more evenly shared by the population [
36,
37]. For the Tibetan Plateau, Gao and Sun [
38] found that transport accessibility and social demand show clear spatial differences, suggesting that plateau regions require special attention because sparse settlement, ecological fragility, and long-distance travel costs may amplify accessibility inequality. For tourism research, this equity perspective is particularly important. If high-grade tourism resources are located in remote areas but network accessibility is concentrated around developed urban cores, tourism development may reinforce rather than reduce regional disparities.
The Xizang–Sichuan region is located in southwestern China and includes the Xizang Autonomous Region and Sichuan Province. It is characterized by complex terrain, ecological sensitivity, ethnic diversity, and marked differences in socio-economic development. Studies on Xizang have emphasized that ecological-environment protection, tourism spatial justice, and the improvement of tourism’s comprehensive benefits are key issues for regional tourism development [
39,
40,
41]. From the perspective of tourism geography, tourism resources constitute the basic attraction of destinations, but their development value depends on market connection, service support, and spatial organization [
42]. General travel-choice studies also show that accessibility, individual attributes, trip characteristics, and travel preferences can affect travel mode choice, providing a useful behavioral perspective for understanding how transport conditions shape spatial mobility [
43]. Research on tourism economic linkages, culture–tourism coupling, high-level Grade A at-tractions, and beautiful leisure villages further indicates that tourism development is shaped by the interaction among resources, transport, economy, policy, and regional co-operation [
44,
45,
46,
47,
48]. In the Tibetan Plateau, high-grade tourist attractions display strong spatial heterogeneity, and peripheral attractions often face accessibility disadvantages despite their high resource value [
49,
50]. Therefore, the Xizang–Sichuan region provides a typical case for examining how high-grade tourism resources, network accessibility, and opportunity equity are matched or mismatched across a large plateau–mountain region.
Based on the above literature, existing tourism accessibility studies have provided useful evidence at provincial, urban, and scenic-spot scales, but cross-regional plateau areas with strong terrain barriers and uneven socio-economic foundations remain insufficiently examined. Second, many studies use travel time, distance, or accessibility to attractions as the main indicator, while less attention is paid to county-level tourism network potential that integrates resource attractiveness, market scale, economic capacity, and travel-time impedance. Third, tourism development level and accessibility equity are often analyzed separately, making it difficult to identify areas where relatively strong tourism development foundations are not matched by sufficient network accessibility. To address these gaps, this study takes counties and districts in the Xizang–Sichuan region as the basic analytical units and focuses on high-grade scenic spots, namely 4A- and 5A-level attractions. It integrates the Analytic Hierarchy Process and an improved gravity model for tourism network potential accessibility to evaluate county-level tourism development and network-based accessibility. On this basis, population-weighted equity indicators and development–TNPA mismatch classification are used to examine how tourism network opportunities are distributed and whether tourism development foundations correspond to accessibility conditions. The objectives of this study are to: (1) construct a multidimensional evaluation framework for county-level tourism development in the Xizang–Sichuan region; (2) measure the spatial pattern of tourism network potential accessibility among counties; (3) evaluate the population-weighted equity of tourism accessibility; and (4) identify mismatch areas where tourism development foundations and network accessibility are not well coordinated.
2. Research Methods and Data Sources
2.1. Study Area
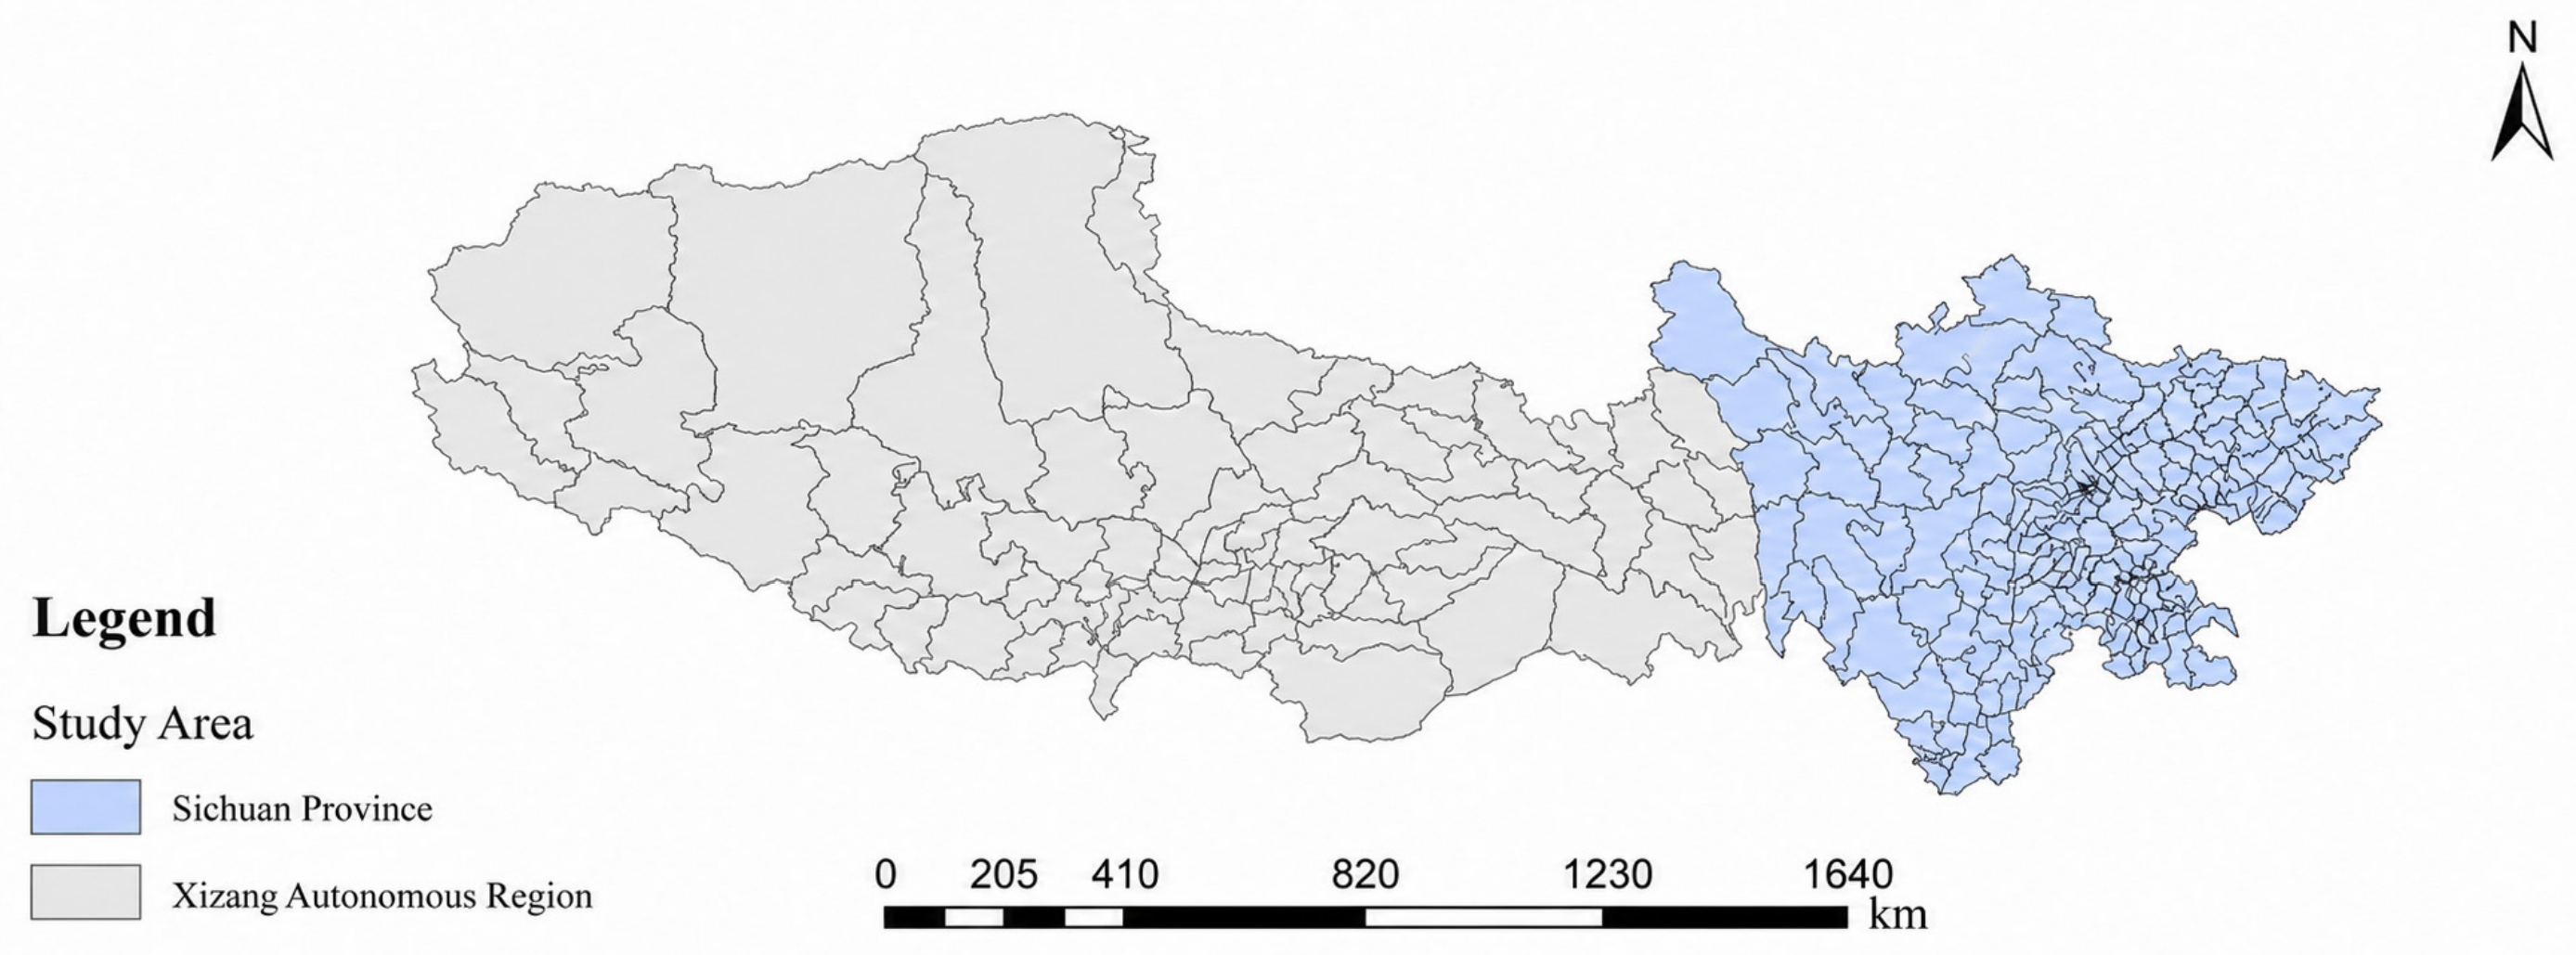
The study area (
Figure 1) comprises the entire Xizang Autonomous Region and Sichuan Province in southwestern China, covering 257 county-level units (183 in Sichuan and 74 in Xizang) over approximately 1.2 million km
2. The region spans the main body of the Qinghai–Tibet Plateau and its eastern margin, characterized by extremely high average elevations (over 4000 m in most parts of Xizang), complex terrain, and fragile ecological conditions. Population distribution is highly uneven: Sichuan is relatively densely populated (83.5 million), whereas Xizang has only 3.6 million inhabitants scattered across vast areas. Consequently, road network density, economic activity (GDP per capita), and tourism service capacity differ sharply between the two provinces. Despite these disparities, the region contains abundant high-grade scenic spots (4A and 5A), including Jiuzhaigou, Daocheng Yading, and the Potala Palace. The combination of rich tourism resources and severe transport barriers makes this area an ideal case for studying spatial accessibility, equity, and development mismatches.
2.2. Analytic Hierarchy Process
The Analytic Hierarchy Process (AHP) is a commonly used decision-analysis method. By constructing a hierarchical structural model, it enables quantitative analysis of complex decision-making problems. In this study, the sum–product method was adopted to calculate the principal eigenvector of the pairwise comparison matrix.Suppose that the relative importance of n elements with respect to a given criterion is obtained through pairwise comparisons, forming the judgment matrix
, where
denotes the importance scale of element
relative to element
. Each column vector of the judgment matrix is first normalized to obtain matrix B, as follows:
The elements in each row of the normalized matrix are then summed to obtain vector M:
Vector
is further normalized to obtain the weight vector
:
The maximum eigenvalue is calculated as follows:
where
represents the i-th component of vector
.
A consistency test is required because the complexity of objective phenomena and differences in expert judgment may lead to logical inconsistencies in the construction of the judgment matrix. For example, an expert may judge that A is more important than B, B is more important than C, but C is more important than A. Therefore, the consistency of the judgment matrix must be examined before the weight vector is accepted.
The consistency index
is calculated as:
where n is the order of the judgment matrix. A larger
indicates a greater deviation from perfect consistency, whereas a smaller
, approaching zero, indicates better consistency.
The random index
is then obtained from standard reference tables derived from extensive random simulation experiments. On this basis, the consistency ratio
is calculated as:
The judgment criterion is as follows: when < 0.1, the consistency of the judgment matrix is considered acceptable and the weight vector W is valid; when ≥ 0.1, the judgment matrix fails to meet the consistency requirement and should be revised.
2.3. Improved Gravity Model for Tourism Network Potential Accessibility (TNPA)
This study adopts an improved gravity model to calculate tourism network potential accessibility (TNPA). The calculation proceeds in several steps. First, the comprehensive tourism quality
of each county
is defined as the geometric mean of its permanent population
(person), gross domestic product
(10,000 RMB), and the regional tourism development level
obtained from the AHP evaluation (dimensionless, ranging 0–1):
This measure integrates market size, economic strength, and tourism development capacity. Second, the generalized comprehensive distance
between county
and county
is calculated by adjusting the shortest road travel time with the per capita GDP difference. The shortest driving time
(minutes) is obtained from the Amap API. Let
and
be the per capita GDP values. Then:
where
is the maximum percapita GDP across all counties. This formulation increases the effective distance between counties with large economic disparities, thereby weakening their potential tourism interaction.
Third, the tourism gravity intensity
between county
and county
is computed using an improved gravity model:
Here is a boundary correction coefficient that accounts for administrative division effects: if the two counties belong to the same prefecture-level city; if they are in the same province but different prefecture-level cities; and if they are in different provinces. The distance decay parameter is set to the classic value of 2.0.
Fourth, the tourism network potential accessibility of county
is defined as the sum of gravity intensities from all other counties:
A larger
indicates a higher total interaction potential, i.e., better accessibility. Finally,
is normalized by min-max rescaling:
which lies in
and is used for subsequent equity and mismatch analyses.
A robustness test was performed by testing different values of (1.0, 1.5, 2.0, 2.5, 3.0) and several sets of boundary coefficients. Spearman’s rank correlation coefficients between all parameter combinations and the baseline (, default boundary coefficients) were all above 0.94, confirming that the model is robust to parameter choices. Therefore, and the default boundary coefficients are adopted as the final parameters.
2.4. Accessibility Equity Evaluation Method
Based on the TNPA results obtained from the improved gravity model, this study further introduces the population-weighted Gini coefficient, Theil index, coefficient of variation, and Lorenz curve to evaluate the equity of tourism network potential across county-level units. Compared with simple county-level averages, the population-weighted approach better reflects how tourism interaction opportunities are distributed among residents in areas with different population sizes, thereby reducing the excessive influence of sparsely populated counties on the overall equity assessment.
First, the population-weighted Gini coefficient is used to measure the inequality of accessibility distribution. A value closer to 0 indicates a more balanced accessibility distribution, whereas a larger value suggests that tourism opportunities are more concentrated in a limited number of areas. The formula is given as:
where
is the population-weighted Gini coefficient;
represents the cumulative population proportion after counties are sorted in ascending order of accessibility; Li is the corresponding cumulative accessibility proportion; and
denotes the number of county-level units.
Second, the Theil index is used to further identify differences in accessibility distribution. Because the Theil index is sensitive to disparities between high and low values, it provides a useful supplement to the Gini coefficient in assessing overall inequality. It is calculated as follows:
where
is the Theil index;
denotes the population of county
;
is the total population of the study area;
is the accessibility value of county
; and
is the population-weighted mean accessibility. A larger Theil index indicates a more unequal distribution of accessibility opportunities. When
, the term
is treated as 0 according to its limiting value.
This study also employs the population-weighted coefficient of variation to measure the dispersion of county-level accessibility relative to the mean level. The calculation is expressed as:
where
represents the population-weighted coefficient of variation. A larger value indicates greater accessibility differences among counties.
On this basis, Lorenz curves are plotted to visually represent the concentration of accessibility opportunities across the cumulative population distribution. The closer the Lorenz curve is to the line of perfect equality, the more balanced the distribution of tourism accessibility among the population. Conversely, a greater deviation from the equality line indicates that accessibility opportunities are more concentrated among a small proportion of the population or in a limited number of areas.
In addition, to identify the matching relationship between regional tourism development foundations and network accessibility, the regional tourism development level and the baseline TNPA value were normalized using min–max standardization:
where
is the standardized value,
is the original value, and
and
are the minimum and maximum values of the corresponding indicator, respectively. The median values of the two standardized indicators were then used as classification thresholds to divide counties into four types: high development–high TNPA, high development–low TNPA, low development–high TNPA, and low development–low TNPA. High development–low TNPA areas indicate counties with relatively strong tourism development foundations but weak integration into the regional tourism network, whereas low development–low TNPA areas face dual constraints of weak development foundations and limited network accessibility. This classification helps identify areas where transport connections, tourism node functions, and resource conversion capacity should be improved.
2.5. Construction of the Comprehensive Evaluation Indicator System for Regional Tourism Development
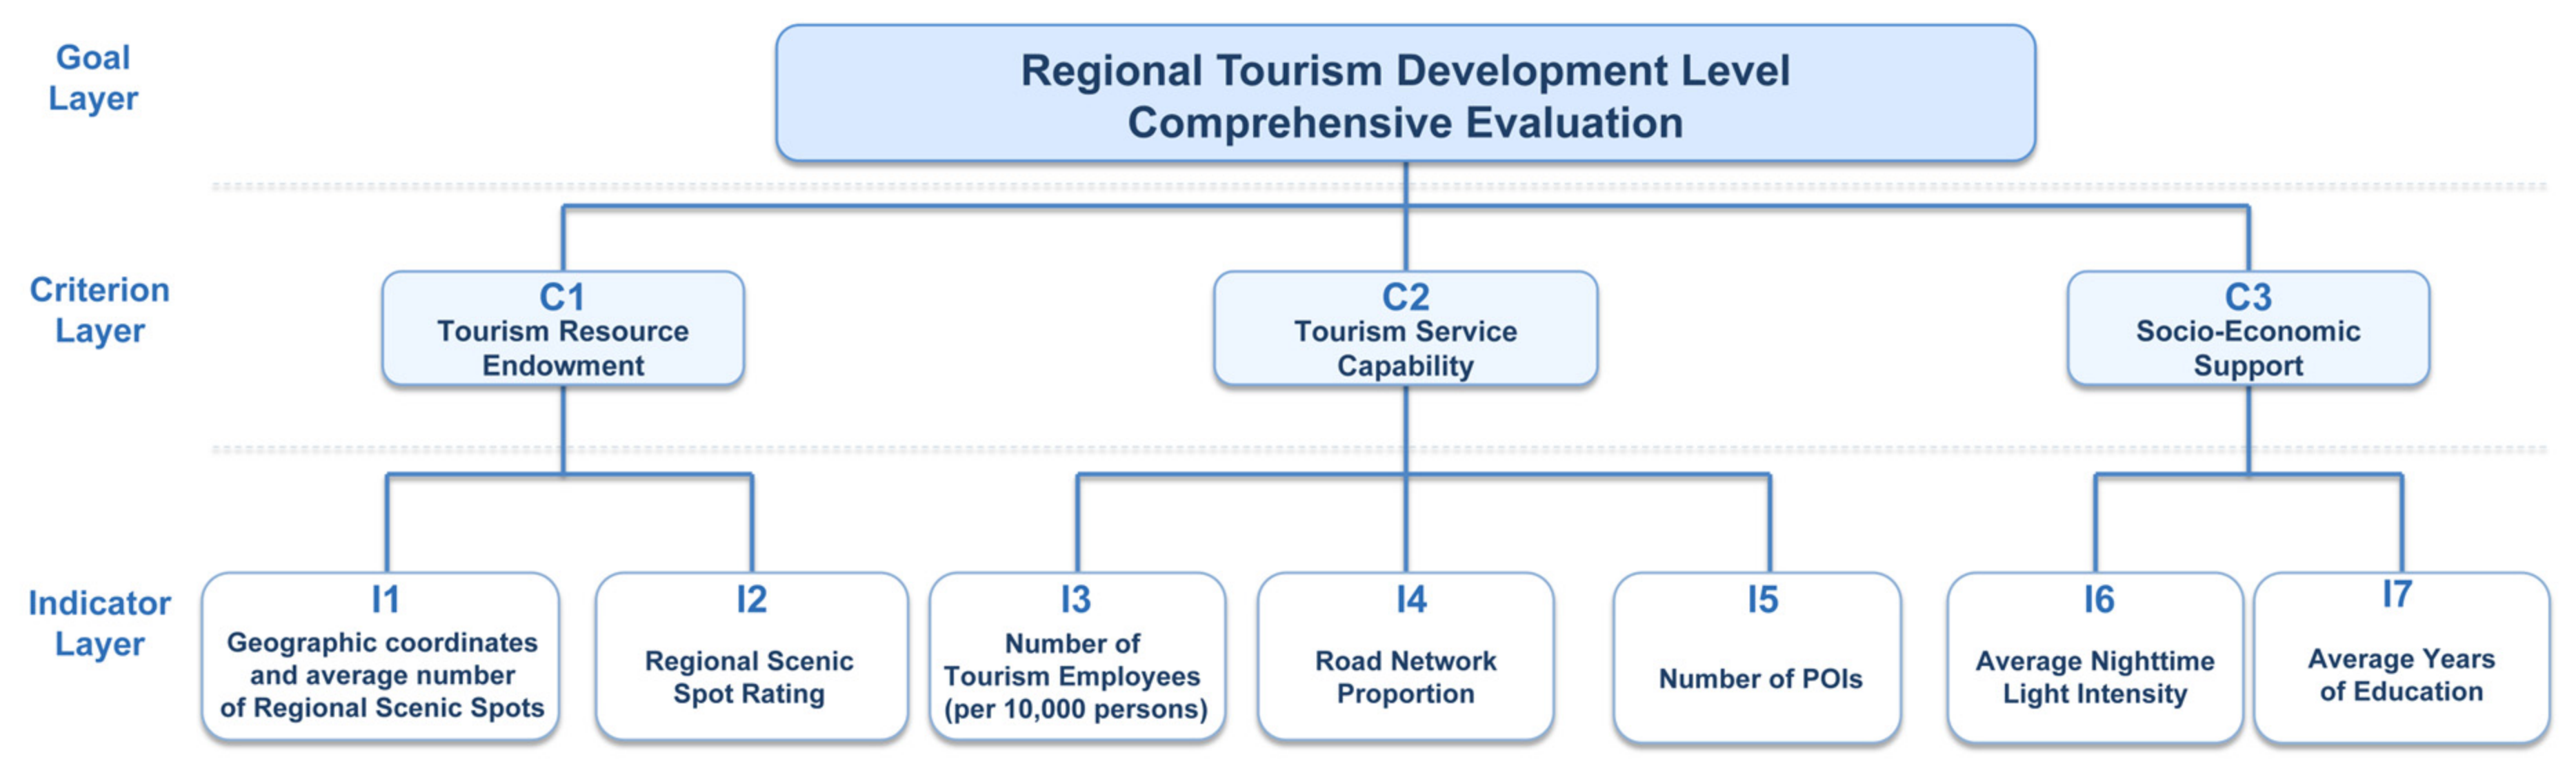
To evaluate the level of regional tourism development in a scientific and comprehensive manner, this study constructs a hierarchical evaluation model with three levels, following the principles of scientific validity, systematicity, operability, and data availability. The target layer is defined as the “comprehensive evaluation of regional tourism development level.” The criterion layer consists of three dimensions: Tourism Resource Endowment, Tourism Service Capacity, and Socioeconomic Support. Based on relevant literature and the characteristics of the study area, seven quantifiable indicators are selected for the indicator layer. The specific meanings and hierarchical relationships of these dimensions and indicators are described in detail below.
The hierarchical structure model established in this study is shown in
Figure 2, and its specific hierarchical relationships are as follows:
2.6. Data Sources and Preprocessing
The county-level population data used in this study were obtained from the results of the Seventh National Population Census. Data on employees in the transportation sector and in the accommodation and catering industries were derived from the 2020 China County-Level Population Census Data. Road network data were obtained from OpenStreetMap (OSM,
https://www.openstreetmap.org/, accessed on 16 January 2026). Scenic spot ratings were collected from the official websites of cultural and tourism authorities. The locations and categories of points of number (POIs) were obtained from Amap POI data collected in 2023. Average years of education were derived from the Seventh National Population Census. POI density was calculated based on the number of POIs within each regional unit. The 2023 nighttime light raster data were obtained from the Earth Observation Group of the National Centers for Environmental Information (NCEI), under the National Oceanic and Atmospheric Administration (NOAA). The above data were obtained by downloading from their respective data sources and websites in March 2026. Origin–destination travel time data were acquired through the Amap API. The numbers of catering and tourism POIs, accommodation and catering services, and scenic spots are per capita quantities, and the light brightness is the average brightness per square kilometer. To eliminate dimensional effects and facilitate cross-sectional comparative analysis, all data were finally normalized using max-min normalization.
The POI data were cleaned by first removing duplicate records (based on name and longitude/latitude), eliminating anomalous points whose coordinates fell outside the county boundaries, and unifying the coordinate system to WGS84. For the road network data, the road layer was extracted from the OpenStreetMap (OSM) network, retaining all traversable roads (including expressways, national highways, provincial highways, and county/township roads), while excluding footpaths and roads under construction. The road network density was calculated as the total length of roads (km) within a county divided by the county area (km2).
Travel time queries were performed using the Gaode Map API. The starting and ending points were set as the seats of the county people’s governments. The queries were conducted for weekdays in April 2026, with the travel mode set to “driving” and the routing strategy to “shortest time”. For counties lacking directly connected roads (e.g., certain townships in Medog County), the nearest road network node was used as a substitute.
The software used in this study includes ArcGIS 10.8 and Python 3.12.
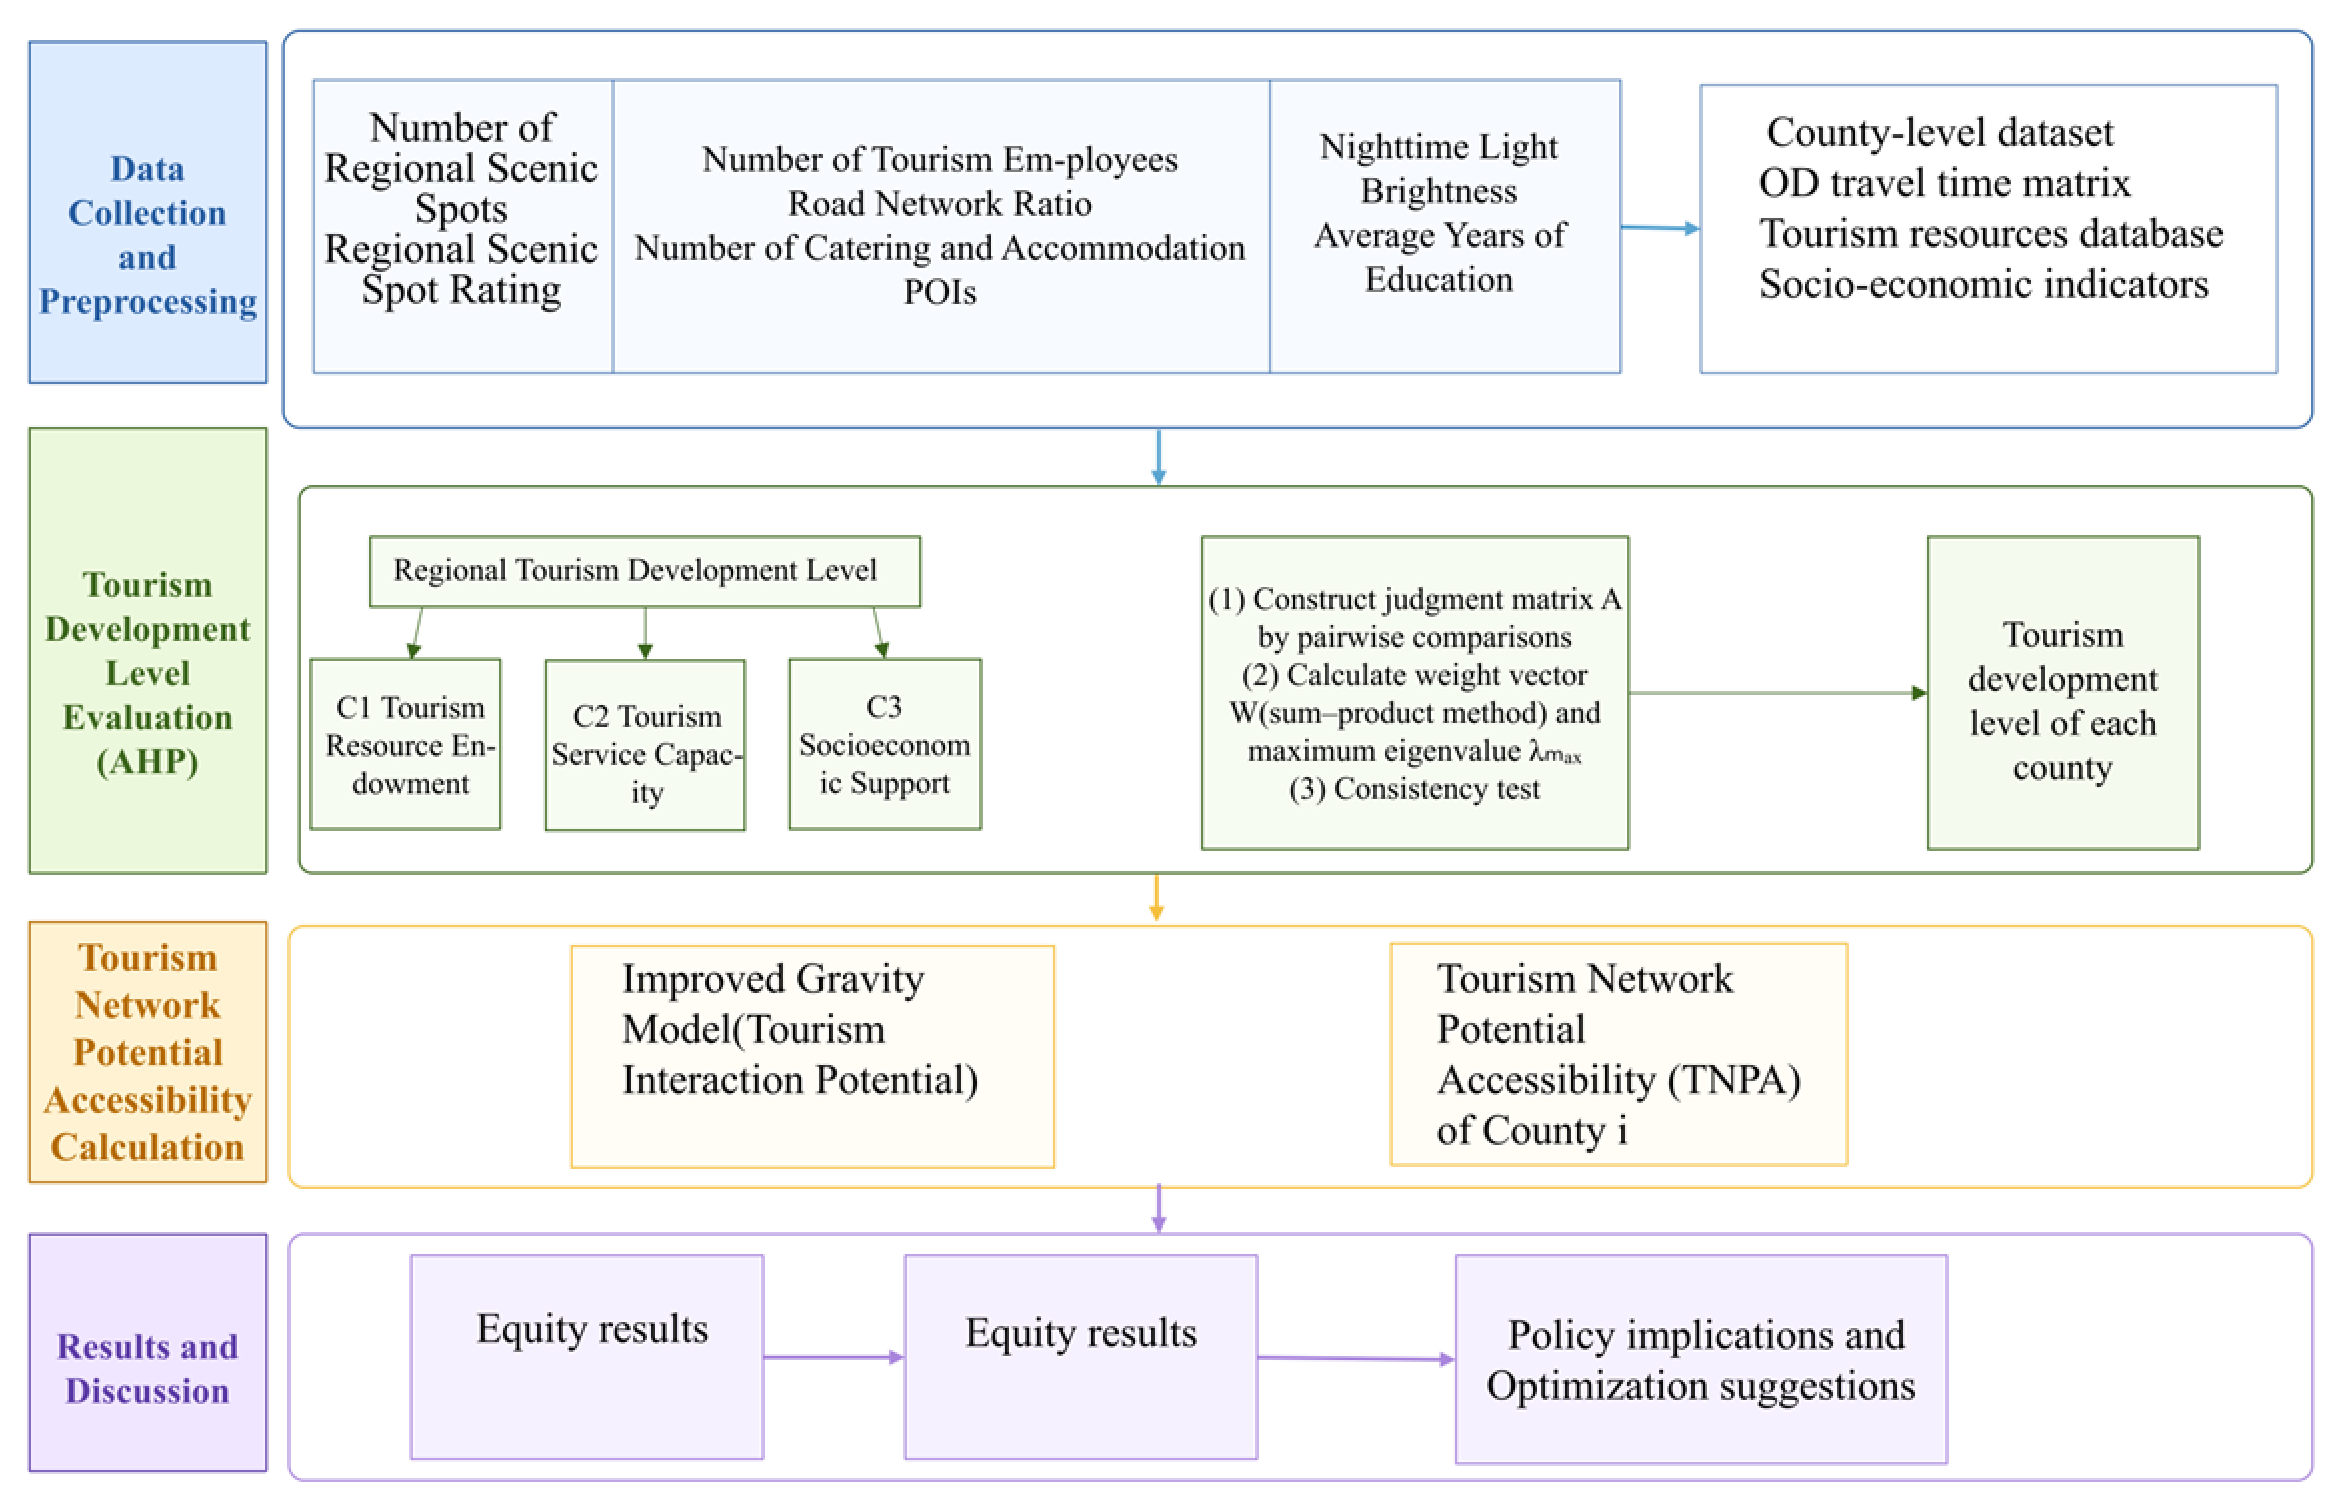
The research process of this study is shown in
Figure 3.
3. Results
3.1. Indicator Weight Results
Based on the established hierarchical structure model, experts in relevant fields were invited to conduct pairwise comparisons of indicators at each level using the 1–9 scale method. A total of 20 valid expert questionnaires were collected. The expert panel consists of 10 tourism geographers, 5 transportation planning engineers and 5 regional economists. All experts hold a master’s degree or higher and have work experience in their respective fields. The geometric mean was used to aggregate the expert judgments, and the sum-product method was then applied to calculate the relative weights. The consistency ratios of all judgment matrices were below 0.1, indicating that the weight results satisfied the consistency requirement. The judgment matrices and consistency test results for the criteria layer and indicator layer are shown in
Appendix A Table A1,
Table A2,
Table A3 and
Table A4, and the indicator weights are presented in
Table 1.
At the criterion level, tourism resource endowment received the highest weight (0.63), followed by tourism service capacity (0.24) and socio-economic support (0.13). At the indicator level, regional Scenic Spot Rating total weight (0.42), followed by the number of high-grade scenic spots (0.20), Number of Tourism Employees (0.13), and nighttime light Brightness (0.07). These four indicators together accounted for more than 84% of the total weight, showing that the evaluation result was mainly shaped by resource quality, resource quantity, service support, and economic activity. This weight structure is consistent with the tourism-development logic of the study area, where high-quality resources form the main attraction while service capacity and socio-economic conditions affect the conversion of resources into practical development advantages.
We conducted a sensitivity analysis on the weights. By setting three extreme weighting schemes (resource-dominated, service-dominated, and balanced), we recalculated the comprehensive tourism development scores and rankings for all counties. Spearman’s rank correlation analysis (
Appendix B Table A5 showed that the lowest correlation coefficient was between the resource-dominated and service-dominated schemes (ρ = 0.74,
p < 0.001), while all other correlation coefficients were greater than 0.8. This indicates that the ranking results are relatively robust and that the AHP weighting is not a decisive factor for the conclusions of this study.
Table 2 summarizes the main characteristics of the tourism development indicators after data checking, standardization, and recalculation using the revised AHP weights. The recalculated comprehensive tourism development level has a mean value of 0.316, with a coefficient of variation of 0.546, indicating a moderate but still evident spatial differentiation in county-level tourism development foundations. Compared with the composite index, several service, infrastructure, and spatial-activity indicators show stronger dispersion, especially road network ratio, nighttime light intensity, POI count, and accommodation and catering services. This suggests that the supporting conditions for tourism activities are more unevenly distributed than the final composite development score itself.
The provincial comparison further reveals a clear Sichuan–Xizang contrast. Sichuan has higher mean values for high-grade scenic spots, scenic-spot rating, accommodation and catering services, road network ratio, POI count, average years of education, and the recalculated comprehensive tourism development level. Nighttime light intensity is the only indicator with a higher mean value in Xizang. However, because this variable is affected by raster aggregation and the large territorial area of some plateau counties, it should be interpreted together with resource, service, and socio-economic indicators rather than being used as a stand-alone proxy for tourism development. Overall, the revised weighting scheme slightly increases the composite development scores but does not change the main conclusion that tourism development foundations remain stronger in Sichuan than in Xizang.
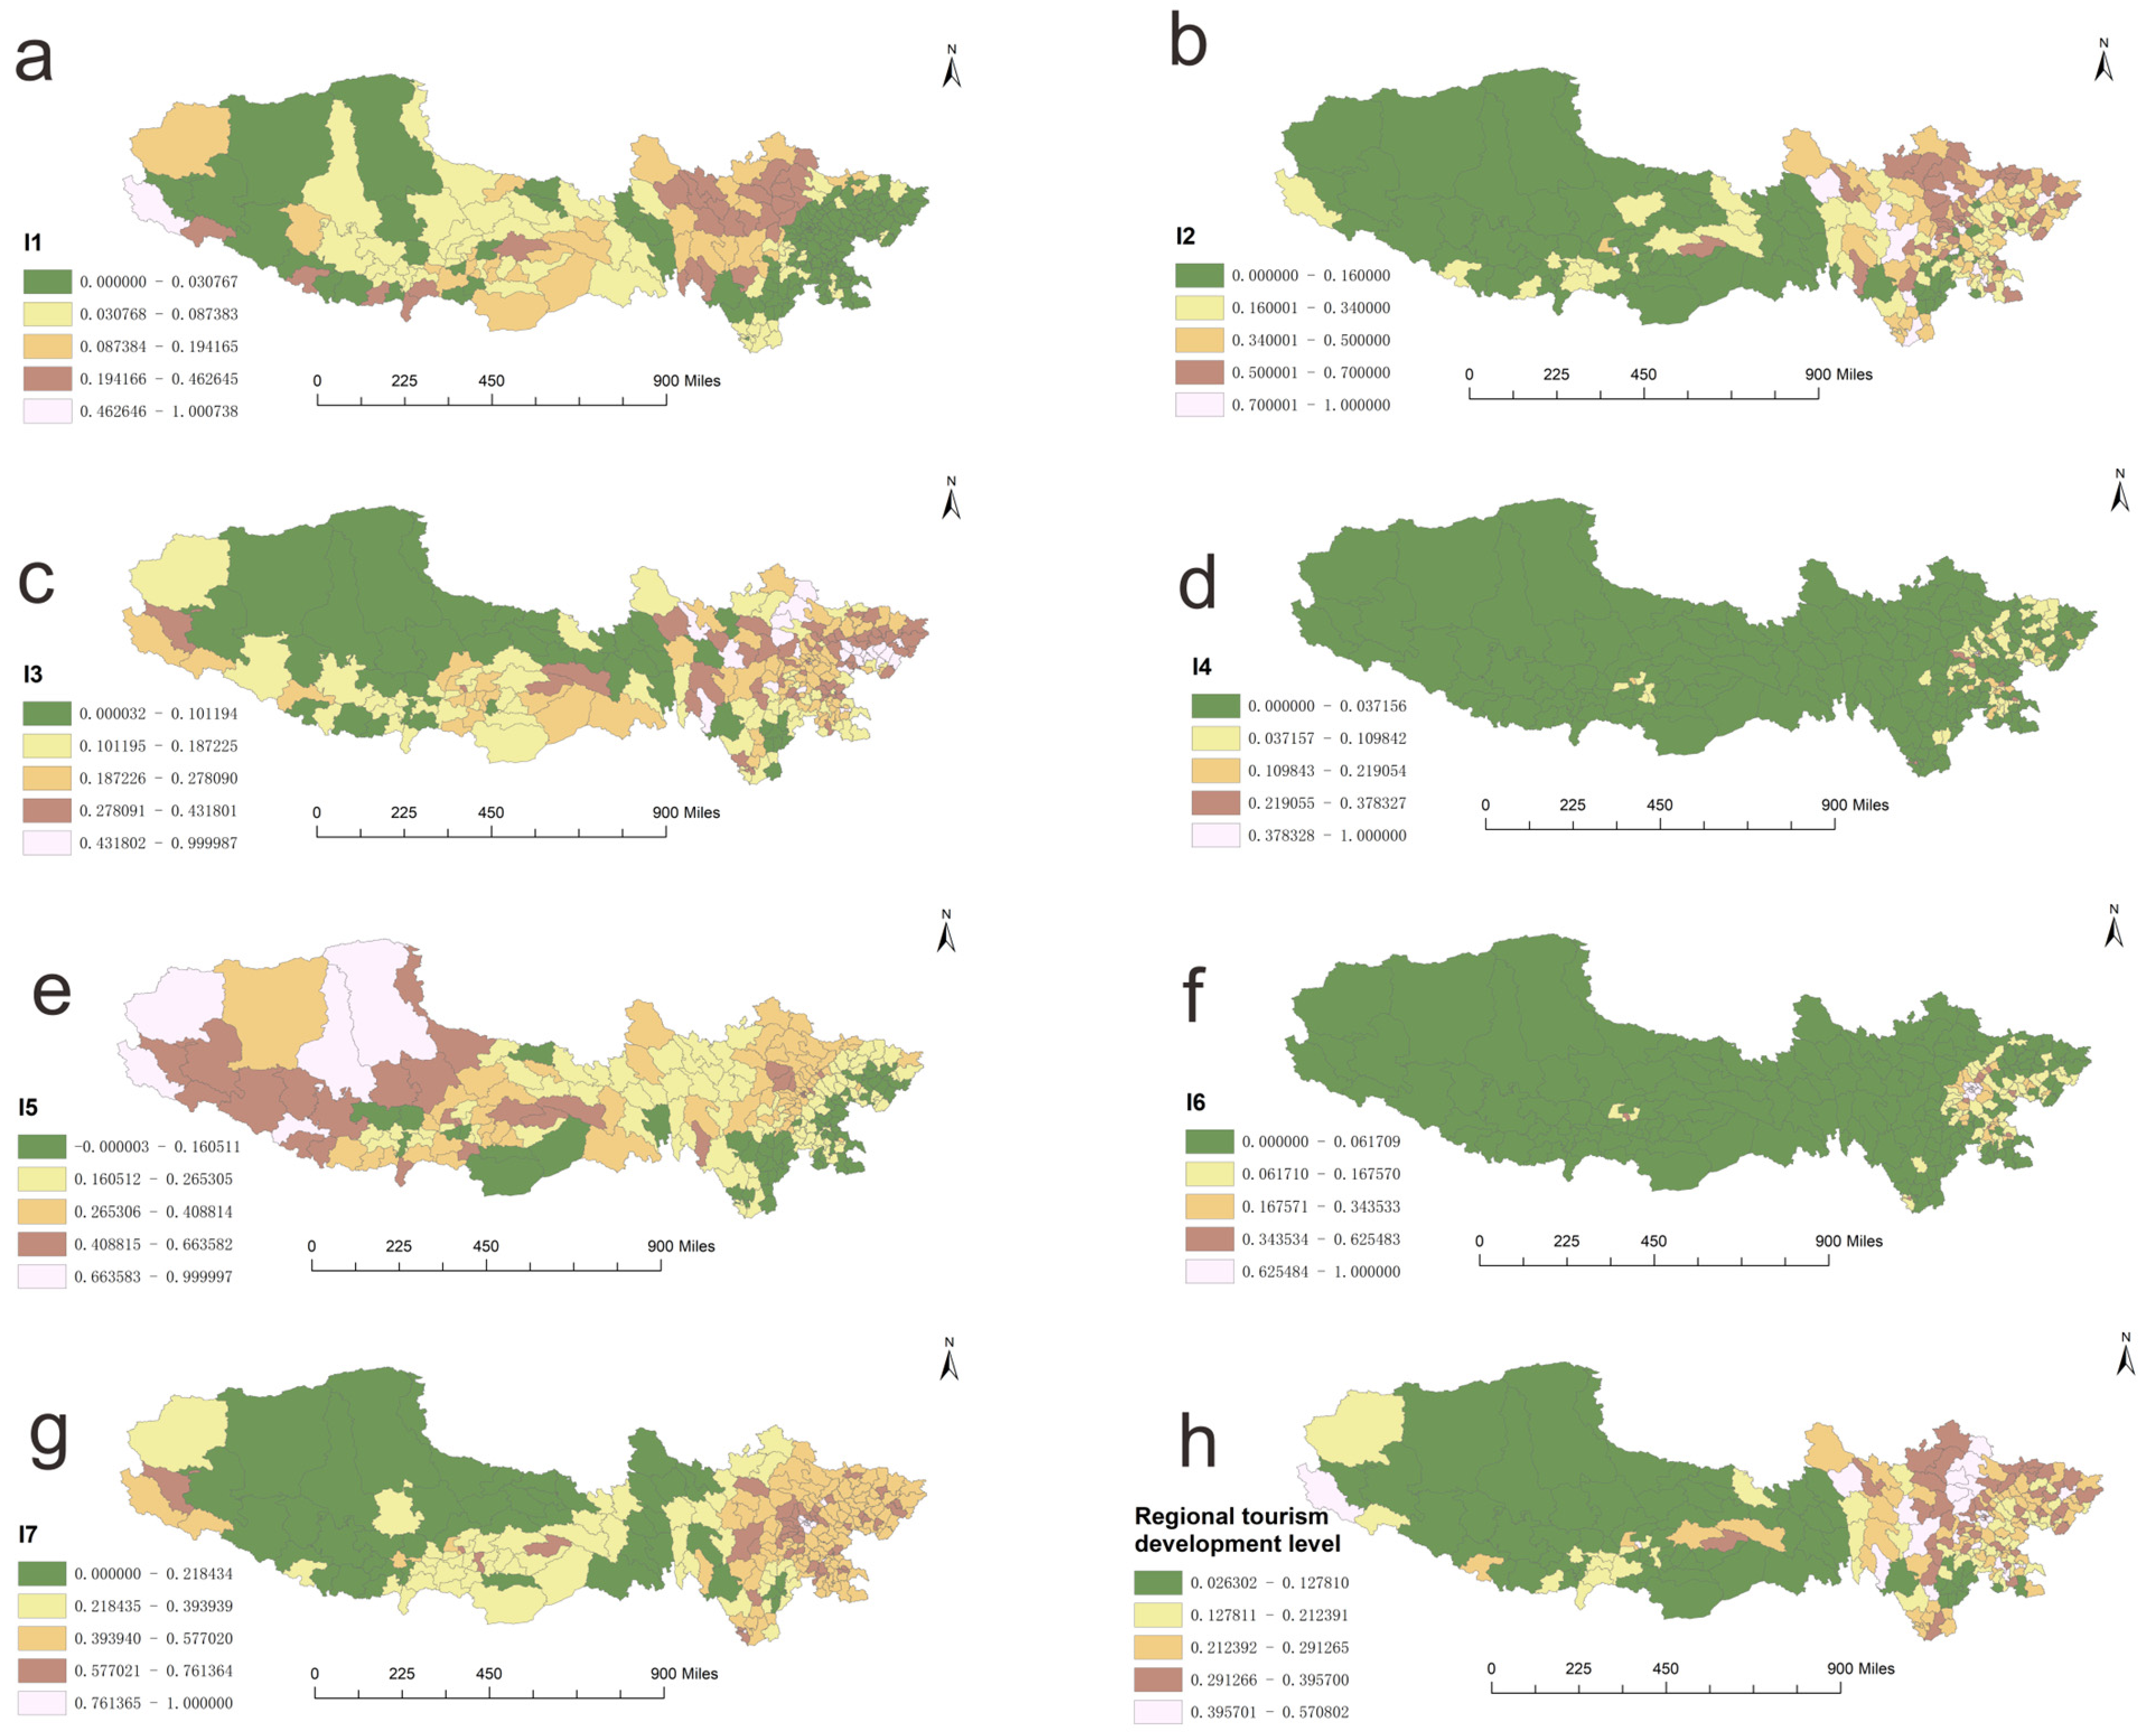
The Jenks natural breaks classification method was used to divide the comprehensive tourism development level into five categories. The normalized indicator values and regional tourism development level are shown in
Figure 4. Higher values of tourism resource indicators were mainly distributed in central and eastern Sichuan, while in Xizang they were concentrated in Lhasa and Nyingchi. Service-related indicators showed a similar but more concentrated pattern. POIs and accommodation and catering services were highly concentrated in Chengdu and its surrounding counties, whereas most counties in Xizang remained at low levels. Road network conditions were also uneven, with higher values mainly appearing in the municipal districts of prefecture-level cities in Sichuan, Chengguan District of Lhasa, and the urban area of Chengdu. Overall, the highest comprehensive development levels were concentrated in the municipal districts of Chengdu and their surrounding areas. The central urban areas of prefecture-level cities in Sichuan and Chengguan District of Lhasa also showed relatively high development levels, while most plateau and peripheral counties were classified as having moderate or low levels of tourism development.
3.2. Spatial Pattern of Tourism Network Potential Accessibility
Based on the improved gravity model described in
Section 2.3, the normalized tourism network potential accessibility
was calculated for each county. This value reflects the county’s total interaction potential with other counties in the region, integrating population, GDP, tourism development level, travel time, and administrative boundary effects.
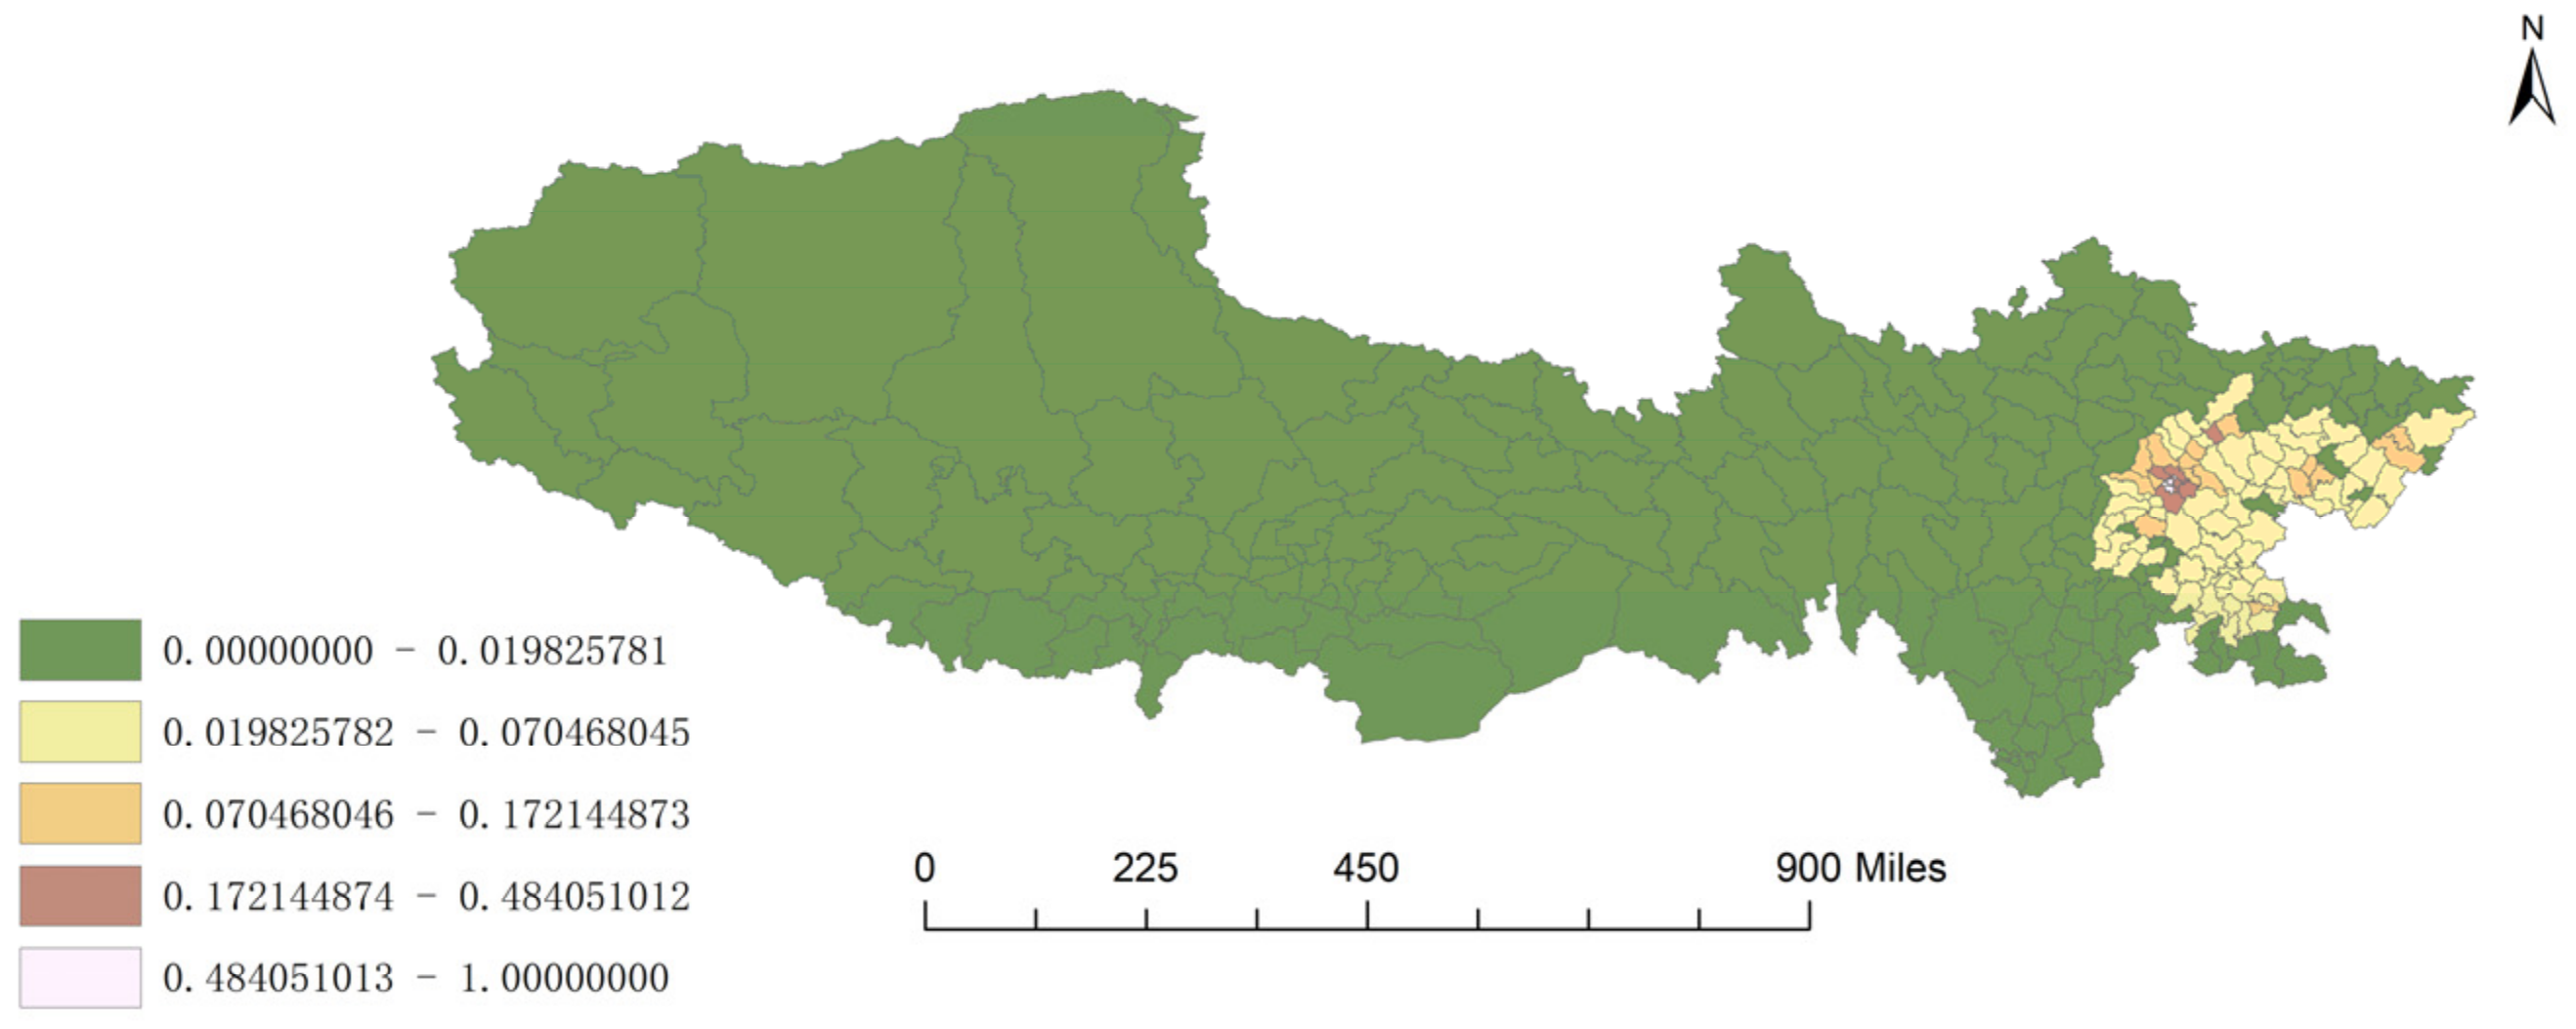
Figure 5 presents the spatial distribution of
.
The normalized TNPA values display a clear core–periphery structure, with a strong concentration of high values in Chengdu’s urban core and nearby counties. Among all counties, Jinniu District records the highest normalized TNPA value, reaching 1.000. It is followed by Qingyang District (0.870), Wuhou District (0.670), Chenghua District (0.482), Jinjiang District (0.337), and Shuangliu District (0.288). Other counties located in the Chengdu Plain, including Pidu District (0.278), Xindu District (0.218), and Longquanyi District (0.206), also present relatively high TNPA levels. Together, these areas form a continuous high-value cluster centered on Chengdu.
By comparison, most counties in the Xizang Autonomous Region show very low TNPA values. The provincial-level statistics further highlight this gap: the average TNPA value in Sichuan is 0.050565, while the corresponding value in Xizang is only 0.000154. This suggests that, under the baseline parameter setting, counties in Xizang have much weaker tourism network potential than those in Sichuan. Overall, the results indicate that Chengdu and its surrounding counties act as the main core of the regional tourism interaction network, whereas most plateau counties remain on the low-accessibility periphery.
The provincial statistics in
Table 3 indicate a pronounced difference between Sichuan and Xizang. The mean TNPA of Sichuan was 0.050565, whereas that of Xizang was only 0.000154. The population-weighted mean TNPA showed an even clearer contrast, with Sichuan reaching 0.112245 and Xizang only 0.000594. The whole-region median TNPA was 0.005128, much lower than the mean, indicating a strongly right-skewed distribution in which a small number of counties occupy a disproportionately high level of tourism network potential.
The ranking results in
Table 4 show that the ten counties with the highest TNPA values were all located in Sichuan, and most of them belonged to the Chengdu metropolitan area. This confirms the dominant role of Chengdu in the regional tourism interaction network. The high TNPA values of the surrounding counties in the Chengdu Plain suggest that the core area is not limited to the central districts, but extends outward through a contiguous network of urban and suburban counties. The weak TNPA values in most counties of Xizang indicate that high-quality tourism resources in plateau areas have not yet been effectively transformed into cross-county network potential.
The observed core–periphery pattern should be interpreted in relation to the model structure. Because TNPA incorporates population size, GDP, tourism development level, travel time, and boundary effects, counties located in the Chengdu metropolitan area naturally gain higher interaction potential. Therefore, the result does not simply indicate that Chengdu has more tourism resources; rather, it reflects the combined effects of market scale, economic capacity, service concentration, and lower travel-time impedance.
3.3. Association and Mismatch Between Tourism Development Foundations and TNPA
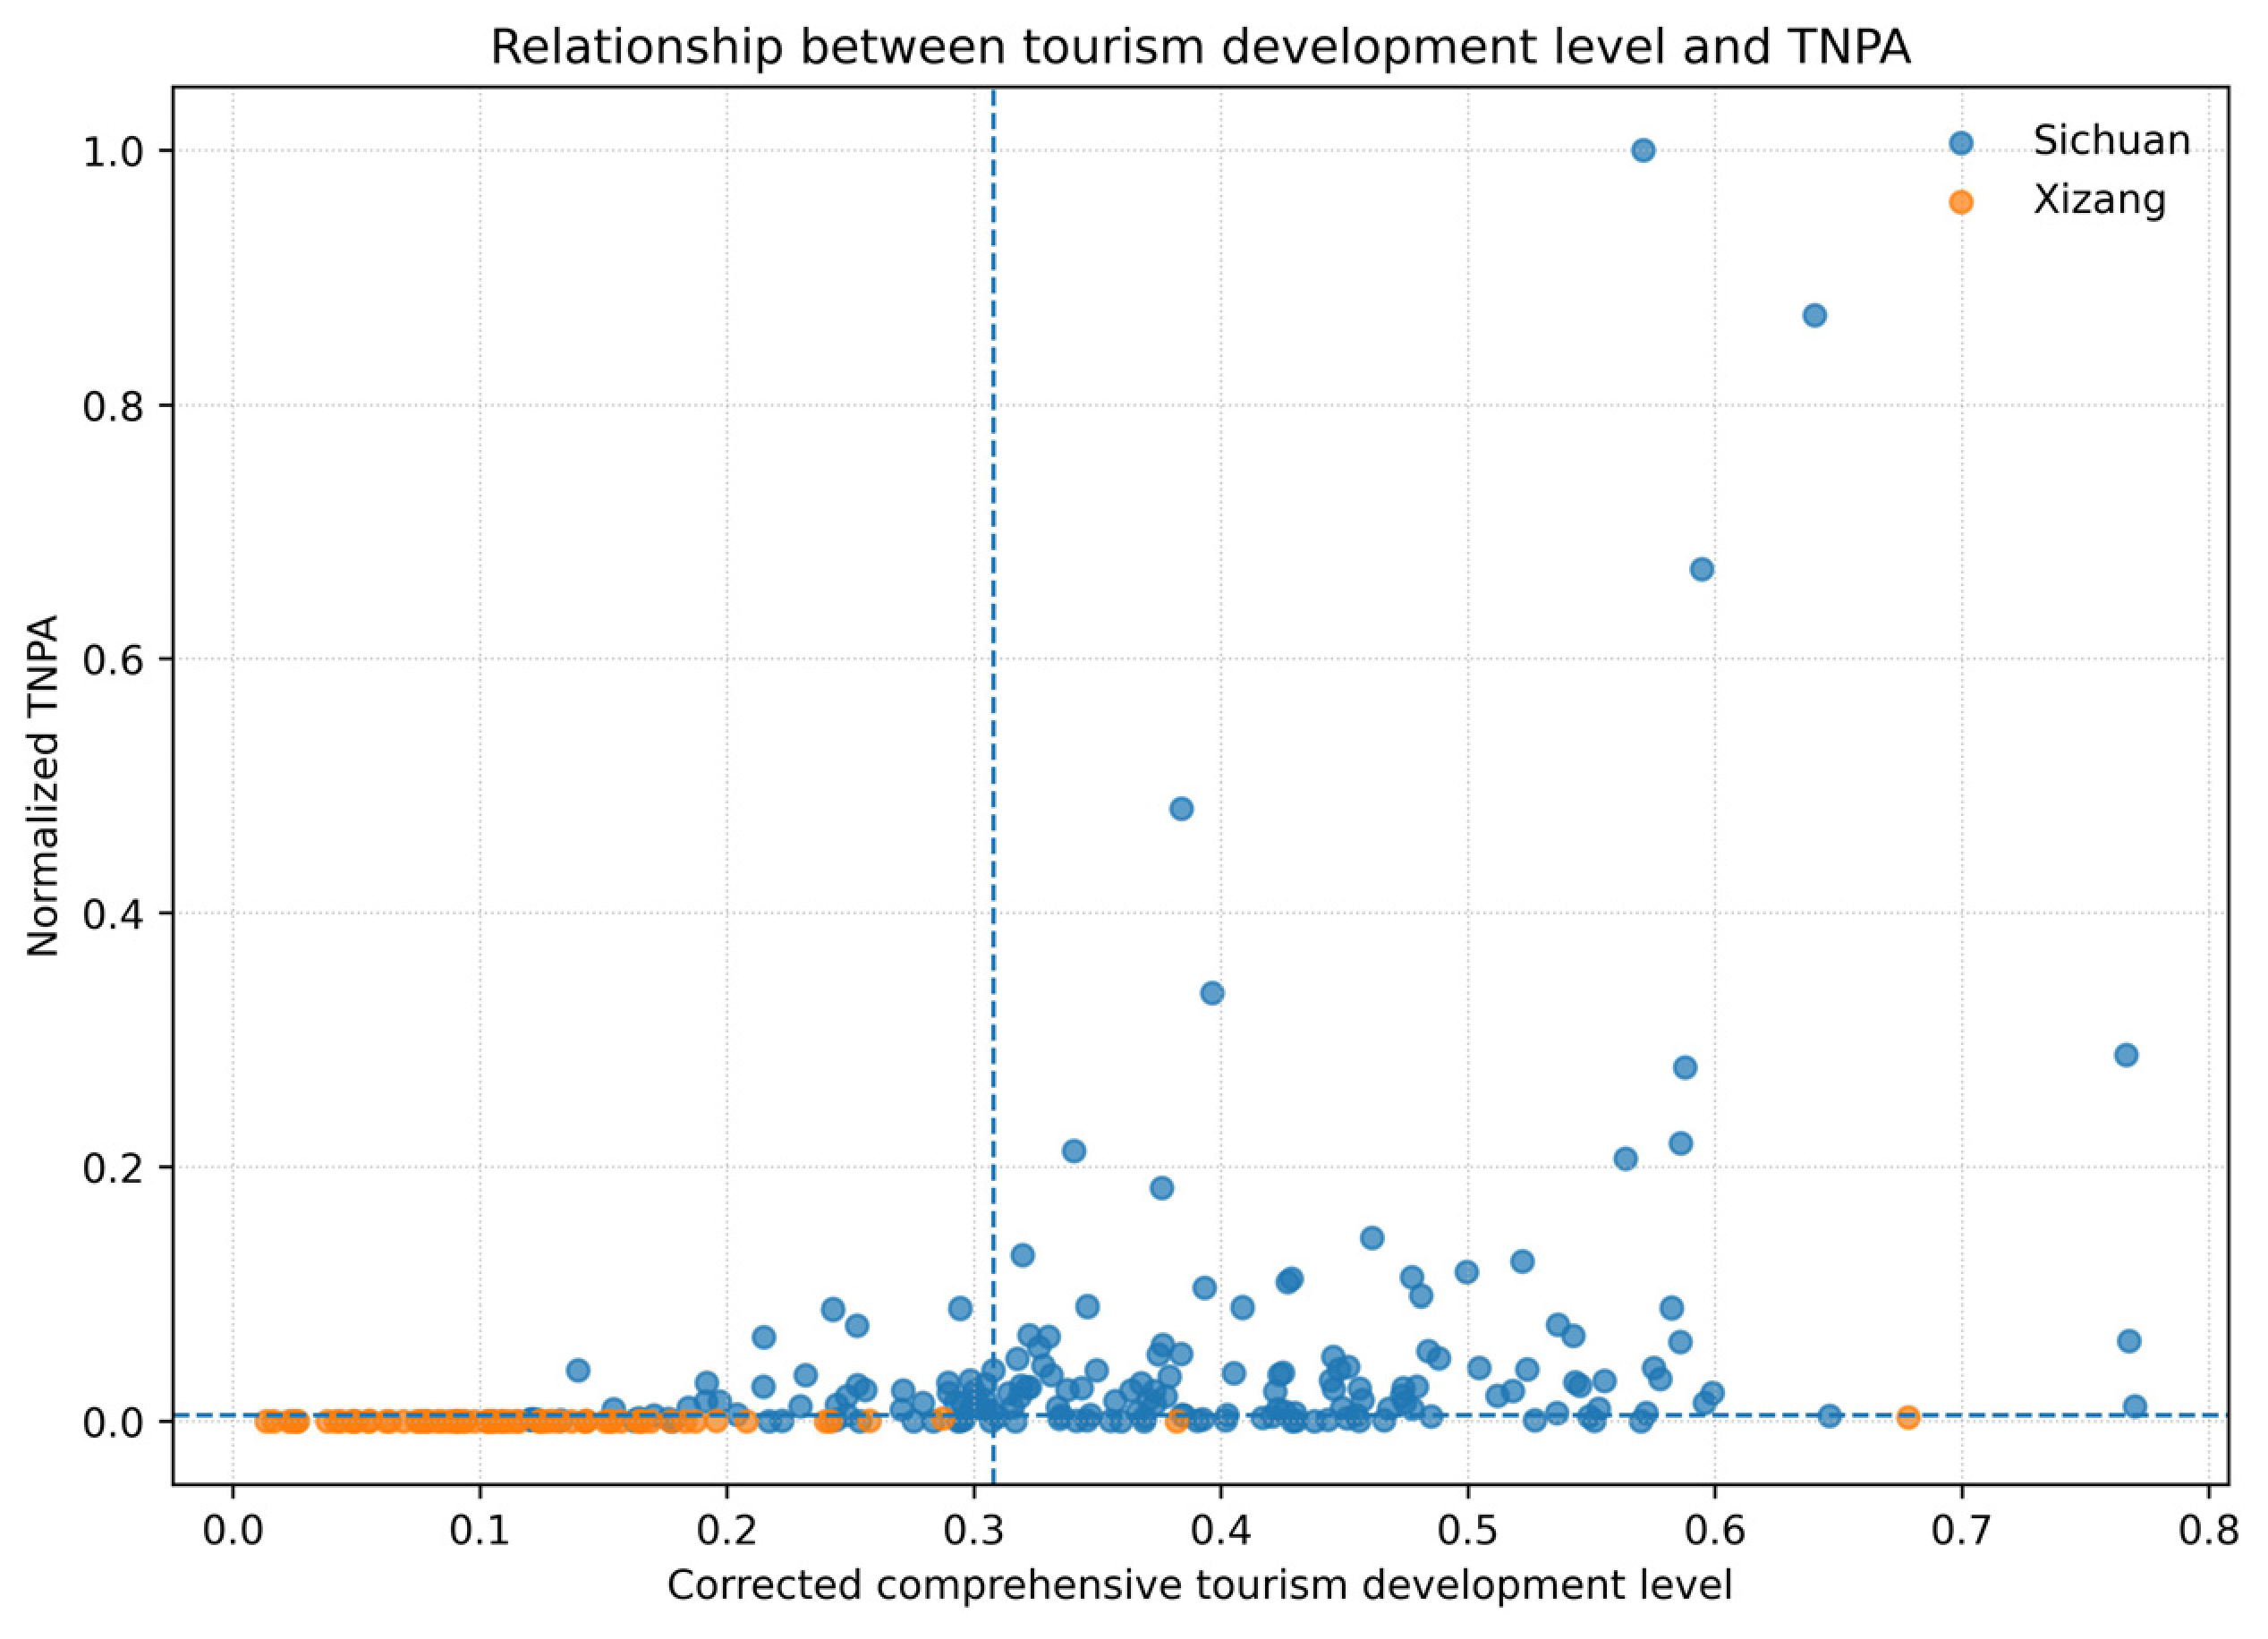
To further examine whether county-level tourism development foundations correspond to network-based accessibility, the comprehensive tourism development level was compared with normalized TNPA (
Figure 6). The scatter plot was divided by the median values of the two variables, which also provided the basis for the subsequent mismatch classification. At the whole-region level, the Pearson correlation between tourism development level and TNPA was 0.354, while the Spearman rank correlation was 0.691. The stronger rank correlation indicates that counties with stronger tourism development foundations generally tend to rank higher in network accessibility, but the magnitude of TNPA does not increase linearly with development level.
The provincial patterns were different. In Sichuan, the Pearson and Spearman correlations were 0.315 and 0.317, respectively, suggesting that development level and TNPA were only moderately aligned within the province. Some counties had relatively strong tourism foundations but remained outside the highest accessibility core, while other counties benefited from their network position around Chengdu despite having weaker tourism development foundations. In Xizang, the Pearson and Spearman correlations were 0.724 and 0.511, respectively. This positive association should be interpreted with caution, because most Xizang counties were compressed near the lower end of the TNPA axis. Differences in tourism development foundations within Xizang therefore do not necessarily translate into strong regional network potential. Long travel times, sparse network connections, and plateau terrain continue to constrain accessibility. Overall, resource and service advantages alone are insufficient to guarantee high TNPA; their effect depends on whether counties are effectively connected to the broader tourism interaction network.
3.4. Accessibility Equity Under Different Distance-Decay Parameters
In this study, accessibility equity refers to population-weighted distributive spatial equity, that is, whether tourism network potential is proportionally distributed among residents across county-level units. It does not directly measure individual-level social equity among different income, ethnic, or age groups. The TNPA results indicate a pronounced core-periphery structure in the tourism interaction network of the Xizang-Sichuan region. However, the spatial distribution of high- and low-value counties alone does not fully explain how tourism network opportunities are shared across the resident population. Therefore, this section further evaluates the population-weighted equity of TNPA using the Gini coefficient, coefficient of variation (CV), Theil index, Lorenz curves, and interregional differences between Sichuan and Xizang.
In this study, accessibility equity refers to population-weighted distributive spatial equity, that is, whether tourism network potential is proportionally distributed among residents across county-level units. It does not directly measure individual-level social equity among different income, ethnic, or age groups. As shown in
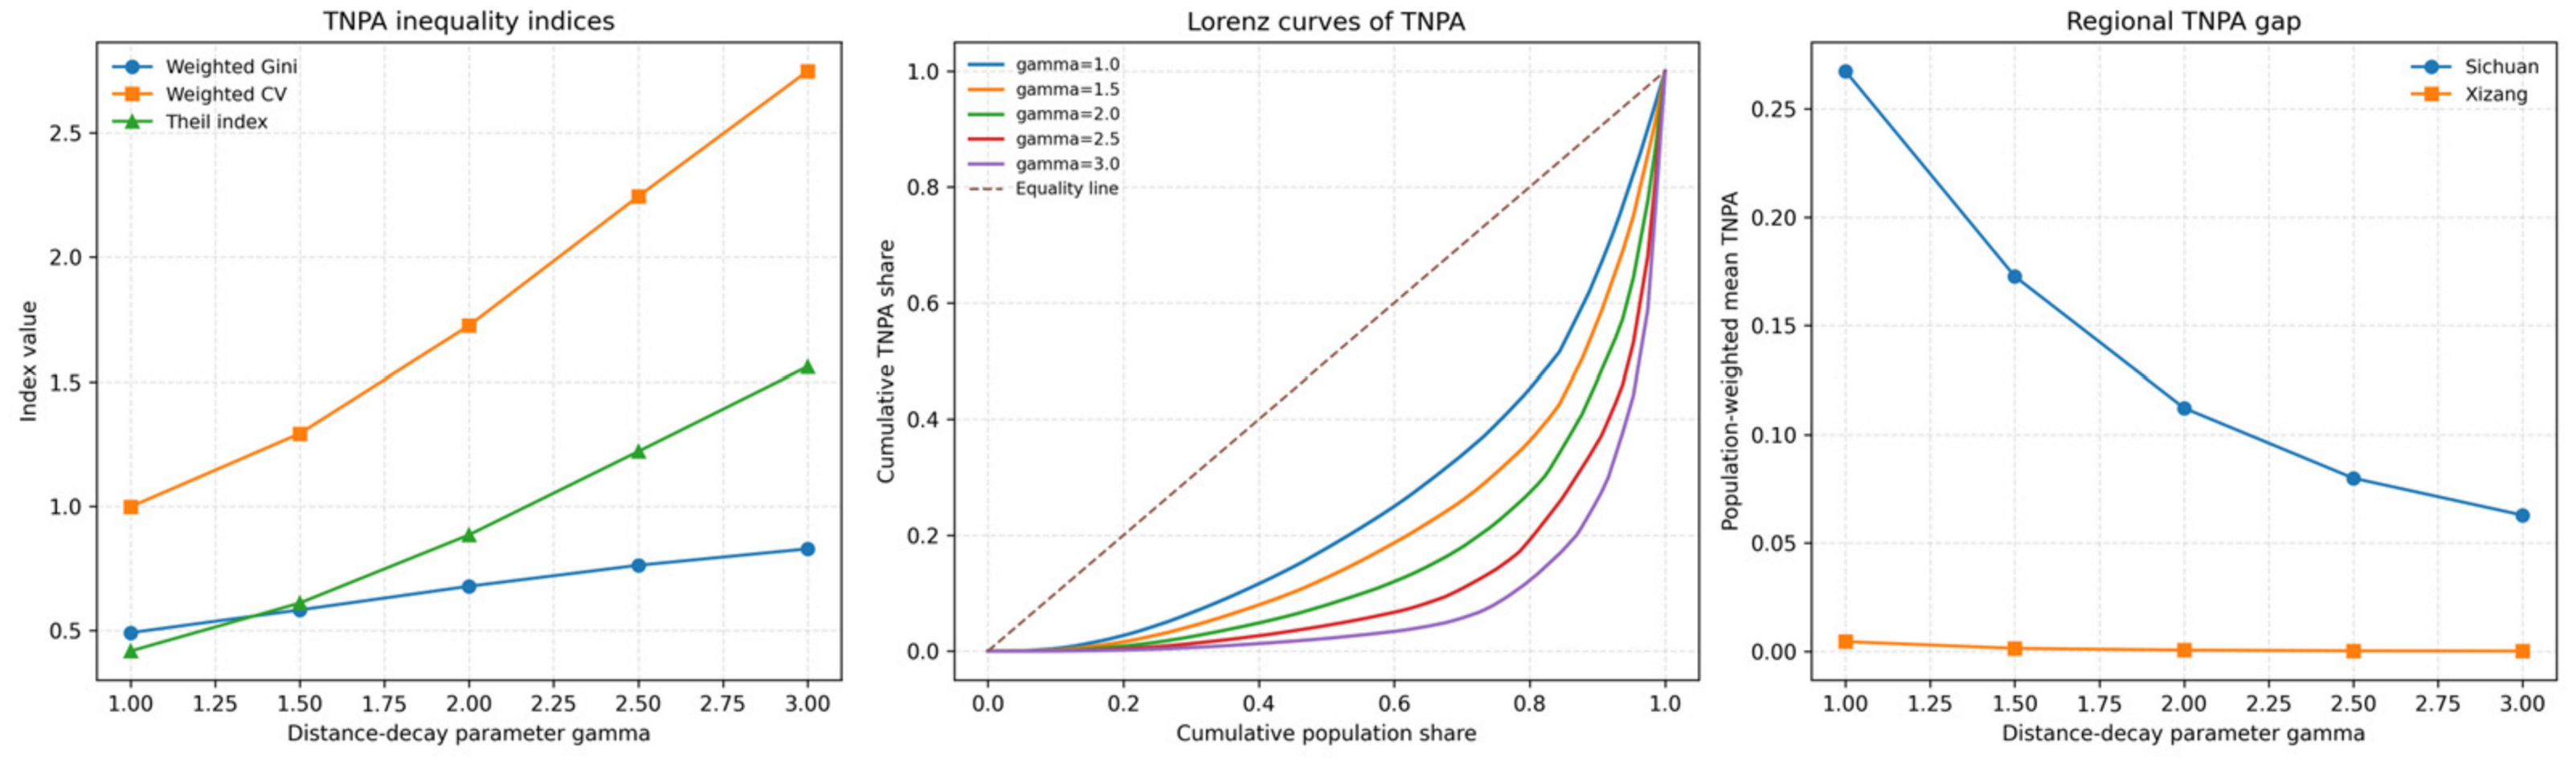
Figure 7, TNPA is unevenly distributed across the population, and the degree of inequality is sensitive to the distance-decay parameter. Under the baseline setting (
= 2.0 with the default boundary correction), the population-weighted Gini coefficient reaches 0.677, while the CV and Theil index are 1.724 and 0.884, respectively. These values indicate that tourism network potential is highly concentrated in a limited number of counties rather than being evenly shared across the study area.
When increases from 1.0 to 3.0, the inequality indicators show a consistent upward trend. This indicates that stronger distance decay further concentrates TNPA in core areas. In other words, when long-distance interaction is more strongly penalized, counties close to the main tourism and market centers gain a more pronounced advantage, while remote plateau counties become increasingly disadvantaged. The Lorenz curves also support this pattern. All curves lie below the line of perfect equality, and the curves bend further away from the equality line as increases. This result shows that the inequality captured by TNPA is not only a spatial contrast between Chengdu and peripheral counties, but also a population-weighted concentration of tourism network opportunities.
The Lorenz curves provide a more intuitive view of this distributional imbalance. All curves lie well below the line of perfect equality, confirming that TNPA opportunities are not proportionally distributed among the population. The baseline curve for = 2.0 already shows a large deviation from the equality line, while the curves for larger values bend further downward. This pattern indicates that a considerable share of the population is associated with counties that receive only a very small proportion of total tourism network potential. Therefore, the inequality captured by TNPA is not only a local spatial phenomenon around Chengdu and its surrounding counties; it is also reflected in the cumulative population distribution of tourism interaction opportunities across the whole region.
The regional comparison further reveals that the inequality in TNPA has a strong provincial dimension. Under the baseline parameter setting, the population-weighted mean TNPA of Sichuan is 0.112245, whereas that of Xizang is only 0.000594. The Sichuan/Xizang ratio is approximately 189.0. This large gap indicates that the peripheral position of Xizang is not simply a result of low local tourism development values, but is also closely related to long travel times, sparse intercounty connections, and weak integration into the broader regional tourism network. Therefore, improving tourism equity in the Xizang–Sichuan region requires more than recognizing the existence of high-quality tourism resources in plateau areas. It also depends on whether these resources can be connected to regional tourism flows through more efficient corridors, stronger node functions, and better cross-regional route organization.
3.5. Development-TNPA Mismatch Types
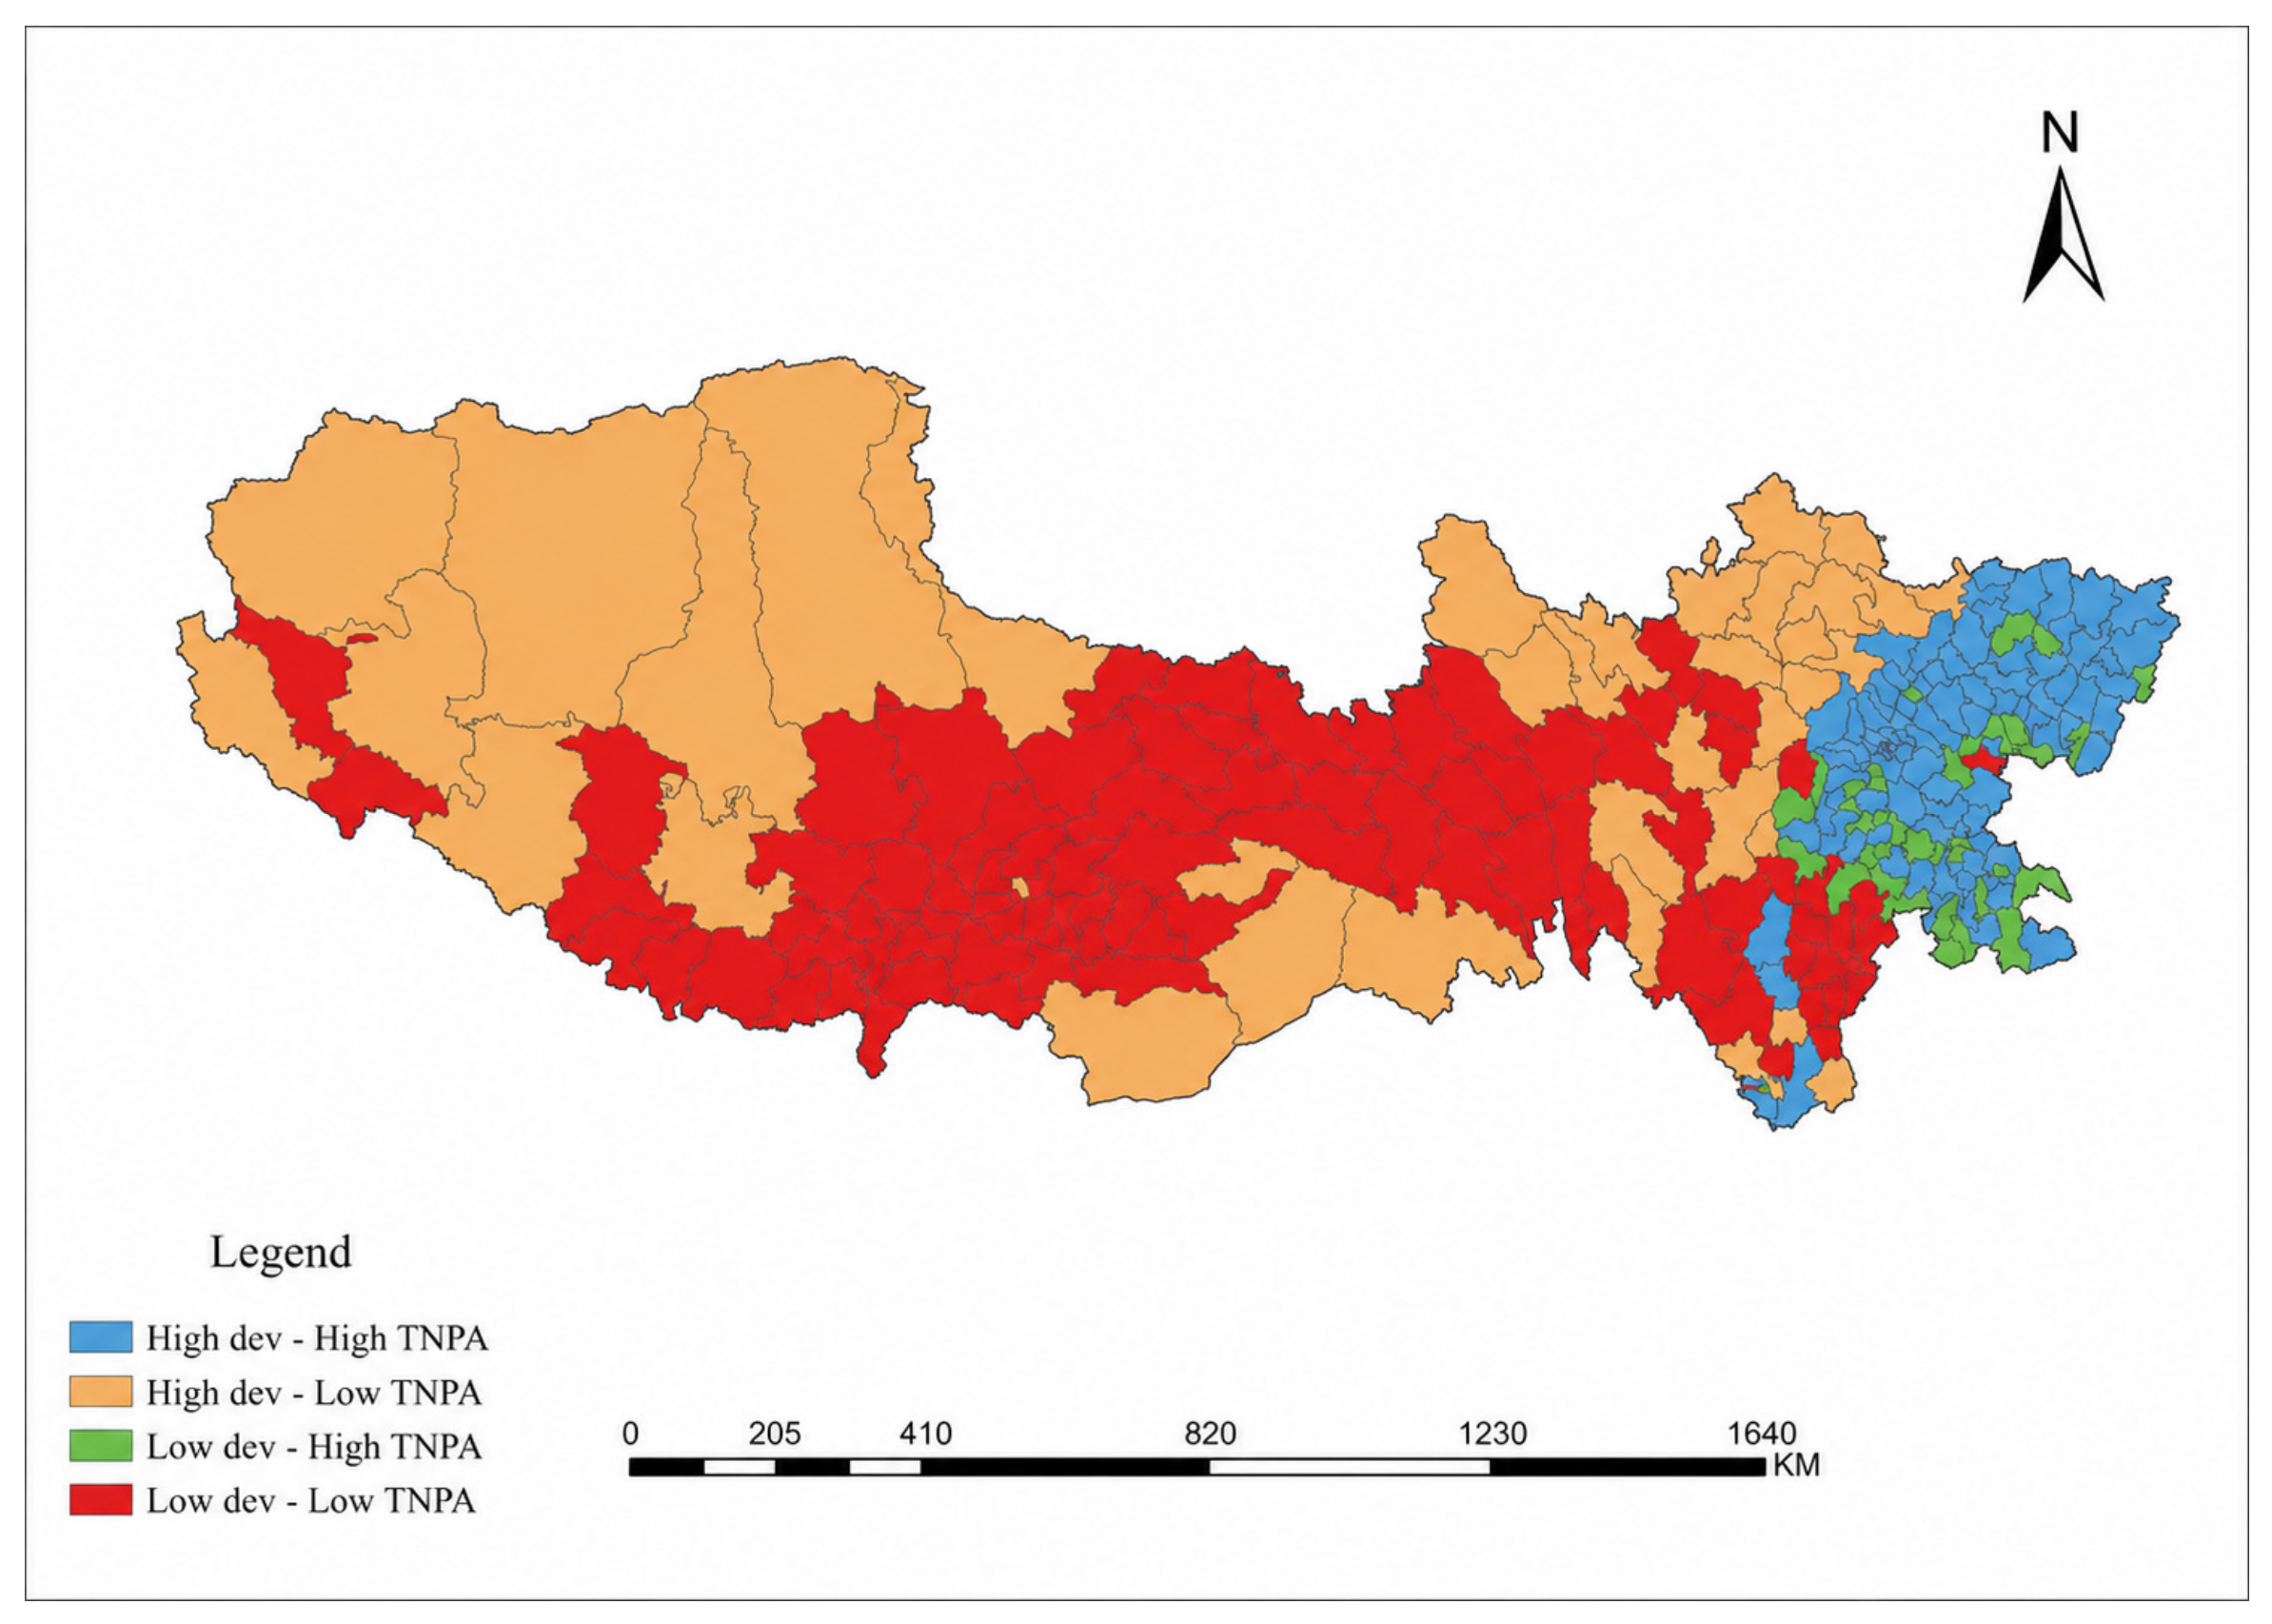
After identifying the distributional inequality of TNPA, it is necessary to examine whether counties with different tourism development foundations are matched with corresponding levels of network accessibility. For this purpose, the comprehensive tourism development level and baseline TNPA were normalized, and their median values were used as thresholds to classify all counties into four types: high development-high TNPA, high development-low TNPA, low development-high TNPA, and low development-low TNPA. The resulting spatial pattern is shown in
Figure 8, and the statistical results are summarized in
Table 5.
The median-based classification provides a clear first diagnosis of the relationship between tourism development and TNPA. However, given the highly uneven distribution of TNPA values, the median threshold should not be treated as an absolute boundary. Some counties close to the median may shift between categories if alternative thresholds are used. Therefore, before interpreting the high-development–low-TNPA group in policy terms, a robustness check was conducted to examine whether this mismatch type remains identifiable under stricter classification rules.
As shown in
Table 6, the high-development–low-TNPA group is not solely produced by the median split. Under the baseline classification, 33 counties are identified as having relatively high tourism development but low TNPA. When a stricter high-development threshold is applied, using the upper quartile of the corrected tourism development level, 14 counties remain in this mismatch group. Similarly, when the lower quartile of TNPA is used to identify counties with particularly weak network accessibility, 3 counties are still retained. These counties are all included in the baseline high-development–low-TNPA group.
This result suggests that the mismatch pattern has a stable core, although not every county in the baseline group should be interpreted with the same strength. Counties that remain under stricter thresholds can be regarded as more robust mismatch cases, whereas counties close to the median boundary should be treated as threshold-sensitive cases. Therefore, the following analysis focuses not only on the number of mismatch counties, but also on their specific locations and intervention priorities.
Figure 8 shows the spatial distribution of the four mismatch types, but the map alone cannot identify all county-level units within the most policy-relevant category. Since the high-development–low-TNPA type represents counties where tourism development foundations are relatively strong but network accessibility remains weak, it is necessary to list the specific counties included in this group.
Table 7 therefore reports the counties classified as high-development–low-TNPA under the baseline median-based classification.
Table 7 indicates that the high-development–low-TNPA counties are mainly concentrated in Aba and Garze in western Sichuan, with a small number located in Xizang and other parts of Sichuan. This result suggests that the mismatch is not simply a problem of weak tourism development. Many of these counties have relatively strong tourism development foundations, but their tourism network potential remains limited. In other words, their main constraint lies in weak integration into the wider tourism interaction network rather than in the complete absence of tourism resources or services.
The counties in Aba and Garze are particularly important because they are located in areas with distinctive plateau tourism resources but relatively high travel-time costs and weaker inter-destination connections. For these counties, the policy implication is not merely to increase the number of attractions or service facilities, but to improve corridor linkage, visitor transfer systems, route organization, and coordination with surrounding tourism nodes. At the same time, because many of these areas are ecologically and culturally sensitive, accessibility improvement should be combined with environmental protection and visitor-flow management.
Several counties close to the median threshold should be interpreted more cautiously. They are retained in the baseline high-development–low-TNPA group, but their classification may be more sensitive to the choice of threshold. Therefore, the strongest evidence for the mismatch pattern should be drawn from counties that also remain under stricter robustness checks, while the remaining counties can be treated as secondary or potential mismatch cases.
Taken together,
Table 5,
Figure 8, and
Table 7 show that the development–TNPA mismatch is not randomly distributed across the Xizang–Sichuan region. The high-development–high-TNPA type is entirely located in Sichuan and contains most of the region’s population, indicating that tourism development foundations and network accessibility reinforce each other mainly in the Chengdu-centered urban network and its surrounding counties. These areas benefit from a combination of resource quality, service capacity, market scale, and relatively low travel-time impedance.
The high-development–low-TNPA type is more policy-sensitive. Although these counties have relatively strong tourism development foundations, their normalized TNPA values remain low. As shown in
Table 7, this group is mainly concentrated in Aba and Garze in western Sichuan, with a small number of cases in Xizang and other parts of Sichuan. This pattern suggests that the key constraint in these counties is not simply a lack of tourism resources or service facilities, but weak integration into the wider intercounty tourism interaction network. For these areas, improving accessibility should therefore focus on corridor linkage, visitor transfer systems, route organization, and coordination with surrounding tourism nodes. In plateau and ecologically sensitive areas, such improvements should be combined with visitor-flow management and environmental protection rather than interpreted as a call for unrestricted infrastructure expansion.
The low-development–high-TNPA type is also located in Sichuan, mostly around or near the high-accessibility core. These counties benefit from favorable network positions, but their tourism development foundations are still relatively weak. Their main task is therefore different from that of the high-development–low-TNPA group. Instead of prioritizing large-scale transport construction, these counties need to improve tourism products, service quality, reception capacity, and the conversion of accessibility advantages into actual tourism development.
The low-development–low-TNPA type is mainly concentrated in Xizang and other peripheral plateau areas. These counties face the dual constraints of weak development foundations and limited network accessibility. For them, tourism development should proceed more cautiously. Basic service improvement, ecological carrying capacity, community participation, and gradual connection to regional tourism routes are more appropriate than rapid scenic-spot expansion.
Overall, the mismatch results show that tourism imbalance in the Xizang–Sichuan region cannot be explained by tourism resources alone. It reflects the combined effects of resource endowment, market scale, transport cost, service capacity, and intercounty network connection. The most important contribution of the mismatch analysis is therefore not simply to confirm the dominance of Chengdu, but to identify counties where tourism development foundations have not yet been effectively transformed into network accessibility. This finding provides a more targeted basis for corridor planning, tourism-node organization, and differentiated regional tourism policy.
4. Discussion
4.1. Main Findings of the Study
This study integrated the Analytic Hierarchy Process (AHP) and an improved gravity model for tourism network potential accessibility (TNPA) to evaluate county-level tourism development and network accessibility in the Xizang–Sichuan region. The results show that tourism resource endowment, especially scenic spot quality, dominates the evaluation system, contributing more than 60% of the total weight, which confirms the theoretical view that tourism resources are the core of destination competitiveness. Notably, the local weight of scenic spot rating is much higher than that of the number of scenic spots, indicating that tourism development in the region is shifting from scale expansion toward quality improvement, where resource quality has greater strategic significance than quantity. Within the tourism service capacity dimension, the weight of tourism employees is the highest, highlighting the central role of human capital. In the socioeconomic support dimension, the weight of nighttime light intensity is substantially higher than that of average years of education, suggesting that economic development provides more direct support for tourism growth.
The TNPA results reveal that Chengdu and its surrounding counties occupy the highest positions in the regional tourism interaction network, whereas most counties in Xizang have extremely low TNPA values, indicating that their tourism resources and development foundations have not been effectively translated into network potential. This pattern supports the core–periphery structure: Chengdu acts as a regional growth pole radiating to surrounding areas, but this radiation hardly crosses the western Sichuan Plateau into the hinterland of Xizang, and the high travel cost along National Highway 318 leads to a significant accessibility gap between Sichuan and Xizang [
38]. The study further reveals that high-quality resource areas such as Aba Prefecture exhibit low accessibility due to their distance from major transport hubs, whereas some counties around Chengdu with fewer tourism resources obtain higher accessibility scores. This suggests that spatial accessibility is a key mediating factor linking resources and markets, and that high-quality tourism resources require convenient transport conditions to be effectively transformed into practical advantages [
44]. We compared our findings with those from adjacent study regions. In Guizhou Province, China, the highest accessibility is found in the provincial capital Guiyang, exhibiting a core–periphery diffusion pattern [
51,
52]. In Yunnan Province, the upgrading of transportation modes has led to reduced travel time on transport facilities, resulting in improved accessibility that promotes the growth of the tourism industry and ultimately enhances tourist satisfaction [
53].Three unique features of the Xizang–Sichuan plateau explain the extreme TNPA inequality observed here. First, the “absolute travel time barrier”—driving from Chengdu to Lhasa takes a minimum of 38 h under ideal conditions, making cross-regional interaction highly dependent on multi-day itineraries that few counties can anchor. Second, the “low-density network effect”—with only 74 counties over 1.2 million km
2 in Xizang, the average inter-county distance is 4.8 times that of Sichuan. Our gravity model’s boundary correction (β = 0.8 for cross-province pairs) actually underestimates the real impedance, because administrative borders in the plateau often coincide with 5000-m mountain passes that close for 4–6 months annually—a seasonal factor not captured by static travel time data. Third, the “dual peripheralization” of population and economy—Xizang contains only 4.2% of the region’s population but 65% of its land area. Consequently, even if a Xizang county has high-quality resources (e.g., the Potala Palace in Chengguan District, corrected tourism development level = 0.678, above the Sichuan median), its TNPA remains negligible because the gravity model’s mass term (population × GDP) for surrounding counties is near-zero. This triple uniqueness—absolute distance, network sparsity, and demographic–economic hollowing—distinguishes the Xizang–Sichuan region from other southwestern provinces where accessibility studies typically deal with more evenly distributed settlement and shorter absolute distances.
The TNPA-based equity analysis shows that tourism network potential is highly concentrated in the Xizang–Sichuan region. Inequality is evident both in the Chengdu-periphery spatial contrast and in population-weighted distribution. As the distance-decay parameter increases, TNPA becomes more concentrated, amplifying the disadvantage of remote counties. Improving equity thus requires stronger network connections, lower travel-time costs, and better integration of plateau nodes. More importantly, the mismatch analysis identifies high-development–low-TNPA counties (e.g., Aba and Garze) where tourism foundations are strong but network integration is weak. Their priority is not adding attractions or facilities, but improving corridor linkage, visitor transfer, route organization, and coordination with surrounding nodes. This avoids a one-size-fits-all interpretation of accessibility inequality.
4.2. Main Strategies for Coordinated Tourism Development in the Sichuan-Xizang Region
Based on the above discussion, this study offers several suggestions for promoting coordinated tourism development in the Xizang–Sichuan region. Priority should be given to improving transport accessibility along key corridors (e.g., Lhasa–Nyingchi, Lhasa–Shigatse, Qamdo–Nyingchi) and establishing cross-regional cooperation mechanisms such as transport subsidies, partial ticket waivers, and coordinated route design. For areas with high development but low tourism network potential (TNPA), efforts should focus on distribution centers, shuttle systems, and cross-regional route organization; for low development–low TNPA areas, gradual support based on ecological capacity and community participation is recommended, avoiding large-scale blind development. Crucially, our Theil index decomposition shows that 76% of total inequality stems from inter-provincial differences (Sichuan vs. Xizang) rather than intra-provincial variation, implying that provincial-level road upgrades alone are insufficient. Instead, inter-provincial corridor investments (e.g., Chengdu–Nyingchi–Lhasa route optimization) and cross-border tourism product design are more efficient strategies to reduce the 189-fold gap in population-weighted mean TNPA between the two regions.
4.3. Connections to Sustainable Tourism Development
The findings of this study have direct implications for sustainable tourism development in the Xizang–Sichuan region. From an environmental sustainability perspective, the pronounced core–periphery pattern and the extreme concentration of tourism network potential in the Chengdu area imply that unmanaged tourism growth in the core may lead to overcrowding, ecological stress, and resource degradation, while peripheral high-quality scenic spots in Xizang and western Sichuan remain underutilized. This mismatch risks both environmental overload in accessible cores and resource idling in remote areas, contradicting the principle of balanced resource use. From a social sustainability viewpoint, the high population-weighted inequality (Gini coefficient = 0.677, Theil index = 0.884) indicates that a large proportion of residents, especially those in Xizang and other peripheral counties, have very limited access to tourism-related opportunities. Improving network accessibility for these populations through targeted corridor investments and visitor-transfer systems can enhance social inclusion and distribute the benefits of tourism more equitably. Economically, the identification of high-development–low-TNPA counties (e.g., Aba and Garze) shows that tourism development foundations alone do not guarantee regional economic integration. Strengthening inter-county network connections, reducing travel-time costs, and fostering cross-provincial cooperation can help transform local tourism assets into sustainable regional income streams, thereby reducing the “rich-get-richer” dynamic that currently characterizes the region. Therefore, future policies should move beyond resource-centric planning and adopt a network-oriented, equity-aware approach that aligns with the United Nations Sustainable Development Goals (notably SDG 10 on reduced inequalities and SDG 11 on sustainable cities and communities.



 ,
,