Article

Circularity Assessment of GeoBarrier System as Sustainable Retaining Wall

1
Department of Civil and Environmental Engineering, School of Engineering and Digital Sciences, Nazarbayev University, 53 Kabanbay Batyr Ave, Astana 010000, Kazakhstan
2
The Environment and Resource Efficiency Cluster (EREC), Nazarbayev University, Astana 010000, Kazakhstan
3
Department of Civil Engineering, Parahyangan Catholic University, Bandung 40141, Indonesia
*
Authors to whom correspondence should be addressed.
Sustainability 2026, 18(13), 6771; https://doi.org/10.3390/su18136771
Submission received: 28 May 2026 / Revised: 23 June 2026 / Accepted: 23 June 2026 / Published: 3 July 2026

Abstract

The growth of circular economy concepts has resulted in the need to develop methods for assessing circularity in geotechnical infrastructure systems. This paper proposes, for the first time, an initial framework for assessing circularity of geotechnical infrastructure systems and then uses it to assess the GeoBarrier System (GBS) as a case study. The framework considers five domains: water, energy, material, waste, and site quality. It was formulated based on a literature review, stakeholder requirements, and the case-specific characteristics of the GBS. Laboratory characterisation and numerical analyses were performed to assess the engineering performance of the system and support the circularity assessment. The results show that water circularity was the highest at 50.0%, meaning that half of the water in the system was effectively reused or recirculated. In contrast, energy circularity was absent due to the lack of renewable energy integration. Material and waste circularity performed at a moderate level, lower than water circularity, reflecting partial use of recycled materials and reuse of excavated soil. The site quality evaluation resulted in a score of 2.250, which, together with the other indicators, suggests an intermediate overall level of circularity performance. The assessment identified opportunities to improve circularity through greater on-site reuse of excavated waste, renewable energy integration, and improved site planning. The proposed framework is the first circularity/sustainability system specific to geotechnical infrastructure systems; therefore, apart from GBS, it is intended for potential applicability for evaluating circularity in other geotechnical systems.

1. Introduction

The circular economy (CE) is an alternative economic model to the conventional linear model of ‘take, make, dispose’, which primarily aims to reduce waste by regenerating and continuing to use resources throughout their life cycle [1,2,3]. The CE model was first proposed by Pearce and Turner [4] in response to the environmental degradation caused by industrial development following the Second Industrial Revolution. Subsequently, the CE model has been used in a variety of sectors. The construction sector has received special attention because of its significant contribution to waste generation and emissions, as well as its high resource demand [5,6]. For example, in the European Union, construction activities account for around 30% of total water consumption, 40% of energy usage, 50% of extracted raw materials, and about 35% of greenhouse gas emissions and total waste production [6,7].
Presently, the construction industry is increasingly implementing CE principles, whereas its implementation in geotechnical engineering seems insufficient. This is particularly valid for slope protection techniques like capillary barrier systems (CBSs) and mechanically stabilised earth walls. The long-term changes to soil properties and subsurface behaviour can impact ecosystem function and climate regulation [8]. Hence, it is important to point out that geotechnical engineering has a crucial role in settling the relationship between built infrastructure and natural ground conditions. Reducing the use of natural materials, reusing in situ soils and recycling construction waste are those measures that align well with geotechnical practice in theory. Nevertheless, only a few studies [9,10] have explored how circularity can be systematically assessed for subsurface structures.
Recent studies [11,12,13] have highlighted several techniques that could make geotechnical engineering more circular. Researchers mention in their studies the significance of integrating Life Cycle Assessment, reusing construction waste, using low-impact ground improvement methods and incorporating recycled materials into geostructures. In practice, they are typically implemented in isolation and seldom accompanied by standardised assessment frameworks.
For retaining wall systems that incorporate recycled or alternative materials, to the authors’ knowledge, there are no comprehensive studies from a circular economy perspective. Accordingly, comparing their performance with that of conventional designs cannot yet be completed.
The present study aims to fill these research gaps by presenting a case study of a GeoBarrier System’s (GBS) circular economy assessment. GBS is a type of retaining wall that combines vegetation and a capillary barrier mechanism, intending to reduce the amount of steel and concrete used [14]. Additionally, by using recycled fine and coarse materials as capillary barrier materials in two layers, it integrates the concepts of the circular economy. GBS could be a cost-effective and sustainable substitute for conventional retaining systems. The system could be appropriate for both urban and rural applications as, in addition to improving structural performance, it also improves visual aesthetics and greenery [14].
Those being said, it is important to note that GBS may be difficult to integrate with widely used instruments for evaluating circularity and sustainability. For example, LEED and BREEAM are two common examples of tools designed specifically for above-ground infrastructure. However, the level of detail needed to assess subsurface structures is absent from these tools [8,15].
Other tools such as Circulytics are more business-orientated and concentrate on organisational performance as opposed to design at the project level [16]. Even though Life Cycle Assessment (LCA) is a comprehensive and versatile tool, it lacks specific standardised methods for assessing the effects of land use and soil [8,17]. The Environmental Geotechnics Indicator (EGI) is largely confined to applications involving contaminated land. Finally, while the Geo-Sustainability Assessment Tool (Geo-SAT) [15] is geotechnics-specific, it requires extensive data inputs and does not explicitly quantify circularity.
More recent CE frameworks developed for the construction sector propose integrated assessments of material, water, energy and waste flows [1,2,7]. However, these frameworks remain largely conceptual and have rarely been adapted for use with geotechnical structures, particularly those with distinct material behaviour and performance requirements, such as GBSs [18,19].
Overall, a review of present approaches highlights two main limitations: First, most frameworks are adapted from sustainability metrics developed for superstructures. Second, there is no standardised quantitative method designed specifically to assess circularity in geotechnical systems. Consequently, the present study aims to apply and adapt a CE evaluation framework to GBS as a circularity-oriented geotechnical design case study.
The methodology involves selecting and modifying the framework to reflect geotechnical conditions, calculating circularity indicators. In addition to demonstrating a modified CE assessment methodology for geotechnical infrastructure, the current study aims to assess the circularity potential of GBS as a sustainable retaining wall solution via conducting a detailed case study, adapting the framework, calculating the relevant indicators, and discussing the applicability of the proposed method to broader geotechnical design practice.

2. GeoBarrier System (GBS): Characteristics and Performance

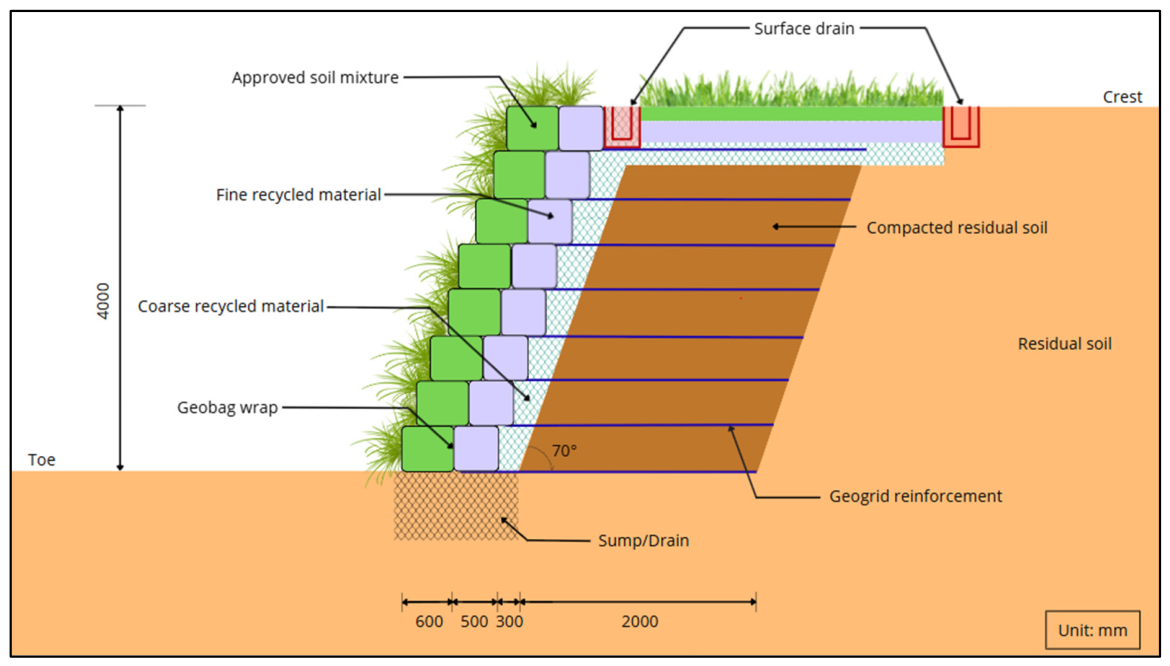
Field studies conducted by Rahardjo et al. [20] demonstrated that the CBS effectively minimises the amount of infiltrated rainwater and improves slope stability for inclinations of up to about 45 degrees [21]. However, if steeper slopes are under consideration, then it is necessary to suggest a retaining wall to ensure stability Therefore, the GBS proposed by Rahardjo et al. [22] was introduced as an effective option for retention [23]. As illustrated in Figure 1, the GBS is composed of three main components: the CBS, the reinforced soil system (RSS), and an approved soil mixture (ASM).
Several criteria are to be considered when designing the CBS. Rahardjo et al. [22] suggested the following critical parameters: (1) the water-entry value (WEV) of the coarse-grained material should ideally be less than 1 kPa; (2) the ratio of the water-entry values of the fine-grained to coarse-grained materials (the w-ratio) should be more than 10; and (3) the saturated hydraulic conductivity of the non-cohesive fine-grained soil should preferably be greater than 10−5 m/s.
The inclusion of the ASM is necessary to ensure proper plant development. In the GBS, the retaining structure employs geosynthetics in the form of geobags that are filled with the ASM, and fine-grained material and geogrid reinforcements are attached to the geobags to form reinforced retaining walls [24]. Research by Rahardjo et al. [23] showed that the placement of geobags between the fine- and coarse-grained layers did not disrupt the functionality of the CBS. To support vegetation growth, including species with deep and widespread roots, ASM is placed in bags and positioned at the front of the structure in direct contact with the fine-grained layer [21]. The ASM bags are attached to the geogrid to provide additional structural reinforcement. In this configuration, the ASM bags fulfil two functions: they act as a growth medium for plants and as the facing element of the retaining wall [21].
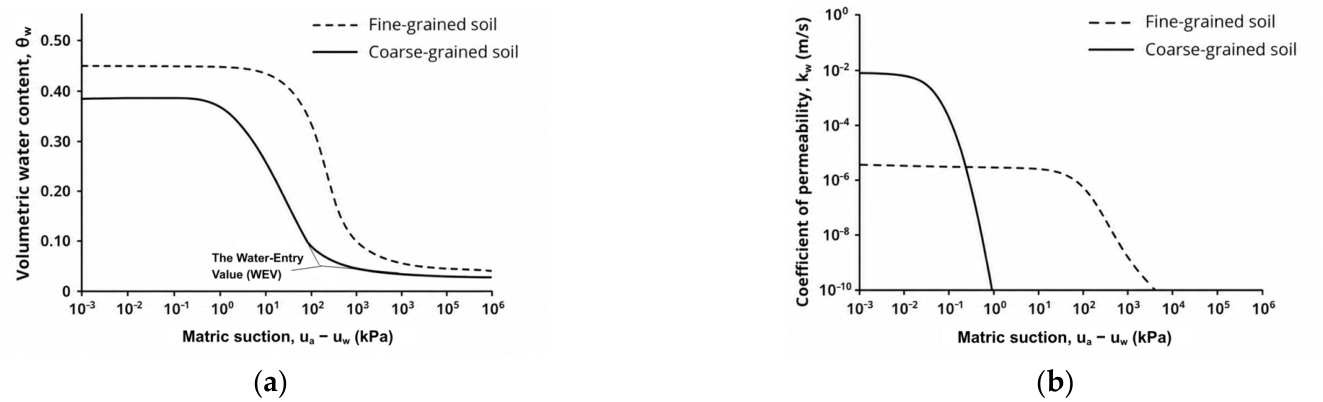
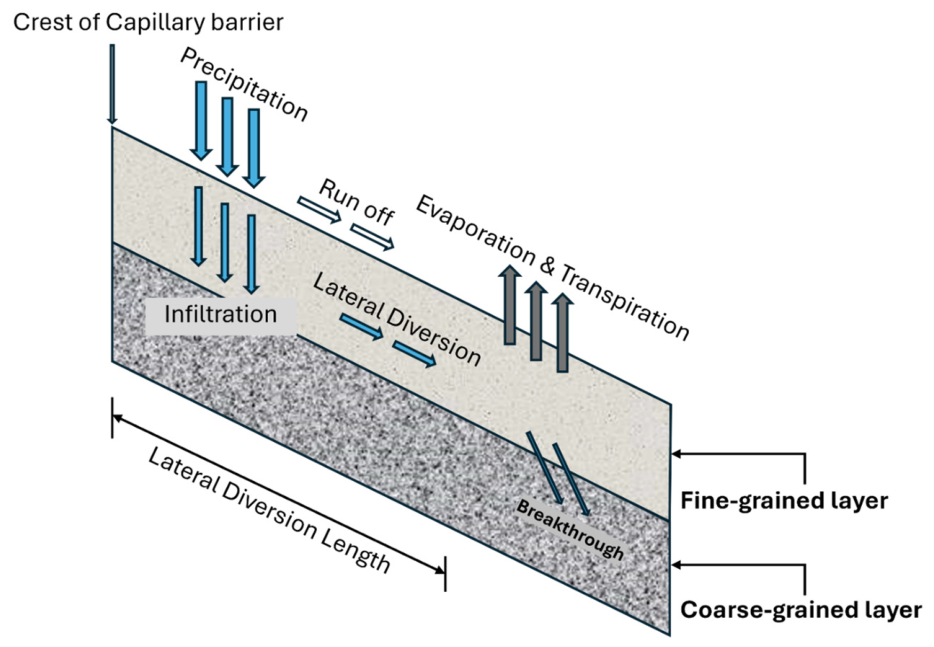
The GBS operates effectively in unsaturated soil. Its performance relies on the distinct hydraulic properties of its materials, particularly the soil–water characteristic curve (SWCC) and unsaturated hydraulic conductivity, which can be seen in Figure 2. The capillary barrier mechanism limits downward water movement by taking advantage of the sharp contrast in permeability between the fine- and coarse-grained layers [22]. In the high matric suction range, the coarse-grained material has much lower hydraulic conductivity than the fine-grained layer, which restricts water infiltration into the coarse layer [22]. Water that accumulates in the fine-grained layer is held by capillary forces and gradually released either through percolation to a drain at the slope toe, lateral drainage paths, or evapotranspiration [22]. As illustrated in Figure 3, the CBS functions to impede water infiltration into the slope until it reaches the coarse-grained layer and the breakthrough occurs, which implies that the system is no longer effective [22].
According to the findings by Rahardjo et al. [25], field measurements and numerical simulations both showed that suction in the GBS-covered slope during rainfall was fairly constant, in contrast to a dramatic reduction in the original, uncovered slope for the same period. These findings provide concrete proof that GBS is a dependable retention system that lowers rainfall infiltration into the soil layers beneath it. Researchers examined the effectiveness of GBS on a residual soil slope in Singapore in a study by Rahardjo et al. [25]. On a 4 m high slope with a 70-degree incline, the eight-layer geobag system was set up. A 2.8 m long geogrid was used to reinforce each layer in order to give it structural support. Subsequently, the study discovered that the GBS successfully preserved a slope’s stability by preventing precipitation from penetrating the subsurface soil layers [25].

3. Circular Economy (CE) Assessment Frameworks for Geotechnical and GBS Projects

The CE is a relatively recent concept that includes many different methods, techniques, and material flows. Although one of its main advantages is that it can be applied to many different sectors, this very scope makes evaluating projects on an individual basis challenging. As a result, converting CE principles into measurable outcomes is still very difficult. Qualitative frameworks such as ReSolve and the various R-Imperative models (from 3R to 9R) are widely used to outline actions that support circularity [6,16]. These actions range from reducing and reusing resources to repair, regeneration and system optimisation [6,16]. Even though these frameworks effectively outline the conceptual foundations and priorities of the CE, their descriptive nature does not provide clear quantitative assessment criteria [6,16].
To identify an appropriate method for evaluating GBS, a variety of environmental protocols, certification schemes and quantitative assessment frameworks were examined. These approaches differ in terms of their primary objectives, the scale at which they are applied, the extent to which they incorporate Life Cycle Thinking (LCT), and their relevance to geotechnical and construction-related work.
LEED, BREEAM and ITACA are well-known systems that are widely used at project and broader planning levels. These systems address multiple sustainability aspects that include water and energy performance, material consumption, site characteristics, and indoor environmental quality. Nevertheless, because of their high data requirements and methodological complexity, applying these systems to geotechnical projects remains problematic [15]. It is particularly relevant to BREEAM since the weighted scoring system requires a lot of specific information [15]. Furthermore, some frameworks—like ITACA—are designed for particular regional contexts, which limits their applicability to projects outside of their developing nation [2].
Quantitative assessment approaches, most notably LCA and related methods such as Life Cycle Costing (LCC), Social LCA (S-LCA) and Life Cycle Sustainability Assessment (LCSA), provide a systematic way of examining the environmental impact of projects from the initial design stage to reuse [9,13,26]. These tools are closely aligned with LCT and have capacity for CE evaluations by considering resource use and environmental effects within a broader systems context [26].
There are specific tools, such as EGI and the Geo-SAT, that have been developed to evaluate environmental and social performance on a project scale in the field of geotechnics. Their strength is consideration of such factors as constructability, material mobilisation and long-term performance. Nevertheless, their application is often constrained by substantial data requirements and difficulties in interpreting the resulting scores. Taking Geo-SAT as an example, there are 169 indicators present, and there is neither a standardised calculation method nor sufficient case studies to validate results.
Several circular economy frameworks developed specifically for the construction sector emphasise indicators such as embodied carbon, material and energy consumption, and social and economic value [1,2,7]. The disadvantage of using such tools mostly comes from the little guidance offered on how to interpret the resulting values, even if these approaches often draw on established methods, such as Life Cycle Assessment and European sustainability indicators.
This lack of interpretative guidance makes it difficult to compare projects and reduces the consistency with which the frameworks are applied in practice. Although frameworks such as MICRON, Circulytics and CTI include comprehensive indicators aligned with global reporting standards, they are primarily designed for business contexts and have not yet been tested in geotechnical projects.
Although there are many frameworks that support the implementation of CE at different scales, limitations in terms of data availability, complexity and sector-specific relevance hinder their direct application to GBS projects. Most frameworks incorporate Life Cycle Thinking, consistent with the recommendations of [27], but further adaptation is required to fully address the specific needs of geotechnical and ground-based construction systems.
The environmental protocols/certification systems are widely used worldwide for guidelines and ESG reporting, while the qualitative frameworks for tracking project progress aim to help organisations and academic entities monitor and improve their progress towards achieving CE goals. Implementation scale and LCT are the selection criteria for the specific needs and goals of stakeholders for CE assessment to be conducted.
In addition, the literature review provides valuable insights on dimensions/KPIs for every framework. These dimensions/KPIs encompass the primary parameters authors consider when assessing circular economy and help them draw relevant conclusions. Some frameworks, such as LCA and equivalents, EGI, Geo-SAT, and Circulytics, focus on process-based dimensions. In contrast, others, such as LEED, BREEM, ITACA, MICRON, CTI, and several recent studies [1,2,7], encompass dimensions with ecological, economic, and social value, also known as ‘sustainability pillars.’
The above literature review also highlights the limitations of each framework, helping researchers identify the research gap and find the most optimal framework for CE assessment of the GBS. One of the most apparent limitations of these techniques is their restriction to constructed projects, where assessment of the whole project could be made. It, however, unveils a lack of their application to circularity assessment of construction practices as a single unit, like application of GBS as a sustainable retaining wall. Additionally, the review of the above frameworks reveals the scarcity of guidelines on data interpretation and classification.

4. Materials and Methods

4.1. Site Description and Characterisation

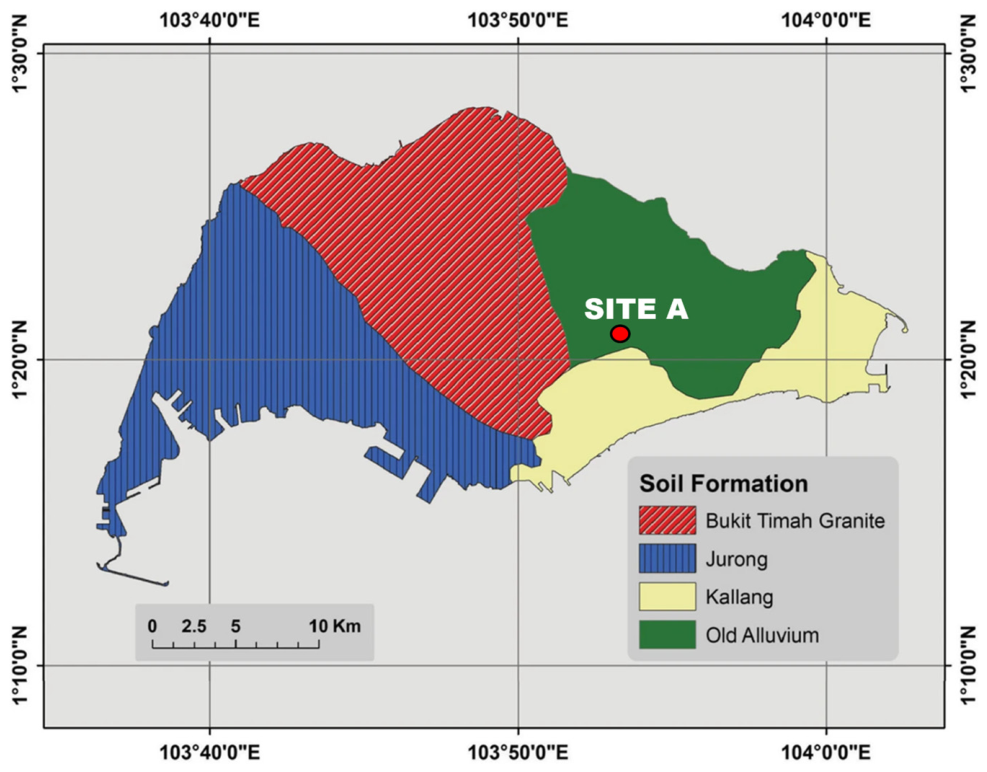
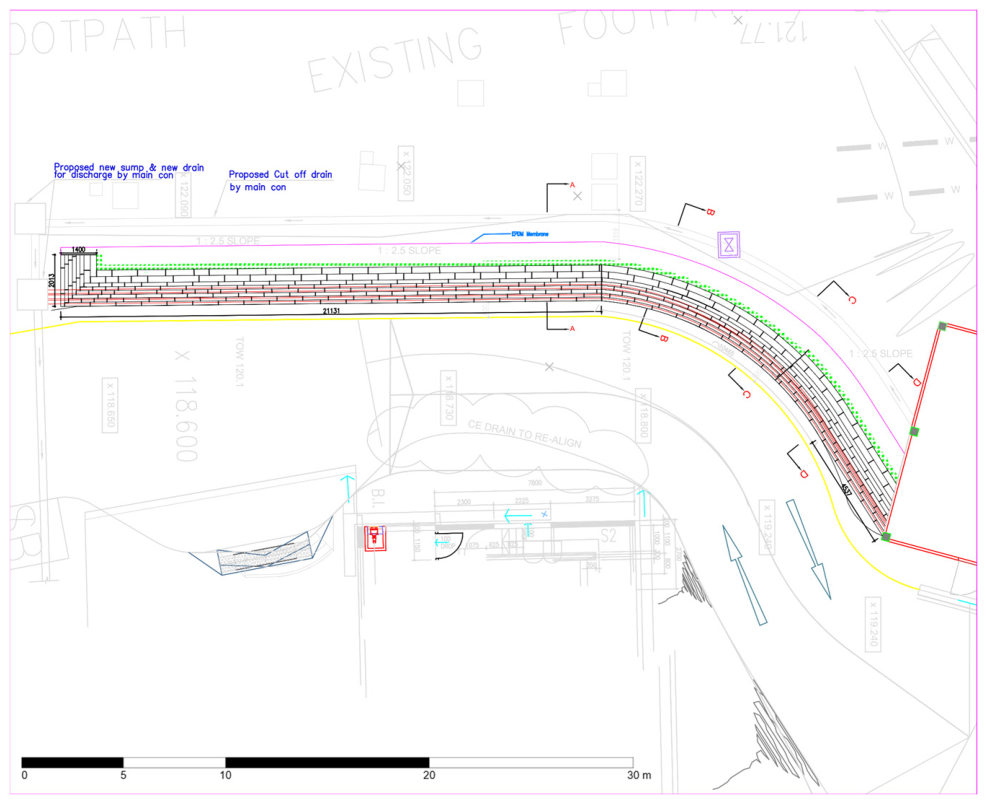
The location of the GBS slope was proposed for construction at Site A in Singapore, which is illustrated in Figure 4 and Figure 5.
The present study incorporated waste-derived materials, namely coarse and fine recycled concrete aggregates (CRCA and FRCA), into the GBS design together with ASM and the original site soils. Recycled concrete aggregates (RCA) originated from construction and demolition debris in Singapore. FRCA and CRCA were obtained from a recycling plant in Singapore. Both waste products were generated by processing bulky fragments of construction and demolition debris using a jaw crusher. All construction and demolition waste was placed on a conveyor system and inspected by workers, who removed all undesirable plastic and timber items. Steel components were extracted from the demolition debris using a large electromagnet, while the residual material was processed through a jaw crusher and classified into several gradations. CRCA and FRCA were grey in colour and contained cement and crushed stone.
All the materials were characterised using grain-size distribution (GSD) testing in accordance with ASTM D6913M-17 [28]. Sieve analysis was performed to classify the soils according to ASTM D2487-17 [29]. Key index properties such as Atterberg limits, specific gravity and compaction parameters were obtained in accordance with ASTM standards D4318-17 [30], D854-14 [31], and ASTM D698-12 [32], respectively.
SWCC was measured using HYPROP equipment, because it is a faster and more reliable alternative to the traditional Tempe cell method. The general procedure involves the following steps: compaction of the soil in a sample ring, saturation of the specimen and installation of tensiometers, followed by recording the measurements using HYPROP-FIT software (version 4.2.2.0) [33]. The test results were fitted to the unimodal SWCC equation proposed by [34].
The saturated permeability (ks) of the CRCA and FRCA was determined using the constant head method (ASTM D2434-19) [35], while to obtain the permeability of ASM, the falling head method was performed (ASTM D5084-16a) [36]. Permeability functions (kw) were estimated indirectly using SWCC-based models [37,38]. Since unsaturated permeability varies with suction, the computational approach divided SWCC into intervals of volumetric water content to derive permeability coefficients.
Shear strength parameters, i.e., effective cohesion (c′) and friction angle (φ′), were measured by consolidated-drained (CD) triaxial tests (ASTM D7181-20) [39]. Cylindrical specimens (7.1 cm × 14 cm) were compacted in layers within a rubber membrane and saturated to a B-value of one. Specimens were then consolidated under selected confining pressures (σ3) and sheared at a strain rate of 0.01 mm/min with drainage allowed throughout. Volume change was continuously recorded, and multistage tests were performed at varying confining pressures until peak stress was reached [40,41].

4.2. Numerical Analysis

Numerical analysis is required to evaluate the performance of the GBS in protecting the slope from rainfall infiltration and to quantify the amount of infiltrated water for further circularity assessment. The seepage governing equation replicates water flow in unsaturated and saturated soils under steady or transient states. The finite element method numerically solves two-dimensional transient problems using Equations (1) and (2) for respective soil conditions [42].
Saturated:
k s 2 h w x 2 + k s 2 h w y 2 =   m v ρ w g h w t ,
unsaturated:
x k w h w x + y k w h w y = m 2 w ρ w g h w t ,
where k s = saturated permeability coefficient; ρ w = density of water; g = gravitational acceleration; u w = pore-water pressure; h w = y + u w / ρ w g , hydraulic head (i.e., the sum of the gravitational head, y, and the pressure head); m v = volume change coefficient for saturated soils; k w = permeability function; h w x = hydraulic head gradient in the x-direction; h w y = hydraulic head gradient in the y-direction; m 2 w = water storage modulus (water volume change coefficient); and t = time.
The limit equilibrium method is employed in slope stability analysis with two factors of safety (FOS) equations to analyse horizontal force and moment equilibrium [42]. Under the assumption of atmospheric air pressure ( u a = 0), the respective FOS equations for saturated (3) and unsaturated (4) soils based on force equilibrium are derived.
Saturated:
F f =   [ c β c o s α + N u w β t a n φ c o s α ] N s i n α ,
unsaturated:
F f =   [ c β c o s α + N   u w β t a n φ b t a n φ t a n φ c o s α ] N s i n α ,
where F f = FOS associated with force equilibrium; c = effective cohesion; φ = effective friction angle; φ b = angle indicating the rate of increase in shear strength in relation to suction change; u w   = pore-water pressure; N = total normal force on the slice base; α = angle between the tangent to the base centre of each slice and the horizontal, (when the angle inclines in the same direction as the overall slope of the geometry, α is positive; conversely, it is negative); and β = sloping distance across the slice base.
For moment equilibrium under zero pore-air pressure, the FOS equations for saturated (5) and unsaturated (6) soils are expressed as
  • saturated:
F m =   [ c β R + N u w β R t a n φ ] W x N f ,
unsaturated:
F m =   [ c β R + N   u w β t a n φ b t a n φ R t a n φ ] W x N f ,
where F m = FOS associated with to moment equilibrium; R = radius for a circular slip surface, or the moment arm associated with the mobilised shear force S m for slip surfaces of any shape; W = total weight of the slice of width b and height h, or shortly the weight of a slice; x = horizontal distance from the centreline of each slice to the centre of rotation; f = perpendicular offset of the normal force from the centre of rotation.
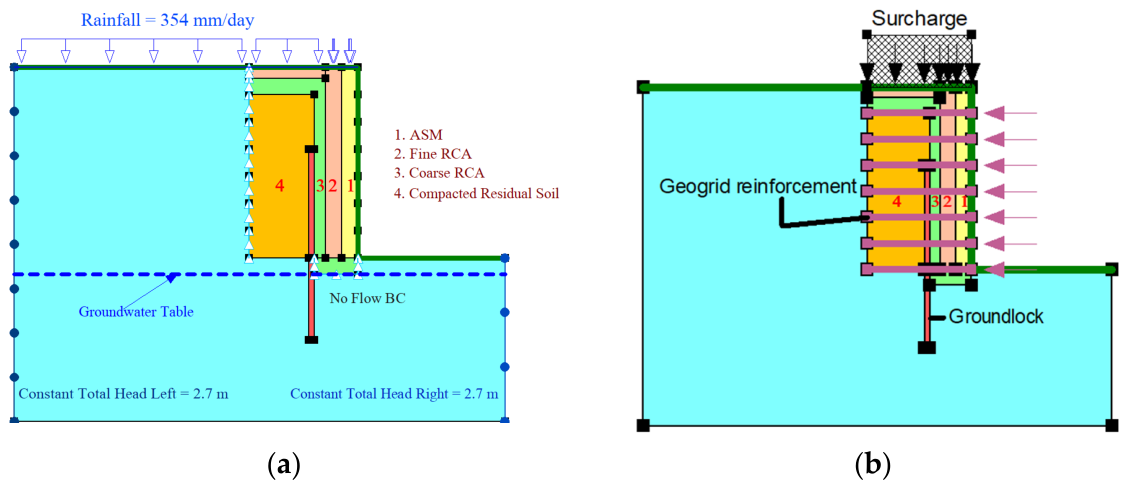
The design process started with a detailed examination of the target site and project details. Figure 6 illustrates a localised segment of a numerical model of a GBS slope with an inclination of up to 90° and a maximum height of 3.5 m.
An existing 800 mm diameter water pipeline lies at a distance of about 10 m from the GBS slope. According to the Code of Practice on Sewerage and Sanitary Works [43], a minimum horizontal clearance of 10 m is required for construction activities near pipelines of this size. It is expected that the proposed GBS will not pose a risk to the nearby water infrastructure, as the aforementioned criterion has been met.
Based on the soil shear strength parameters, the groundwater table (GWT) position, and rainfall intensity of the investigated area, the model was constructed, including four major parts of the GBS, which can be seen in Figure 6. The thickness of each GBS component was assigned according to the model proposed by Rahardjo et al. [21]. The system comprised compacted soil, geogrid reinforcement, CRCA and FRCA for the CBS, and ASM for the green cover. The SWCCs and permeability functions of the GBS materials were incorporated into SEEP/W to simulate pore-water pressure profiles under varying conditions. The element size employed in the finite element study was 0.1 m, following Chua et al. [14].
Boundary conditions were defined using field data: the GWT was positioned 3.8 m below the crest and 0.3 m above the toe of the slope, while rainfall intensity was taken as 354 mm/day based on local records. Constant total head boundaries of 2.7 m were applied along both the left and right sides of the domain. The pore-water pressure distributions obtained from seepage analyses were then integrated into slope stability analyses.
For slope stability analysis, the slice-based Morgenstern–Price method was applied to determine the FOS, as it satisfies both force and moment equilibrium. The Mohr–Coulomb constitutive model extended for unsaturated soils [44] was adopted, incorporating suction effects. The grid and radius search methods in SLOPE/W were employed to locate potential slip surfaces. A surcharge load of 30 kN/m2 was applied at the crest to represent external loading [45].
Reinforcement was modelled using geogrid layers assigned along the slope. The geogrid length was set to 2 m. In the reinforcement load definition, the geogrid was specified as a geosynthetic material, with pullout resistance calculated from the interface properties. These included an interface adhesion of 28 kPa, interface shear angle of 0°, surface area factor of 2, and resistance reduction factor of 1. The geogrid tensile capacity was taken as 35 kN/m with a reduction factor of 1.

4.3. Proposed Circular Assessment Framework

The proposed circularity assessment framework is a methodological approach designed to evaluate the circularity performance of GBS across multiple resource domains. The assessment considers the following five indicators: water circularity, energy circularity, material circularity, waste circularity, and site quality. All indicators are quantified using defined calculation procedures and project-specific data to enable a consistent comparison of results between different projects.
The average of the circular inflow and outflow is used to calculate the water’s circularity [2,46]. It is a flow-based indicator reflecting the degree of circular water management [2,46]. The percentage of renewable energy sources compared to total energy demand is known as energy circularity [2,46,47,48]. The system’s score goes from zero, which indicates that it solely relies on non-renewable energy sources, to full, which denotes that it uses renewable energy sources exclusively [2,46,47,48]. It also emphasises how crucial it is to incorporate sustainable energy sources into the design process. The percentage of recovered or recycled materials used in the project’s total material demand is known as material circularity [2,49]. While lower values indicate a continued reliance on natural resources, higher values indicate a greater reliance on secondary materials [2,49]. The on-site handling of excavated materials is the main focus of waste circularity. To encourage more circular building methods, it calculates the percentage of these materials that are kept and recycled inside the project’s boundaries as opposed to being taken out for disposal [2,49].
When combined, all these indicators offer an organised quantitative way to assess circularity in infrastructure and building systems. It offers a data-driven foundation for enhancing resource efficiency and environmental performance throughout the project life cycle and can be adapted to suit a variety of project types.

5. Results

5.1. GBS Case Study: Site Overview and Characterisation

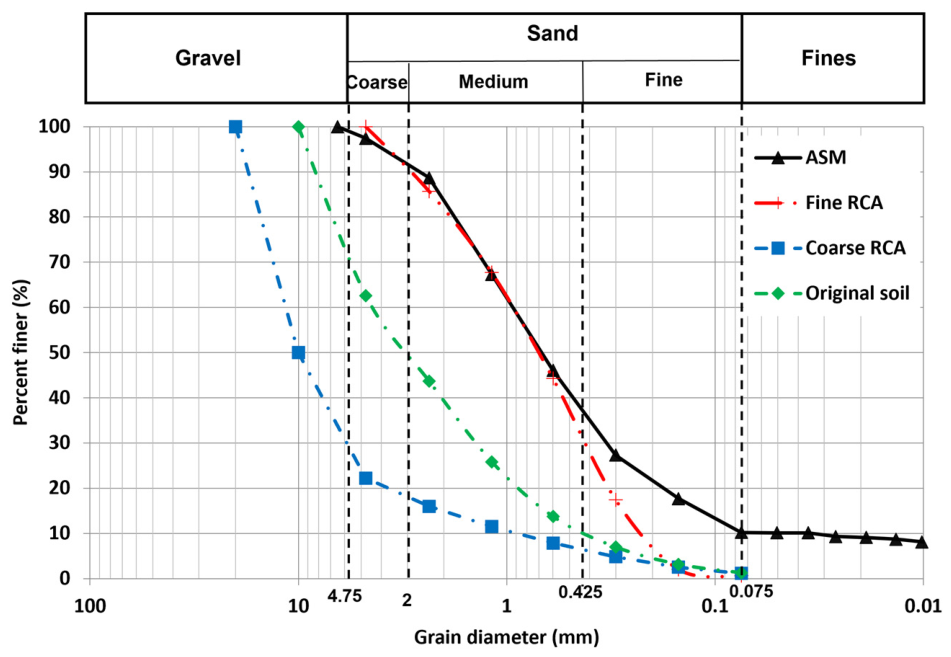
Grain-size distribution (GSD) tests of the original soil, CRCA, FRCA, and ASM were performed following ASTM D6913M-17, and the corresponding curves are shown in Figure 7. The soils were classified according to ASTM D2487-17 using the Unified Soil Classification System (USCS), and the results are presented in Table 1. The index properties of the original soil, CRCA, FRCA, and ASM were determined by conducting Atterberg limits, specific gravity, and Proctor compaction tests in accordance with ASTM D4318-17, ASTM D854-14, and ASTM D698-12, respectively. The results are presented in Table 1.
The effective internal friction angles (φ′) obtained from the triaxial test were 30° for ASM, 38° for FRCA, and 42° for CRCA. According to Fredlund and Rahardjo [37], unsaturated shear strength angles (φb) were taken to be half of the effective internal friction angles. One of the requirements to achieve the capillary barrier effect is the incorporation of non-cohesive soil inside the barrier; hence, the corresponding effective cohesions (c′) for both waste products were zero [25]. The effective cohesion for ASM and original soil was the same and equal to 2 kPa. Site investigation data indicated that Borehole BH-14 exhibited the lowest shear strength. Accordingly, it was conservatively adopted as the representative original soil in the numerical analysis, with properties defined as bulk density (γb) = 17 kN/m3, c′ = 2 kPa, and φ′ = 28°. The shear strength properties adopted for the analysis can be found in Table 2.
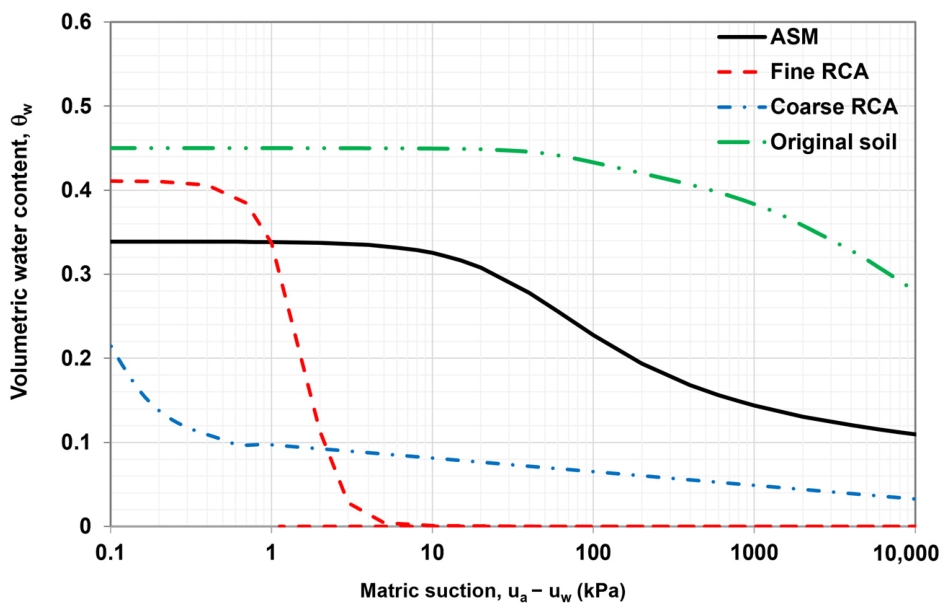
Following the results obtained from the HYPROP test, SWCCs of ASM, RCAs, and original soil were obtained, which can be seen in Figure 8. To get a complete relationship between suction and water content, a unimodal fitting equation proposed by Satyanaga et al. [34] was used to best fit the experimental data. To model SWCC using the Satyanaga et al. [34] fitting equation, each parameter must have a valid initial value. To closely match the SWCC experimental data, all parameters can be modified using an iterative non-linear regression approach built into Microsoft Excel [50,51].
Particle size distribution of soil significantly influences its air-entry value [42]. Coarser particles tend to have lower air-entry values than finer particles, which is also true here (see Figure 8). Similarly, the saturated volumetric water content is the lowest for the coarse RCA and the highest for the original soil.
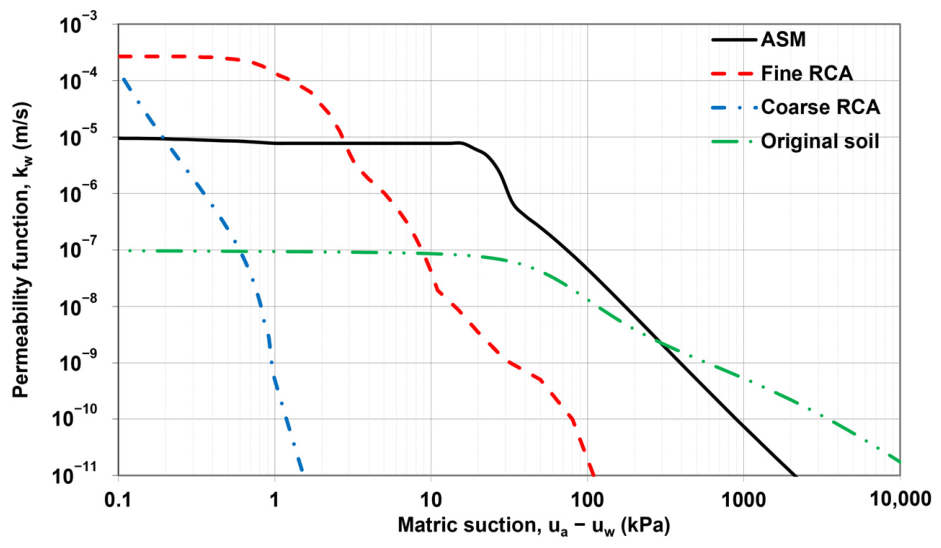
Figure 9 shows the permeability functions of original soil, ASM, and RCAs that were determined using the statistical method according to Satyanaga et al. [52]. These curves verify the capability of the studied recycled waste materials for performing as a capillary barrier inside the GBS. The major reason is the distinction in permeability between fine and coarse RCAs when reaching higher suction values. It allows the water to flow down through a fine RCA until the breakthrough to coarse RCA occurs. Permeability functions of the remaining materials, like ASM and original soil, are lower for having a higher percentage of fine particles. Their saturated permeabilities are 1.0 × 10⁻⁵ m/s and 1.0 × 10⁻⁷ m/s, respectively. All these permeability functions were later incorporated in the numerical analysis with the best-fitted data of SWCCs of each of the corresponding materials to obtain the amount of infiltrated rainwater.

5.2. GBS Case Study: Numerical Analysis

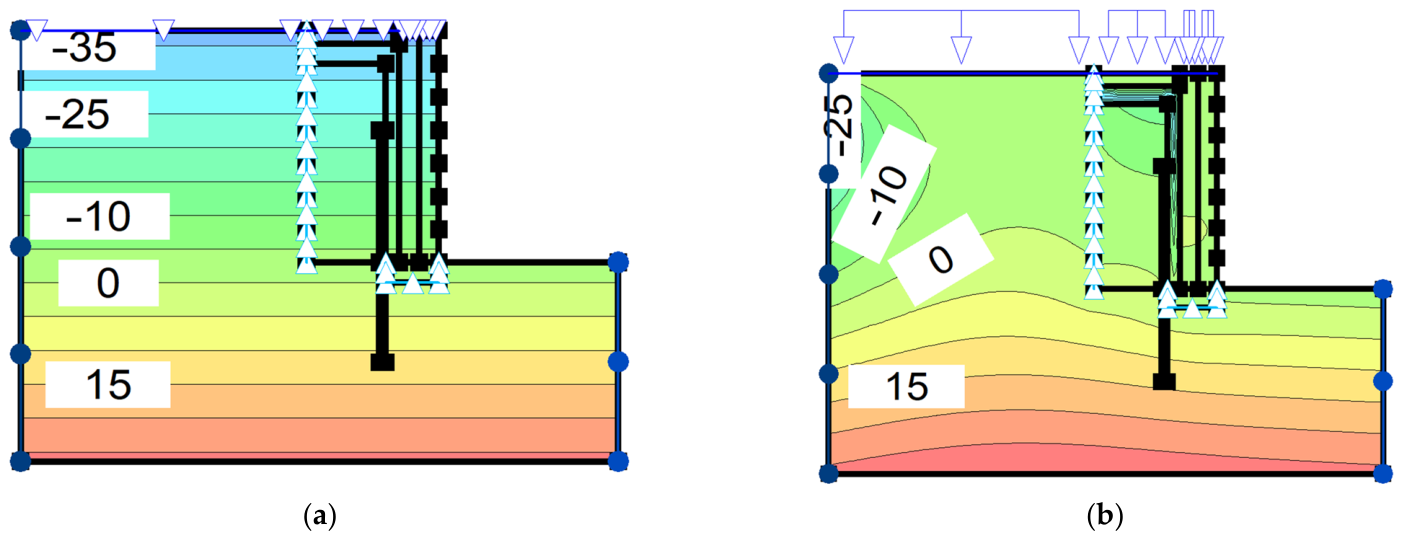
With the model fully defined, seepage and slope stability analyses were carried out, and the corresponding results are presented in Figure 10, Figure 11 and Figure 12. Figure 10 demonstrates the changes in pore-water pressure in the soil beneath the slope with GBS before and after rainfall. The pore-water pressure contours were obtained from seepage analyses using SEEP/W and used to examine the influence of GBS on infiltrated water movement. The results indicate that GBS contributes to suction maintenance in the slope after rainfall, limiting positive pore-water pressures development. This response is mainly observed in the near-surface zone, where rainfall infiltration has the most immediate effect.
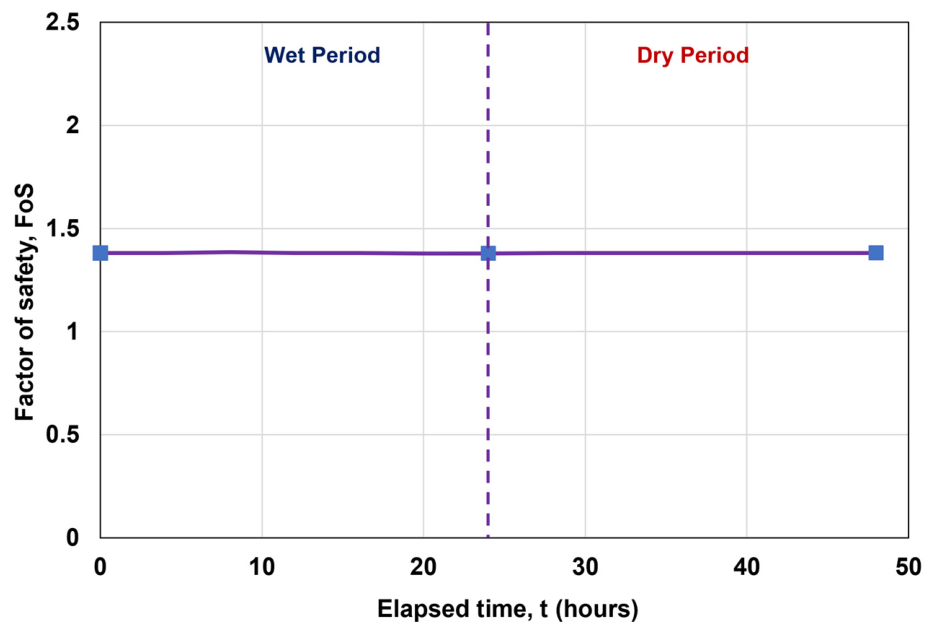
Figure 11 shows that the FOS of a slope incorporating GBS is nearly constant throughout all 48 h. This means that GBS successfully achieved its goal by preventing rainfall infiltration since there is no change between wet and dry periods, otherwise a reduction of FOS would be expected during rainfall. To ensure a conservative assessment, the shear strength parameters were taken as the minimum values among the three experiments. The analysis was conducted under extreme rainfall conditions, and as a result, the FOS represents the worst-case scenario [21]. In this context, wet period corresponds to the duration of rainfall, while dry period refers to the period after its end.
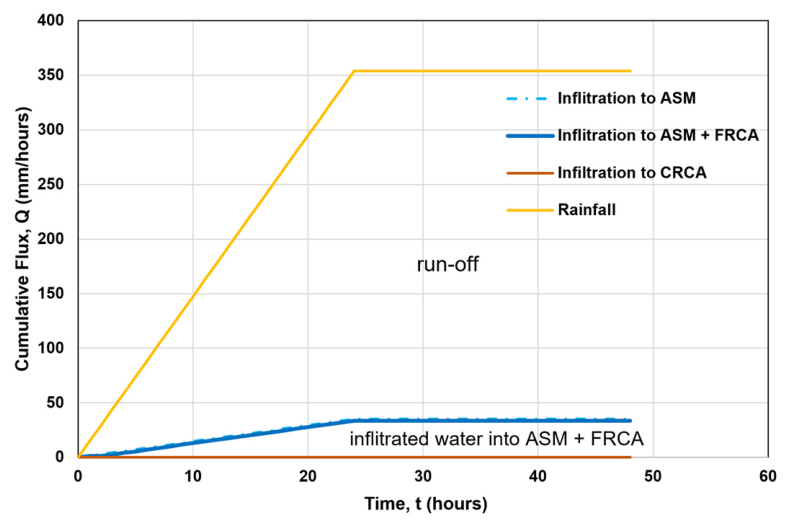
Following slope stability analyses results, it was required to identify the volume of the infiltrated rainfall into the system for further circular assessment. Figure 12 demonstrates the amount of rainfall infiltrated into the corresponding GBS layers. It can be used to evaluate the GBS effectiveness in minimising rainfall infiltration. Given the required rainfall intensity of 354 mm/day, approximately 10% of the rainwater infiltrated into ASM and FRCA combined, with the remaining amount being discharged as runoff. According to the graph, it can be seen that no infiltration into CRCA has been observed, and infiltrated water in the ASM and fine layers is within an adequate level. This implies that breakthrough into the coarse layer of CBS had not occurred and the system was functioning well, proving the efficacy of GBS in reducing the amount of infiltrated rainwater.

5.3. Circularity Assessment

The circularity assessment framework developed for GBS was created with consideration of the requirements of the primary stakeholders involved in the system life cycle [53,54]. The identified stakeholders are the project owners, design and engineering consultants, construction contractors, material suppliers, operation and maintenance operators, regulatory and environmental authorities, and local communities in close proximity to the project area. These stakeholders were selected because they have a direct impact on the design, construction, operation, regulation, or environmental acceptance of the system [55].
Among these stakeholders, regulatory and environmental authorities and project owners are the most prioritised stakeholders since they were responsible for the approval of the project, its adherence to environmental requirements, operation, and cost-effectiveness [56]. The local communities are equally significant since the GBS has an impact on groundwater safety, environmental standards, slope stability, and the surrounding lands [25,57]. Design consultants and contractors have a significant effect on constructability and implementation of the system, whereas suppliers are responsible for the material availability and sourcing [58]. Operational and maintenance personnel are additionally important because they affect the long-term functionality and operational performance of the system over its service life.
The considerations of these stakeholder groups formed the basis in deciding which circularity indicators to include in the present study. The regulatory agencies and local communities require slope and groundwater protection, minimised environmental disturbance, and improved site compatibility [59,60]. Project owners and system operators prioritise durability, operational efficiency, lower demand for maintenance, and enhanced life cycle performance of the system [61,62]. Contractors and engineering consultants concentrate at constructability, lower effects of excavation work, and resource efficiency in the installation process [57,63]. Material suppliers and sustainability-oriented stakeholders highlight the use of recycled materials and emphasise reuse potential and minimisation of natural material consumption [64,65].
Based on these stakeholder requirements, a circularity assessment to evaluate the GBS performance was carried out across five key domains that include water, energy, materials, waste, and site quality. The selected circularity indicators provide a quantitative basis for examining how efficiently resources are retained and reused within the system. It was accomplished to avoid reliance on natural materials and their associated environmental impact. Water circularity evaluates the proportion of inflows and outflows and addresses the issues raised by stakeholders concerning the management of the groundwater, rainfall infiltration control, and overall water efficiency [2,46]. Energy circularity considers the share of renewable sources in total energy use actively engaged in the development and operation of the system [2,46,47,48]. Material circularity evaluates the extent to which recycled or recovered materials contribute to the total input, and waste circularity measures how much of the excavated soil is reused on-site [2,49]. Site quality assesses site disturbance impacts and the environmental compatibility of the system [2,49]. The circularity indicators were calculated using Equations (7)–(11):
Water circularity:
W a t e r   c i r c u l a r i t y % = %   C i r c u l a r   w a t e r   i n f l o w + %   C i r c u l a r   w a t e r   o u t f l o w 2
Energy circularity:
R e n e w a b l e   e n e r g y % = R e n e w a b l e   e n e r g y T o t a l   e n e r g y × 100 %
Material circularity:
I n d i c a t o r   ( % ) =   V r e V t o t a l   o r   W r e W t o t a l × 100 % ,
where V r e : the volume of recycled and/or recovered material used in the system [m3]; V t o t a l : the total volume of all materials used in the system [m3].
Waste circularity:
I n d i c a t o r   ( % ) =   V t r t o t V s t o t × 100 % ,
where V t r t o t : the total volume of waste soil reused on-site [m3]; V s t o t : the total volume of excavations planned or carried out [m3].
Site quality:
I n d i c a t o r = B i / A × ( 1 )   +   B i i / A × ( 0 )   +   B i i i / A × ( 3 )   +   B i v / A × ( 5 ) ,
where A = Site area (m2); B i = Total area of the site exhibiting soil properties in their natural condition (m2); B i i = Total area of the site area including green spaces and/or regions previously utilised for agricultural activities (m2); B i i i = Total area of the site area on which occupied by building structures or infrastructures (m2); and B i v = Total surface area of the site area on which remediation operations were executed/are planned (m2).
Following the calculations made for key performance indicators, the findings reveal that the GBS currently demonstrates moderate circular performance. Using the results obtained from Figure 12, water circularity was calculated at 50.0%, reflecting that half of the water in the system is effectively reused or circulated. Material and waste circularity were 38.47% and 43.51%, respectively. It highlights key areas where sustainability improvements could be targeted. Table 3 shows that the total volume of all materials in the GBS is 343.09 m3, of which 132 m3 are recyclable materials (FRCA and CRCA) and 211.09 m3 are non-recyclable materials (ASM and compacted soil). The following breakdown shows the proportion of recyclable and non-recyclable materials in the system, which was used when calculating the material and waste circularity indicators. Energy circularity stood at zero percent as no renewable energy is involved in the system. The site quality rating was recorded to be 2.250, which reflects that the project is predominantly located within previously developed or engineered areas, with a smaller proportion of green areas following ITACA land reuse criterion. The input parameters and the computed values used to determine the five key performance indicators are summarised in Table 4. The reported values include water inflow and outflow, energy consumption and contribution of renewable energy, material and waste volumes, and land-use parameters required for the site quality assessment.

6. Discussion

Following the circularity assessment, the sustainability performance of the GBS was examined in relation to water, energy, materials, and waste. First, the water circularity value was 50.0%, indicating that a large proportion of water leaving the system can either be recycled or safely released back into the environment. Figure 12 illustrates that a significant portion of infiltrated rainwater is directed through the fine-grained layer toward the main drain. This controlled drainage reduces surface runoff and mitigates flooding risk, thereby contributing to the system’s water circularity performance. Nonetheless, the low inflow percentage suggests that measures such as rainwater harvesting could offer practical opportunities to improve overall performance. From a stakeholder standpoint, water management remains particularly important for regulatory and environmental authorities, project owners, and local communities because rainfall mitigation, slope and groundwater protection, and effective resource use are directly related to environmental safety and system sustainability.
At present, energy circularity within the GBS is rated as zero. The sole explanation is an absolute reliance on traditional non-renewable energy sources. In light of more general infrastructure decarbonisation goals, the system is less circular in its use of energy resources when renewable energy is not integrated. Long-term energy resilience and environmental performance are both lowered by such dependence. Small-scale wind installations or the on-site installation of solar panels could be crucial in resolving this issue.
The system’s circularity value, when assessing material use within it, was 38.47%. The value shows that a small portion of the total material volume is made up of recycled materials, primarily recycled concrete aggregates. The continued reliance on natural soil emphasises the transition’s incompleteness, even though it already shows a first step toward circular material use. As a result, even though recycled inputs are used, the system cannot yet be characterised as primarily circular in material terms. This result is of special significance for project owners, contractors and regulatory and environmental authorities, as the selection of materials has a direct impact on resource efficiency, environmental impact and long-term sustainability performance [66].
Meanwhile, 43.51% of waste was circular, indicating a moderate level of circular practice. Instead of completely removing and disposing of the excavated soil elsewhere, the result shows that it was reused within the project site. Reusing of excavated soil enhanced waste circularity performance and reduced disposal requirements. Although the amount of reuse is still limited, it is an improvement over completely linear waste handling. Material recovery is not regularly given priority in current planning and construction procedures, which restricts improvements in environmental performance and resource efficiency. Excavated materials should be identified early on, their potential for on-site reuse within the project boundaries should be systematically evaluated in order to improve waste circularity. From stakeholders’ point of view, enhanced waste reutilization is especially critical for contractors, local governments, and adjacent communities due to reduced disposal needs, transport effects, and environmental disturbances resulting from excavation operations [67].
The evaluation of the site quality led to a score of 2.250, which means that the project is predominantly located on previously modified or engineered land, with a lower share of green areas within the project boundary. This result is indicative of the land-use characteristics of the site and the presence of infrastructure and engineered earthworks associated with the GBS. Although the system does not generate severe environmental degradation, there are still opportunities to improve site quality through integration of vegetation and optimisation of land use. As one of the design objectives of the GBS is vegetation establishment, its long-term development is expected to contribute positively to the environmental performance and visual integration of the structure. These improvements are of particular interest to local communities and regulatory and environmental authorities, as site quality has a strong impact on environmental acceptance and long-term project sustainability [60].
Although the proposed framework is applicable, there are some limitations that should be acknowledged as well. First, the present evaluation is based on one case study of GBS, which may restrict the generalisability of the results to other geotechnical systems and environmental conditions. Second, some indicators are based on simplified assumptions on material reuse and operation conditions because of lack of long-term monitoring data. Third, the weighting structure is still preliminary and has not been validated through a large-scale stakeholder survey or a multi-expert decision-making process. Moreover, economic and social sustainability indicators are not fully integrated into the current framework, which might limit its ability to fully capture broader sustainability performance.
The current approach addresses many aspects of the concept of circularity, but stakeholder analysis reveals that some of the criteria are currently not fully covered by the approach. Specifically, while the approach places great emphasis on material flow and waste management, little attention is paid to the performance of the organisation, its longevity, and climate change. Therefore, several refinements are suggested.
The first one involves the use of a new parameter that will focus on the carbon and climate performance. This new parameter will consider the embodied carbon due to materials used, construction practices, and transportation, as well as the savings obtained through the recycling of aggregates and local production of building materials. This modification addresses primarily the demands of regulatory and environmental authorities and project owners.
Secondly, a durability and maintenance parameter might be added to the framework. Service life, maintenance frequency, and long-term operating performance have a direct impact on lifetime resource efficiency and economic sustainability [68]. Higher durability and lower maintenance costs would facilitate better contributions towards circularity over time.
Aside from introducing new variables, there should also be changes made to the weighting system since stakeholder considerations can be different based on the objectives of the projects, sensitivity to the environment, and regulatory considerations. Projects involving the groundwater will have higher weights assigned to water circularity and site quality. Urban projects where digging might be problematic could benefit from a higher consideration for waste circularity and constructability. Projects that aim to lower carbon emissions or attain certification in sustainability should focus on material circularity and carbon efficiency.
The current assessment framework evaluates five circularity domains without explicit weighting factors based on stakeholders. However, a preliminary weighting structure can be suggested for future refinement of the framework based on stakeholder priorities derived from the literature review and the characteristics of the GBS case study as follows:
  • Water circularity: 25%
  • Material circularity: 25%
  • Waste circularity: 20%
  • Site quality: 15%
  • Energy circularity: 5%
  • Carbon performance: 5%
  • Durability and maintenance: 5%
These weighting values are meant as preliminary and conceptual assessments of stakeholder priorities within the existing framework. Future research should evaluate and modify the weighting system using stakeholder surveys or formal multi-criteria decision-making methods.
Energy circularity is given less weightage due to the nature of the GBS, which has relatively modest energy requirements in comparison to material demands. Water and material circularity are given more weight since they align better with the interests of regulators, project owners, and communities.
The obtained results indicate that material circularity, waste circularity, and water circularity are likely to have the greatest impact on the overall circularity performance of the current GBS configuration because these parameters contribute the most to the current system design and resource flows. The use of recycled concrete aggregates, in particular, and the reuse of excavated soil are critical for enhancing material and waste circularity performance. In contrast, energy circularity currently has little impact because renewable energy sources are not integrated into the existing case study arrangement.
Future research may conduct formal sensitivity assessments by systematically adjusting parameter values and weighting variables in order to assess the framework’s robustness under different stakeholder priorities, environmental conditions, and project constraints.
There are several other aspects that can be addressed to improve the current framework. One of them is to validate the framework through additional case studies in different environmental and operational contexts. Moreover, future studies should focus on stakeholder-based weighting approaches such as Analytic Hierarchy Process (AHP) or multicriteria decision analysis (MCDA) methods [69]. Furthermore, long-term monitoring data should be used to assess the durability, maintenance requirements and operational performance during the entire life cycle of the GBS.

7. Conclusions

A preliminary framework for circularity assessment is introduced for the first time, specific to geotechnical infrastructure systems in the present study, and was then applied to the GeoBarrier System (GBS) as a case study through an integrated evaluation approach covering water, energy, material, waste, and site quality aspects. This framework was developed based on literature review, stakeholder requirements, and case-specific characteristics of GBS. The results indicate that water circularity is starting to develop, whereas energy circularity remains absent because the system lacks circular energy strategies. Material and waste circularity demonstrated moderate performance through partial incorporation of recycled materials and reuse of excavated soil. Together with a site quality score of 2.250, the system’s overall circularity performance can be classified at an intermediate level. It can be improved by increasing the use of recycled materials, reusing excavated waste on site, reducing amount of material, incorporating renewable energy sources, and enhancing site planning to lower material demand and environmental disturbance. Overall, the proposed framework has the potential to provide a consistent way to assess circularity and encourages more resource-efficient design decisions for a variety of infrastructure projects and may find application in other geotechnical systems.

Author Contributions

Conceptualization, A.S., R.A., M.G. and M.K.; methodology, A.S. and M.G.; software, R.A.; validation, M.G. and A.L.; formal analysis, R.A., A.S. and M.G.; investigation, R.A., A.S., M.G. and M.K.; resources, A.S., M.G. and J.K.; data curation, R.A., A.S. and M.K.; writing—original draft preparation, R.A., A.S. and M.G.; writing—review and editing, M.K., A.L. and J.K.; visualization, R.A. and A.S.; supervision, A.S., M.G., A.L. and J.K.; project administration, A.S. and J.K.; funding acquisition, A.S. All authors have read and agreed to the published version of the manuscript.

Funding

This research was funded by the research project AP23486953 from the Ministry of Higher Education and Science of the Republic of Kazakhstan.

Institutional Review Board Statement

Not applicable.

Informed Consent Statement

Not applicable.

Data Availability Statement

The original contributions presented in this study are included in the article. Further inquiries can be directed to the corresponding authors.

Acknowledgments

This research was supported by the research project AP23486953 from the Ministry of Higher Education and Science of the Republic of Kazakhstan. The authors are grateful for this support. Any opinions, findings, and conclusions or recommendations expressed in this material are those of the authors and do not necessarily reflect the views of Nazarbayev University.

Conflicts of Interest

The authors declare no conflicts of interest.

Abbreviations

The following abbreviations are used in this manuscript:
CECircular economy
CBSCapillary barrier system
GBSGeoBarrier system
LCALife cycle assessment
ESGEnvironmental, social, and governance
EGIEnvironmental geotechnics indicator
RSSReinforced soil system
ASMApproved soil mixture
WEVWater-entry value
SWCCSoil–water characteristic curve
LCTLife cycle thinking
LCCLife cycle costing
S-LCASocial life cycle assessment
LCSALife cycle sustainability assessment
Geo-SATGeo-Sustainability Assessment Tool
RCARecycled concrete aggregate
CRCACoarse recycled concrete aggregates
FRCAFine recycled concrete aggregates
GSDGrain-size distribution
CDConsolidated-drained
FOSFactor of safety
GWTGroundwater table
AHPAnalytic hierarchy process
MCDAMulticriteria decision analysis
USCSUnified soil classification system

References

  1. Medina, E.M.; Fu, F.; Fu, F. A New Circular Economy Framework for Construction Projects. Proc. Inst. Civ. Eng. Eng. Sustain. 2021, 174, 304–315. [Google Scholar] [CrossRef]
  2. Fagone, C.; Santamicone, M.; Villa, V. Architecture Engineering and Construction Industrial Framework for Circular Economy: Development of a Circular Construction Site Methodology. Sustainability 2023, 15, 1813. [Google Scholar] [CrossRef]
  3. Jemal, K.M.; Kabzhassarova, M.; Shaimkhanov, R.; Dikhanbayeva, D.; Turkyilmaz, A.; Durdyev, S.; Karaca, F. Facilitating Circular Economy Strategies Using Digital Construction Tools: Framework Development. Sustainability 2023, 15, 877. [Google Scholar] [CrossRef]
  4. Pearce, D.W.; Turner, R.K. Economics of Natural Resources and the Environment; Johns Hopkins University Press: Baltimore, MD, USA, 1989. [Google Scholar]
  5. Perkins, L.; Royal, A.C.D.; Jefferson, I.; Hills, C.D. The Use of Recycled and Secondary Aggregates to Achieve a Circular Economy within Geotechnical Engineering. Geotechnics 2021, 1, 416–438. [Google Scholar] [CrossRef]
  6. Tserng, H.P.; Chou, C.M.; Chang, Y.T. The Key Strategies to Implement Circular Economy in Building Projects-a Case Study of Taiwan. Sustainability 2021, 13, 754. [Google Scholar] [CrossRef]
  7. González, A.; Sendra, C.; Herena, A.; Rosquillas, M.; Vaz, D. Methodology to Assess the Circularity in Building Construction and Refurbishment Activities. Resour. Conserv. Recycl. Adv. 2021, 12, 200051. [Google Scholar] [CrossRef] [PubMed]
  8. Raymond, A.J.; Tipton, J.R.; Kendall, A.; DeJong, J.T. Review of Impact Categories and Environmental Indicators for Life Cycle Assessment of Geotechnical Systems. J. Ind. Ecol. 2020, 24, 485–499. [Google Scholar] [CrossRef]
  9. Samuelsson, I.; Larsson, S.; Spross, J. Life Cycle Assessment and Life Cycle Cost Analysis for Geotechnical Engineering: Review and Research Gaps. IOP Conf. Ser. Earth Environ. Sci. 2021, 710, 012031. [Google Scholar] [CrossRef]
  10. Raza, F.; Alshameri, B.; Jamil, S.M. Assessment of Triple Bottom Line of Sustainability for Geotechnical Projects; Springer Netherlands: Dordrecht, The Netherlands, 2021; Volume 23. [Google Scholar]
  11. Raymond, A.J.; DeJong, J.T.; Kendall, A.; Blackburn, J.T.; Deschamps, R. Life Cycle Sustainability Assessment of Geotechnical Ground Improvement Methods. J. Geotech. Geoenviron. Eng. 2021, 147, 04021161. [Google Scholar] [CrossRef]
  12. de Melo, D.L.; Kendall, A.; DeJong, J.T. Evaluation of Life Cycle Assessment (LCA) Use in Geotechnical Engineering. Environ. Res. Infrastruct. Sustain. 2024, 4, 012001. [Google Scholar] [CrossRef]
  13. Firoozi, A.A.; Firoozi, A.A.; Maghami, M.R. Sustainable Practices in Geotechnical Engineering: Forging Pathways for Resilient Infrastructure. Results Eng. 2025, 26, 105577. [Google Scholar] [CrossRef]
  14. Chua, Y.S.; Rahardjo, H.; Satyanaga, A. Structured Soil Mixture for Solving Deformation Issue in GeoBarrier System. Transp. Geotech. 2022, 33, 100727. [Google Scholar] [CrossRef]
  15. Raza, F.; Alshameri, B.; Jamil, S.M. Engineering Aspect of Sustainability Assessment for Geotechnical Projects; Springer Netherlands: Dordrecht, The Netherlands, 2021; Volume 23. [Google Scholar]
  16. MacArthur, E. Towards the Circular Economy. J. Ind. Ecol. 2013, 2, 23–44. [Google Scholar]
  17. Vidal Legaz, B.; Maia De Souza, D.; Teixeira, R.F.M.; Antón, A.; Putman, B.; Sala, S. Soil Quality, Properties, and Functions in Life Cycle Assessment: An Evaluation of Models. J. Clean. Prod. 2017, 140, 502–515. [Google Scholar] [CrossRef]
  18. Song, X.; Carlsson, C.; Kiilsgaard, R.; Bendz, D.; Kennedy, H. Life Cycle Assessment of Geotechnical Works in Building Construction: A Review and Recommendations. Sustainability 2020, 12, 8442. [Google Scholar] [CrossRef]
  19. Ossio, F.; Salinas, C.; Hernández, H. Circular Economy in the Built Environment: A Systematic Literature Review and Definition of the Circular Construction Concept. J. Clean. Prod. 2023, 414, 137738. [Google Scholar] [CrossRef]
  20. Rahardjo, H.; Santoso, V.A.; Leong, E.C.; Ng, Y.S.; Hua, C.J. Performance of an Instrumented Slope Covered by a Capillary Barrier System. J. Geotech. Geoenviron. Eng. 2012, 138, 481–490. [Google Scholar] [CrossRef]
  21. Rahardjo, H.; Choon Leong, E.; Professor, A.; Looi Wang, C.; Liang Heng Wong, J. Geobarrier System for Protection Against Rainfall-Induced Slope Failure. ISSMGE Int. J. Geoengin. Case Hist. 2019, 5, 26–42. [Google Scholar] [CrossRef]
  22. Rahardjo, H.; Krisdani, H.; Leong, E.-C. Application of Unsaturated Soil Mechanics in Capillary Barrier System. In Proceedings of the 3rd Asian Conference on Unsaturated Soils, Nanjing, China, 20–24 April 2007; pp. 127–137. [Google Scholar]
  23. Rahardjo, H.; Kim, Y.; Gofar, N.; Leong, E.C.; Wang, C.L.; Wong, J.L.H. Field Instrumentations and Monitoring of GeoBarrier System for Steep Slope Protection. Transp. Geotech. 2018, 16, 29–42. [Google Scholar] [CrossRef]
  24. Rahardjo, H.; Gofar, N.; Satyanaga, A. Effect of Geobags on Water Flow through Capillary Barrier System. Geotech. Eng. J. SEAGS AGSSEA 2018, 49, 73–78. [Google Scholar]
  25. Rahardjo, H.; Kim, Y.; Gofar, N.; Satyanaga, A. Analyses and Design of Steep Slope with GeoBarrier System (GBS) under Heavy Rainfall. Geotext. Geomembr. 2020, 48, 157–169. [Google Scholar] [CrossRef]
  26. Larsen, V.G.; Tollin, N.; Sattrup, P.A.; Birkved, M.; Holmboe, T. What Are the Challenges in Assessing Circular Economy for the Built Environment? A Literature Review on Integrating LCA, LCC and S-LCA in Life Cycle Sustainability Assessment, LCSA. J. Build. Eng. 2022, 50, 104203. [Google Scholar] [CrossRef]
  27. Moraga, G.; Huysveld, S.; Mathieux, F.; Blengini, G.A.; Alaerts, L.; Van Acker, K.; de Meester, S.; Dewulf, J. Circular Economy Indicators: What Do They Measure? Resour. Conserv. Recycl. 2019, 146, 452–461. [Google Scholar] [CrossRef] [PubMed]
  28. ASTM D6913M-17; Standard Test Methods for Particle-Size Distribution (Gradation) of Soils Using Sieve Analysis. ASTM International: West Conshohocken, PA, USA, 2017.
  29. ASTM D2487-17; Standard Practice for Classification of Soils for Engineering Purposes (Unified Soil Classification System). ASTM International: West Conshohocken, PA, USA, 2017.
  30. ASTM D4318-17; Standard Test Methods for Liquid Limit, Plastic Limit, and Plasticity Index of Soils. ASTM International: West Conshohocken, PA, USA, 2017.
  31. ASTM D854-14; Standard Test Methods for Specific Gravity of Soil Solids by Water Pycnometer. ASTM International: West Conshohocken, PA, USA, 2014.
  32. ASTM D698-12; Standard Test Methods for Laboratory Compaction Characteristics of Soil Using Standard Effort (12,400 ft-lbf/ft3 (600 kN-m3/m3)). ASTM International: West Conshohocken, PA, USA, 2012.
  33. METER. Group AG Operation Manual HYPROP 2. 2018. Available online: https://library.metergroup.com/Manuals/18263_HYPROP_Manual_Web.pdf (accessed on 22 June 2026).
  34. Satyanaga, A.; Rahardjo, H.; Zhai, Q. Estimation of Unimodal Water Characteristic Curve for Gap-Graded Soil. Soils Found. 2017, 57, 789–801. [Google Scholar] [CrossRef]
  35. ASTM D2434-19; Standard Test Method for Permeability of Granular Soils (Constant Head). ASTM International: West Conshohocken, PA, USA, 2019.
  36. ASTM D5084-16a; Standard Test Methods for Measurement of Hydraulic Conductivity of Saturated Porous Materials Using a Flexible Wall Permeameter. ASTM International: West Conshohocken, PA, USA, 2016.
  37. Fredlund, D.G.; Rahardjo, H. Soil Mechanics for Unsaturated Soils; John Wiley & Sons: Hoboken, NJ, USA, 1993. [Google Scholar]
  38. Fredlund, D.G.; Xing, A.; Huang, S. Predicting the Permeability Function for Unsaturated Soils Using the Soil-Water Characteristic Curve. Can. Geotech. J. 1994, 31, 533–546. [Google Scholar] [CrossRef]
  39. ASTM D7181-20; Standard Test Method for Consolidated Drained Triaxial Compression Test for Soils. ASTM International: West Conshohocken, PA, USA, 2020.
  40. Bishop, A.; Henkel, D. The Measurement of Soil Properties in the Tri-Axial Test; Edward Arnold: London, UK, 1962. [Google Scholar]
  41. Powrie, W. Soil Mechanics: Concepts and Applications, 2nd ed.; CRC PRESS: Boca Raton, FL, USA, 2004. [Google Scholar]
  42. Fredlund, D.G.; Rahardjo, H.; Fredlund, M.D. Unsaturated Soil Mechanics in Engineering Practice; Wiley: Hoboken, NJ, USA, 2012. [Google Scholar]
  43. PUB Innovation in Water Singapore. 2019. Available online: https://www.pub.gov.sg/-/media/Images/Feature/Content-Pages/Resources/R-and-D/Issue-11Innovation-in-Water-SingaporeFull-PDF.pdf (accessed on 22 June 2026).
  44. Oh, W.T.; Vanapalli, S.K. Influence of Rain Infiltration on the Stability of Compacted Soil Slopes. Comput. Geotech. 2010, 37, 649–657. [Google Scholar] [CrossRef]
  45. Li, G.X.; Jie, Y.X.; Chew, S.H. Excess Hydrostatic Pressure in Reinforced Retaining Wall with Cohesive Backfill. In Proceedings of the Vii International Conference On Geosynthetics, Nice, France, 22–27 September 2002; pp. 295–298. [Google Scholar]
  46. WBCSD Circular Transition Indicators v3.0—Metrics for Business, by Business. 2022. Available online: https://www.wbcsd.org/resources/circular-transition-indicators-v3-0/ (accessed on 22 June 2026).
  47. Council, U.S.G.B. LEED Reference Guide for Building Design and Construction; US Green Building Council: Atlanta, GA, USA, 2013. [Google Scholar]
  48. Baratsas, S.G.; Pistikopoulos, E.N.; Avraamidou, S. A Quantitative and Holistic Circular Economy Assessment Framework at the Micro Level. Comput. Chem. Eng. 2022, 160, 107697. [Google Scholar] [CrossRef]
  49. ITACA. ITACA Protocol: Tools for Evaluating Environmental and Energy Sustainability of Buildings. Available online: https://itaca.org/nuovosito/area_sostenibilita.asp (accessed on 22 June 2026).
  50. Satyanaga, A.; Rahardjo, H.; Koh, Z.H.; Mohamed, H. Measurement of a Soil-Water Characteristic Curve and Unsaturated Permeability Using the Evaporation Method and the Chilled-Mirror Method. J. Zhejiang Univ. Sci. A 2019, 20, 368–374. [Google Scholar]
  51. Dodge, M.; Stinson, C. Microsoft Office Excel 2007 Inside Out; Microsoft Press: Redmond, WA, USA, 2007. [Google Scholar]
  52. Satyanaga, A.; Bairakhmetov, N.; Kim, J.R.; Moon, S.W. Role of Bimodal Water Retention Curve on the Unsaturated Shear Strength. Appl. Sci. 2022, 12, 1266. [Google Scholar] [CrossRef]
  53. Bal, M.; Bryde, D.; Fearon, D.; Ochieng, E. Stakeholder Engagement: Achieving Sustainability in the Construction Sector. Sustainability 2013, 5, 695–710. [Google Scholar] [CrossRef]
  54. Karaca, F.; Guney, M.; Kumisbek, A.; Kaskina, D.; Tokbolat, S. A New Stakeholder Opinion-Based Rapid Sustainability Assessment Method (RSAM) for Existing Residential Buildings. Sustain. Cities Soc. 2020, 60, 102155. [Google Scholar] [CrossRef]
  55. Pot, R.; Roelse, F.P.; van Der Meer, M.T.; Nushi, B.R.I.; Nelemans, J.P. The Observational Method in a Real-Time, Multi-Stakeholder Environment. In Geotechnical Safety and Risk V; IOS Press: Amsterdam, Netherlands, 2015; pp. 990–996. [Google Scholar]
  56. Munaro, M.R.; Tavares, S.F. A Review on Barriers, Drivers, and Stakeholders towards the Circular Economy: The Construction Sector Perspective. Clean. Responsible Consum. 2023, 8, 100107. [Google Scholar] [CrossRef]
  57. Deamer, L.; Lee, J.; Mulheron, M.; De Waele, J. Building Sustainability Impacts from the Bottom up: Identifying Sustainability Impacts throughout a Geotechnical Company. Sustainability 2021, 13, 11981. [Google Scholar] [CrossRef]
  58. Toochukwu, A.C. Sustainable Construction Practices: Balancing Cost Efficiency, Environmental Impact, and Stakeholder Collaboration. Int. Res. J. Mod. Eng. Technol. Sci. 2025, 7, 4118–4140. [Google Scholar] [CrossRef]
  59. Rahardjo, H.; Nio, A.S.; Leong, E.C.; Song, N.Y. Effects of Groundwater Table Position and Soil Properties on Stability of Slope during Rainfall. J. Geotech. Geoenviron. Eng. 2010, 136, 1555–1564. [Google Scholar] [CrossRef]
  60. Dair, C.M.; Williams, K. Sustainable Land Reuse: The Influence of Different Stakeholders in Achieving Sustainable Brownfield Developments in England. Environ. Plan. A 2006, 38, 1345–1366. [Google Scholar] [CrossRef]
  61. Du, J.; Wang, W.; Gao, X.; Hu, M.; Jiang, H. Sustainable Operations: A Systematic Operational Performance Evaluation Framework for Public–Private Partnership Transportation Infrastructure Projects. Sustainability 2023, 15, 7951. [Google Scholar] [CrossRef]
  62. Shohet, I.M.; Levi, S.; Zeibak-Shini, R.; Shahin, F. Performance-Based Maintenance and Operation of Multi-Campus Critical Infrastructure Facilities Using Supply Chain Multi-Choice Goal Programming. Appl. Sci. 2025, 15, 11161. [Google Scholar] [CrossRef]
  63. Alghamdi, A. Sustainable Practices in Construction Management and Environmental Engineering: A Review. Sustainability 2025, 17, 10027. [Google Scholar] [CrossRef]
  64. Ghufran, M.; Khan, K.I.A.; Ullah, F.; Nasir, A.R.; Al Alahmadi, A.A.; Alzaed, A.N.; Alwetaishi, M. Circular Economy in the Construction Industry: A Step towards Sustainable Development. Buildings 2022, 12, 1004. [Google Scholar] [CrossRef]
  65. Dehghanian, K. A Circular Management Model for Sustainable and Resilient Geotechnical Infrastructure. Discov. Appl. Sci. 2026, 8, 576. [Google Scholar] [CrossRef]
  66. Kibert, C.J. Sustainable Construction: Green Building Design and Delivery; John Wiley & Sons: Hoboken, NJ, USA, 2016. [Google Scholar]
  67. Panagiotakis, I.; Dermatas, D. New European Union Soil Strategy: A Potential Worldwide Tool for Sustainable Waste Management and Circular Economy. Waste Manag. Res. 2022, 40, 245–247. [Google Scholar] [CrossRef] [PubMed]
  68. Grant, A.; Ries, R. Impact of Building Service Life Models on Life Cycle Assessment. Build. Res. Inf. 2013, 41, 168–186. [Google Scholar] [CrossRef]
  69. Sang, C.; Yang, X.; Zhang, H.; Zhang, C.; Zhu, M.; Li, X.; Jia, Y.; Nie, Y.; Dong, J.; Xia, F. Integrating Environmental Footprint Analysis and Analytic Hierarchy Process for Sustainable Decision-Making for in Situ Groundwater Remediation. J. Clean. Prod. 2026, 543, 147625. [Google Scholar] [CrossRef]
Figure 1. Schematic representation of GeoBarrier System (GBS).
Sustainability 18 06771 g001
Figure 2. (a) Soil–water characteristic curves (SWCCs) of capillary barrier materials; (b) permeability functions of capillary barrier materials.
Sustainability 18 06771 g002
Figure 3. Schematic of the capillary barrier mechanism.
Sustainability 18 06771 g003
Figure 4. Overview map of Site A, Singapore.
Sustainability 18 06771 g004
Figure 5. Location of the GBS slope in Site A.
Sustainability 18 06771 g005
Figure 6. Cross-section of GBS used in numerical analysis. (a) Seepage analysis using SEEP/W; (b) slope stability analysis using SLOPE/W.
Sustainability 18 06771 g006
Figure 7. Grain-size distribution curves of original soil and GBS materials.
Sustainability 18 06771 g007
Figure 8. Soil–water characteristic curves (SWCCs) of original soil and GBS materials.
Sustainability 18 06771 g008
Figure 9. Permeability function of original soil and GBS materials.
Sustainability 18 06771 g009
Figure 10. Pore-water pressure contours (a) at t = 0 day (before rainfall started) and (b) at t = 1 day (at the end of rainfall).
Sustainability 18 06771 g010
Figure 11. Factor of safety (FOS) of a slope with GBS.
Sustainability 18 06771 g011
Figure 12. Rainfall infiltration into GBS layers.
Sustainability 18 06771 g012
Table 1. Index properties of the original soil and the GBS materials.
DescriptionASMFine Recycled Concrete Aggregate (FRCA)Coarse Recycled Concrete Aggregate (CRCA)Original Soil
USCS **SCSPGPCH
Specific gravity, GS2.412.572.662.67
Gravel content (%)0 32
Sand (%)7601005
Silt (%)8100047
Clay (%)160017
Liquid Limit, LL (%)16NA *NA31
Plastic Limit, PL (%)41NANA52
Plasticity Index, PI (%)25NANA21
Dry density, ρ d (mg/m3)1.181.671.571.37
* NA = not applicable ** Unified Soil Classification System (USCS).
Table 2. Shear strength parameters of the original soil and the GBS materials.
ParameterASMFine Recycled Concrete Aggregate (FRCA)Coarse Recycled Concrete Aggregate (CRCA)Original Soil
Unit weight (kN/m3)18161717
Effective cohesion (kPa)2002
Effective friction angle (o)30384228
ϕb angle (o)15192114
Table 3. The volume of materials present within GBS.
MaterialsMaterial TypeVolume of Single Geobag (m3)Total Volume (m3)
ASMnon-recyclable0.3099.00
Fine recycled concrete aggregate (FRCA)recyclable0.2582.50
Coarse recycled concrete aggregate (CRCA)recyclable0.1549.50
Original soil–compacted soilnon-recyclable0.40112.09
Table 4. Circularity indicator values for the GBS.
Water
Circularity (%)
Energy
Circularity (%)
Material
Circularity (%)
Waste
Circularity (%)
Site Quality
%Water Inflow%Water OutflowRenewable
Energy
Total
Energy
Vre (m3)Vtotal (m3)Vtrtot (m3)Vstot (m3)A (m2)Bi (m2)Bii (m2)Biii (m2)Biv (m2)
10900100132343.09244.09560.991371.280343.011028.270
Score50Score0Score38.47Score43.51Score2.25
Disclaimer/Publisher’s Note: The statements, opinions and data contained in all publications are solely those of the individual author(s) and contributor(s) and not of MDPI and/or the editor(s). MDPI and/or the editor(s) disclaim responsibility for any injury to people or property resulting from any ideas, methods, instructions or products referred to in the content.