1. Introduction
Since the mid-20th century, the polarization effects of urbanization have caused widespread rural decline and urban expansion [
1,
2]. Academic discourse has shifted from a unidirectional “rural support for cities” model [
3] to frameworks that emphasize functional complementarity and spatial symbiosis [
4,
5]. China’s urban–rural integration strategy goes beyond previous policies by promoting two-way factor flows, functional complementarity, and institutional synergy [
6,
7,
8,
9], with the aim of achieving sustainable integration of land, economy, society, and environment [
10,
11,
12].
Urban–rural integration is essentially a spatial restructuring of the human–land relationship [
13]. Wu Chuanjun’s theory of the regional system of the human–land relationship views human society and the geographical environment as a dynamic, coupled structure [
14]. Recently, building on this theory, scholars have developed conceptual frameworks such as the rural regional system and the urban–rural integration system [
15], emphasizing that cities and rural areas function as coupled subsystems whose sustainable development depends on human–land coordination [
16,
17,
18,
19]. However, coupling has a threshold effect; beyond critical values, degradation replaces coordination [
20,
21]. Achieving coordination is especially critical in ecologically fragile regions with scarce geographic capital [
22].
Existing studies have measured urban–rural environment coupling using the entropy method and the coupled coordination degree model [
23,
24,
25,
26] and have identified driving factors via regression analysis, Geodetector, and Grey relational analysis [
27,
28,
29,
30]. Research subjects have focused primarily on coastal cities and eastern plain regions [
31,
32,
33,
34]. The Pressure-State-Response (PSR) framework [
35] and its derivatives provide a classic paradigm for deconstructing causal chains between human activities and the environment [
36]. However, these frameworks assume linear transmission and treat information flows as secondary, posing adaptability challenges in the digital age [
37]. In recent years, the enabling effects of digital technologies on urban and rural development have gradually emerged as a research frontier [
38,
39]. Existing research indicates that digital infrastructure can reshape regional spatial structures by reducing transaction costs and overcoming spatiotemporal barriers, and that the development of digital villages has a significant promotional effect on rural industrial integration [
40,
41]. Yet most studies treat digital elements as general drivers, lacking theoretical refinement on how digital technologies might compensate for geographic capital deficits in ecologically fragile areas.
Existing research on karst mountainous areas has focused on rocky desertification control [
42,
43], ecological resettlement [
44], and land use monitoring [
45]. The fundamental contradiction in southwestern karst regions is resource constraints arising from population–land tension and fragmented topography [
46]. Some recent studies have examined coupling between rural settlement restructuring and land use transformation [
47] or between urban–rural integration and rural resilience [
48]. However, existing work shows a divergence between ecological conservation and urbanization pathways. Few studies integrate urban–rural development and environmental carrying capacity into a unified system for long-term tracking, especially under overlapping multiple strategies in karst areas. Located in the core karst landscape of the Yungui Plateau [
49], Guiyang faces rigid spatial constraints due to fragmented topography and arable land scarcity. As a National Big Data Comprehensive Pilot Zone and ecological civilization model city, Guiyang has undergone human–land restructuring under multiple strategic initiatives over two decades. At the same time, the coexistence of rapid digital economic development and strict ecological red lines makes it possible to examine how digital technologies reduce spatial and temporal distances and how early environmental governance influences the trajectory of human–land coordination. Therefore, by establishing a comprehensive evaluation system that encompasses urban and rural development as well as environmental support, and by constructing an integrated ‘evolution–mechanism–space’ analytical chain combining the entropy method, the coupled coordination degree model, Grey relational analysis, Geodetector, and multi-source spatial analysis methods, we go beyond the common practice of using these methods separately and enable a systematic understanding of how temporal evolution translates into spatial responses. Theoretically, we reveal an ‘early governance’ pathway for the human–land system in karst mountainous areas, which deviates from the classic environmental Kuznets curve (EKC). Unlike plain regions that often experience a ‘pollute first, treat later’ trajectory, Guiyang initiated intensive ecological governance as early as 2012, when the coupling coordination degree had not yet reached 0.6, thereby avoiding severe environmental degradation. Moreover, we identify a two-factor enhancement effect between digital technology and other driving factors, extending the traditional PSR framework into the digital era. Practically, we quantify the topographic constraints on construction land expansion in karst areas: expansion is concentrated on 0–6° gentle slopes and 1000–1400 m mid-elevation zones, overlapping with high-quality farmland, while steep slopes (>25°) and high-altitude areas are strictly protected. We also discover a ‘semi-decoupling’ phenomenon between economic growth and new land occupation, with a synchronization rate of only 50%. These findings provide spatially explicit guidance for urban–rural integration governance in similar mountainous regions.
2. Materials and Methods
2.1. Theoretical Framework
This study is grounded in Wu Chuanjun’s theory of the human–land relationship system [
14] and the urban–rural integration theories of Liu Yansui [
13] and Fang Chuanglin [
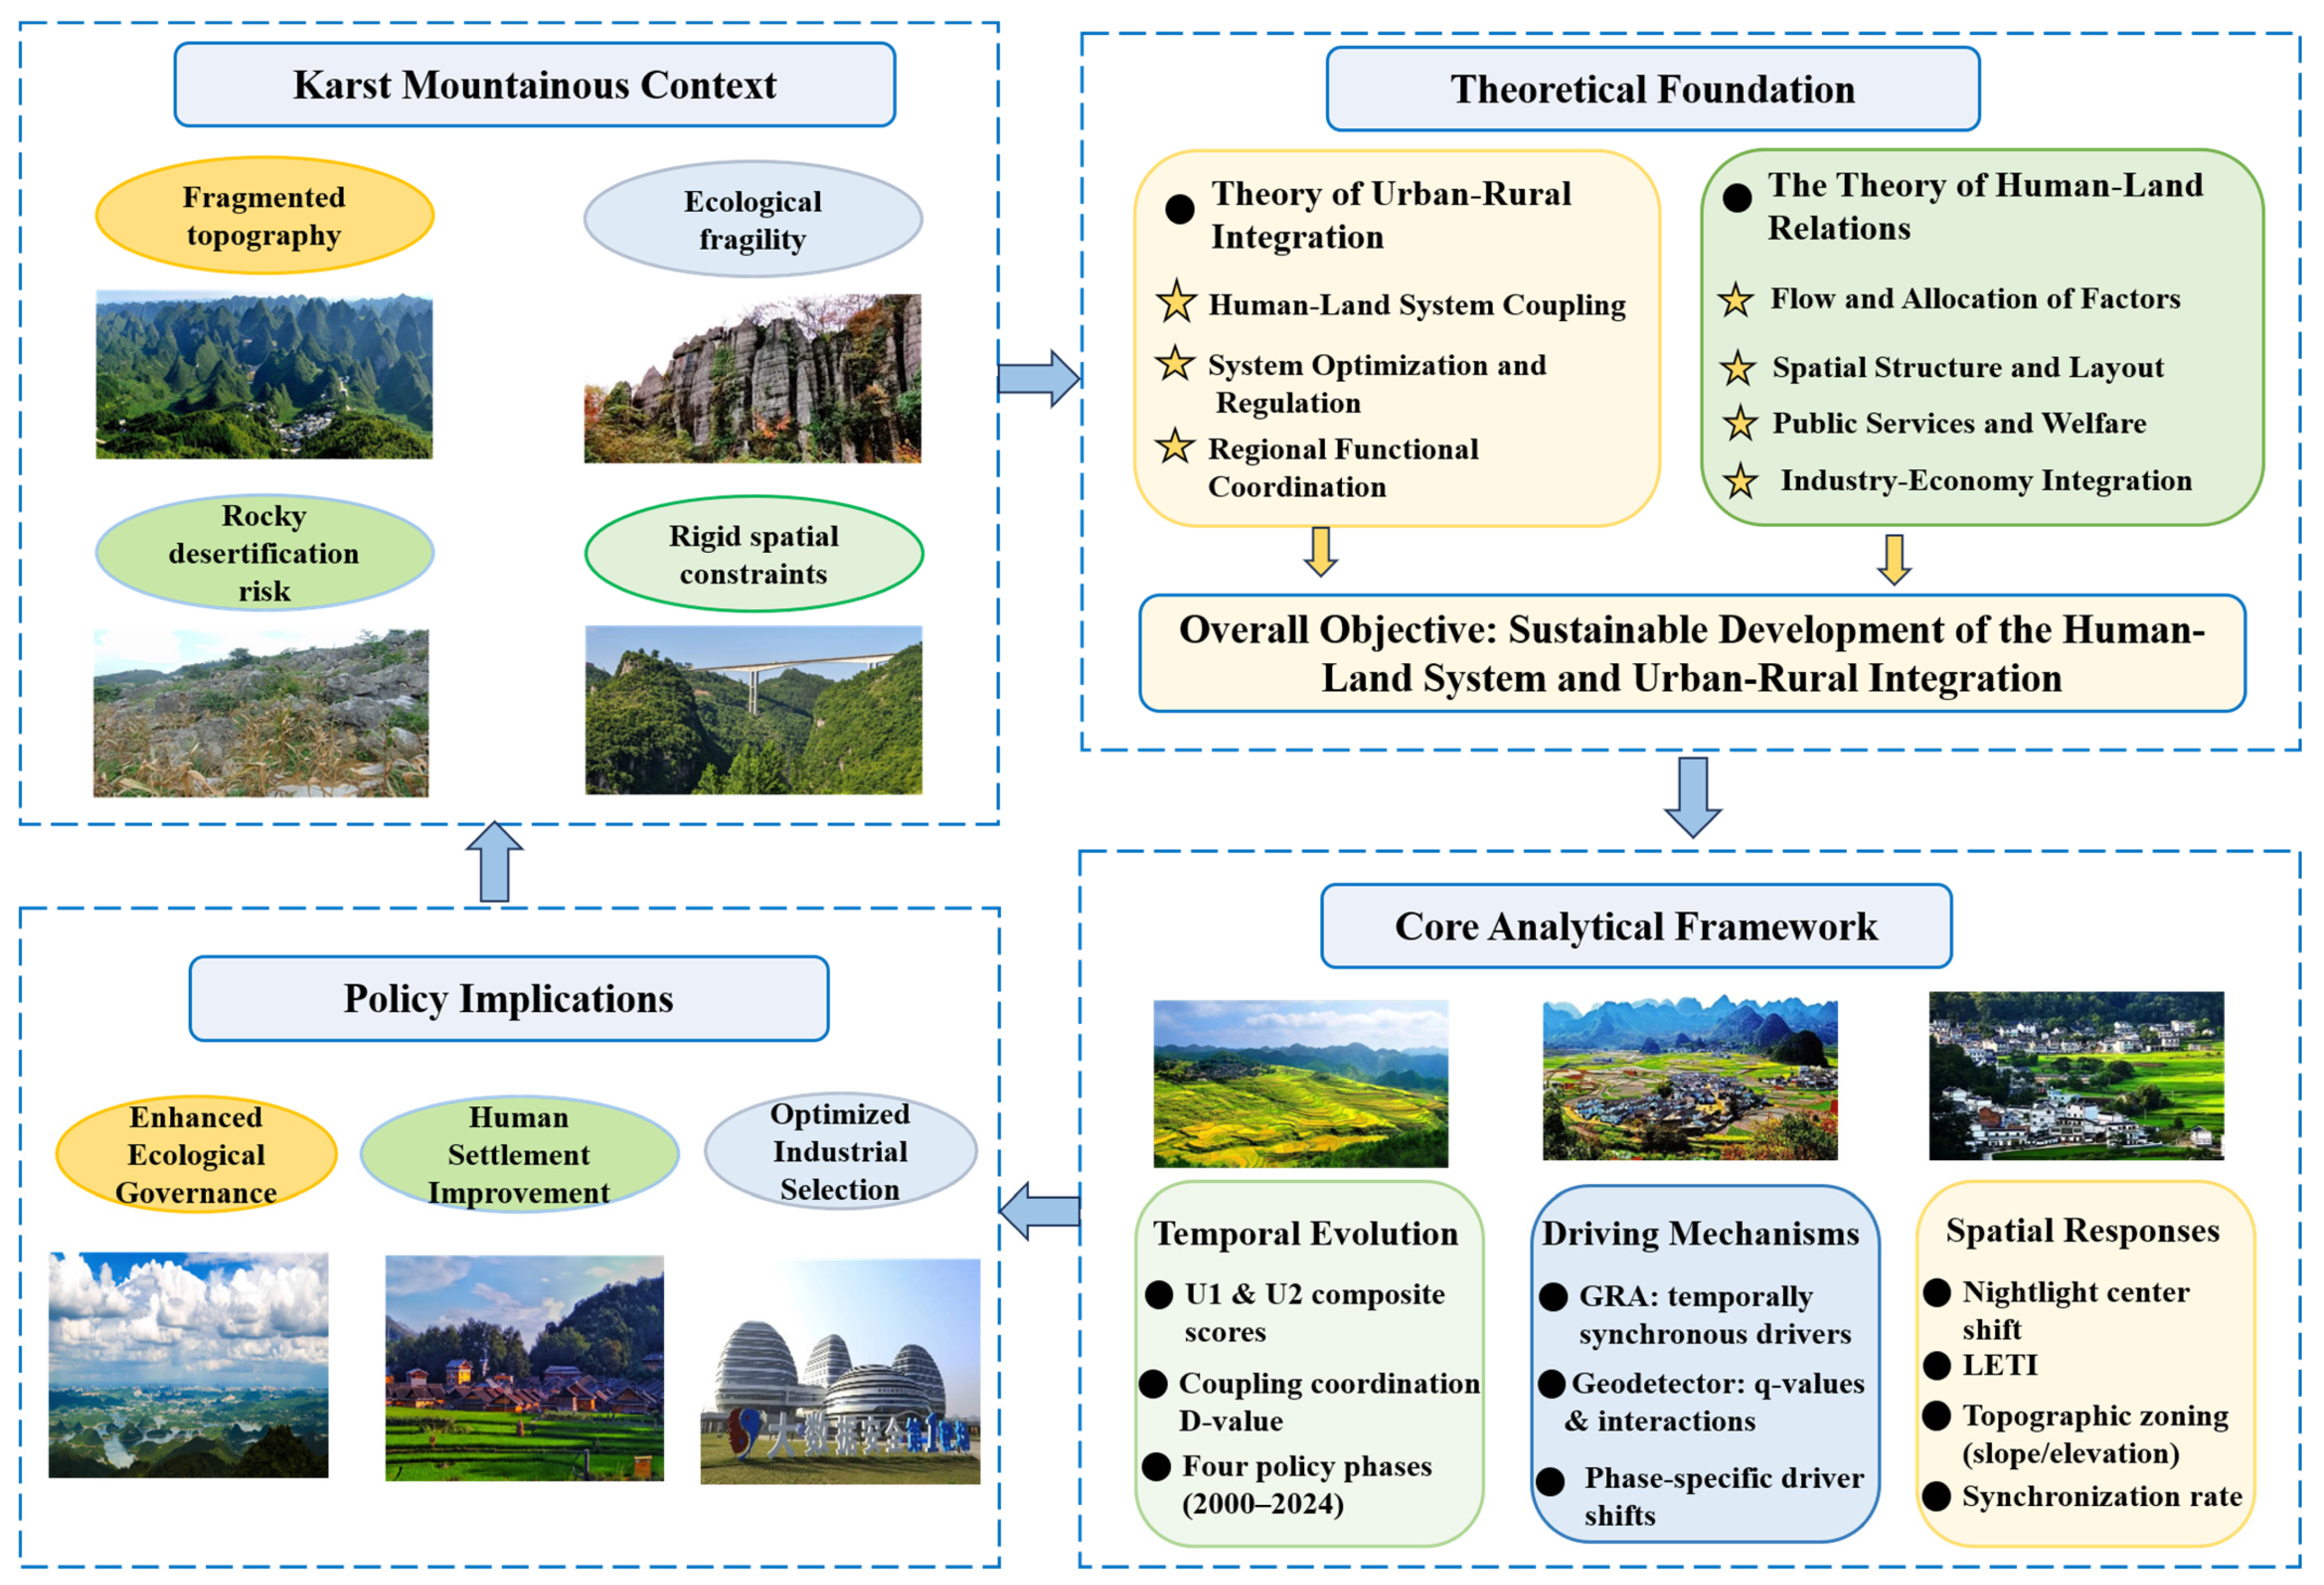
50], which collectively inform an overall objective: sustainable development of the human–land system and urban–rural integration. In response to the karst mountainous context, characterized by fragmented topography, ecological fragility, rocky desertification risk, and rigid spatial constraints imposed by ecological red lines. To systematically examine how the human–land system evolves, what drives its changes, and how these changes manifest spatially, a three-stage analytical chain is constructed that links temporal evolution, driving mechanisms, and spatial responses (
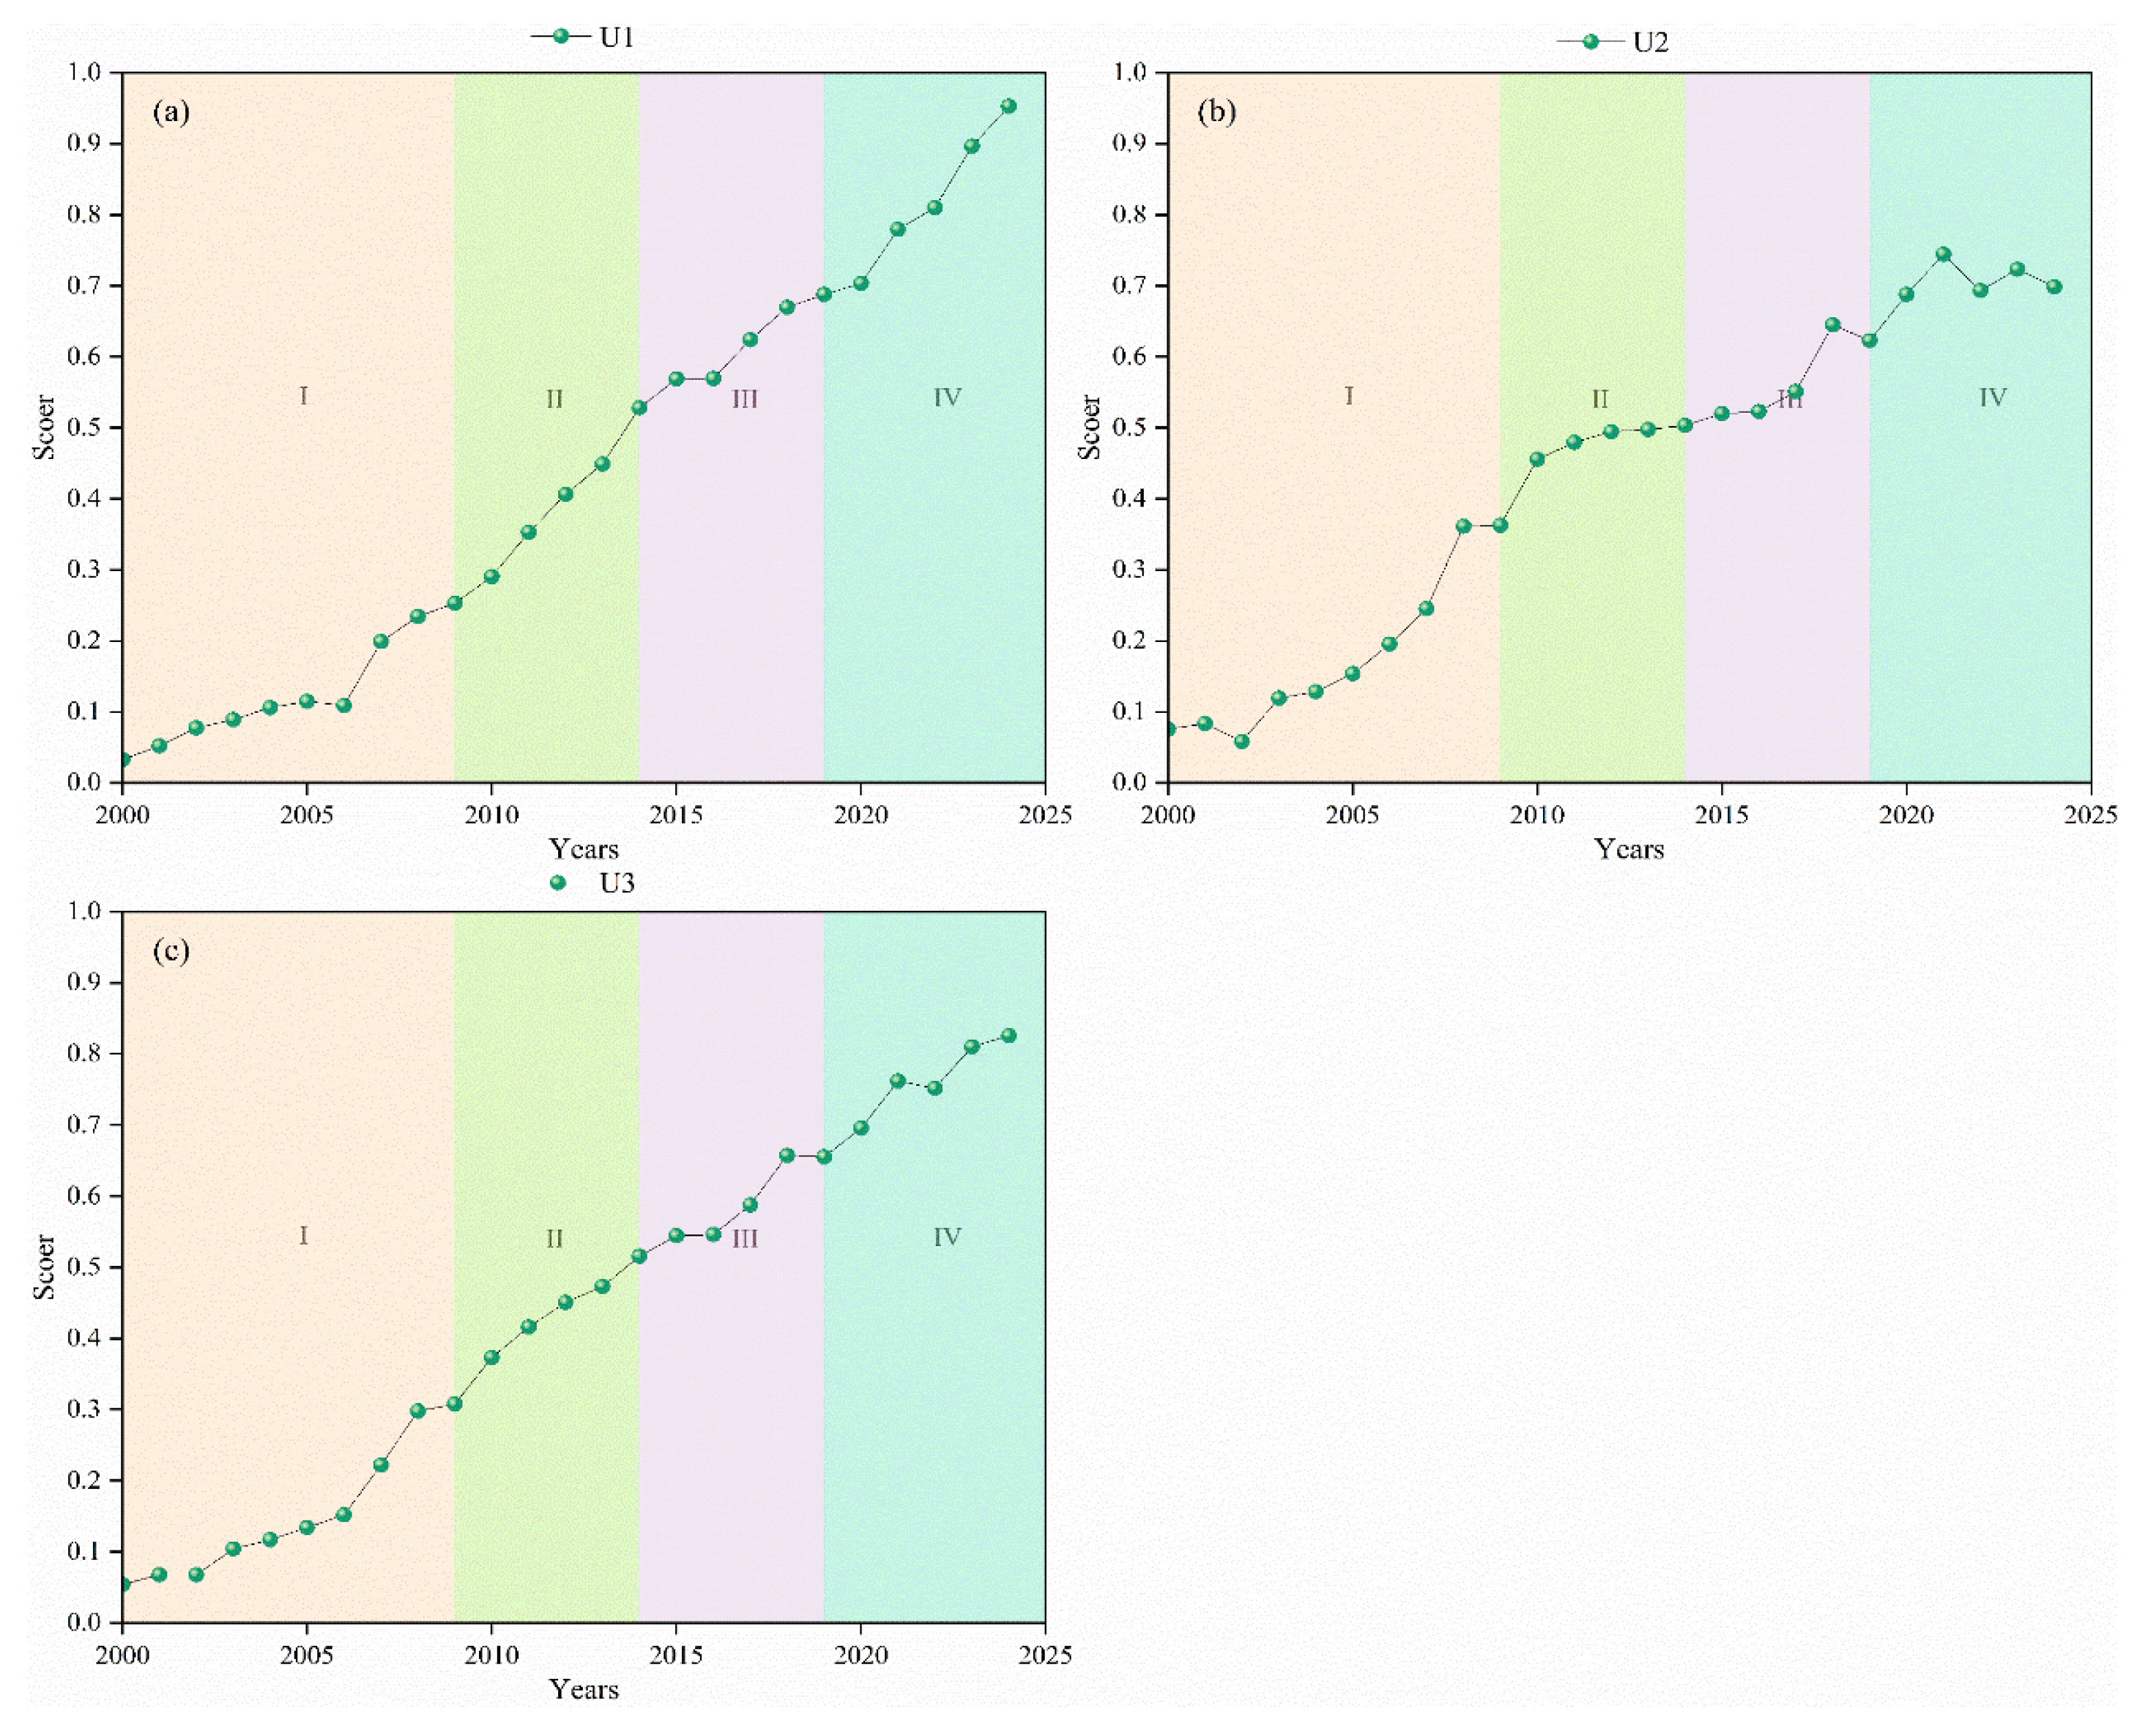
Figure 1). The first stage calculates the composite scores of urban–rural development (U1) and environmental support (U2), together with the coupling coordination D-value, over the period 2000–2024, which is divided into four policy phases. The second stage applies Grey relational analysis to identify temporally synchronous drivers and Geodetector (Excel version,
http://www.geodetector.cn/) to quantify the explanatory power of individual factors and their interactions, thereby revealing phase-specific shifts in the dominant drivers. The third stage maps spatial responses through nightlight center migration, land use ecological transition index, topographic zoning, and synchronization rate between economic activity and construction expansion. The findings ultimately support policy implications tailored to karst regions, including enhanced ecological governance, human settlement improvement, and optimized industrial selection.
2.2. Study Area
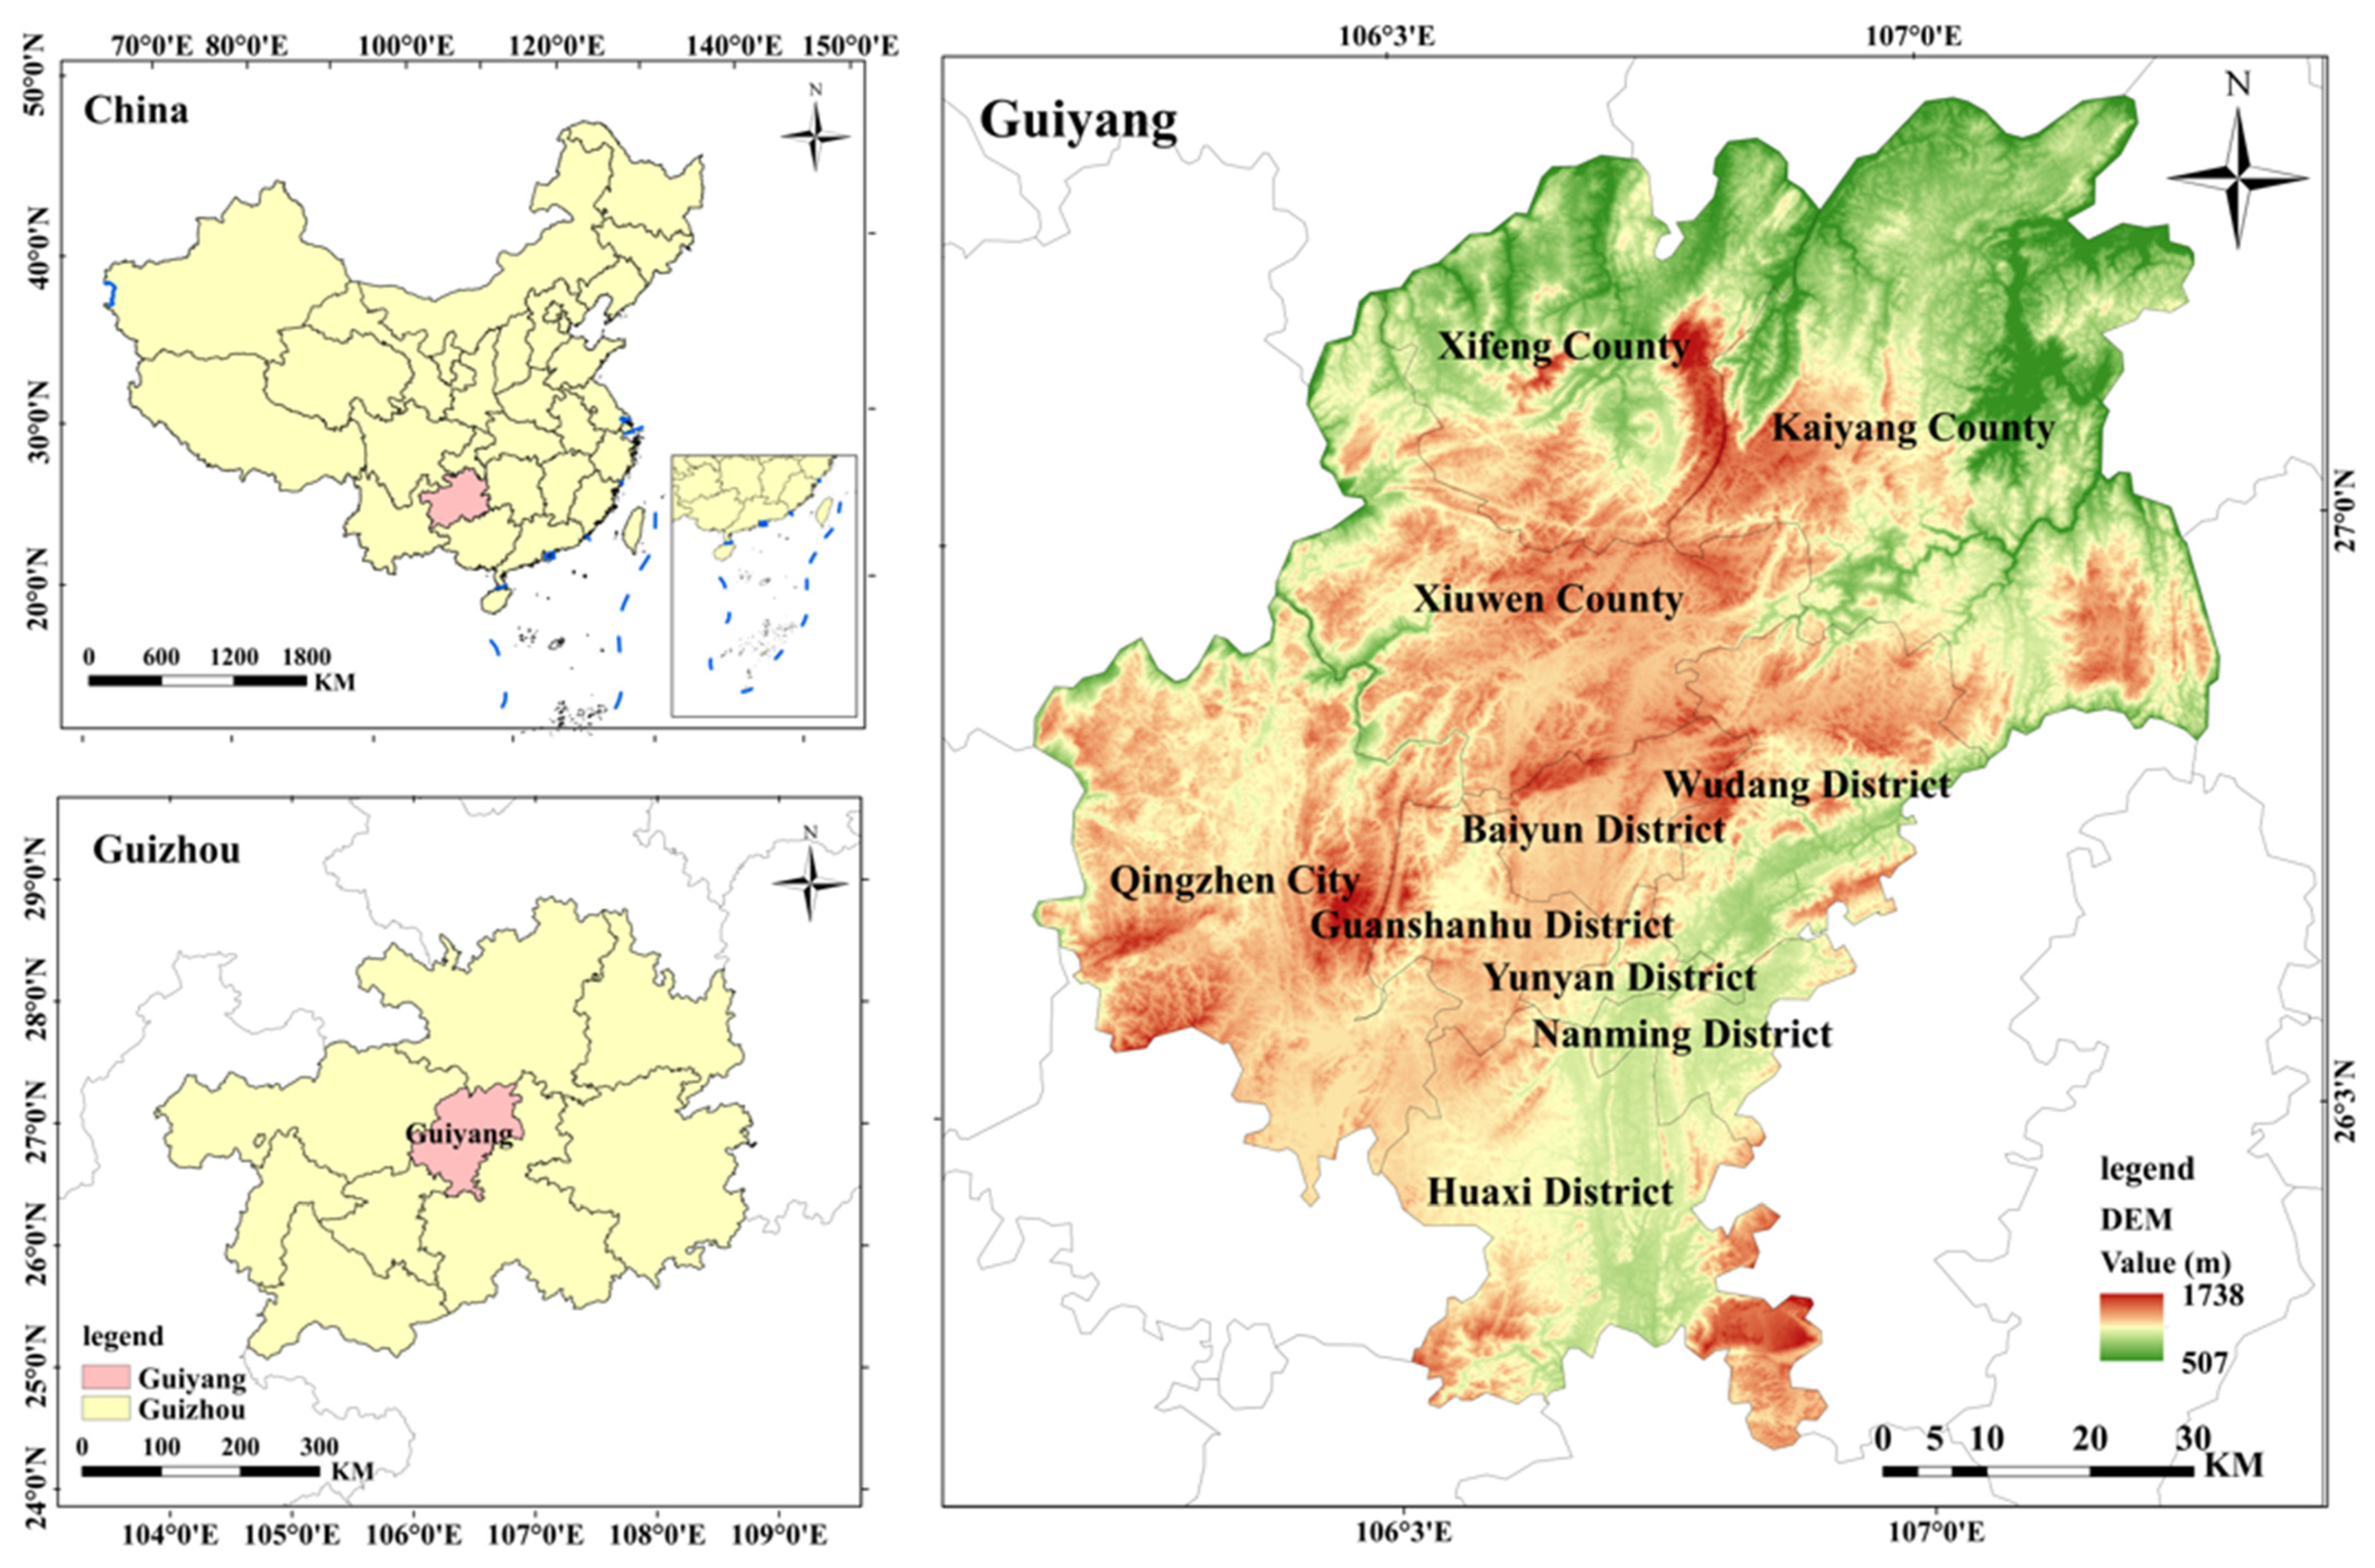
Guiyang is a typical karst mountainous city in southwest China, covering an area of 8034 km
2, with over 85% of its terrain consisting of karst landforms and an average elevation of 1100 m (
Figure 2). It administers six urban districts, three counties, and one county-level city, with an urbanization rate exceeding 80% in 2023. Urban and rural construction land is concentrated within a limited basin area, imposing strict spatial constraints on the evolution of human settlements and land use. Rural areas, isolated by topography and lacking adequate infrastructure and public services, exhibit a marked urban–rural divide. Since 2000, Guiyang has implemented multiple overlapping initiatives, including the Western Development Strategy, the National Big Data Comprehensive Pilot Zone, the National Ecological Civilization Model City, and the “Provincial Capital Enhancement” initiative. This makes it an ideal case study for examining the relationship between geographical constraints and integrated urban–rural development.
2.3. Data Sources and Preprocessing
This study established a multi-source data system covering the period from 2000 to 2024, including socioeconomic statistics, remote sensing imagery, and basic geographic information (
Table 1).
Indicator data were drawn from the Guiyang and Guizhou Statistical Yearbooks (2001–2025). Missing values in trend indicators were imputed using linear regression, while missing values in volatility indicators were estimated using provincial growth rates. Negative indicators were normalized.
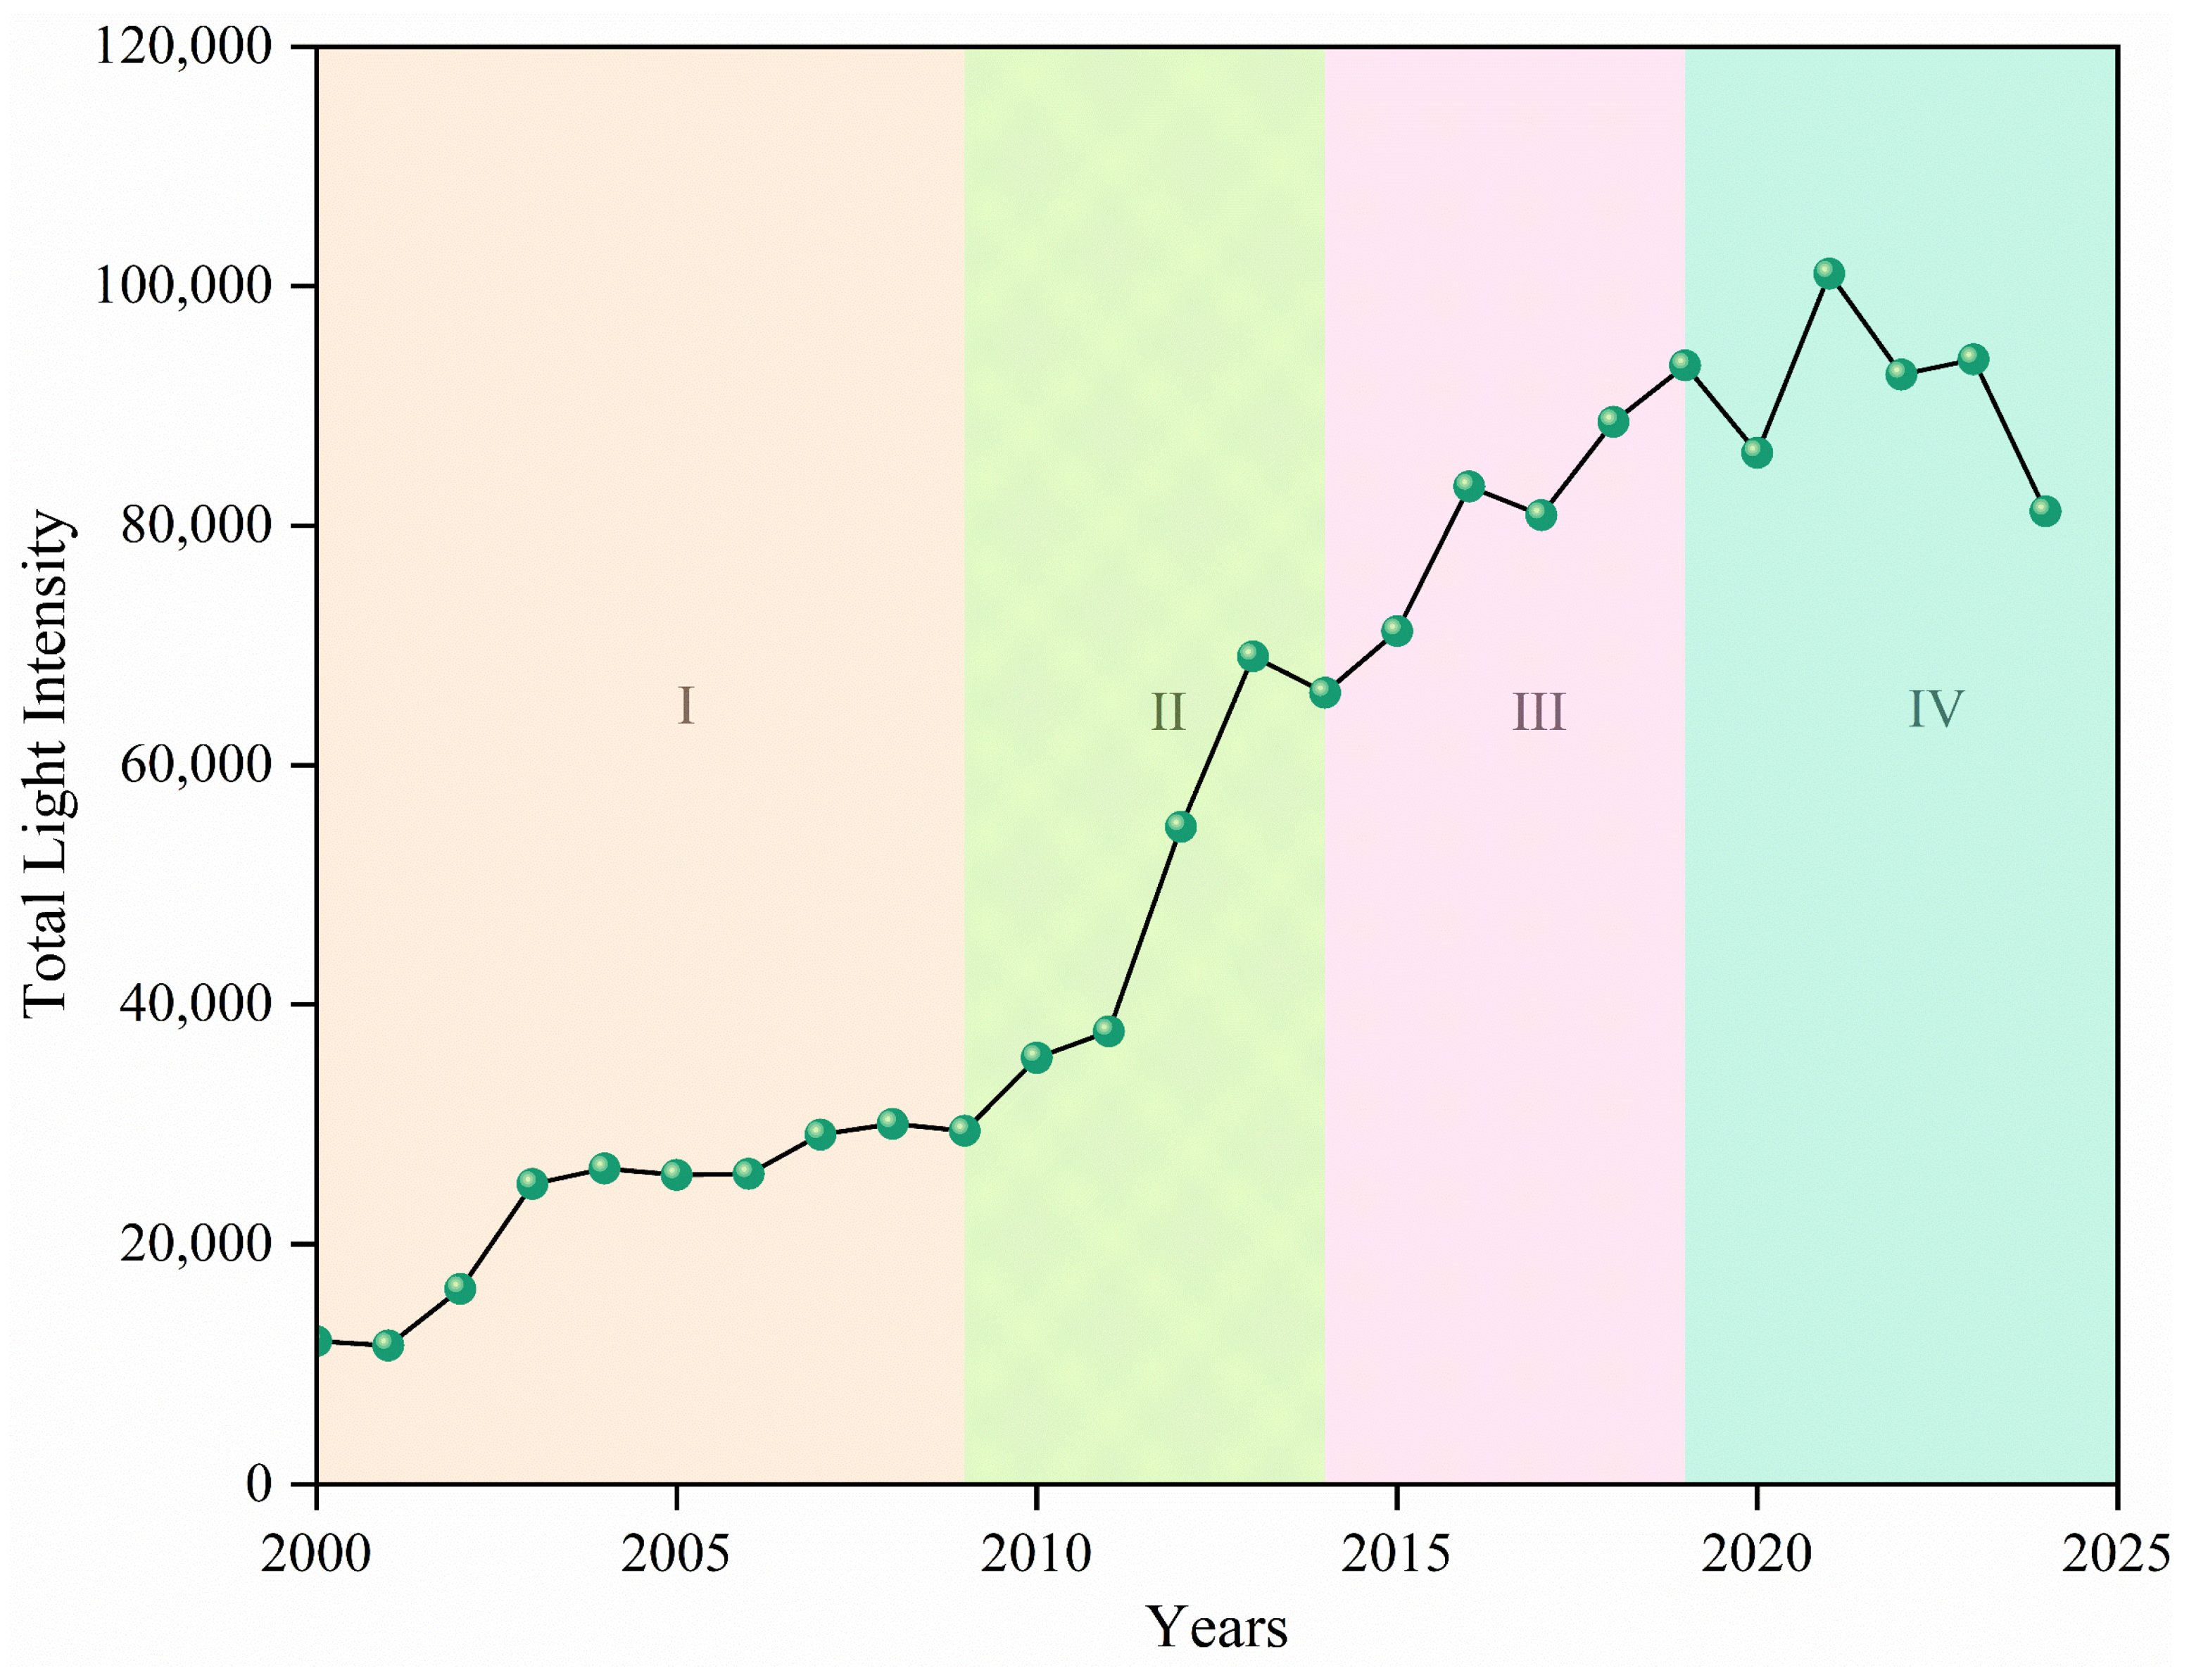
Nighttime light data were sourced from the “China Regional Extended-Time-Series NPP-VIIRS-like Artificial Nighttime Light Dataset (1986–2024)” released by the National Qinghai–Tibet Plateau Science Data Center [
51]. Annual light images for Guiyang (2000–2024) were extracted and total and average light values were calculated. Data validity was verified using Pearson and Spearman correlation (
Section 3.5.1).
Land use data (30 m resolution) for 2000, 2005, 2010, 2015, and 2020 were obtained from the Chinese Academy of Sciences (
www.resdc.cn). The data were reclassified into six categories: built-up, cropland, forest, grassland, water, and unutilized land.
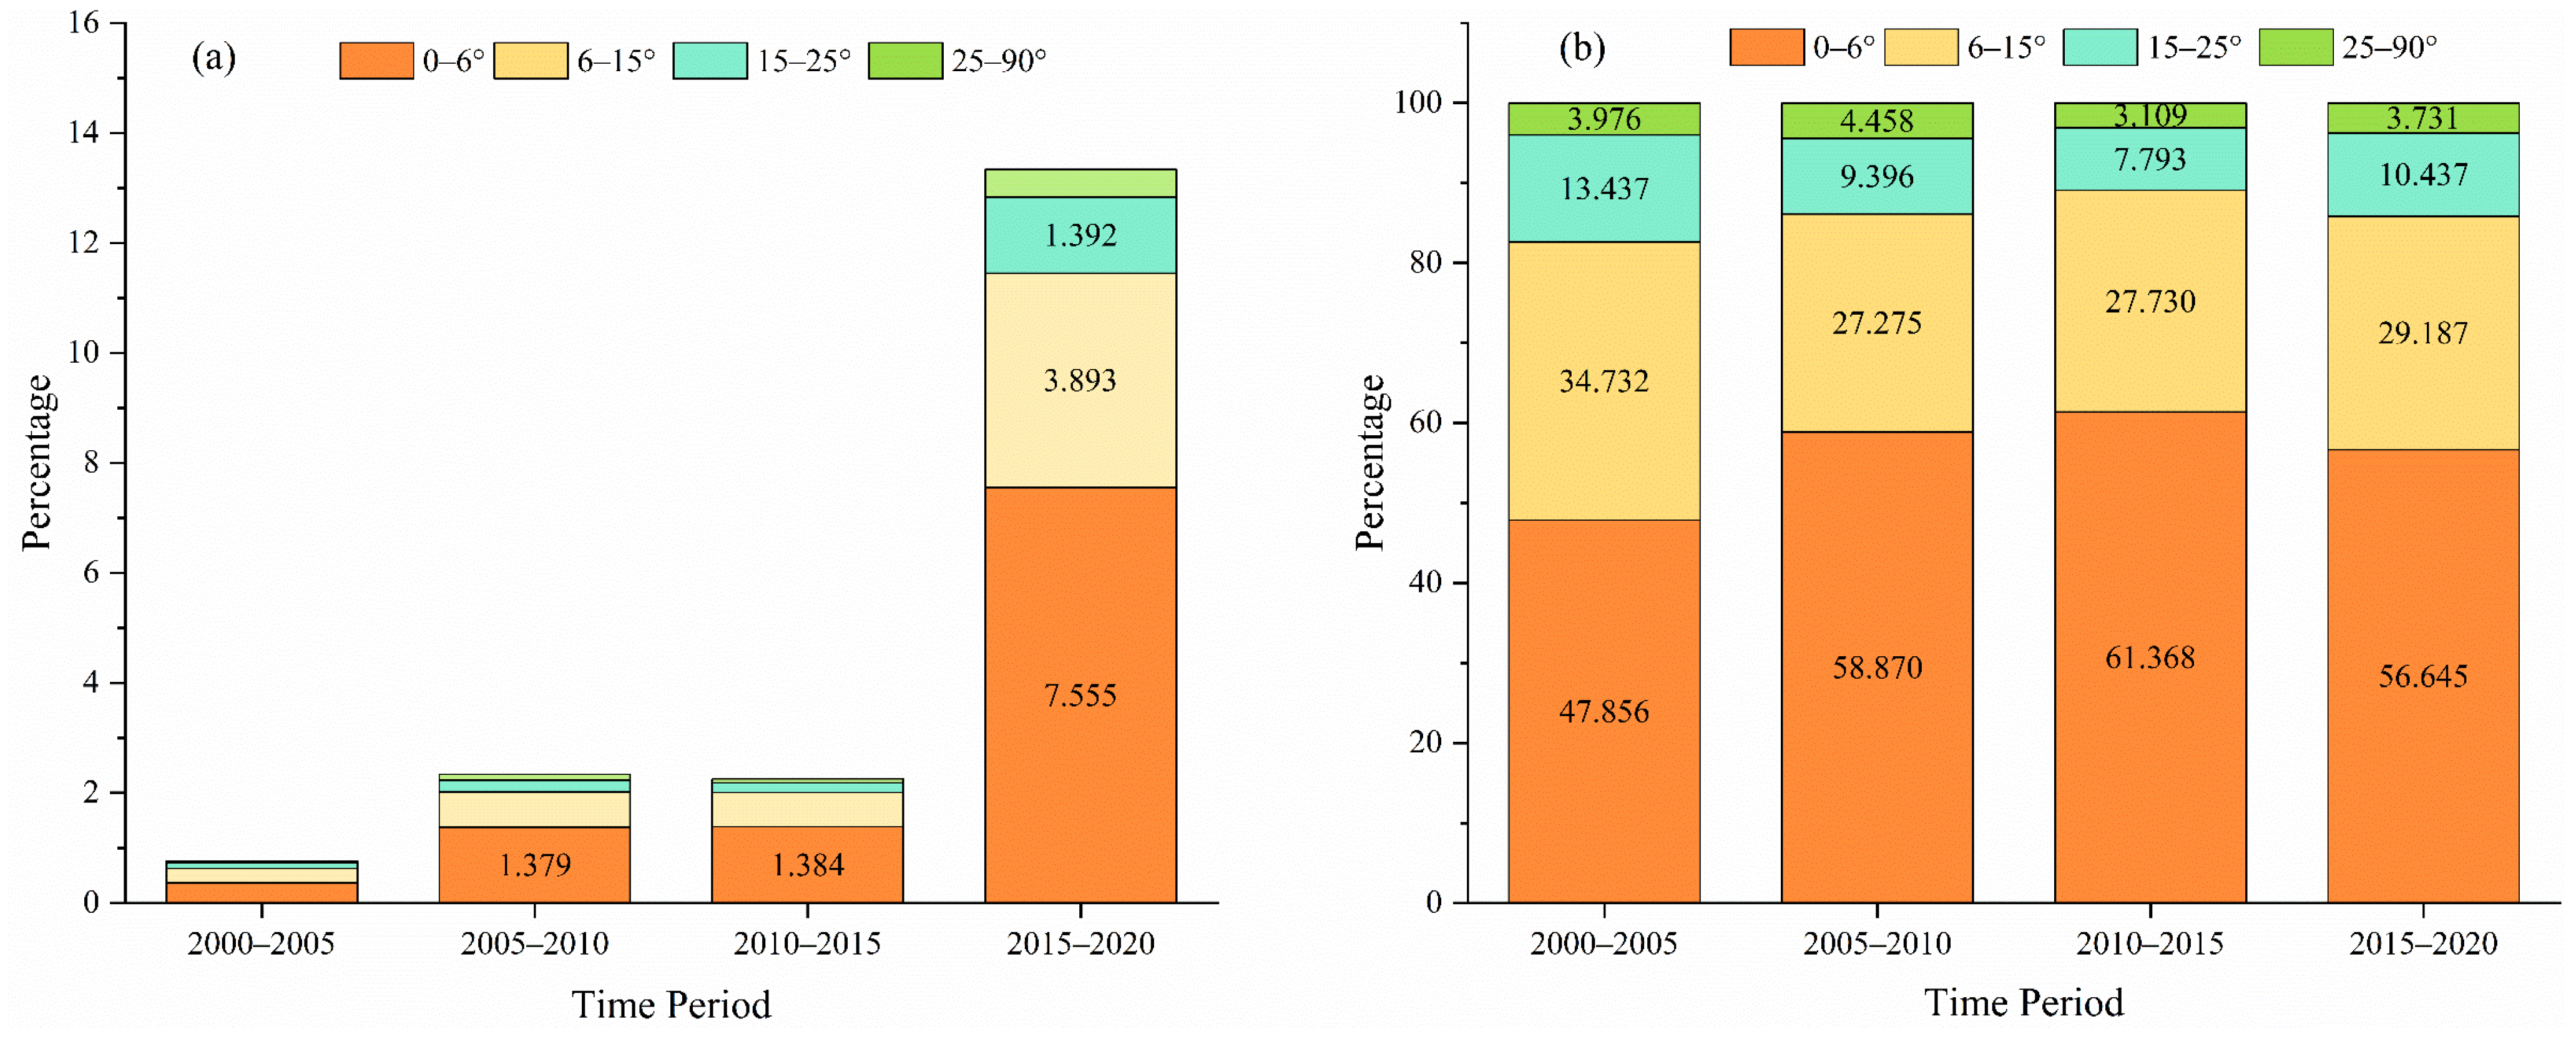
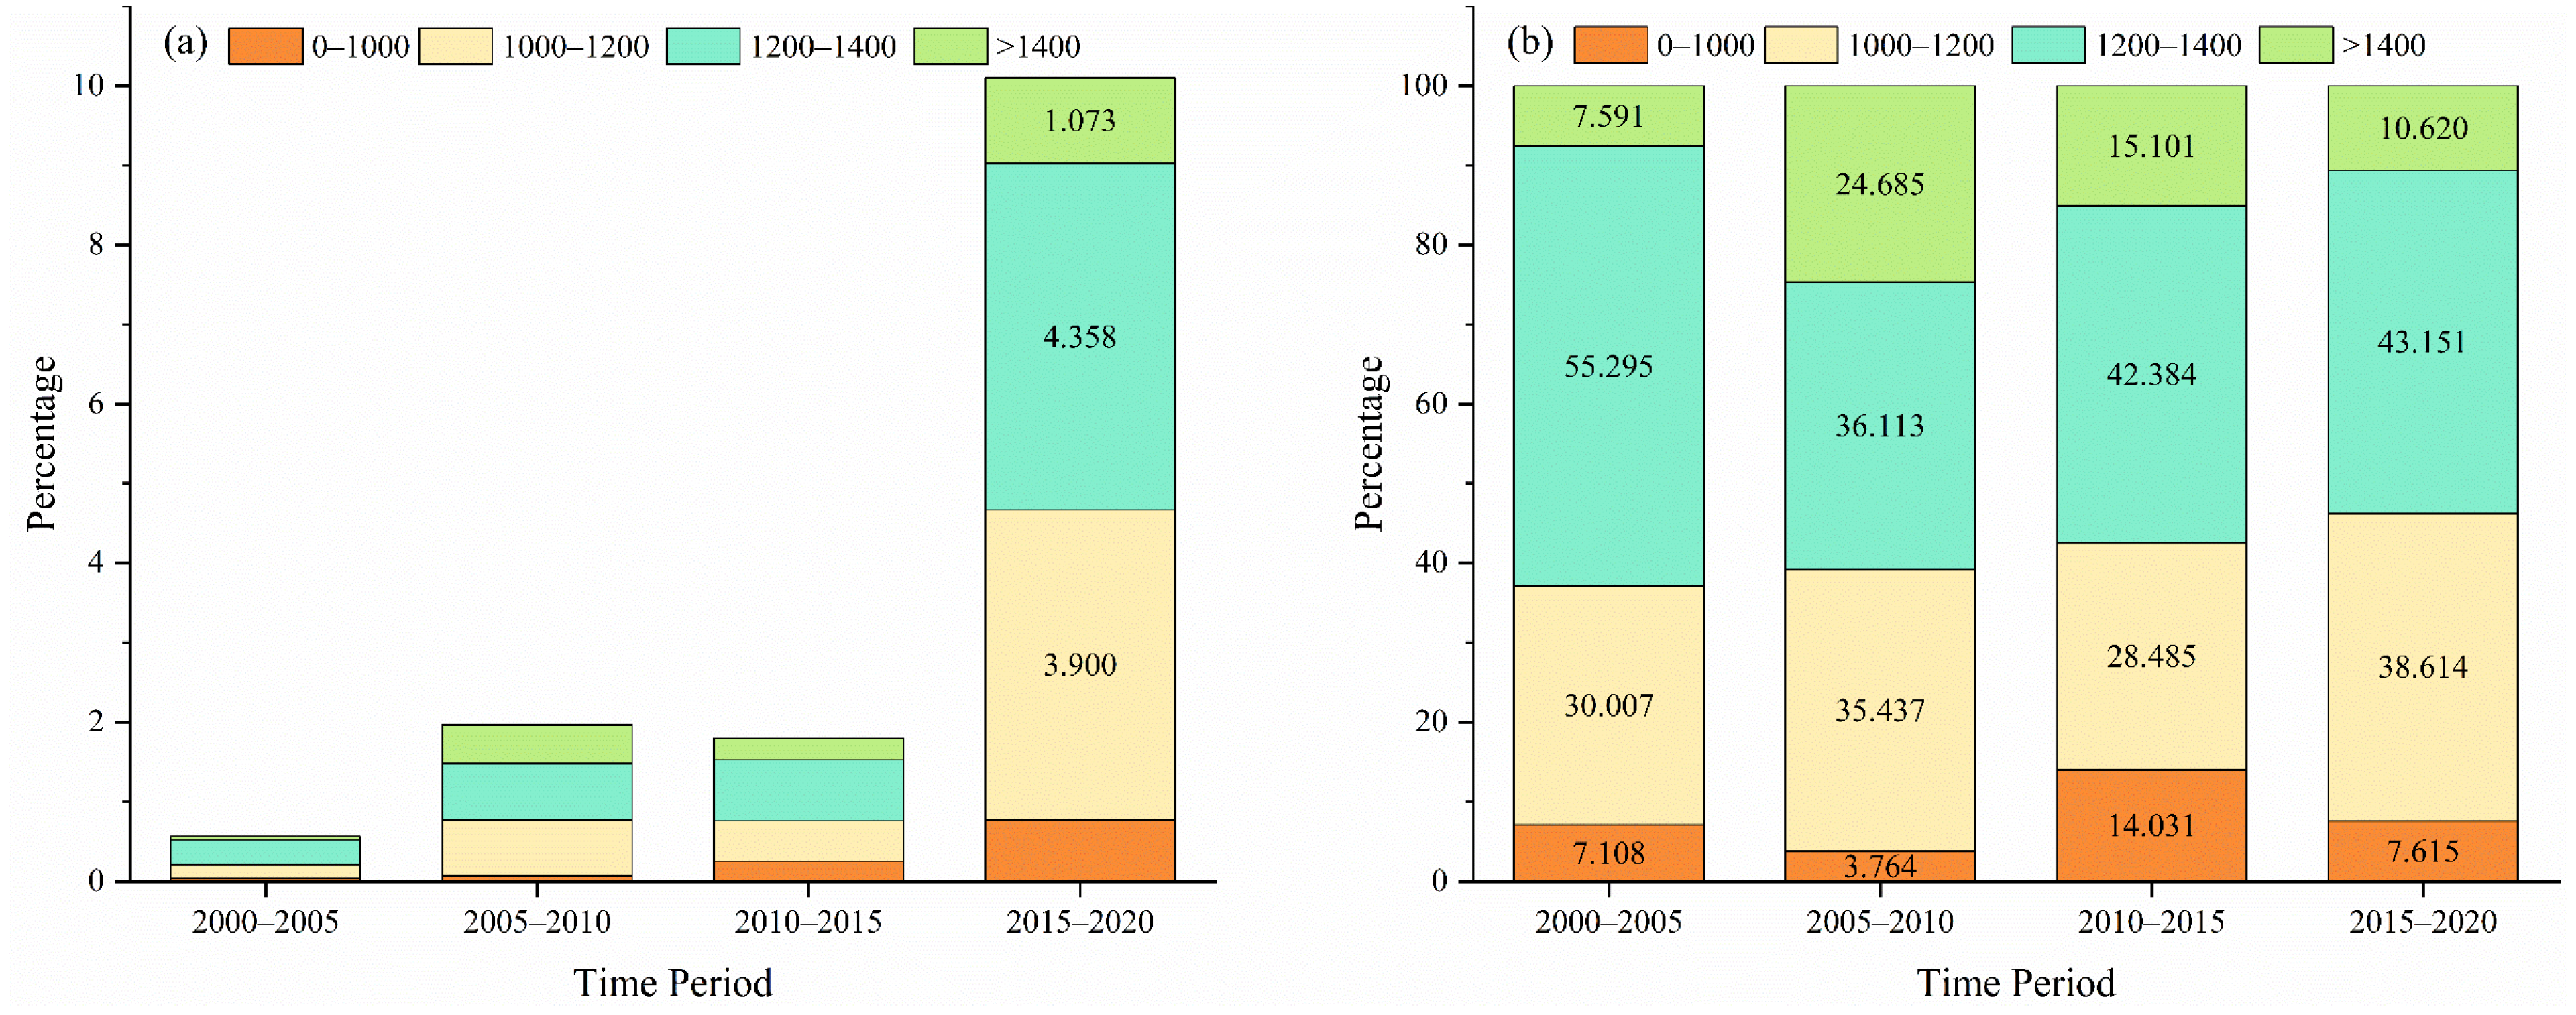
DEM data were obtained from ASTER GDEM V3 (30 m), from which slope and elevation were extracted. Slope was classified into four levels—0–6°, 6–15°, 15–25°, and >25°—with 25° serving as the threshold for restricting cultivation on steep slopes. Elevation was classified into four levels based on urban vertical differentiation: <1000 m, 1000–1200 m, 1200–1400 m, and >1400 m.
Administrative boundaries were extracted from the standard base map based on map review number GS (2024)0650. All raster data were uniformly projected to WGS 1984 UTM Zone 48N, resampled to 30 m resolution, and cropped using administrative boundaries as a mask.
2.4. Indicator System Construction
Following Wu Chuanjun’s theory of human–environment interaction [
14], we deconstruct Guiyang’s urban–rural human–land system into two target layers: urban–rural development (U1) and environmental support (U2). U1 reflects human development intensity and urban–rural integration level, while U2 reflects the karst environment’s carrying capacity and ecological constraints. The two subsystems are mutually coupled and jointly determine human–land coordination (
Table 2).
The U1 system encompasses seven dimensions, population, agricultural modernization, land and space, economy, transportation, livelihoods, and information exchange, comprising 13 indicators. The selection of indicators was based on mainstream paradigms for evaluating urban–rural integration [
50,
52], with targeted enhancements tailored to the characteristics of karst mountainous regions. Specifically, per-unit-area GDP was added to measure the economic output efficiency of scarce terraced land in basin areas; road mileage was retained to characterize transportation accessibility costs in mountainous areas; and the number of broadband internet subscribers and mobile phone users was included to capture the reshaping effect of digital technology on the flow of urban–rural factors.
The U2 system encompasses three dimensions: pollution pressure, environmental governance, and ecological foundation. On the pressure side, we select fertilizer application rates, industrial wastewater discharge, and sulfur dioxide emissions, which together constitute the primary anthropogenic environmental stresses in karst regions [
53]. On the governance side, we select the comprehensive utilization rate of solid waste, sewage treatment rates, and environmental protection investment, reflecting the intensity of environmental regulation. On the ecological foundation side, forest coverage serves as the core proxy indicator for the effectiveness of rocky desertification control [
54], supplemented by the rate of good air quality and per capita park green space area to characterize urban ecological well-being.
The indicator system presented in
Table 2 is intended for human-influenced karst landscapes where natural baseline conditions and anthropogenic pressures co-exist. In purely natural karst regions with negligible human disturbance, the system may be adapted by omitting the anthropogenic indicators (X14–X19) and retain only the natural baseline indicators (X20–X22). Hence, the full set of indicators is most appropriate for regions characterized by active human–land interactions.
2.5. Research Methods
This study comprehensively employs the entropy method, coupling coordination degree model, Grey relational analysis, Geodetector, and spatial analysis methods. Entropy method and coupling coordination degree model are used to measure the temporal evolution of the system; Grey relational analysis and Geodetector are used to identify driving mechanisms from two complementary dimensions—temporal synchrony and hierarchical explanatory power, respectively; while the shift in the center of gravity of nighttime lights, land use transition matrices, and topographic zoning statistics are employed to reveal the spatial response characteristics of coordination evolution. Through the progressive integration of these methods, an “evolution–mechanism–spatial” analytical chain is constructed.
2.5.1. Entropy Method and Coupling Coordination Degree Model
The entropy method is based on the principle of information entropy and assigns objective weights based on the dispersion of indicator data. Compared to subjective weighting methods such as the Analytic Hierarchy Process (AHP), the entropy method avoids cognitive biases introduced by expert scoring and is particularly suitable for the comprehensive evaluation of long-term, multi-indicator systems [
55]. Composite scores were calculated for U1 and U2 via data standardization, information entropy calculation, and weight determination.
Here “” is the number of indicators in the corresponding subsystem, is the weight of the jth indicator in the kth subsystem, and is the standardized indicator value.
The coupling degree (C) and coupling coordination degree (D) were introduced to measure the mutual coupling intensity and coordination level between U1 and U2:
Here, represents the coupling degree; represents the coupling coordination degree; represents the comprehensive coordination index; and and are undetermined weights that reflect the relative importance of the two subsystems. Existing research generally holds that urban–rural development and the ecological environment hold equal importance in sustainable development. and are set to 0.5.
Referring to existing studies [
56,
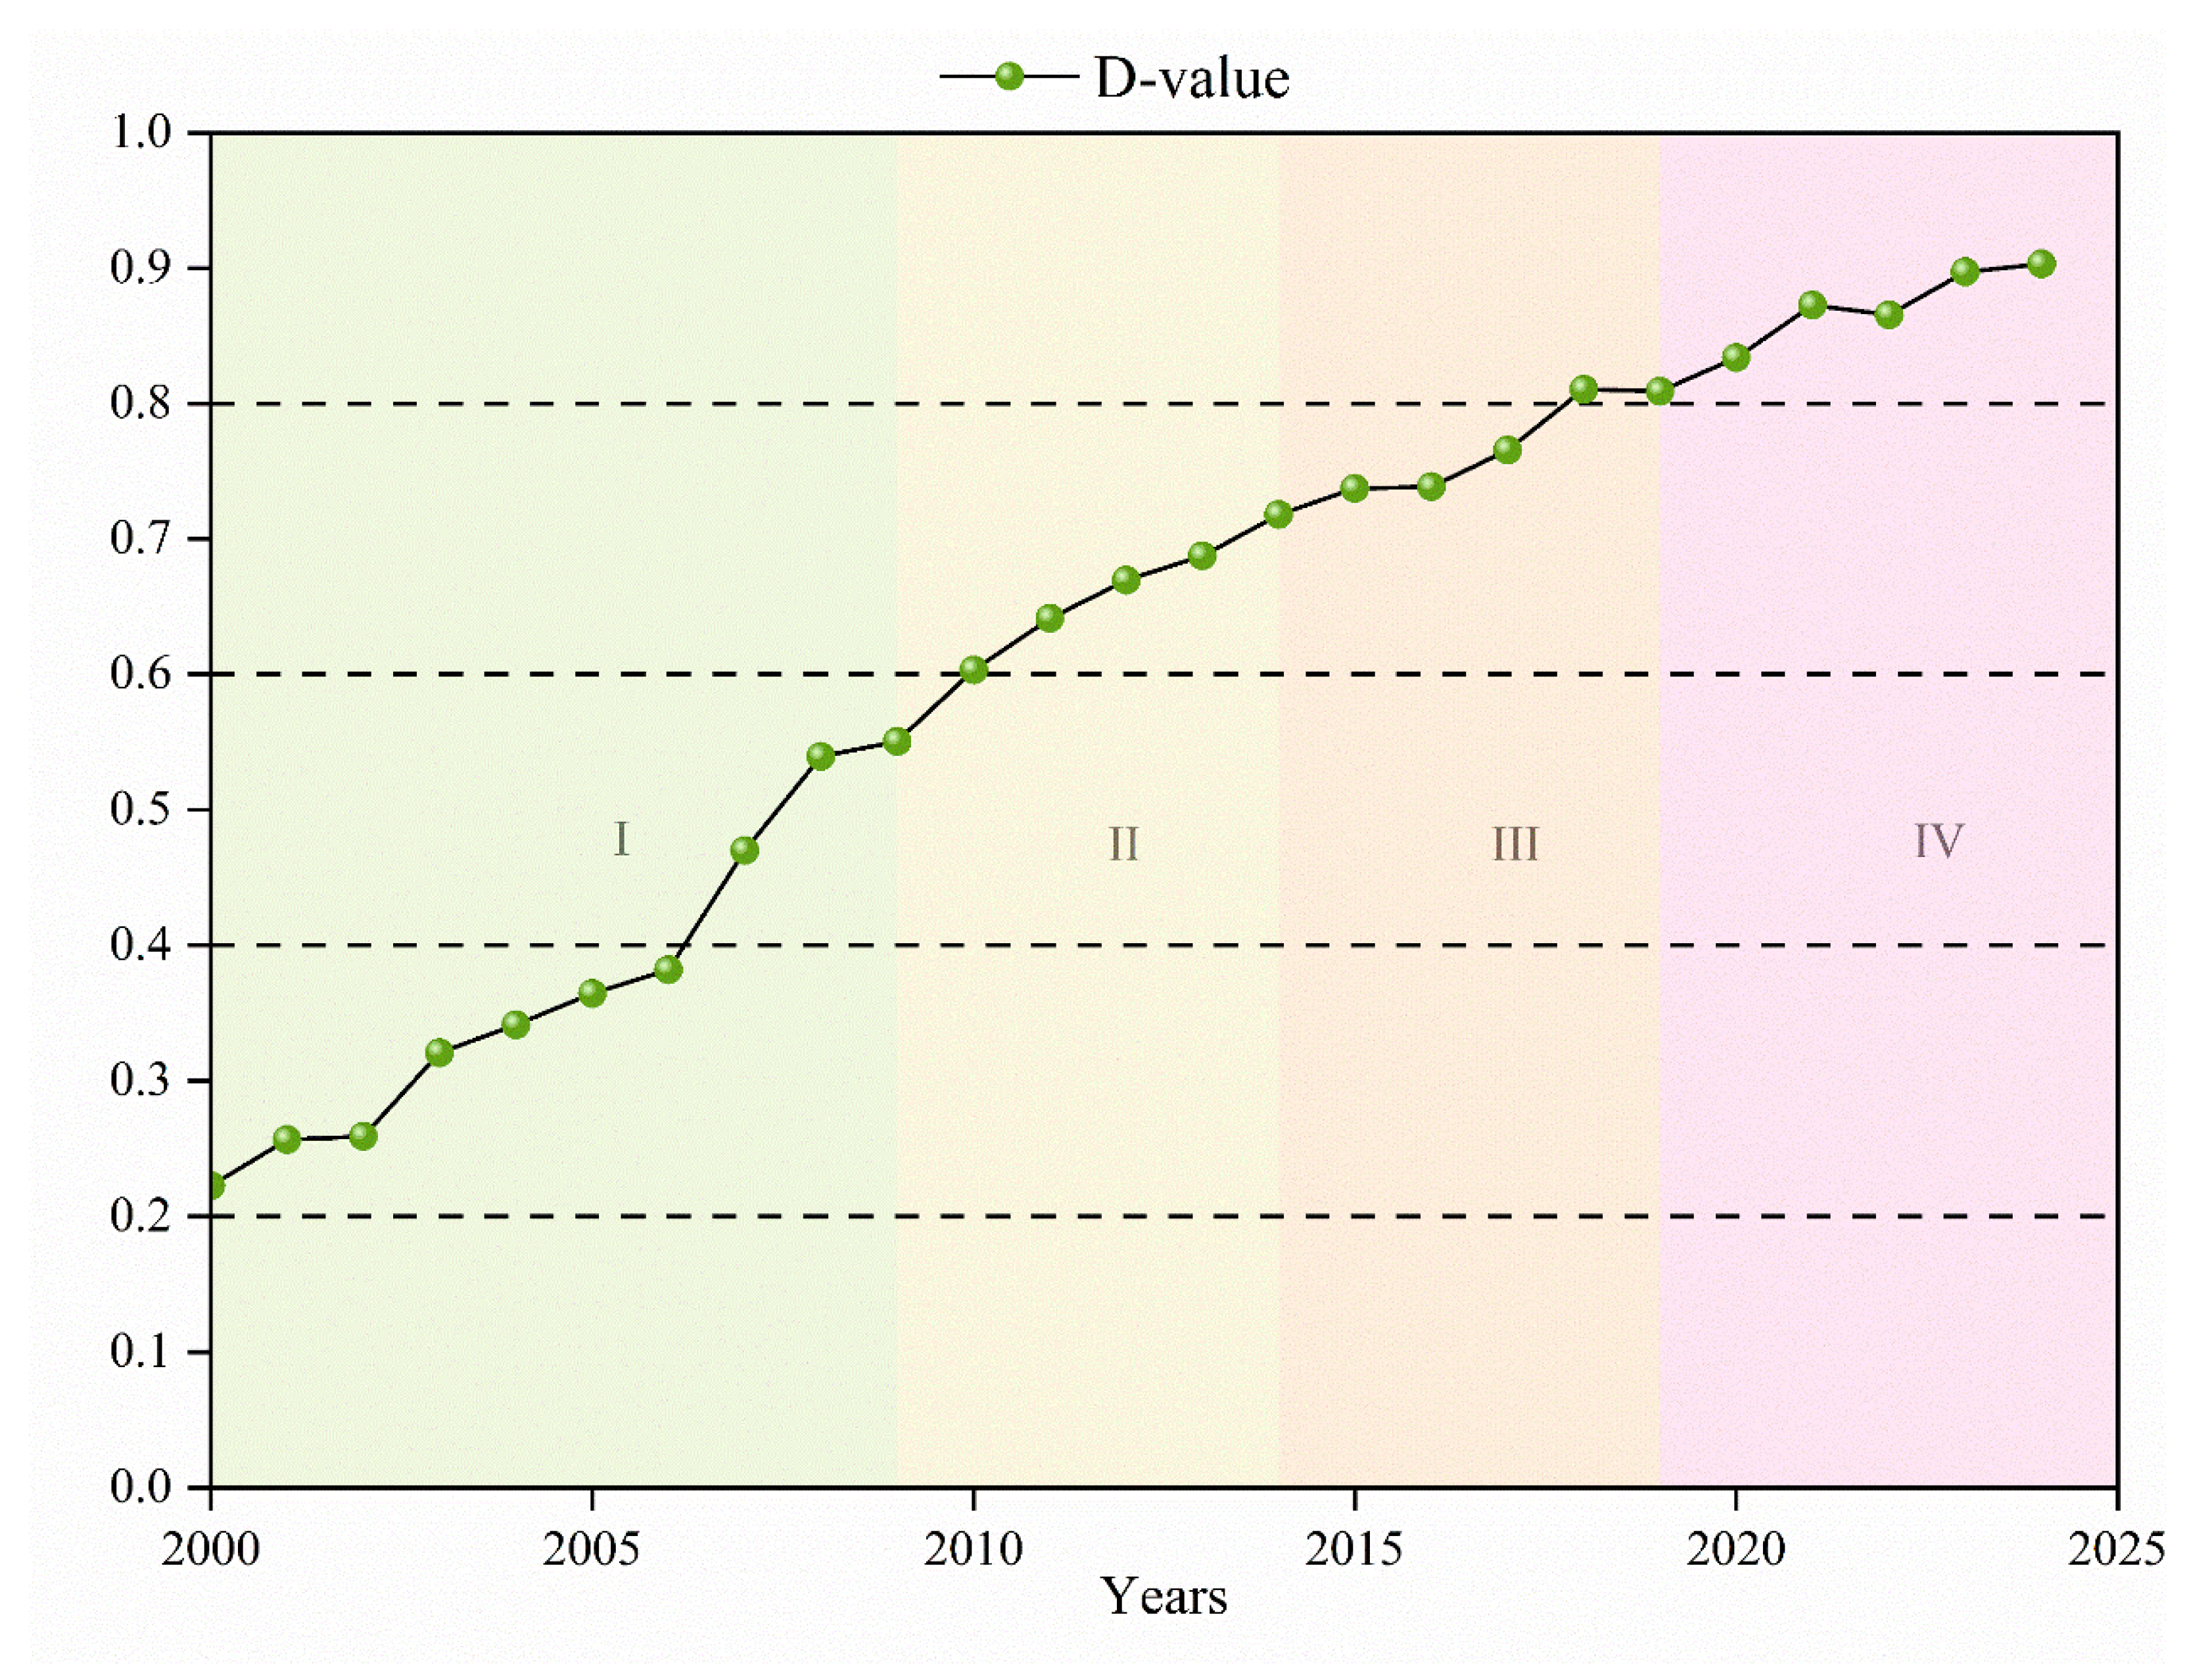
57], the value ranges for the coupling coordination degree (D) and the coupling degree (C) are divided into five levels: serious imbalance (0–0.2), relative imbalance (0.2–0.4), low coordination (0.4–0.6), good coordination (0.6–0.8), and high-quality coordination (0.8–1).
2.5.2. Grey Relational Analysis (GRA)
Grey relational analysis (GRA), suitable for small samples without distributional assumptions [
58], was applied to time-segmented analysis to address Geodetector’s limitation in reflecting temporal dynamics. Using D-value as the reference sequence and each driving factor as a comparison sequence, the correlation coefficient r is calculated after initialization and dimensionless processing:
The value of R_i ranges from 0 to 1; a higher value indicates that the trend of this factor is more closely aligned with that of the D-value and that its driving effect is stronger. The correlation coefficients for the entire period (2000–2024) and for each of the four policy phases is calculated.
2.5.3. Geodetector
Geodetector is a statistical method for detecting spatial heterogeneity and identifying driving factors [
59]. By extending this method to the temporal dimension [
60], it uses years as the stratification unit to examine the extent to which differences in factors across years explain variations in the D-value; this extension has already been applied in studies of long-term human–land relationships [
61]. The explanatory power of the factors is measured by the q-value:
In the equation, represents the variance of the selected factor; N represents the number of spatial units; L represents the number of factor types; and represent the sample size and variance of spatial unit k, respectively. q ranges from 0 to 1; a higher q-value indicates greater explanatory power of the influencing factor for the spatiotemporal evolution of human–land coordination.
The interaction detector can identify the explanatory power of the combined effect of two different factors on human–land harmony. Specifically, by comparing the relationship between univariate and bivariate Q-values, it classifies interaction types into five categories: nonlinear attenuation, single-factor nonlinear attenuation, two-factor enhancement, independence, and nonlinear enhancement.
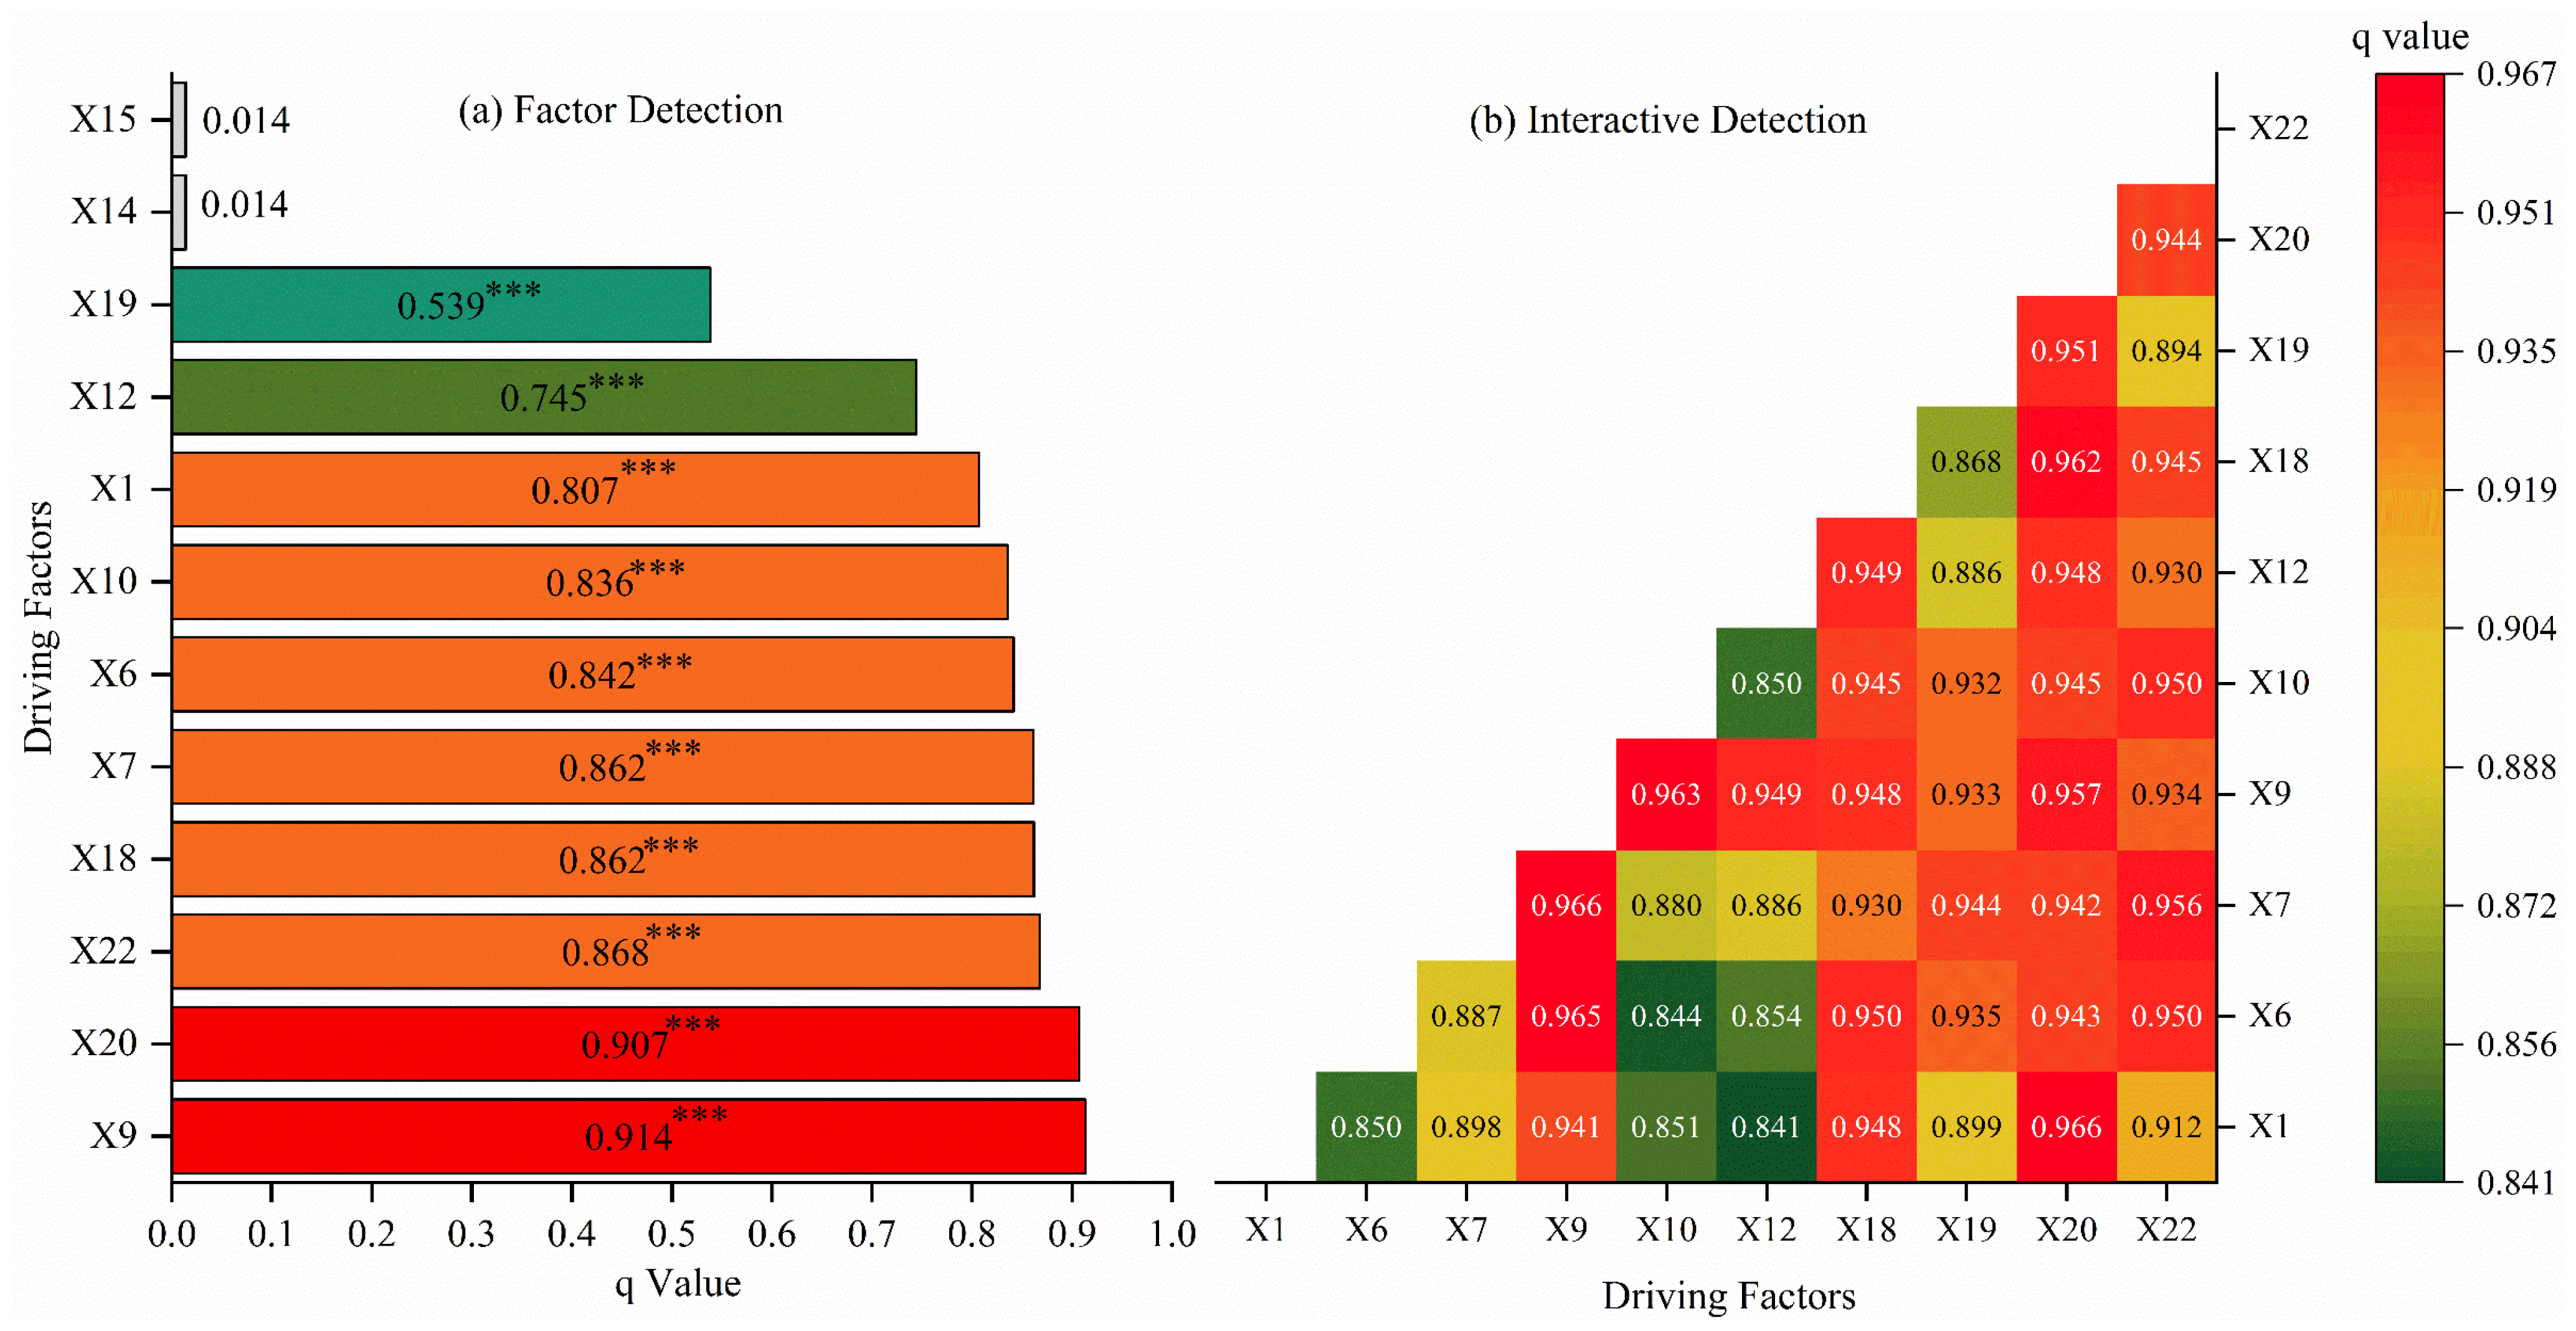
From the indicator system, 12 factors were selected for Geodetector analysis, spanning both the urban–rural development system (U1) and the environmental support system (U2) (
Table 3). The selection followed three criteria: (1) representation of key dimensions in urban–rural human–land coordination; (2) data availability for the entire study period (2000–2024); and (3) relevance to policy-driven evolutionary mechanisms in Guiyang. The selected factors are listed in
Table 3. These 12 factors encompass the core dimensions of both urban–rural development and environmental support, enabling a comprehensive assessment of the driving mechanisms behind D-value evolution. It is worth noting that although several drivers used in Geodetector are derived from the U1 and U2 assessment systems, this does not constitute a circular argument. First, the dependent variable in Geodetector is the D-value, which is a nonlinear aggregation of all 22 indicators, whereas the drivers are the original raw indicators, which are mathematically distinct; second, Geodetector captures the spatial hierarchical heterogeneity of the D-value across years, while the entropy method captures the temporal variation in each subsystem; third, the comparative analysis of Geodetector and the Grey relational analysis significantly enhances the robustness of the research results.
2.5.4. Spatial Analysis
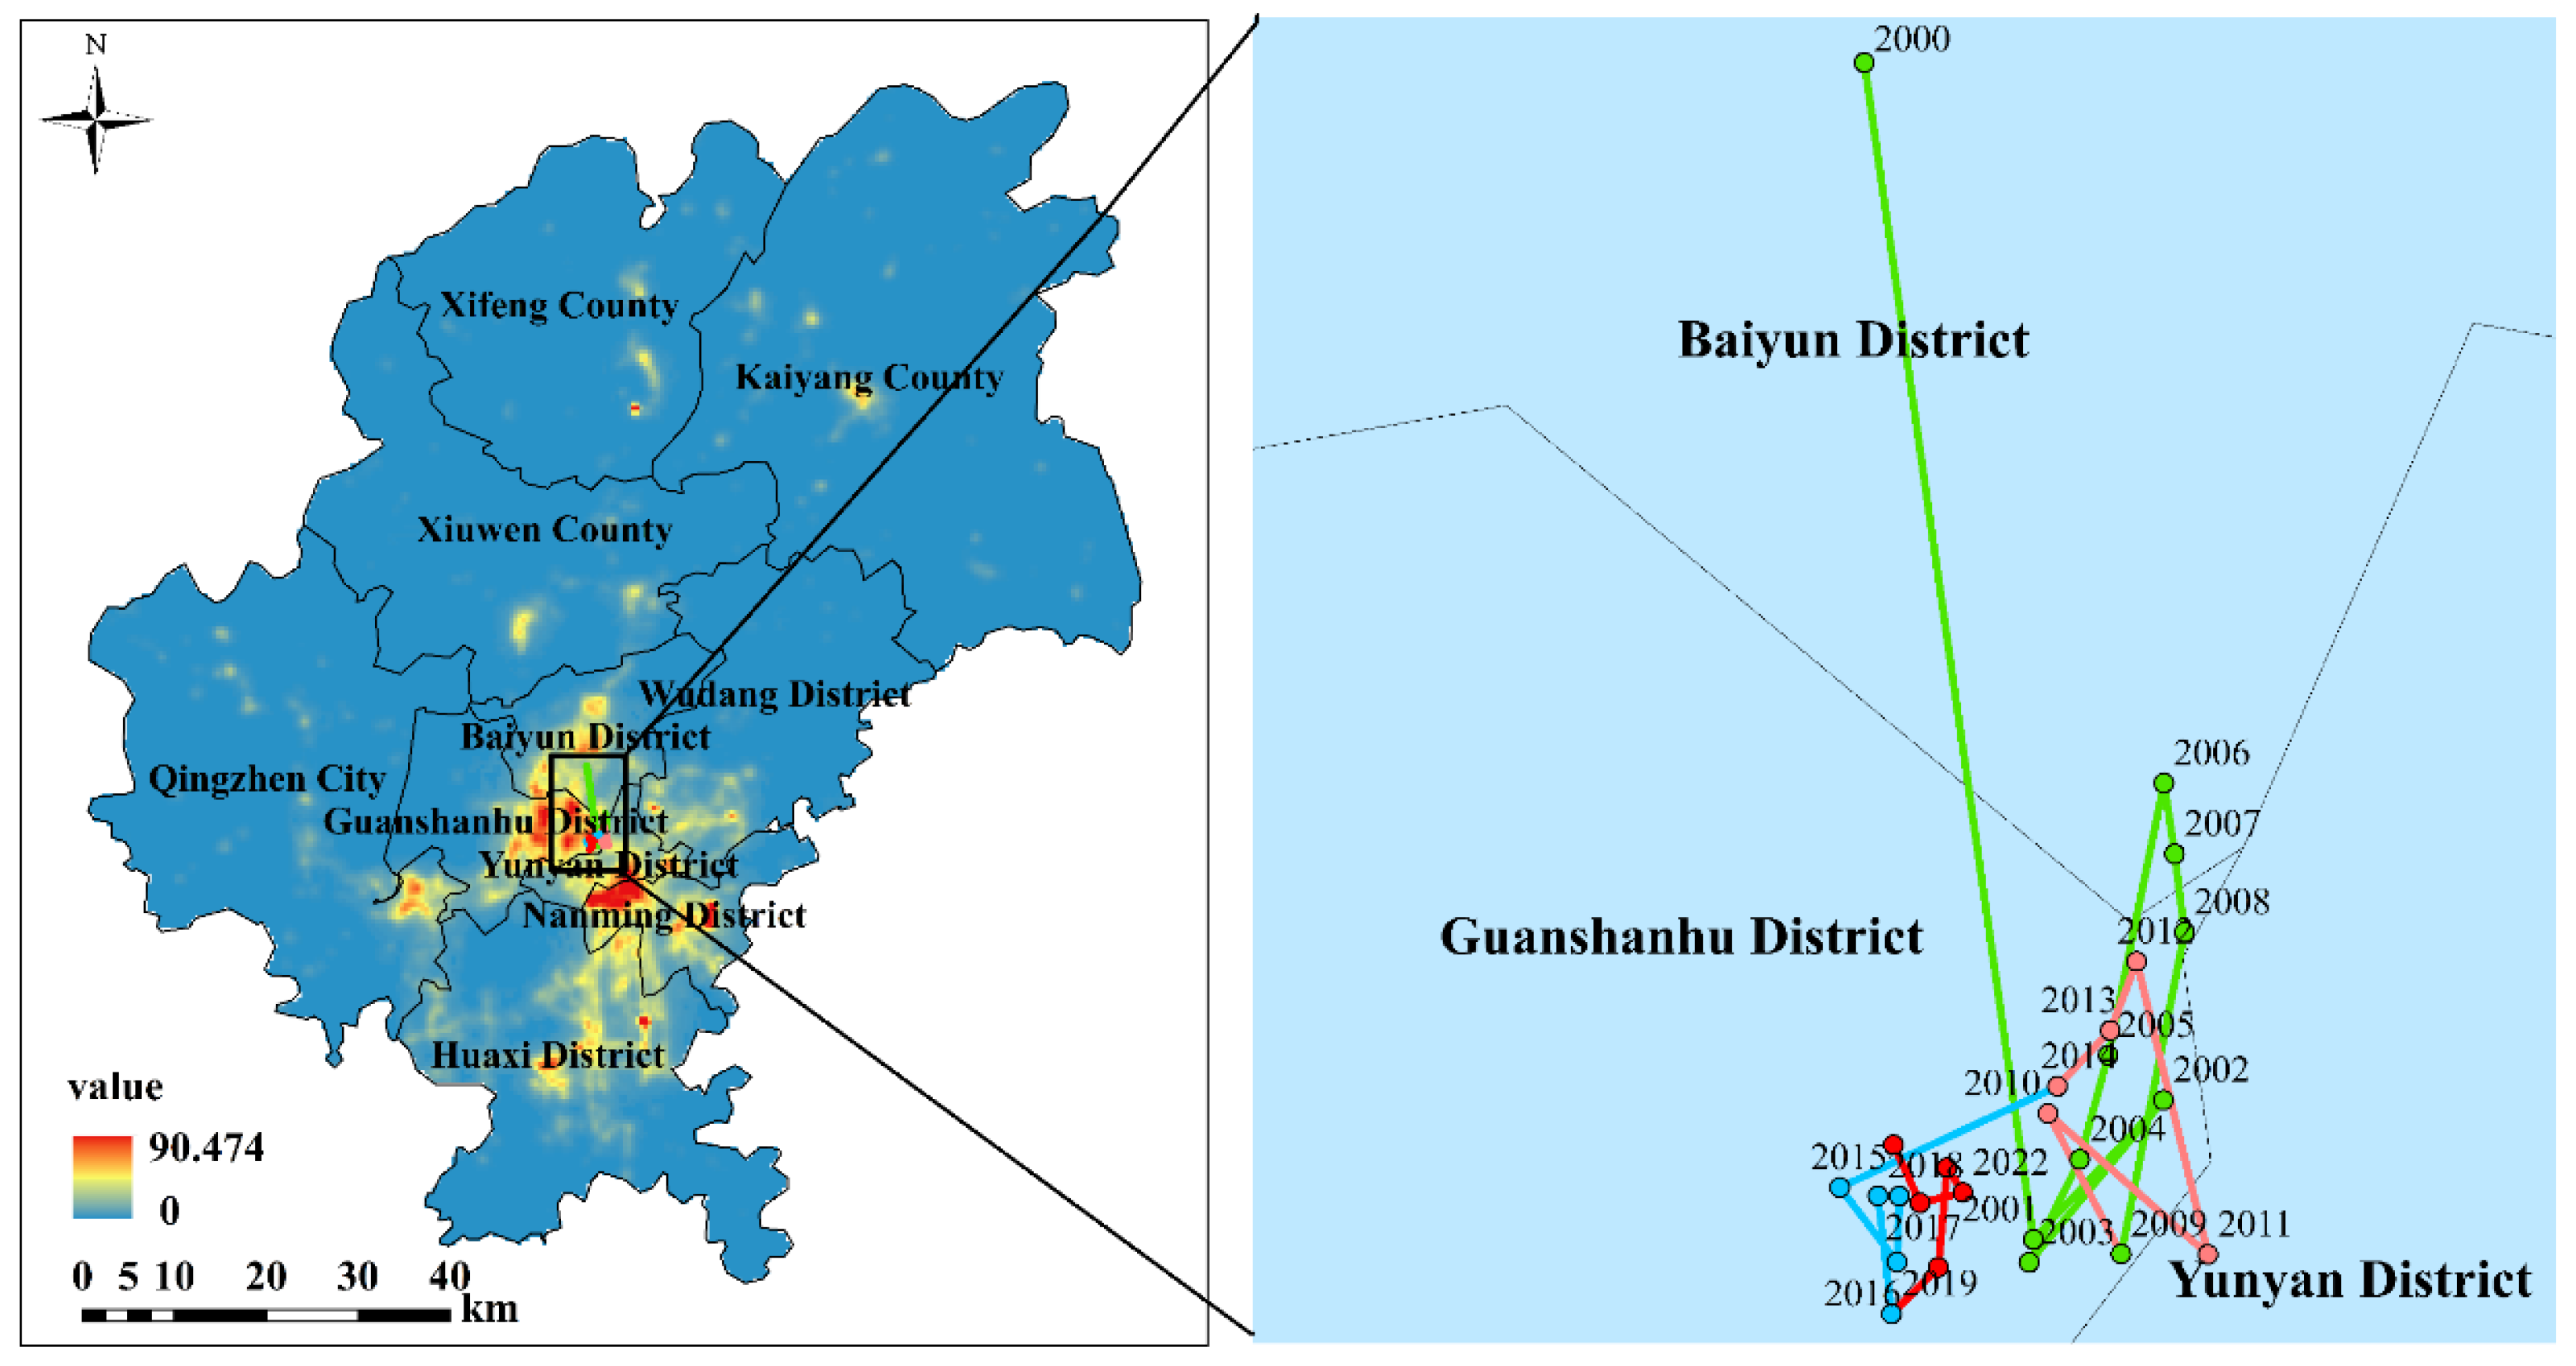
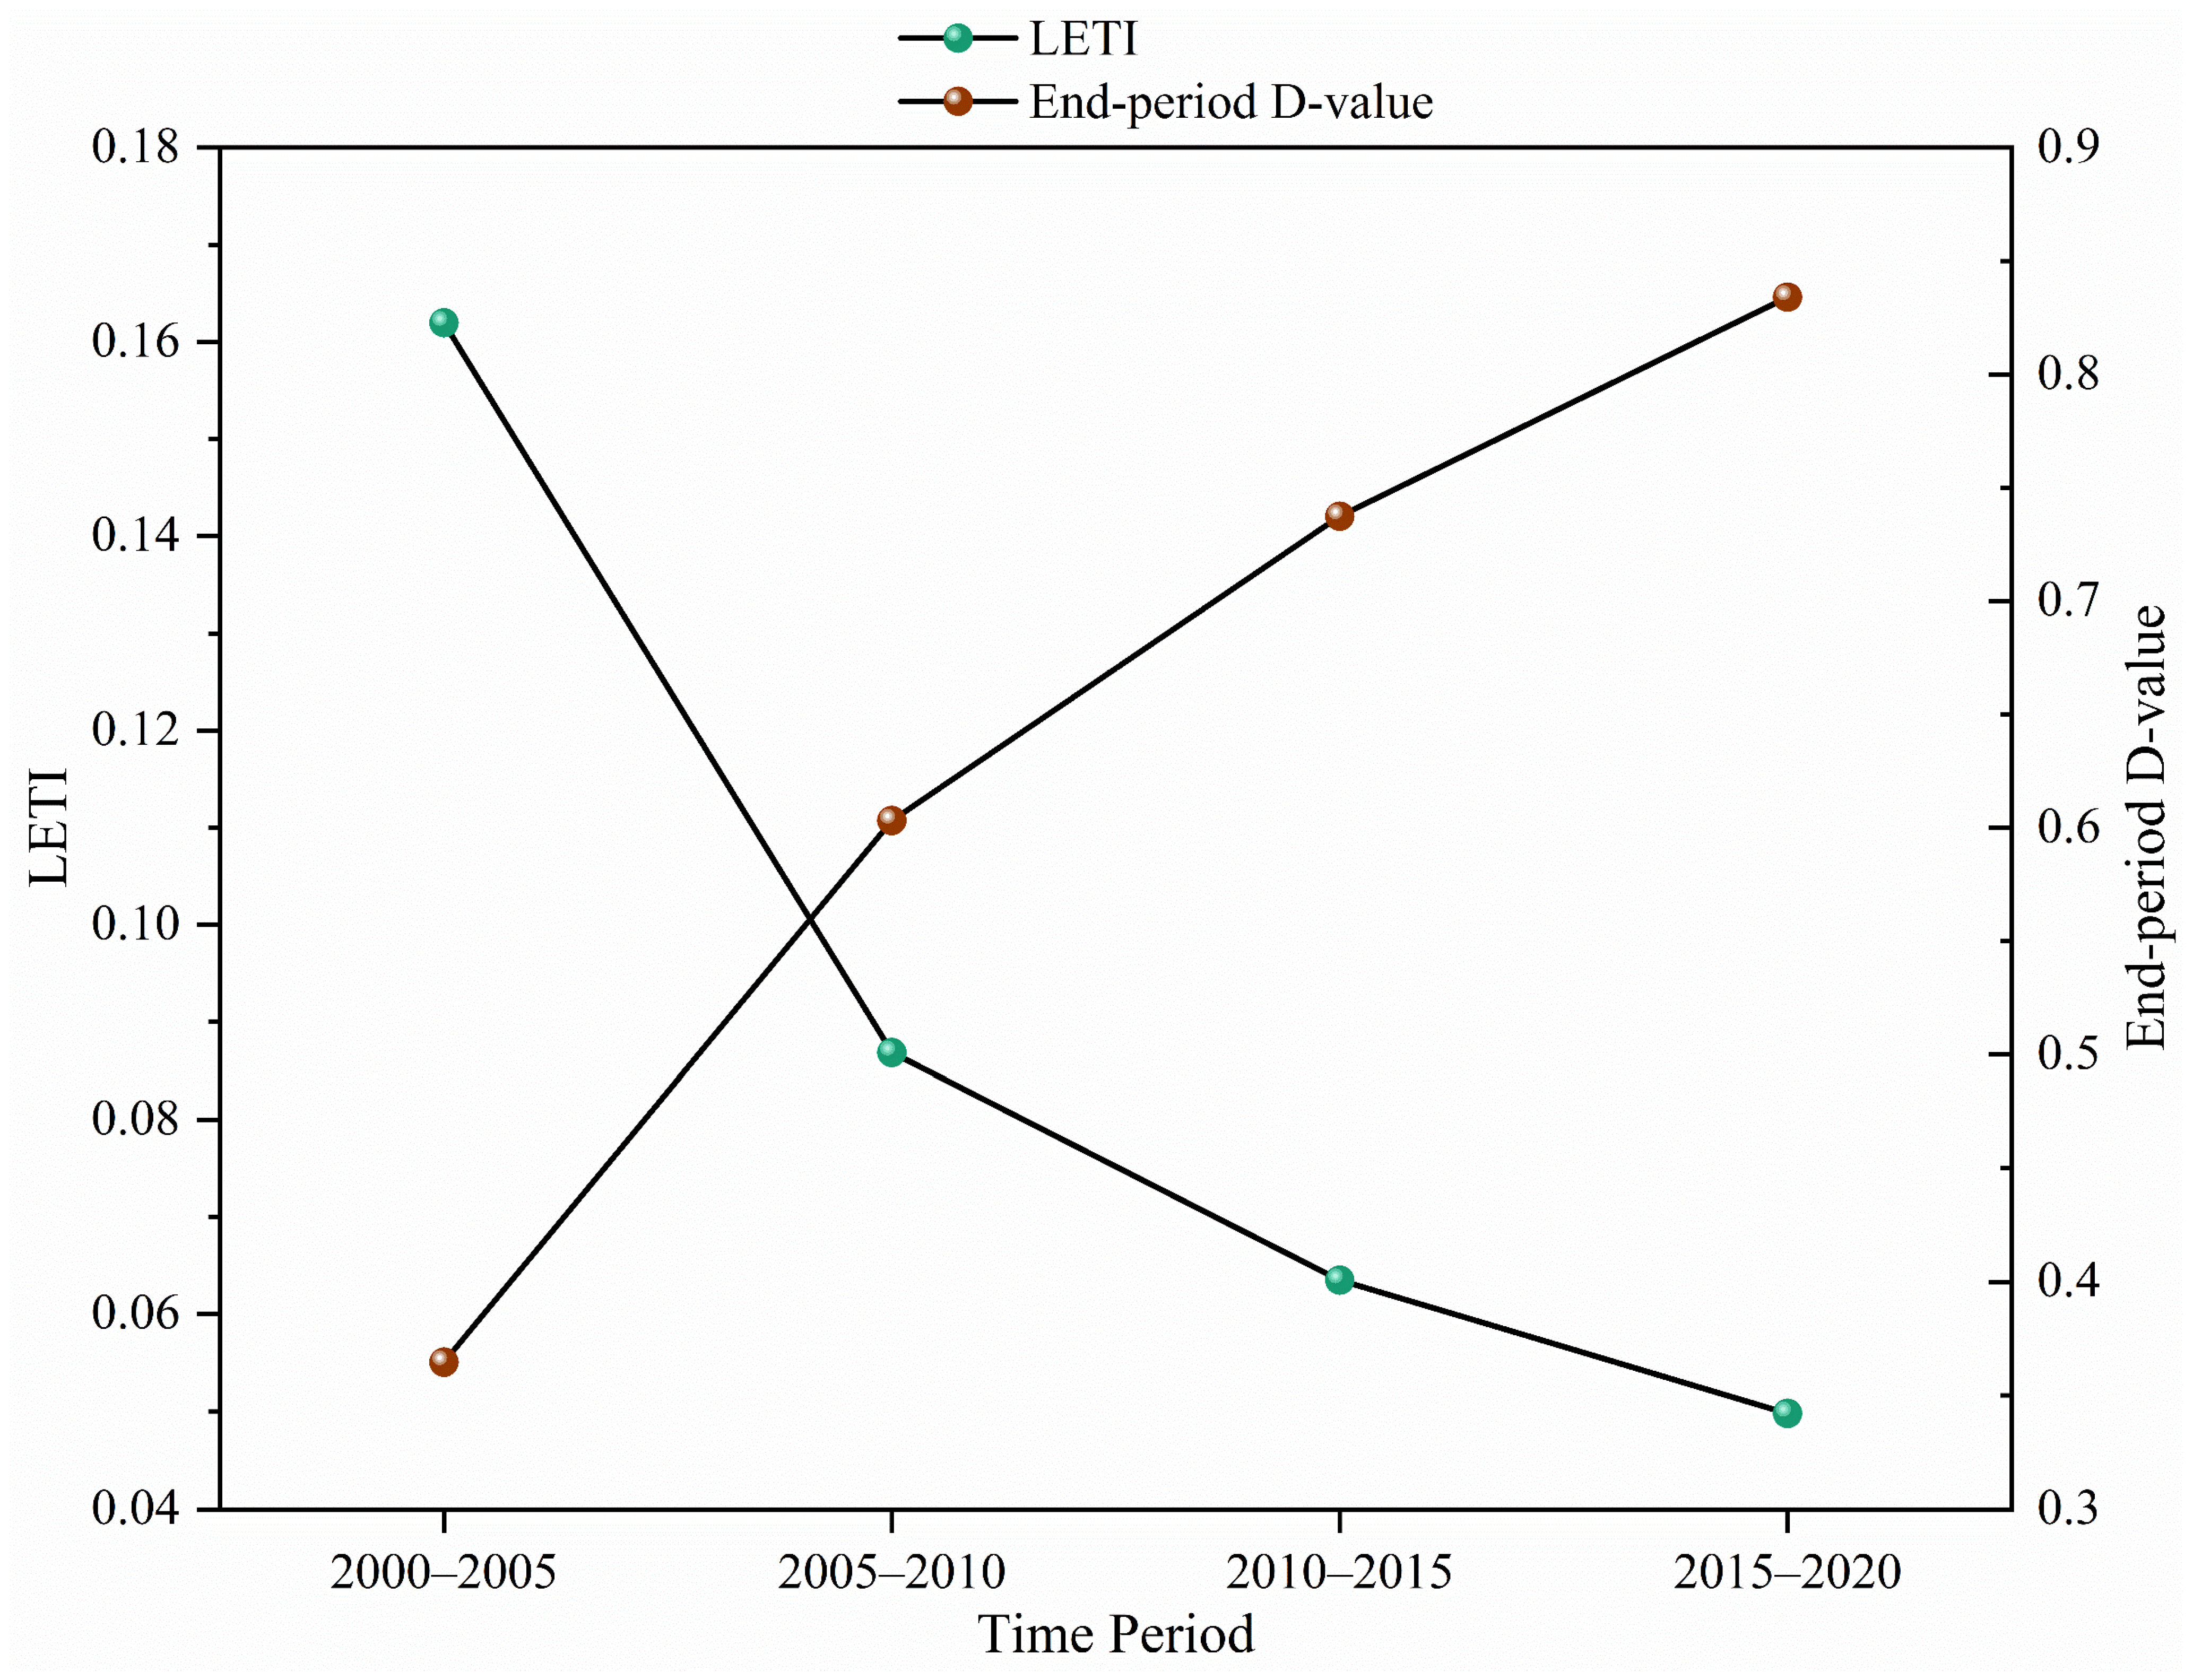
To reveal the spatial mapping characteristics of the coordinated evolution of humans and the environment, the following analyses were conducted using integrated data on nighttime lights, land use, and DEM: (1) Shift in light centers of gravity. The weighted average center method was used to calculate the annual light centers of gravity, with pixel brightness values serving as weights, to analyze the spatial migration trajectories of economically active areas. (2) Land use transitions matrix and land use ecological transition index. Based on five-period land use data, transitions matrices between adjacent periods were generated. Adverse and beneficial transitions were defined (
Table 4), and the land use ecological transition index (LETI) was calculated:
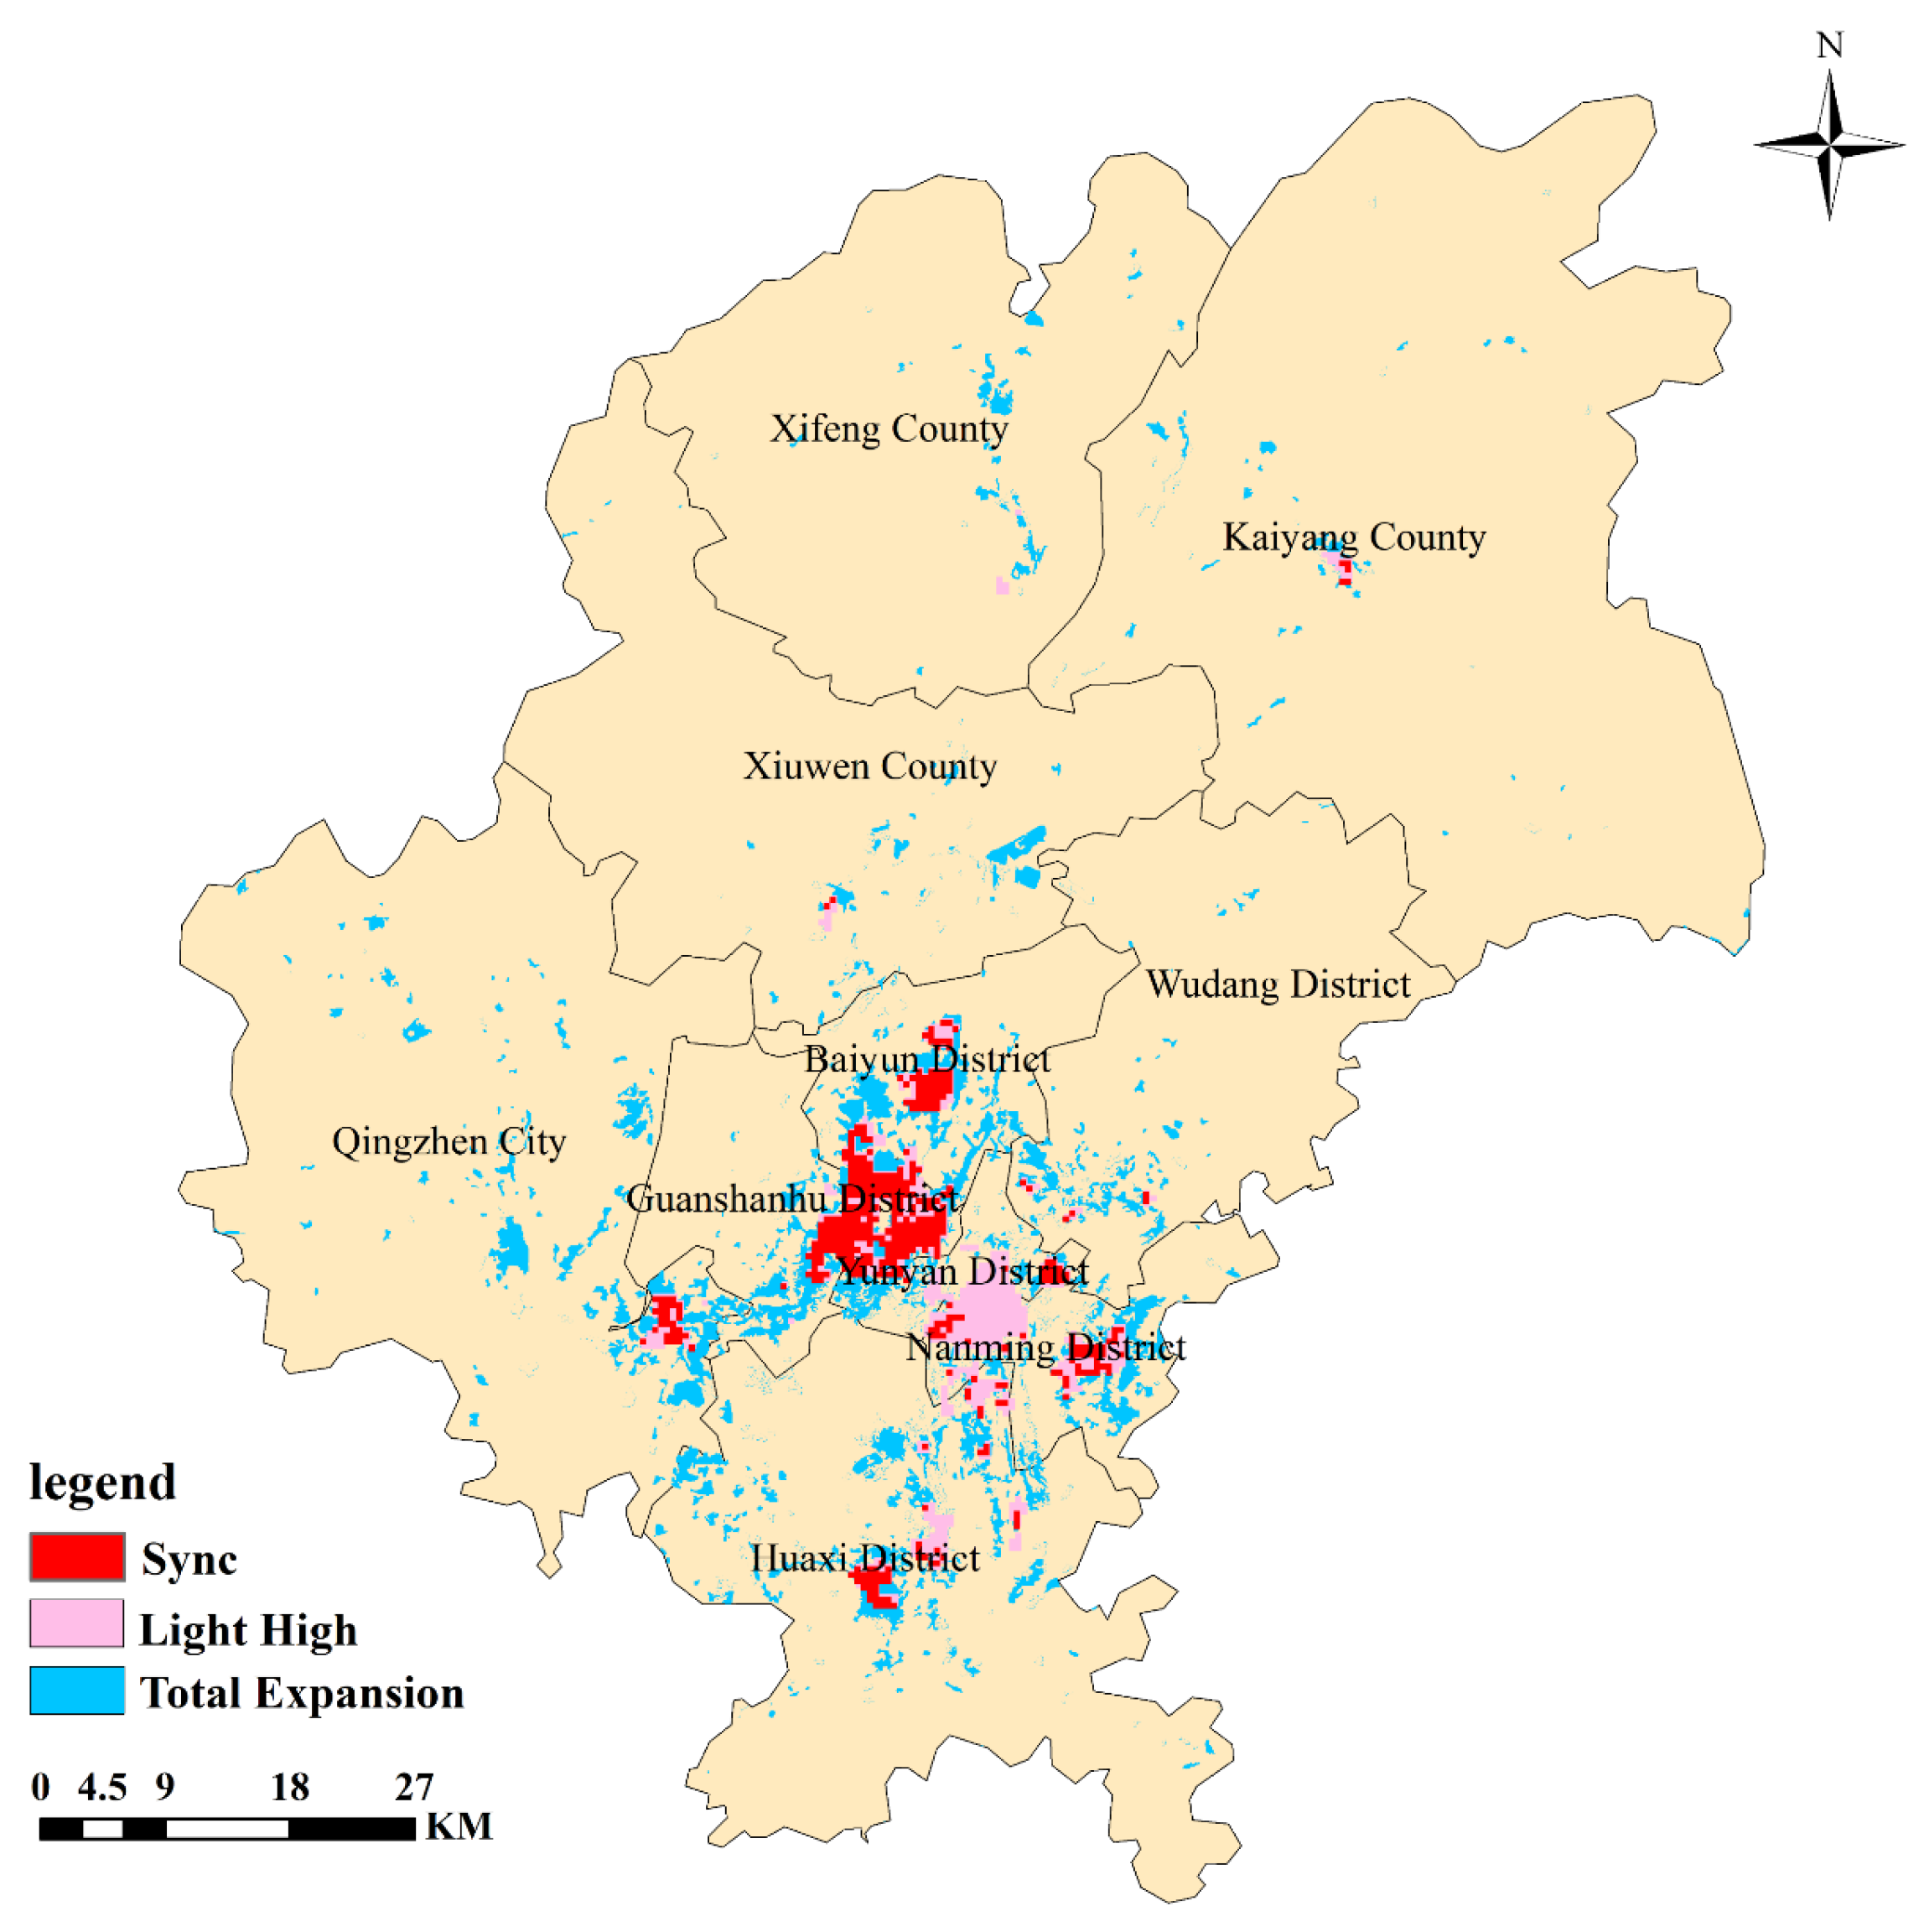
to measure the human–land coordination effects in terms of land-use conversion trends. (3) Topographic zoning statistics. Slope data (0–6°, 6–15°, 15–25°, >25°) and elevation data (<1000 m, 1000–1200 m, 1200–1400 m, >1400 m) were extracted from the DEM to calculate the proportion of newly added construction land in different topographic categories for each time period. (4) Overlap analysis. Using the 2020 nighttime high-intensity light zones to represent economically active areas, and the union of new construction land from 2000 to 2020 to represent expansion zones, the synchronization rate between the two was calculated:
to assess the spatial compatibility of industry–city integration.
4. Discussion
4.1. Theoretical Framework for Urban–Rural Integration in Karst Mountainous Areas
Unlike China’s eastern plains, which follow an urban–rural integration process of “scale expansion → industrial clustering → population influx” and rely on vast tracts of land and a relatively homogeneous environment [
13,
62], the coordination of Guiyang’s urban–rural human–land system is largely attributable to improved transportation infrastructure, clear priorities for ecological governance, and the widespread adoption of digital technologies.
Several details clarify how this alternative pathway works. Digital technology partly compensates for geographic capital through spatiotemporal compression [
63,
64]. The interaction term between the number of broadband internet subscribers and other driving factors is of the two-factor enhancement type, with a maximum explanatory power of q = 0.949, exceeding that of any single factor. Typically, the environmental Kuznets curve implies environmental degradation before improvement [
65,
66]; however, Guiyang implemented intensive ecological governance even when its per capita GDP was only approximately
$3900 and its D-value had not yet reached the threshold for high-quality coordination. At the same time, the spatial structure adapts to the topography: Guiyang exhibits a polycentric, clustered pattern. Compared to the mountainous terrain of Chongqing [
67], the smaller settlements here and wider ecological buffer zones reflect the more fragmented nature of the karst landscape.
However, tensions remain. Between 2015 and 2020, the depletion of high-quality farmland on gentle slopes and the decline of the LETI to 0.050 indicate that this pathway relies heavily on land-driven development. The core test of this pathway’s long-term sustainability lies in whether the positive impacts of the digital dividend and ecological governance can continue to offset the cumulative costs of land development [
68,
69].
4.2. Extending the PSR Framework in the Digital Age: Three Effects of Digital Empowerment and Evaluation
The traditional PSR framework assumes that information flows serve as an adjunct to responses and that stress develops along a linear path [
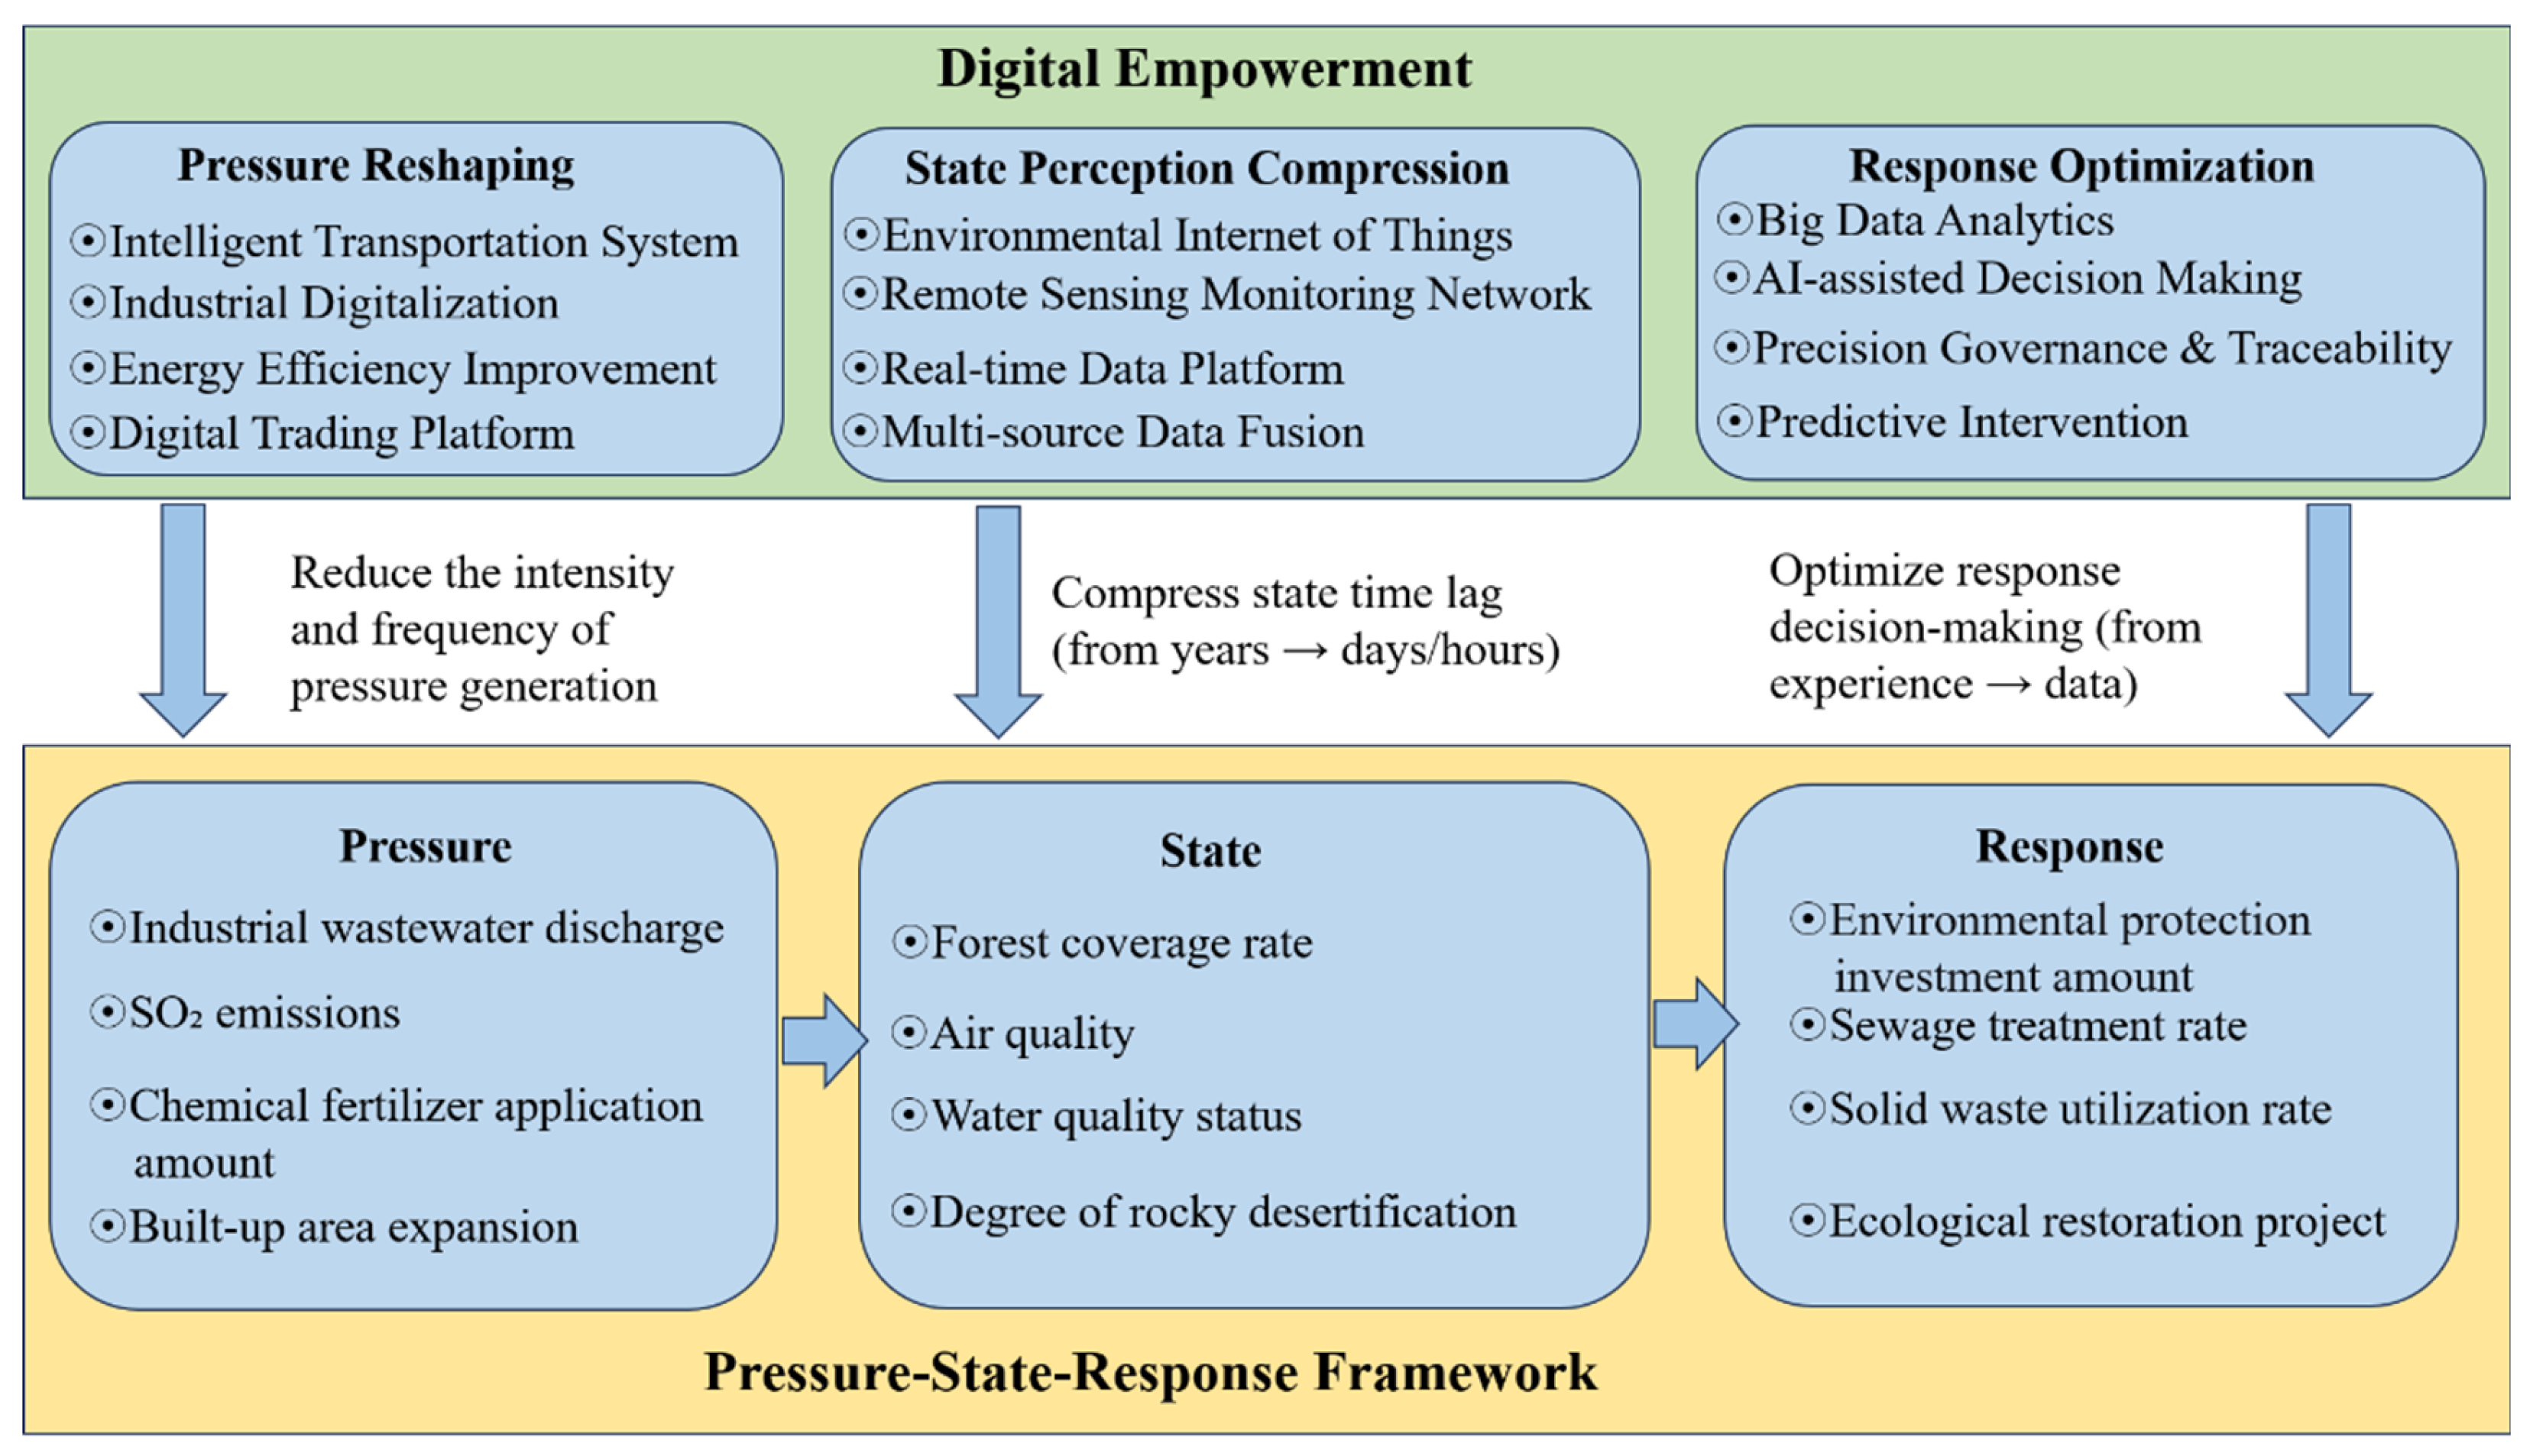
70]. The digital age challenges these assumptions: information flows have become an independent force that reshapes stress generation, while real-time sensing enables responses to shift upstream.
This study finds that digital technologies permeate all stages of pressure (P), state (S), and response (R), expanding the PSR framework into three effects (
Figure 12). First, the pressure reduction effect: e-commerce and smart tourism reduce resource consumption and pollution per unit of GDP at the source of pressure. Second, the state-awareness compression effect: Guiyang’s environmental big data platform compressed the environmental feedback cycle from annual to near-real-time, creating a window for early intervention, which explains why Guiyang’s ecological governance preceded environmental degradation. Third, the response decision optimization effect: the interaction between the number of broadband internet subscribers and other driving factors is of the two-factor enhancement type, with a maximum explanatory power of q = 0.949, indicating that digital technologies have reshaped the efficiency of urban–rural factor flows and the precision of governance responses [
71].
Guiyang’s four-stage evolution provides empirical validation. In Phase I, digital infrastructure was underdeveloped, and human–land relations followed the traditional PSR logic. In Phase II, digital technology emerged but served only as an auxiliary tool for the response phase. In Phase III, with the rapid increase in internet penetration, the three effects began to manifest systematically; digital empowerment and ecological governance achieved “mutual reinforcement” for the first time. In Phase IV, digital empowerment and response were deeply integrated, forming a closed-loop of intelligent sensing and decision-making. Digital-based responses began to partially replace engineering-based responses; the city’s ranking in environmental investment dropped from fourth in the first stage to eighteenth in the fourth stage, while the U2 index remained persistently high.
4.3. Sustainability Implications of the Divergence Between Ecological Land Use Conversion and Coordination
The significant negative correlation between LETI and D-value (r = −0.89, p < 0.05) indicates that, despite land use deviating from ecological friendliness, system coordination continues to increase. This finding can be explained by the distinction between weak sustainability and strong sustainability.
Weak sustainability assumes that natural capital and man-made capital are interchangeable; sustainability can be achieved as long as the total capital stock does not decline [
72]. From this perspective, the growth in Guiyang’s transportation infrastructure, digital technology, and forest cover has offset the loss of high-quality arable land in the total capital account, driving the D-value upward.
Strong sustainability emphasizes that certain key natural capital stocks are irreplaceable and must be maintained independently [
73]. From this perspective, the loss of high-quality farmland on gentle slopes is irreversible. Soil formation rates in karst regions are extremely low; once arable land in the basin is occupied by construction, its food production capacity and ecosystem services cannot be fully restored through off-site compensation [
74]. A decline in the LETI to 0.050 can be regarded as a quantitative signal of compromised resilience. Therefore, focusing solely on area-equivalent compensation while ignoring the ecological and economic functions of different land types will lead to irreversible losses. Elevating compensation from area equivalence to functional equivalence is the theoretical requirement for advancing toward robust sustainable governance.
4.4. Mountainous Urbanization Under Topographic Constraints
Mountainous urbanization follows divergent paths due to geographical context. The Alpine region and Chongqing represent two distinct yet well-documented environments of urbanization in mountainous areas, with the Alps exemplifying long-term slope management in a European setting and Chongqing reflecting rapid polycentric expansion under topographic constraints in China. By comparing the mountainous urbanization processes in these two representative cases with Guiyang’s situation, we can better understand how Guiyang pursues a path of “digital–ecological synergy” and how karst constraints shape its governance trajectory. The Alpine region achieves balance through slope restrictions and compact development [
75], while Chongqing uses a “multi-centric, cluster-based” structure to respond to parallel ridge–valley topography [
67]. Guiyang’s expansion follows a pattern of protecting peripheries and developing central areas. Compared to the Alps, Guiyang’s steep slope restrictions are driven more by karst desertification control than by landscape risk management. Compared to Chongqing, Guiyang’s urban clusters are smaller with wider ecological buffer zones, reflecting the strong constraints of peak cluster depression landscapes on contiguous development.
This development process may be associated with three types of cumulative risks. First, farmland depletion in basin areas: the scarcest high-quality cropland is concentrated on 0–6° slopes at 1000–1400 m elevation. During 2015–2020, this zone accounted for 7.555% of new construction land. At current rates, developable space may saturate within 10–15 years. Second, soil erosion risk on slopes: in the 6–15° gentle slope zone, soil depth typically falls below 50 cm; surface hardening increases runoff coefficients, and combined with concentrated rainfall, erosion risk rises. Third, the risk of reversing rocky desertification at high altitudes: new development above 1400 m exceeded 1% in Phase IV. These are mostly post-remediation ecological restoration zones with low community stability; once disturbed, rocky desertification becomes irreversible [
76]. These risk indicators suggest that the short-term economic rationality of the current expansion model comes at the cost of long-term natural capital depletion, and its sustainability depends on whether a transition from incremental expansion to stock optimization can be achieved before critical thresholds are reached.
4.5. Research Limitations and Future Directions
This study has several limitations. First, regarding data limitations, our analysis ends in 2024, and short-term changes in 2025–2026 are unlikely to significantly alter the main conclusions, as the key transitions occurred before 2015 and the D-value has plateaued since 2020. Nevertheless, future updates with longer time series would be valuable. Due to limited long-term remote sensing data, the study did not directly incorporate rocky desertification area but used forest cover as a proxy. Although the two are highly correlated, proxy use still results in information loss. Subsequent studies should use higher-resolution imagery to construct long-term rocky desertification datasets.
Second, methodological limitations arise regarding the potential overlap between driving factors and evaluation metrics. Some of the drivers used in the Geodetector analysis also appear as original metrics in the U1 and U2 evaluation systems. While we do not believe this constitutes circular reasoning, we acknowledge that complete independence would be methodologically clearer. However, given limitations in data availability, we were unable to compile a fully independent set of drivers over the 25-year study period. To partially address this concern, we employed cross-validation using GRA and Geodetector to enhance the robustness of our conclusions. In future research, we will use fully independent drivers to validate our findings.
Third, there are limitations regarding generalizability. Guiyang enjoys unique policy advantages; whether its “digital–ecological synergy” approach can be replicated in other karst regions with weaker policy support and underdeveloped digital infrastructure—such as Bijie, Southwest Guizhou, Northwest Guangxi, and Southeast Yunnan—requires verification through comparative case studies.
Fourth, the depth of micro-level mechanisms remains limited. While this study highlights the interaction between digital factors and population aggregation (q = 0.956), it has not yet delved into the micro-level mechanisms. Future research could combine farmer surveys and business interviews to explore the micro-level mechanisms of digital empowerment within human–land systems.
5. Conclusions
Taking Guiyang City as an example, this study integrates the entropy method, the coupled coordination degree model, Grey relational analysis, Geodetector, and multi-source spatial analysis methods to examine the evolutionary characteristics, driving mechanisms, and spatial responses of the human–land system during the urban–rural integration of the karst mountainous region from 2000 to 2024. The results are as follows:
First, the comprehensive score of Guiyang’s urban–rural human–land system increased from 0.054 to 0.826, and the coupling coordination degree rose from 0.223 (relative imbalance) in 2000 to 0.903 (high-quality coordination) in 2024, while the environmental support system deviated from the classic environmental Kuznets curve. This indicates that Guiyang, through ecological governance interventions initiated in 2012, avoided severe environmental degradation and maintained a balance between economic development and environmental protection.
Second, the driving forces underwent a structural shift from being primarily driven by economic scale to being primarily driven by green well-being. The interaction between the number of broadband internet subscribers and other driving factors is of the two-factor enhancement type, with a maximum explanatory power of q = 0.949, indicating that digital technology compensated for the scarcity of geographic capital through a two-factor synergy effect with population agglomeration.
Third, spatially, the center of light intensity stabilized after 2015, while the LETI decreased from 0.162 to 0.050, showing a significant negative correlation with the D-value. The expansion of construction land was concentrated on slopes with gradients of 0–6° and in areas at elevations of 1000–1400 m, overlapping with high-quality farmland, whereas steep slopes and high-altitude regions were strictly protected. The synchronization rate between economic development and land expansion was approximately 50%, indicating a reduced reliance of economic activities on land expansion.
These findings highlight the policy need to promote the alignment of digital infrastructure investment with the population distribution of mid-altitude communities, while shifting farmland compensation standards from area equivalence to functional equivalence.