Article

Synergizing Governance and Technology: How Dual-Pilot Policies Enhance Green Innovation Through Information Transparency

1
School of Business, Hubei University, Wuhan 430062, China
2
School of Economics and Management, Hanjiang Normal University, Shiyan 442000, China
*
Author to whom correspondence should be addressed.
Sustainability 2026, 18(13), 6566; https://doi.org/10.3390/su18136566
Submission received: 4 June 2026 / Revised: 25 June 2026 / Accepted: 26 June 2026 / Published: 29 June 2026

Abstract

Based on the dual-pilot policies established under China’s 2012 Ambient Air Quality Standards and the “Broadband China” strategy, this paper utilizes panel data from 289 prefecture-level cities spanning 2000–2023 and employs a multi-period difference-in-differences model to examine how environmental information transparency affects urban green innovation performance. The results indicate that the joint implementation of the two policies is associated with significant improvements in both the quantity and the quality of urban green innovation. Mechanism analysis indicates that the effects of dual-pilot policies on green innovation operate through heightened public environmental attention, stronger environmental compliance pressure, and improved resource allocation. Comparative analysis further shows that, relative to cities covered by only one of the two policies, dual-pilot cities experienced more pronounced gains in green innovation, consistent with the argument that policy synergy and informational complementarity strengthen institutional effectiveness. By demonstrating that environmental information transparency, realized through the complementary operation of disclosure mandates and digital infrastructure, can simultaneously expand the scale and elevate the quality of green innovation, this paper provides empirical evidence to inform the design of integrated policy mixes that combine governance and technology in emerging economies pursuing green transformation.

1. Introduction

Escalating global environmental crises, including climate change [1], biodiversity loss [2], and pollution [3,4], threaten both ecological stability and sustainable development. Against this backdrop, green innovation has emerged as a central strategy for reconciling environmental sustainability with economic growth [5]. Through advances in clean production technologies [6], pollution abatement systems [7], and circular economy models [8], green innovation provides a viable pathway toward sustainable development.
However, the rapid expansion of green innovation in quantity has outpaced its substantive improvement in quality [9]. This imbalance is driven by the high research and development costs of green innovation and its dual externalities. Specifically, knowledge spillovers and the positive externalities of environmental improvement erode the innovation incentives of micro-level actors [10], and may encourage superficial innovation practices such as greenwashing [11]. Consequently, addressing the development dilemma of emphasizing quantity over quality has become a central issue in advancing green transformation.
Grounded in new institutional theory, a growing body of research has examined the role of governmental environmental constraints and public environmental participation in shaping green innovation. One stream of the literature focuses on formal institutional pressures exerted by the government. Studies in this tradition argue that both command-and-control environmental regulations [12] and market-based regulatory instruments, such as emissions trading schemes [13,14] and environmental protection taxes [15,16], exert regulatory pressure that compels firms towards green innovation. Another research perspective emphasizes informal institutional pressures arising from public environmental participation. Through channels such as voting, reporting pollution to environmental authorities, and relocation decisions, the public expresses environmental concerns that can influence the decisions of both governments and firms. Public participation may also operate through capital markets, with investment choices that reward environmentally responsible firms [17,18], thereby encouraging green transformation [19,20]. Public participation can encourage governments at all levels to strengthen environmental policy design and enforcement, and may also motivate firms to adopt cleaner production practices and increase investment in green technology research and development. However, the extent to which both governmental constraints and public participation can promote green innovation depends on the timely acquisition and broad sharing of environmental information. Environmental information transparency facilitates more targeted environmental policymaking by governments, more informed decision-making by the public, and more responsive adjustments in technology and production processes by firms.
Research on the effect of institutionalized disclosure of environmental information on green innovation remains at an early stage, although scholarly attention paid to this topic has grown steadily. Specifically, the relationship between institutionalized disclosure of environmental information and green innovation has attracted increasing empirical interest. Several studies using environmental information disclosure indices released by the Institute of Public and Environmental Affairs and the Natural Resources Defense Council have documented a positive association between institutionalized disclosure of environmental information and urban green innovation [21,22]. Research based on environmental information disclosure data from listed companies has yielded complementary evidence. A parallel body of work has examined the implementation outcomes of the Ambient air quality standards (AAQS-2012) from an information disclosure perspective. These studies have documented how the public release of air quality data triggers avoidance behaviors, generates economic value [23,24], and may encourage green innovation activities among firms [25]. The Broadband China (BC) policy, a national initiative for digital infrastructure development, has likewise attracted considerable research attention. Studies have documented the policy’s contribution to expanding broadband infrastructure [26,27,28,29,30]. The expansion of digital networks and information technology has been found to lower information barriers, improve communication efficiency, and reduce the cost of information acquisition, thereby broadening the reach of information dissemination. Related research indicates that the BC policy is associated with stronger green innovation outcomes, partly through the strengthening of external monitoring mechanisms [31]. Additional studies suggest that internet expansion under this policy may support green innovation research and development through several pathways, including deeper financing mechanisms [32], accelerating talent agglomeration [30,32,33,34], more efficient resource allocation [35], and stronger innovation collaboration [36]. Taken together, these effects may provide financial resources, talent, and allocative efficiency that contribute to improvements in green innovation performance.
China’s institutional context offers a suitable setting for examining how environmental information transparency relates to green innovation. The country has built an extensive digital governance platform that supports environmental data collection, integration, public access, and enforcement. In the 2024 UN E-Government Survey, China ranked 11th globally, and its Online Service Index reflects considerable technical capacity for environmental data disclosure and multi-channel dissemination. China’s centralized environmental governance architecture also helps to address transparency barriers such as data fragmentation and accountability gaps. This is achieved through mandatory enterprise-level connectivity to monitoring networks, standardized reporting protocols, and cross-departmental data sharing. In this paper, environmental information transparency is defined as an integrated construct comprising two interdependent dimensions, namely the institutionalized disclosure of environmental information and the digitalized dissemination of that information. These two dimensions are best understood as sequential links in a single information flow chain, rather than as independent contributors to transparency. Disclosure without dissemination renders environmental data technically available yet practically inaccessible to the public and firms, while dissemination infrastructure without authoritative disclosure carries no actionable environmental content. A complete information flow chain requires both dimensions, enabling environmental information to inform the decisions of governments, the public, and enterprises. Although a growing body of scholarship has recognized the contribution of each dimension individually to green innovation, the two have been examined largely in isolation. The role of environmental information transparency as a unified, dual-dimensional construct in expanding the scale and elevating the quality of green innovation has yet to receive systematic empirical attention.
To address this gap, this paper selects the AAQS-2012 and the BC policy as a joint quasi-natural experiment. The AAQS-2012, jointly issued by the Ministry of Environmental Protection and the General Administration of Quality Supervision, Inspection and Quarantine, mandated for the first time in China the construction of a nationwide real-time air quality monitoring network with standardized pollutant indicators and compulsory public disclosure requirements, thereby establishing the institutionalized supply of environmental information. The BC strategy, promulgated by the State Council, funded large-scale fiber-optic deployment, expanded mobile broadband coverage, and reduced connectivity costs, thereby providing the digitalized dissemination channel for environmental information. Although the two policies were designed by separate government bodies with distinct objectives, they correspond precisely to the two core dimensions of environmental information transparency identified above. Within the information flow chain, the two policies are not independent of each other but sequentially linked. Implementing either policy in isolation risks interrupting the transmission of environmental information and weakening the effectiveness of environmental governance. Only when both policies operate jointly can a bidirectional and unobstructed information transmission mechanism be established, ensuring the effective implementation of environmental governance. The joint operation of the two policies therefore constitutes the de facto realization of environmental information transparency. Methodologically, the staggered implementation of the two policies across cities generates spatial–temporal variation that supports a difference-in-differences (DID) identification strategy.
Consequently, this research addresses three pivotal inquiries: whether environmental information transparency effectively catalyzes green innovation performance; if such catalytic effects exist, whether they manifest predominantly through quantitative expansion or qualitative enhancement of innovation; and through what underlying mechanisms these effects operate. To interrogate these propositions, our study leverages panel data encompassing 289 prefecture-level and higher cities across China from 2000 to 2023. Leveraging the rollout of the AAQS-2012 and the BC policy as quasi-natural experiments, this paper employs a multi-period DID design to examine the causal effect of environmental information transparency on green innovation performance. The findings reveal that dual-pilot policies not only significantly expand the quantity of urban green innovation but also enhance its quality. Mechanism analysis indicates these effects primarily operate through public environmental attention, environmental compliance pressure, and resource allocation. Further heterogeneity analysis shows that, compared to single-policy pilots, the dual policy demonstrates stronger institutional effectiveness and systemic advantages through institutional coordination and informational complementarity, underscoring the necessity of deep integration between environmental governance and digital infrastructure.
This paper makes three marginal contributions to the existing literature. First, it extends the application boundary of institutional complexity theory in multi-instrument environmental governance settings. Prior research on institutional complexity has largely focused on the tensions and conflicts among multiple formal institutions [12,13,15,16], and relevant studies usually treat formal regulatory enforcement and informal public oversight as independent drivers of green innovation separately [17,18], with limited attention paid to how the two governance forces can operate in coordination through a shared informational carrier. Building a tripartite government–public–enterprise analytical framework, this paper identifies environmental information transparency as the core carrier that connects these two forces: institutionalized disclosure of environmental information provides the factual basis for public oversight, while digital infrastructure reduces the cost of information access and strengthens the implementation effect of social supervision. This finding redirects analytical attention from institutional conflict to institutional linkage, expanding the applicable scope of institutional complexity theory. It also complements the research on boundary conditions of stakeholder theory, by clarifying that the availability and transmission efficiency of environmental information are critical prerequisites for public pressure to translate into substantive governance effects.
Second, it enriches the cross-domain research dimension of policy synergy theory. Existing studies on environmental policy mixes mostly center on the complementarity between homogeneous regulatory tools, and generally treat digital infrastructure as a neutral technological backdrop rather than an institutional factor that shapes the effectiveness of regulatory policies. While prior research acknowledges the separate roles of institutionalized disclosure of environmental information [21,22,23,24,37], it rarely articulates how the two coordinate with each other to shape innovation outcomes. This paper proposes and verifies a supply–transmission complementarity logic: the AAQS-2012 generates standardized environmental information from the supply side, while the Broadband China policy reduces the cost of information acquisition and diffusion from the transmission side. The two functions are interdependent, and the full governance potential of environmental information can only be released when both are in place. This finding extends the research scope of policy synergy from homogeneous instrument combinations to cross-domain synergy between regulatory standards and infrastructure investment, providing a new theoretical perspective for environmental policy mix design in the digital era.
Third, it clarifies the parallel transmission mechanisms through which environmental information transparency affects green innovation. The existing literature has not fully discussed the internal paths through which information-based environmental policies influence innovation. Through three parallel channels, namely public environmental attention, environmental compliance pressure, and resource allocation optimization, this paper systematically examines the transmission paths by which environmental information transparency drives urban green innovation, and unpacks the black box of how information-based governance shapes innovation performance. This mechanistic evidence supplements the micro empirical evidence on the driving factors of green transition in emerging economies, and provides a reference analytical framework for similar economies to evaluate the innovation effects of information-oriented environmental policies.

2. Policy Background

Rapid economic growth and accelerating urbanization in China have brought air pollution to the forefront of environmental policy concerns. In response, the Ministry of Environmental Protection and the General Administration of Quality Supervision, Inspection and Quarantine jointly issued promulgated the AAQS-2012. A defining feature of the AAQS-2012 was its requirement for more comprehensive and transparent disclosure of environmental quality information to the public. Compared with earlier environmental standards, the AAQS-2012 broadened the scope of the national air quality monitoring system by incorporating newly recognized pollutants such as PM2.5, while continuing to cover conventional pollutants including SO2 and NO2. The standards further required pilot cities to establish air quality monitoring stations, compile air quality data through a centralized reporting system, and disclose this information in real time to higher-level governments, environmental authorities, and the public.
Digital infrastructure has become a central element of national strategic infrastructure worldwide, closely linked to technological and industrial advancement and to national competitiveness. Its core components include next-generation information and communication technologies such as data centers, cloud computing, and artificial intelligence. These technologies depend on the availability of extensive broadband networks. Although China’s broadband coverage and access capabilities continued to improve, a number of structural challenges remained. These included the unclear public infrastructure status of broadband networks, marked regional and urban–rural disparities, limited diversity of digital applications, weak indigenous innovation capacity, and an underdeveloped institutional environment. In response, the State Council issued the Broadband China Strategy and Implementation Plan in 2013. The policy set out a phased pilot city deployment plan for the period from 2014 to 2016, with the stated objectives of accelerating broadband infrastructure construction, lowering user access barriers, and expanding network coverage and performance. By the end of September 2023, fiber-to-the-home ports nationwide had reached 1.08 billion, achieving near-universal coverage in administrative villages, while the number of 5G base stations built and activated had reached 3.189 million. Coverage extended to all urban districts of prefecture-level cities and county seats, with further expansion into townships and administrative villages. According to the China Broadband Development White Paper (2023), the national broadband network by this point provided nationwide coverage and high-speed connectivity.
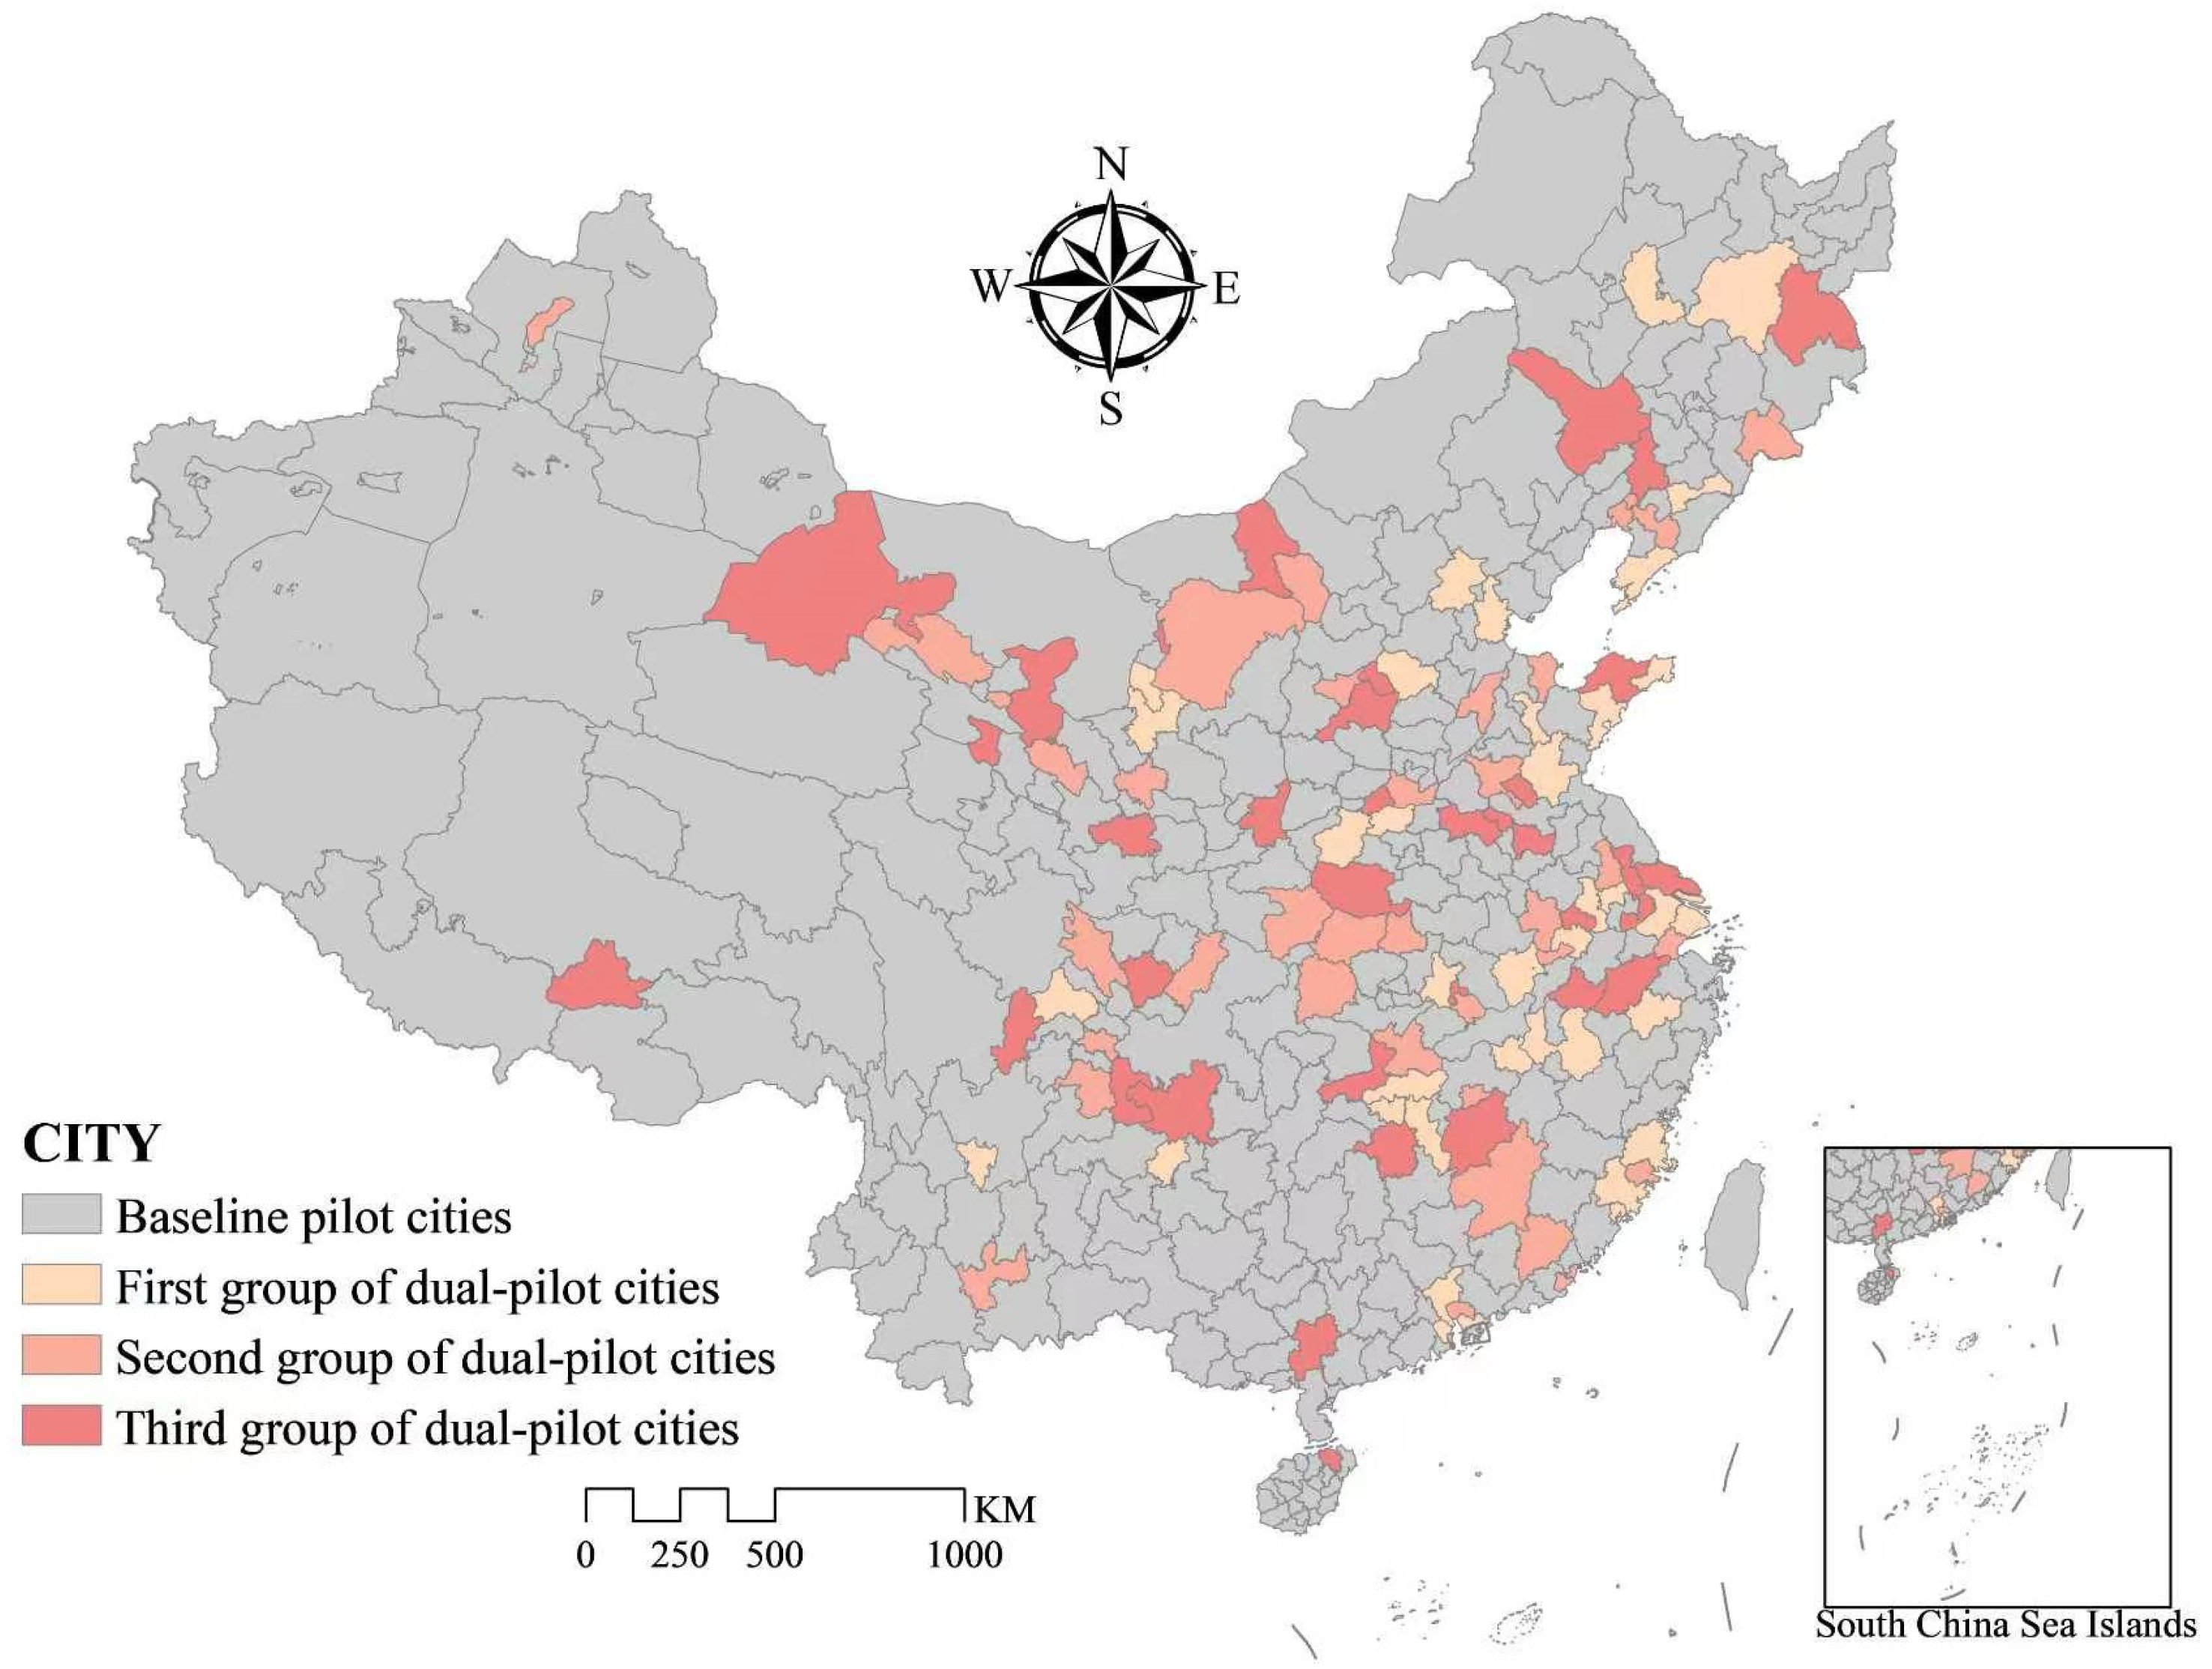
By 2024, following the nationwide implementation of the AAQS-2012 and the phased rollout of the BC policy, the two policies covered 338 and 120 prefecture-level and above cities, respectively. Of these, 105 cities had implemented both policies concurrently, thereby constituting the dual-pilot cities whose geographical distribution is shown in Figure 1. Although the two policies differed in their primary objectives, city selection criteria, and implementation pace, both significantly enhanced environmental information transparency and public accessibility. The AAQS-2012 adopted a gradual rollout policy, initially implemented in core cities before progressively extending to all prefecture-level cities nationwide. This approach ensured steady policy advancement and incremental impact assessment. In contrast, the BC policy emphasized establishing a multi-tiered and diverse pilot city framework. Regarding the implementation timeline, the AAQS-2012 pilot phase commenced in 2012, initially focusing on highly developed economic regions such as the Beijing–Tianjin–Hebei (BTH), Yangtze River Delta (YRD), and Pearl River Delta (PRD) areas, as well as municipalities directly under the central government and provincial capitals. The BC policy, however, began its nationwide phased implementation from 2014 onwards.
Three considerations motivate the selection of the AAQS-2012 and the BC policy as a joint quasi-natural experiment. First, the two policies exhibit functional complementarity that maps onto the two core dimensions of environmental information transparency. The AAQS-2012, jointly issued by the Ministry of Environmental Protection and the General Administration of Quality Supervision, Inspection and Quarantine, addresses the supply side by establishing a unified national real-time air quality monitoring system, standardizing pollutant measurement indicators, and mandating regular public disclosure of monitoring data. The BC strategy, issued by the State Council, addresses the dissemination side by expanding broadband network coverage, improving internet access speed and affordability, and lowering the cost for the public, enterprises, and regulatory authorities to obtain, transmit, and utilize environmental information. Only when standardized environmental information is made widely accessible through digital infrastructure does environmental information transparency become operative at the city level. The two policies together thus form a linked chain from information production and disclosure to information diffusion and utilization, which aligns more closely with the theoretical construct of environmental information transparency than either policy alone. Second, the two policies were issued by different government bodies and operate at different institutional levels, which reflects the multi-tiered architecture of China’s environmental governance. The AAQS-2012 functions as a sector-specific regulatory standard that sets the institutional rules and data foundation for institutionalized disclosure of environmental information, while the BC strategy serves as a national infrastructure initiative that supplies the technical carrier and transmission channel for information dissemination. Although operating at different institutional levels, the two policies converge on the common goal of improving environmental information accessibility, jointly constituting a policy mix that combines institutional norms with technical infrastructure. Third, both policies were rolled out in staggered fashion across cities, each following its own selection criteria and implementation timeline. This staggered implementation design supports the identification strategy of the multi-period DID model.
Underpinning this complementary framework, although the AAQS-2012 and the BC Policy exhibit distinct objectives and operational approaches, they converge in enhancing environmental information transparency. Scholarly research indicates that AAQS-2012 established a pivotal data foundation for environmental regulation through the implementation of a nationwide real-time air quality monitoring network [24,38]. The real-time data generated by this infrastructure, coupled with systematic public disclosure mechanisms, have shifted regulatory practice from uniform, across-the-board approaches toward more precisely targeted governance, thereby strengthening regulatory effectiveness. Illustratively, leveraging this monitoring framework, multiple cities within the Beijing–Tianjin–Hebei region have developed capabilities for three-day granular forecasts and seven-day trajectory projections. This technological advancement has facilitated dynamic optimization of peak-shifting production policies: regulatory authorities have replaced standardized production restriction mandates with tailored adjustments of industrial operational schedules based on air quality prognoses, actualizing nuanced environmental stewardship. Concurrently, information transparency has empowered public oversight as a potent constraint against corporate environmental violations. Empirical evidence confirms that civic utilization of publicly accessible data to report infractions through social media platforms generates substantive external pressure, significantly curtailing subsequent environmental non-compliance incidents and emission levels among cited enterprises [39]. The efficacy of such public oversight mechanisms based on information technology critically depends on ubiquitous, high-speed, and affordable internet access. Herein lies the pivotal role of the BC policy in providing digital infrastructure support. Through large-scale fiber-optic deployment, enhanced mobile broadband coverage, and reduced connectivity costs, the BC substantially elevated nationwide internet penetration and network quality [40]. This enabled broader public access to environmental data, social media engagement, and participatory environmental monitoring. As evidenced by He et al. [41], the BC‘s implementation significantly reduced corporate pollution emissions and improved environmental performance by strengthening external supervision, facilitating technological upgrading, and optimizing management practices.
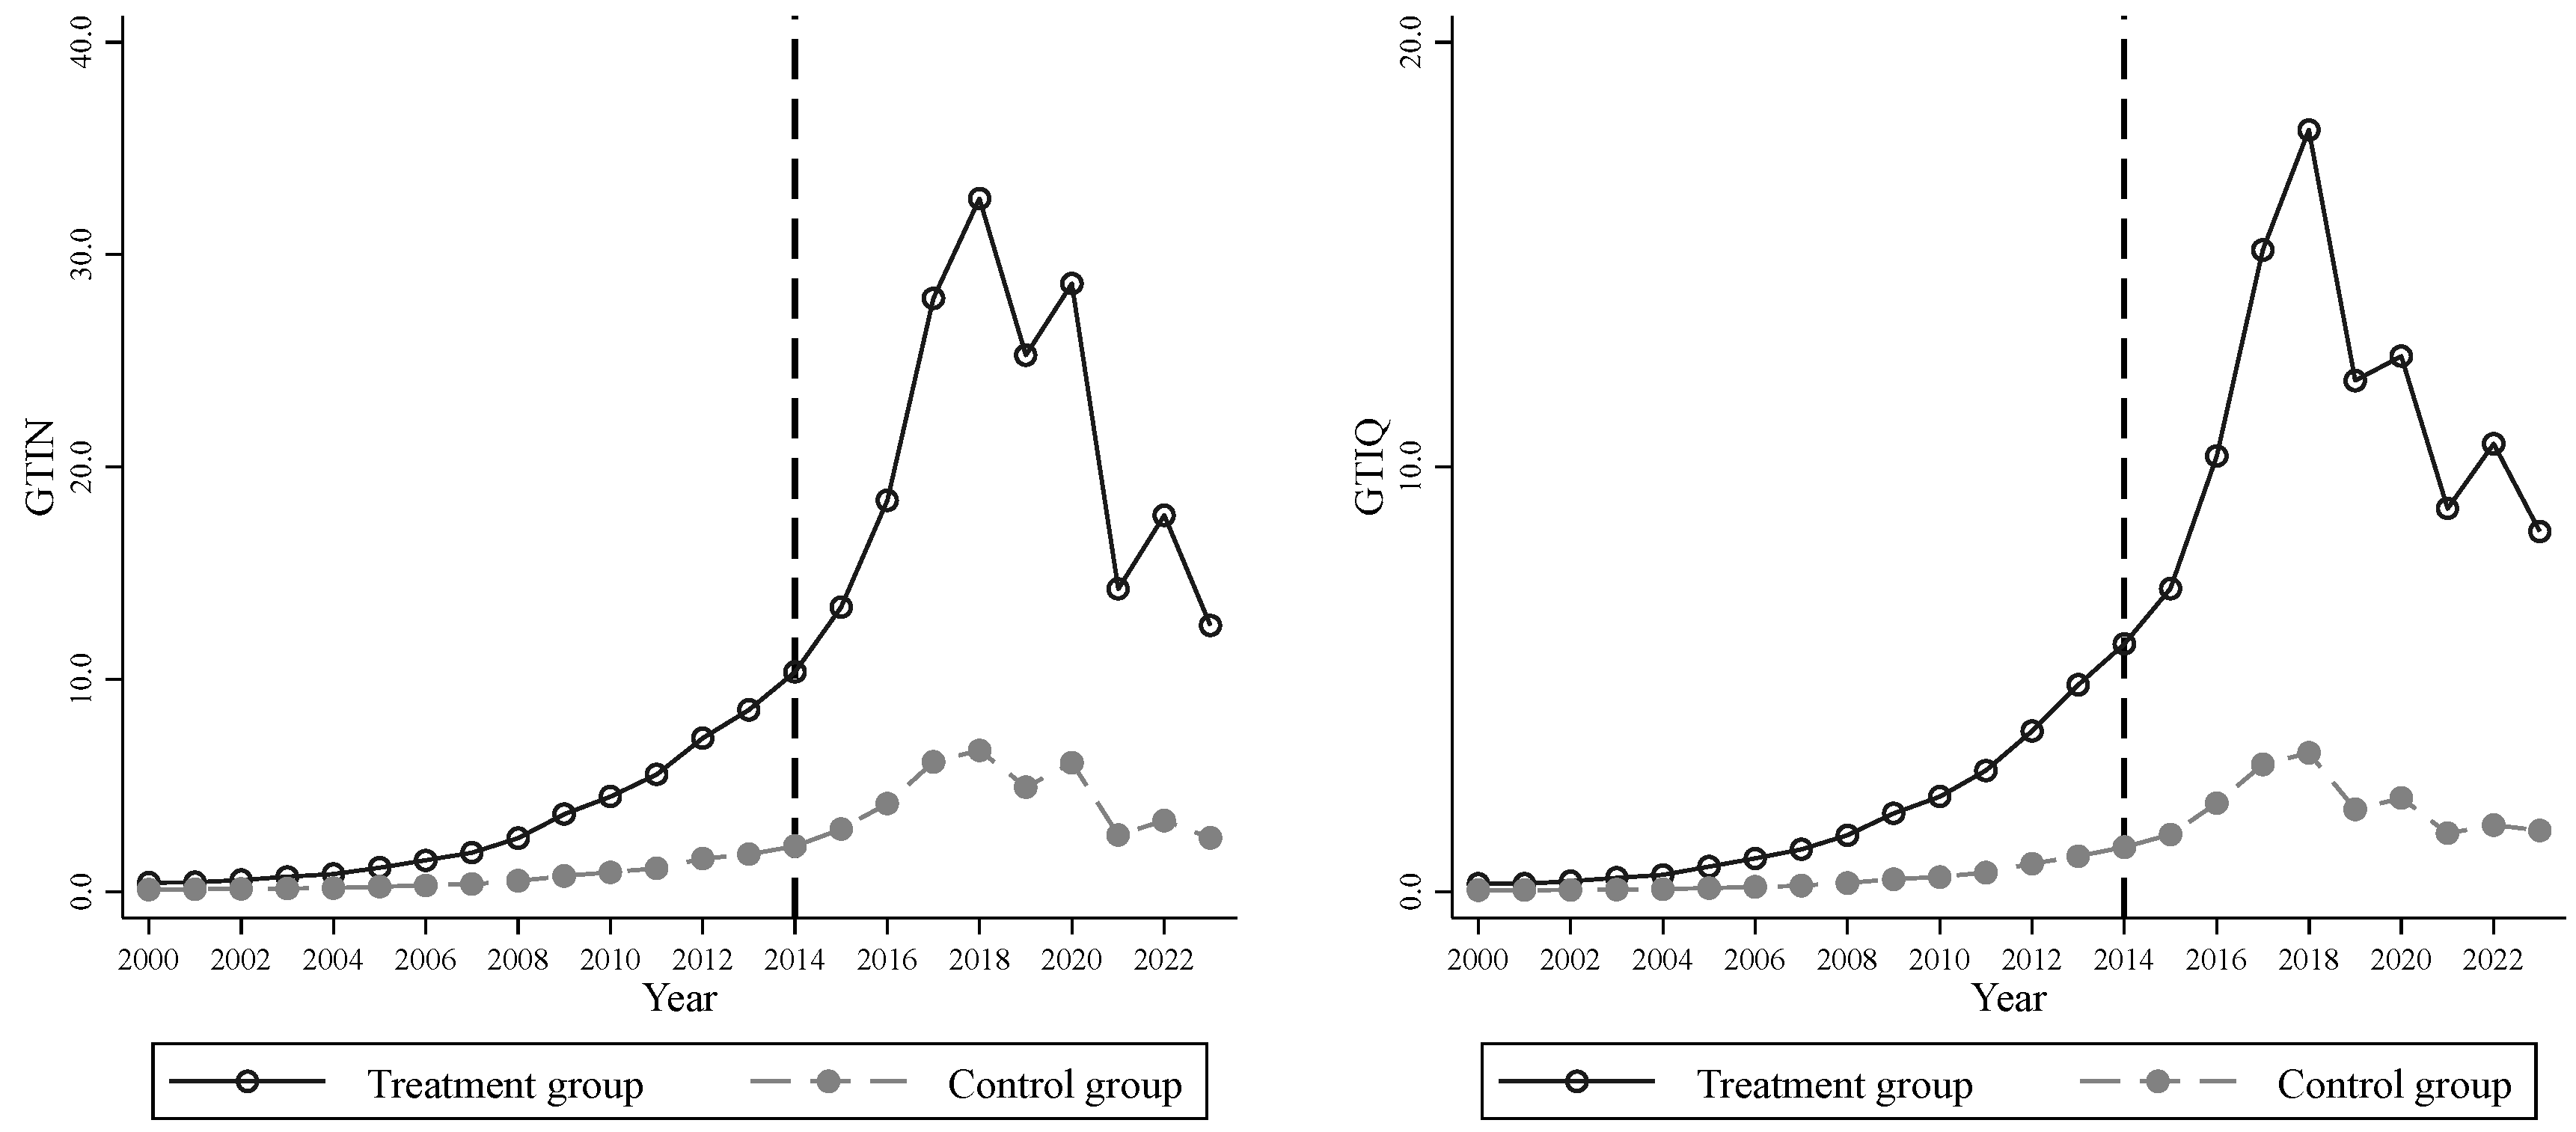
Figure 2 displays the evolution of green innovation quantity and quality for dual-pilot and non-pilot cities around the joint implementation of the AAQS-2012 and the BC policy. Prior to 2014, the two groups followed nearly identical growth trajectories, with the compound annual growth rate differing by only 1.1 percentage points for quantity and 0.6 percentage points for quality, which provides descriptive support for the parallel trend assumption. From 2014 to 2018, the treatment group registered an average increase of 22.30 hundred green patents in quantity and 12.10 hundred green invention patents in quality, compared with gains of 4.51 hundred and 2.22 hundred in the control group. After patent examination standards were tightened nationwide in 2018, a clear divergence emerged in the quality dimension. Green invention patents in the treatment group contracted at an annual rate of 14.0 percent, a smaller contraction than the 15.2 percent recorded in the control group, while the quantity of green patents exhibited no meaningful difference. These descriptive trends indicate that the dual-pilot policies are associated with superior green innovation performance, especially in quality, and motivate the formal empirical analysis that follows.

3. Theoretical Analysis and Hypothesis Development

3.1. The Direct Effect of Environmental Information Transparency on Green Innovation Performance

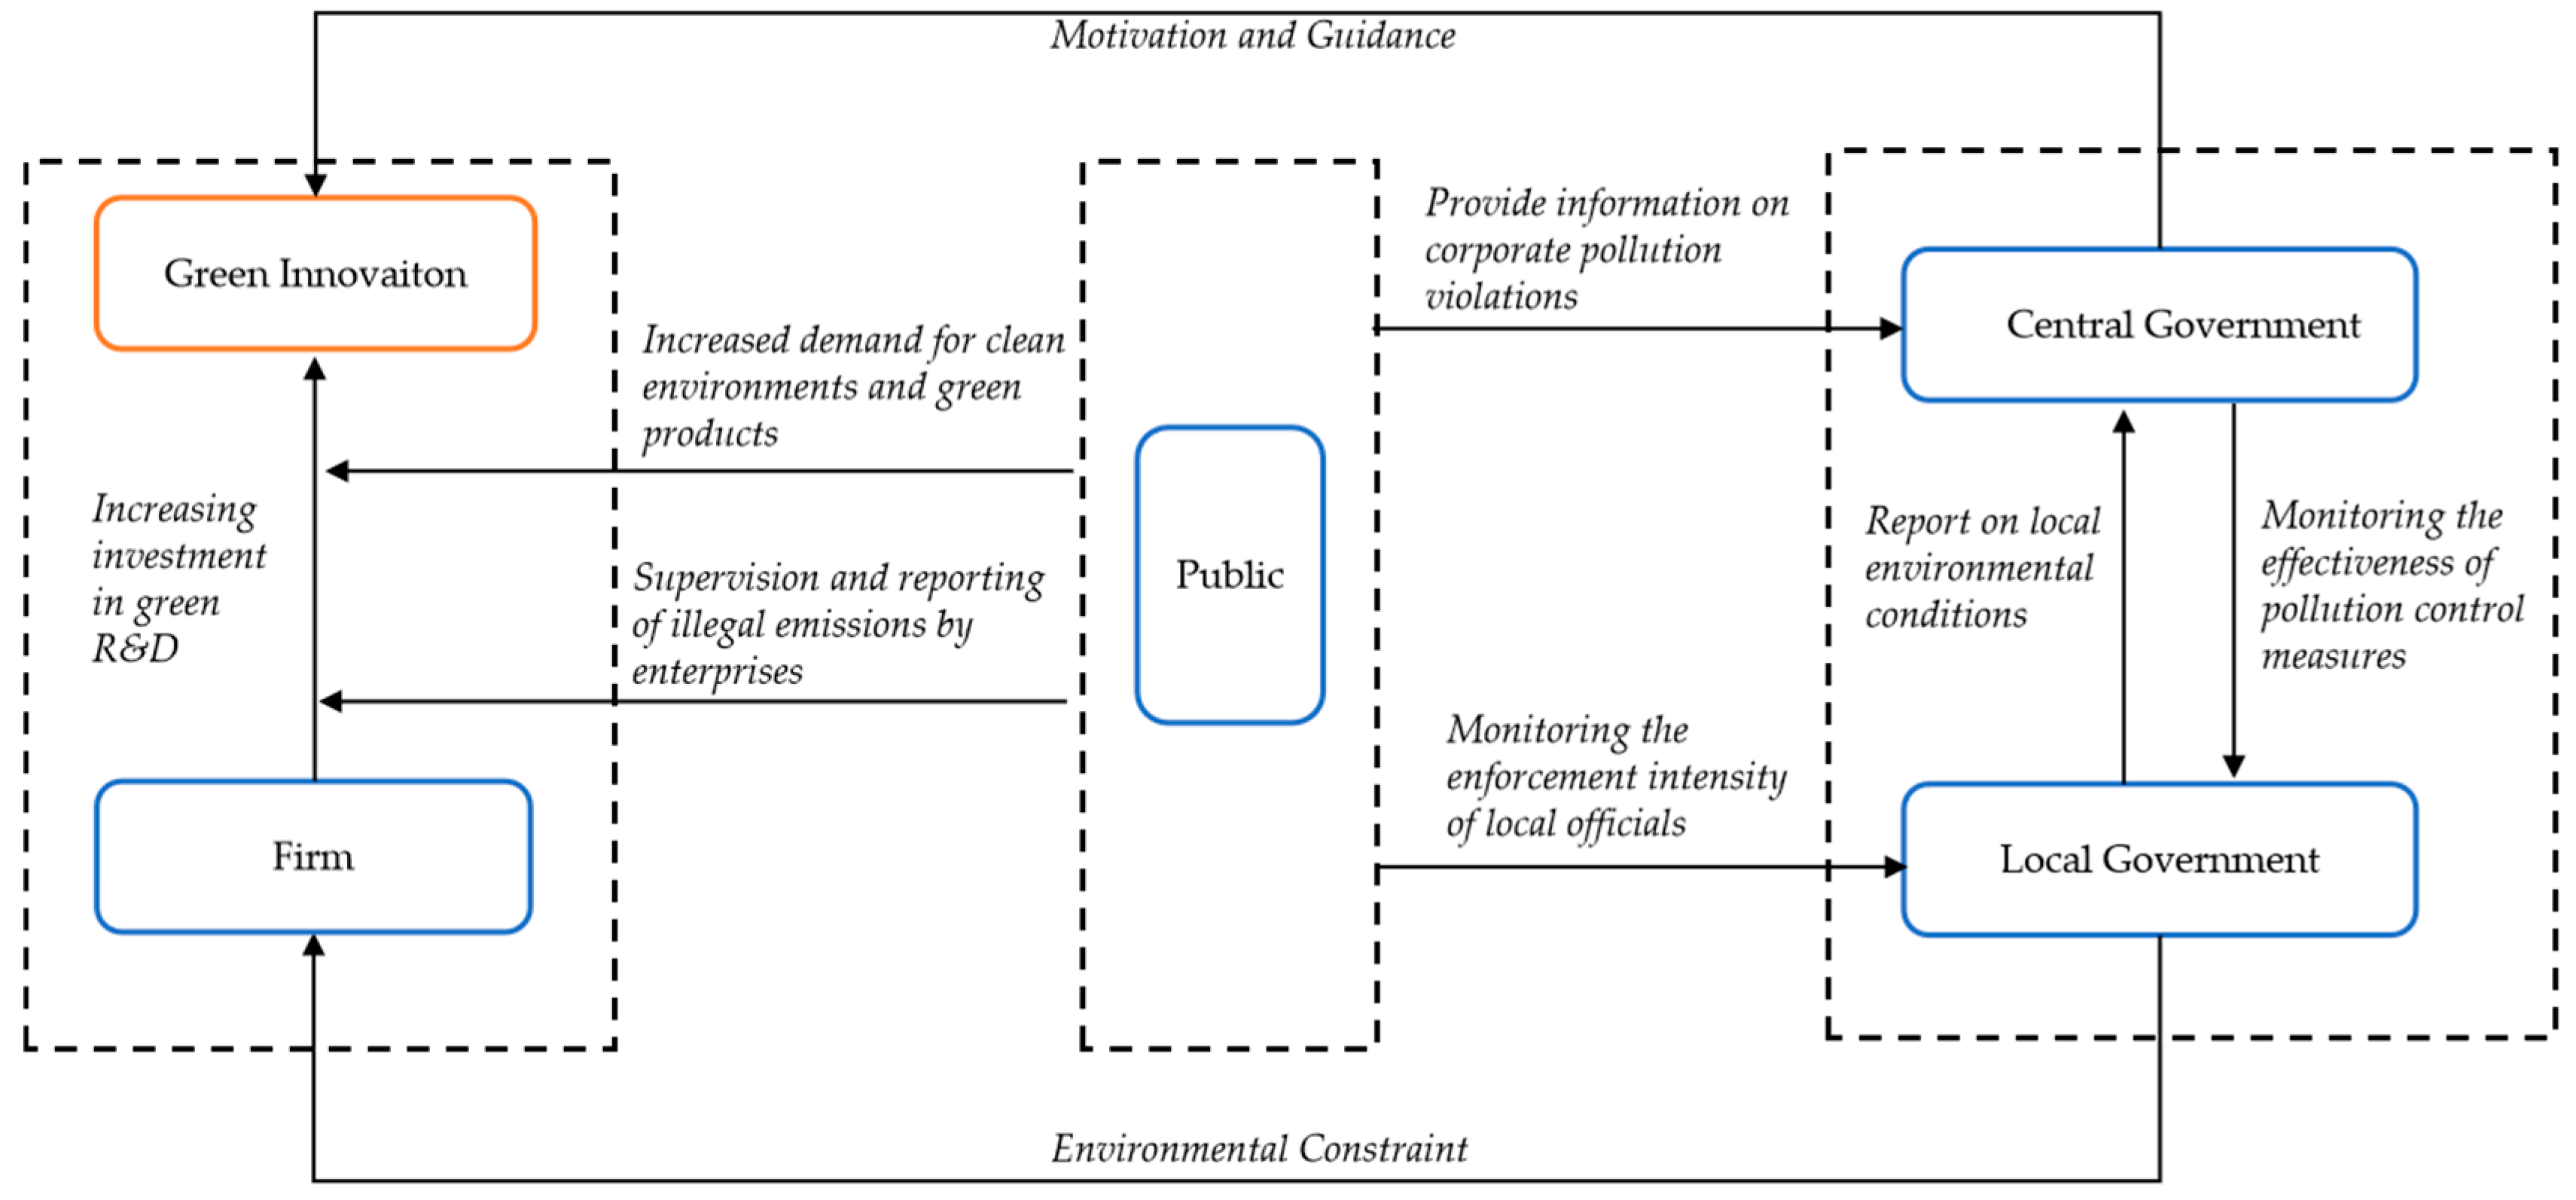
Drawing on information asymmetry theory, this paper examines how environmental information transparency shapes the decisions of three key actors in environmental governance, namely governments, the public, and enterprises. This paper constructs a tripartite theoretical framework, illustrated in Figure 3, that traces how transparency influences each actor and, through their interactions, contributes to green innovation. The framework is developed along three pathways.
The first pathway concerns government decision-making. Environmental information transparency can serve a dual function as both an incentive and a disciplinary mechanism. On one hand, transparency empowers the central government to monitor environmental conditions at the municipal level more accurately, facilitating the formulation and adjustment of environmental constraint targets and strengthening the oversight of local environmental governance performance [42,43]. This tightening of top-down environmental constraints and oversight encourages local governments to shift from lax enforcement toward more stringent regulatory approaches. Faced with sustained environmental regulatory pressure, polluting enterprises have stronger incentives to invest in environmental technology research and development or to adopt pollution control technologies and services [44]. On the other hand, environmental information transparency amplifies the public scrutiny of government enforcement and intensifies public opinion pressure on regulators [45,46]. In response, the central government optimizes resource allocation by prioritizing support for green enterprises and research projects, thereby advancing strategic sustainable development goals [35]. This reallocation of resources toward green activities can accelerate the development and diffusion of environmental technologies, including those in clean energy and eco-friendly materials, while promoting the green transformation of traditional industries.
The second pathway concerns public participation. Extensive research has documented the severe health consequences of air pollution [47,48], including elevated rates of total and infant mortality [49,50] and increased incidences of lung cancer and respiratory diseases [3,4]. These findings have heightened public demand for a cleaner environment. Enhanced environmental information transparency strengthens public awareness of local environmental conditions and encourages greater engagement in environmental protection, enabling citizens to serve as societal monitors of pollution. With the ability to observe emissions, the public can use various media channels, such as microblogs, hotlines, and online platforms, to report illegal corporate discharges to authorities [39,45,46]. This form of bottom-up supervision not only presses governments to strengthen regulatory enforcement but also helps to curb corporate rent-seeking behavior [51], providing firms with additional motivation to develop and adopt environmental technologies. Furthermore, heightened public awareness of actual pollution levels can prompt shifts in consumption attitudes and behaviors [23,24]. By purchasing or investing in environmentally friendly products such as air purifiers, the public creates new market demand, which in turn directs enterprises toward green research and development and channels societal resources toward more sustainable patterns of production and consumption.
The third pathway concerns corporate behavior. Environmental information transparency renders previously hidden environmental costs more visible, thereby increasing the financial burden associated with corporate pollution [52]. To reduce pollution fees and environmental taxes [53], improve energy efficiency [54], and maintain competitive advantage, firms have greater motivation to incorporate sustainability considerations into their daily operations and long-term strategic planning. This shift often begins with the adoption of non-innovative environmental measures, such as procuring green equipment [55], utilizing eco-friendly materials, or engaging green services. The operational pressure to reduce environmental costs, together with growing market demand from the public for green products [56,57], creates new market opportunities that encourage firms to move beyond such measures and invest in green innovation. In parallel, the government’s preference for green industries in resource allocation, manifested through instruments such as government green procurement, further prompts enterprises to increase their investment in the research, development, and application of green technologies [58].
Therefore, based on the preceding analysis of the multifaceted impacts of environmental information transparency on governmental decision-making, public participation, and corporate behavior, this paper proposes its first core hypothesis:
H1: 
Environmental information transparency positively affects the quantity and quality of urban green innovation.

3.2. The Mechanism Effect of Environmental Information Transparency on Green Innovation Performance

3.2.1. Public Environmental Complaints

Information asymmetry represents a persistent barrier to environmental governance. Akerlof [59] showed that the uneven distribution of information can lead to market failure and resource misallocation. In environmental governance, firms that generate pollution hold an informational advantage over the public, who bear the consequences of environmental degradation yet lack direct access to pollution data. This asymmetric weakens both the capacity and willingness of the public to participate in environmental monitoring. The dual policies reshape this information landscape by mandating the systematic disclosure of corporate pollution data and government enforcement information, reducing the cost for the public to access environmental information, and thereby breaking down the information barrier between firms and society [20,60].
Stakeholder theory, as advanced by Freeman [61], suggests that the long-term viability of firms depends on their ability to respond to the demands of diverse stakeholders. Environmental information transparency can strengthen public environmental awareness and participation capacity, enabling individuals to move from passively receiving environmental information to actively monitoring environmental conditions [62]. This shift in the public’s role strengthens oversight of both government enforcement and corporate pollution, and increases the legitimacy pressure on firms to improve their environmental performance [46]. Rising environmental and energy costs create incentives for firms to pursue cost savings and risk mitigation through green innovation [63,64].
The demand-pull theory of innovation offers an explanation for how shifts in public preferences can stimulate green innovation [65,66]. Environmental information transparency not only reinforces public monitoring of polluting activities but also shapes green consumption preferences. Studies indicate that public demand for green products and services continues to grow, with higher expectations for product variety and quality [23]. This shift on the demand side can create new market opportunities and signal the direction of technological development for innovative firms. Driven by green market demand, firms compete to increase investment in green technology research and development [67]. The resulting competition can accelerate the iteration and diffusion of green technologies, contributing to improvements in both the quantity and the quality of urban green innovation at the city level. Based on the foregoing analysis, this paper proposes the following hypothesis:
H2: 
Environmental information transparency increases green innovation performance through public environmental attention.

3.2.2. Government Environmental Regulation

Institutional theory provides an analytical framework for understanding how environmental regulation shapes corporate green innovation behavior [68]. DiMaggio and Powell [69] identify three institutional forces that shape organizational behavior, namely regulative pressure, normative pressure, and cognitive pressure. The implementation of environmental information transparency can amplify the transmission effect of regulative pressure [70]. Public disclosure of pollution data exposes corporate environmental behavior to scrutiny from government regulators, media, and the public, increasing the likelihood that violations will be detected, exposed, and penalized [71]. This intensified institutional pressure creates incentives for firms to treat environmental issues as a strategic priority and to reassess their investment in environmental technology and innovation.
The Porter Hypothesis further posits a positive relationship between well-designed environmental regulation and corporate innovation [72]. Porter and van der Linde [12] argue that well-designed environmental regulations can stimulate corporate innovation potential, enabling firms to offset or even exceed compliance costs through technological progress and simultaneously improve both environmental and economic performance. Environmental information transparency can reinforce the under which the Porter effect operates, by increasing the credibility and enforceability of environmental regulations [73]. Compliance pressure creates strong demands for emission reduction and technological upgrading among polluting firms [72,74]. However, constrained in R&D funding, technological accumulation, and innovation capacity can limit the ability of these firms to independently undertake green technology development [75].
To cope with external regulatory pressure, polluting firms tend to procure green equipment and technologies through market channels [76]. This procurement demand can generate market opportunities for the green technology industry [67]. In response to this market signal, innovative firms may increase investment in green technology research and development, creating a self-reinforcing dynamic among regulatory pressure, technology demand, and innovation supply [77]. This transmission mechanism can contribute to the overall pace of urban green innovation and may facilitate a gradual shift from quantitative expansion toward qualitative improvement. Based on the above analysis, this paper proposes the following hypothesis:
H3: 
Environmental information transparency increases green innovation performance through environmental compliance pressure.

3.2.3. Resource Allocation

The Resource-Based View posits that a firm’s competitive advantage derives from its capacity to acquire and integrate heterogeneous resources [78]. Green innovation typically requires substantial investment, long development cycles, and tolerance for risk, and thus depends on the availability of key factor inputs including capital, talent, and technology. Enhanced environmental information transparency can alter the institutional environment and incentive structures that govern resource allocation, thereby improving the conditions under which innovative enterprises obtain access to essential resources [79].
Signaling theory provides a lens for understanding how environmental information guides resource allocation [80]. Spence [81] argues that under conditions of information asymmetry, high-quality actors can distinguish themselves by transmitting credible signals, thereby gaining priority in resource allocation. Environmental information transparency performs a similar signaling function. The transparency of pollution data intensifies accountability pressure on government environmental performance, while the improved observability of corporate environmental behavior enables governments and markets to identify firms and projects with green development potential more accurately.
Under sustained pressure from pollution reduction mandates and dual-carbon targets, local governments tend to favor green industries in resource allocation decisions [82,83,84]. This preference manifests in the preferential allocation of critical resources, including fiscal funds, tax incentives, land supply, and financial credit, toward green enterprises and R&D projects [80]. Such targeted resource infusion effectively alleviates financing constraints faced by innovative enterprises during green technology development, reduces the risk and uncertainty associated with innovation activities, and consequently incentivizes firms to increase R&D investment.
The reallocation of resources toward green sectors can generate spillover effects that extend beyond the directly supported firms and projects. Government investment targeted at green sectors can accelerate the development and diffusion of environmental technologies, support the growth of strategic emerging industries such as clean energy and eco-friendly materials, and encourage the transformation of traditional industries toward low-carbon modes of production [85]. These shifts at the industrial level can contribute to an environment that supports innovation, thereby creating conditions under which both the quantity and the quality of urban green innovation may improve. Based on the above analysis, this paper proposes the following hypotheses:
H4: 
Environmental information transparency facilitates green innovation performance by enabling efficient resource allocation.

4. Model and Data

4.1. Model Specification

This paper employs a multi-period DID model to assess the treatment effect of the dual-pilot policies, namely the AAQS-2012 and the BC policy, on green innovation performance. To mitigate potential endogeneity concerns, the model incorporates two-way fixed effect (TWFE) at both the city and year levels. The model is set as follows:
Y i t = α 0 + α 1 I n f o r m a t i o n i t + λ X i t + μ i + γ t + ε i t
In Equation (1), Y i t denotes the quantity or quality of green innovation in city i and year t . The variable I n f o r m a t i o n i t is a binary indicator for environmental information transparency, equaling 1 if city i implemented both the AAQS-2012 and the BC policy in year t , and 0 otherwise. The vector X i t comprises a set of control covariates. City fixed effects ( μ i ) and year fixed effects ( γ t ) are included to absorb unobserved heterogeneity, while ε i t represents the idiosyncratic error term. Robust standard errors are clustered at the city level to address potential serial correlation and heteroskedasticity.

4.2. Variable Setting

4.2.1. Dependent Variables

Patent data serve as a core indicator for measuring innovation performance. Following prior research, this paper excludes green design patents because their inventive content is generally limited and their examination timelines vary substantially and are difficult to anticipate [22,86]. This paper measures the quantity of urban green innovation, denoted GTIN, as the sum of green invention patent applications and green utility model patent applications filed in each city per year, capturing the overall scale of green innovation activity. The quality of urban green innovation, denoted GTIQ, is measured by the count of green invention patent applications alone. Under China’s patent system, invention patent applications are subject to substantive examination, which entails a rigorous assessment of technical novelty, inventiveness, and practical applicability. Utility model patents, by contrast, undergo only a formal examination that does not evaluate inventive step. This institutional difference means that invention patents typically embody greater technical sophistication and higher innovative value, providing an institutional basis for distinguishing innovation quality by patent type and making green invention patent applications a reasonable proxy for high-quality green innovation. This approach has been widely adopted in city-level green innovation studies [87]. In the robustness checks, this paper also employs the count of granted green invention patents as an alternative quality indicator. Unlike applications, granted patents have passed the full substantive examination process and can therefore more accurately reflect high-quality innovative output that has received official recognition.

4.2.2. Independent Variables

The key independent variable, the dual-pilot policies (Information), is constructed as the interaction term between the city-level treatment dummy ( T r e a t i ) and the time period dummy ( T i m e i t ). Cities implementing both the Ambient Air Quality Standards and the “Broadband China” pilot policies concurrently are assigned to the treatment group ( T r e a t i = 1); all other cities constitute the control group ( T r e a t i = 0). For cities in the treatment group, T i m e i t is coded as 1 for the initial year of the dual-pilot policies implementation and all subsequent years, and 0 for the years preceding the implementation.

4.2.3. Control Variables

To mitigate potential confounding effects from other determinants of urban green innovation, this paper incorporates a comprehensive set of control variables in line with the established literature. These include economic development, measured by per capita GDP (PGDP); industrial structure upgrading, captured by the ratio of the value-added of the tertiary to the secondary sector (Industry); scientific and technological advancement, proxied by the share of science and technology expenditure in the total public budget (ST); foreign direct investment intensity, represented by the proportion of actually utilized FDI to regional GDP (FDI), with amounts converted to RMB using annual average exchange rates; and population scale, measured by the natural logarithm of the year-end registered population (POP). These controls account for macroeconomic conditions, innovation resource allocation, knowledge infrastructure, international technology spillovers, and agglomeration effects relevant to green innovation.

4.3. Data Sources

Utilizing panel data spanning the period 2000–2023 for 289 prefecture-level and above cities in China, this paper accounts for data availability and administrative boundary changes. The final sample comprises 105 cities designated as dual-pilot cities under both the AAQS-2012 and the BC policy, alongside 184 non-dual-pilot cities. Data on the AAQS-2012 pilot cities were manually compiled from the official website of the Ministry of Ecology and Environment of China. Similarly, data identifying the BC policy were manually compiled from the official website of the Ministry of Industry and Information Technology of China. Data on green patents were sourced from the China National Intellectual Property Administration. The Baidu Search Index data were collected and verified using Python-based web scraping techniques implemented in PyCharm Community Edition 2022.1.2, followed by manual validation. City-level socioeconomic and environmental data were primarily obtained from the China City Statistical Yearbook and provincial statistical yearbooks. Firm-level data were extracted from the China Stock Market & Accounting Research Database covering the years 2003 to 2023 (Given the challenges in data acquisition and the significant influence of listed firms in the market, this paper utilizes firm-level data from companies listed on the Shanghai and Shenzhen A-share markets in China. To ensure data accuracy and analytical validity, financial firms, as well as companies designated as ST or *ST, were excluded from the sample). Table 1 presents descriptive statistics for all primary variables.

5. Empirical Results

5.1. Baseline Regression

Table 2 presents baseline regression results estimating Model (1) for both GTIN and GTIQ. As reported in columns (1) to (4) of Table 2, the dual-pilot policies significantly promote both the quantity and quality of green innovation, irrespective of the inclusion of city-level control variables. As a further check, the analysis excludes all observations from cities that were covered by only one of the two policies during the sample period, retaining cities with neither policy as the control group. The results in columns (5) and (6) of Table 2 show that the estimated coefficients remain positive and statistically significant for both the quantity and the quality of green innovation. Our results empirically validate the conclusions posited by Li et al. [22] and Zhang et al. [21] regarding the catalytic role of the institutionalized disclosure of environmental information in fostering green innovation. Furthermore, it elucidates that the synergistic interaction between efficient information dissemination and institutionalized disclosure of environmental information mechanisms significantly drives the enhancement of green innovation quality.

5.2. Validation of the Effectiveness of the DID Method

5.2.1. Parallel Trend Test and Dynamic Effect Test

To ensure the validity of the DID estimation, this paper must satisfy the parallel trend assumption, which posits that the treatment and control groups exhibited similar trends in green innovation levels prior to the policy implementation. Following the approach of Jacobson et al. [88], this paper employ an event study framework to test whether this assumption holds for the two groups and to simultaneously examine the dynamic effects of the dual-pilot policies in the treated cities. The model is specified as follows:
Y i t = θ 0 + k = 5 5 θ k I n f o r m a t i o n i t k + δ X i t + μ i + γ t + ε i t
In this specification, Y i t represents green innovation performance. The set of dummy variables I n f o r m a t i o n k identifies dual pilot cities relative to the policy implementation year. Specifically, for city i , let τ i denote the specific year it became a dual-pilot city, and define k = t τ i . Thus, when k = 0 (the implementation year itself), I n f o r m a t i o n 0 = 1 for city i , and 0 otherwise; when k = 1 (one year after implementation), I n f o r m a t i o n 1 = 1 for city i , and 0 otherwise; and when k = −1 (one year before implementation), I n f o r m a t i o n 1 = 1 for city i , and 0 otherwise. Variables for other leads ( k < −1) and lags ( k > 1 ) are defined analogously.
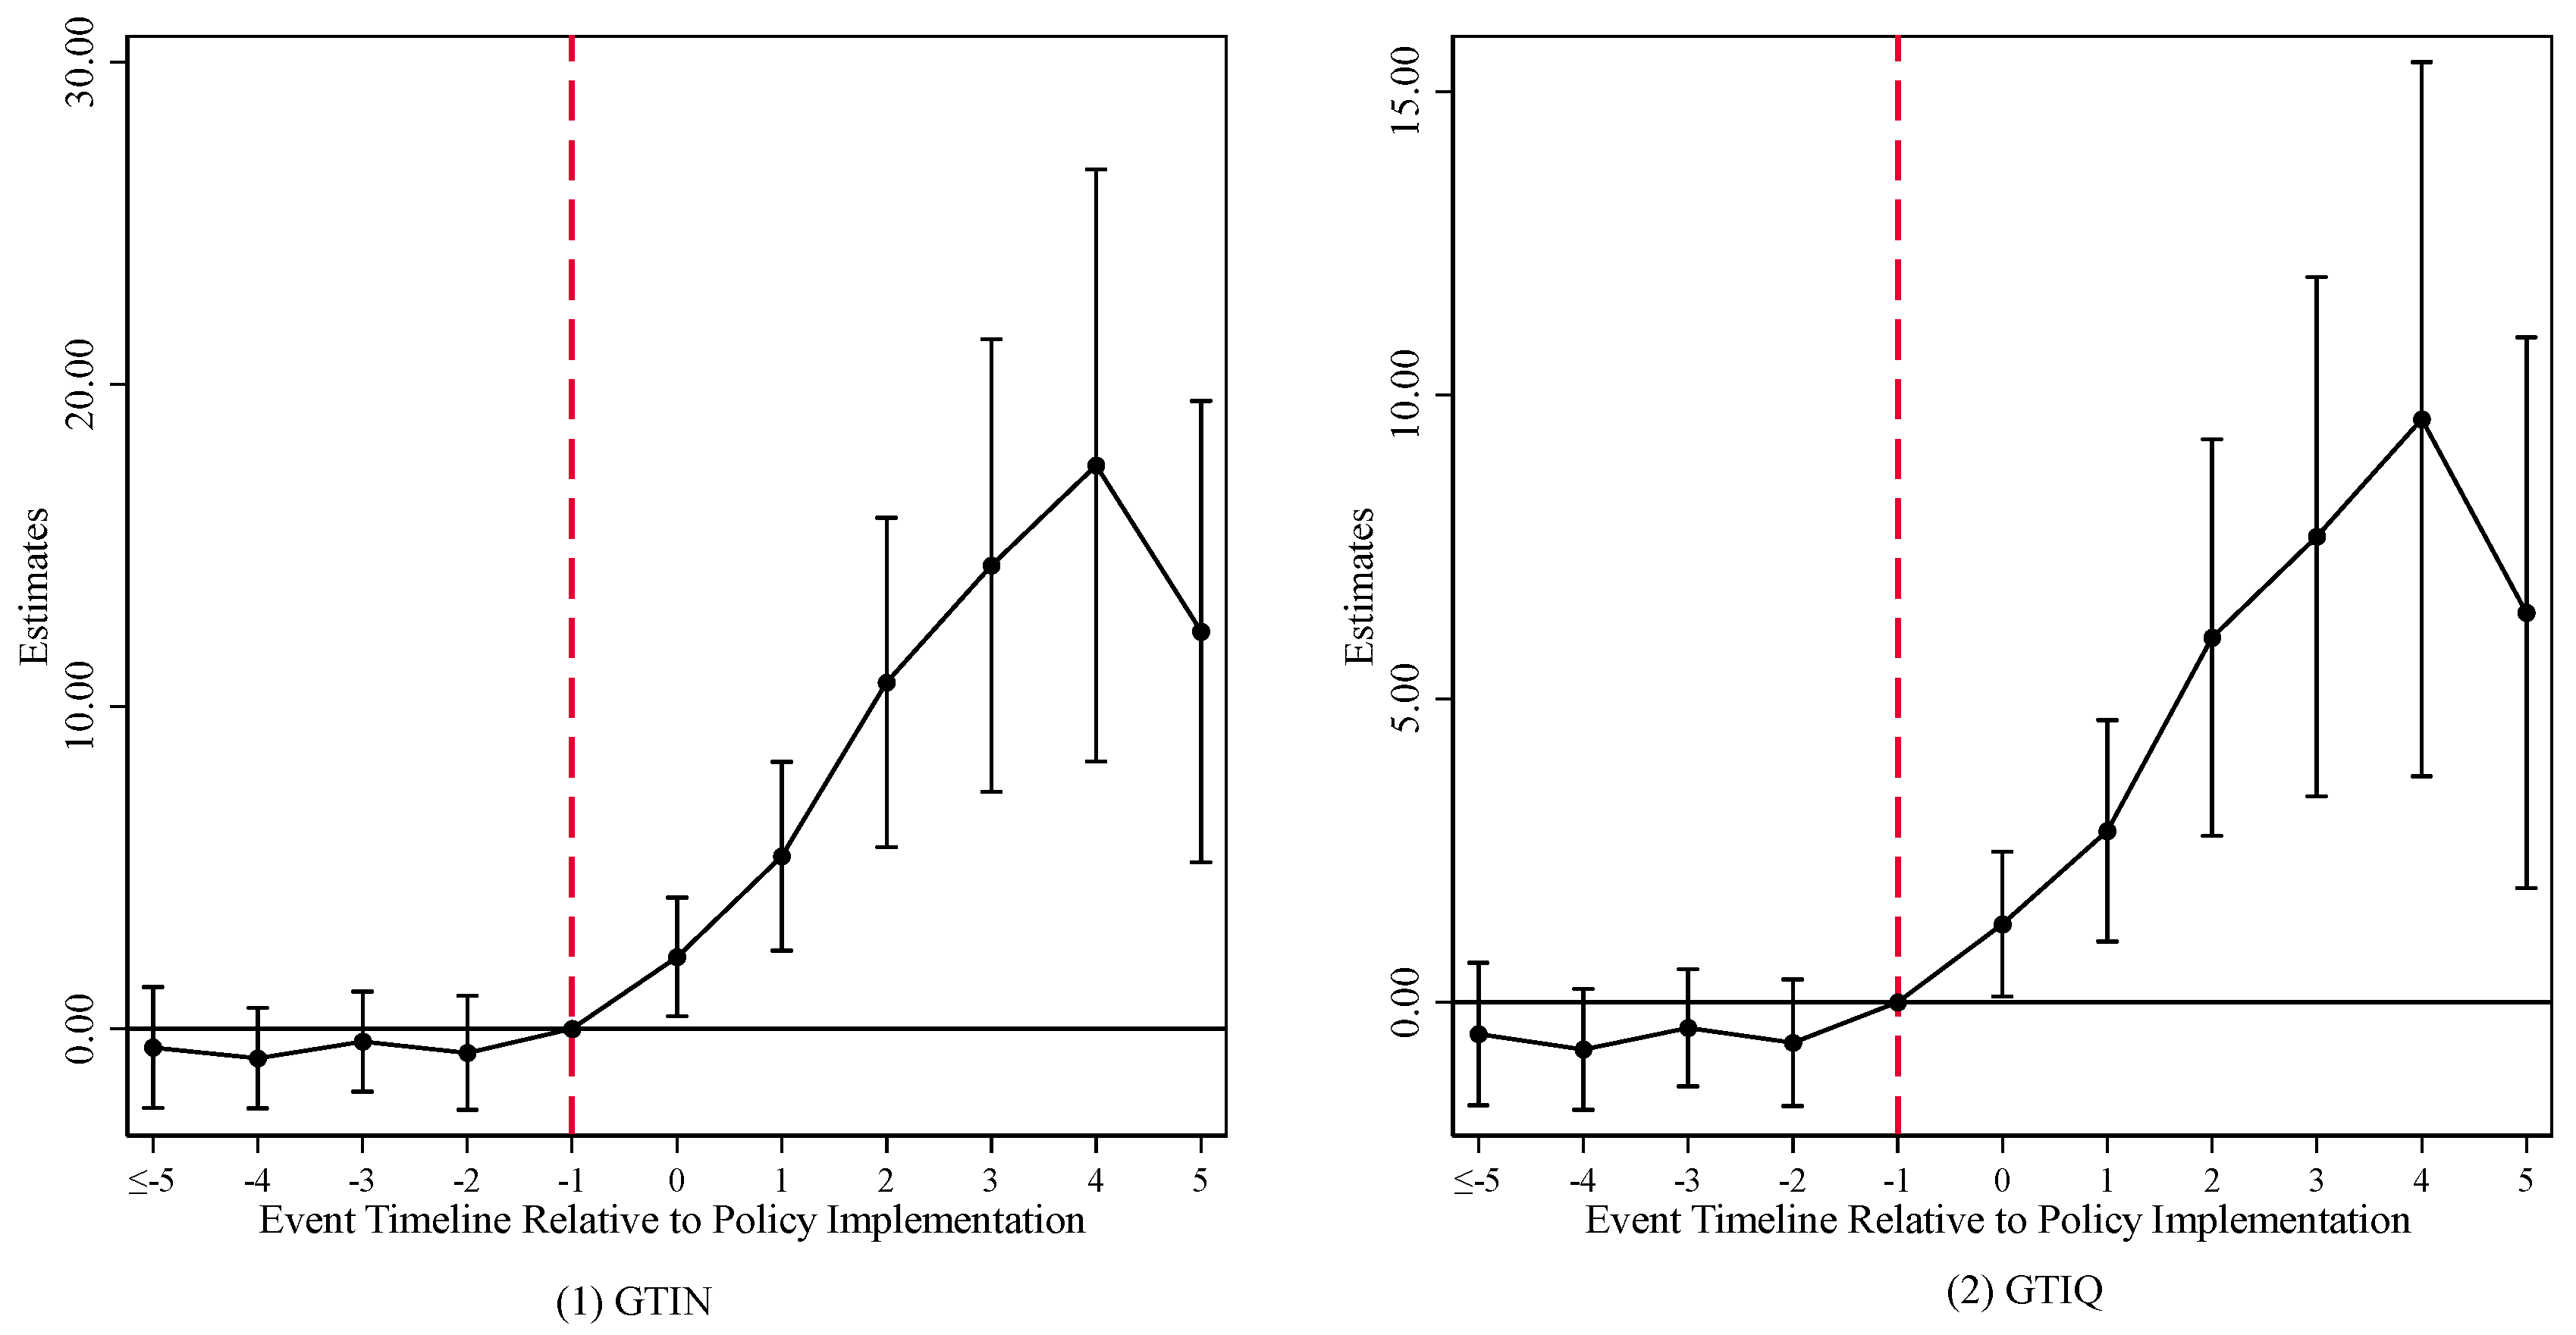
To conduct the parallel trend test, city-specific interactions with year dummies were constructed. Addressing potential multicollinearity, the sixth period prior to the dual-pilot policies initiation was designated as the base period, with 2014 marking the formal policy implementation year. Parallel trend tests were performed separately for GTIN and GTIQ. Figure 4 plots the estimated coefficients for I n f o r m a t i o n k along with their 95% confidence intervals. The estimated coefficients on the pre-treatment leads are not statistically distinguishable from zero for either GTIN or GTIQ, consistent with the assumption that the treatment and control groups followed parallel trends prior to policy implementation. The dynamic pattern indicates that, despite a temporary decline in period 5, the overall effect of the dual-pilot policies on both the quantity and the quality of green innovation follows an upward trend over time. This pattern suggests that the policies are associated with sustained growth in green innovation outcomes.

5.2.2. Placebo Test

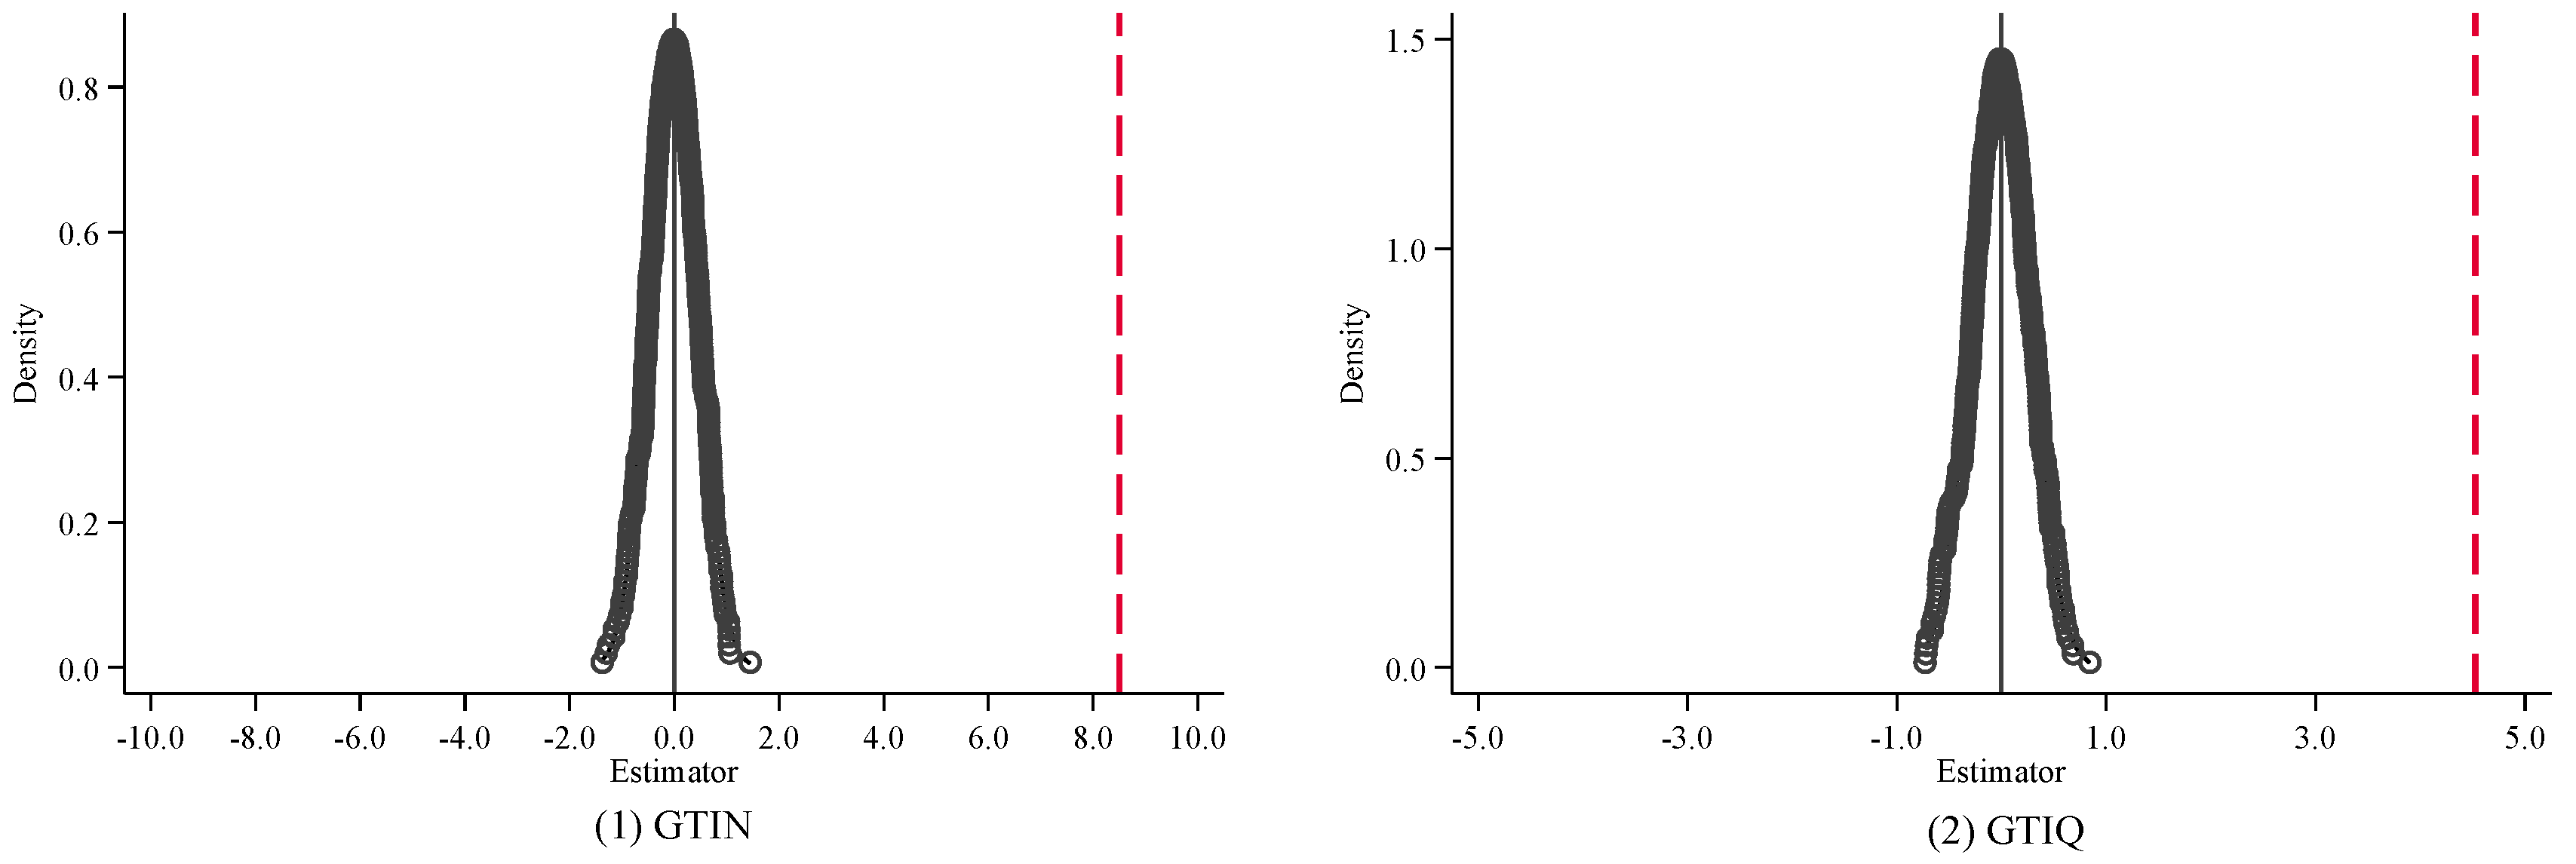
To mitigate potential bias arising from omitted variables, a placebo test was conducted. Specifically, the dual-pilot status was randomly assigned to different cities to create a simulated treatment group. A falsified policy variable, I n f o r m a t i o n f a l s e , was constructed based on this random assignment, and regression analysis was performed using Model (1). This paper repeats the randomization procedure 500 times. Figure 5 presents the kernel density distributions of the placebo estimates. The placebo coefficients are distributed around zero and follow a pattern close to a normal distribution. Most of the placebo coefficients are not statistically distinguishable from zero. The distribution of the placebo coefficients lies clearly apart from the baseline estimate. This evidence indicates that the association between the dual-pilot policies and urban green innovation is unlikely to be attributable to unobserved confounding factors.

5.2.3. Goodman-Bacon Decomposition Test

Recognizing that treatment effect heterogeneity in staggered DID designs may introduce bias in TWFE estimators [89,90,91], this paper employs Goodman-Bacon’s decomposition method to evaluate the magnitude of potential estimation bias [91]. The analysis utilizes a balanced panel spanning 2000–2023 and implements the bacondecomp command to decompose the staggered DID estimates. This decomposition enables systematic assessment of the robustness of our model estimates, with the full Bacon decomposition results presented in Table 3.
Table 3 reports the Goodman-Bacon decomposition of the two-way fixed effect estimates. The overall TWFE estimate is 12.93 for GTIN and 7.02 for GTIQ, both statistically significant at the 1 percent level. The decomposition shows that variation in treatment timing accounts for 5.53 percent of the overall estimate, while within-group differences account for 4.35 percent. Comparisons involving the never-treated group receive 90.12 percent of the total weight. The relatively small combined weight assigned to comparisons that may be affected by treatment effect heterogeneity, namely those based on variation in treatment timing and within-group differences, suggests that such heterogeneity does not materially affect the core estimates reported in this paper.

5.3. Robustness Checks

5.3.1. PSM-DID Estimation

Prior to dual-pilot policy implementation, observable city-level differences between treatment and control groups risked selection bias in staggered DID estimates. To mitigate this, this paper employs a propensity score matching-difference-in-differences (PSM-DID) approach. Key matching variables, namely, economic development, industrial upgrading, and foreign direct investment, were selected to identify comparable control cities for each treatment unit. Using year-specific 1:2 nearest neighbor matching and kernel matching within the common support domain, this paper excluded unmatched observations and confirmed covariate balance. The results reported in Table 4 indicate that the dual-pilot policies are associated with higher levels of both the quantity and the quality of urban green innovation, after accounting for selection bias through matching. These results remain consistent across alternative matching specifications, lending further support to the main findings.

5.3.2. Mitigate Endogenous Issues

Although the quasi-natural experiment design based on the concurrent implementation of the AAQS-2012 and the BC policy helps mitigate endogeneity concerns, residual bias could persist due to unobserved factors or omitted variables. To further validate the robustness of our findings, this paper employs two additional strategies. First, this paper lags the dependent variable by one and two periods. As shown in Table 5, the lagged dependent variable tests confirm that the positive effect of the dual-pilot policies on both the quantity and quality of urban green innovation remains consistent with the baseline regression results.
Second, this paper conducts an instrumental variable (IV) analysis. This paper utilizes the number of post offices in each city in 1984 as an instrument for environmental information transparency. This variable satisfies the relevance and exclusion restriction conditions. Regarding relevance, post offices served as traditional communication hubs intrinsically linked to the development of modern communication infrastructure. For exogeneity, the establishment of the post office in 1984, which occurred approximately 40 years ago, is unlikely to have had a direct impact on current urban green innovation. As this time-invariant instrument would be absorbed by city fixed effects, this paper constructs an interaction term between the dual-pilot policies time trend and the 1984 post office count to serve as the operational IV.
Columns (5) through (7) of Table 5 report the two-stage least squares regression results. Column (5) reports the first-stage results. The coefficient on the instrument is positive and statistically significant at the 1 percent level, confirming its relevance to the endogenous regressor. The Kleibergen–Paap rk Wald F-statistic exceeds the conventional threshold for weak instruments, suggesting that weak instrument bias is not a serious concern in this setting. Columns (6) and (7) present the second-stage results. After accounting for endogeneity, the coefficients on Information remain positive and statistically significant for both the quantity and the quality of green innovation. These results indicate that the main findings are not driven by endogeneity bias.

5.3.3. Exclude Competing Policies

To mitigate potential bias arising from concurrent influential policies affecting urban green innovation scale and quality during the sample period, this paper explicitly accounts for confounding policy effects. Empirical evidence indicates that the Central Environmental Inspection Policy (CEIP) [92,93], Carbon Emissions Trading Scheme (CETS) [13,93], and Smart City (SC) Initiative may significantly affect green innovation outcomes [94,95]. Furthermore, following the promulgation of AAQS-2012, the State Council’s Three-Year Action Plan for Winning the Blue Sky Defense Campaign (WBSDC) designated key cities with enhanced monitoring and enforcement. Potential overlaps in pilot city selection between these strategies could introduce confounding policy effects. In this regard, the study added interaction terms between whether the province was a CEIP area and the specific implementation time of each province (see column (1) and column (2) of Table 6), between whether the province was a CETS pilot area and the specific implementation time of each province (see column (3) and column (4) of Table 6), between whether the city was a SC pilot city and the specific implementation time of each city (see column (5) and column (6) of Table 6), and between whether the city was a key city under the WBSDC and the specific implementation time (see column (7) and column (8) of Table 6) to the baseline regression model to eliminate the interference of competing policies and confusion of policy effects. The study found that the coefficient of Information remained significantly positive, meaning that the implementation of other important policies during the same period did not cause significant bias in the estimation results.

5.3.4. Employ Count Regression Models

Given that the dependent variable of this paper is measured by the number of green patents, this variable essentially belongs to the category of count data. As a further check, this paper re-estimates the baseline specification using a count regression model. Because the variance of each dependent variable exceeds its mean, this paper employs the negative binomial model rather than the Poisson model. The results are reported in Table 7. After switching to the negative binomial model, the coefficient on Information remains positive and statistically significant for both GTIN and GTIQ, consistent with the baseline findings.

5.3.5. Alternative Dependent Variables

To alleviate concerns about the measurement of innovation quality, this paper replace the dependent variable with the number of granted green invention patents and re-estimate the baseline model. Compared with patent applications, granted invention patents have passed the complete substantive examination and officially obtained patent rights, which can more strictly reflect recognized high-quality innovation achievements. Table 8 reports the estimation results. The coefficient of Information remains significantly positive at the 1% level for both innovation quantity and quality specifications, indicating that the core conclusion that dual-pilot policies improve both the quantity and quality of urban green innovation is not affected by the measurement method of innovation quality.

6. Further Discussion

6.1. Mechanism Analysis

Based on the theoretical analysis in the previous text, the dual-pilot policies of the AAQS−2012 and the BC policy may improve green innovation performance through promoting public environmental attention, environmental compliance pressure, and resource allocation. Drawing on the study of Baron & Kenny [96], this paper conducts an empirical analysis of each of these mechanisms.

6.1.1. Mechanism Test of Public Environmental Complaints

This paper examines whether dual-pilot policies enhance green innovation through public environmental concern. Following existing studies [18,19], this paper uses the Baidu Search Index for haze as a proxy for public environmental concern (PEC), constructed from daily city-level searches aggregated annually. Table 9 columns (1)–(3) report the test results for this mechanism. Column (1) presents the second-step estimation: the coefficient of the dual-pilot policy variable Information is positive and significant at the 1% level, indicating that the implementation of the dual-pilot policies significantly raises public environmental attention. Columns (2) and (3) report the third-step results: after including the mediator variable PEC in the regression, the coefficient of Information remains positive and statistically significant at the 1% level for both green innovation quantity (GTIN) and quality (GTIQ). Meanwhile, the coefficient of PEC is also significantly positive at the 1% level in both columns. According to the mediation test logic, this result confirms that public environmental concern exerts a partial mediating effect in the process of dual-pilot policies promoting the quantity and quality of green innovation. Specifically, the dual-pilot policies enhance the public’s capacity for real-time access to local environmental information. This heightened accessibility fosters increased public engagement with environmental issues, leading to more active participation in environmental protection activities and stronger demand for higher corporate emission standards. Consequently, these amplified societal expectations generate informal institutional pressure, compelling firms to increase R&D investments and optimize pollution control and energy-saving technologies, thereby driving the observed enhancement in both the quantity and quality of urban green innovation.

6.1.2. Mechanism Test of Government Environmental Regulation

This paper examines whether dual-pilot policies enhance green innovation through the intensification of government environmental regulation. This paper employs city-level SO2 emissions (log-transformed, 10,000 tonnes) as a proxy for regulatory intensity, where lower emission levels correspond to stricter environmental regulation. As shown in Table 9 columns (4)–(6), column (4) reports the second-step result: the coefficient of Information is negative and statistically significant at the 5% level, indicating that the dual-pilot policies effectively reduce urban SO2 emissions, which reflects a significant improvement in environmental regulation intensity. Columns (5) and (6) present the third-step estimation: after controlling for the mediator variable SO2, the coefficient of Information remains positive and significant at the 1% level for both GTIN and GTIQ. Meanwhile, the coefficient of SO2 is significantly negative at the 1% and 5% levels respectively, meaning that lower pollution emissions are associated with higher green innovation performance. This verifies that environmental regulation intensity plays a partial mediating role in the impact of dual-pilot policies on green innovation. Specifically, environmental information transparency strengthens regulatory enforcement and compliance monitoring, driving measurable declines in SO2 emissions. This reduction directly reflects heightened regulatory intensity, which subsequently incentivizes firms to reallocate resources toward green R&D, optimize pollution control technologies, and elevate urban green innovation quality. Consequently, the observed emission reductions provide robust empirical support for the mechanism through which environmental transparency amplifies regulatory effectiveness, ultimately driving green innovation performance.

6.1.3. Mechanism Test of Resource Allocation

To examine whether dual-pilot policies stimulate green innovation through environmental transparency-driven resource reallocation, this paper constructs a city-year-level measure of government green R&D subsidies (Subsidy) derived from listed firms’ annual reports. Specifically, we filter out subsidies designated for scientific research, technological innovation, or environmental technology from corporate filings, and aggregate them to the city-year level with log-transformation to mitigate skewness. Table 9 columns (7)–(9) report the test results. Column (7) shows the second-step estimation: the dual-pilot policies exert a significantly positive impact on Subsidy at the 1% level, indicating that improved environmental information transparency effectively guides government fiscal resources toward green innovation support. Columns (8) and (9) present the third-step results: when both Information and Subsidy are included in the regression, the coefficient of Information remains significantly positive at the 1% level for both green innovation quantity and quality, and the coefficient of Subsidy is also significantly positive at the 1% and 5% levels respectively. This confirms that government green R&D subsidies play a partial mediating effect in the relationship between dual-pilot policies and green innovation improvement. In terms of the mechanism logic, enhanced environmental information transparency increases public scrutiny over governmental resource allocation, thereby incentivizing the direction of preferential subsidies toward green innovation. Meanwhile, stricter environmental requirements also compel firms to increase environmental investment and adopt advanced technologies. The resultant reallocation of governmental and corporate resources collectively drives the improvement in both the quantity and quality of urban green innovation.

6.2. Comparative Analysis

This section examines whether the dual-pilot combination of the AAQS-2012 and the BC policy yields a stronger effect on green innovation than either policy alone. This paper employs two complementary identification strategies, namely PSM-DID and the staggered DID estimator developed by Callaway & Sant’Anna [90].
This paper restricts the sample to cities covered by at least one of the two policies, excluding all cities that never adopted either policy. Within this restricted sample, dual-pilot cities that implemented both policies serve as the treatment group, and cities that implemented only one of the two policies serve as the control group. This paper first implements the PSM-DID estimations. The matching procedure uses key covariates including the level of economic development, industrial structure upgrading, and foreign direct investment to identify comparable control cities for each treatment unit. This paper applies year-specific 1:2 nearest neighbor matching and kernel matching within the common support, excludes observations that fall outside the common support, and verifies covariate balance after matching. Columns (1) and (2) of Table 10 report the results under 1:2 nearest neighbor matching. The coefficient on Information_c is positive and statistically significant at the 1 percent level for both green innovation quantity and quality. Columns (3) and (4) report the kernel matching results, which are closely aligned with those from nearest neighbor matching. The coefficient on the dual-pilot variable remains positive and statistically significant at the 1 percent level for both outcomes, and the coefficient magnitudes are similar across the two matching methods. These results indicate that, after mitigating sample selection bias through propensity score matching, the dual-pilot combination is associated with greater green innovation output than either single-policy implementation, both in scale and in quality.
To further address potential bias from heterogeneous treatment effects in the staggered DID setting, this paper re-estimates the policy effect using the Callaway & Sant’Anna [90] estimator with explicit treatment cohort definitions. This method first estimates group-time average treatment effects for each treatment cohort, defined by the year of BC policy implementation, at each time period, and then aggregates them into an overall ATT weighted by cohort size. This approach avoids the negative weighting problem inherent in conventional two-way fixed effect staggered DID models and strengthens the credibility of causal inference. Columns (5) and (6) of Table 10 present the estimation results. The overall ATT of the dual-pilot policies is 4.238 for green innovation quantity, statistically significant at the 5 percent level, and 2.201 for green innovation quality, significant at the 10 percent level. This result lends further support to the main finding that the dual-pilot combination is associated with stronger green innovation outcomes than either policy implemented in isolation.

7. Conclusions

7.1. Core Findings

Using panel data from 289 prefecture-level and above cities in China spanning 2000 to 2023, this paper employs a multi-period difference-in-differences model to examine how the joint implementation of the AAQS-2012 and the BC policy influences urban green innovation performance. The results indicate that the dual-pilot combination is associated with significant improvements in both the quantity and the quality of urban green innovation. This finding holds across a range of checks, including placebo tests, validity assessments, PSM-DID, instrumental variable estimation, exclusion of competing policies, and re-estimation with count regression models. Mediation analysis suggests that environmental information transparency contributes to green innovation through three channels, namely heightened public environmental attention, stronger environmental compliance pressure, and improved resource allocation. Further analysis indicates that cities covered by both policies experienced greater improvements in green innovation than cities covered by only one. These findings provide empirical evidence to inform the design of integrated environmental governance and digital infrastructure policies, and offer a reference for other economies facing similar challenges in balancing the scale and the quality of green innovation.

7.2. Policy Implications

Based on the empirical findings and the theoretical analysis presented above, this paper offers the following policy recommendations for different stakeholders.
First, the central government should strengthen top-level coordination between environmental information disclosure and digital infrastructure policies. This entails accelerating the establishment of a unified national real-time air quality monitoring platform with standardized pollutant indicators and mandatory disclosure rules, thereby overcoming regional data fragmentation. To ensure comprehensive coverage, targeted fiscal transfers should be directed to less developed central and western cities, enabling them to achieve high-speed network connectivity for environmental monitoring stations, public environmental service platforms, and official complaint channels. These measures collectively narrow the digital divide in environmental governance and lay the data foundation for subsequent enforcement and participation.
Second, building on this unified data infrastructure, local governments should deploy digital technologies to enhance the precision and credibility of environmental enforcement. This requires regularly auditing the accuracy and timeliness of real-time air quality monitoring data, imposing stricter administrative penalties for the concealment of pollution data, and establishing public online inquiry systems for pollutant emission records. Furthermore, intelligent enforcement systems that leverage big data, 5G, and cloud platforms should be introduced to automatically identify abnormal emission data, reduce manual oversight costs, and strengthen regulatory deterrence, thus forming a data-driven enforcement loop.
Third, public and media participation in environmental governance should be facilitated through multiple digital channels. Local governments can collaborate with news media, environmental non-governmental organizations, and internet platforms to deliver real-time environmental quality data to mobile terminals, simplify online pollution reporting procedures, and establish closed-loop feedback mechanisms that render public oversight transparent and effective. Beyond such oversight mechanisms, demand-side engagement should be activated through digital platforms for environmental education and eco-labeling systems, which encourage residents to adopt green consumption preferences. By strengthening the link between environmental awareness and consumption behavior, sustained public attention can be converted into durable market demand for green products. This market pull generates continuous incentives for enterprise green innovation, complementing regulatory pressure and fostering a self-reinforcing governance dynamic.

7.3. Research Limitations and Future Expectations

This paper has several limitations that point to directions for future research. First, the measurement of green innovation quality is constrained by data availability. This paper uses green invention patent applications and grants as proxies for innovation quality, drawing on the distinction between substantive examination for invention patents and formal examination for utility models under China’s patent system. While these indicators can distinguish innovation quality to a meaningful degree, they do not directly capture the technological influence or commercial value of patents. Constructing forward citation-weighted indicators within a fixed time window would offer a more rigorous measure of quality but is currently limited by the availability of detailed patent citation records at the city level. Future research could match city-level patent data with citation records and construct fixed-window citation-weighted indicators to further verify the robustness of the conclusions. Second, the analysis is conducted at the city aggregate level and does not examine heterogeneity at the firm level. Future research could match city-level policy data with micro-level panel data on listed firms to identify heterogeneous responses across heavy-polluting enterprises, high-technology firms, and small and medium-sized enterprises. Third, the staggered difference-in-differences design, while widely used in policy evaluation, relies on the parallel trend assumption and may be affected by treatment effect heterogeneity across adoption cohorts. Although the Goodman-Bacon decomposition suggests that such heterogeneity does not materially affect the core estimates in this paper, and the Callaway and Sant’Anna estimator yields broadly consistent results, future work could apply alternative identification strategies as new methodological developments become available. Fourth, the empirical findings are based on China’s centralized governance context. Whether the complementary effect of environmental disclosure and digital infrastructure policies extends to institutional environments with different governance structures requires further investigation through cross-country comparative studies.


Author Contributions

Formal analysis, T.G. and J.C.; Investigation, J.C.; Methodology, T.G.; Software, D.X.; Writing—original draft, T.G.; Supervision, D.X. and J.C.; Data curation, T.G.; Writing—review and editing, T.G. and J.C.; Resources, T.G.; Project administration, T.G. and D.X.; Visualization, T.G.; Funding acquisition, T.G. All authors have read and agreed to the published version of the manuscript.

Funding

This work was supported by the National Social Science Foundation of China (YouthProject) [Grant No. 24CJY074], The Labor Income Distribution Effect of Market-basedAllocation of Resource and Environmental Factors.

Institutional Review Board Statement

Not applicable.

Informed Consent Statement

Not applicable.

Data Availability Statement

The data used to support the findings of this study are available from the corresponding author upon request.

Acknowledgments

The authors would like to thank the editors and anonymous reviewers for their valuable comments and suggestions that helped improve the quality of this manuscript.

Conflicts of Interest

The authors declare that they have no conflicts of interest.

References

  1. Laino, E.; Iglesias, G. Extreme Weather Events and Environmental Contamination under Climate Change: A Comparative Review of Ten European Coastal Cities. Curr. Opin. Environ. Sci. Health 2025, 45, 100606. [Google Scholar] [CrossRef] [Scilit]
  2. Ahmed, A.; Luong, H.; Tessema, A. Balancing Act: Corporate Governance and Biodiversity Conservation in Extractive Sector. J. Clean. Prod. 2025, 519, 146021. [Google Scholar] [CrossRef] [Scilit]
  3. Sun, S.; Sarkar, C.; Kumari, S.; James, P.; Cao, W.; Lee, R.S.; Tian, L.; Webster, C. Air Pollution Associated Respiratory Mortality Risk Alleviated by Residential Greenness in the Chinese Elderly Health Service Cohort. Environ. Res. 2020, 183, 109139. [Google Scholar] [CrossRef] [Scilit] [PubMed]
  4. Turner, M.C.; Andersen, Z.J.; Baccarelli, A.; Diver, W.R.; Gapstur, S.M.; Pope, C.A., III; Prada, D.; Samet, J.; Thurston, G.; Cohen, A. Outdoor Air Pollution and Cancer: An Overview of the Current Evidence and Public Health Recommendations. CA A Cancer J. Clin. 2020, 70, 460–479. [Google Scholar] [CrossRef] [Scilit]
  5. Niu, Z.; Yan, C.; Tan, F. Green Innovation and Eco-Efficiency: Interaction between Society and Environment of Sustainable Development Demonstration Belt in China. Environ. Technol. Innov. 2024, 34, 103620. [Google Scholar] [CrossRef] [Scilit]
  6. Zhou, B.; Zhan, G.; Yao, Y.; Zhang, W.; Zhao, S.; Quan, F.; Fang, C.; Shi, Y.; Huang, Y.; Jia, F.; et al. Renewable Energy Driven Electroreduction Nitrate to Ammonia and In-Situ Ammonia Recovery via a Flow-through Coupled Device. Water Res. 2023, 242, 120256. [Google Scholar] [CrossRef] [Scilit] [PubMed]
  7. Li, J.; Liu, X.; Cai, C.; Su, Q.; Chen, M.; Zhu, X. From Waste to Value: Engineering Properties and Failure Mechanisms of Green Backfills Utilizing Molybdenum Tailings, Fly Ash and Coal Gangue. Powder Technol. 2025, 464, 121294. [Google Scholar] [CrossRef] [Scilit]
  8. Chen, J.; Ren, Z.J.; Ramaswami, A. Methodology for Identifying Cost-Effective Food Waste-Resource Circulatory Strategies toward Zero-Carbon Cities: Linking Valorization Technologies with Byproduct Reutilization Pathways. Resour. Conserv. Recycl. 2025, 219, 108273. [Google Scholar]
  9. Lian, G.; Xu, A.; Zhu, Y. Substantive Green Innovation or Symbolic Green Innovation? The Impact of ER on Enterprise Green Innovation Based on the Dual Moderating Effects. J. Innov. Knowl. 2022, 7, 100203. [Google Scholar] [CrossRef] [Scilit]
  10. Song, Y.; Gao, W.; Lee, C.-C. Does China’s Green Credit Interest Subsidies Policy Promote Enterprises’ Green Technology Innovation Quality? Based on the Perspective of Financial and Fiscal Coordination. J. Environ. Manag. 2025, 390, 126366. [Google Scholar] [CrossRef] [Scilit]
  11. Peng, D.; Kong, Q. Corporate Green Innovation under Environmental Regulation: The Role of ESG Ratings and Greenwashing. Energy Econ. 2024, 140, 107971. [Google Scholar] [CrossRef] [Scilit]
  12. Porter, M.E.; Linde, C. van der Toward a New Conception of the Environment-Competitiveness Relationship. J. Econ. Perspect. 1995, 9, 97–118. [Google Scholar] [CrossRef] [Scilit]
  13. Liu, Y.; Liu, S.; Shao, X.; He, Y. Policy Spillover Effect and Action Mechanism for Environmental Rights Trading on Green Innovation: Evidence from China’s Carbon Emissions Trading Policy. Renew. Sustain. Energy Rev. 2022, 153, 111779. [Google Scholar]
  14. Liu, H.; Chen, Q.; Song, Y. Does the Carbon Emissions Trading Scheme Promote Green Technology Innovation? New Evidence from Chinese Cities. Econ. Anal. Policy 2025, 87, 1045–1057. [Google Scholar] [CrossRef] [Scilit]
  15. Yan, K.; Liu, N.; Shi, L.; Yang, L.; Lu, M. How Does FinTech Enable the Expansion of Green Innovation Boundaries: Evidence from the Interventions of China’s Environmental Protection Tax Law. Energy Econ. 2025, 144, 108367. [Google Scholar] [CrossRef] [Scilit]
  16. Zhou, Y.; Su, Q. Environmental Protection Tax, Management Efficiency, and Enterprise Green Technology Innovation. Financ. Res. Lett. 2025, 75, 106860. [Google Scholar] [CrossRef] [Scilit]
  17. Liu, M.; Luo, X.; Lu, W.-Z. Public Perceptions of Environmental, Social, and Governance (ESG) Based on Social Media Data: Evidence from China. J. Clean. Prod. 2023, 387, 135840. [Google Scholar] [CrossRef] [Scilit]
  18. Ren, X.; Ren, Y. Public Environmental Concern and Corporate ESG Performance. Financ. Res. Lett. 2024, 61, 104991. [Google Scholar] [CrossRef] [Scilit]
  19. Tao, Y.; Wang, D.; Ye, Y.; Wu, H.; Zhang, Y. The Role of Public Environmental Concern on Corporate Social Responsibility: Evidence from Search Index of Web Users. Energy Econ. 2023, 126, 107041. [Google Scholar] [CrossRef] [Scilit]
  20. Zhou, B.; Ding, H. How Public Attention Drives Corporate Environmental Protection: Effects and Channels. Technol. Forecast. Soc. Change 2023, 191, 122486. [Google Scholar] [CrossRef] [Scilit]
  21. Zhang, Y.; Wang, H.; Ruan, S.; Cheng, J.; Song, Y. Effects of Environmental Information Disclosure on the Green Development of Mining Industry: Evidence from Chinese Provincial Mining Sub-Sectors. Resour. Policy 2024, 89, 104669. [Google Scholar] [CrossRef] [Scilit]
  22. Li, G.; Xue, Q.; Qin, J. Environmental Information Disclosure and Green Technology Innovation: Empirical Evidence from China. Technol. Forecast. Soc. Change 2022, 176, 121453. [Google Scholar] [CrossRef] [Scilit]
  23. Wang, Z.; Zhang, J. The Value of Information Disclosure: Evidence from Mask Consumption in China. J. Environ. Econ. Manag. 2023, 122, 102865. [Google Scholar] [CrossRef] [Scilit]
  24. Barwick, P.J.; Li, S.; Lin, L.; Zou, E.Y. From Fog to Smog: The Value of Pollution Information. Am. Econ. Rev. 2024, 114, 1338–1381. [Google Scholar] [CrossRef] [Scilit]
  25. He, L.; Wang, M. Environmental Regulation and Green Innovation of Polluting Firms in China. PLoS ONE 2023, 18, e0281303. [Google Scholar] [CrossRef] [Scilit] [PubMed]
  26. Wang, Q.; Hu, A.; Tian, Z. Digital Transformation and Electricity Consumption: Evidence from the Broadband China Pilot Policy. Energy Econ. 2022, 115, 106346. [Google Scholar] [CrossRef] [Scilit]
  27. Hong, J.; Shi, F.; Zheng, Y. Does Network Infrastructure Construction Reduce Energy Intensity? Based on the “Broadband China” Strategy. Technol. Forecast. Soc. Change 2023, 190, 122437. [Google Scholar] [CrossRef] [Scilit]
  28. Wang, C.; Wang, L. Does Broadband Infrastructure Promote Urban Innovation? Evidence from “Broadband China” Demonstration Policy. Struct. Change Econ. Dyn. 2024, 69, 349–362. [Google Scholar] [CrossRef] [Scilit]
  29. Ding, C.J.; Chen, H.; Liu, Y.; Hu, J.; Hu, M.; Chen, D.; Irfan, M. Unleashing Digital Empowerment: Pioneering Low-Carbon Development through the Broadband China Strategy. Energy 2024, 295, 131034. [Google Scholar] [CrossRef] [Scilit]
  30. Cao, Q.; Ni, P.; Guo, J. Broadband Internet and Income Inequality among the Floating Population: Evidence from the “Broadband China” Strategy in China. China Econ. Rev. 2025, 90, 102369. [Google Scholar] [CrossRef] [Scilit]
  31. Tang, C.; Xu, Y.; Hao, Y.; Wu, H.; Xue, Y. What Is the Role of Telecommunications Infrastructure Construction in Green Technology Innovation? A Firm-Level Analysis for China. Energy Econ. 2021, 103, 105576. [Google Scholar] [CrossRef] [Scilit]
  32. Niu, G.; Jin, X.; Wang, Q.; Zhou, Y. Broadband Infrastructure and Digital Financial Inclusion in Rural China. China Econ. Rev. 2022, 76, 101853. [Google Scholar] [CrossRef] [Scilit]
  33. Jin, X.; Ma, B.; Zhang, H. Impact of Fast Internet Access on Employment: Evidence from a Broadband Expansion in China. China Econ. Rev. 2023, 81, 102038. [Google Scholar] [CrossRef] [Scilit]
  34. Cheng, Q.; Hao, J.; Chen, Y.; Guo, J. The Impact of Internet Infrastructure Development on the Urban Entrepreneurship of Rural Migrants: Evidence from the Broadband China Policy. Appl. Econ. 2025, 57, 10425–10439. [Google Scholar]
  35. Jin, L.; Cao, K.; Li, J.; Xu, Q. Information Infrastructure Construction and Optimization of Resources Allocation among Firms: Evidence from “Broadband China” Strategy. Int. Rev. Econ. Financ. 2024, 91, 36–53. [Google Scholar] [CrossRef] [Scilit]
  36. Tian, X.; Lu, H. Digital Infrastructure and Cross-Regional Collaborative Innovation in Enterprises. Financ. Res. Lett. 2023, 58, 104635. [Google Scholar] [CrossRef] [Scilit]
  37. Feng, E.; Siu, Y.L.; Wong, C.W.Y.; Li, S.; Miao, X. Can Environmental Information Disclosure Spur Corporate Green Innovation? Sci. Total Environ. 2024, 912, 169076. [Google Scholar] [CrossRef] [Scilit] [PubMed]
  38. Greenstone, M.; He, G.; Jia, R.; Liu, T. Can Technology Solve the Principal-Agent Problem? Evidence from China’s War on Air Pollution. Am. Econ. Rev. Insights 2022, 4, 54–70. [Google Scholar] [CrossRef] [Scilit]
  39. Buntaine, M.T.; Greenstone, M.; He, G.; Liu, M.; Wang, S.; Zhang, B. Does the Squeaky Wheel Get More Grease? The Direct and Indirect Effects of Citizen Participation on Environmental Governance in China. Am. Econ. Rev. 2024, 114, 815–850. [Google Scholar] [CrossRef] [Scilit]
  40. Zhang, D.; Bai, D.; He, Y.; Sun, Q. Synergistic Abatement Effects of Broadband China and Environmental Regulation: Firm-Level Evidence. Int. Rev. Financ. Anal. 2024, 96, 103750. [Google Scholar] [CrossRef] [Scilit]
  41. He, W.; Wang, X.; Miao, M. Network Infrastructure and Corporate Environmental Performance: Empirical Evidence from “Broadband China.”. Energy Econ. 2024, 131, 107393. [Google Scholar] [CrossRef] [Scilit]
  42. Chen, G.; Xu, J.; Qi, Y. Environmental (de) Centralization and Local Environmental Governance: Evidence from a Natural Experiment in China. China Econ. Rev. 2022, 72, 101755. [Google Scholar] [CrossRef] [Scilit]
  43. Jiang, Y.; Xiao, Y.; Zhang, Z.; Zhao, S. How Does Central-Local Interaction Affect Local Environmental Governance? Insights from the Transformation of Central Environmental Protection Inspection in China. Environ. Res. 2024, 243, 117668. [Google Scholar] [PubMed]
  44. Hu, Y.; Dong, Y.; Paraman, P. Environmental Responsibility Governance: Local Environmental Legislation Influence on Corporate Environmental Investment Decisions. Financ. Res. Lett. 2025, 79, 107250. [Google Scholar] [CrossRef] [Scilit]
  45. Wei, T.; Chen, M.; Wang, F.; Cheng, S. The Impact of Public Demands on Local Environmental Governance Performance: Evidence from Civil Environmental Complaints Placed on Leaders at Different Government Levels in China. J. Environ. Manag. 2024, 360, 121216. [Google Scholar] [CrossRef] [Scilit]
  46. Zhang, M.; Yang, Y.; Du, P.; Wang, J.; Wei, Y.; Qin, J.; Yu, L. The Effect of Public Environmental Participation on Pollution Governance in China: The Mediating Role of Local Governments’ Environmental Attention. Environ. Impact Assess. Rev. 2024, 104, 107345. [Google Scholar] [CrossRef] [Scilit]
  47. Greenstone, M.; Hanna, R. Environmental Regulations, Air and Water Pollution, and Infant Mortality in India. Am. Econ. Rev. 2014, 104, 3038–3072. [Google Scholar] [CrossRef] [Scilit]
  48. Xie, Y.; Dai, H.; Zhang, Y.; Wu, Y.; Hanaoka, T.; Masui, T. Comparison of Health and Economic Impacts of PM2.5 and Ozone Pollution in China. Environ. Int. 2019, 130, 104881. [Google Scholar] [PubMed]
  49. Chay, K.Y.; Greenstone, M. The Impact of Air Pollution on Infant Mortality: Evidence from Geographic Variation in Pollution Shocks Induced by a Recession. Q. J. Econ. 2003, 118, 1121–1167. [Google Scholar] [CrossRef] [Scilit]
  50. Cheung, C.W.; He, G.; Pan, Y. Mitigating the Air Pollution Effect? The Remarkable Decline in the Pollution-Mortality Relationship in Hong Kong. J. Environ. Econ. Manag. 2020, 101, 102316. [Google Scholar] [CrossRef] [Scilit]
  51. Tang, C.; Tan, L.; Liu, X. Regulatory Distance and Corporate Environmental Performance: From the Perspective of Rent-Seeking Distance. J. Environ. Manag. 2024, 365, 121580. [Google Scholar] [CrossRef] [Scilit]
  52. Luo, W.; Guo, X.; Zhong, S.; Wang, J. Environmental Information Disclosure Quality, Media Attention and Debt Financing Costs: Evidence from Chinese Heavy Polluting Listed Companies. J. Clean. Prod. 2019, 231, 268–277. [Google Scholar] [CrossRef] [Scilit]
  53. Liu, G.; Yang, Z.; Zhang, F.; Zhang, N. Environmental Tax Reform and Environmental Investment: A Quasi-Natural Experiment Based on China’s Environmental Protection Tax Law. Energy Econ. 2022, 109, 106000. [Google Scholar] [CrossRef] [Scilit]
  54. Zhao, X.; Sun, B. The Influence of Chinese Environmental Regulation on Corporation Innovation and Competitiveness. J. Clean. Prod. 2016, 112, 1528–1536. [Google Scholar] [CrossRef] [Scilit]
  55. Tang, M.; Walsh, G.; Lerner, D.; Fitza, M.A.; Li, Q. Green Innovation, Managerial Concern and Firm Performance: An Empirical Study. Bus. Strategy Environ. 2018, 27, 39–51. [Google Scholar] [CrossRef] [Scilit]
  56. Testa, F.; Pretner, G.; Iovino, R.; Bianchi, G.; Tessitore, S.; Iraldo, F. Drivers to Green Consumption: A Systematic Review. Environ. Dev. Sustain. 2021, 23, 4826–4880. [Google Scholar]
  57. Zhao, X.; Fan, L.; Xu, Y. An Investigation of Determinants of Green Consumption Behavior: An Extended Theory of Planned Behavior. Innov. Green Dev. 2025, 4, 100198. [Google Scholar] [CrossRef] [Scilit]
  58. Zou, G.; Zhang, S.; Gan, X.; Cheng, H. How Government Green Procurement Incentivises Corporate Green Innovation? Evidence from China. Econ. Anal. Policy 2025, 86, 1605–1626. [Google Scholar] [CrossRef] [Scilit]
  59. Akerlof, G.A. The Market for “Lemons”: Quality Uncertainty and the Market Mechanism. Q. J. Econ. 1970, 84, 488–500. [Google Scholar] [CrossRef] [Scilit]
  60. Sun, D.; Zeng, S.; Chen, H.; Meng, X.; Jin, Z. Monitoring Effect of Transparency: How Does Government Environmental Disclosure Facilitate Corporate Environmentalism? Bus. Strategy Environ. 2019, 28, 1594–1607. [Google Scholar]
  61. Freeman, R.E. Strategic Management: A Stakeholder Approach; Cambridge University Press: Cambridge, UK, 2010. [Google Scholar]
  62. Newig, J.; Jager, N.W.; Challies, E.; Kochskaemper, E. Does Stakeholder Participation Improve Environmental Governance? Evidence from a Meta-Analysis of 305 Case Studies. Glob. Environ. Change 2023, 82, 102705. [Google Scholar] [CrossRef] [Scilit] [PubMed]
  63. Demirel, P.; Kesidou, E. Sustainability-Oriented Capabilities for Eco-Innovation: Meeting the Regulatory, Technology, and Market Demands. Bus. Strategy Environ. 2019, 28, 847–857. [Google Scholar] [CrossRef] [Scilit]
  64. Liu, L. Green Innovation, Firm Performance, and Risk Mitigation: Evidence from the USA. Environ. Dev. Sustain. 2024, 26, 24009–24030. [Google Scholar]
  65. Schmookler, J. Invention and Economic Growth; Harvard University Press: Cambridge, MA, USA, 1966. [Google Scholar]
  66. Ghisetti, C. Demand-Pull and Environmental Innovations: Estimating the Effects of Innovative Public Procurement. Technol. Forecast. Soc. Change 2017, 125, 178–187. [Google Scholar] [CrossRef] [Scilit] [PubMed]
  67. Fusillo, F.; Orsatti, G.; Scandura, A. Public Green Demand and Green Innovation: Evidence from US Firms. Eurasian Bus. Rev. 2025, 15, 647–679. [Google Scholar] [CrossRef] [Scilit]
  68. Khan, S.J.; Dhir, A.; Parida, V.; Papa, A. Past, Present, and Future of Green Product Innovation. Bus. Strategy Environ. 2021, 30, 4081–4106. [Google Scholar] [CrossRef] [Scilit]
  69. DiMaggio, P.J.; Powell, W.W. The Iron Cage Revisited: Institutional Isomorphism and Collective Rationality in Organizational Fields. Am. Sociol. Rev. 1983, 48, 147–160. [Google Scholar] [CrossRef] [Scilit]
  70. García-Sánchez, I.-M.; Ortiz-Martínez, E.; Marín-Hernández, S.; Aibar-Guzmán, B. How Does the E Uropean G Reen D Eal Affect the Disclosure of Environmental Information? Corp. Soc. Responsib. Environ. Manag. 2023, 30, 2766–2782. [Google Scholar] [CrossRef] [Scilit]
  71. Chang, Y.; Wang, S. A Study on the Impact of ESG Rating on Green Technology Innovation in Enterprises: An Empirical Study Based on Informal Environmental Governance. J. Environ. Manag. 2024, 358, 120878. [Google Scholar] [CrossRef] [Scilit]
  72. Chang, K.; Liu, L.; Luo, D.; Xing, K. The Impact of Green Technology Innovation on Carbon Dioxide Emissions: The Role of Local Environmental Regulations. J. Environ. Manag. 2023, 340, 117990. [Google Scholar] [CrossRef] [Scilit] [PubMed]
  73. Li, P.; Lu, Y.; Peng, L.; Wang, J. Information, Incentives, and Environmental Governance: Evidence from China’s Ambient Air Quality Standards. J. Environ. Econ. Manag. 2024, 128, 103066. [Google Scholar] [CrossRef] [Scilit]
  74. Zhou, P.; Song, F.; Huang, X. Environmental Regulations and Firms’ Green Innovations: Transforming Pressure into Incentives. Int. Rev. Financ. Anal. 2023, 86, 102504. [Google Scholar] [CrossRef] [Scilit]
  75. Akhtar, S.; Tian, H.; Iqbal, S.; Hussain, R.Y. Environmental Regulations and Government Support Drive Green Innovation Performance: Role of Competitive Pressure and Digital Transformation. Clean. Technol. Environ. Policy 2024, 26, 4433–4453. [Google Scholar] [CrossRef] [Scilit]
  76. Wei, R.; Wang, M.; Xia, Y. Environmental Protection Tax and Corporate Carbon Emissions in China: A Perspective of Green Innovation. Clean. Technol. Environ. Policy 2024, 26, 2625–2641. [Google Scholar] [CrossRef] [Scilit]
  77. Lin, J.; Cao, X.; Dong, X.; An, Y. Environmental Regulations, Supply Chain Relationships, and Green Technological Innovation. J. Corp. Financ. 2024, 88, 102645. [Google Scholar] [CrossRef] [Scilit]
  78. Barney, J. Firm Resources and Sustained Competitive Advantage. J. Manag. 1991, 17, 99–120. [Google Scholar] [CrossRef] [Scilit]
  79. Chen, H.; Deng, J.; Lu, M.; Zhang, P.; Zhang, Q. Government Environmental Attention, Credit Supply and Firms’ Green Investment. Energy Econ. 2024, 134, 107547. [Google Scholar] [CrossRef] [Scilit]
  80. Jolink, A.; Niesten, E. Credibly Reducing Information Asymmetry: Signaling on Economic or Environmental Value by Environmental Alliances. Long Range Plan. 2020, 54, 101996. [Google Scholar] [CrossRef] [Scilit]
  81. Spence, M. Job Market Signaling. In Uncertainty in Economics; Elsevier: Amsterdam, The Netherlands, 1978; pp. 281–306. [Google Scholar]
  82. Yu, C.-H.; Wu, X.; Lee, W.-C.; Zhao, J. Resource Misallocation in the Chinese Wind Power Industry: The Role of Feed-in Tariff Policy. Energy Econ. 2021, 98, 105236. [Google Scholar] [CrossRef] [Scilit]
  83. Liu, Q.; Yu, L.; Yan, G.; Guo, Y. External Governance Pressure and Corporate Environmental Responsibility: Evidence from a Quasi-Natural Experiment in China. Bus. Ethics Environ. Responsib. 2023, 32, 74–93. [Google Scholar]
  84. Sun, Y.; Yang, Y. Do Government Environmental Target Constraints Break the Political Resource Curse?—A Study on Political Connections and Firm Green Innovation. Int. Rev. Econ. Financ. 2024, 96, 103534. [Google Scholar]
  85. Mehmood, S.; Zaman, K.; Khan, S.; Ali, Z.; Khan, H.U.R. The Role of Green Industrial Transformation in Mitigating Carbon Emissions: Exploring the Channels of Technological Innovation and Environmental Regulation. Energy Built Environ. 2024, 5, 464–479. [Google Scholar] [CrossRef] [Scilit]
  86. Li, W.; Zheng, M. Is It Substantive Innovation or Strategic Innovation?—Impact of Macroeconomic Policies on Micro-Enterprises’ Innovation. Econ. Res. J. 2016, 51, 60–73. [Google Scholar]
  87. Hu, A.G.; Zhang, P.; Zhao, L. China as Number One? Evidence from China’s Most Recent Patenting Surge. J. Dev. Econ. 2017, 124, 107–119. [Google Scholar]
  88. Jacobson, L.S.; LaLonde, R.J.; Sullivan, D.G. Earnings Losses of Displaced Workers. Am. Econ. Rev. 1993, 83, 685–709. [Google Scholar]
  89. De Chaisemartin, C.; d’Haultfoeuille, X. Two-Way Fixed Effects Estimators with Heterogeneous Treatment Effects. Am. Econ. Rev. 2020, 110, 2964–2996. [Google Scholar] [CrossRef] [Scilit]
  90. Callaway, B.; Sant’Anna, P.H. Difference-in-Differences with Multiple Time Periods. J. Econom. 2021, 225, 200–230. [Google Scholar]
  91. Goodman-Bacon, A. Difference-in-Differences with Variation in Treatment Timing. J. Econom. 2021, 225, 254–277. [Google Scholar] [CrossRef] [Scilit]
  92. Cheng, Z.; Yu, X. Can Central Environmental Protection Inspection Induce Corporate Green Technology Innovation? J. Clean. Prod. 2023, 387, 135902. [Google Scholar] [CrossRef] [Scilit]
  93. Zeng, M.; Zheng, L.; Huang, Z.; Cheng, X.; Zeng, H. Does Vertical Supervision Promote Regional Green Transformation? Evidence from Central Environmental Protection Inspection. J. Environ. Manag. 2023, 326, 116681. [Google Scholar]
  94. Qi, Y.; Tang, Y.; Bai, T. Impact of Smart City Pilot Policy on Heterogeneous Green Innovation: Micro-Evidence from Chinese Listed Enterprises. Econ. Change Restruct. 2024, 57, 67. [Google Scholar] [CrossRef] [Scilit]
  95. Yang, S.; Jahanger, A.; Usman, M. Examining the Influence of Green Innovations in Industrial Enterprises on China’s Smart City Development. Technol. Forecast. Soc. Change 2024, 199, 123031. [Google Scholar] [CrossRef] [Scilit]
  96. Baron, R.M.; Kenny, D.A. The Moderator–Mediator Variable Distinction in Social Psychological Research: Conceptual, Strategic, and Statistical Considerations. J. Personal. Soc. Psychol. 1986, 51, 1173. [Google Scholar] [CrossRef]
Figure 1. The spatial distribution of the dual pilot cities. Notes: This map is plotted based on the standard map from the Standard Map Service System of the Ministry of Natural Resources of the People’s Republic of China (Map Approval No. GS(2024)0650). The basic geographic elements of the base map (including national boundaries and administrative division boundaries) remain unmodified; only thematic research data (pilot city distribution) is overlaid on the base map.
Sustainability 18 06566 g001
Figure 2. Trends of quantity and quality in green innovation.
Sustainability 18 06566 g002
Figure 3. Tripartite Synergistic Dynamics in Environmental Governance: Interplay of Governmental Agency, Civic Engagement, and Corporate Conduct. Note: The dashed-line panels from left to right delineate the corporate, residential, and governmental sectors. Azure panels signify micro-level enterprises, civilian constituency, central government authorities, and subnational administrative entities. Directional arrows denote functional interactions between actors, while the orange panel encapsulates the ultimate outcome of these dynamics: green innovation.
Sustainability 18 06566 g003
Figure 4. Parallel Trend Assumption Validation.
Sustainability 18 06566 g004
Figure 5. Coefficient Distribution of the Placebo Test.
Sustainability 18 06566 g005
Table 1. Descriptive Statistics for primary variables.
VariableObservationsMeanMinimumMaximumStd. Dev.
GTIN61754.664716.72600346.7000
GTIQ61752.416610.11760240.5100
Information61750.12620.332001
PGDP55854.94813.80590.122646.7749
Industry58711.06990.65500.07917.7682
ST57701.48761.70870.000220.9064
FDI57880.05050.068100.8395
POP58144.67110.80882.64488.1356
Table 2. Estimation Results of Baseline Regression.

Variable
(1)(2)(3)(4)(5)(6)
GTINGTINGTIQGTIQGTINGTIQ
Information12.9154 ***10.6177 ***7.3241 ***5.8896 ***8.5010 ***4.5245 ***
(4.0857)(4.0821)(3.6385)(3.6890)(3.7066)(2.9745)
PGDP 1.4721 *** 0.8829 ***2.5280 ***1.5375 ***
(3.6287) (3.0554)(3.4301)(2.9986)
Industry 5.3926 * 3.6227 *9.4105 *6.4026
(1.7840) (1.6752)(1.7422)(1.6405)
ST 2.0430 *** 1.0981 ***2.3761 ***1.2714 ***
(3.4465) (3.4454)(3.0322)(3.0424)
FDI 0.4588 2.66001.43993.9406
(0.0452) (0.5271)(0.1026)(0.5756)
POP 3.1779 * 1.3560 *4.28371.8746
(1.9489) (1.7075)(1.2477)(1.1109)
Year fixed effectYesYesYesYesYesYes
City fixed effectYesYesYesYesYesYes
constant3.0379 ***−27.6504 ***1.4941 ***−14.7289 **−40.2693 **−21.9898 **
(7.6263)(−2.6219)(5.8902)(−2.5176)(−1.9805)(−2.0215)
Observations617454016174540137423742
adj. R20.59180.65230.58520.64180.66340.6521
Notes: ***, **, and * denote statistical significance at the 1%, 5%, and 10% levels, respectively. T-statistics are reported in parentheses.
Table 3. Decomposition Results of Goodman-Bacon Method.
Decomposition ItemATT (GTIN)ATT (GTIQ)Weight
Timing Groups0.67096099670.66794039210.0553
Never vs. Timing Groups18.2063506210.137442950.9012
Within Groups−77.34574127−47.547634120.0435
Notes: ATT denotes the average treatment effect on the treated.
Table 4. PSM-DID Estimates.
(1)(2)(3)(4)
1:2 Nearest-Neighbor MatchingKernel Matching
VariableGTINGTIQGTINGTIQ
Information10.8147 ***6.0322 ***10.6177 ***5.8896 ***
(4.1317)(3.7496)(4.0821)(3.6890)
Control variablesYesYesYesYes
Year fixed effectYesYesYesYes
City fixed effectYesYesYesYes
Constant−42.1157 **−23.4343 **−27.6504 ***−14.7289 **
(−2.4369)(−2.3838)(−2.6219)(−2.5176)
Observations3938393854015401
adj. R20.66470.65430.65230.6418
Notes: *** and ** denote statistical significance at the 1% and 5% levels, respectively. T-statistics are reported in parentheses.
Table 5. Endogeneity Addressing Strategies for Causal Identification Validation.
(1)(2)(3)(4)(5)(6)(7)
1-Year Lagged2-Year LaggedFirst-StageSecond-Stage
VariableGTINGTIQGTINGTIQInformationGTINGTIQ
Information10.8888 ***6.1245 ***11.1322 ***6.3343 *** 16.7004 ***9.6027 ***
(4.0689)(3.6286)(3.9979)(3.5377) (3.8175)(3.3244)
IV 0.2589 ***
(37.0960)
Control variablesYesYesYesYesYesYesYes
Year fixed effectYesYesYesYesYesYesYes
City fixed effectYesYesYesYesYesYesYes
Wald F-statistic 1376.423
{16.380}
Constant−27.2315 ***−13.6699 **−25.4947 **−15.7739 **−0.0920
(−2.6092)(−2.4013)(−2.1586)(−2.2850)(−1.0606)
Observations5223522349914991442344234423
adj. R20.68460.67690.69990.69370.95350.18600.1733
Notes: *** and ** denote statistical significance at the 1% and 5% levels, respectively. T-statistics are reported in parentheses. Parentheses ( ) enclose t-statistics for coefficient estimates, while curly braces { } contain the 10% maximal relative bias thresholds from the Stock–Yogo weak identification test.
Table 6. Mitigate Confounding Policy Interventions.
(1)(2)(3)(4)(5)(6)(7)(8)
VariableGTINGTIQGTINGTIQGTINGTIQGTINGTIQ
Information10.6091 ***5.8854 ***10.4335 ***5.7790 ***10.6460 ***5.8785 ***10.1989 ***5.6669 ***
(4.0834)(3.6916)(4.3236)(3.9052)(4.1971)(3.8371)(4.0713)(3.7207)
CEIP−1.0988−0.5341
(−0.8761)(−0.6921)
CETS 11.1146 **6.6686 *
(2.0393)(1.8605)
SC 0.2526−0.0986
(0.1112)(−0.0697)
WBSDC 8.3080 ***4.4166 **
(2.7425)(2.2034)
Control variablesYesYesYesYesYesYesYesYes
Year fixed effectYesYesYesYesYesYesYesYes
City fixed effectYesYesYesYesYesYesYesYes
Constant−27.4443 ***−14.6288 **−24.3035 ***−12.7209 **−27.6114 ***−14.7320 **−25.8475 **−13.7705 **
(−2.6279)(−2.5264)(−2.6267)(−2.5512)(−2.6091)(−2.4932)(−2.4438)(−2.3948)
Observations54015401540154015401540154015401
adj. R20.65220.64180.66530.65510.65220.64180.65900.6472
Notes: ***, **, and * denote statistical significance at the 1%, 5%, and 10% levels, respectively. T-statistics are reported in parentheses.
Table 7. Using Count Regression Models.
(1)(2)(3)(4)
VariableGTINGTINGTIQGTIQ
Information1.7785 ***0.9850 ***1.8392 ***1.0227 ***
(59.9081)(9.7464)(40.7522)(8.8120)
Control variablesNoYesNoYes
Year fixed effectYesYesYesYes
City fixed effectYesYesYesYes
Constant0.4474 ***0.01610.5686 ***−0.1022
(8.2959)(0.0548)(7.2588)(−0.2905)
Observations6174540161745401
Notes: *** denotes statistical significance at the 1% level. This section employs clustered bootstrap standard errors.
Table 8. Estimation Results of Alternative Dependent Variables.
(1)(2)
VariableGTIAGTIA
Information1.4931 ***1.1262 ***
(3.7523)(3.5918)
Control variablesNoYes
Year fixed effectYesYes
City fixed effectYesYes
Constant0.3411 ***−0.9243
(7.5889)(−0.8739)
Observations56225182
adj. R20.50220.5900
Notes: *** denotes statistical significance at the 1% level. T-statistics are reported in parentheses.
Table 9. Mechanism test.
(1)(2)(3)(4)(5)(6)(7)(8)(9)
VariablePECGTINGTIQSO2GTINGTIQSubsidyGTINGTIQ
Information22.1292 ***5.6222 ***2.8610 ***−0.1900 **9.7156 ***5.3510 ***1.6277 ***10.4565 ***5.8153 ***
(4.3731)(3.9173)(3.2232)(−2.4034)(4.2676)(3.9007)(3.7770)(4.0402)(3.6623)
PEC 0.0847 ***0.0528 *** −4.0585 ***−2.4317 ** 0.0948 ***0.0430 **
(8.5933)(9.8623) (−2.7798)(−2.4332) (3.1433)(2.5043)
SO2
Subsidy
Control variablesYesYesYesYesYesYesYesYesYes
Year fixed effectYesYesYesYesYesYesYesYesYes
City fixed effectYesYesYesYesYesYesYesYesYes
Constant6.5203−14.4421 **−7.8333 **1.5569 ***−21.2553 **−10.8900 **−2.6295−27.3852 ***−14.6059 **
(0.6593)(−2.3670)(−2.2787)(3.9952)(−2.4782)(−2.4103)(−1.0961)(−2.6043)(−2.5043)
Observations296129612961537853785378540054005400
adj. R20.75970.84830.85840.85180.66680.65660.66650.65290.6422
Notes: *** and ** denote statistical significance at the 1% and 5% levels, respectively. T-statistics are reported in parentheses.
Table 10. Estimation Results of Comparative Analysis.
(1)(2)(3)(4)(5)(6)
1:2 Nearest-Neighbor MatchingKernel MatchingCallaway and Sant’Anna (2021)
VariableGTINGTIQGTINGTIQGTINGTIQ
Information_c5.6219 ***3.0162 ***5.5892 ***2.9958 ***
(3.8730)(3.2035)(3.8942)(3.2154)
Overall_ATT 4.2375 **2.2009 *
(2.2856)(1.8558)
Control variablesYesYesYesYesYesYes
Year fixed effectYesYesYesYes
City fixed effectYesYesYesYes
Constant−17.8237 **−8.2801 *−15.9365 *−7.3724 *
(−2.1050)(−1.8724)(−1.9416)(−1.7512)
Observations229722972316231622922292
adj. R20.86710.87940.86690.8793
Notes: The table reports the overall ATT from the Callaway and Sant’Anna [90] staggered DID estimator, estimated via the outcome regression approach and aggregated by treatment cohort size. Standard errors are clustered at the city level. ***, **, and * denote statistical significance at the 1%, 5%, and 10% levels, respectively. T-statistics are reported in parentheses.
Disclaimer/Publisher’s Note: The statements, opinions and data contained in all publications are solely those of the individual author(s) and contributor(s) and not of MDPI and/or the editor(s). MDPI and/or the editor(s) disclaim responsibility for any injury to people or property resulting from any ideas, methods, instructions or products referred to in the content.