Optimizing Production–Living–Ecological Space Under Resource and Environmental Carrying Capacity Constraints: Evidence from Daye City, China



Abstract
1. Introduction
2. Materials and Methods
2.1. Study Area
2.2. Data Sources and Preprocessing
- (1)
- Conventional statistical and remote sensing data: Statistical and remote sensing data were derived from authoritative national scientific data platforms and government statistical yearbooks (Table 1). Following missing value filling, outlier removal and coordinate consistency processing, multi-source datasets were spatially matched using spatial interpolation.
- (2)
- Geospatial big data: A location accessibility index was derived from commuting time estimates based on road network data acquired through the Baidu Maps API, with a 3 km × 3 km grid and weighted interpolation. The social security level was evaluated by the spatial accessibility of public service facilities. POI data for medical, financial and other public service facilities were collected using Python 3.13, and accessibility was calculated via the Dijkstra shortest-path algorithm.
- (3)
- Thematic data: Relevant data were collected, including the “Three Zones and Three Lines”, mining rights distribution, river and lake protection boundaries, drinking water source protection zones, flood control zones, forestry development plans, land supply plans, and industrial park development plans, to improve the regional adaptability of the evaluation.

| Data Category | Data Name | Data Source | Accuracy/Resolution |
|---|---|---|---|
| Ecological Environment | Meteorological Data (Precipitation/Accumulated Temperature, 2015) | Resource and Environment Science and Data Center, Chinese Academy of Sciences (RESDC, CAS) | 1 km |
| Land Cover Data (GlobeLand30, 2020) | China Knowledge Centre for Engineering Sciences and Technology (CKCEST) | 30 m | |
| Remote Sensing Imagery (Landsat 8 OLI, 2018) | Geospatial Data Cloud | 30 m | |
| PM2.5 Concentration (2018) | Data Sharing Service System of the Big Earth Data Science Engineering Program (CASEarth) | 1 km | |
| Potential Geological Hazard Sites (2020) | Daye Municipal Bureau of Natural Resources and Planning | Vector Point Data | |
| Land Resources | Digital Elevation Model (DEM, 2020) | Geospatial Data Cloud (GDEMV2) | 30 m |
| Soil Properties (Silt Content/Organic Matter, 2009) | National Tibetan Plateau Data Center (Harmonized World Soil Database, HWSD) | 1 km | |
| Surface Effective Radiation (Multi-Year Average, 1971–2000) | National Ecological Science and Technology Resource Service Platform | / | |
| Social Development | Basic Geospatial Information (Administrative Boundaries/Road Networks) | Daye Municipal People’s Government, OpenStreetMap (OSM) | Vector |
| Socio-Economic Statistics (GDP/Population, 2021) | Encyclopedia of Administrative Divisions of the People’s Republic of China, Seventh National Population Census of the People’s Republic of China | Township level | |
| Social Sensing Data (Commuting/POI Data) | Baidu Maps Open API, Web Crawling and Secondary Calculation | / |
2.3. Evaluation Model of RECC
2.3.1. Index System Construction and Weighting Method
- (1)
- Indicator Standardization: To eliminate differences in dimensions and magnitudes among indicators, all variables were standardized using the min–max normalization method. Positive and negative indicators were processed according to Equations (1) and (2), respectively.
- (2)
- Subjective Weight Determination: To ensure the reliability and regional applicability of the evaluation, a panel of 37 experts and local practitioners from fields such as territorial spatial planning, ecological assessment, and agricultural resources was selected. The expert questionnaire utilized scoring guidelines based on a series of national standards, including the Code for Classification of Urban Land Use and Planning Standards of Development Land (GB 50137-2011), Regulations for Gradation on Agricultural Land Quality (GB/T 28407-2012), and Ecosystem Assessment (GB/T 43678-2024) [33,34,35]. After excluding samples with logical inconsistencies, 31 valid questionnaires were used for weight calculation.The Saaty 1–9 scale was employed to construct the pairwise comparison matrix , where and . The geometric mean method was used to aggregate the independent scores from the 31 experts into a comprehensive group decision matrix:Subsequently, the square root method was applied to calculate the local weight of each indicator, followed by normalization:To verify the logical consistency of expert judgments, consistency tests were conducted on the aggregated judgment matrices. By calculating the maximum eigenvalue (), the Consistency Index (CI) and Consistency Ratio (CR) were obtained using and , where RI denotes the Random Index. A judgment matrix was considered acceptable when . All aggregated matrices satisfied this criterion, indicating satisfactory consistency of expert judgments. The corresponding pairwise comparison matrices and consistency statistics are provided in Appendix A (Table A1, Table A2 and Table A3). In addition, Kendall’s coefficient of concordance (W) was calculated to assess inter-rater reliability among the 31 experts. The results indicated significant agreement among the experts (W = 0.732, p < 0.001), further supporting the robustness of the AHP weighting process.
- (3)
- Objective Weight Determination: To mitigate the potential decision bias inherent in purely subjective weighting, the entropy weight method was introduced to determine the objective weights based on the dispersion of the indicator data.First, the proportion of the -th evaluation unit under the -th indicator was calculated:where denotes the data processed by min–max normalization, and is the total number of evaluation units (i.e., spatial grids in Daye City).Next, the information entropy of the -th indicator was computed:(Note: When , is defined as 0 to prevent invalid calculations.)Finally, the objective weight of the -th indicator was obtained:where n represents the total number of evaluation indicators (27 in total), and indicates the information utility value of the -th indicator.
- (4)
- Combined Weight Calculation: A normalized multiplicative synthesis method was employed to calculate the final comprehensive weights. This approach amplifies core indicators that possess significant weights both subjectively and objectively, thereby enhancing the discriminatory power of the evaluation results [36,37]. The calculation is as follows:where is the subjective weight (AHP), is the objective weight (entropy method), and represents the final comprehensive weight of the j-th indicator.
| Subsystem | Criterion Layer | Indicator Layer | Comprehensive Weight |
|---|---|---|---|
| Ecological Environment | Ecological services | Water conservation | 0.2550 |
| Soil and water conservation | 0.5218 | ||
| Windbreak and sand fixation | 0.2232 | ||
| Ecosystem risks | Soil erosion sensitivity | 0.4753 | |
| Rocky desertification sensitivity | 0.5247 | ||
| Ecosystem constraints | Air pollution | 0.1538 | |
| Geological hazard risk | 0.8462 | ||
| Agricultural Production | Agro-climatic suitability | Surface effective radiation | 0.3274 |
| Photo-thermal productivity | 0.4011 | ||
| Arable land aspect | 0.2715 | ||
| Agricultural water suitability | Regional drought index | 0.4006 | |
| Agricultural land suitability | Arable land elevation | 0.1780 | |
| Arable land slope | 0.3435 | ||
| Soil organic matter content | 0.2833 | ||
| Soil silt content | 0.1952 | ||
| Socio-Economic | Urban construction suitability | Land construction suitability | 0.1103 |
| Location advantage index | 0.1836 0.7061 | ||
| Spatial stress of industrial/mining land | 0.1189 | ||
| Social development level | Transport accessibility | 0.2661 | |
| Population density | 0.2725 | ||
| Regional gross industrial output | 0.2886 | ||
| Regional consumption level | 0.054 | ||
| Regional land-use intensity | 0.2265 | ||
| Social security level | Medical service accessibility | 0.2462 | |
| Industrial distribution density | 0.3145 | ||
| Service facility level | 0.2128 | ||
| Cultural and recreational facility level | 0.2550 |
2.3.2. Obstacle Degree Model
- (1)
- Factor Contribution Degree : This indicator represents the contribution of a single indicator to the overall evaluation objective, with its value equal to the comprehensive weight of the corresponding single indicator:where is the comprehensive weight of the j-th indicator, which is fully consistent with the calculation results of the combined weighting method described above.
- (2)
- Index Deviation Degree : This indicator reflects the gap between the actual value of a single indicator and the optimal value for carrying capacity, with its value defined as the difference between 1 and the normalized value of the indicator:where is the normalized value of the j-th indicator for the i-th evaluation unit, which is consistent with the results of the min–max normalization process detailed in the previous section.
- (3)
- Obstacle Degree : This indicator quantifies the inhibitory effect of a single indicator on the improvement of carrying capacity. Meanwhile, the comprehensive obstacle degree of categorical indicators can be calculated via weighted averaging to identify the core restricting factors:where is the obstacle degree of the j-th indicator for the i-th evaluation unit; a larger value indicates a stronger inhibitory effect on the improvement of carrying capacity; the summation ranges from j = 1 to n = 27 (the total number of evaluation indicators in this study).
2.3.3. Calculation of Key Parameters
- (1)
- Soil and Water Conservation Function: The soil and water conservation capacity was evaluated based on slope gradient, slope length, fractional vegetation cover, and the percentages of soil clay, silt, sand, and organic carbon [40], as expressed in Equation (10):where represents the evaluated soil and water conservation capacity; K is the soil erodibility factor; L and S are the topographic factors for slope length and gradient, respectively; and C is the vegetation cover factor.The soil erodibility factor (K) characterizes soil sensitivity to water erosion, which significantly correlates with soil organic matter content and particle composition [41,42]. It is calculated using Equation (11):where , , and denote the percentages of soil clay, silt, and sand, respectively; and is the percentage of soil organic carbon.The vegetation cover factor (C) reflects the mitigating effect of vegetation on soil erosion. Following the N-SPECT model parameterization, the C value was set to 0 for paddy fields and wetlands, 0.01 for construction land, and 0.7 for barren land. For rainfed cropland, the C value was calculated using Equation (12):where is the vegetation cover factor for rainfed cropland, and indicates the fractional vegetation cover.
- (2)
- Medical Security Level: Travel times from each sampling point to nearby hospitals and clinics were retrieved via the Baidu Maps Open API using Python scripts [43,44]. The minimum travel time was identified and transformed based on Equations (13) and (14). The final spatial distribution was then generated through spatial interpolation and normalization processing [45,46,47].where is the transformed value of the minimum travel time for sampling point i; represents the absolute shortest travel time (in seconds) from sampling point to the nearest hospital; and is the travel time (in seconds) from sampling point to hospital .
2.3.4. RECC-Driven Spatial Optimization Method
3. Results
3.1. Evaluation Results of RECC
3.1.1. Evaluation of the Ecological Environment Subsystem
3.1.2. Evaluation of the Agricultural Production Subsystem
3.1.3. Evaluation of the Socio-Economic Subsystem
3.2. Diagnosis of Obstacle Factors for RECC Enhancement and Their Spatial Characteristics
3.2.1. Identification of Dominant Obstacle Factors Across the Study Area
3.2.2. Spatial Agglomeration Patterns of Core Obstacle Factors
3.2.3. Interaction Mechanisms Among Obstacle Factors
3.3. Optimized Layout of PLE Spaces
3.3.1. Identification and Classification of PLE Spaces Based on Land Use
3.3.2. Spatial Utilization Conflicts and Tailored Optimization Strategies
- (1)
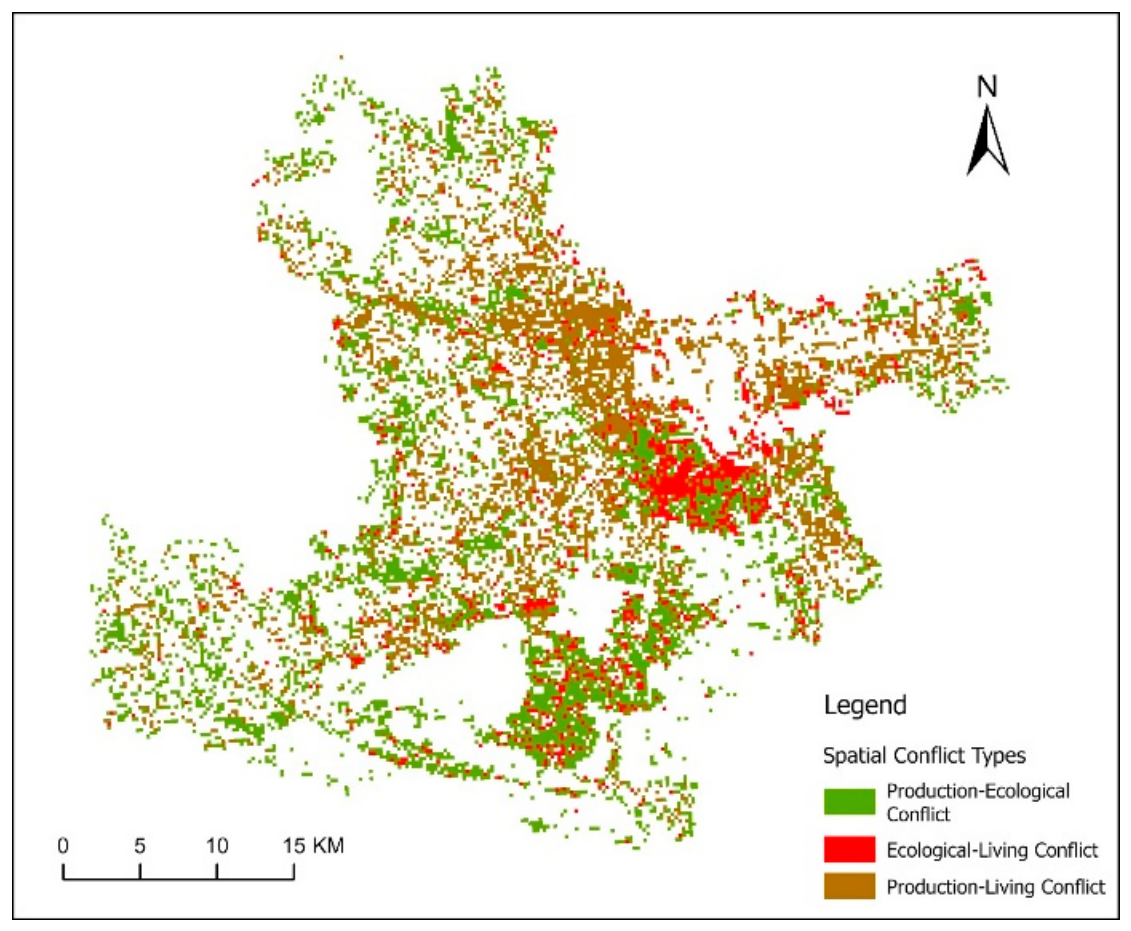
- Production–Ecological Conflict: This conflict type largely overlaps with the high-value hotspots of soil erosion sensitivity—the third-ranked obstacle factor across the study area. As the most spatially extensive conflict, it covers 266.94 km2 (47.73% of the total conflict area) and is concentrated in the transitional zone between the southern Mufu Mountains and the central plains (e.g., the peripheries of Liurenba and Yinzu Towns). Steep slopes and low vegetation cover render the area highly susceptible to soil erosion and rocky desertification triggered by steep-slope agricultural reclamation, thereby undermining regional water conservation functions. Optimization Strategy: In gently sloping areas with high-quality, contiguous cultivated land, terracing projects should be implemented. In steeply sloping areas with fragmented, low-quality land, the policy of cropland-to-forest and grassland conversion should be rigorously enforced to reinforce the city’s southern ecological barrier.
- (2)
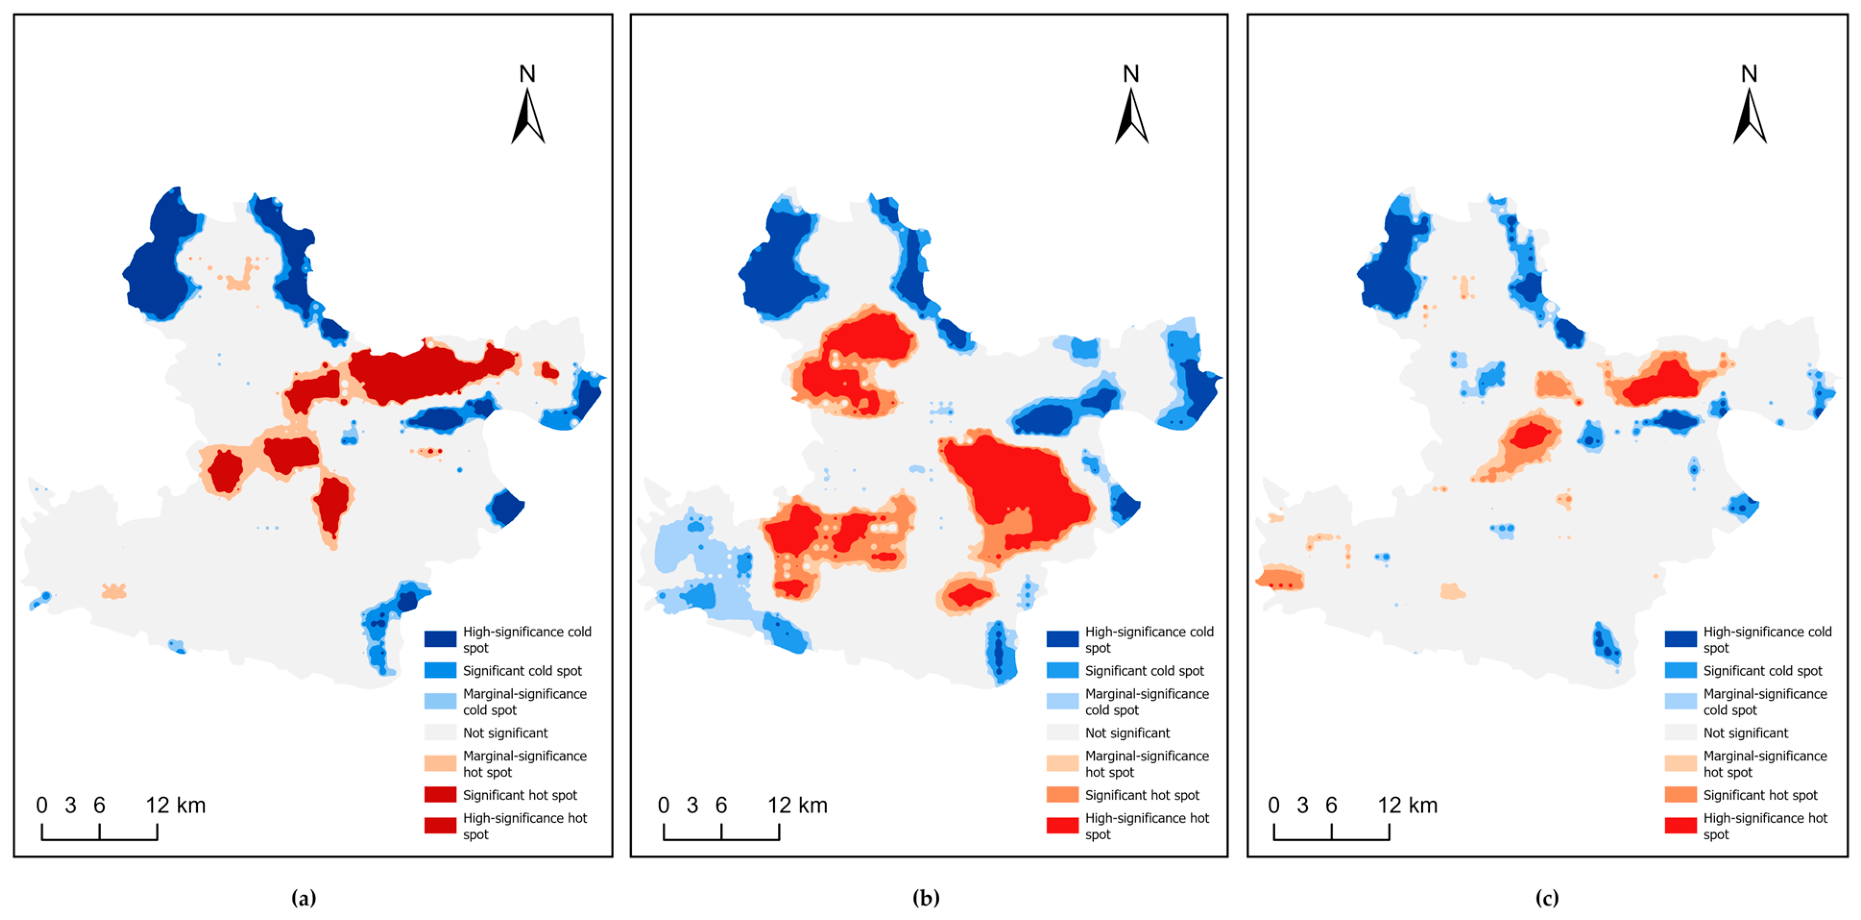
- Production–Living Conflict: The primary driver of this conflict is the top-ranked obstacle factor—the spatial stress of industrial/mining land. Its highly significant hotspots largely coincide with structural conflicts in the central and western plains and gentle hills. Covering 222.74 km2 (39.82% of the total conflict area), the conflict arises from two distinct mechanisms: (i) Urban expansion-driven conflict in the northeastern central urban area: The area has flat terrain and abundant water resources, affected by the expansion of the main urban area, and construction land has encroached on agricultural land. (ii) Structural conflict in the central and western plain and hilly areas: Inefficient rural residential land and industrial/mining land are fragmented and interspersed within large agricultural production areas, resulting in an imbalance in land allocation. Optimization Strategy: In the northeast, the urban–rural construction land linking quota policy should be applied to consolidate fragmented farmland while preserving the total cultivated land area, thereby reserving space for orderly urban expansion. In the central and western regions, underutilized construction land could be cleared and reclaimed as agricultural space to alleviate farmland fragmentation.
- (3)
- Ecological–Living Conflict: This conflict largely overlaps with the high-value hotspots of geological hazard risk—the second-ranked obstacle factor—further confirming the chain-reaction effect of secondary hazards induced by the spatial stress of industrial/mining land. It covers 66.95 km2 (12.45% of the total conflict area) and appears as scattered patches in the southern low hills and piedmont zones. Some rural settlements are located within areas highly susceptible to landslides and debris flows, posing significant geohazard risks to local residents. Optimization Strategy: Systematic disaster risk assessments should be conducted for rural settlements, existing hazard sites remediated, and emergency facilities constructed. In high-risk areas, priority should be given to risk mitigation measures. Where appropriate, phased and voluntary relocation may be considered, followed by ecological restoration to enhance landscape stability.
3.3.3. Optimization of the Spatial Pattern
3.3.4. Effectiveness Evaluation of Spatial Pattern Optimization
- (1)
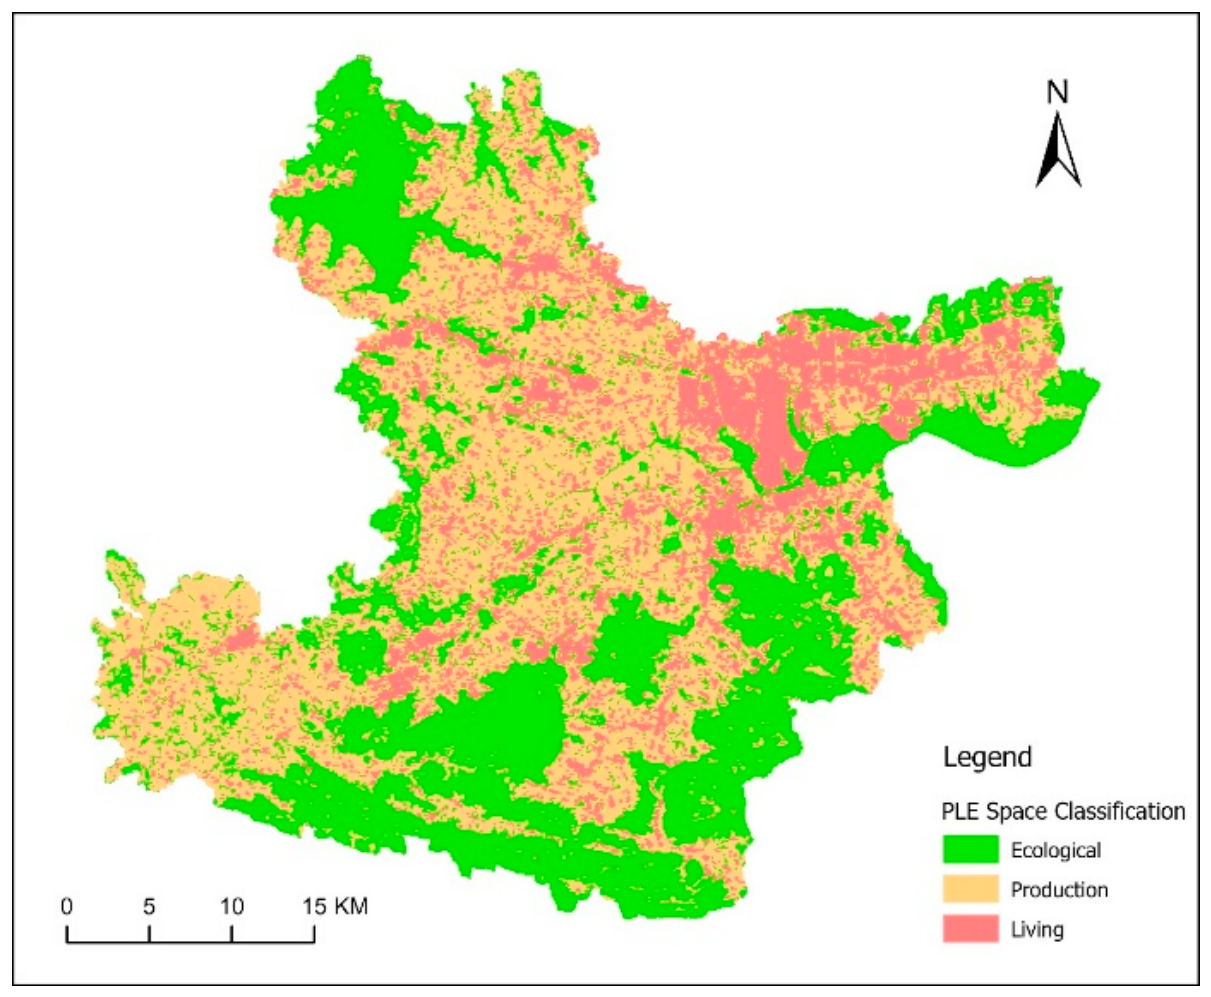
- Mitigation of Core Obstacle Constraints: By identifying legacy and high-stress industrial and mining spaces, ecological restoration and land replacement were implemented for 8.96 km2 of abandoned industrial and mining patches within the study area. These patches were systematically reallocated to ecological and agricultural spaces, thereby weakening the influence of industrial/mining stress (with an overall obstacle degree of 36.47%) on the regional RECC. Meanwhile, legally operating mines and certified green mines were retained to promote the transition of mining development from dispersed to intensive modes. This reduces spatial conflicts arising from fragmented industrial/mining land and supports the systematic remediation and functional optimization of inefficient industrial/mining land.
- (2)
- Resolution of Structural Spatial Conflicts: The total proportion of living space increased from 13.97% to 21.27%. This increase did not result from uncontrolled urban sprawl, but was achieved through the implementation of the linking policy for urban construction land increase and rural residential land decrease and disaster avoidance resettlement. These measures effectively alleviated the spatial interlacing conflicts between production–living spaces and ecological–living spaces.
- (3)
- Systematic Quality Improvement of Ecological and Agricultural Protection Spaces: The proportions of ecological space (45.21%) and agricultural space (33.51%) changed slightly after spatial optimization. The primary improvement resulted from the removal of misclassified degraded wasteland and polluted land patches. The optimized territorial pattern has clearer functional boundaries and higher spatial connectivity, thereby improving regional ecological resilience and strengthening the RECC baseline.
4. Discussion
5. Conclusions
- (1)
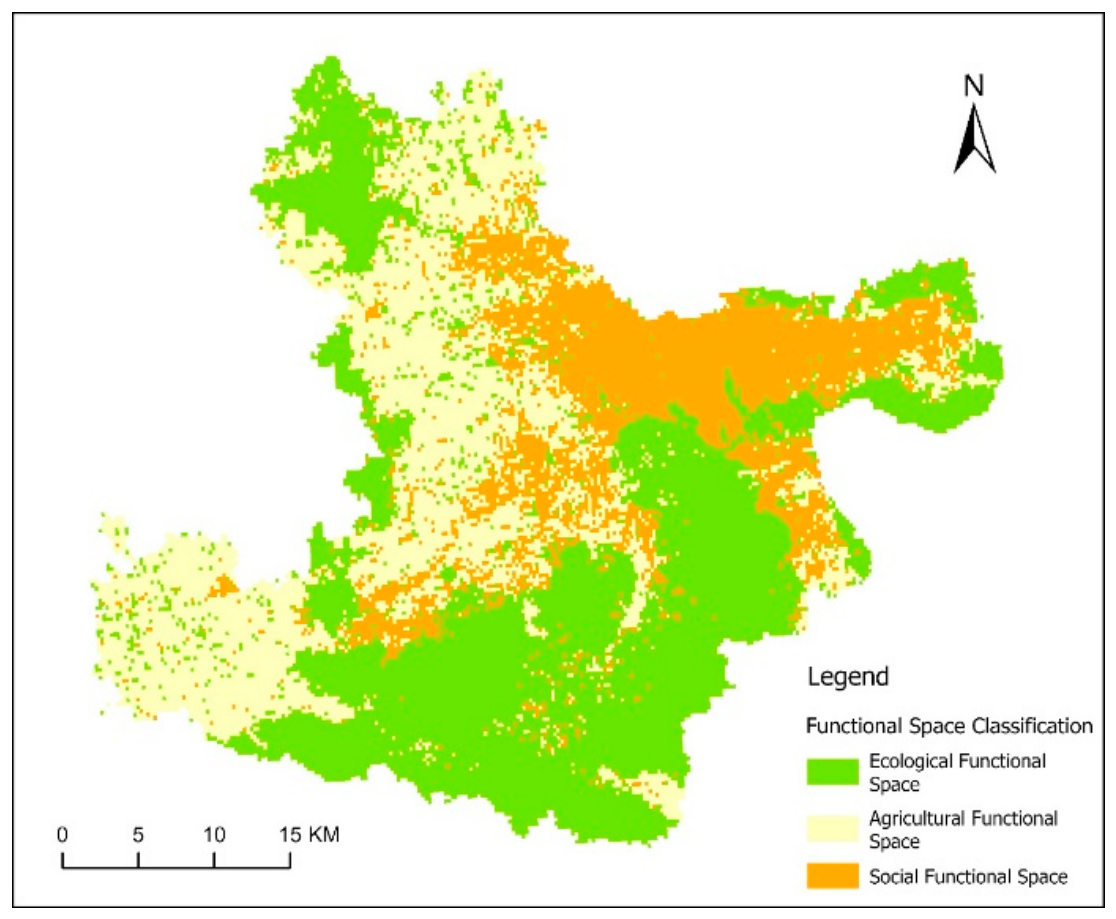
- The RECC of Daye City exhibits a distinct north–south spatial differentiation pattern. High ecological carrying capacity is concentrated in the Mufu Mountains in the south and the lake-network region in the north, forming a spatial pattern shaped by mountain and water ecosystems. Cultivated land in the southern mountain fringe areas is subject to the dual constraints of soil erosion and geological hazards. High-value areas of agricultural carrying capacity are concentrated in the plains of the northern, central, and southwestern parts of the city, serving as the core hinterland for grain production. Urban development carrying capacity is highly coupled with the infrastructure density of the central urban area, exhibiting significant spatial polarization.
- (2)
- The spatial stress of industrial/mining land and its induced secondary ecological disasters constitute the core constraint chain for RECC improvement. The obstacle degree diagnosis shows that the spatial degree of industrial/mining land stress (36.47%) is the primary dominant obstacle to RECC enhancement. Together with geological hazard risk (15.45%) and soil erosion sensitivity (13.01%), these three factors reach a cumulative obstacle degree of 64.93%, jointly forming the core constraint system. Spatially, the extremely significant hotspots of the three factors exhibit a high degree of spatial overlap in the central and northern regions, dominated by legacy industrial/mining lands associated with historical resource extraction. Mechanistically, the interaction between industrial/mining stress and geological hazard risk yields a q-value of 0.2823, and its interaction with soil erosion sensitivity yields a q-value of 0.2438, presenting a strong bivariate enhancement and nonlinear enhancement, respectively. These results indicate a cascading feedback process linking mining disturbance, ecological degradation, and declining carrying capacity, which is the fundamental cause of the markedly low RECC in mining areas.
- (3)
- The spatial distribution of PLE space conflicts is highly coupled with the hotspot areas of core obstacle factors. Conflicts across the study area are dominated by production–ecological conflicts (accounting for 47.73%), which are accompanied by two core risks: ecological degradation and environmental hazards. Specifically, urban expansion-driven conflicts are concentrated along the urban fringe in the northeastern part of the city; structural conflicts are formed in the central and western rural areas under the influence of long-term industrial/mining activities; and the southern mountain fringe areas, constrained by both steep-slope farming and geological hazards, have significant safety risks for human settlements.
- (4)
- Differentiated spatial restructuring should focus on alleviating industrial and mining stress and mitigating cascading disaster risks. Based on the rigid constraints of RECC and obstacle diagnosis results, we constructed a territorial spatial optimization pattern characterized by “ecological barrier, contiguous agricultural land, and compact urban development”. After optimization, the proportions of ecological functional space, agricultural functional space, and urban development space are 45.21%, 33.51%, and 21.27%, respectively. For Daye City and other similar resource-exhausted cities, spatial restructuring should not be limited to land quota reallocation alone. For structural conflicts in the central and western regions, the focus should be on revitalizing existing land stock to improve land use efficiency; for high-risk areas in the south, strict ecological protection and risk-mitigation measures should be prioritized, while relocation may be considered where necessary and feasible. Meanwhile, a multi-stakeholder collaborative restoration and risk assessment mechanism could support improvements in human-settlement safety, resilience, and regional carrying capacity.
Author Contributions
Funding
Institutional Review Board Statement
Informed Consent Statement
Data Availability Statement
Conflicts of Interest
Appendix A
| Ecological Services | Ecosystem Risks | Ecosystem Constraints | |
|---|---|---|---|
| Ecological services | 1.000 | 0.512 | 0.327 |
| Ecosystem risks | 1.953 | 1.000 | 0.491 |
| Ecosystem constraints | 3.058 | 2.037 | 1.000 |
| λmax = 3.0098 | CI = 0.0049 | CR = 0.0084 | RI = 0.58 |
| Agro-Climatic Suitability | Agricultural Water Suitability | Agricultural Land Suitability | |
|---|---|---|---|
| Agro-climatic suitability | 1.000 | 0.487 | 0.213 |
| Agricultural water suitability | 2.053 | 1.000 | 0.342 |
| Agricultural land suitability | 4.695 | 2.924 | 1.000 |
| λmax = 3.0042 | CI = 0.0021 | CR = 0.0036 | RI = 0.58 |
| Urban Construction Suitability | Social Development Level | Social Security Level | |
|---|---|---|---|
| Urban construction suitability | 1.000 | 0.524 | 0.497 |
| Social development level | 1.908 | 1.000 | 1.315 |
| Social security level | 2.012 | 0.760 | 1.000 |
| λmax = 3.0083 | CI = 0.0042 | CR = 0.0072 | RI = 0.58 |
References
- Wu, K.; Zhang, W.Z.; Zhang, P.Y.; Xue, B.; An, S.W.; Shao, S.; Long, Y.; Liu, Y.J.; Tao, A.J.; Hong, H. High-quality development of resource-based cities in China:Dilemmas and breakthroughs. J. Nat. Resour. 2023, 38, 1–21. [Google Scholar] [CrossRef]
- Gao, Z.G.; Ding, M.Y. Digital economy, carbon emission intensity and high-quality development of resource-based cities. Gansu Soc. Sci. 2024, 2, 184–195. [Google Scholar] [CrossRef]
- Wang, Q.; Li, W. Research progress and prospect of regional resource and environmental carrying capacity evaluation. Ecol. Environ. Sci. 2020, 29, 1487–1498. [Google Scholar] [CrossRef]
- Fan, J.; Zhou, K. Theoretical thinking and path exploration of deepening the implementation of major function-oriented zone strategy with “Three Zones and Three Lines”. China Land Sci. 2021, 35, 1–9. [Google Scholar] [CrossRef]
- Lin, G.; Jiang, D.; Fu, J.; Zhao, Y. A Review on the Overall Optimization of Production–Living–Ecological Space: Theoretical Basis and Conceptual Framework. Land 2022, 11, 345. [Google Scholar] [CrossRef]
- Chen, X.P.; Fang, K.; Peng, J.; Liu, A.Y. New insights into assessing the carrying capacity ofresources and the environment:The origin, development and prospects of the planetary boundaries framework. J. Nat. Resour. 2020, 35, 513–531. [Google Scholar] [CrossRef]
- DuPuy, P.; Galaitsi, S.; Linkov, I. Carrying capacity in human-environment interactions: A systematic review. Integr. Environ. Assess. Manag. 2025, 21, 526–539. [Google Scholar] [CrossRef] [PubMed]
- Li, C.H.; Ren, B.P. Spatial characteristics and convergence analysis of regional resource and environmental carrying capacity in China. Hum. Geogr. 2023, 38, 88–96. [Google Scholar] [CrossRef]
- Duan, X.J.; Wang, L.; Kang, J.Y.; Liu, Y. Theory and methodology of rural construction type classification: A case study of Jiangsu Province. Sci. Geogr. Sin. 2022, 42, 323–332. [Google Scholar] [CrossRef]
- Sadri-Shojaei, S.; Momeni, M.; Kerachian, R. A novel methodology for assessing resources and environmental carrying capacity with emphasis on ecosystem services: A multi-disciplinary approach to sustainable urban planning. J. Environ. Manag. 2025, 373, 123507. [Google Scholar] [CrossRef] [PubMed]
- Bao, K.; He, G.; Ruan, J.; Zhu, Y.; Hou, X. Analysis on the resource and environmental carrying capacity of coal city based on improved system dynamics model: A case study of Huainan, China. Environ. Sci. Pollut. Res. 2022, 30, 36728–36743. [Google Scholar] [CrossRef] [PubMed]
- Xiao, J.; Zhang, J.; He, G.; Li, H.; Du, L.; Yang, R.; Yin, M.; Tian, P.; Yang, Y.; Li, Q.; et al. Integrated Assessment of Water Resource Carrying Capacity: Dynamics, Obstacles, Coordination and Driving Mechanisms in the Gansu Section of the Yellow River Basin, China. Water 2026, 18, 761. [Google Scholar] [CrossRef]
- Du, Y.-W.; Wang, Y.-C.; Li, W.-S. Emergy ecological footprint method considering uncertainty and its application in evaluating marine ranching resources and environmental carrying capacity. J. Clean. Prod. 2022, 336, 130363. [Google Scholar] [CrossRef]
- Tang, L.; Huang, J.; Cui, Q.; Chen, X.; Xian, B.; Wang, Y.; Wang, D. Evaluation of Regional Resources and Environmental Carrying Capacity in China: A Case Study of Shandong Province. Sustainability 2026, 18, 2256. [Google Scholar] [CrossRef]
- Khani, S.; Emadzadeh, M.; Mahjouri, N.; Behboudian, M. A novel framework for evaluating water resources and environmental carrying capacity under climate change: The Zarrinehrud Basin experience. Environ. Sustain. Indic. 2025, 27, 100810. [Google Scholar] [CrossRef]
- Pravitasari, A.E.; Stanny, Y.A.; Indraprahasta, G.S.; Mulya, S.P.; Rustiadi, E.; Rosandi, V.B.; Wulandari, S.; Wahid, M. Carrying capacity based on ecological footprint of six metropolitan areas in Java Island. Environ. Sustain. Indic. 2026, 30, 101168. [Google Scholar] [CrossRef]
- Tong, C.; Jin, Y.; Liang, B.; Ye, Y.; Bao, H. A comprehensive framework for monitoring and providing early warning of resource and environmental carrying capacity within the Yangtze River Economic Belt based on big data. Land 2024, 13, 1993. [Google Scholar] [CrossRef]
- Peng, Y.; Tan, X.; Zhu, Z.; Liao, J.; Xiang, L.; Wu, F. Evaluation of resource and environmental carrying capacity at provincial level in China using a pressure–support–adjustment ternary system. Sustainability 2024, 16, 8607. [Google Scholar] [CrossRef]
- Xu, J.Q. Development process and thinking of “Three Zones”. Land Sci. Front. 2021, 4, 20–22. [Google Scholar]
- Li, X.H.; Luo, X.; Pang, Z.H. Spatiotemporal evolution and driving forces of synergistic development between the “dual carbon” goals and economy and society: Based on the perspective of carbon reduction through the synergy of “production-living-ecological spaces”. Popul. Resour. Environ. 2025, 35, 55–65. [Google Scholar]
- Jia, J.; Jiang, E.; Tian, S.; Qu, B.; Li, J.; Hao, L.; Liu, C.; Jing, Y. Land-Use Transformation and Its Eco-Environmental Effects of Production–Living–Ecological Space Based on the County Level in the Yellow River Basin. Land 2025, 14, 427. [Google Scholar] [CrossRef]
- Sun, Y.; Wang, J.W.; Wu, S.D. Resource and environmental carrying capacity in China for 35 years:Evolution, hotspots, future trend. J. Nat. Resour. 2022, 37, 34–58. [Google Scholar] [CrossRef]
- Bole, Y.; Rina, S.; Guga, S.; Na, M.; Fan, S.; Zhang, J. Evaluation of resources, environment, and ecological carrying capacity from the perspective of “production-living-ecology” spaces: A case study of western Jilin Province, China. J. Clean. Prod. 2025, 491, 144770. [Google Scholar] [CrossRef]
- Jiang, Z.M.; Wu, H.; Xu, Z.C.; Shen, F.; Jia, N.; Huang, J.C.; Lin, A.Q. Optimizing land use spatial patterns to balance urban development and resource-environmental constraints: A case study of China’s Central Plains Urban Agglomeration. J. Environ. Manag. 2025, 380, 125173. [Google Scholar] [CrossRef] [PubMed]
- Li, G.; Cheng, L.; Liu, G.; Zheng, Z. Prediction of land use and optimization of water environmental carrying capacity on Xiamen Island based on socio-economic and water environmental coordination objectives. Sustain. Cities Soc. 2025, 134, 106922. [Google Scholar] [CrossRef]
- Wang, S.; Yang, L.; Arif, M. Evolutionary analysis of ecological-production-living space-carrying capacity in tourism-centric traditional villages in Guangxi, China. J. Environ. Manag. 2025, 375, 124182. [Google Scholar] [CrossRef] [PubMed]
- Guo, X.; Fang, C.; Mu, X.; Chen, D. Coupling and coordination analysis of urbanization and ecosystem service value in Beijing-Tianjin-Hebei urban agglomeration. Ecol. Indic. 2022, 137, 108782. [Google Scholar] [CrossRef]
- Ozsahin, E.; Ozdes, M. Agricultural land suitability assessment for agricultural productivity based on GIS modeling and multi-criteria decision analysis: The case of Tekirdag province. Environ. Monit. Assess. 2022, 194, 41. [Google Scholar] [CrossRef]
- Song, W.; Zhang, H.; Zhao, R.; Wu, K.; Li, X.; Niu, B.; Li, J. Study on cultivated land quality evaluation from the perspective of farmland ecosystems. Ecol. Indic. 2022, 139, 108959. [Google Scholar] [CrossRef]
- Bai, J.J.; Xu, X.; Duan, Y.T.; Zhang, G.Y.; Wang, Z.; Wang, L.; Zheng, C.L. Evaluation of resource and environmental carrying capacity in rare earth mining areas in China. Sci. Rep. 2022, 12, 6105. [Google Scholar] [CrossRef] [PubMed]
- Wu, X.L.; Hu, F. Analysis of ecological carrying capacity using a fuzzy comprehensive evaluation method. Ecol. Indic. 2020, 113, 106243. [Google Scholar] [CrossRef]
- Fu, Z.; Ding, X.; Guo, Y.; Chen, Y.; Li, M.; Hu, X.; Huang, J.; Zhao, X.; Fu, X.; Fang, Y. Evaluation and prediction of water resources carrying capacity in Dongting Lake area based on county unit and DWM-BP neural network model. Water 2024, 16, 3480. [Google Scholar] [CrossRef]
- GB 50137-2011; Code for Classification of Urban Land Use and Planning Standards of Development Land. China Architecture & Building Press: Beijing, China, 2011.
- GB/T 28407-2012; Regulations for Gradation on Agricultural Land Quality. General Administration of Quality Supervision, Inspection and Quarantine of the People’s Republic of China. Standardization Administration of the People’s Republic of China: Beijing, China, 2012.
- GB/T 43678-2024; Ecosystem Assessment—Methodology for Ecosystem Services Assessment. State Administration for Market Regulation. Standardization Administration of China: Beijing, China, 2024.
- Li, G.; Li, J.P.; Sun, X.L.; Zhao, D. Research on subjective-objective combined weighting method considering both ordinal and intensity information. Chin. J. Manag. Sci. 2017, 25, 179–187. [Google Scholar] [CrossRef]
- Li, Z.J.; Wang, T. Evaluation of regional water resources carrying capacity based on an improved combination weighting method. China Rural Water Hydropower 2022, 10, 112–118. [Google Scholar] [CrossRef]
- Wu, X.L.; Peng, B. Urban comprehensive carrying capacity analysis in Zhejiang Province of China from the perspective of production, living, and ecological spaces. Geo-Spat. Inf. Sci. 2024, 27, 2179–2198. [Google Scholar] [CrossRef]
- Zhang, L.; Li, W.; Chen, Z.; Yin, Z.; Hu, R.; Qin, C.; Li, X. Coupling coordination measurement and obstacle diagnosis of new urbanization and rural revitalization in the basin area of Sichuan Province, China. Sustainability 2024, 16, 9209. [Google Scholar] [CrossRef]
- Ge, L.; Zheng, H.; Fu, Z.; Cai, C.; Wei, Y. Uncovering interactive impacts of climate extremes and land use change on soil erosion using a coupled RUSLE-OPGD framework. Catena 2025, 261, 109507. [Google Scholar] [CrossRef]
- Liu, Y.H.; Wang, H.T.; Zhen, Z.L.; Zhang, Q. Changes of soil erosion based on RUSLE model and driving factors in Shanxi section of Yellow River Basin. Soils 2025, 57, 452–460. [Google Scholar] [CrossRef]
- Cheng, L.; Li, L.L.; Mao, Z.H. Spatio-temporal variation of soil erosion and its influencing factors based on RUSLE model: A case study of Guangdong-Hong Kong-Macao Greater Bay Area. Sci. Soil Water Conserv. 2025, 23, 62–72. [Google Scholar] [CrossRef]
- Hu, L.R.; He, S.J.; Su, S.L. Accessibility of Healthcare Resources to Public Housing in Shenzhen, China: Indirect Map Service and Optimized Two-Step Floating Catchment Area Method. Trop. Geogr. 2024, 44, 226–235. [Google Scholar] [CrossRef]
- Dai, Y.; Wang, L.F.; Xu, Z.; Liu, H. How far and discernible are public toilets? A city-scale study using spatial analytics and deep learning in Nanjing, China. J. Urban Manag. 2025, 14, 735–752. [Google Scholar] [CrossRef]
- Hu, S.Y.; Lu, Y.Q.; Hu, G.J.; Sun, J.W. Measuring Accessibility and Equity of Medical Resources in Shenzhen Based on Multi-source Big Data. Econ. Geogr. 2021, 41, 87–96. [Google Scholar] [CrossRef]
- Wu, W.J.; Sun, R.N. Theories and methods for accessibility evaluation of urban public service facilities. City Plan. Rev. 2024, 48, 65–70. [Google Scholar]
- Liu, X.R.; Li, R.; Cai, J.; Li, B.S.; Li, Y.H. Quantifying urban function accessibility and its effect on population mobility based on function-associated population mobility network. Int. J. Appl. Earth Obs. Geoinf. 2024, 135, 104273. [Google Scholar] [CrossRef]
- Fu, X.H.; Wang, J.C.; Yin, H.L.; Zhao, X.H.; Ding, X.; Huang, J.; Fang, Y.C. Coupling mechanism of wetland ecotourism and resource-environment carrying capacity: A case study of Dongting Lake area. Resour. Environ. Yangtze Basin 2025, 34, 2249–2263. [Google Scholar]
- Wang, Z.F.; Zhao, S.S. Research on the spatial consistency between tourism resource and environmental carrying capacity and land spatial functions in the urban agglomeration of the middle reaches of the Yangtze River. Resour. Environ. Yangtze Basin 2021, 30, 1027–1039. [Google Scholar]
- Yin, S.; Guo, J.; Han, Z. County-level environmental carrying capacity and spatial suitability of coastal resources: A case study of Zhuanghe, China. Front. Mar. Sci. 2022, 9, 1022382. [Google Scholar] [CrossRef]
- Xu, M.; Xiong, K.; Chen, Y.; Feng, M. Evaluation of ecosystem carrying capacity and diagnosis of obstacle factors in the World Heritage Karst sites. npj Herit. Sci. 2025, 13, 25. [Google Scholar] [CrossRef]
- Wu, X.Y.; You, Z.; Yang, Z.H.Z.; Wang, D.D.; Du, M.J.; Hu, H.; Yang, Y.G. Spatio-temporal evolution and multi-scenario simulation of ecosystem service value in the middle and lower reaches of Yangtze River mining and metallurgy basin. Environ. Sci. Technol. 2025, 48, 179–193. [Google Scholar] [CrossRef]
- Huang, T.N.; Li, J.F.; Xu, J.L.; Liao, X.L. The rational assessment of developing transformation and obstacle diagnosis for resources exhausted cities: A case study of Daye, Hubei. J. Nat. Resour. 2019, 34, 1417–1428. [Google Scholar] [CrossRef]




| Carrying Capacity Type | Functional Suitability Classification | Value Range |
|---|---|---|
| Ecological Environment (EECC) | Important ecological function zone | EECC ≤ 0.52 |
| Moderately important ecological function zone | 0.52 < EECC ≤ 0.70 | |
| Non-important ecological function zone | 0.70 < EECC | |
| Agricultural Production (ACC) | Highly suitable area for agricultural production | ACC ≤ 0.47 |
| Moderately suitable area for agricultural production | 47 < ACC ≤ 0.71 | |
| Unsuitable area for agricultural production | 0.71 < ACC | |
| Socio-Economic (SCC) | Highly suitable area for socio-economic development | SCC ≤ 0.41 |
| Moderately suitable area for socio-economic development | 0.41 < SCC ≤ 0.62 | |
| Unsuitable area for socio-economic development | 0.62 < SCC |
| Rank | Obstacle Factor | Subsystem | Obstacle Degree (%) |
|---|---|---|---|
| 1 | Spatial stress of industrial/mining land | Socio-economic | 36.47 |
| 2 | Geological hazard risk | Ecological environment | 15.45 |
| 3 | Soil erosion sensitivity | Ecological environment | 13.01 |
| 4 | Population density | Socio-economic | 12.97 |
| 5 | Location advantage index | Socio-economic | 12.32 |
| 6 | Soil organic matter content | Agricultural production | 6.72 |
| 7 | Arable land slope | Agricultural production | 3.06 |
| Factor | Moran’s I | Expected I | Variance | Z-Score | p-Value |
|---|---|---|---|---|---|
| Spatial stress of industrial/mining land | 0.713 | −0.0007 | 0.000173 | 54.20 | <0.001 |
| Geological hazard risk | 0.758 | −0.0007 | 0.000174 | 57.59 | <0.001 |
| Soil erosion sensitivity | 0.319 | −0.0007 | 0.000174 | 24.25 | <0.001 |
| Interacting Factor Pair | q-Statistic (X1) | q-Statistic (X2) | Interaction q-Statistic | Interaction Type |
|---|---|---|---|---|
| Spatial stress of industrial/mining land ∩ Geological hazard risk | 0.1205 | 0.2338 | 0.2823 | Bivariate enhancement |
| Spatial stress of industrial/mining land ∩ Soil erosion sensitivity | 0.1205 | 0.1097 | 0.2438 | Nonlinear enhancement |
| Geological hazard risk ∩ Soil erosion sensitivity | 0.2338 | 0.1097 | 0.2711 | Bivariate enhancement |
| Primary Category | Secondary Category | Area (km2) | Proportion (%) |
|---|---|---|---|
| Living space | Urban living space | 120.0613 | 7.71 |
| Rural living space | 97.5036 | 6.26 | |
| Subtotal | 217.5649 | 13.97 | |
| Production space | Agricultural production space | 533.5440 | 34.27 |
| Mining production space | 28.0447 | 1.80 | |
| Subtotal | 561.5887 | 36.07 | |
| Ecological space | Forest and grassland ecological space | 559.3651 | 35.92 |
| Aquatic ecological space | 215.9106 | 13.87 | |
| Other ecological space | 2.5499 | 0.16 | |
| Subtotal | 777.8257 | 49.96 |
| Spatial Type | Proportion Before Optimization (%) | Proportion After Optimization (%) | Area Change Trend |
|---|---|---|---|
| Ecological space | 49.96 | 45.21 | Slight decrease (−4.75%) |
| Agricultural (production) space | 34.27 | 33.51 | Slight decrease (−0.76%) |
| Mining space | 1.80 | 1.22 | Slight decrease (−0.58%) |
| Living space | 13.97 | 21.27 | Coordinated expansion (+7.30%) |
Disclaimer/Publisher’s Note: The statements, opinions and data contained in all publications are solely those of the individual author(s) and contributor(s) and not of MDPI and/or the editor(s). MDPI and/or the editor(s) disclaim responsibility for any injury to people or property resulting from any ideas, methods, instructions or products referred to in the content. |
© 2026 by the authors. Licensee MDPI, Basel, Switzerland. This article is an open access article distributed under the terms and conditions of the Creative Commons Attribution (CC BY) license.
Share and Cite
Zhou, Z.; Yang, C.; Zhang, W.; Yang, C.; Shi, L.; Feng, Q.; Liu, T. Optimizing Production–Living–Ecological Space Under Resource and Environmental Carrying Capacity Constraints: Evidence from Daye City, China. Sustainability 2026, 18, 6458. https://doi.org/10.3390/su18136458
Zhou Z, Yang C, Zhang W, Yang C, Shi L, Feng Q, Liu T. Optimizing Production–Living–Ecological Space Under Resource and Environmental Carrying Capacity Constraints: Evidence from Daye City, China. Sustainability. 2026; 18(13):6458. https://doi.org/10.3390/su18136458
Chicago/Turabian StyleZhou, Zikai, Chuanqiang Yang, Wenzhuo Zhang, Chenglin Yang, Lang Shi, Qi Feng, and Tao Liu. 2026. "Optimizing Production–Living–Ecological Space Under Resource and Environmental Carrying Capacity Constraints: Evidence from Daye City, China" Sustainability 18, no. 13: 6458. https://doi.org/10.3390/su18136458
APA StyleZhou, Z., Yang, C., Zhang, W., Yang, C., Shi, L., Feng, Q., & Liu, T. (2026). Optimizing Production–Living–Ecological Space Under Resource and Environmental Carrying Capacity Constraints: Evidence from Daye City, China. Sustainability, 18(13), 6458. https://doi.org/10.3390/su18136458