Systematic Review

The Risk–Value Trade-Off: Impact of Risk Perception, Perceived Value on Consumers’ Purchase Intention: A Meta-Analysis

School of Public Administration and Policy, Renmin University of China, 59 Zhongguancun Street, Haidian District, Beijing 100872, China
*
Authors to whom correspondence should be addressed.
Sustainability 2026, 18(13), 6447; https://doi.org/10.3390/su18136447
Submission received: 14 May 2026 / Revised: 11 June 2026 / Accepted: 22 June 2026 / Published: 24 June 2026
(This article belongs to the Section Psychology of Sustainability and Sustainable Development)

Abstract

Risk perception and value assessment are key drivers of purchase intention. However, the literature lacks a consensus on how and when risk perception and perceived value impact consumers’ purchase intention, and their relationship remains unclear. To solve this gap, mechanisms of consumer purchase intentions must be elucidated. We conducted a systematic meta-analysis to examine the relationships and factors moderating it, and used meta-analytic structural equation modeling (MASEM) to reveal the mechanism and boundaries. Forty-four studies (N = 21,370) were included to examine how risk perception and perceived value impact consumer purchase intention, showing that consumer purchase intention is affected positively by perceived value and negatively by risk perception. Risk perception and perceived value exhibit mutual interaction effects. Perceived value has a stronger relationship with consumer purchase intention than risk perception. In the moderator’s analysis, the effects of perceived value on consumers’ risk perception and of perceived risk on perceived value and purchase intention are stronger when consumers come from developing (vs. developed) countries. Impacts of perceived value on consumer purchase intention and risk perception and of risk perception on perceived value and purchase intention are stronger when consumers are non-students (vs. students). When analyzing the three models’ mechanisms of action, Model 1 better explained consumer intention’s boundaries and impact mechanisms. To our knowledge, this is the first meta-analytic study summarizing how risk perception and perceived value impact consumers’ purchase intention, revealing the mechanism and boundaries of consumer behavior and illuminating a forward-looking new perspective outlining research directions.

1. Introduction

Risk perception and perceived value are two essential factors affecting how consumers evaluate gain, loss, make decisions, and behave; these constructs encapsulate their psychological change process in weighing risk–value trade-off [1,2,3,4,5,6,7,8]. Perceived value represents the “gain” realized by consumers after they subjectively evaluate the value of a product or service. Conversely, risk perception signifies the “loss”, which is defined as the possibility of consumers’ subjective feelings of various losses when purchasing goods [9,10,11,12,13]. One gain or loss determines consumers’ purchasing decisions, thus driving their purchase intentions and final actual purchasing behavior [2,6,14,15]. The relationship between perceived value, risk perception, and consumer purchase intention has also attracted wide attention and become a major focus of interest in the psychology and management areas [15,16,17,18].
Recent empirical research has focused on how perceived value and risk perception affect consumer intention, and identified a risk–value trade-off influencing consumer decision-making; however, the literature lacks a systematic integrated analysis and has not reached consensus on the correlation among these three factors. The initial empirical results have supported consumers’ perceived value’s positive promotion effect on purchase intention [19,20,21,22]. However, some studies have found that perceived value does not directly impact purchase intention, suggesting it might indirectly affect purchase intention through other variables; consequently, the magnitude of this impact remains unclear [14,23,24]. One study found that consumers’ perceived value negatively impacts their purchase intention [25], while others found that their risk perception negatively impacts purchase intention [1,21,22,26]. Previous research has also found that perceived value does not significantly impact risk perception [21,22,27,28], whereas other investigations indicate that consumers’ perceived value interacts with their risk perception [8,14,19,29]. Considering these inconsistent conclusions, meta-analysis can compensate for this by establishing a cumulative knowledge system, providing novel, more accurate, and powerful evidence and guidance for action, reducing research bias and statistical artifacts, and revealing boundaries and influencing mechanisms. Thus, we aim to answer these questions:
(1)
What are the interrelationships among risk perception, perceived value, and consumer purchase intention?
(2)
Are these relationships consistent across purchase channels, geographical regions, research populations, and other factors?
(3)
What are the underlying mechanisms among risk–value trade-off and purchase intention, and what are their boundary conditions?
(4)
What are the theoretical, practical, and policy contributions?
We first briefly discuss the current situation and shortcomings of research on perceived risk, perceived value, and consumer purchase intention. We then outline the meta-analytic method that provides the foundation for our review and define perceived value, risk perception, and consumer purchase intention. We conduct a meta-analysis to synthesize the relationship among value perception, risk perception, and consumer purchase behavior and use meta-analytic structural equation modeling (MASEM) to elucidate the underlying mechanism and boundaries [1,4,16,30,31]. To the best of our knowledge, this study is the first to quantitatively assess the impacts of perceived value and risk perception on consumers’ purchase intention by using meta-analysis, and we develop an extensive roadmap for future consumer behavior research. Additionally, the results can help consolidate cumulative knowledge, provide more precise and robust guidelines for action, and illuminate forward-looking new perspectives outlining future research directions.

2. Literature Review

2.1. Perceived Value

Diverse conceptualizations of perceived value exist across disciplines, with Zeithaml’s 1988 framework representing a seminal contribution to the consumer behavior literature [1,2,13,24]. This construct represents consumers’ subjective evaluation of a product or service’s utility after they comprehensively evaluate its perceived benefits and costs. Consequently, it is one of the most important drivers in predicting purchase intention and behavior [7,32]. Under this definition, perceived value is derived from two factors: consumer-perceived benefits and costs [2,33]. Consumer decision-making is fundamentally a “risk–value” trade-off process. The assessment of perceived value encompasses not only immediate benefits and costs but also considerations of future uncertainty—that is, perceived risk influences the “long-term commitment” dimension in value judgments [2,13]. Meanwhile, when analyzing consumer psychological decision-making or evaluation processes, scholars often operationalize perceived value across varying dimensionalities, primarily utilitarian, hedonic, and social dimensions [7,33,34]. Its measurement has evolved from a unidimensional global assessment [13] to multidimensional structured scales. The most widely adopted framework aggregates three core dimensions: utilitarian (functional/economic), hedonic (emotional/experiential), and social value [32,35].
Among the included studies, 72.7% (32) used multidimensional measurement, while 27.3% (12) adopted global unidimensional items. Of the multidimensional studies, 87.5% included utilitarian value, 78.1% hedonic value, and 53.1% social value, aligning with our higher-order construct definition. 95.5% (42) of studies used 5-point or 7-point Likert scales, with item counts ranging from three (global) to 18 (comprehensive multidimensional). This consistent core dimensionality supports aggregating perceived value as a unified construct in our meta-analysis.
To ensure measurement rigor and uniform operationalization in this meta-analysis, we conceptualize perceived value as a comprehensive, higher-order aggregate construct. Thus, the uniform operational definition adopted in this study defines perceived value as the consumer’s overall net cognitive and emotional assessment of a product or service’s utility, aggregating utilitarian (functional/economic), hedonic (emotional/experiential), and social value dimensions. This overarching definition allows us to systematically synthesize primary studies that measured either global perceived value or its specific sub-dimensions. At the same time, it varies from person to person and is influenced by personal needs, preferences, and evaluation backgrounds. Moreover, the process of customers perceiving the value of services or products is not static, but changes with situational shifts (such as the passage of time, purchasing methods, changes in the purchasing environment, etc.) and their own experiences, and after the final evaluation, the risk–value balance result is obtained, which prompts consumers to formulate purchase intentions and promotes actual purchasing behavior [2,13,24].

2.2. Risk Perception

Driven by extensive scholarly inquiry, risk perception encompasses diverse definitions, connotations, and dimensions in different disciplines [2,36,37]. Among these definitions, the risk perception framework established by Bauer (1960) has been widely accepted, providing a theoretical basis for understanding and risk assessment [4,10,11]. Risk perception is defined as the possibility of consumers’ subjective feelings of various losses in purchasing goods [2,4,9,24]. Consumer risk awareness is enhanced significantly for highly priced or deeply involved products and services [8,38,39]. When consumers recognize the upward trend of potential risks, their risk aversion significantly increases, and their questioning attitude in purchasing decision-making intensifies [2,6,24]. Because the manifestation of risk varies by context, the primary literature frequently measures risk through distinct facets, including psychological, social, performance-related, physical, temporal, and monetary concerns [1,4,34]. Following Bauer (1960), risk perception is predominantly measured as subjective assessments of potential losses. The classical six-dimensional framework [9] includes financial, performance, physical, psychological, social, and temporal risks, with privacy risk often incorporated in online contexts [34].
Among the 44 included articles, 65.9% (29) of studies used multidimensional risk measurement, and 34.1% (15) used global items. Financial (93.1%) and performance (89.7%) risks were the most consistently included dimensions across the multidimensional studies. 97.7% (43) of studies employed 5-point or 7-point Likert scales, with item counts ranging from 2 to 24. The consistent focus on core loss facets justifies treating risk perception as a higher-order aggregate construct.

2.3. Consumers’ Purchase Intention

Existing research has explored the drivers and formation mechanisms of consumer decision-making intention from diverse perspectives [6,13,40,41]. This construct reflects the psychological state of customers’ “whether they want to buy” and “how likely they are to buy” [2,41,42]. In the theory of planned behavior, it is the purchasing tendency formed by consumers after evaluating a product, consisting of cognitive, emotional, and affective components, and is a direct predictor of actual purchasing behavior. The Theory of Reasoned Action (TRA) and Theory of Planned Behavior (TPB) posit that the actual behavior of an individual is determined by their behavioral intention. Consumers will develop a willingness to purchase through the combined effects of marketing mix, marketing environment, consumer characteristics, and consumer psychological evaluation, namely the process of risk–value balancing, which in turn promotes the adoption of purchasing behavior. Therefore, in a general sense, individuals first generate certain cognition, then generate behavioral intentions, and finally implement behaviors [1,2,4]. Purchase intention demonstrates the highest measurement consistency across studies, rooted in the Theory of Reasoned Action and Theory of Planned Behavior. The standard approach uses 3–5 Likert items assessing consumers’ subjective willingness and likelihood to purchase.
All 44 studies used self-reported Likert scales: 79.5% (n = 35) used 7-point scales and 20.5% (9) used 5-point scales. 90.9% (n = 40) adopted the classic 3–5 item TRA/TPB-based measurement, with only 9.1% adding supplementary items on recommendation or repurchase intention. This high homogeneity ensures the comparability of purchase intention effect sizes across the sampled studies.

2.4. Relationships Among Risk Perception, Perceived Value, and Consumer Purchase Intention

Previous studies have identified the risk–value as a key factor trade-off influencing consumer decision-making. Within consumer behavior theory, such as the above theory, there has always been an ongoing debate on whether customers make decisions based on “gain” (value) or “loss” (risk). From the perspective of “gain”, the most critical factor is maximizing perceived value of the product or services, which means that consumers tend to choose products or services with the highest subjective value evaluation. Some empirical analyses have also confirmed this view, showing a significant positive correlation between perceived value and consumer intention [1,2,4]. Therefore, an increase in consumers’ perception of the value of products or services often triggers purchasing decisions, which are reflected in their willingness to consume and actual purchasing behavior. From the perspective of “loss”, as they accumulate their own experience and knowledge, they often worry about the risk of destruction or loss. These concerns are known as risk perception, which is inversely related to purchase intention or behavior. This occurs because once customers are concerned about sustained or potential losses, they are more inclined to choose products or services with lower or lowest risk profiles, thereby inhibiting the formation of purchase intention and converting it into purchase behavior. However, the literature on how and when perceived value and risk perception are linked during the intention formation process is limited. Customers’ purchasing decisions often involve multiple evaluation rounds. They not only weigh the product’s expected benefits, but also comprehensively consider potential risks and their possible negative impacts. Thus, customers’ ultimate judgment of product value stems from the dynamic balance between the comprehensive benefits they can obtain and the total risks they need to bear [1,4,14,19,20,26,29].
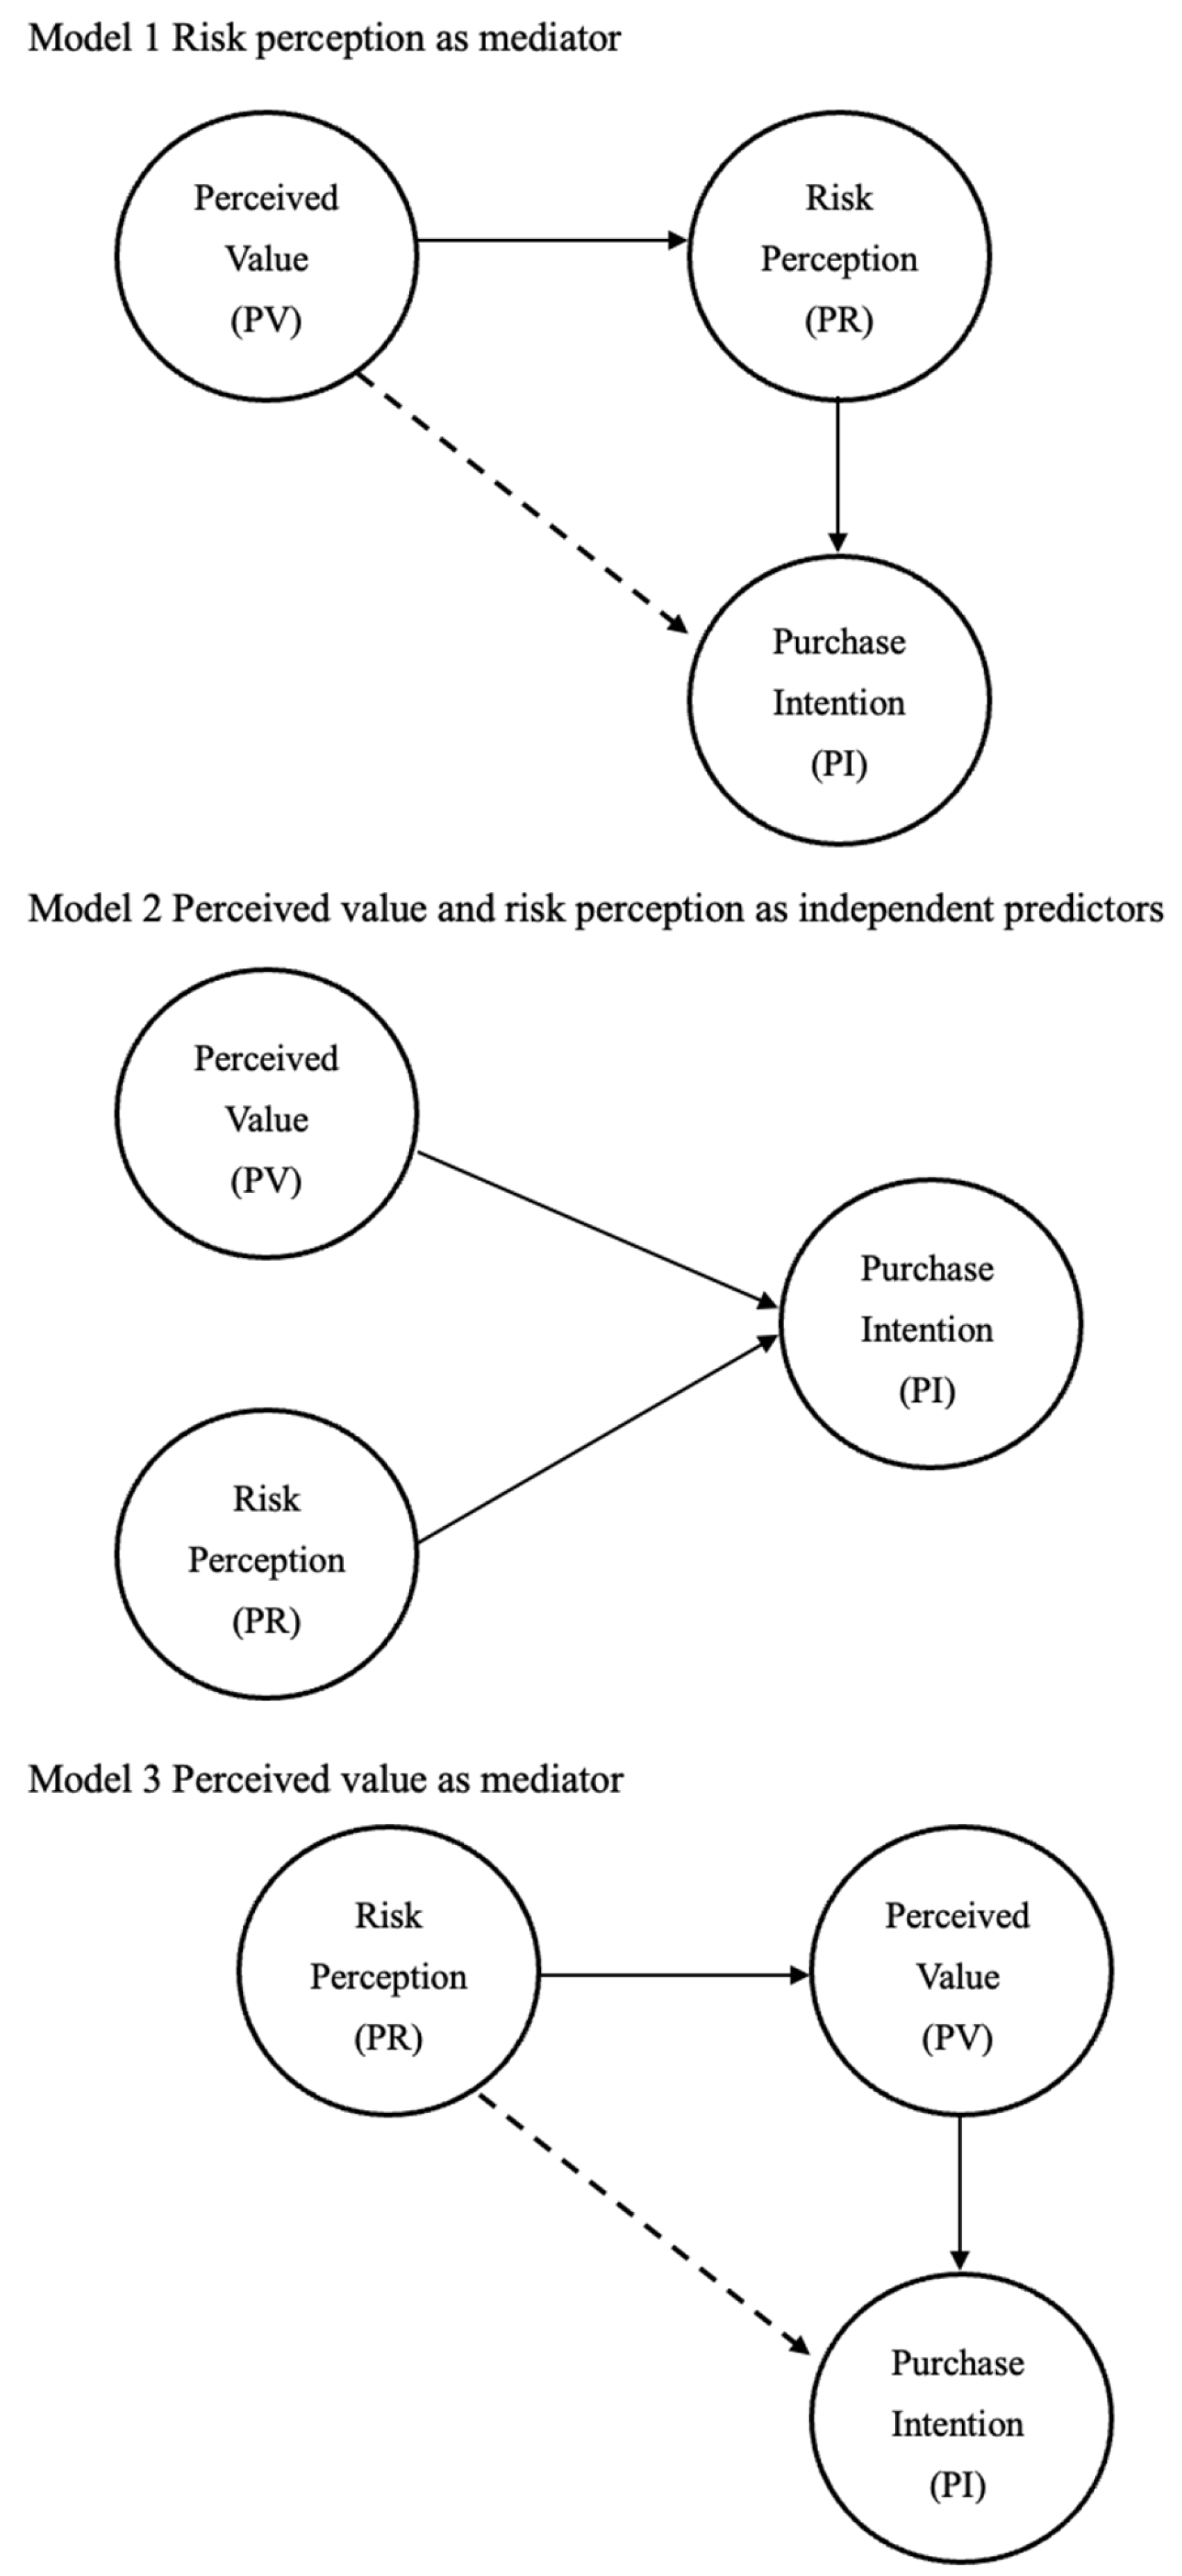
Therefore, this study systematically analyzes the correlations and mechanisms among risk perception, perceived value, and consumer purchase intention, and identifies the underlying factors, boundaries, and influencing mechanisms that shape these relationships. The conceptual framework is illustrated in Figure 1.

2.5. Potential Moderators

This meta-analysis’s premise is similarity. Weighted merging can be used to solve multiple statistics homogeneity [2,4,30,31]. Heterogeneity is an important factor affecting the relationship between variables, and potential factors are one of the results of heterogeneity. After using Meta 3.0 software to comprehensively evaluate all empirical data included, we observed that the Q statistic was as high as 802.147, which significantly exceeded the chi square (χ2) threshold (df = 44). This statistical test indicates that there is significant heterogeneity in the effect size among different study samples. In further heterogeneity analysis, 96.135% of the variance in the overall effect size can be attributed to true moderate effects (i.e., I2 = 96.135%), while only 3.865% of the change can be attributed to sampling error, indicating the presence of significant moderating variables in the sample data that can explain the reasons for changes in the relationships between variables. Specifically, variables such as publication time, sample source region, consumer education background, and product acquisition channels may all have an impact on the variability of research conclusions [4,41].
Geographical region. It refers to the investigation’s location when they purchase a product or service. Different regions often represent different cultures [1,4,41]. Previous studies showed that sample size differences and effect size variability among studies may serve as key moderating variables affecting the final effect value [4,14,15].
Research population. Previous studies reported that whether consumers are students is a factor in consumer purchase behavior. College students are the main force of consumption [43,44,45,46], and being a student is important in purchase intention when they evaluate goods’ perceived value and risk. Thus, students’ identity can influence the effect sizes of perceived value, risk, and consumers’ purchase intention [1,4]. To ensure objective grouping, we strictly followed the sample description in the original studies: studies that explicitly recruited full-time college/university students as the sole participant group were coded as the “student group”, while studies that recruited general consumers, working adults, or other non-student populations (including mixed samples with less than 50% student participants) were coded as the “non-student group”. This review divided the research population into students and non-students.
Purchase channel. Previous studies indicated the specific channel or path through which products or services are transferred from sellers to consumers [4,41]. Consumer perceptions of transaction value cover multiple dimensions, which are accompanied by differences in perceived risk levels. From the purchase channel perspective, there are two main ways to achieve this: the digital transaction mode based on the Internet and mobile terminals (online channel) and the traditional transaction mode relying on physical sites and cash payments [4,47,48]. To ensure clear group boundaries, we explicitly defined the two channels as follows: (1) Online channels refer to transactions completed entirely through digital platforms, including e-commerce websites, mobile applications, social commerce platforms, and other internet-based channels; (2) Offline channels refer to transactions completed entirely through physical retail locations, including brick-and-mortar stores, supermarkets, shopping malls, and other face-to-face transaction channels. Studies investigating mixed omnichannel purchasing behaviors (i.e., consumers using both online and offline channels in the same purchase process) were excluded from this subgroup analysis.
Previous studies have revealed how variables such as age, income, education level, and gender mediate the relationship between perceived value, risk perception, and consumer purchase intention regarding other potential factors influencing consumer behavior [4,31,49,50]. Due to the limited sample sizes and lack of specific correlation coefficient values in existing research, the analysis of these aspects is restricted.

3. Method

3.1. Inclusion and Exclusion Criteria

This study is based on the current system evaluation method standards and strictly follows international guidelines [4,30,31]. The inclusion criteria were as follows: (1) quantitative methods were used to measure risk perception, perceived value, and purchase intention, and sample size and the following statistical indicators were provided, such as correlation coefficient (r), determination coefficient (r2), effect size (d), and standard error; (2) English academic achievements that have undergone peer review; for example, journals, conferences, graduation theses, etc. (3) will target consumer groups with purchasing intentions as the outcome objects. The exclusion criteria were (1) statistical analyses with unreported sample size, (2) significant difference between the definition of variable operability and the study’s framework, and (3) multiple similar studies. Priority should be given to research reports with the most systematic variable measurements and the most complete data. The core focal constructs were higher-order global constructs of value perception, risk perception, and consumer purchase intention.

3.2. Search Strategy

We searched the Web of Science, Emerald Insight, EBSCOhost, Wiley Online Library, ProQuest, Scopus, Cochrane Library, and Google Scholar electronic databases. The time was limited before 15 September 2025.
This study used a pre-constructed evaluation framework and standardized process for literature screening. We have identified the following search string through a preliminary search: ((perceived value OR value perception) AND (risk perception OR perceived risk OR perception of risk OR risk cognition) AND (consumer purchase intention OR customer buying intention OR consumer’s buying willingness)). We also searched for references and Google Scholar (reviewing the top 1000 results) to obtain as many potential target literature as possible [4,31].

3.3. Data Extraction

To verify coding accuracy, we set up a coding group composed of three researchers with substantive knowledge and methodological experience in business and management. The coding work was carried out back-to-back by two researchers in the team for each included study. Firstly, coding standards were developed through group discussions. Then, two researchers independently began the first round of experimental coding to cover as many research features as possible that were considered potentially relevant for subsequent analysis. Two reviewers independently completed the data extraction using standardized extraction templates to record the following core elements: researcher information, publication year, research purpose, sample characteristics, target population, academic journals, data sources, and key conclusions. Any discrepancies arising during data extraction were resolved through negotiation mechanisms or third-party evaluation. All excluded literature was explained, and the basis for exclusion was recorded; finally, 44 studies were included [1,6,8,14,15,20,22,26,27,28,29,51,52,53,54,55,56,57,58,59,60,61,62,63,64,65,66,67,68,69,70,71,72,73,74,75,76,77,78,79,80,81,82,83]. Table 1 summarizes the research data included in the analysis.

3.4. Potential Moderators’ Coding

To ensure the scientificity of the data-encoding process, a special team of three senior researchers was responsible for this study. The main coding personnel carried out phased standardization: First, they determined the basic feature framework through open discussions, without limiting the coding scope, and comprehensively collected potential analysis elements. Subsequently, all features were structured and labeled based on the revised coding system. Finally, cross-validation ensured the consistency of data labeling and generated the final coding list (Table 1). In response to coding differences, group members reached consensus through professional argumentation and formed standardized coding standards.

3.5. Effect Size Computation

The literature generally used the correlation coefficient (r) as a standard indicator to measure the correlation among perceived value, risk perception, and consumer behavior intention [4,84]. Empirical research in this field rarely reports alternative statistical measures such as the coefficient of determination (R2), standardized mean difference (d), or standard error. To address this issue, statistical conversion formulas were used to standardize the above indicators into Pearson’s correlation coefficients (r) [4,84]:
r = d 4 + d
where d = m 1 m 2 s , m 1 is the mean of Group 1, m 2 is the mean of Group 2, and s is the sum of the two groups’ standard deviations.
r = ( 1 R 2 ) 2 n 1
where R 2 is the coefficient of determination, and n indicates the studies’ sample sizes.
Z i = 0.5 l n ( 1 + r i r i ) ,   S E i = 1 W i ,   Z = ( W i Z i ) W i ,   r = e 2 z 1 e 2 z + 1
where W i  = n − 3, and Z is the Z-score when calculating Fisher’s Z.

3.6. Risk-of-Bias Assessment

This study used an improved version of the risk-of-bias scale (RoB 2.0) to score study quality, it is derived from the classic observational study quality assessment tool. Two reviewers independently completed the evaluation process to extract data. The scale includes six evaluation dimensions, and the judgment criteria for each are set with three options: “yes,” “no,” and “unclear.” The research design quality was measured objectively using systematic standards [4,16,31], and it was shown in the Supplementary Materials.

3.7. Analytic Procedures

This study’s empirical analysis used MASEM’s two-stage validation framework [85,86]. In stage 1, a correlation matrix was constructed using meta-analysis to quantify the strength of correlations among these variables. For the literature using multiple measures for the same structure, we calculated their effect values’ arithmetic mean to obtain a single estimator [87], which is treated as an independent observation for correlation coefficient reports containing independent samples. For model selection, we used the random-effects model proposed by Der Simonian and Laird for heterogeneity analysis, which reflects the real research context better than the fixed-effects model [88]. Heterogeneity assessment was based on the I2-statistic combined with the χ2 test [87], which includes double testing for intra- and inter-group differences. After weighted calculations, the effect size and its confidence interval were visualized in a forest plot. To explore the impact mechanism, subgroup analysis was done. The sample was stratified by covariates (time span, regional distribution, target population, sales channels) to examine study variation sources. Fail-safe N [89] and funnel-plot [4,31] assessed publication bias. Fail-safe N > 5K + 10 [84] critical value means negative results’ impact on meta-analysis conclusion is acceptable. Statistical processing was completed using Comprehensive Meta-Analysis software (version 3.0; 2006, Meta-Analysis Corp, Englewood, NJ, USA).
This study used Hunter and Schmidt’s (2004) [87] computational method for meta-analysis integration of 44 independent studies and constructed a correlation coefficient matrix characterizing the degree of correlation between variables. This analysis applies a weighted adjustment to the effect values based on each original study’s sample size to reduce random errors caused by sample differences. Among the influencing factors, the interference of measurement error on the estimation of effect size and its cross-study variability were second only to the sampling error. In the subsequent modeling stage, the corrected correlation matrix was used as input data for the structural equation model as a theoretical validation step. Note that, considering the correction of measurement errors by meta-analysis, the results obtained are accurate estimates at the conceptual level. Therefore, it is more suitable to define this step as structural equation modeling rather than path analysis. This research design can effectively evaluate the goodness-of-fit between empirical results and theoretical predictions.
To examine how multiple theoretical concepts connect, multiple MASEM works well for checking mediating relationships. Bergh et al. (2016) explained the steps in detail [85]. It has two method strengths: (1) Meta-analysis overcomes small samples and makes conclusions more generalizable; (2) MASEM tests if theoretical models fit and checks multivariate structural relationships [4,30,85]. We use MASEM to perform maximum likelihood parameter estimation using a meta-analysis correlation matrix, and evaluate the goodness-of-fit of the three models using multiple statistical indicators, which helped us identify the best model.

4. Results

This study got key info via systematic database retrieval and literature screening, showing the core traits of research data and initial analysis results objectively.

4.1. Study Characteristics

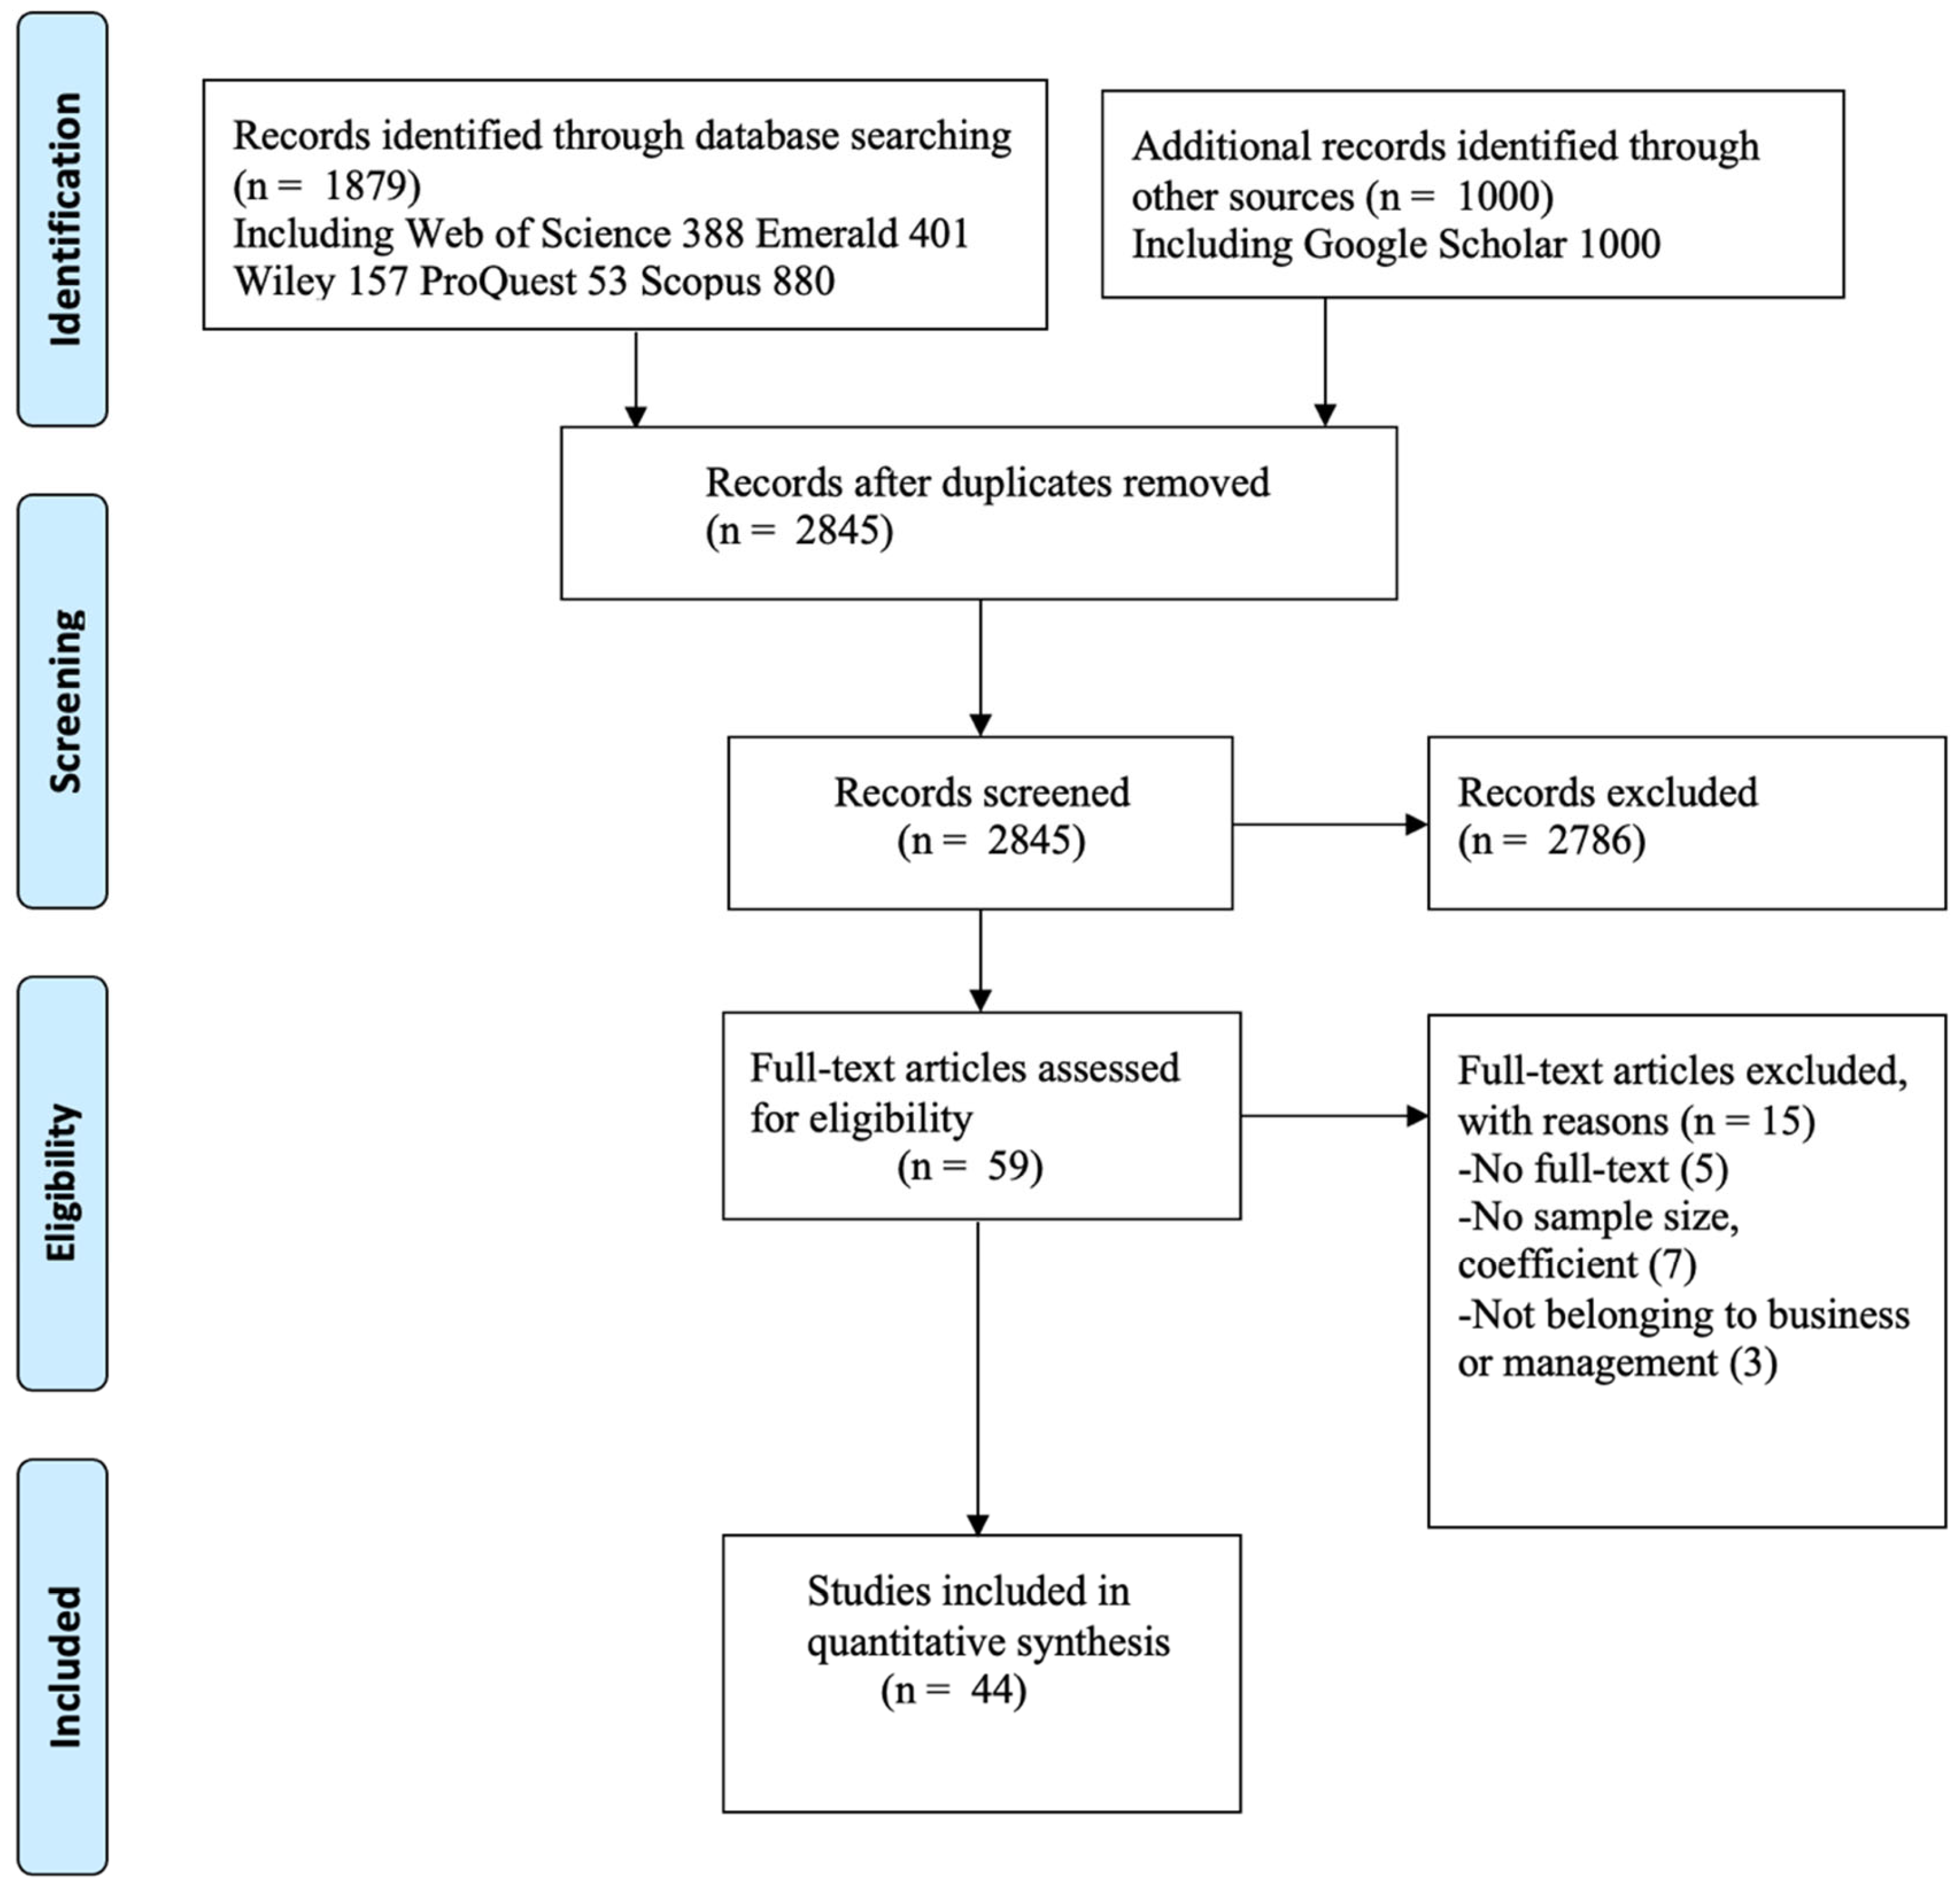
Figure 2 illustrates the literature screening process. We obtained 2879 articles through a systematic search, and 2845 articles were preliminarily screened based on predetermined criteria. After deduplication and the systematic evaluation of titles, abstracts, and keywords, 44 articles were selected for analysis. Table 1 summarizes the characteristics of these studies. Specifically, 38 articles were selected from professional databases through strict matching of the inclusion criteria, and six eligible studies were identified through supplementary searches in Google Scholar. Subsequently, the system extracted research data for comprehensive analysis. The included studies covered North America, Africa, Europe, and Asia, with the US, China, and the UK as the main research regions. Notably, the sample distribution was geographically imbalanced: 32 studies (72.7%) were conducted in Asia, five studies (11.4%) in North America, five studies (11.4%) in Europe, and only two studies (4.5%) in Africa. No studies from South America or Oceania were included in our analysis. This imbalance may limit the generalizability of our regional comparison results, particularly for underrepresented regions. The publication’s time span was 2008–2025.

4.2. Results of Risk-of-Bias

The results of the bias risk analysis for the included studies are detailed in the Supplementary Materials (Table S1). The evaluation adopts standard tools, covering core dimensions such as lost visit reports, blinding, randomization methods, withdrawal cases, and group concealment. Two reviewers independently completed the risk rating, and the final data showed that among the 44 studies, the literature with a bias risk level of “low” accounted for the highest proportion (83.7%, about 37 articles), while 11.4% (about five articles) were judged as “high” risk, and 4.9% (about two articles) had “unclear” ratings.

4.3. Publication Bias Assessment

The statistical analysis in the Supplementary Materials (Figure S1) identifies no significant publication bias in this meta-analysis. To verify this, we performed a fail-safe factor N test [4,31]. It can get the number of potentially unpublished negative studies required to overturn the current positive meta-analysis results. According to Card’s (2011) proposed standard, when the fail-safe factor N significantly exceeds the total included studies (specific critical value = 5K + 10, where K represents the total included aim studies), the existing research results have high stability and are unlikely to be influenced by potential unpublished data (Card, 2011). The fail-safe N test results show that the following number of missing studies would ensure that p-value is greater than the alpha (alpha = 0.05): 16,572 (perceived value–purchase intention [PV-PI]), 975 (risk perception–purchase intention [PR-PI]), 272 (risk perception–perceived value [PR-PV]), and 317 (perceived value–risk perception [PV-PR]); these numbers are far higher than 160 (5K + 10, where K = 44).
To further quantitatively assess the symmetry of the funnel plot and confirm the absence of severe publication bias, we conducted Egger’s regression test for all four pairwise relationships. The results showed that Egger’s intercepts were 0.872 (p = 0.385) for PV-PI, 1.234 (p = 0.221) for PV-PR, 0.945 (p = 0.347) for PR-PV, and 1.056 (p = 0.293) for PR-PI. All p-values were greater than 0.05, indicating that the funnel plots were statistically symmetric and there was no significant publication bias in our meta-analysis.
According to the existing data’s comprehensive analysis, although publication bias exists, its interference with the research results remains controllable. Table 2 and the Supplementary Materials (Figures S1 and S2) indicate that this deviation’s statistical impact is well below the acceptable threshold.

4.4. Results of Meta-Analysis

To further examine the influence mechanisms among risk–value trade-off and purchase intention, we performed a meta-analysis and MASEM. The main relationships examined were PV-PI, PV-PR, PR-PV, and PR-PI, covering the three main models in previous studies. According to the results (Table 2), we investigated the relationships among PV-PI, PV-PR, PR-PV, and PR-PI. In total, 39 studies (96.7%) explored the correlation between PV-PI (r = 0.487), and under the random-effects model, significant statistical heterogeneity was identified ( I 2 = 96.135%; p = 0.000; Q = 802.147); 21 studies (47.7%) on PV-PR (r = −0.232), with significant heterogeneity among the samples ( I 2 = 94.151%; p = 0.000; Q = 102.58), 26 (59.1%) on PR-PV (r = −0.159), with significant heterogeneity ( I 2 = 87.681%; p = 0.001; Q = 89.293), and 34 studies (77.3%) on PR-PI (r = −0.163), there was significant statistical heterogeneity among the studies ( I 2 = 93.302%; p = 0.001; Q = 283.681). Table 3 presents the overall MASEM results. In Model 1 for PV-PI, the results show that perceived value positively impacted consumer purchase intention (r = 0.425); for PV-PR, perceived value negatively impacted consumers’ risk perception (r = −0.232); for PR-PI, risk perception negatively impacted consumers’ perceived intention (r = −0.187). In Model 2 for PV-PI, perceived value positively impacted consumer purchase intention (r = 0.438); for PR-PI, risk perception negatively impacted consumers’ purchase intention (r = −0.159). In Model 3 for PV-PI, perceived value positively impacted consumers’ purchase intention (r = 0.574); for PR-PV, risk perception negatively impacted consumers’ perceived value (r = −0.159); for PR-PI, risk perception negatively impacted consumers’ purchase intention (r = −0.101).

4.5. Results of Moderator Analysis

Table 4 reports the detailed moderator results. Given the significant heterogeneity observed in the overall effect sizes (I2 > 87% for all relationships), we conducted subgroup analyses to explore the potential sources of heterogeneity and clarify the boundary conditions of the risk–value trade-off. The following sections interpret the moderator effects from theoretical and empirical perspectives.

4.5.1. Publication Year

The included literature was mainly published between 2008 and 2025. The analysis showed that the effect size exhibited fluctuating characteristics. The meta-regression test found a significant negative correlation between the year variable and effect size, with a standardized regression coefficient of −0.0188 for PV-PI ( p = 0.2292), −0.0581 for PV-PR ( p = 0.006), −0.0357 for PR-PV ( p = 0.011), −0.0243 for PR-PI ( p = 0.175), in which the PV-PI and PR-PI were non-significant, whereas the PV-PR and PR-PV were significant. The linear regression showed PV-PI and PR-PI had no identifiable trend (only a small decline over the years) from 2008 to 2025, and PV-PR and PR-PV showed slight declining trends.
The weakening negative relationship between perceived value and risk perception over time can be explained by the development of e-commerce infrastructure and consumer digital literacy. In the early stage of e-commerce development (2008–2015), consumers generally had low trust in online transactions, and higher perceived value was often associated with greater perceived risk (e.g., “too good to be true” psychology). However, with the improvement in payment security systems, logistics services, and after-sales guarantee mechanisms in recent years, the negative correlation between value and risk has gradually weakened. Consumers are now more likely to associate high perceived value with genuine product quality and service advantages rather than potential traps.
A comprehensive analysis showed that the effect sizes did not show significant correlation in different time dimensions, consistent with the distribution characteristics of publication times in the literature. Table 2 and Table 4 present the quantitative results.

4.5.2. Geographical Region

The geographical region covered the United States, the United Kingdom, South Africa, Turkey, Egypt, Canada, India, Malaysia, Iran, Finland, France, Spain, China, Bangladesh, Korea, and Pakistan. The effect sizes differed according to different countries. In PV-PI, we found that the effect sizes for the association between perceived value and consumer’s purchase intention decreased in developed countries but increased in developing countries (0.449 vs. 0.53), in detail, two studies were performed in Africa (4.5%), with an overall correlation of 0.719 ( p = 0.000), 32 studies were performed in Asia (72.7%), with an overall correlation of 0.505 ( p = 0.000), five studies were performed in Europe (11.4%), with an overall correlation of 0.472 ( p = 0.046), and five studies were performed in North America (11.4%), with an overall correlation of 0.411 ( p = 0.000); and this findings can also be found in PR-PV (−0.068 vs. −0.203), in detail, the relationship varied. In Africa, the correlation was −0.199, in Asia, the correlation was −0.04, in Europe, the correlation was 0.019 ( p = 0.605), in North America, the correlation was −0.51; while the opposite results were obtained in PV-PR (−0.49 vs. −0.187) and PR-PI (−0.257 vs. −0.132) relationships. These regional differences can be primarily attributed to cultural dimensions and economic development levels as proposed by Hofstede’s cultural dimensions theory. Developing countries generally have higher power distance and collectivism scores, where consumers tend to rely more on subjective value judgments (e.g., brand reputation, social approval) rather than objective risk assessments when making purchase decisions. In contrast, consumers in developed countries with higher individualism and uncertainty avoidance scores are more risk-averse and conduct more comprehensive risk evaluations before purchasing, which weakens the direct impact of perceived value on purchase intention. Additionally, the lower market maturity and less standardized regulatory environment in developing countries may lead to greater variability in product quality, making consumers more sensitive to perceived value as a signal of product quality. However, it should be emphasized that these regional findings should be interpreted with caution due to the severe sample imbalance: the results for Africa, Europe, and North America are based on only two, five, and five studies, respectively, while the Asian results are based on 32 studies. Future research with more balanced regional samples is needed to validate these findings.

4.5.3. Purchase Channel

Through systematic analysis of consumer shopping channels, data shows that digital trading platforms have significantly higher effects on PV-PI, PV-PR, and PR-PV indicators than physical retail terminals (0.518 vs. 0.495; −0.223 vs. −0.212; −0.298 vs. −0.179), in PV-PI. When consumers shop online, the effect size was 0.518 ( p = 0.000); in contrast, when consumers shop offline, the effect sizes decreased to 0.495 ( p = 0.000); in PV-PR, the online channels’ effect sizes were −0.223, and the offline were −0.212; in PR-PV, the online channels’ effect sizes were −0.298, and the offline were −0.179; while it was opposite in PR-PI, the online were −0.158, and the offline were −0.204. The stronger impact of perceived value on purchase intention in online channels can be explained by the information asymmetry inherent in digital transactions. In offline shopping, consumers can directly inspect products, experience services, and reduce uncertainty through physical contact, thus reducing their reliance on perceived value as the primary decision-making criterion. In online shopping, however, consumers cannot touch or try products before purchase, so they rely more heavily on perceived value (aggregated from product descriptions, reviews, and ratings) to evaluate product utility. The stronger negative relationship between risk perception and perceived value in online channels further confirms this point: higher perceived risk in online transactions significantly reduces consumers’ evaluation of product value, as they associate potential risks (e.g., product mismatch, delivery delays, fraud) with lower net utility. The opposite result for PR-PI may be due to the fact that online platforms have established more comprehensive risk mitigation mechanisms (e.g., return policies, buyer protection programs) that buffer the negative impact of risk perception on purchase intention compared to some offline retail channels with less standardized after-sales services. It should be noted that our strict boundary definition between online and offline channels excluded studies on mixed omnichannel purchasing behaviors, which are increasingly prevalent in modern retail. Therefore, our results may not fully generalize to omnichannel contexts where consumers seamlessly switch between online and offline touchpoints during the purchase process.

4.5.4. Research Population

University undergraduates represent a pivotal demographic within commercial sectors [16,31,44]. The purchasing decision-making process of this group is influenced by both value cognition and risk assessment, which significantly affects their consumption behavior patterns. 5 of the 44 articles included for PV-PI were college students (11.4%). When consumers were college students, the effect sizes were 0.372 ( p = 0.000); in contrast, when consumers were not, the effect sizes increased to 0.533 ( p = 0.000) and this can be found in PV-PR, PR-PV, and PR-PI. In more detail, in PV-PR, seven studies were with students, and 21 studies were with non-students, and the effect sizes were −0.221 ( p = 0.000). In PR-PV, two studies were with students, and 24 studies were all non-students, and also the effect sizes increased in negative magnitude (−0.158 vs. −0.176). In PR-PI, three studies were with students, and 31 studies were with non-students. When consumers were college students, the effect sizes were −0.148 ( p = 0.000); in contrast, when consumers were not, the effect sizes increased to −0.181 ( p = 0.000) (Table 3). These differences between student and non-student populations can be explained by consumer socialization theory and life cycle stage differences. College students typically have limited disposable income and less purchasing experience, so their purchase decisions are more influenced by peer pressure, fashion trends, and short-term hedonic needs rather than comprehensive value–risk trade-offs. They are also more willing to take risks to try new products or services, which weakens the negative impact of risk perception on purchase intention. In contrast, non-student consumers (especially working adults) have more stable income, richer purchasing experience, and greater family responsibilities, so they conduct more thorough value assessments and risk evaluations before making purchase decisions. Their purchase decisions are more rational and long-term oriented, leading to stronger relationships between perceived value, risk perception, and purchase intention. It is worth noting that age, income, and purchasing experience are highly correlated with student status, and we were unable to isolate their independent effects in this meta-analysis due to the lack of subgroup correlation coefficients reported in most original studies. Future primary studies should report detailed demographic subgroup data to enable more rigorous examination of these confounding variables.

4.5.5. Other Moderators

Research data suggested that individual characteristic variables, including demographic indicators such as education level, economic status, marital status, and gender differences, may regulate the pathways between perceived value, risk perception, and consumer decision-making. However, empirical analyses of these moderating effects are limited, and most studies did not provide quantitative results for correlation testing.

4.5.6. Sensitivity Analysis and Robustness Check

To evaluate the robustness of our combined effect estimates and examine whether any single study disproportionately influenced the overall results, we conducted leave-one-out sensitivity analysis for all four pairwise relationships. This method involves recalculating the pooled effect size and 95% confidence interval after excluding each individual study one by one.
The results of the sensitivity analysis are presented in Supplementary Materials (Table S3). For the PV-PI relationship, the pooled effect sizes ranged from 0.468 to 0.505 after excluding each study, all of which were within the 95% confidence interval of the original overall effect size (0.412–0.554). For the PV-PR relationship, the recalculated effect sizes ranged from −0.251 to −0.213, all within the original confidence interval (−0.359 to −0.096). For the PR-PV relationship, the effect sizes ranged from −0.178 to −0.141, consistent with the original result (−0.251 to −0.064). For the PR-PI relationship, the effect sizes ranged from −0.182 to −0.145, all within the original confidence interval (−0.252 to −0.072).
These findings indicate that no single study significantly altered the magnitude or direction of the overall effect sizes. The stability of our results across all leave-one-out iterations confirms the robustness of our meta-analytic conclusions and rules out the possibility that the observed effects are driven by outliers or influential studies.

4.6. Results for MASEM

This study aims to explore in depth the interaction mechanism between the risk–value trade-off and consumer purchase intention. Among the three models evaluated, particular attention was paid to which model included the key variable of the legal relationship network in its construction. Through meta-analysis, we have obtained comprehensive empirical evidence that most strongly supports models that include legal relationship networks. To accurately answer this question, this study used a real score correlation matrix and conducted in-depth research using the structural equation modeling (SEM) method. The Supplementary Materials provide the correlation coefficient matrix for all variables. When conducting SEM analysis, this study used the maximum likelihood estimation method to fit the model, and in order to ensure the conservatism of sample size estimation, the harmonic mean of the sample size was used as the input parameter to the analysis. Viswesvaran and Ones recommended this analysis method in 1995, and this study used the AMOS (v21.29) software for the SEM analysis. The MASEM analysis results of these competitive models are presented in Table 3. In all evaluated models, the importance of each path is reflected. The significance of the statistical results mainly comes from the relatively large sample size, which leads to higher RMSEA values in cases of low degrees of freedom. Based on four established models, fitting statistical indicators including chi square, RMSEA, NFI, CFI, and SRMR, this study conducted a comprehensive comparison of these models to determine which model is superior in both theory and empirical fit.

5. Discussion

This study uses meta-analysis techniques to systematically verify the correlation mechanism between consumers’ perceived value, risk perception, and consumption decisions, providing data support for the construction of theoretical models. Through multiple model comparisons, the optimal explanatory path is determined, and the situational boundaries and intermediary transmission paths are clarified. We provide cumulative evidence for the risk–value trade-off framework in consumer decision-making. The following sections systematically address the four research questions raised in the Introduction.

5.1. Relationships Among Risk Perception, Perceived Value, and Consumer Purchase Intention (RQ1)

Our meta-analysis results provide definitive answers to the first research question by quantifying the strength and direction of the pairwise relationships among the three core variables (RQ1). First, perceived value has a significant positive impact on consumer purchase intention (r = 0.487, p < 0.001), which is consistent with the vast majority of empirical studies [1,2,7]. This finding confirms that consumers’ overall net assessment of product utility—encompassing utilitarian, hedonic, and social dimensions—is the primary driver of their willingness to purchase. Second, risk perception has a significant negative impact on purchase intention (r = −0.163, p < 0.001), supporting the classic view that subjective perceptions of potential losses (financial, performance, psychological, temporal, physical, and social) inhibit consumer decision-making [21,27].
Notably, our results reveal a significant bidirectional negative interaction between perceived value and risk perception: higher perceived value reduces consumers’ risk perception (r = −0.232, p < 0.001), and higher risk perception in turn lowers consumers’ evaluation of product value (r = −0.159, p < 0.001). This finding resolves the long-standing inconsistency in the previous literature regarding whether PV and PR are independent or interactive variables [8,26], confirming that they are not parallel, isolated factors but dynamically influence each other throughout the decision-making process. Furthermore, the effect size of PV on PI (0.487) is nearly three times larger than that of PR on PI (−0.163), indicating that perceived value plays a more dominant role in the risk–value trade-off. This explains why even in high-risk contexts, consumers may still make purchase decisions if they perceive sufficiently high net value.

5.2. Boundary Conditions of the Risk–Value Trade-Off Relationships (RQ2)

To answer the second research question (RQ2), we conducted subgroup analyses to examine whether the relationships among PV, PR, and PI vary across geographical regions, research populations, purchase channels, and publication time. The results confirm that all four pairwise relationships exhibit significant heterogeneity (I2 > 87% for all), and the identified moderators explain a substantial portion of this variability.
First, geographical region significantly moderates the risk–value trade-off. The impact of PV on PI is stronger in developing countries (r = 0.53) than in developed countries (r = 0.449), while the negative impact of PR on PV and PI is also stronger in developing countries. These differences can be primarily attributed to cultural dimensions and market maturity as proposed by Hofstede’s cultural dimensions theory: consumers in developing countries with higher collectivism and power distance rely more on subjective value judgments (e.g., brand reputation, social approval) as signals of product quality, while consumers in developed countries with higher individualism and uncertainty avoidance conduct more comprehensive risk evaluations before purchasing. Additionally, the lower market maturity and less standardized regulatory environment in developing countries may lead to greater variability in product quality, making consumers more sensitive to perceived value as a quality signal. However, we emphasize that these regional findings should be interpreted cautiously due to the severe sample imbalance (72.7% of studies were conducted in Asia).
Second, the research population (students vs. non-students) is another critical moderator. The relationships between PV-PI, PV-PR, PR-PV, and PR-PI are all stronger for non-student consumers than for students. Specifically, the effect size of PV on PI is 0.533 for non-students compared to 0.372 for students. This is consistent with consumer socialization theory and life cycle stage differences: non-student consumers (especially working adults) have more stable incomes, richer purchasing experience, and greater family responsibilities, leading to more rational and thorough value–risk assessments. In contrast, college students with limited disposable income and less purchasing experience are more influenced by peer pressure, fashion trends, and short-term hedonic needs, weakening the strength of the risk–value trade-off. When comparing the strength of these established moderating effects (geographical region and student status) with other demographic variables frequently examined in primary studies—such as age, income, education level, and gender—several theoretical insights emerge. Previous empirical literature indicates that female consumers, older demographics, and lower-income individuals typically exhibit heightened risk aversion, leading to a stronger negative impact of risk perception on purchase intention [4,49]. Conversely, highly educated consumers tend to engage in more systematic cognitive processing, amplifying the role of perceived value. Our meta-analytic results reveal that the meso-level proxy of ‘student versus non-student’ (which fundamentally captures bundled variance in age, income, and financial independence) generates a substantial effect size shift (e.g., the effect of PV on PI increasing from 0.372 to 0.533). This shift is comparable to, if not stronger than, the isolated effects of age or gender reported in individual primary studies. Furthermore, the macro-level effect of geographical region (developed vs. developing) appears to exert a more profound structural influence on the risk–value trade-off than individual-level traits like education or gender. Regional institutional frameworks, market maturity, and cultural norms systematically dictate baseline market trust, essentially overriding micro-level demographic variations.
Third, the purchase channel also moderates the relationships. The impact of PV on PI (0.518 vs. 0.495) and the negative impact of PR on PV (−0.298 vs. −0.179) are stronger in online channels than in offline channels. This is due to the inherent information asymmetry in digital transactions: in offline shopping, consumers can directly inspect products and experience services, reducing uncertainty through physical contact; in online shopping, however, consumers cannot touch or try products before purchase, so they rely more heavily on perceived value (aggregated from product descriptions, reviews, and ratings) to evaluate utility. The stronger negative relationship between PR and PV in online channels further confirms this point: higher perceived risk (e.g., product mismatch, delivery delays, fraud) significantly reduces consumers’ evaluation of net utility. Interestingly, the negative impact of PR on PI is weaker in online channels (−0.158 vs. −0.204), which may be explained by the comprehensive risk mitigation mechanisms (e.g., no-hassle return policies, buyer protection programs) established by modern e-commerce platforms.
Finally, publication time has a significant but weak moderating effect. The negative relationships between PV-PR and PR-PV have gradually weakened over time (standardized regression coefficients of −0.0681 and −0.0357, respectively), which reflects the development of e-commerce infrastructure and consumer digital literacy. In the early stage of e-commerce development (2008–2015), consumers generally had low trust in online transactions, and higher perceived value was often associated with greater perceived risk (“too good to be true” psychology). However, with the improvement in payment security systems, logistics services, and after-sales guarantee mechanisms in recent years, consumers are now more likely to associate high perceived value with genuine product quality and service advantages rather than potential traps.

5.3. Influence Mechanisms of the Risk–Value Trade-Off on Purchase Intention (RQ3)

The third research question concerns the underlying mechanisms by which the risk–value trade-off affects purchase intention and its boundaries (RQ3). To address this, we compared three competing theoretical models using MASEM, and the results show that Model 1 (PV → PR → PI and PV → PI) provides the best fit to the data, with superior goodness-of-fit indices (lower RMSEA and SRMR, higher CFI) compared to Model 2 (PV → PI and PR → PI) and Model 3 (PR → PV → PI and PR → PI).
Model 1 reveals a dual-path mechanism: perceived value not only has a direct positive impact on purchase intention (r = 0.425) but also exerts an indirect positive effect by reducing risk perception (r = −0.232), which in turn weakens its inhibitory effect on purchase intention (r = −0.187). This hierarchical cognitive processing mechanism indicates that consumers first evaluate the overall value of a product, and this value assessment then shapes their perception of potential risks. In contrast, Model 2 only examines the unidirectional effects of PV and PR on PI while ignoring their dynamic interaction, leading to obvious theoretical limitations. Although Model 3 has a relatively complete structure, its goodness-of-fit indices are significantly worse than those of Model 1, as it reverses the primary causal direction between PV and PR.
These findings clarify the internal logic of the risk–value trade-off: consumer decision-making is not a simple parallel evaluation of gains and losses but a dynamic process where value perception serves as the primary cognitive anchor that buffers risk perception. This explains why value enhancement strategies are often more effective than pure risk reduction strategies in driving purchase intention, as confirmed by our earlier finding that PV has a stronger overall impact on PI.

5.4. Theoretical and Practical Implications (RQ4)

This review theoretically validated previous experiences and found that both perceived value as an aggregated construct (encompassing hedonism and utilitarianism) and global risk perception affect consumers’ purchase intentions. The mechanism of purchase decision-making is jointly influenced by consumers’ holistic value evaluations of retail brand image and comprehensive risk expectations. By clearly defining perceived value and risk perception as higher-order constructs, this study standardizes the measurement logic across heterogeneous primary studies, thereby strengthening the validity of the MASEM path estimates. First, this is the first meta-analytic study to systematically summarize the relationships among PV, PR, and PI, providing cumulative quantitative evidence that resolves the inconsistencies in previous empirical research. By quantifying the effect sizes and confirming the bidirectional interaction between PV and PR, we advance the risk–value trade-off framework beyond conceptual discussions to rigorous empirical validation. Second, by clearly defining PV and PR as higher-order aggregate constructs (PV encompassing utilitarian, hedonic, and social dimensions; PR aggregating six loss facets) and standardizing their operationalization across heterogeneous studies, we strengthen the validity of cross-study comparisons and provide a unified measurement foundation for future research. Third, our MASEM results identify the optimal explanatory mechanism of the risk–value trade-off, embedding it into the Theory of Planned Behavior by conceptualizing PV as a primary driver of consumer attitude and PR as a definitive boundary of perceived behavioral control. This enriches the theoretical framework of consumer decision-making by explicitly incorporating the dynamic interaction between gains and losses.
In management practices, for marketing practitioners, our findings provide actionable, context-specific guidelines for designing effective strategies. First, since perceived value plays a dominant role in driving purchase intention, managers should prioritize ensuring the match between product quality and price, and enhance utilitarian, hedonic, and social value through product innovation and experiential marketing. Second, differentiated strategies should be deployed based on the identified boundary conditions. In developing markets, emphasize brand prestige and core utility to amplify perceived value and offset systemic market uncertainties; in developed markets, prioritize strict risk mitigation through transparent data privacy policies and extended warranties to satisfy highly risk-averse consumers. For non-student consumers, provide comprehensive value–risk transparency and explicitly detail long-term ROI and performance guarantees; for student demographics, pivot toward maximizing hedonic and social value through trendy, experiential campaigns. For online channels, leverage rich media (e.g., AR/VR try-ons) and verified customer reviews to reduce information asymmetry, while strengthening risk mitigation mechanisms such as frictionless return policies [1,4,6,8,30].
For policymakers, our results highlight the critical role of market regulation in shaping consumer risk–value assessments. In developing countries where consumers are more sensitive to both value and risk, strengthening product quality supervision and consumer rights protection can reduce unnecessary systemic risk perception, thereby enhancing consumer confidence and promoting sustainable market development. Additionally, standardizing e-commerce platform operations and improving after-sales service regulations can further buffer the negative impact of risk perception on purchase intention in digital transactions. Policymakers should also promote consumer education to improve digital literacy and risk assessment capabilities, helping consumers make more informed purchase decisions [1,4,24,30].

5.5. Limitations and Future Research

First, the sample distribution was severely imbalanced across geographical regions. As noted earlier, 72.7% of the included studies were conducted in Asia, while only a small number of studies covered Africa, Europe, and North America, and no studies from South America or Oceania were included. This imbalance limits the generalizability of our regional comparison results. Future research should prioritize data collection from underrepresented regions to obtain a more comprehensive understanding of cross-cultural differences in the risk–value trade-off.
Second, the student/non-student grouping, while based on objective sample descriptions from original studies, did not control for confounding variables such as age, income, and purchasing experience. Most original studies did not report subgroup correlation coefficients stratified by these demographic variables, which prevented us from conducting further meta-regression analysis to isolate their independent effects. Future primary studies should report more detailed demographic subgroup data to enable more rigorous meta-analytic investigations of these confounding factors.
Third, our strict boundary definition between online and offline purchasing channels excluded studies on mixed omnichannel behaviors, which are becoming increasingly dominant in modern retail. This limits the applicability of our results to emerging omnichannel contexts. Future research should explore how the risk–value trade-off operates in omnichannel environments where consumers integrate multiple touchpoints throughout the purchase journey.
Fourth, the sampling method included in the study has a selective bias, and the survey subjects are mainly limited to a portion of consumers who actively participate in the questionnaire survey. The consumption patterns of this specific group of people may not objectively reflect the overall psychological changes in consumers’ risk–value balance. In order to enhance the reliability of the research results, it is recommended to improve the sampling design, expand the channels of sample sources, and pay special attention to collaborative cooperation with various retail terminals. Consumer feedback should be collected immediately after the product purchase process to ensure better representativeness and external validity of the data.

6. Conclusions

The risk–value trade-off in the consumer purchasing decision-making process constitutes the core determining element of behavioral intention. The existing research has not reached a unified conclusion on the pathways and interactive effects of these two types of psychological factors, and their underlying correlation mechanisms need to be clarified. To fill the research gap, this study adopts a quantitative literature review method to reveal the underlying mechanism of action through effect quantity integration and path modeling. Forty-four studies (N = 21,370) were included to examine how risk perception and perceived value impact consumer purchase intention, showing that consumer purchase intention is affected positively by perceived value and negatively by risk perception. Risk perception and perceived value exhibit mutual interaction effects. Perceived value has a stronger relationship with consumer purchase intention than risk perception. In the moderator’s analysis, the effects of perceived value on consumers’ risk perception and of perceived risk on perceived value and purchase intention are stronger when consumers come from developing (vs. developed) countries. Impacts of perceived value on consumer purchase intention and risk perception, and of risk perception on perceived value and purchase intention, are stronger when consumers are non-students (vs. students). When analyzing the three models’ mechanisms of action, Model 1 better explained the boundaries of consumer intention and impact mechanisms. To our knowledge, this is the first meta-analytic study summarizing how risk perception and perceived value impact consumers’ purchase intention, revealing the mechanism and boundaries of consumer behavior and illuminating a forward-looking new perspective outlining research directions.

Supplementary Materials

The following supporting information can be downloaded at: https://www.mdpi.com/article/10.3390/su18136447/s1, Table S1. Risk-of-bias assessment of included studies. Table S2. Meta-Analytic Derived Correlation Matrix. (a) Model 1: Meta-Analytic Derived Correlation Matrix. (b) Model 2: Meta-Analytic Derived Correlation Matrix. (c) Model 3: Meta-Analytic Derived Correlation Matrix. Table S3. Results of leave-one-out (one study removed) text. Figure S1. Funnel plot of the 44 articles included. Figure S2. Effect sizes and year of publication of the 44 articles included. Supplementary File PRISMA 2020 checklist [90].

Author Contributions

Z.L.: Conceptualization, Methodology, Investigation, Visualization, Writing—Original Draft, Writing—Review & Editing. J.Z.: Conceptualization, Methodology, Writing—Original Draft, Writing—Review & Editing. J.T.: Writing—Review & Editing. All authors have read and agreed to the published version of the manuscript.

Funding

This work was supported by the 2024 Capital Health Development Research Project “Research on Risk Assessment Standards and Improvement of Early Warning Effectiveness for Health Emergency Incidents” (Project No. Capital Development 2024-3061) and the Beijing Public Health Emergency Management Center Project “Capital Health Emergency Event Risk Warning” (Project No. 0686-2411BC060456Z).

Institutional Review Board Statement

Not applicable.

Informed Consent Statement

Not applicable.

Data Availability Statement

All data has been attached and uploaded. If there are any other requirements, please contact the corresponding author.

Conflicts of Interest

The authors declare no conflict of interest.

References

  1. Chen, Y.H.; Lin, I.K.; Huang, C.I.; Chen, H.S. How key opinion leaders’ expertise and renown shape consumer behavior in social commerce: An analysis using a comprehensive model. J. Theor. Appl. Electron. Commer. Res. 2024, 19, 3370–3385. [Google Scholar] [CrossRef]
  2. Choudhary, V.; Bag, T.; Mukherjee, S. Promotion of rural tourism through virtual reality: The impact of content richness on consumer’s perceived value and behavioral intention. J. Travel Tour. Mark. 2025, 42, 665–692. [Google Scholar] [CrossRef]
  3. Gonzalez, C.; Donahue, K.; Goldstein, D.G.; Heidari, H.; Jalali, M.S.; Schelble, B.; Singh, A.; Woolley, A.W. Toward a science of human–AI teaming for decision making: A complementarity framework. PNAS Nexus 2026, 5, pgag030. [Google Scholar] [CrossRef] [PubMed]
  4. Li, Z.H.; Sa, Y.Z.; Song, X.P.; Yang, K.H.; Zhao, K.; Jiang, Z.X.; Zhang, Q.X. Impact of risk perception on customer purchase behavior: A meta-analysis. J. Bus. Ind. Mark. 2020, 35, 76–96. [Google Scholar]
  5. Lu, K.; Shi, C. Why do travelers discontinue using integrated ride-hailing platforms? The role of perceived value and perceived risk. Humanit. Soc. Sci. Commun. 2025, 12, 344. [Google Scholar] [CrossRef]
  6. Shashi, P.; Cerchione, R.; Jhamb, D. Double-edged circularity: Comparative assessment of circular and non-circular consumers. Ecol. Econ. 2023, 212, 107931. [Google Scholar]
  7. Yu, C.; Jaing, W.; Miao, R. User-centric design experience or privacy risk perception? The dual pathways of tourism platform’s AI capability to perceived user value. Curr. Issues Tour. 2024, 9, 1376–1393. [Google Scholar]
  8. Zhao, S.; Cao, X. Investigating the determinants of Chinese residents’ intention to purchase green housing: A dual-stage structural equation modeling-artificial neural network approach. J. Hous. Built Environ. 2025, 40, 461–495. [Google Scholar]
  9. Bauer, R.A. Consumer Behavior as Risk Taking. In Proceedings of the 43rd National Conference of the American Marketing Assocation; American Marketing Association: Chicago, IL, USA, 1960; pp. 389–398. [Google Scholar]
  10. Dowling, G.R. Perceived risk: The concept and its measurement. Psychol. Mark. 1986, 3, 193–210. [Google Scholar] [CrossRef]
  11. Schiffman, L.G.; O’Cass, A.; Paladino, A.; D’Alessandro, S.; Bednall, D. Consumer Behaviour, 5th ed.; Pearson Publications: London, UK, 2011. [Google Scholar]
  12. Song, J.; Kajalo, S. Psychological determinants of participation in the sharing economy: A cross-cultural study of the U.S. and China. Front. Psychol. 2026, 16, 1666282. [Google Scholar] [PubMed]
  13. Zeithaml, V.A. Consumer perceptions of price, quality, and value: A means-end model and synthesis of evidence. J. Mark. 1988, 52, 2–22. [Google Scholar] [CrossRef] [PubMed]
  14. Meshreki, H.; Ennew, C.; Mourad, M.M. A comparative analysis of dimensions of coo and animosity on industrial buyers’ attitudes and intentions. J. Prod. Brand Manag. 2018, 27, 832–846. [Google Scholar] [CrossRef]
  15. Sabiote, C.M.; Frías, D.M.; Castañeda, J.A. The moderating effect of uncertainty-avoidance on overall perceived value of a service purchased online. Internet Res. 2011, 22, 180–198. [Google Scholar]
  16. Gong, W.; Li, Z.; Tang, J. Impact of risk perception on emergency information seeking behavior: A meta-analysis. Front. Psychol. 2026, 16, 1646584. [Google Scholar] [CrossRef] [PubMed]
  17. Rustam, M.; Sianipar, A.; Takwin, B. An Investigation on Integral Emotions as Parallel Predictors for Risky Financial Behavior. PsyCh. J. 2026, 15, e70089. [Google Scholar] [CrossRef] [PubMed]
  18. Woodruff, R.B. Customer value: The next source for competitive advantage. J. Acad. Mark. Sci. 1997, 25, 139. [Google Scholar] [CrossRef]
  19. Shapiro, S.L.; Reams, L.; So, K.K.F. Is it worth the price? The role of perceived financial risk, identification, and perceived value in purchasing pay-per-view broadcasts of combat sports. Sport Manag. Rev. 2019, 22, 235–246. [Google Scholar] [CrossRef]
  20. Wang, H.J. Determinants of consumers’ purchase behaviour towards green brands. Serv. Ind. J. 2017, 37, 896–918. [Google Scholar] [CrossRef]
  21. Wang, Y.; Hazen, B.T. Consumer product knowledge and intention to purchase remanufactured products. Int. J. Prod. Econ. 2016, 181, 460–469. [Google Scholar] [CrossRef]
  22. Yang, Y.; Wang, Y.; Bi, X. Factors Influencing Purchase of Advanced Intelligent Driving Vehicles in China: A Perspective of Value-Based Adoption Model. World Electr. Veh. J. 2025, 16, 154. [Google Scholar] [CrossRef]
  23. Lin, C.; Shih, H. Past progress and future directions in conceptualizing customer perceived value. Int. J. Serv. Ind. Manag. 2005, 16, 318–336. [Google Scholar] [CrossRef]
  24. Qin, G. The Impact and Mechanism of Artificial Intelligence Autonomy on User Perception and Consumption Behavior—Method Based on Meta-Analysis. E-Commer. Lett. 2025, 14, 3816–3832. [Google Scholar]
  25. Piri, Z.; Lotfizadeh, F. Investigation of the influence of perceived quality, price and risk on perceived product value for mobile consumers. Asian Soc. Sci. 2015, 12, 103. [Google Scholar] [CrossRef]
  26. Barcelos, R.H.; Dantas, D.C.; Sénécal, S. Watch Your Tone: How a Brand’s Tone of Voice on Social Media Influences Consumer Responses. J. Interact. Mark. 2018, 41, 60–80. [Google Scholar]
  27. Chiu, C.M.; Wang, E.T.G.; Fang, Y.-H.; Huang, H.-Y. Understanding customers’ repeat purchase intentions in B2C e-commerce: The roles of utilitarian value, hedonic value and perceived risk. Inf. Syst. J. 2014, 24, 85–114. [Google Scholar]
  28. Isa, S.; Lim, C.; Chin, P.N. Green Purchase Intention of Laundry Detergent Powder in Presence of Eco-Friendly Brand. Glob. Bus. Manag. Res. Int. J. 2017, 9, 128–143. [Google Scholar]
  29. Beneke, J.; Carter, S. The development of a consumer value proposition of private label brands and the application thereof in a South African retail context. J. Retail. Consum. Serv. 2015, 25, 22–35. [Google Scholar] [CrossRef]
  30. Barends, E.; Rousseau, M. Evidence-Based Management—How to Use Evidence to Make Better Organizational Decisions; Kogan Page: London, UK, 2018. [Google Scholar]
  31. Tang, J.; Li, Z. The Antecedents of Organ Donation Intention and Behavior: A meta-Analysis. Health Commun. 2026, 41, 601–636. [Google Scholar] [PubMed]
  32. Chen, Z.; Dubinsky, A.J. A conceptual model of perceived customer value in e-commerce: A preliminary investigation. Psychol. Mark. 2003, 20, 323–347. [Google Scholar]
  33. Cronin, J.J.; Brady, M.K.; Hult, G.T.M. Assessing the effect of quality, value, and customer satisfaction on consumer behavioural intentions in service environments. J. Retail. 2000, 76, 193–218. [Google Scholar]
  34. Forsythe, S.; Liu, C.; Shannon, D.; Gardner, L.C. Development of a scale to measure the perceived benefits and risks of online shopping. J. Interact. Mark. 2006, 20, 55–75. [Google Scholar] [CrossRef]
  35. Sweeney, J.C.; Soutar, G.N.; Johnson, L.W. The role of perceived risk in the quality-value relationship: A study in a retail environment. J. Retail. 1999, 75, 77–105. [Google Scholar] [CrossRef]
  36. Conchar, M.P.; Olavarrieta, S. An integrated framework for the conceptualization of consumers’ perceived-risk processing. J. Acad. Mark. Sci. 2004, 32, 418–436. [Google Scholar] [CrossRef]
  37. Grewal, D.; Marmorstein, H. The moderating effects of message framing and source credibility on the price-perceived risk relationship. J. Consum. Res. 1994, 21, 145. [Google Scholar] [CrossRef] [PubMed]
  38. Biswas, D.; Das, N. The differential effects of celebrity and expert endorsements on consumer risk perceptions. The role of consumer knowledge, perceived congruency, and product technology orientation. J. Advert. 2006, 35, 17–31. [Google Scholar] [CrossRef]
  39. Cox, D.F. Risk Taking and Information Handling in Consumer Behavior; Harvard University Press: Boston, MA, USA, 1967. [Google Scholar]
  40. Lee, J.; Lee, J.N. How purchase intention consummates purchase behaviour: The stochastic nature of product valuation in electronic commerce. Behav. Inf. Technol. 2015, 34, 57–68. [Google Scholar]
  41. Del, I.H.; Roger, J.B.; Kenneth, A. Customer Behavior: Building Marketing Strategy, 12th ed.; McGraw-Hill Education Publications: Columbus, OH, USA, 2001. [Google Scholar]
  42. Wang, J.; Kim, S. Searching for new directions for energy policy: Testing the cross-effect of risk perception and cyberspace factors on online/offline opposition to nuclear energy in south korea. Sustainability 2019, 11, 1368. [Google Scholar] [CrossRef]
  43. Chen, S.; Zhi, K.; Chen, Y. How active and passive social media use affects impulse buying in Chinese college students? The roles of emotional responses, gender, materialism and self-control. Front. Psychol. 2022, 13, 1011337. [Google Scholar] [CrossRef] [PubMed]
  44. Dou, F.; Zhao, J.; Wang, M. Green consumption values and green purchasing behaviour: A moderated mediation model of gratitude and green product availability. Int. J. Psychol. 2025, 60, e70029. [Google Scholar] [CrossRef] [PubMed]
  45. Jameel, A.; Khan, S.; Alonazi, W.B.; Khan, A.A. Exploring the impact of social media sites on compulsive shopping behavior: The mediating role of materialism. Psychol. Res. Behav. Manag. 2024, 17, 171–185. [Google Scholar] [CrossRef] [PubMed]
  46. Rausch, T.M.; Kopplin, C.S. Bridge the gap: Consumers’ purchase intention and behavior regarding sustainable clothing. J. Clean. Prod. 2021, 278, 123882. [Google Scholar] [CrossRef]
  47. Brynjolfsson, E.; Hu, Y.J.; Rahman, M.S. Competing in the age of omni-channel retailing. MIT Sloan Manag. Rev. 2013, 54, 23–29. [Google Scholar]
  48. Wilson, H.; Daniel, E. The multi-channel challenge: A dynamic capability approach. Ind. Mark. Manag. 2007, 36, 10–20. [Google Scholar] [CrossRef]
  49. Crawford, J.; Lamb, C. The role of environmental factors in the purchase of foreign industrial product. J. Int. Consum. Mark. 1989, 1, 87–103. [Google Scholar] [CrossRef]
  50. Leon, G.S.; Joseph, W. Consumer Behavior, 11th ed.; Pearson Publications: London, UK, 2014. [Google Scholar]
  51. Ashrafi, D.M.; Alam, I.; Anzum, M. An empirical investigation of consumers’ intention for using ride-sharing applications: Does perceived risk matter? Int. J. Innov. Technol. Manag. 2021, 18, 2150040. [Google Scholar] [CrossRef]
  52. Beck, M.; Toulouse, N.Ö. Assessing the impact of energy labels on attitude and behavioral intention: An empirical investigation. J. Clean. Prod. 2023, 415, 137751. [Google Scholar] [CrossRef]
  53. Cao, D.; Xie, Q.; Yao, X.; Zheng, Y. Organic food consumption in China: Food safety concerns, perceptions, and purchase behavior under the moderating role of trust. Front. Sustain. Food Syst. 2023, 7, 1319309. [Google Scholar] [CrossRef]
  54. Chang, E.C.; Tseng, Y.F. Research note: E-store image, perceived value and perceived risk. J. Bus. Res. 2013, 66, 864–870. [Google Scholar] [CrossRef]
  55. Chang, S.H.; Chih, W.H.; Liou, D.K.; Yang, Y.T. The mediation of cognitive attitude for online shopping. Inf. Technol. People 2016, 29, 618–646. [Google Scholar] [CrossRef]
  56. Chen, H.S.; Tsai, B.K.; Hsieh, C.M. Determinants of consumers’ purchasing intentions for the hydrogen-electric motorcycle. Sustainability 2017, 9, 1447. [Google Scholar] [CrossRef]
  57. Chen, Y.S.; Chang, C.H. Enhance green purchase intentions: The roles of green perceived value, green perceived risk, and green trust. Manag. Decis. 2012, 50, 502–520. [Google Scholar]
  58. Dayan, T.S.; Danaher, P.J.; Gibbs, B.J. How often versus how long: The interplay of contact frequency and relationship duration in customer-reported service relationship strength. J. Serv. Res. 2009, 11, 371–388. [Google Scholar]
  59. Dhewi, T.S.; Putra, I.W.J.A.; Wahyudi, H.D. The influence of green perceived value and green perceived risk perceptions on the green product purchase intention. KnE Soc. Sci. 2018, 411–425. [Google Scholar] [CrossRef]
  60. Gan, C.; Wang, W. The influence of perceived value on purchase intention in social commerce context. Internet Res. 2017, 27, 772–785. [Google Scholar] [CrossRef]
  61. Ge, L. To buy or not to buy? A research on the relationship between traceable food extrinsic cues and consumers’ purchase intention. Front. Psychol. 2022, 13, 873941. [Google Scholar] [CrossRef] [PubMed]
  62. Hati, S.R.H.; Putri, N.I.S.; Daryanti, S.; Wibowo, S.S.; Safira, A.; Setyowardhani, H. Brand familiarity vs. profit-sharing rate: Which has a stronger impact on Muslim customers’ intention to invest in an Islamic bank? J. Islam. Mark. 2022, 13, 1703–1727. [Google Scholar]
  63. Hu, X.; Zhou, R.; Wang, S.; Gao, L.; Zhu, Z. Consumers’ value perception and intention to purchase electric vehicles: A benefit-risk analysis. Res. Transp. Bus. Manag. 2023, 49, 101004. [Google Scholar] [CrossRef]
  64. Jazaa, J.; Ijaz, M.F.; Rhee, J. Constituents and consequences of Online-shopping in Sustainable E-Business: An experimental study of Online-Shopping Malls. Sustainability 2018, 10, 3756. [Google Scholar]
  65. Lee, B.C. Critical decisions in new product launch: Pricing and advertising strategies on consumer adoption of green product innovation. Asian J. Technol. Innov. 2014, 22, 16–32. [Google Scholar] [CrossRef]
  66. Liljander, V.; Polsa, P.; Van Riel, A. Modelling consumer responses to an apparel store brand: Store image as a risk reducer. J. Retail. Consum. Serv. 2009, 16, 281–290. [Google Scholar] [CrossRef]
  67. Lou, X.; Chi, T.; Janke, J.; Desch, G. How do perceived value and risk affect purchase intention toward second-hand luxury goods? An empirical study of US consumers. Sustainability 2022, 14, 11730. [Google Scholar]
  68. Minaee, A.; Salidpour, B. Determining the effective components and formulating the basic model of consumer behavior. Int. J. Sci. Manag. Dev. 2014, 2, 112–125. [Google Scholar]
  69. Ozen, H.; Kaya, İ. How value perception affects buying intentions of online consumers. Bogazici J. Econ. Adm. Sci. 2013, 27, 11–29. [Google Scholar] [CrossRef]
  70. Ozturk, A.B.; Bilgihan, A.; Salehi-Esfahani, S.; Hua, N. Understanding the mobile payment technology acceptance based on valence theory: A case of restaurant transactions. Int. J. Contemp. Hosp. Manag. 2017, 29, 2027–2049. [Google Scholar]
  71. Rizwan, M.; Aslam, A.; Rahman, M.U.; Ahmad, N.; Sarwar, U.; Asghar, T. Impact of green marketing on purchase intention: An empirical study from Pakistan. Asian J. Empir. Res. 2013, 3, 87–100. [Google Scholar]
  72. Shapiro, S.L.; Drayer, J.; Shapiro, S.L.; Dwyer, B. Worth the price of admission? The mediating effect of perceived value on ticket purchase intention. Sport Mark. Q. 2018, 27, 44–57. [Google Scholar] [CrossRef]
  73. Sharma, K.; Jain, R.; Sharma, A. Anthropomorphic artificial intelligence drives consumer behavior: Comprehensive literature review and research agenda. J. Internet Commer. 2025, 24, 185–223. [Google Scholar] [CrossRef]
  74. Shi, R.; Li, G.; Liu, G. Modeling study on repeat purchase intention on silk products based on the electronic commercial platform. Res. J. Costume Cult. 2012, 20, 937–941. [Google Scholar] [CrossRef]
  75. Tae, B.; Karen, K. Exploring the consequences of brand credibility in services. J. Serv. Mark. 2011, 25, 260–272. [Google Scholar] [CrossRef]
  76. Wang, C.H.; Hsien, G.C. Service innovation and new product performance: The influence of market-linking capabilities and market turbulence. Int. J. Prod. Econ. 2015, 172, 54–64. [Google Scholar]
  77. Yee, C.J.; San, N.C. Consumers’ perceived quality, perceived value and perceived risk towards purchase decision on automobile. Am. J. Econ. Bus. Adm. 2011, 3, 47–57. [Google Scholar] [CrossRef]
  78. Zeng, H.; Hao, L. Cross-cultural examination of the effects of promotional framing on consumers’ responses: A comparison of China and Pakistan. Int. Bus. Rev. 2016, 25, 1020–1029. [Google Scholar] [CrossRef]
  79. Zhang, M.; Zhu, M.; Liu, X.; Yang, J. Why should I pay for e-books? An empirical study to investigate Chinese readers’ purchase behavioural intention in the mobile era. Electron. Libr. 2017, 35, 472–493. [Google Scholar]
  80. Zhao, J.; Peng, Z. Shared short-term rentals for sustainable tourism in the social-network age: The impact of online reviews on users’ purchase decisions. Sustainability 2019, 11, 4064. [Google Scholar]
  81. Zhao, S.; Chen, L. Exploring residents’ purchase intention of green housings in China: An extended perspective of perceived value. Int. J. Environ. Res. Public Health 2021, 18, 4074. [Google Scholar] [CrossRef] [PubMed]
  82. Zhao, X.; Deng, S.; Zhou, Y. The impact of reference effects on online purchase intention of agricultural products: The moderating role of consumers’ food safety consciousness. Internet Res. 2017, 27, 233–255. [Google Scholar]
  83. Zhao, Y. Research on Purchase Intentions of Residential Product Based on Structural Equation Model. In 2008 International Workshop on Modelling, Simulation and Optimization; IEEE: Piscataway, NJ, USA, 2008; pp. 115–118. [Google Scholar]
  84. Card, N.A. Applied Meta-Analysis for Social Science Research; Guilford Publications: New York, NY, USA, 2011. [Google Scholar]
  85. Bergh, D.D.; Aguinis, H.; Heavey, C.; Ketchen, D.J.; Boyd, B.K.; Su, P.; Joo, H. Using meta-analytic structural equation modeling to advance strategic management research: Guidelines and an empirical illustration via the strategic leadership-performance relationship. Strateg. Manag. J. 2016, 37, 477–497. [Google Scholar] [CrossRef] [PubMed]
  86. Viswesvaran, C.; Ones, D.S. Theory testing: Combining psychometric meta-analysis and structural equations modelling. Pers. Psychol. 1995, 48, 865–885. [Google Scholar] [CrossRef]
  87. Hunter, J.E.; Schmidt, F.L. Methods of Meta-Analysis: Correcting Error and Bias in Research Findings, 2nd ed.; Sage: Thousand Oaks, CA, USA, 2004. [Google Scholar]
  88. Borenstein, M.; Rothstein, H.R. Introduction to Meta-Analysis; John Wiley and Sons Publications: Oxford, UK, 2011. [Google Scholar]
  89. Rosenthal, R. The “file drawer problem” and tolerance for null results. Psychol. Bull. 1979, 85, 638–641. [Google Scholar] [CrossRef]
  90. Page, M.J.; McKenzie, J.E.; Bossuyt, P.M.; Boutron, I.; Hoffmann, T.C.; Mulrow, C.D.; Shamseer, L.; Tetzlaff, J.M.; Akl, E.A.; Brennan, S.E.; et al. The PRISMA 2020 statement: An updated guideline for reporting systematic reviews. BMJ 2021, 372, n71. [Google Scholar] [CrossRef] [PubMed]
Figure 1. Research conceptual framework. Note: PR: Risk Perception; PV: Perceived Value; PI: Purchase Intention.
Sustainability 18 06447 g001
Figure 2. Flow chart for selecting included studies.
Sustainability 18 06447 g002
Table 1. General characteristics of the 44 studies included.
No.AuthorCitationResearch AreaResearch AimSample Size (Male%)JournalResearch PopulationPurchase ChannelMain Findings
1Shapiro et al. 2018[72]USATo examine the relationship between identification, perceived value, and purchase intentions, and to assess the moderating role of perceived financial risk within the context of combat sports pay-per-view purchases.564 (35%)Sport Management Reviewnon-studentsonlineIdentification had a positive association with perceived value and purchase intentions. Perceived value was directly associated with purchase intentions. However, perceived financial risk did not moderate the relationship between identification and purchase intentions. PV was found to have positive influence on consumer PI.
2Zhao et al. 2017[82]ChinaTo analyze the impact of reference effects on online purchase intention (OPI) of agricultural products in B2C context and to examine how consumers’ food safety consciousness (FSC) moderates that impact.237 (39%)Internet Researchnon-studentsonlinePI was found to have positive influence on consumer PI.
3Wang and Hsien 2015[76]ChinaTo examine how knowledge of manufactured products in terms of cost, value and green attributes affects consumers’ prediction of both risk and quality associated with purchasing remanufactured products.264 no detailsInternal Journal of Production EconomicsstudentsofflineThe results of our structural equation modeling indicate that purchase intention is positively influenced by perceived value and negatively influenced by perceived risk. PV was found to have a positive influence on consumers’ PI.
4Beneke and Carter 2015[29]South AfricaTo address the question: What are the drivers of private label branded breakfast cereals, taking price, perceived risk and perceived quality into account?482 (57.3%)Journal of Retailing and Consumer Servicesnon-studentsofflinePerceived value was found to have a positive influence on consumers’ purchase intention.
5Lee 2014[65]ChinaTo examine the effects that pricing strategies (i.e., market skimming pricing vs. market penetration pricing) and advertising strategies (functional vs. emotional advertising) have on consumer perceived quality, perceived risk, perceived value, and purchase intention of product innovation.234 (52%)Asian Journal of Technology InnovationstudentsofflineThe results showed that a market penetration pricing strategy reduces consumer financial risk and increases consumer-perceived value, ultimately increases consumer purchase intention of product innovation.
6Chiu et al. 2012[27]ChinaTo investigate the upset purchase intention of experienced online buyers based on means-end chain theory and prospect theory.782 (40.3%)Information Systems JournalstudentsonlineThe results indicate that both the repeat purchase intention and repurchase intention are positively associated with perceived value and negative level of perceived risk reduces the effect of utilitarian value and increases the effect of hedonic intention.
7Chang and Tseng 2013[54]ChinaThis study also argues that perceived risk influences a consumer’s intention to purchase and thus mitigates value’s role as a motivator, which prompts the consumer to purchase online.323 no detailsJournal of Business Researchnon-studentsonlineThe result of online survey among consumers of the most popular shopping websites in Taiwan show that store image influences purchase intention through perceived value and utilitarian value does not moderate the influence between perceived value and purchase intention. However, perceived value exerts a strong effect on purchase intention. The results indicate that brand reliability and brand trust exert a strong positive influence by increasing perceived quality and by decreasing perceived risk across multiple service categories.
8Tae and Karen 2011[75]USATo investigate whether the framework of brand credibility effects is applicable to service categories and to examine brand credibility’s impact differs according to service type and involvement level.404 (25%)Journal of Services MarketingstudentsonlineThe results show that the fit effect on buying intentions is fully mediated by the functions as partial mediator of the effect of risk perceptions. The relative strength of the regulatory fit effect in explaining customer perceived value is stronger than the health insurance policy and the perceived value is a mediator of the effect of regulatory fit on purchase intentions.
9Dayan et al. 2009[58]UKThis research examines the regulatory fit effect on perceived value and buying intentions in the context of private health insurance decisions.150 (52%)Journal of Service Researchnon-studentsofflineThe results show that the fit effect on buying intentions is fully mediated by the functions as partial mediator of the effect of risk perceptions. The relative strength of the regulatory fit effect in explaining customer perceived value is stronger than the health insurance policy and the perceived value is a mediator of the effect of regulatory fit on purchase intentions.
10Zhao 2008[83]ChinaTo understand how we derive the value of the residential product by using a unified model, route and marketing mix and how can we inspire the consumer’s purchase intentions.272 no detailsInternational Workshop on Modelingnon-studentsofflineResults indicate perceived value is the most direct antecedent of the purchase intentions, both of the two antecedents perform via perceived value. The marketing strategies influence perceived quality and perceived risk.
11Meshrek et al. 2018[14]Egypt and CanadaTo investigate COO as a multidimensional construct and almost as a normative dimension of buyers’ attitudes and intentions.376 Egypt 247, Canada 129Journal of Product and Brand Managementnon-studentsofflinePrice was an antecedent of perceived risk and value in Egypt while perceived value was the strongest determinant of willingness to buy, while perceived value was a significant role in this respect in Canada but not in Egypt.
12Chen et al. 2017[56]ChinaTo identify the significant external variables that affect consumers’ purchase intentions toward using hydrogen-electric motorcycles.283 (42.4%)Sustainabilitynon-studentsofflinePerceived risk negatively affected the perceived value, and the perceived value positively affected purchase intentions.
13Isa et al. 2017[28]MalaysiaTo explore the relationship between eco-friendly brand and green purchase intention of laundry detergent powder.186 (42.45%)Global Business and Management Researchnon-studentsonlineThis research demonstrates that green perceived quality, green perceived value and green trust has a positive impact on purchase intention of eco-friendly brand. There are also mediating effects of green perceived value between green perceived quality and green perceived value.
14Wang 2017[20]ChinaTo explore the factors that influence green consumers’ purchase behavior toward green brands.215 (43.7%)The Service Industries Journalnon-studentsofflinePerceived quality, green perceived value and green perceived risk, information costs saved and purchase intentions.
15Minaee and Salidpour 2014[68]IranUsing approaches and marketing theory Dobbins 3 Culter, two minor target was set first, determine the components effective and formulate the basic model of consumer behavior, and second, to evaluate the model.599 no detailsInternational Journal of Scientific Management and Developmentnon-studentsonlineRisk perception negatively affected perceived value and perceived value positively affected purchase behavior.
16Liljander et al. 2009[66]FinlandTo investigate attitudes towards buying a retailer-endorsed brand or store brand (SB) in apparel retailing.216 (51.8%)Journal of Retailing and Consumer Servicesnon-studentsofflineCustomers of a Finnish department store were surveyed. Data were analyzed using Structural Equation Modeling (SEM); perceived value and quality of SB apparel appear to be the main drivers of purchase intentions. Perceived risk reduces SB value and purchase intentions.
17Sabiote et al. 2011[15]Spain UKTo analyze differences in the overall perceived value of a service purchased online and the consequences for international consumer behavior, taking consumers’ uncertainty avoidance as a moderating variable315 Spain 159, UK 156Internet Researchnon-studentsonlineThe results reveal that in the formation of overall perceived value, which embraces both the online purchase
18Gan and Wang 2017[60]ChinaTo examine the effects of perceived risk on purchase intention in social commerce context.277 (45.5%)Internet Researchnon-studentsonlineUtilitarian, hedonic and social values have significant and positive impacts on satisfaction and purchase intention, and utilitarian value is found to be the most salient factor influencing purchase intention
19Zhang et al. 2017[79]ChinaTo provide insights into the factors that influence the purchase e-books.431 (47%)The Electronic Librarynon-studentsofflineBoth UV and HV are positively associated with readers’ purchase intention.
20Jazaa et al. 2018[64]KoreaTo investigate how retailers could enhance their shopping processes and hence help sustain their e-business development.632 (60%)Sustainabilitynon-studentsonlinePV and trust in online shopping can nurture positive attitudes and shopping intentions among online customers.
21Barcelos et al. 2018[26]CanadaTo investigate how the tone of voice used by firms (human vs. corporate) influences purchase intentions on social media.202 no detailsJournal of Interactive Marketingnon-studentsofflineN = 202 show in different contexts that using a human voice can even reduce purchase intentions in situations associated with high situational involvement, due to perceptions of risk associated with humanness.
22Dhew et al. 2018[59]IndiaTo acquire the influence of green perceived value and green perceived risk perceptions on the green products purchase intention.250 no details1st International Research Conference on Economics and Businessnon-studentsofflineThe empirical results showed that the perception of green values positively correlated to their interest in purchasing green products. Meanwhile, the perception of green perceived risks was negatively correlated to the interest in purchasing green products.
23Chen and Chang 2012[57]ChinaTo develop an original framework to explore the influence of green perceived value and green perceived risk on green purchase intentions and to discuss the mediation role of green trust.258 no detailsManagement Decisionnon-studentsofflineThe empirical results show that green perceived value would positively affect green trust and green purchase intentions, while green perceived risk would negatively influences both of them.
24Ozturk et al. 2017[70]USATo examine factors affecting restaurant customers’ intention to use near field communication (NFC)-based mobile payment (MP) technology.417 (58.7%)International Journal of Contemporary Hospitality Managementnon-studentsonlinePR is not relative to purchase intention, U value is relative to purchase intention.
25Zeng and Hao 2016[78]China and PakistanTo explore how cross-cultural differences moderated the effects of buy one get one free and buy two get fifty percent off promotion on consumer uncertainty avoidance (China (lower uncertainty avoidance) and Pakistan (higher uncertainty avoidance)) across products.504 China 253, Pakistan 251International Business ReviewstudentsofflinePerceived value and purchase attention are significantly larger in Pakistan than in China. In addition, the study verified the negative risk-perceived value link, positive perceived risk-perceived value link and positive perceived value-purchase intention link from cross-cultural investigated data.
26Chang et al. 2016[55]ChinaTo explore the relationships among intrinsic motivation, extrinsic motivation, flow, cognitive attitudes, perceived satisfaction and purchase intention of consumers’ online shopping from a cognitive attitude perspective.800 no detailsInformation Technology and Peoplenon-studentsonlineThe results indicated that hedonic value, utilitarian value, security, and privacy significantly affected cognitive attitudes (i.e., cognitive trust and perceived risk).
27Ozen and Kaya 2013[69]TurkeyThis study tries to understand how Turkish online consumers perceive value for their purchase intentions.1361 no detailsReview of Social Economic and Administrative Studiesnon-studentsonlineRisk perception had a negative effect on value perception willingness to buy is positively influenced by value perception.
28Rizwan et al. 2013[71]PakistanTo explore the factors that affect purchase intention and to build up a conceptual model to inspect the influence of three preceding factors (green perceived value, green perceived risk, and trust) on purchase intention based green marketing.150 (50%)Asian Journal of Empirical Researchnon-studentsofflineGreen perceived value and green perceived risk significantly affect green purchase intention. The study did not find any relationship between value and risk.
29Yee and San 2011[77]MalaysiaTo study the relationships of perceived quality, perceived value and perceived risk that will affect Malaysian consumer purchase decision towards cars.200 no detailsAmerican Journal of Economics and Business Administrationnon-studentsofflineResults from multiple regression analysis showed the positive association between the three factors mentioned previously with purchase decision.
30Shi et al. 2012[74]ChinaThis paper mainly explores the e-commerce purchase frequency (EPF), customer perceived value (CPV), perceived risk (PR), and customer satisfaction (CS). The influence of the four factors on repeat purchase intention (RPI) is investigated.141 no detailsThe Research Journal of the Costume Culturenon-studentsonlineWe found that CPV and CS have positive correlations with repeat purchase intention. The CPV has a negative correlation with PR and has no significant influence on RPI.
31Zhao and Peng 2019[80]ChinaTo investigate the impact of online reviews on users’ purchase decisions toward shared short-term rentals using the SOR model.232 (52.2%)Sustainabilitynon-studentsonlinePerceived value and perceived risk fully mediate the relationship between online review quality and purchase decisions.
32Beck and Toulouse 2023[52]FranceBased on the theory of planned behavior, this study investigates the impact of perceived value and risk perception on purchase intention.994 (48.1%)Journal of Cleaner Productionnon-studentsonlineEmpirical research first reveals the “double-edged sword” effect of labeling: it optimizes the ecological perception of products and amplifies social risk perception. Further research has shown that the juxtaposition of new and old labels can effectively alleviate the negative impact of new labels on the two variables mentioned above and purchase intention (whether for hedonic or practical products). The mediation effect analysis highlights the key role of ecological value cognition in the process of new label influencing purchase intention.
33Ashrafi et al. 2021[51]BangladeshThis study explores the key factors influencing non-users’ willingness to use carpooling applications from the dual perspectives of perceived value and perceived risk.388 (47%)International Journal of Innovation and Technology Managementnon-studentsonlinePerceived value has a significant positive impact on non-user usage intention, while risk perception presents a negative impact; it is worth noting that risk perception positively moderates the impact of value perception on usage intention.
34Cao et al. 2023[53]ChinaExploring the interactive relationship between food safety concerns, perceived value, perceived risk, and various dimensions of organic food purchasing behavior.353 (39.2%)Frontiers in Sustainable Food Systemsnon-studentsonlineThe research results confirm a significant interaction between perceived value and risk, both of which are related to food safety concerns. At the same time, it was observed that perceived value has a positive and significant impact on purchasing behavior, while perceived risk presents a negative and significant impact.
35Hati et al. 2021[62]IndonesiaThe purpose of this study is to examine the impacts of product knowledge, perceived quality, perceived risk and perceived value on customers’ intention to invest in Islamic Banks.217 (41.9%)Journal of Islamic Marketingnon-studentsofflineThis study highlights the central and dual roles of perceived risk as both the independent and the intervening variable that mediates the relationship between product knowledge and Muslim customer intention to invest in an Islamic bank’s term deposits.
36Lou et al. 2022[67]USAThis study aims to explore how American consumers perceive second-hand luxury goods and the various factors that influence their purchase intention, including economic value, emotional value, social value, quality value, green values, and perceived risk. 340 (59.3%)Sustainabilitynon-studentsonlinePerceived value has a significant positive impact on intention, while risk perception has no impact on intention.
37Sharma et al. 2025[73]IndiaThe current study examines how the perception of negative
consequences or risks interact with hedonic and utilitarian
values in predicting gamers’ continuance intention to play
online games.
201 (54%)Journal of Internet Commercenon-studentsonlineHedonic value positively impacts the continuance intention to play online games, whereas utilitarian value does not significantly impact online gaming behavior. Furthermore, at higher perceived risk levels, hedonic value enhances the online game continuance intention, whereas utilitarian value has insignificant effect. At low perceived risk levels, both hedonic and utilitarian values have significant effect on continuance intentions to play online games.
38Ge 2022[61]ChinaThis study proposes that traceability knowledge, traceability information quality, and traceability certification credibility affect traceable food purchase intention through the mediating effect of perceived risk and perceived value.421 (33.1%)Frontiers in Psychologynon-studentsofflineRisk perception negatively affects perceived value, which in turn positively affects intention, while risk perception negatively affects intention.
39Chen et al. 2024[1]ChinaThis study explores the relationship between risk perception, perceived value, and purchase intention.411 (21.2%)Journal of Theoretical and Applied Electronic Commerce Researchnon-studentsonlineConsumer value perception is positively correlated with intention, while risk perception has a negative impact.
40Zhao and Cao 2025[8]ChinaThis study aims to elucidate the key antecedents that influence residents’ perceived value and purchase intention of green housing.715 (50.6%)Journal of Housing and the Built Environmentnon-studentsofflineSocial benefit perception and performance risk perception only significantly affect perceived value, while financial risk perception and financial incentives only significantly affect purchase intention.
41Zhao and Chen 2021[81]ChinaThis study proposes a comprehensive research model from the perspective of expanding perceived value, integrating residents’ cognition and personal traits to examine the impact mechanism of residents’ willingness to purchase green housing.728 (50.4%)International Journal of Environmental Research and Public Healthnon-studentsofflineThe results reveal that perceived value is a crucial predictor of GH purchase intention. All dimensions of perceived benefits—including perceived functional benefits, perceived emotional benefits, perceived green benefits, and perceived social benefits—have a positive influence on perceived value, while perceived performance risks have a negative influence on perceived value.
42Shashi et al. 2023[6]IndiaThe impact of marketing mix perception on perceived value, risk perception on purchase intention, and circular purchasing behavior for both circular and non-circular consumer groups.1153 (56.3%)Ecological Economicsnon-studentsonlineThe negative effects of perceived risk on perceived value and purchase intention of two groups of consumers.
43Yang et al. 2025[22]ChinaExploring in depth the mechanisms by which key variables such as perceived usefulness, perceived pleasure, perceived cost, perceived risk, and brand credibility affect consumer purchase intention.337 (58.8%)World Electric Vehicle Journalnon-studentsonlineUnlike previous studies, in the current context of advanced autonomous driving technology, perceived risk has no significant impact on perceived value; Perceived value has a significant positive impact on purchase intention.
44Hu et al. 2023[63]ChinaThis study aims to explore the relationship between consumers’ risk perception, benefit perception, and value perception of electric vehicles from the perspective of value perception, as well as their impact on purchase intention.367 (56.8%)Research in Transportation Business and Managementnon-studentsofflineThe impact of risk perception on perceived value varies: personal safety risk and performance risk have a negative impact on perceived value, while financial risk does not show a significant impact. In addition, perceived value has a positive promoting effect on consumer purchase intention, but this promoting effect will weaken due to information overload.
Table 2. Results of meta-analysis.
VariablesModelNumber of StudiesWeighted rPoint Estimate95% CIZ-ValuepQ-ValueI2Fail-Safe N (Nfs 0.05)Results
PV-PIFixed390.4870.508(0.494, 0.521)60.4440.000 802.14796.13516,572sig
Random390.487(0.412, 0.554)11.1650.000 sig
PV-PRFixed21−0.232−0.221(−0.253, −0.190)−13.3250.000 102.5894.151317sig
Random21−0.232(−0.359, −0.096)−3.3110.001 sig
PR-PVFixed26−0.159−0.173(−0.204, −0.142)−10.8120.000 89.29587.681272sig
Random26−0.159(−0.251, −0.064)−3.2610.001 sig
PR-PIFixed34−0.163−0.177(−0.199, −0.153)−14.7370.000 283.68193.302975sig
Random34−0.163(−0.252, −0.072)−3.4730.001 sig
Note: PV: perceived value; PR: risk perception; PI: purchase intention.
Table 3. Results of MASEM.
ModelTotal Sample Sizesdfχ2p-ValueRMSEASRMRCFIAICBIC
Model 1
Fixed352321600.21 0.000 0.04 0.03 0.95 0.04 0.04
Random35231329.98 0.000 0.03 0.04 0.97 0.02 0.03
Model 2
Fixed4013131790.76 0.000 0.27 0.17 0.55 753.54 507.95
Random40131370.40 0.000 0.02 0.20 0.55 30.64 30.64
Model 3
Fixed3849361513.69 0.000 0.19 0.13 0.73 367.89 161.46
Random384923146.57 0.000 0.03 0.04 0.96 0.95 0.96
Table 4. Results of moderator analysis.
VariablesNumber of StudiesWeighted rPoint Estimate95% CIpZ-ValueQ-ValueQwithinQbetweenI2
PV-PI
Year34 −0.0188(−0.049, 0.012)0.229
Geographical region
Africa20.7190.719(0.685, 0.750)0.000 26.4123.808672.065130.08273.741
Asia310.5050.505(0.488, 0.521)0.000 49.825566.98996.473
Europe50.4720.472(0.423, 0.518)0.000 16.4354.48933.175
North America60.4110.411(0.372, 0.450)0.000 18.25696.77895.867
developing320.530.53(0.515, 0.546)0.000 53.713664.462774.53727.61196.840
developed120.4490.449(0.422, 0.476)0.000 28.214110.07591.824
Students or not
non-students390.5330.533(0.518, 0.547)0.000 58.463675.969734.21567.93396.154
students50.3720.372(0.334, 0.410)0.000 17.42158.24593.133
Purchase channel
offline230.4950.495(0.474, 0.515)0.000 39.618394.021799.2052.94295.686
online210.5180.518(0.500, 0.536)0.000 45.682405.18496.792
PV-PR
Year21 −0.0681(−0.117, −0.020)0.006
Geographical region
Africa 63.67838.903
Asia18−0.187−0.187(−0.221, −0.153)0.000 −10.61763.67892.148
Europe-------
North America2−0.49−0.49(−0.253, −0.190)0.000 −10.18500.000
developing18−0.187−0.187(−0.221, −0.153)0.000 −10.61763.67863.67838.90392.148
developed3−0.49−0.49(−0.564, −0.408)0.000 −10.18500.000
Students or not
non-students7−0.221−0.221(−0.253, −0.190)0.000 −13.325102.5865.24626.01394.151
students21−0.221−0.221(−0.253, −0.190)0.000 −13.325102.58
Purchase channel
offline7−0.212−0.212(−0.285, −0.137)0.000 −5.4568.238102.510.0787.862
online19−0.223−0.223(−0.258, −0.188)0.000 −12.15994.27195.757
PR-PV
Year26 −0.0357(−0.063, −0.008)0.011
Geographical region
Africa2−0.199−0.199(−0.268, −0.128)0.000 −5.4284.26740.63848.65776.565
Asia17−0.04−0.04(−0.243, −0.164)0.000 −9.7944.1082.619
Europe50.0190.019(−0.054, 0.092)0.605 0.51732.26490.702
North America2−0.51−0.51(−0.51, −0.628)0.000 −6.31700.000
developing19−0.203−0.203(−0.237, −0.168)0.000 −11.1978.38676.93512.36128.453
developed7−0.068−0.068(−0.135, −0.000)0.049 −1.9768.54994.165
Students or not
non-students24−0.176−0.176(−0.208, −0.142)0.000 −10.21889.08989.1430.14389.898
students2−0.158−0.158(−0.242, −0.071)0.000 −3.5550.0630.000
Purchase channel
offline14−0.179−0.179(−0.219, −0.138)0.000 8.47874.91589.1090.18789.321
online12−0.298−0.298(−0.212, −0.118)0.000 −6.72414.19385.909
PR-PI
Year34 −0.0243(−0.059, −0.11)0.175
Geographical region
Africa 274.339.351
Asia26−0.178−0.178(−0.204, −0.151)0.000 −12.761566.98993.020
Europe3−0.042−0.042(−0.138, 0.056)0.005 −0.8394.48987.084
North America5−0.211−0.211(−0.261, −0.160)0.000 −7.93596.77896.265
developing25−0.132−0.132(−0.161, −0.103)0.000 −8.819108.252257.45626.22588.915
developed9−0.257−0.257(−0.193, −0.219)0.000 −12.87149.20495.979
Students or not
non-students31−0.181−0.181(−0.206, −0.156)0.000 −14.007272.853282.7140.96794.136
students3−0.148−0.148(−0.209, −0.087)0.000 −4.6839.8679.717
Purchase channel
offline16−0.204−0.204(−0.240, −0.167)0.000 −10.739159.774280.0773.60493.741
online18−0.158−0.158(−0.188, −0.129)0.000 −10.268120.30393.350
Disclaimer/Publisher’s Note: The statements, opinions and data contained in all publications are solely those of the individual author(s) and contributor(s) and not of MDPI and/or the editor(s). MDPI and/or the editor(s) disclaim responsibility for any injury to people or property resulting from any ideas, methods, instructions or products referred to in the content.