Article

How Digital Technological Innovation Influences the Coordination Between Urban Renewal and Ecological Resilience: Evidence from China’s Yangtze River Economic Belt


1
Business School, Xinyang Normal University, Xinyang 464000, China
2
Henan Scientific Research Platforms Service Center, Zhengzhou 450003, China
3
Institute of Economics, Henan Academy of Social Sciences, Zhengzhou 450000, China
*
Author to whom correspondence should be addressed.
Sustainability 2026, 18(12), 6322; https://doi.org/10.3390/su18126322
Submission received: 25 May 2026 / Revised: 16 June 2026 / Accepted: 17 June 2026 / Published: 19 June 2026
(This article belongs to the Special Issue Adapting Cities: Ecological Resilience and Urban Renewal)

Abstract

The coordinated development of urban renewal (UR) and ecological resilience (ER) is essential for regional sustainability and livable city construction. Based on data from 108 cities in the Yangtze River Economic Belt (YREB) during 2012–2023, this study constructs the UR indicator system from the dimensions of urban infrastructure construction, social function development, and cultural and leisure facility construction. ER is evaluated in terms of resistance, adaptability, and recoverability. The spatiotemporal evolution of their coupling coordination degree (CCD) is then examined. In addition, the XGBoost-SHAP model is employed to identify the threshold of digital technological innovation (DTI) on CCD and its interactions with different development conditions. The results show that (1) CCD remained relatively low but improved slowly during the study period. UR lagged behind ER in most cities, indicating that insufficient UR development capacity was the main constraint on coordination between the two systems. (2) CCD exhibited a pronounced core–periphery pattern, with high-value areas mainly concentrated in provincial capitals and centrally administered municipalities within the YREB. (3) DTI was positively associated with CCD and exhibited a nonlinear pattern with a model-derived turning point, while the strength and pattern of this association varied across different development contexts. These findings enrich the understanding of UR-ER coordination and offer policy implications for sustainable urban governance.

1. Introduction

Rapid urbanization has fundamentally reshaped the relationship between human societies and natural ecosystems, generating unprecedented pressures on urban sustainability [1]. In China, the pace of urban expansion has been particularly dramatic: driven by sustained rural-to-urban migration over the past four decades, China’s urbanization rate had exceeded 66% by 2023 [2]. While this transformation has underpinned remarkable economic growth, it has simultaneously precipitated a cascade of compounding urban challenges—aging and deteriorating infrastructure, socio-spatial fragmentation, environmental degradation, and heightened vulnerability to climate-related hazards [3,4,5]. Against this backdrop, urban renewal (UR) and ecological resilience (ER) have emerged as two pivotal yet insufficiently integrated imperatives in China’s urban governance agenda [6].
UR originated in the United States as a policy response to slums, urban decay, and the need for inner-city redevelopment [7]. Over time, its meaning has expanded from physical demolition and reconstruction to a broader agenda of urban improvement, incorporating residents’ quality of life, social inclusion, and cultural continuity as objectives comparable to physical upgrading [8,9,10]. China’s 14th Five-Year Plan positioned UR as a key national strategic agenda, followed by a series of more comprehensive policy requirements that underscore people-centered and sustainable urban development [11]. The level of UR has been assessed using various approaches. Wang et al. used GIS to evaluate UR in Changsha across economic, social, environmental, spatial, and land-use dimensions, and combined this assessment with machine learning to predict land-use change in 2030 [12]. Ye et al. employed questionnaire surveys to evaluate how UR projects affected residents’ quality of life in five redeveloped communities in Guangzhou [13]. Li et al. developed multidimensional indicator systems covering urban, facility, ecological, and cultural aspects, and used a DID model to test the effect of smart city construction on UR performance [14].
Concurrently, ER, referring to the capacity of ecosystems to maintain core structures and functions, adapt to external changes, and recover or reorganize after disturbances, has become increasingly important under rising global climate risks [15,16,17]. The Yangtze River Economic Belt (YREB), which covers ecologically sensitive watershed systems and contributes approximately 46% of China’s economic output, has therefore attracted substantial scholarly attention. Prior studies have assessed ER in the urban agglomeration located in the middle reaches of the YREB using indicator systems based on resistance, adaptability, and recoverability [18]. Using an environmental–social coupling framework, Wang and Ge analyzed ER in the Yangtze River Delta and examined its spatial associations [19]. Moreover, a growing body of research has further examined the contribution of green technological innovation, environmental regulation, and landscape configuration to ER [20,21,22].
However, a critical gap remains: UR and ER have rarely been examined as an integrated and synergistic system. The dynamic coupling between physical–social urban transformation and ecological adaptive capacity remains underexplored. In urban systems, land development intensity, green-space patterns, and infrastructure quality directly influence ER, while also constituting key domains of UR [23,24,25]. ER, in turn, may shape the direction and intensity of renewal by determining whether spatial upgrading can be achieved without compromising ecological security and sustainability [26,27]. To capture such interactions, recent studies have increasingly used the coupling coordination degree model (CCDM) to measure the coordinated evolution of socio-ecological subsystems, with applications extending to urbanization–environment interactions, economy–environment relationships, and broader socio-ecological systems [28,29,30].
Digital technological innovation (DTI) has become an important technological force in urban governance and sustainability transitions. Such innovation provides the technical foundation for the diffusion and application of digital tools in urban planning and governance. Existing studies have shown that DTI has reshaped the ways cities are planned, managed, and experienced [31,32], while also creating additional value for urban governance [33,34]. Digital tools derived from DTI, including digital twins, geographic information systems, and machine learning, can support sustainable UR [35,36,37]. Moreover, by improving information-processing efficiency, optimizing resource allocation, and enhancing interactions among governance actors and stakeholders, innovative digital applications can further promote urban development and renewal [38]. From the perspective of urban ecological governance and resilience, digital technologies can enhance ecological monitoring, pollution control, and risk early warning, thereby improving ecosystem stability and resilience [39,40].
In summary, several limitations remain in the existing literature. First, although methods for measuring UR have been progressively enriched, approaches based on GIS or land-use data mainly emphasize physical spatial restructuring and changes in the built environment, making it difficult to incorporate non-physical dimensions such as public service provision and social governance. Survey-based approaches are better able to reflect the people-centered orientation of UR, yet their case-specific nature limits the external validity of their findings. While conventional econometric models can identify policy impacts, they have limited capacity to reveal complex nonlinear relationships arising from the joint influence of multiple factors. Second, current research on DTI has primarily investigated its effects on isolated systems. However, limited attention has been paid to the association between DTI and UR–ER coordination, especially its nonlinear characteristics, indicative transition points, and interactions across different development contexts.
Therefore, this study focuses on the YREB and employs a two-stage entropy method to assess UR and ER development during 2012–2023. On this basis, a modified CCDM, together with kernel density estimation (KDE), is adopted to examine the coupling coordination degree (CCD) of the two systems and its dynamic evolution. Furthermore, this study applies an XGBoost-SHAP framework to identify the nonlinear impacts of DTI on CCD. This study makes several contributions: (1) It develops a people-centered assessment framework for UR based on infrastructure construction, social function development, and cultural and leisure facility construction. This framework integrates physical and non-physical dimensions, thereby capturing UR more comprehensively. (2) This study integrates UR and ER into a common analytical framework and systematically evaluates their coupling coordination relationship. In doing so, it extends UR research toward ecological sustainability and enriches ER research from the perspective of urban governance. (3) By combining the predictive strength of XGBoost with the interpretability of SHAP, this study identifies the nonlinear association, turning point, and context-dependent interaction patterns between DTI and CCD, thereby providing insights for livable, resilient, and sustainable urban development.
The rest of this paper is organized as follows. Section 2 presents the theoretical analysis and research hypotheses; Section 3 describes the study area, methodology, indicators, and data sources; Section 4 reports the empirical results; Section 5 discusses the findings and research limitations; Section 6 concludes with policy implications. The research framework of this study is shown in Figure 1.

2. Theoretical Analysis and Research Hypothesis

Digital technologies are characterized by general applicability and innovation complementarity, enabling them to diffuse into fields such as construction, transportation, energy, environmental governance, and public services, thereby providing a common technological foundation for UR and ER [41]. The application of digital technologies in UR has expanded across different stages of the renewal process. Digital tools can support spatial diagnosis, scenario analysis, performance-based planning, stakeholder engagement, and the implementation and evaluation of renewal actions [42,43]. In ER building, urban digital twins and sensing technologies can integrate hazard, infrastructure, environmental, and social information to support situational awareness, risk-informed decision-making, community adaptation planning, and disaster management [44,45,46]. DTI may therefore reduce information barriers between UR and ecological governance and improve the alignment between renewal needs and ecological constraints. Accordingly, the following hypothesis is proposed:
H1. 
DTI is positively associated with the CCD between UR and ER.
DTI does not automatically translate from knowledge production into urban-governance performance. Absorptive capacity theory suggests that the ability to recognize, assimilate, and apply new knowledge depends on the accumulation of prior knowledge and exhibits path dependence [47]. At low levels of DTI, technological knowledge may remain fragmented, while its application may be constrained by insufficient complementary assets, implementation capabilities, and skilled personnel [48,49]. As innovation accumulates to a certain scale, knowledge diffusion, technological complementarities, and application networks may gradually develop, thereby substantially strengthening the contribution of digital technologies to the coordination between UR and ER. Accordingly, the following hypothesis is proposed:
H2. 
The impact of DTI on CCD is nonlinear and exhibits a threshold effect.
Moreover, the effectiveness of DTI is influenced by multiple factors. Differences in cities’ levels of economic development and urban structures affect the scope of adoption and implementation pathways of urban digital innovation technologies [50]. Existing studies indicate that the effective application of digital technologies requires multiple complementary conditions, including social, economic, infrastructural, and governance capacities [51,52]. Accordingly, the following hypothesis is proposed:
H3. 
The impact of DTI on CCD is heterogeneous across different development contexts.

3. Materials and Methods

3.1. Study Area

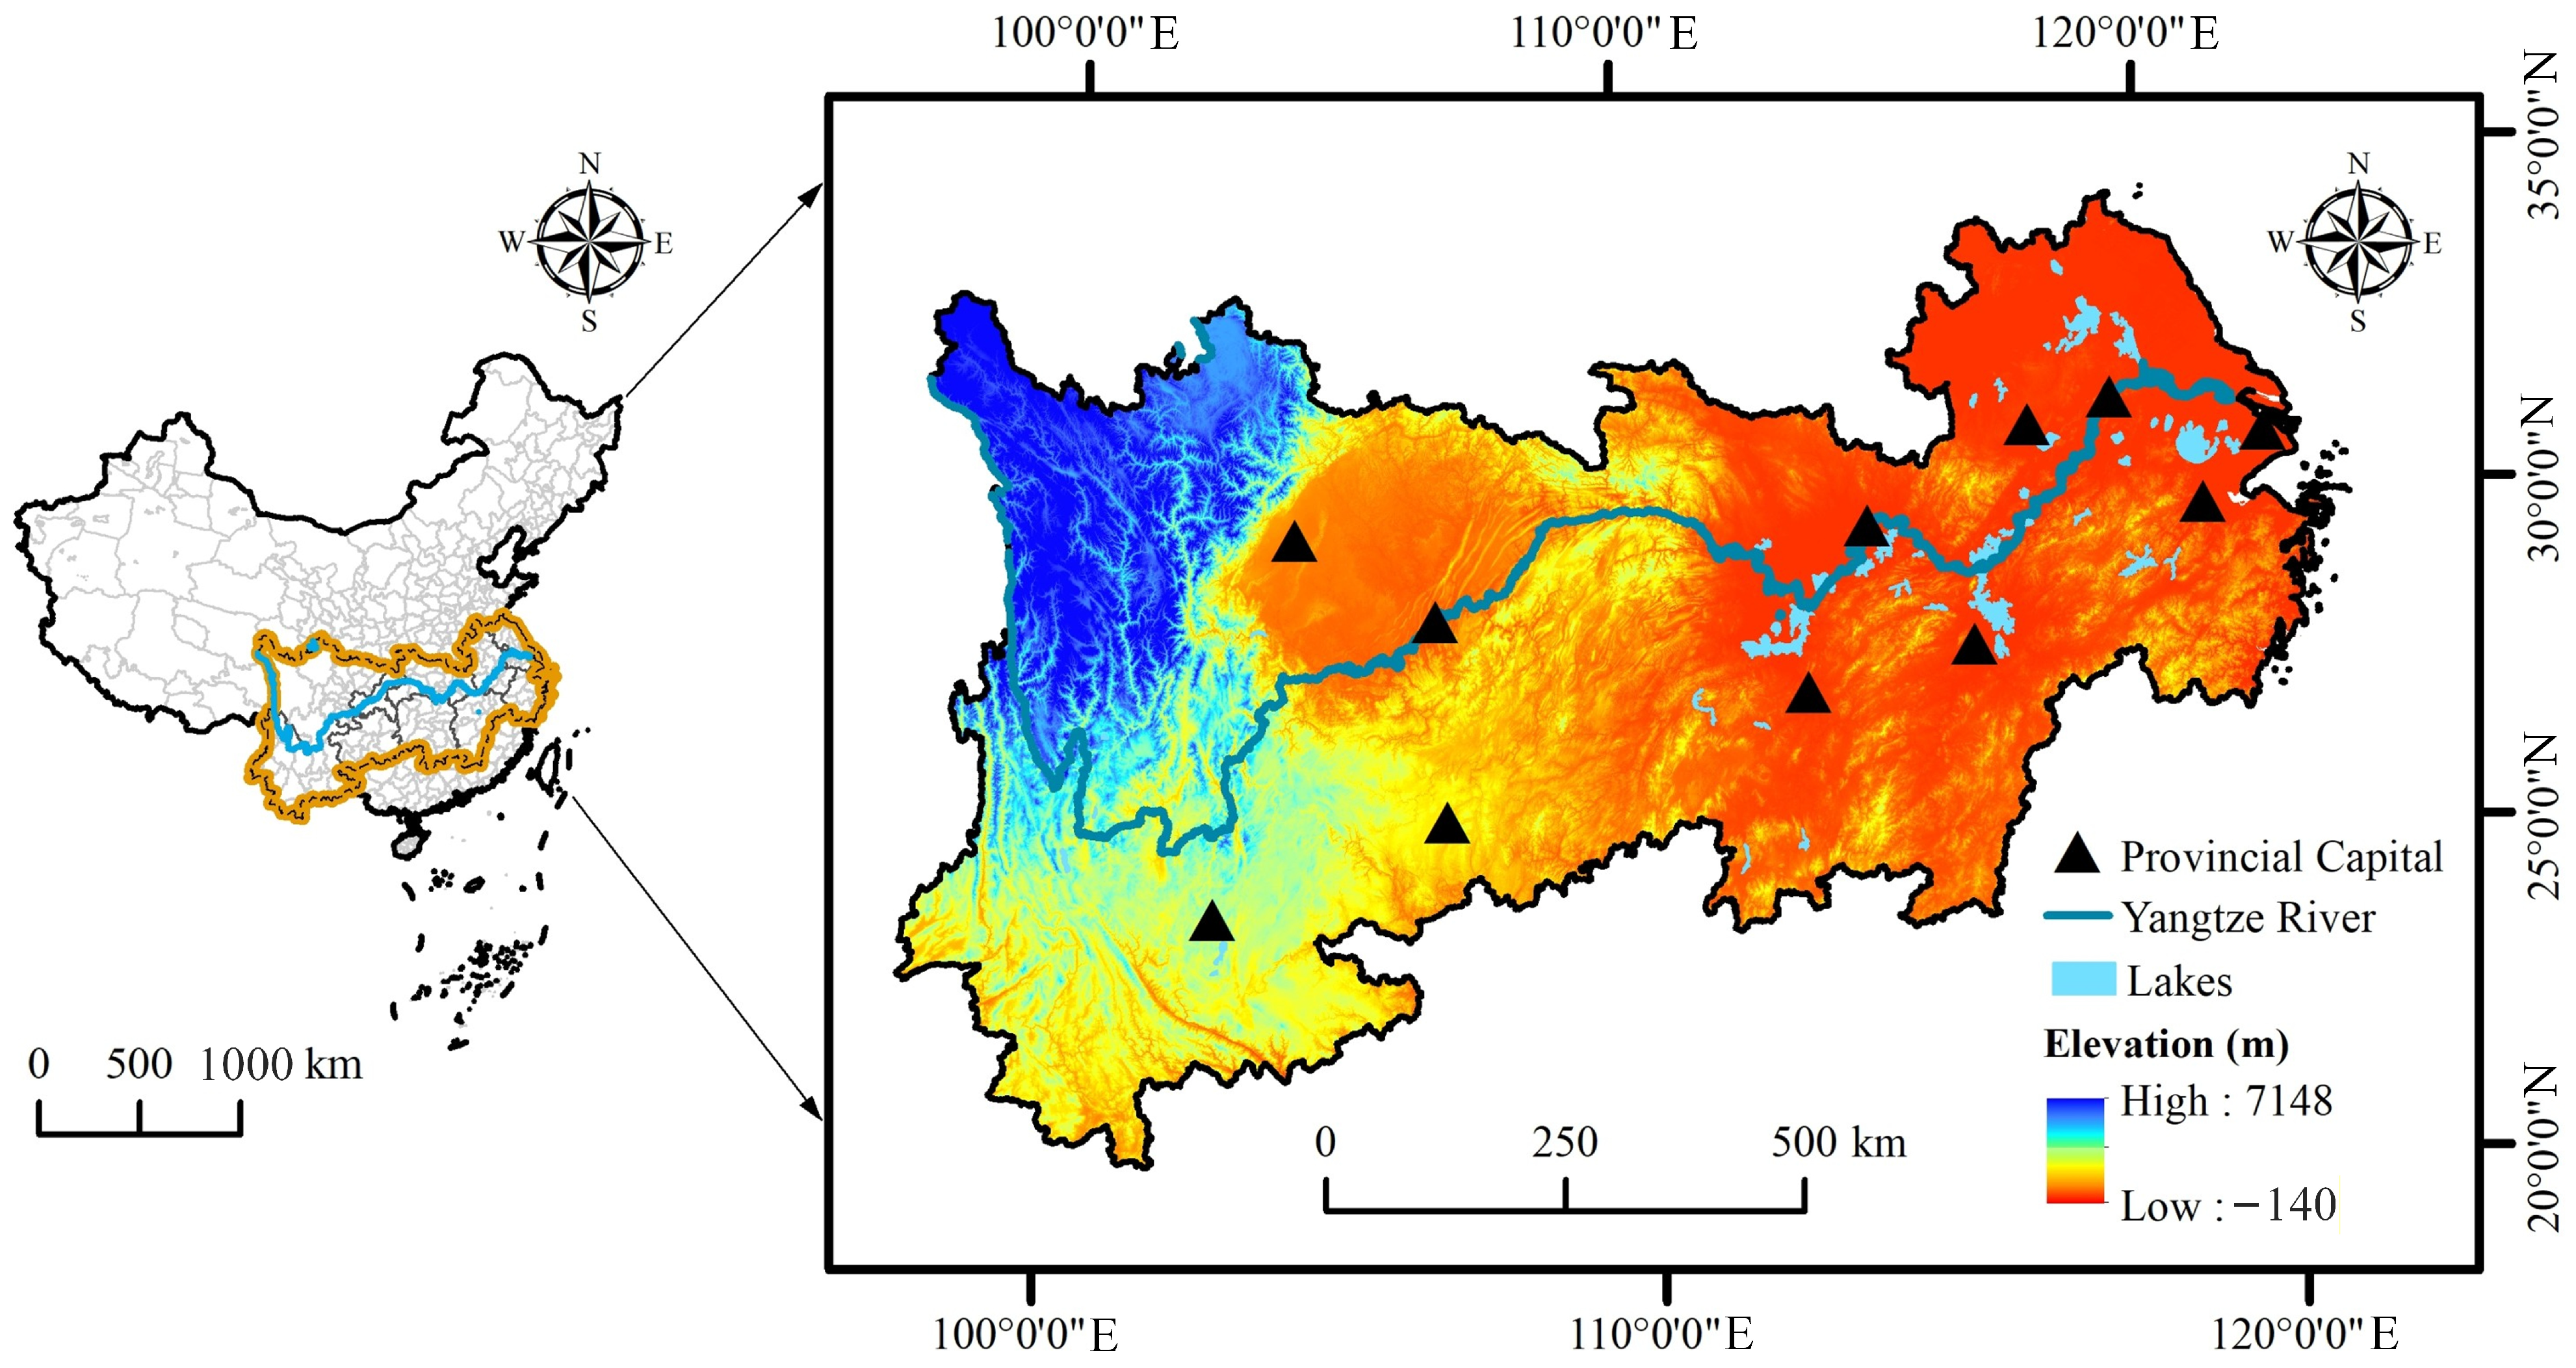
The YREB extends across eastern, central, and western China (Figure 2). With its vast territorial span, dense population, large economic scale, and ecological importance, it represents one of China’s most significant cross-regional development belts. The YREB connects China’s eastern coastal areas with its central and western hinterlands, making it strategically important for coordinated regional development and a crucial carrier for regional integration and ecological civilization construction [53]. All maps presented in this study were produced using ArcMap 10.8 software.

3.2. Methods

3.2.1. Two-Stage Entropy Method

Given its ability to objectively evaluate multidimensional and hierarchical indicator systems, the two-stage entropy method is adopted in this study to measure the development levels of UR and ER in the YREB [54,55]. The entropy values for UR and ER were calculated using StataMP 17 software. The formulas are as follows:
Step 1: Data standardization. Equations (1) and (2) represent the standardization of positive and negative indicators, respectively. Where x ijk denotes the raw data, i represents the prefecture-level city, j denotes the measurement indicator, and k represents the measurement dimension ( i   =   1 ,   2 ,   ,   m ;   j   =   1 ,   2 ,   ,   n ;   k   =   1 ,   2 ,   ,   h ) .
y ijk = x ijk min ( x ijk ) max ( x ijk ) min ( x ijk )
y ijk = max ( x ijk ) x ijk max ( x ijk ) min ( x ijk )
Step 2: Calculate the proportion of the j - th indicator for the i - th prefecture-level city within the k - th dimension:
p ijk = y ijk / i = 0 m y ijk
Step 3: The entropy value for each indicator is computed.
Calculate the entropy value e   jk of the j - th indicator within the k - th dimension:
e   jk = 1 ln m i   = 1 m p ijk ln ( p ijk )
Calculate the proportion g   ik of the indicators within the k - th dimension for the i - th prefecture-level city:
g   ik = j = 1 n 1 e   jk j = 1 n e   ik p ijk i   = 1 m j   = 1 n 1 e   jk j   = 1 n e   i k p ijk
Calculate the weighted entropy value e k of dimension k :
e   k = 1 ln m i   = 1 m g   ik ln ( g   ik )
Step 4: Calculate the comprehensive evaluation index. UR   i and ER   i denote the development levels of UR and ER for city i , respectively, calculated using the original data of the two systems.
UR   i = k   = 1 h 1 e   k k = 1 h e   k g   ik
ER   i = k = 1 h 1 e k k = 1 h e k g   ik

3.2.2. Modified CCDM

In the conventional CCDM, the C value is prone to uneven distribution, which may simplify the derived coordination degree and weaken its ability to distinguish differences in coordinated development across units. Accordingly, a modified CCDM is adopted to quantify the CCD of UR and ER in the YREB [56,57]. The formulas are as follows:
C   i = 2   1 U   2 U   1 2 × U   1 U   2
T   i = α U   1 + β U   2
D   i = C   i × T   i
where for city i , U   1 is defined as the smaller of UR   i and ER   i , while U   2 is defined as the larger of the two values; C   i represents the coupling degree between UR and ER; T   i is the coordination index of the two systems; α and β are importance coefficients. Given that UR and ER are considered equally important, this study sets α   =   β   = 0.5 . D   i denotes the CCD between UR and ER.
Based on previous research [58], the classification criteria for the CCD are presented in Table 1.

3.2.3. KDE

To further characterize the distributional evolution of the CCD between UR and ER in the YREB, this study employs KDE to estimate CCD across different years and subregions. In this study, MATLAB R2023b software was used to generate the kernel density plots. The formula is as follows [59]:
F ( x ) = 1 qh i   = 1 q K   X i x h
  K ( x ) = 1 2 π e ( 1 2   x 2 )
where F ( x ) denotes the probability density function of the random variable X ; x is the evaluation point; q is the number of observations; h is the bandwidth; and K ( x ) is the kernel function.

3.2.4. XGBoost-SHAP Model

Extreme Gradient Boosting (XGBoost) is an ensemble learning method based on gradient-boosted decision trees. Its core advantage lies in iteratively integrating multiple decision trees and continuously fitting the residuals from previous rounds, thereby improving model performance [60,61]. XGBoost has notable advantages in capturing complex nonlinear relationships, improving predictive accuracy, and enhancing model robustness. On the one hand, its gradient-boosting-based iterative mechanism progressively reduces prediction errors. On the other hand, optimizations in split-node search, missing-value handling, and parallel computation enable the model to maintain strong predictive performance when dealing with high-dimensional data and complex feature structures. The objective function is
  O b j e c t = 1 2 L r   S r 2 M r + θ + λ L
where L is the number of leaf nodes in the tree; S r and M r denote the sums of the first- and second-order partial derivatives, respectively, for the samples assigned to leaf node r ;   θ is a fixed coefficient; and λ is the complexity parameter.
Building on the XGBoost model, this study further employs the SHAP approach to explain the model outputs. SHAP provides a visual and quantitative interpretation of the contribution of each explanatory variable to the predicted results, including its relative importance, direction of influence, and nonlinear response patterns. This method enhances the clarity and explainability of complex machine learning models [62]. The expression is given as follows:
  S t   = S     P   t H   !   p H   1 ! p ! f H   t f H
where S t denotes the contribution of feature t ;   H is a subset of features; P is the full feature set; f H   t and f H are the model predictions with and without feature t . In this study, PyCharm 2025.2.2 was used for XGBoost model training and SHAP-based visual interpretation.

3.3. Indicator Selection and Data Sources

3.3.1. Indicator System

Against the backdrop of China’s urban development shifting from incremental expansion to the quality enhancement of existing urban areas, UR is no longer limited to demolition and reconstruction. Its focus has shifted from the simple addition of new construction to the revitalization, optimization, and reorganization of existing spaces, facilities, and service resources [11]. The 15th Five-Year Plan for Urban Renewal issued by the State Council of China defines UR as a systematic undertaking whose major tasks include cultivating new drivers of urban development, creating high-quality urban living spaces, promoting green and low-carbon transformation, enhancing urban safety and resilience, fostering urban cultural prosperity, and improving urban governance capacity, with the goal of making cities spaces that support a high-quality life for the public [63]. Based on this practical logic, this study does not interpret UR merely as demolition and reconstruction or urban expansion. Instead, it defines UR as a city’s comprehensive development capacity to continuously optimize existing urban assets, improve urban functions, and enhance urban quality by drawing on established built-up spaces, infrastructure, public services, and cultural and leisure resources. Around this evaluation object, and with reference to relevant studies [64], this study constructs an UR indicator system from three dimensions: urban infrastructure construction, social function development, and cultural and leisure facility construction, with the aim of systematically measuring UR development capacity.
ER is conceptualized in accordance with the intrinsic logic of ecosystem responses to external disturbances and is assessed through three dimensions: resistance, adaptability, and recoverability [65]. Resistance denotes the ability to withstand environmental pressure and pollution shocks; adaptability refers to the capacity for adjustment, optimization, and response to change; and recoverability reflects the ability to restore, reorganize, and evolve after damage. These dimensions jointly capture the level of urban ER.
The construction of the UR indicator system was primarily based on previous studies [64,66], while the dimensional framework and indicator selection for ER were also developed with reference to the relevant literature [64,65,67,68]. The specific indicator system is presented in Table 2. Table A1 and Table A2 in Appendix A report the descriptive statistics for the individual UR and ER indicators, respectively.

3.3.2. Core Explanatory Variable

This study uses DTI as the explanatory variable and measures it by the number of granted digital-economy-related patents [69]. Granted patents are technological outputs that have been examined by the relevant patent authority and awarded legal protection, and they can therefore serve as observable indicators of inventive activity and technological knowledge production. Following previous studies [70], digital-technology-related patent grants were identified based on the Classification System for Key Digital Technology Patents (2023) [71]. Specifically, the relevant digital technology fields were determined according to the classification system, and patent records were downloaded from the China National Intellectual Property Administration using the corresponding International Patent Classification (IPC) codes. Granted digital technology patents were then screened and assigned to the city level based on their geographical information.

3.3.3. Control Variables

To mitigate potential omitted-variable bias, this study includes the following control variables. (1) Economic development (ECO) is proxied by GDP per capita, as a stable economic foundation is essential for sustainable urban development [72]. (2) Population density (POP) is calculated as population divided by land area; while population agglomeration facilitates the concentration of resources and factors, excessive agglomeration may increase environmental pressure and ecological burdens [73,74]. (3) Public transportation (TRANS) is measured by the number of public buses and trolleybuses per 10,000 people, reflecting both infrastructure provision and green development [75]. (4) Opening-up (OPEN) is measured by total exports as a share of GDP, which may promote capital flows and technology diffusion but also increase resource consumption and environmental pressure [76,77]. (5) Industrial co-agglomeration (IND) is measured using the industrial co-agglomeration index, as stronger co-agglomeration can generate economies of scale and support green industrial transformation [78]. (6) Financial development (FIN) is proxied by the ratio of outstanding deposits and loans of regional financial institutions to GDP, representing the financial support available for UR implementation [79]. (7) Government intervention (GOV) is measured by fiscal expenditure as a share of GDP, reflecting government involvement in resource allocation, public investment, and policy guidance [80].

3.3.4. Data Sources

The data employed in this study were compiled from multiple sources, including the China Urban Construction Statistical Yearbook, the China City Statistical Yearbook, municipal statistical yearbooks of cities and official government bulletins in the YREB. Data on star-rated hotels were retrieved from local statistical bureaus, and the proportion of days with good air quality was obtained from the China Weather Network. The measurement of industrial co-agglomeration follows the approach adopted in previous research [81]. Following the procedures adopted in previous studies, green patent data [82] and granted digital-economy-related patents data were obtained from the China National Intellectual Property Administration. Table A3 in Appendix A reports the descriptive statistics for the key variables UR, ER, CCD, and DTI.

4. Results

4.1. Spatiotemporal Evolution of UR

4.1.1. Temporal Characteristics of UR

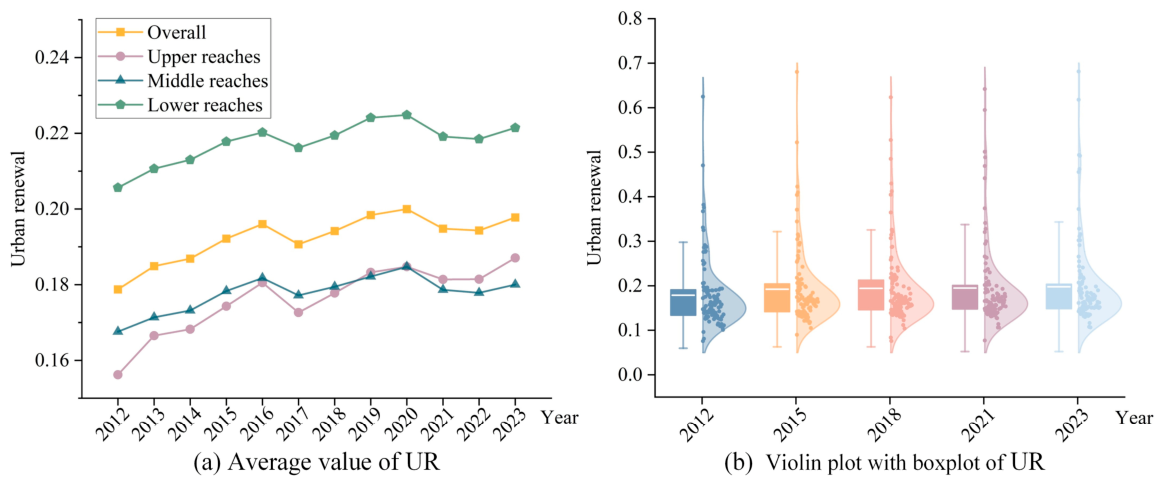
Figure 3a indicates that UR in the YREB displayed an overall upward trajectory, and its mean value increased from 0.1788 to 0.1978. This suggests that UR progressed relatively slowly over the study period. Regionally, the downstream region remained the leading area, while the middle reaches outperformed the upstream region before 2018 but lagged behind thereafter. Figure 3b presents the distributional characteristics of UR. At the city level, faster improvements were mainly observed in cities with relatively high UR levels, such as Shanghai, Nanjing, Hangzhou, Wuhan, Chongqing, and Chengdu, while most other prefecture-level cities experienced only modest increases.

4.1.2. Spatial Distribution of UR

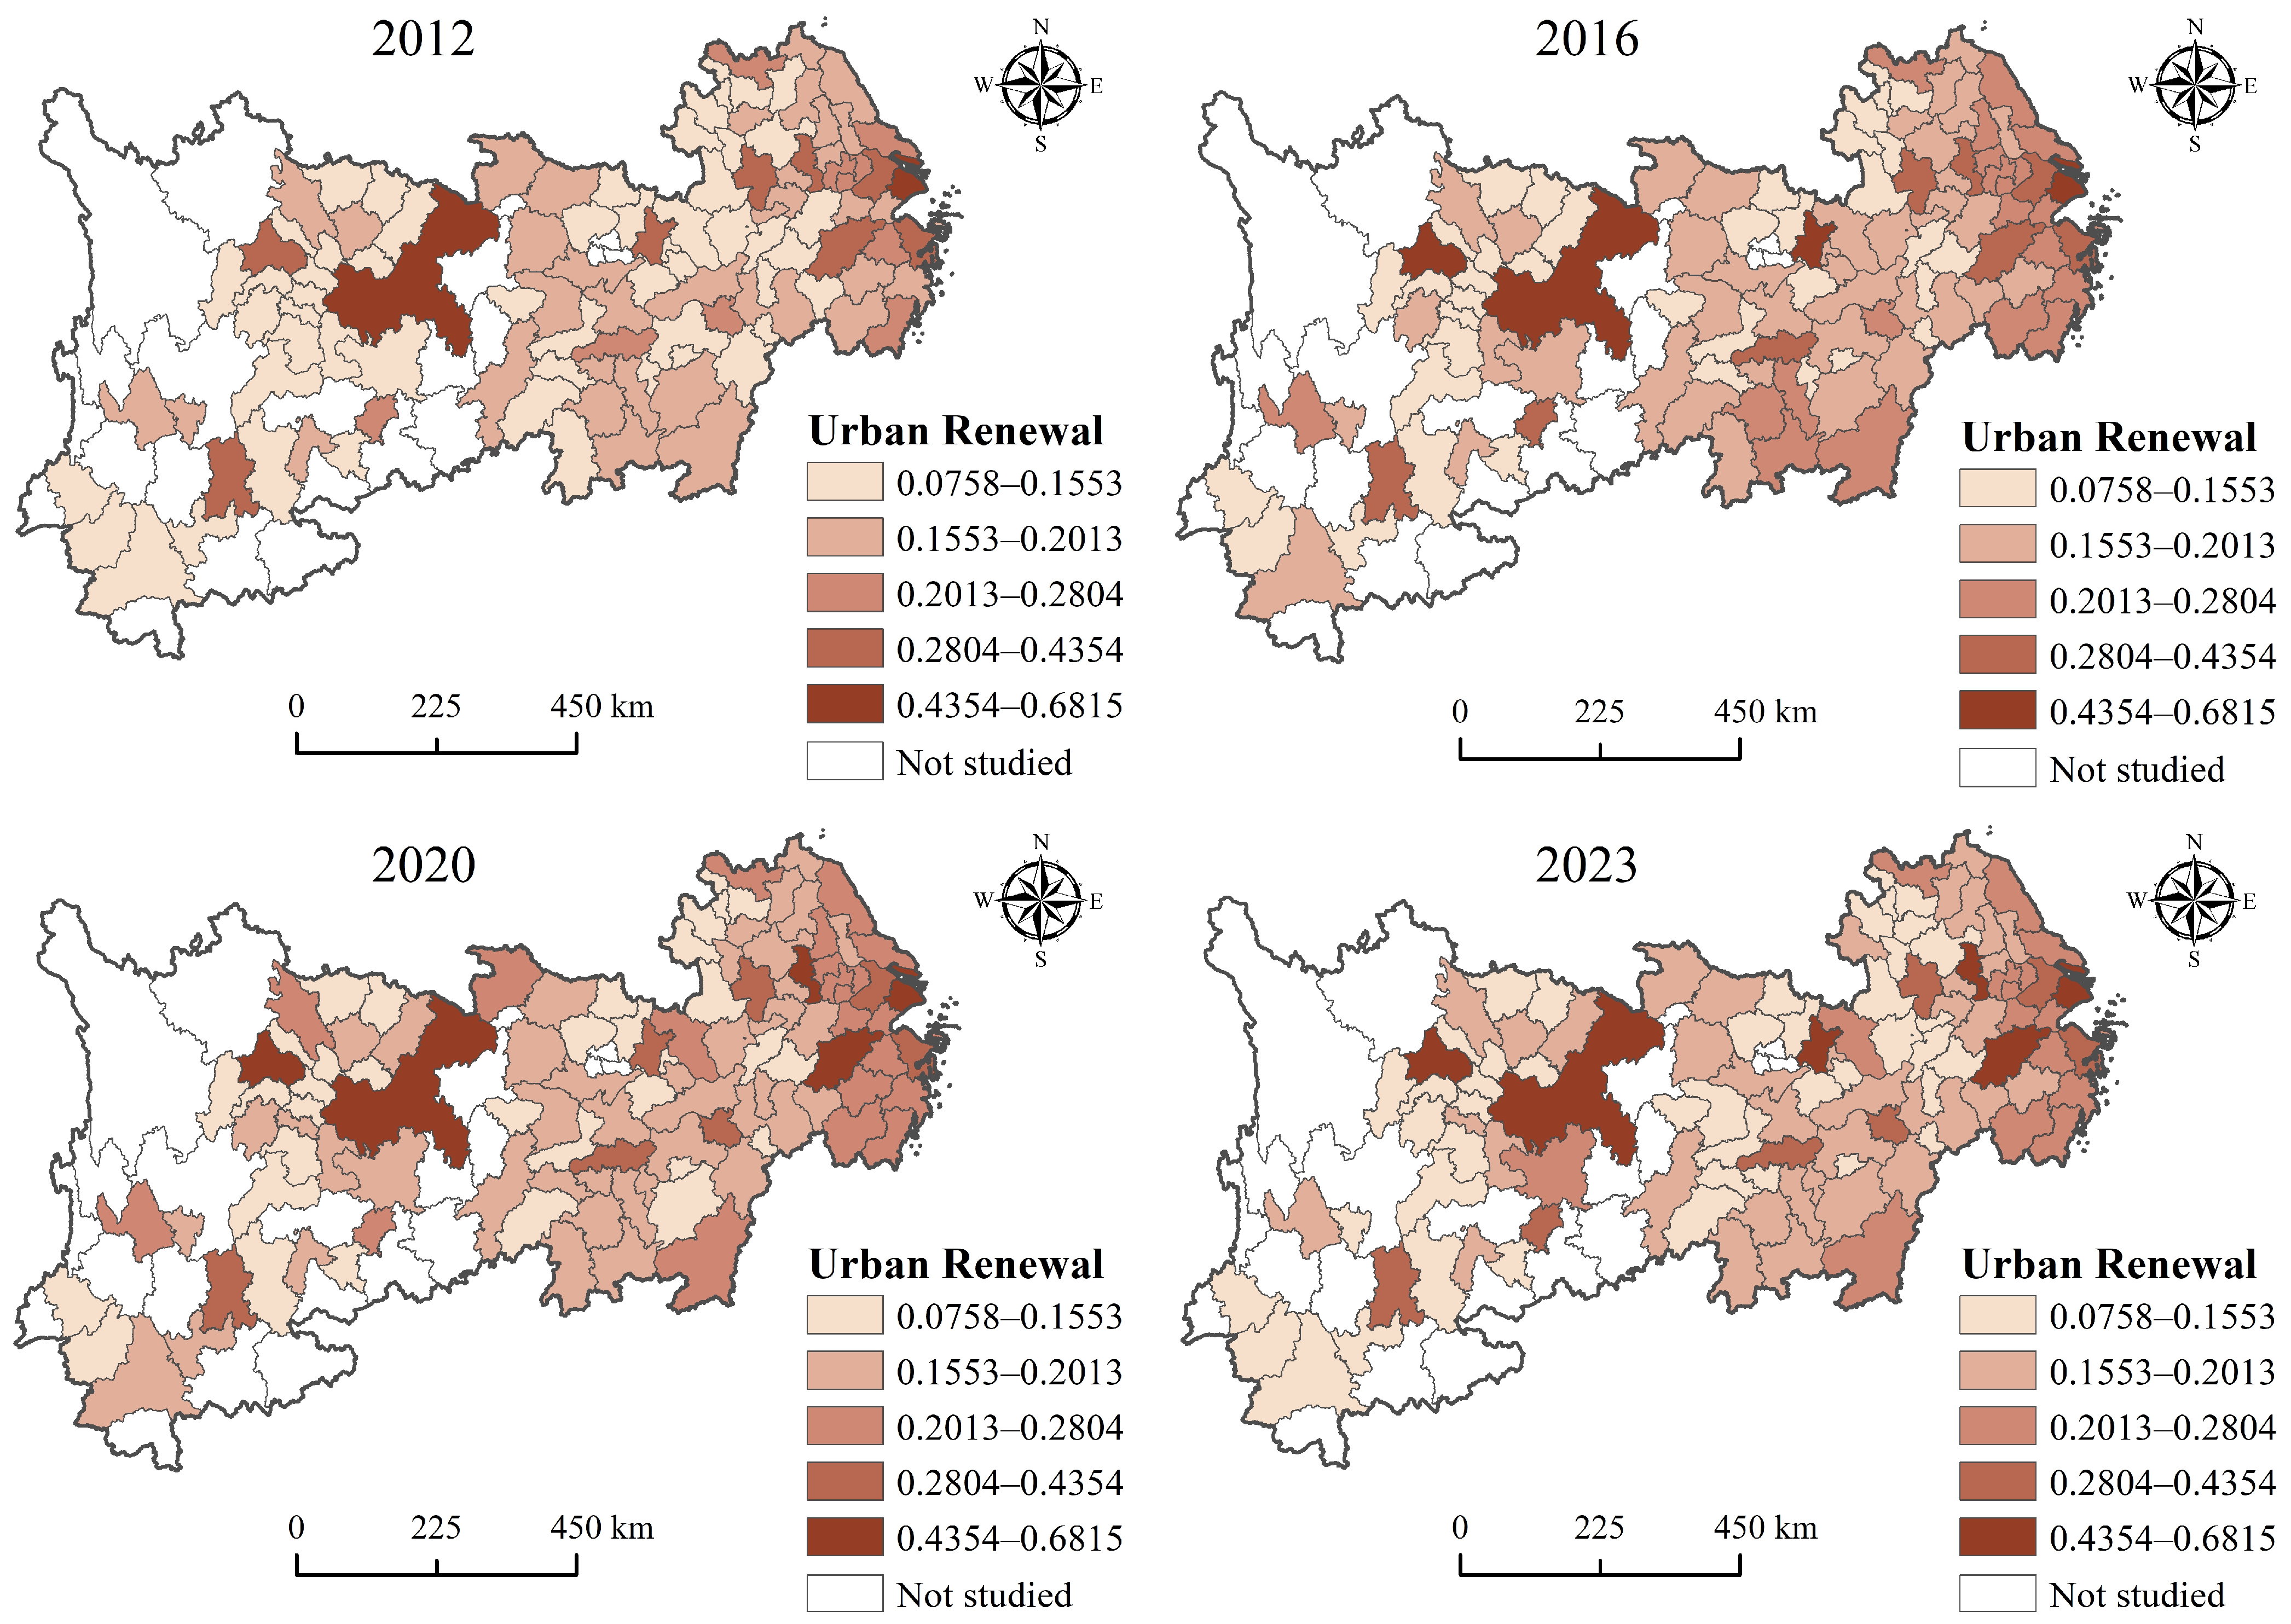
As shown in Figure 4, UR in the YREB displays marked spatial unevenness and a clear core–periphery structure. High-level UR areas were mainly concentrated in provincial capitals and municipalities, while low-level areas were mostly located in non-core cities and upstream peripheral regions. Over time, high-value areas expanded from scattered points to more clustered spatial patterns, indicating stronger spatial spillover and diffusion effects. However, from 2020 to 2023, this trend weakened, and some non-core cities experienced declines in UR levels. As a result, the regional imbalance in UR remained largely unchanged.

4.2. Spatiotemporal Evolution of ER

4.2.1. Temporal Characteristics of ER

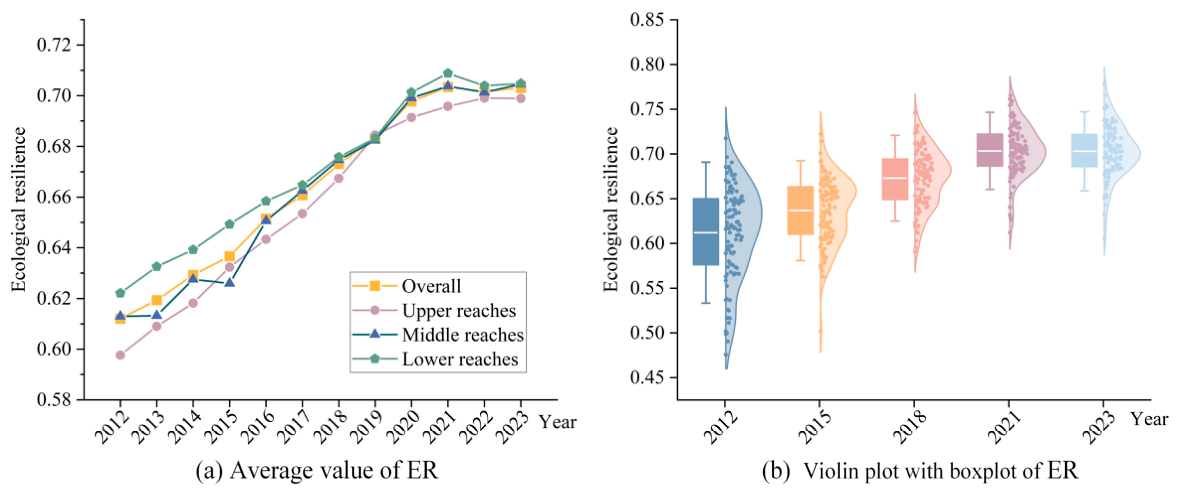
As shown in Figure 5, ER in the YREB increased markedly during 2012–2023, with the mean value rising from 0.6120 to 0.7030. This indicates that the regional ecosystem has continuously strengthened its capacity to cope with disturbances and recover from shocks. At the subregional level, the gaps in ER among the three subregions have continued to narrow. These results indicate that ecological protection and green development strategies have effectively strengthened ER across the YREB.

4.2.2. Spatial Distribution of ER

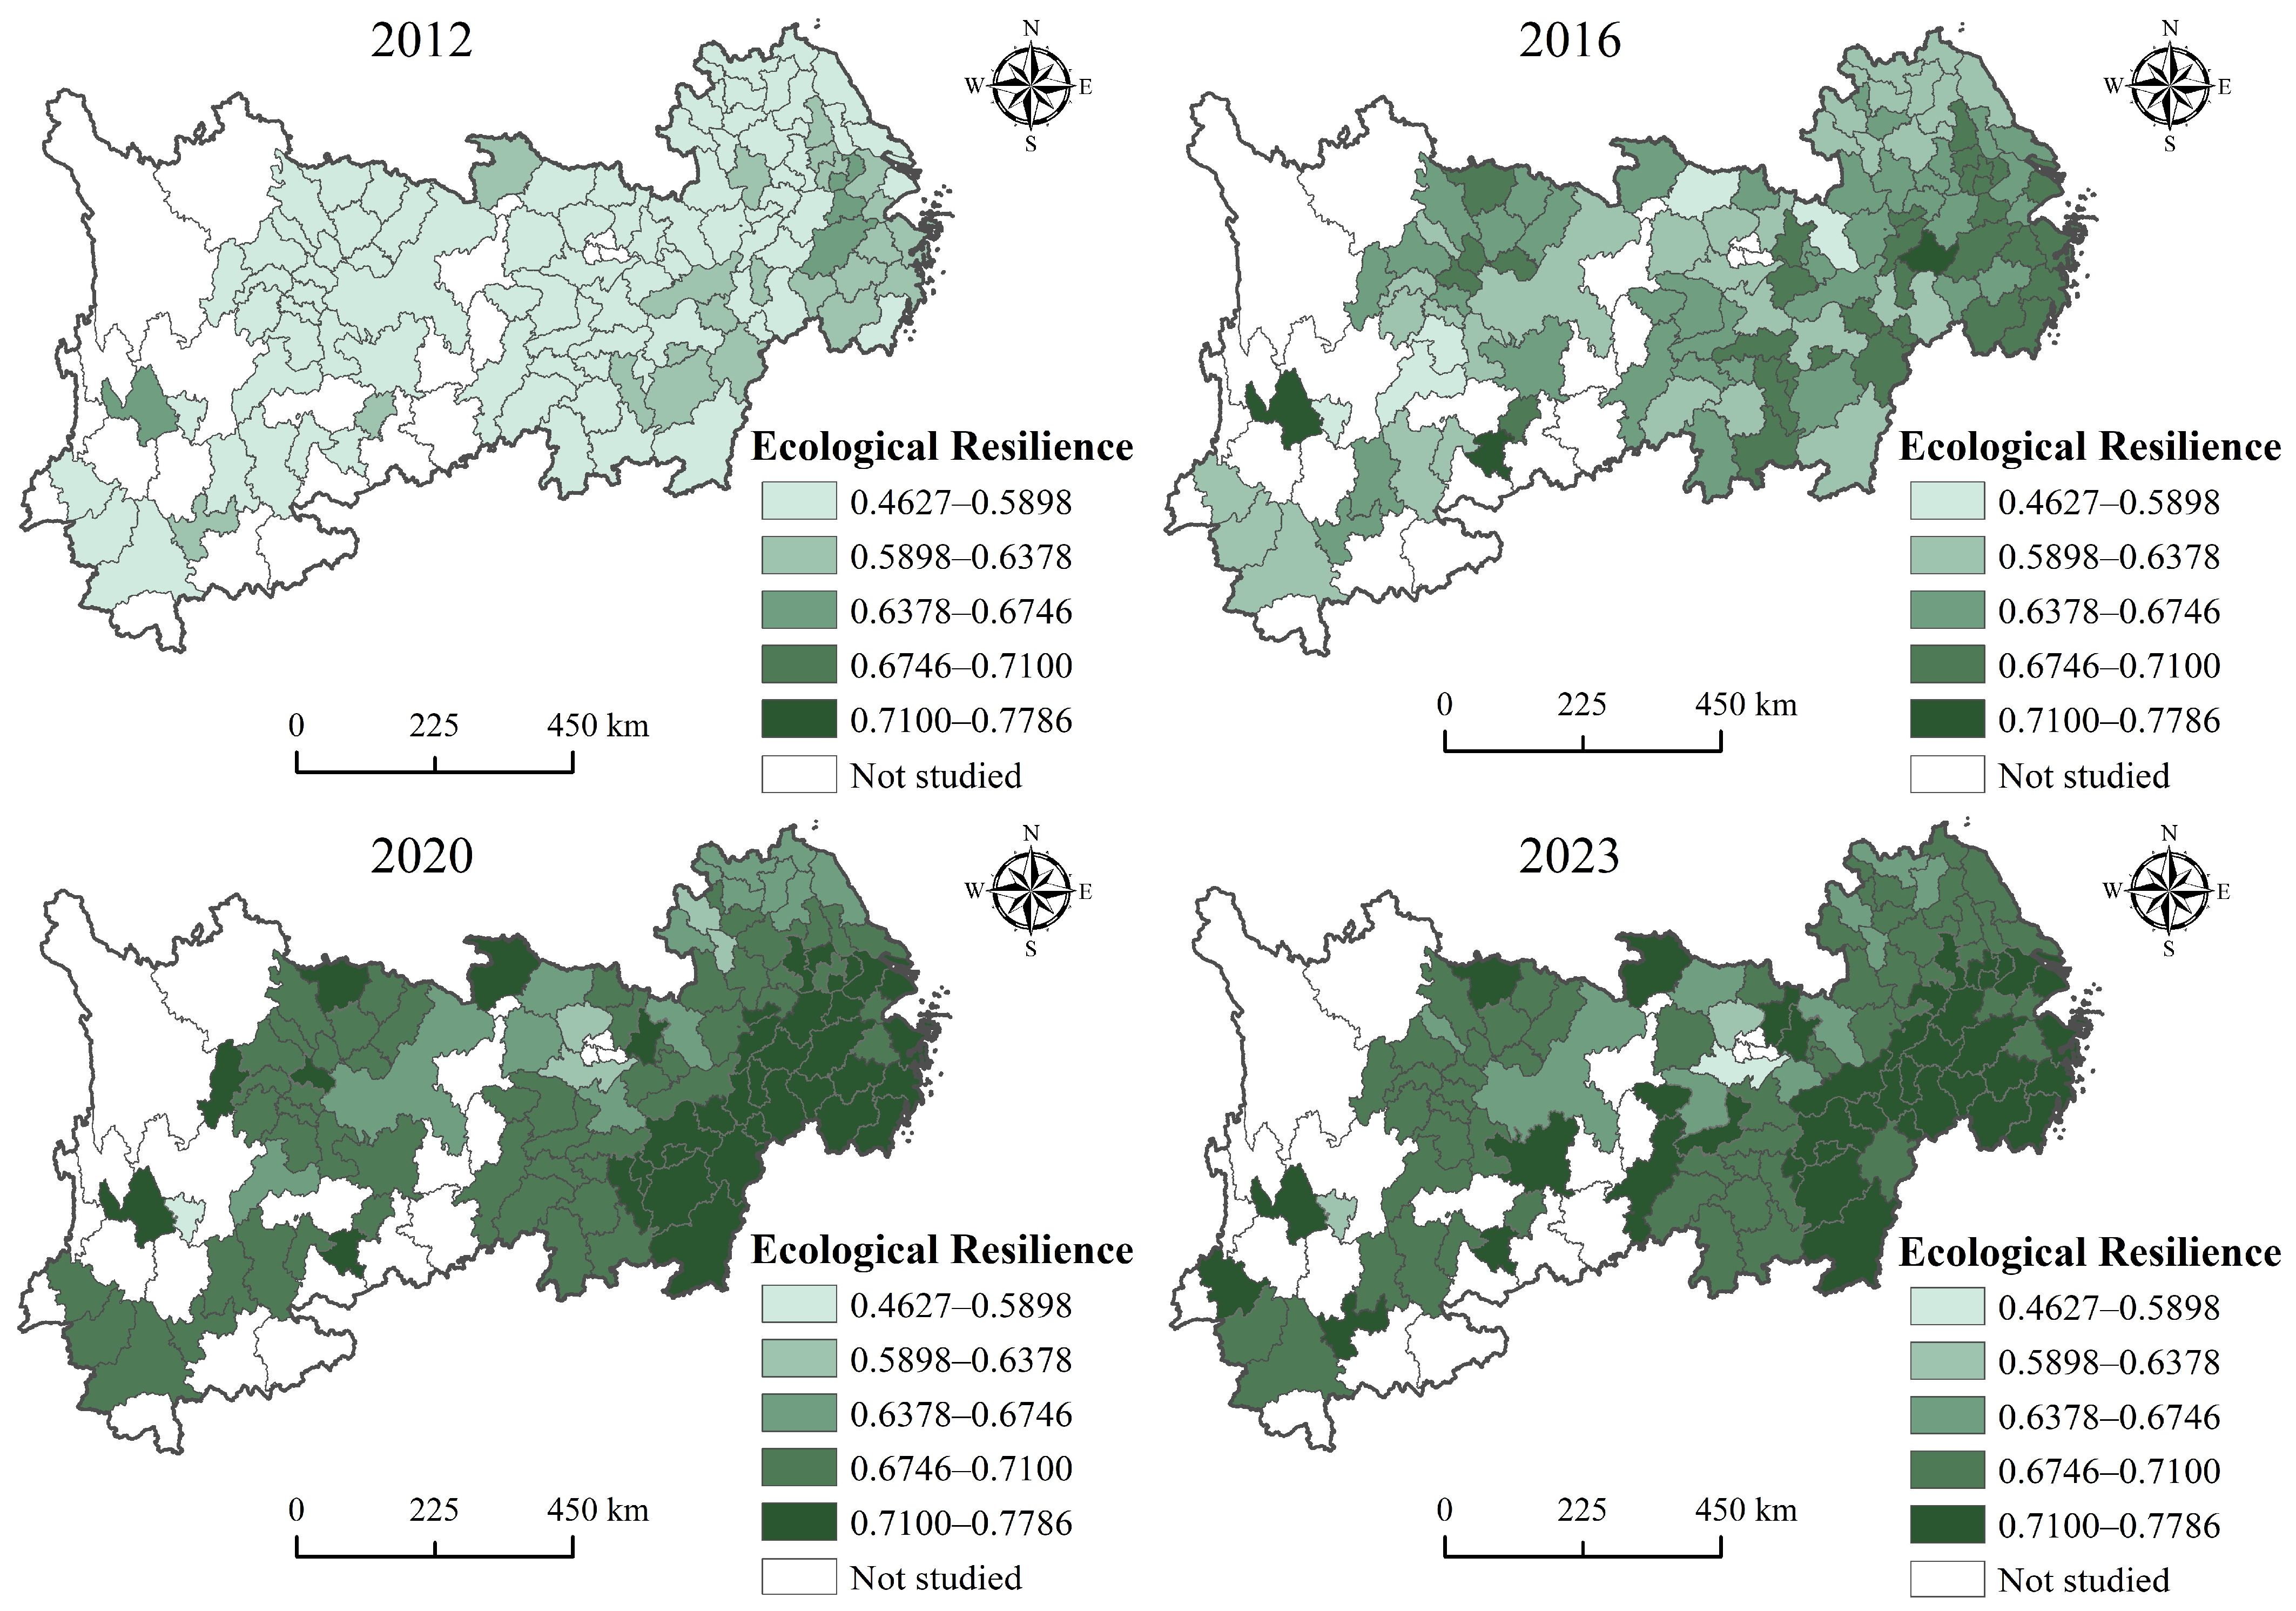
In terms of spatial evolution (Figure 6), ER in the YREB was initially low, with few high-value cities and a relatively scattered spatial distribution, indicating weak agglomeration. By 2023, medium-high and high-value cities had increased markedly, and high-value areas gradually expanded from isolated points into clustered zones. Continuous belts of relatively high ER began to emerge in the down and middle reaches, suggesting significant improvements in regional ecological governance and environmental restoration.

4.3. Spatiotemporal Evolution of CCD

4.3.1. Temporal Characteristics of CCD

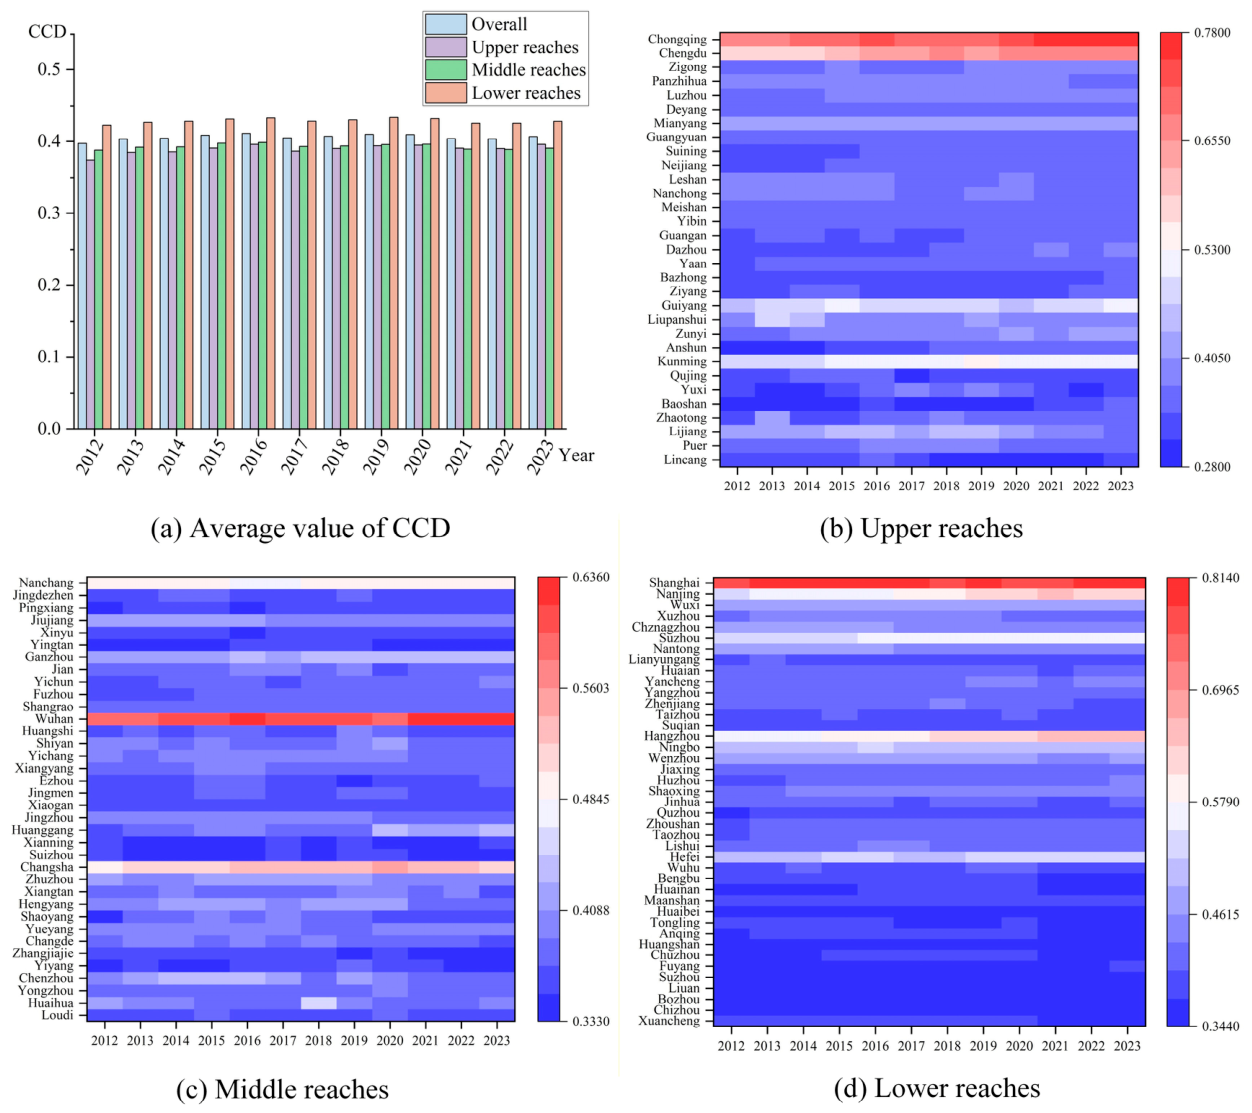
During 2012–2023, the mean CCD in the YREB rose slightly from 0.3973 to 0.4066, showing a slow upward trend (Figure 7a). This indicates that the synergy between UR and ER improved, but only marginally, and the overall system had not yet entered the primary coordination stage. In light of the preceding results of UR and ER, only Shanghai and Chongqing showed synchronous development between the two systems (CUR ≈ CER), whereas CUR remained lower than CER in all other cities. This pattern suggests that the generally low CCD level is mainly attributable to the lagging development of UR, which continues to constrain the enhancement of system-level coordination.
As shown in Figure 7b–d, subregional differences in CCD remained evident in 2023. In the upper reaches, only Chongqing and Chengdu reached moderate coordination (L2), while Kunming and Guiyang were at the primary coordination level (L3). In the middle reaches, Wuhan achieved moderate coordination (L2), and Changsha remained at primary coordination (L3). The lower reaches performed better overall, with five cities entering the coordinated development stage. Specifically, Shanghai became the first city to reach quality coordination (L1) in the YREB, Hangzhou and Nanjing achieved moderate coordination (L2), and Suzhou and Hefei reached primary coordination (L3). All other cities were still at the basic incoordination (L4) or moderate incoordination (L5) levels.

4.3.2. Spatial Distribution of CCD

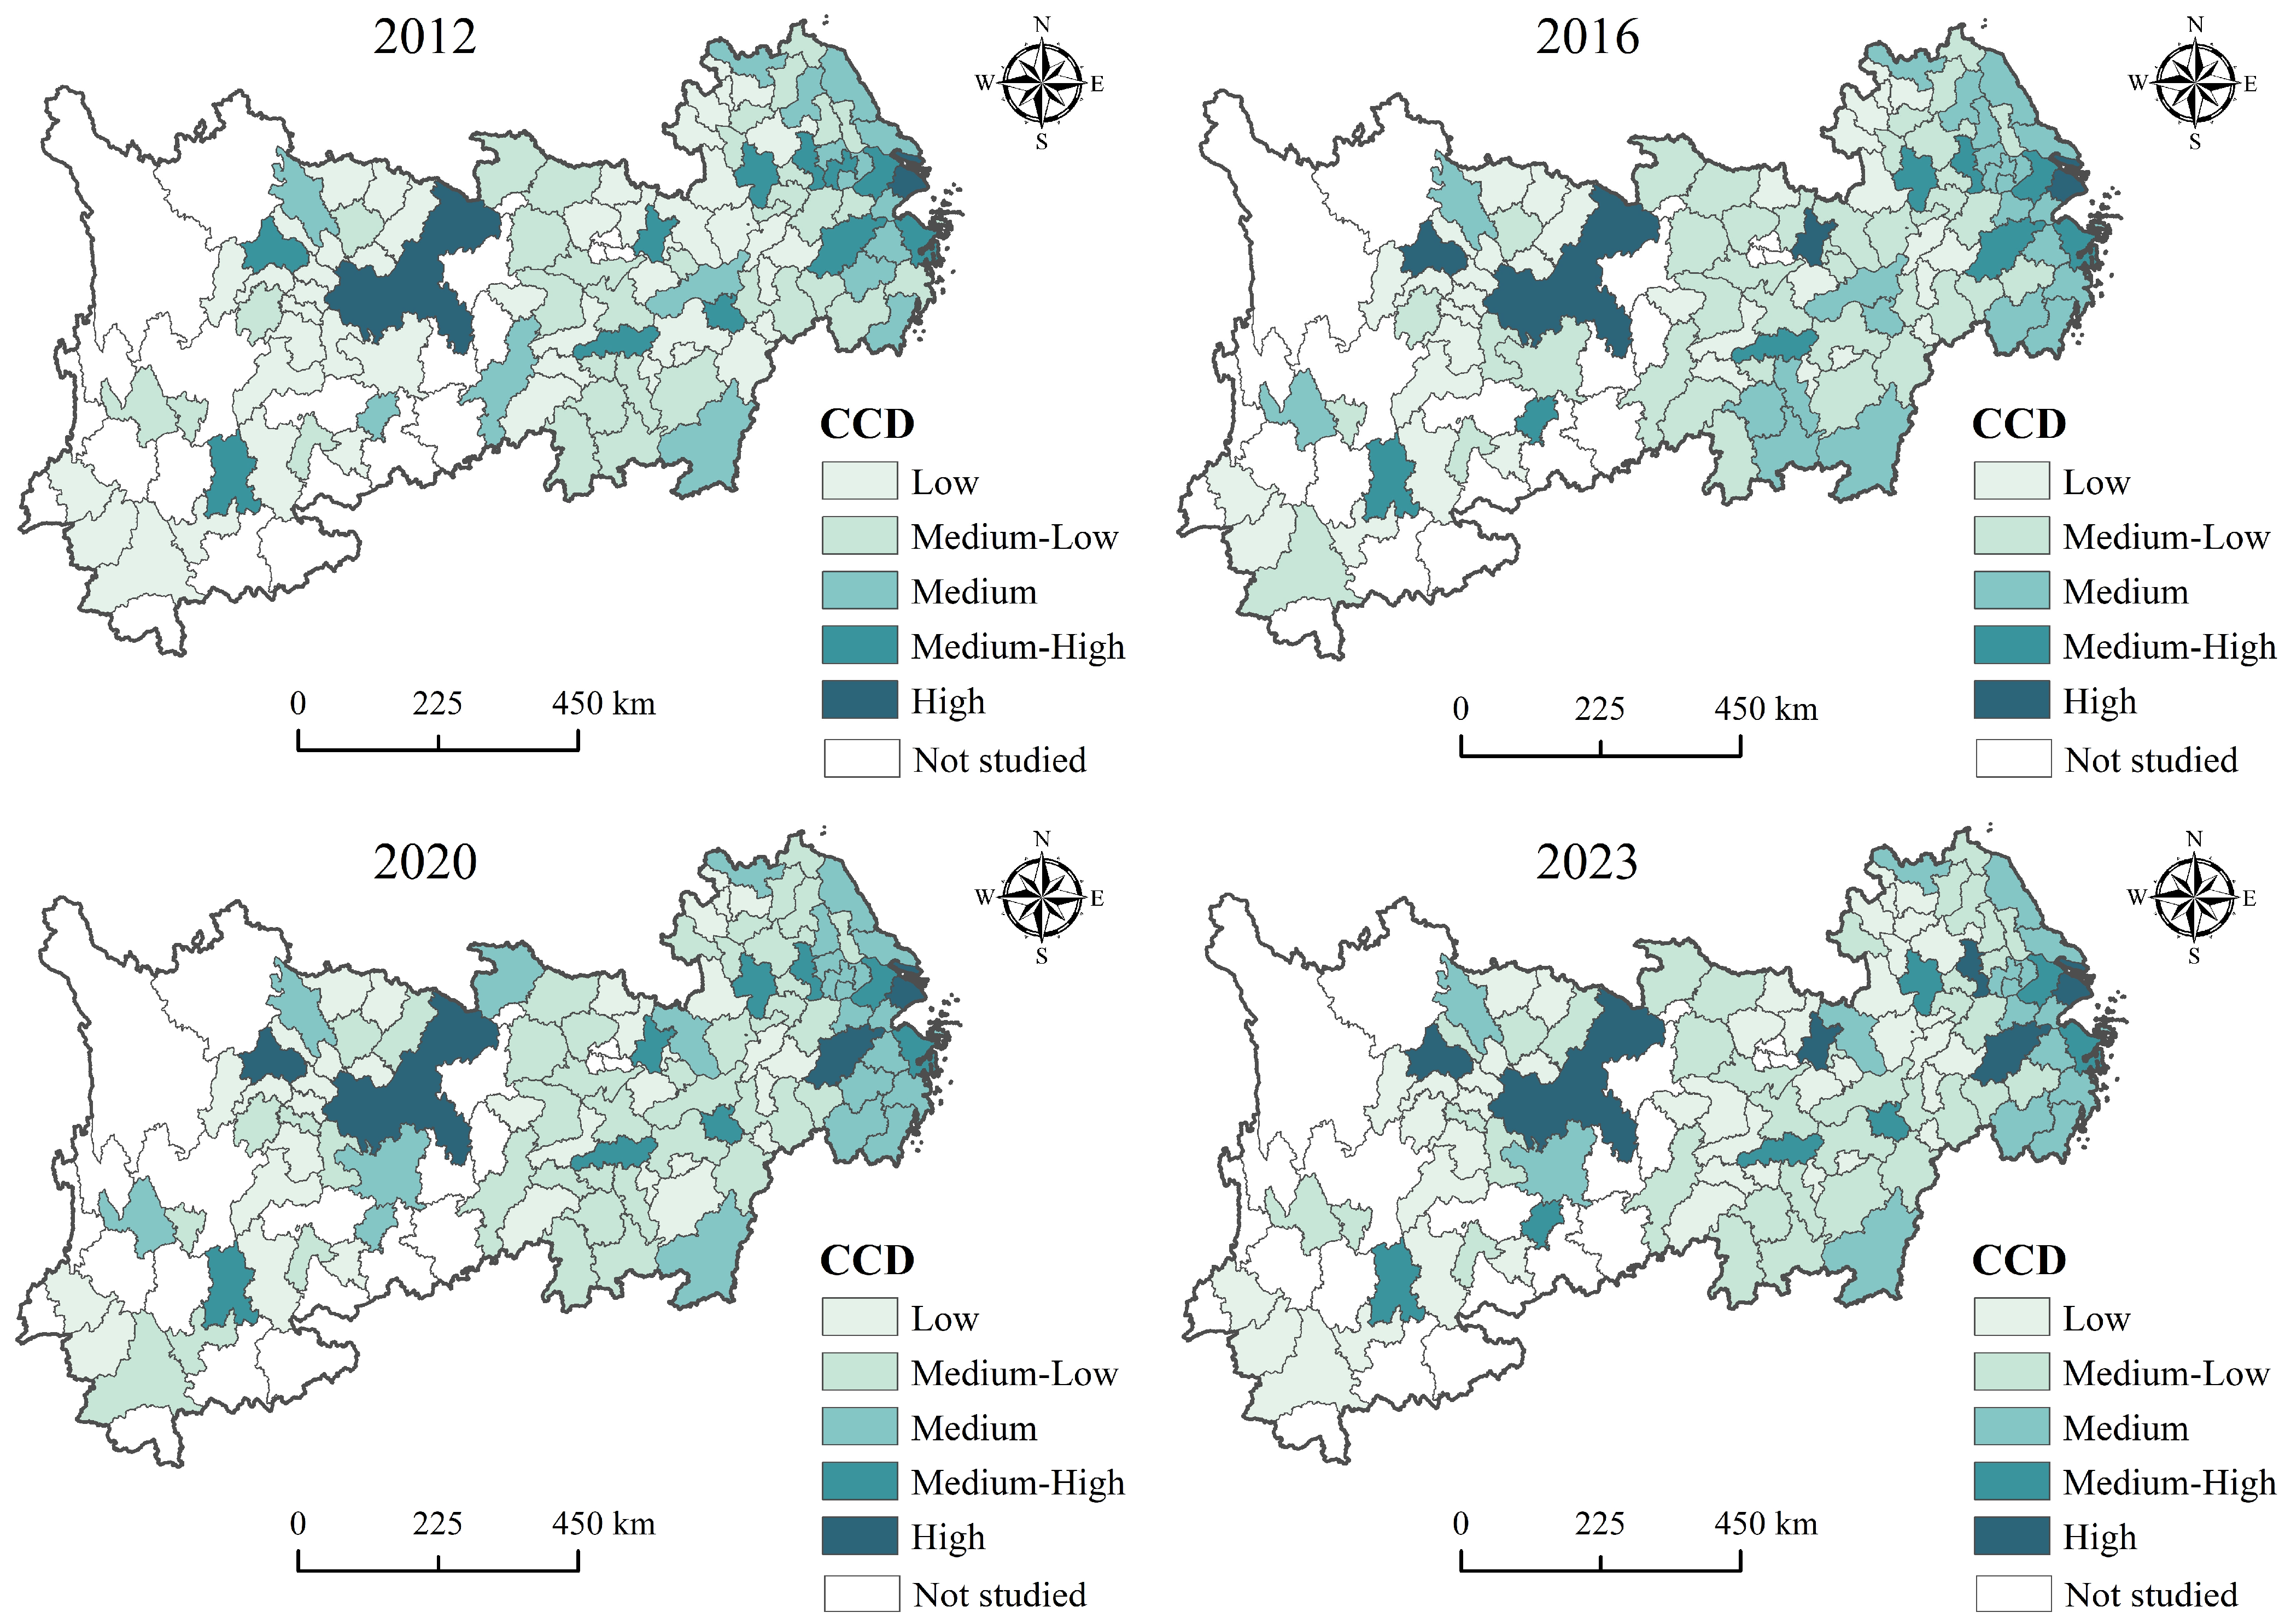
This study divides CCD into five categories using the natural breaks classification method to explore the spatial pattern of CCD (Figure 8). Overall, CCD between UR and ER in the YREB shows marked spatial unevenness. In 2012, only Shanghai and Chongqing were identified as high-value cities. By 2023, this number had increased to six, mainly located in the core nodes of the Chengdu–Chongqing urban agglomeration, the urban agglomeration in the middle reaches of the Yangtze River, and the Yangtze River Delta urban agglomeration. In the middle and upper reaches, cities with relatively high CCD levels remained spatially dispersed, with limited spillover effects on neighboring cities. By contrast, the downstream region showed a more evident clustering pattern, where high-CCD cities were more concentrated. Coastal cities gradually formed a medium-to-high-value cluster belt, reflecting stronger spatial connectivity and regional coordination.

4.3.3. KDE Analysis of CCD

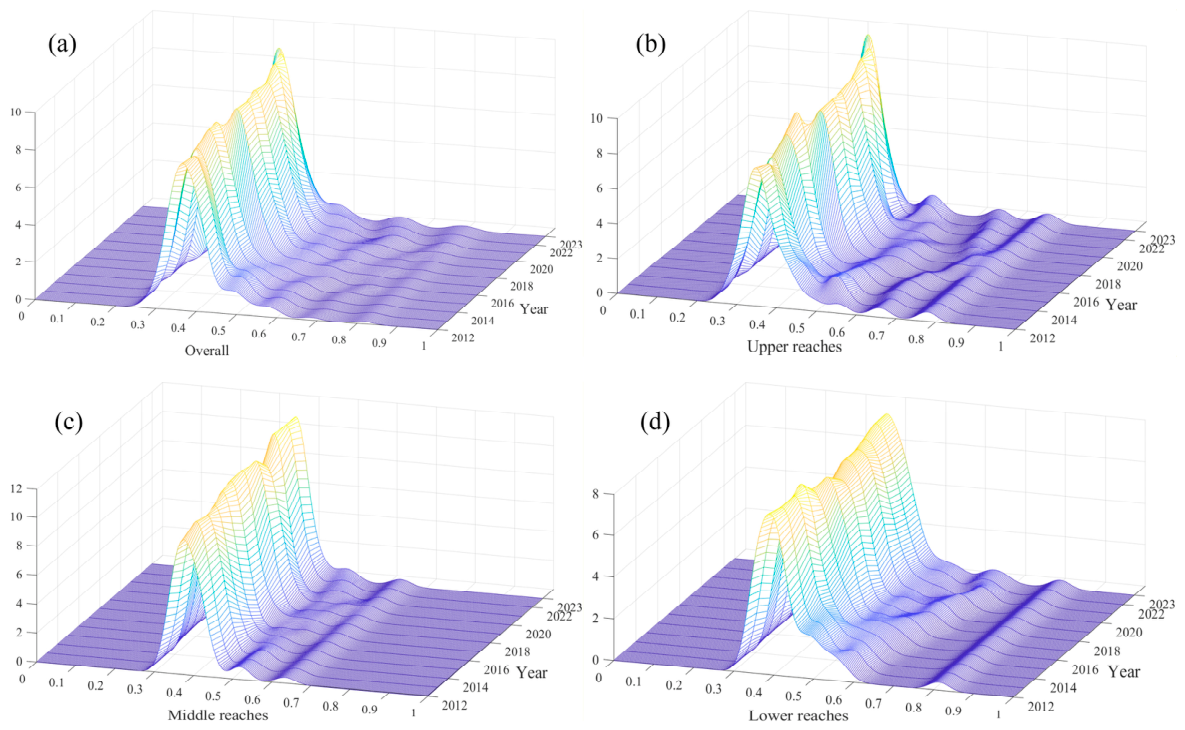
KDE is further used to reveal the evolutionary characteristics of CCD. Overall (Figure 9a), the main peak becomes narrower and higher over time, indicating that the CCD of most cities is gradually converging and that overall dispersion is decreasing. The long right tail of the density curve suggests that while a few cities have moved into a relatively high coordination range, most cities remain at medium or low levels, revealing clear regional stratification.
At the subregional level (Figure 9b–d), the kernel density curve of the upstream region exhibits evident fluctuations, a relatively wide distribution, and a long right tail, indicating comparatively large disparities among cities within the region. The middle reaches display a more concentrated kernel density distribution, suggesting relatively smaller intraregional differences. At the same time, the shorter right tail indicates that the number of cities with high values remains limited and that their CCD levels are not particularly high, such that a significant high-value leading effect has yet to emerge. In contrast, the downstream region shows a wider main peak that extends further to the right, suggesting that, in addition to core cities, the CCD of some other cities has also been gradually increasing. This reflects stronger regional linkage and more evident diffusion effects.

4.4. Impact of DTI on CCD

4.4.1. Model Fitting Performance

This study employs the XGBoost-SHAP model to identify the predictive importance and nonlinear associations of key factors with CCD. Specifically, ECO, POP, TRANS, OPEN, IND, FIN, GOV, and DTI are incorporated as explanatory variables, while CCD is specified as the dependent variable. The sample is randomly divided into training and testing subsets, accounting for 70% and 30% of the observations, respectively. Model hyperparameters are optimized using grid search in combination with five-fold cross-validation. The final optimized hyperparameters are as follows: colsample_bytree = 1.0, gamma = 0, learning_rate = 0.2, max_depth = 4, min_child_weight = 5, n_estimators = 100, reg_alpha = 1, reg_lambda = 0, subsample = 1.0. For the training set, the model obtains an R2 of 0.9285, an RMSE of 0.0223, and an MAE of 0.0161. For the testing set, the corresponding values are R2 = 0.8366, RMSE = 0.0272, and MAE = 0.0181. The model exhibits reliable predictive performance and generalization ability, with no evident signs of overfitting.

4.4.2. Relative Importance and Contributions of Influencing Factors

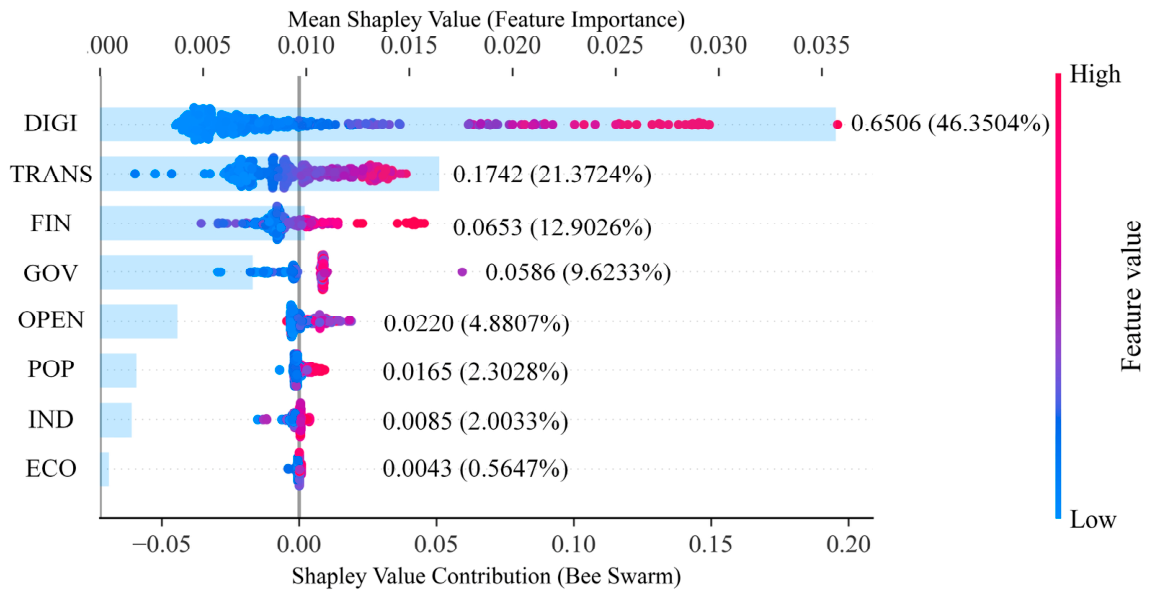
In Figure 10, the bar chart reports the Mean Shapley Value, which is used to evaluate the relative importance of each determinant, while the value in parentheses represents the corresponding contribution of that factor. The beeswarm plot further illustrates how high and low values of each predictor are associated with positive or negative contributions to the model-predicted CCD. The predictors are ranked in descending order of importance as follows: DTI, TRANS, FIN, GOV, OPEN, POP, IND, and ECO. Higher values of these predictors are generally associated with positive SHAP contributions and higher predicted CCD. Among them, DTI has the highest predictive importance, accounting for 46.3504% of the total normalized feature importance, and higher DTI values are generally associated with higher predicted CCD. This finding provides empirical support for Hypothesis 1.

4.4.3. Nonlinear Associations Between DTI and CCD

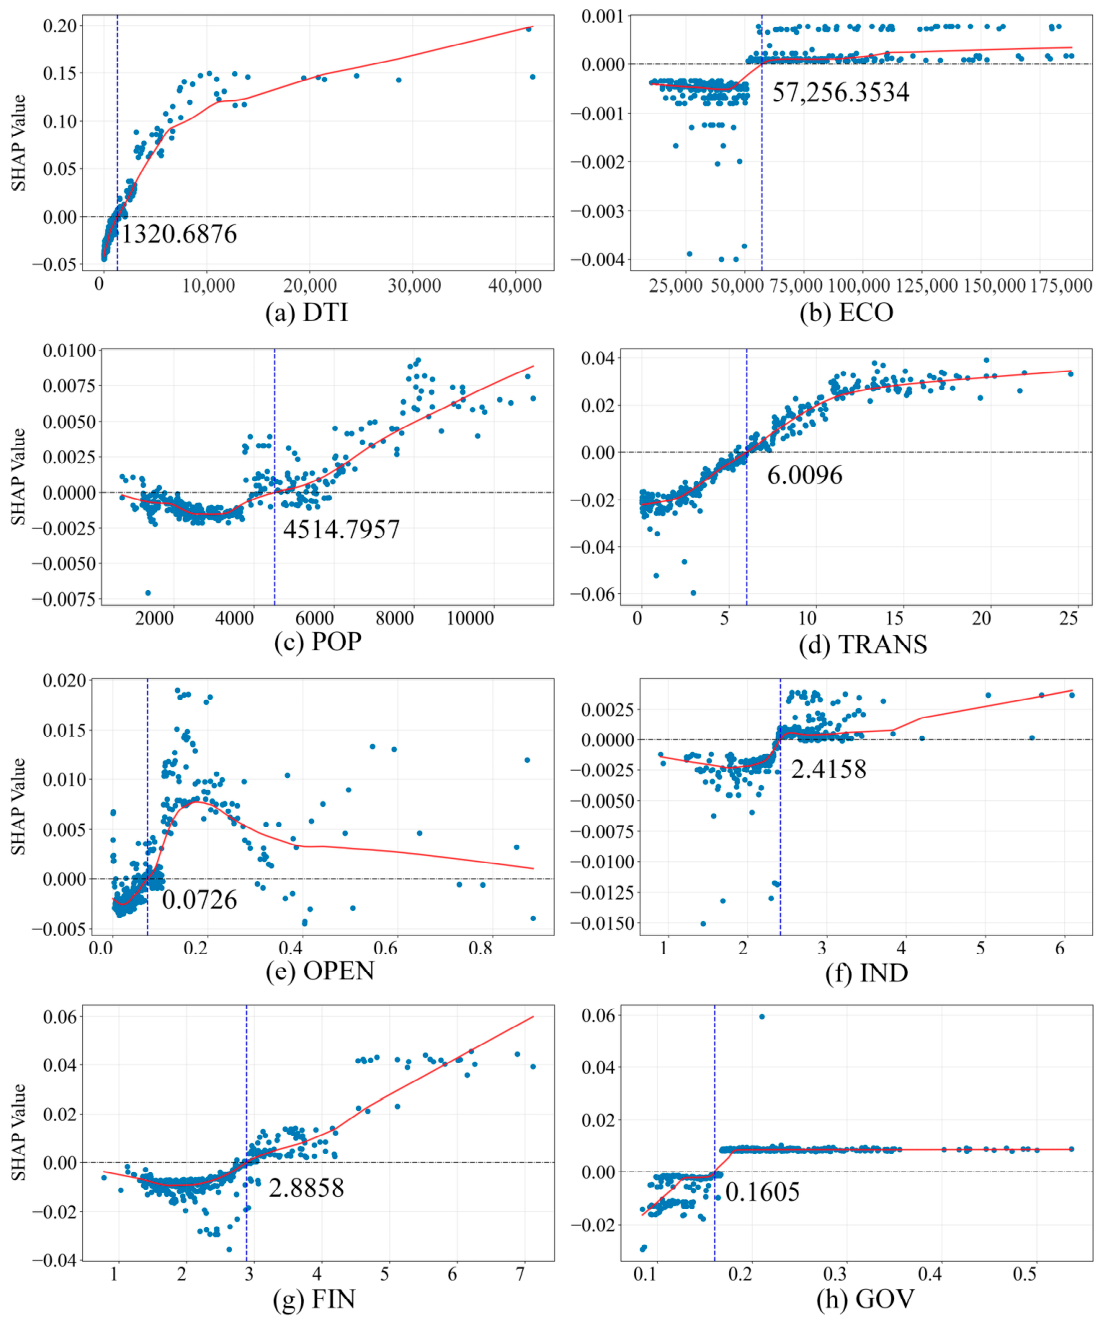
To further explore the nonlinear response and threshold of DTI on CCD, this study plots SHAP dependence curves for the predictors (Figure 11). A positive SHAP value contributes to an increase in the predicted CCD, whereas a negative value contributes to a decrease. The red line represents the LOWESS smoothing curve fitted to the SHAP dependence pattern, the grey dashed horizontal line indicates a SHAP value of zero, and the blue dotted vertical line marks the turning point where the smoothing curve crosses the zero-SHAP line.
According to the SHAP dependence plot (Figure 11a), DTI exhibits a nonlinear association with the CCD. As DTI increases, its SHAP value generally shifts from negative to positive and continues to rise, indicating that higher levels of DTI are typically associated with stronger positive contributions to model-predicted CCD, although the strength of this association varies across stages. The fitted dependence curve shows a turning point at approximately 1321 granted digital-technology-related patents. Below this point, limited technological accumulation and diffusion capacity may constrain the positive contribution of DTI to predicted CCD. Beyond this point, the positive SHAP contribution of DTI becomes more pronounced. This pattern is consistent with Hypothesis 2. One possible explanation is that, once digital technological innovation accumulates to a certain scale, digital knowledge may be more readily translated into practical applications in urban governance, green transformation, ecological monitoring, and risk response. However, at relatively high levels of DTI, although its positive contribution persists, the marginal increase gradually weakens. This pattern may suggest that the main constraints on CCD no longer arise solely from technological supply, but increasingly relate to institutional coordination, cross-departmental collaboration, practical implementation, regional diffusion, and governance capacity.
In addition to DTI, the other factors also exhibit varying degrees of nonlinear association with CCD in the YREB. Figure 11b–h show that higher levels of ECO, POP, TRANS, IND, FIN, OPEN, and GOV are generally associated with positive contributions to model-predicted CCD, although the model-derived turning points and nonlinear patterns differ substantially across factors.

4.4.4. Interaction Between DTI and Control Variables

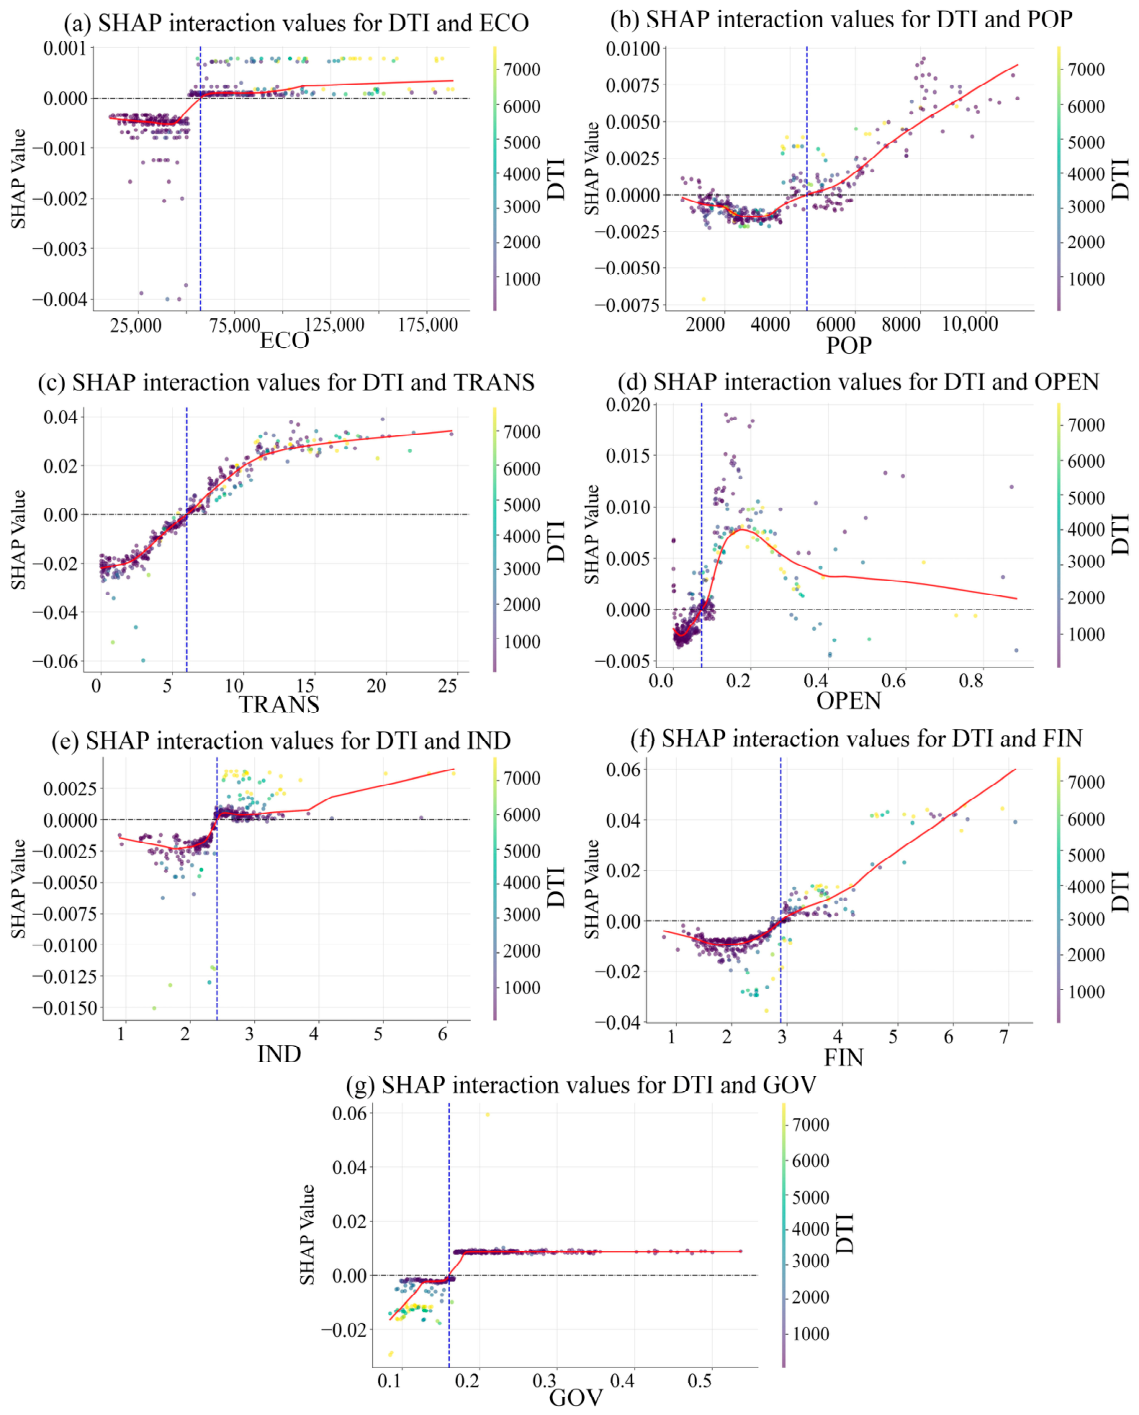
To examine how the association between DTI and CCD varies across different development contexts, this study plots SHAP interaction dependence graphs between DTI and each control variable. These plots reveal heterogeneous interaction patterns, indicating that the predictive contribution of DTI to CCD differs across levels of the socioeconomic and governance variables.
Figure 12a,c–e show that the positive association between DTI and model-predicted CCD is more pronounced at higher levels of ECO, TRANS, OPEN, and IND. These interaction patterns suggest that stronger economic foundations, more developed public transportation, greater openness, and higher industrial co-agglomeration are associated with conditions under which digital technological knowledge may be more readily absorbed, diffused, and applied.
Figure 12g indicates that the positive SHAP contribution of DTI tends to weaken at higher levels of GOV. The possible reason is that differences in fiscal allocation, implementation efficiency, and institutional coordination may affect how digital technological outputs are translated into practical applications. DTI generally depends on technological diffusion, data mobility, enterprise-level application scenarios, and the participation of market actors. Where resource allocation is more strongly shaped by administrative priorities, digital resources may not always flow to the most suitable or efficient application scenarios. This may constrain the mobility of innovation factors and weaken the extent to which digital patent outputs are converted into improvements in urban and ecological governance.
Figure 12b,f show that the interaction patterns of DTI with POP and FIN are relatively complex, as low, medium, and high values are distributed across the full range without a clear monotonic pattern. Nevertheless, higher levels of DTI are generally associated with positive SHAP contributions under different levels of POP and FIN.
Taking together, these heterogeneous interaction patterns indicate that the association between DTI and CCD varies across different development contexts, thereby providing empirical support for Hypothesis 3.

5. Discussion and Policy Implications

5.1. Discussion

5.1.1. Developmental Imbalance and Governance Mismatch Between UR and ER

The results indicate that ecological protection and environmental governance have generated relatively broad and regionally coordinated improvements, whereas the accumulation of UR capacity is a slower process that depends more heavily on local conditions. ER can be enhanced through coordinated regional environmental regulation, pollution control, ecological restoration, and basin-wide governance [20,83,84]. By contrast, UR is inherently a comprehensive and multi-stage governance process [85]. It involves a wide range of activities and is characterized by large investment requirements, long implementation cycles, and strong policy dependence, making rapid improvements difficult to achieve in the short term [86,87]. This challenge is particularly pronounced in ordinary prefecture-level cities, where limited fiscal capacity, weaker industrial foundations, insufficient population-attraction capacity, and constrained governance capabilities hinder substantial progress in UR.
Therefore, the relatively low CCD does not simply indicate that both systems remain underdeveloped; it also reflects a mismatch between their development paths and governance mechanisms. From an urban-planning perspective, ecological objectives have not yet been fully embedded in the urban-renewal process in most YREB cities. UR and ecological governance are often advanced through separate plans, departments, funding channels, and evaluation systems: the former emphasizes spatial redevelopment and functional upgrading, while the latter focuses on pollution control, ecological restoration, and environmental compliance. Without unified mechanisms for project identification, funding allocation, and outcome evaluation, progress in one subsystem does not automatically lead to improvement in the other. Core cities perform better not only because they possess more resources, but also because they are better able to integrate spatial planning, renewal projects, ecological restoration, infrastructure, and public services within a unified decision-making framework. Peripheral cities, by contrast, face greater governance fragmentation. Ecological governance may improve relatively quickly under higher-level policies and earmarked funding, whereas UR depends more heavily on local fiscal capacity, project operation, and long-term maintenance. Limited fiscal, demographic, and industrial support therefore creates an asymmetric path of faster ecological improvement but slower renewal capacity growth, resulting in slower CCD improvement.

5.1.2. Translating DTI into UR–ER Coordination

DTI may support CCD by reducing information fragmentation, improving urban resource allocation, and facilitating cross-departmental collaboration. This possible mechanism helps explain the nonlinear association identified by XGBoost-SHAP. At low levels of DTI, fragmented technological knowledge, limited application scenarios, and weak absorptive and commercialization capacities may constrain its contribution to CCD. Beyond the turning point of approximately 1321 granted patents, the positive SHAP contribution of DTI becomes more pronounced, possibly because digital knowledge can be more readily diffused and applied in urban planning, infrastructure management, and ecological governance. The interaction results further indicate that this positive predictive association is stronger in cities with better economic foundations, more developed public transportation, greater openness, and higher industrial co-agglomeration.
Overall, DTI is more likely to support UR–ER coordination when digital technological knowledge is effectively embedded in urban planning, infrastructure operation, ecological-risk management, and collaborative governance. Its policy relevance therefore lies not in simply increasing patent counts, but in strengthening cities’ institutional and organizational capacity to translate digital inventions into practical applications. For core cities, the priority is to promote regional diffusion and prevent digital benefits from remaining concentrated within administrative boundaries. For peripheral cities, a more urgent task is to strengthen technological absorptive capacity, shared data platforms, professional teams, and cross-departmental application mechanisms rather than merely pursuing additional technological outputs.

5.2. Policy Implications

First, UR and ER should be incorporated into a basin-oriented planning and governance framework. The Outline of the Development Plan for the Yangtze River Economic Belt places ecological protection and restoration at the center of regional development, while the Yangtze River Protection Law requires coordinated basin-wide protection, restoration, resource use, and green development [88,89]. Cities should therefore incorporate ecological carrying capacity, flood and heat risks, water connectivity, and environmental sensitivity into the identification, design, approval, and evaluation of renewal projects. In ecologically sensitive areas, environmental monitoring, data sharing, ecological compensation, and joint project evaluation should be strengthened to support integrated spatial planning and basin-wide governance.
Second, cities should adopt differentiated renewal and resilience strategies based on their development stages and main constraints. Core cities generally possess relatively well-developed infrastructure, public services, and innovation networks. They should shift from large-scale expansion toward refined management of existing spaces, cross-regional ecological cooperation, and the diffusion of renewal experience and digital technologies. Peripheral cities generally suffer from weak UR capacity rather than a complete lack of ecological governance. Instead of copying core-city models, they should prioritize basic projects that address aging facilities, inadequate public services, inefficient industrial land, ecological risks, and cultural-service gaps while improving both urban functions and ecological security.
Finally, the practical application of DTI should be strengthened to support UR–ER coordination. The model results indicate that DTI is an important predictor of CCD and is positively associated with the coordinated development of UR and ER. Policy efforts should therefore focus not only on digital innovation capacity and infrastructure, but also on expanding the application of digital technologies in urban renewal, ecological monitoring, disaster warning, public services, and spatial governance. Greater attention should be given to translating digital innovation outputs into practical applications so that technological knowledge can more effectively support refined urban governance, ecological resilience building, and coordinated development.

5.3. Limitations

This study has several limitations. First, UR is assessed using long-term city-level statistics, which cannot fully capture place-based dimensions such as site-specific multi-vulnerability, public-space quality, resident participation, stakeholder consultation, and cross-departmental collaboration. Second, the ER assessment relies on aggregated prefecture-level indicators and therefore cannot directly support fine-scale environmental zoning or priority-area identification. Future research could integrate remote sensing, hazard exposure, land-use and land-cover, landscape connectivity, and infrastructure vulnerability within a GIS framework to identify areas with different ecological pressures, exposure levels, vulnerabilities, and recovery capacities, thereby supporting more operational environmental zoning and place-specific UR. Third, DTI is measured by the annual city-level count of granted digital-technology-related patents. Although this indicator captures digital innovation output, it does not fully reflect digital infrastructure, governance, applications, or technology adoption. Future research could develop a multidimensional DTI measure combining patent data with indicators of digital infrastructure and practical application.

6. Conclusions

Based on data from 108 cities in the YREB from 2012 to 2023, this study assesses UR across three dimensions—urban infrastructure construction, social function development, and cultural and leisure facility construction—and evaluates ER in terms of resistance, adaptability, and recoverability. It further measures the CCD between the two systems. Furthermore, XGBoost-SHAP is employed to identify an indicative transition point in the association between DTI and CCD and to examine the interactions between DTI and different socioeconomic factors. This analysis leads to several major findings.
First, the overall level of UR in the YREB showed a fluctuating upward trend, but the magnitude of improvement was relatively limited. In contrast, ER increased significantly, with a relatively balanced regional development pattern. Second, the CCD between UR and ER is characterized by significant spatial disequilibrium. Areas with relatively high CCD levels are predominantly concentrated in provincial capitals, municipalities and coastal cities. Compared with the middle and upper reaches, the lower reaches demonstrate stronger spatial connectivity and a higher degree of coordination. The relatively lagging development of UR constitutes the major shortcoming that constrains the synergistic advancement of the two systems. Third, DTI shows the highest predictive importance for CCD in the XGBoost-SHAP model. Its association with CCD is nonlinear: when the number of granted digital-technology-related patents exceeds the model-identified turning point of approximately 1321, its positive predictive contribution becomes more pronounced. The interaction analysis further indicates that the positive association between DTI and CCD is stronger under higher levels of ECO, TRANS, OPEN, and IND, whereas higher GOV is associated with a weaker DTI contribution. The interactions with POP and FIN are more complex.

Author Contributions

Conceptualization, J.H. and R.P.; methodology, Y.H. and T.S.; software, Y.H. and W.Z.; investigation, J.H. and Y.H.; resources, T.S. and W.Z.; writing—original draft preparation, Y.H. and T.S.; writing—review and editing, J.H. and R.P.; visualization, Y.H.; funding acquisition, J.H. and R.P. All authors have read and agreed to the published version of the manuscript.

Funding

This research was funded by the National Natural Science Foundation of China (Grant No. 72203197), The Key Project of Philosophy and Social Science Research in Colleges and Universities in Henan Province (Nos. 2024-YYZD-05, 2025-JCZD-31, and 2026-YYZD-23), and Planning Projects of Philosophy and Social Sciences in Henan Province (No. 2024BJJ031).

Institutional Review Board Statement

Not applicable.

Informed Consent Statement

Not applicable.

Data Availability Statement

Data supporting the conclusions of this study are available from the authors upon request.

Conflicts of Interest

The authors declare no conflicts of interest.

Appendix A

Table A1. Descriptive statistics of the UR indicators.
VariableObsMeanStd. Dev.MinMax
A11296165.569217.93315.181645.38
A2129620.4277.8352.2555.575
A3129614.7897.3650.01162.54
A4129694.98511.03910.99100
A512969.78515.82084
A612965.7344.706047
A71296174.15174.844141931
A812961739.572916.25160.1277975.784
A9129611.96617.7720.05138
A101296418.721856.896218307
A1112968.98512.1160.13596.655
A12129639.11639.7381291
Table A2. Descriptive statistics of the ER indicators.
VariableObsMeanStd. Dev.MinMax
B112962.3162.1950.05219.125
B2129614.23923.1640.052276.237
B3129610.29220.5190.091577.004
B4129617.12314.9590.38497.72
B5129683.16310.86638.08100
B6129684.03919.0937152
B7129696.4729.62510100
B8129689.82210.50423122
B9129641.6874.34421.7663.738
B10129613.9723.6781.7535.882
B1112960.0280.0140.0030.193
B121296644.8531435.501113,592
Table A3. Descriptive statistics of the key variables.
VariableObsMeanStd. Dev.MinMax
UR12960.19240.08830.07580.6815
ER12960.66430.04820.47560.7785
CCD12960.40570.07910.28180.8137
DTI12961884.324596.018042,630

References

  1. Bai, X.; McPhearson, T.; Cleugh, H.; Nagendra, H.; Tong, X.; Zhu, T.; Zhu, Y.G. Linking urbanization and the environment: Conceptual and empirical advances. Annu. Rev. Environ. Resour. 2017, 42, 215–240. [Google Scholar] [CrossRef]
  2. National Bureau of Statistics of China. Remarkable Changes and a New Look: Urban Development Opens a New Chapter—Series Report No. 19 on the Economic and Social Development Achievements of the 75 Years Since the Founding of New China; National Bureau of Statistics of China: Beijing, China, 2024. Available online: https://www.stats.gov.cn/sj/sjjd/202409/t20240923_1956628.html (accessed on 17 March 2026).
  3. Huang, X.; Ren, H.; Liu, Y. Exploring the stages of urban renewal in Japan and its inspiration for China. J. Nat. Resour. 2025, 40, 1586–1604. [Google Scholar] [CrossRef]
  4. Goh, K.C.; Kurniawan, T.A.; Meidiana, C.; Anouzla, A.; Aziz, F.; Ali, I.; Casila, J.C.C.; Khan, M.I.; Zhang, D.; Jiang, M.; et al. Strengthening urban resilience in China through underground infrastructures management: Addressing global climate challenges with technological solutions. Deep. Undergr. Sci. Eng. 2025, 1–24. [Google Scholar]
  5. Li, X.; Song, J.; Lin, T.; Dixon, J.; Zhang, G.; Ye, H. Urbanization and health in China, thinking at the national, local and individual levels. Environ. Health 2016, 15, S32. [Google Scholar] [CrossRef] [PubMed]
  6. Chen, W.; Wang, G.; Zeng, J. Impact of urbanization on ecosystem health in Chinese urban agglomerations. Environ. Impact Assess. Rev. 2023, 98, 106964. [Google Scholar] [CrossRef]
  7. Office of Policy Development and Research. HUD’s Historical Timeline. Available online: https://www.huduser.gov/portal/hudtimeline_1950.html (accessed on 17 March 2026).
  8. Roberts, P.; Sykes, H. Urban Regeneration: A Handbook; Sage: London, UK, 1999. [Google Scholar]
  9. Roberts, P. The evolution, definition and purpose of urban regeneration. Urban. Regen. A Handb. 2000, 1, 9–36. [Google Scholar]
  10. dos Santos Figueiredo, Y.D.; Prim, M.A.; Dandolini, G.A. Urban regeneration in the light of social innovation: A systematic integrative literature review. Land Use Policy 2022, 113, 105873. [Google Scholar] [CrossRef]
  11. The Central People’s Government of the People’s Republic of China. The Opinions of the General Office of the CPC Central Committee and the General Office of the State Council on Continuously Promoting Urban Renewal Actions; The Central People’s Government of the People’s Republic of China: Beijing, China, 2025. Available online: https://www.gov.cn/zhengce/202505/content_7023880.htm (accessed on 17 March 2026).
  12. Wang, X.; Shen, Y.; Li, Y.; Sun, Y.; Li, X.; Fang, L.; Huang, C.; Yao, J. Identifying drivers of community-scale urban renewal with an ante-hoc interpretable hybrid graph model. J. Urban. Manag. 2026. [Google Scholar] [CrossRef]
  13. Ye, C.; Liu, Y.; Lin, M.; Lin, X.; Zhu, Y.; Mi, J. Post renewal residential experiences in urban renewal: Perspectives of residents, communities, and processes in Guangzhou, China. J. Urban. Manag. 2025. [Google Scholar] [CrossRef]
  14. Li, B.; Hu, R.; Yang, J. Does smart city construction affect urban renewal? Evidence from China. J. Clean. Prod. 2025, 496, 145110. [Google Scholar] [CrossRef]
  15. Holling, C.S. Resilience and stability of ecological systems. Annu. Rev. Ecol. Syst. 1973, 4, 1–23. [Google Scholar] [CrossRef]
  16. Walker, B.; Holling, C.S.; Carpenter, S.R.; Kinzig, A. Resilience, adaptability and transformability in social–ecological systems. Ecol. Soc. 2004, 9, 1708–3087. [Google Scholar] [CrossRef]
  17. Meerow, S.; Newell, J.P.; Stults, M. Defining urban resilience: A review. Landsc. Urban. Plan. 2016, 147, 38–49. [Google Scholar] [CrossRef]
  18. Lee, C.C.; Yan, J.; Li, T. Ecological resilience of city clusters in the middle reaches of Yangtze river. J. Clean. Prod. 2024, 443, 141082. [Google Scholar] [CrossRef]
  19. Wang, H.; Ge, Q. Ecological resilience of three major urban agglomerations in China from the “environment–society” coupling perspective. Ecol. Indic. 2024, 169, 112944. [Google Scholar] [CrossRef]
  20. Wu, N.; Zhou, Y.; Yin, S.; Gong, H.; Zhang, C. Revealing the nonlinear impact of environmental regulation on ecological resilience using the XGBoost-SHAP model: Evidence from the Yangtze River Delta region, China. J. Clean. Prod. 2025, 514, 145700. [Google Scholar] [CrossRef]
  21. Zhou, Y.; Wu, N.; Zhang, C.; Wang, Q.; Chen, Z.; Yin, S. How green technological innovation shapes urban ecological resilience: Structural, governance, and fiscal pathways in the Yangtze river economic belt. J. Clean. Prod. 2026, 543, 147607. [Google Scholar] [CrossRef]
  22. Ma, X.; Zhang, J.; Wang, P.; Zhou, L.; Sun, Y. Estimating the nonlinear response of landscape patterns to ecological resilience using a random forest algorithm: Evidence from the Yangtze River Delta. Ecol. Indic. 2023, 153, 110409. [Google Scholar] [CrossRef]
  23. Sun, X.; Gao, L.; Ren, H.; Ye, Y.; Li, A.; Stafford-Smith, M.; Conner, J.D.; Wu, J.; Bryan, B.A. China’s progress towards sustainable land development and ecological civilization. Landsc. Ecol. 2018, 33, 1647–1653. [Google Scholar] [CrossRef]
  24. Semeraro, T.; Scarano, A.; Buccolieri, R.; Santino, A.; Aarrevaara, E. Planning of urban green spaces: An ecological perspective on human benefits. Landsc. Ecol. 2021, 10, 105. [Google Scholar] [CrossRef]
  25. Liu, H.; Lin, B. Ecological indicators for green building construction. Ecol. Indic. 2016, 67, 68–77. [Google Scholar] [CrossRef]
  26. Wilkinson, C. Social-ecological resilience: Insights and issues for planning theory. Plan. Theory 2012, 11, 148–169. [Google Scholar]
  27. Chang, S.; Su, K.; Jiang, X.; You, Y.; Li, C.; Wang, L. Exploring the impact of urban regeneration programs on wildlife and human well-being: A case study in Nanning, China. Ecol. Indic. 2024, 159, 111640. [Google Scholar] [CrossRef]
  28. Wang, Z.; Liang, L.; Sun, Z.; Wang, X. Spatiotemporal differentiation and the factors influencing urbanization and ecological environment synergistic effects within the Beijing–Tianjin–Hebei urban agglomeration. J. Environ. Manag. 2019, 243, 227–239. [Google Scholar] [CrossRef] [PubMed]
  29. Ni, Z.; Zhao, Y.; Liu, J.; Li, Y.; Xia, X.; Zhang, Y. Navigating ecological–economic interactions: Spatiotemporal dynamics and drivers in the lower reaches of the Jinsha river. Land 2024, 13, 2159. [Google Scholar] [CrossRef]
  30. Zhang, Y.; Zhu, T.; Guo, H.; Yang, X. Analysis of the coupling coordination degree of the Society-Economy-Resource-Environment system in urban areas: Case study of the Jingjinji urban agglomeration, China. Ecol. Indic. 2023, 146, 109851. [Google Scholar] [CrossRef]
  31. Bibri, S.E.; Krogstie, J. Smart sustainable cities of the future: An extensive interdisciplinary literature review. Sustain. Cities Soc. 2017, 31, 183–212. [Google Scholar] [CrossRef]
  32. Son, T.H.; Weedon, Z.; Yigitcanlar, T.; Sanchez, T.; Corchado, J.M.; Mehmood, R. Algorithmic urban planning for smart and sustainable development: Systematic review of the literature. Sustain. Cities Soc. 2023, 94, 104562. [Google Scholar] [CrossRef]
  33. Jiang, H.; Geertman, S.; Witte, P. Smartening urban governance: An evidence-based perspective. Reg. Sci. Policy Pract. 2021, 13, 744–759. [Google Scholar] [CrossRef]
  34. Li, L.; Lin, X.; Yang, X.; Luo, Z.; Wang, M. Digital governance and urban government service spaces: Understanding resident interaction and perception in Chinese cities. Land 2024, 13, 1403. [Google Scholar] [CrossRef]
  35. Weil, C.; Bibri, S.E.; Longchamp, R.; Golay, F.; Alahi, A. Urban digital twin challenges: A systematic review and perspectives for sustainable smart cities. Sustain. Cities Soc. 2023, 99, 104862. [Google Scholar] [CrossRef]
  36. Wang, H.; Shen, Q.; Tang, B.S. GIS-based framework for supporting land use planning in urban renewal: Case study in Hong Kong. J. Urban. Plan. Dev. 2015, 141, 05014015. [Google Scholar] [CrossRef]
  37. Koutra, S.; Ioakimidis, C.S. Unveiling the potential of machine learning applications in urban planning challenges. Land 2022, 12, 83. [Google Scholar] [CrossRef]
  38. Moufid, O.; Praharaj, S.; Oulidi, H.J. Digital technologies in urban regeneration: A systematic review of literature. J. Urban Manag. 2025, 14, 264–278. [Google Scholar] [CrossRef]
  39. Argyroudis, S.A.; Mitoulis, S.A.; Chatzi, E.; Baker, J.W.; Brilakis, I.; Gkoumas, K.; Vousdoukas, M.; Hynes, W.; Carluccio, S.; Keou, O.; et al. Digital technologies can enhance climate resilience of critical infrastructure. Clim. Risk Manag. 2022, 35, 100387. [Google Scholar] [CrossRef]
  40. Zhang, Y.; Wang, J.; Liu, Y.; Zhao, J. The Impact of the Digital Economy on Urban Ecological Resilience: Empirical Evidence from China’s Comprehensive Big Data Pilot Zone Policy. Sustainability 2024, 16, 3611. [Google Scholar] [CrossRef]
  41. Bresnahan, T.F.; Trajtenberg, M. General purpose technologies “Engines of growth”? J. Econom. 1995, 65, 83–108. [Google Scholar] [CrossRef]
  42. Xiahou, X.; Ding, X.; Chen, P.; Qian, Y.; Jin, H. Digital Technologies in Urban Regeneration: A Systematic Literature Review from the Perspectives of Stakeholders, Scales, and Stages. Buildings 2025, 15, 2455. [Google Scholar] [CrossRef]
  43. Allan, M.; Rajabifard, A.; Foliente, G. Urban Regeneration and Placemaking: A Digital Twin Enhanced Performance-Based Framework for Melbourne’s Greenline Project? Aust. Plan. 2023, 59, 247–257. [Google Scholar] [CrossRef]
  44. Fan, C.; Jiang, Y.; Mostafavi, A. Social Sensing in Disaster City Digital Twin: Integrated Textual-Visual-Geo Framework for Situational Awareness During Built Environment Disruptions. J. Manag. Eng. 2020, 36, 04020002. [Google Scholar] [CrossRef]
  45. Therias, A.; Rafiee, A. City Digital Twins for Urban Resilience. Int. J. Digit. Earth 2023, 16, 4164–4190. [Google Scholar] [CrossRef]
  46. Ye, X.; Du, J.; Han, Y.; Newman, G.; Retchless, D.; Zou, L.; Ham, Y.; Cai, Z. Developing Human-Centered Urban Digital Twins for Community Infrastructure Resilience: A Research Agenda. J. Plan. Lit. 2023, 38, 187–199. [Google Scholar] [PubMed]
  47. Cohen, W.M.; Levinthal, D.A. Absorptive capacity: A new perspective on learning and innovation. Adm. Sci. Q. 1990, 35, 128–152. [Google Scholar] [CrossRef]
  48. Bresnahan, T.F.; Brynjolfsson, E.; Hitt, L.M. Information technology, workplace organization, and the demand for skilled labor: Firm-level evidence. Q. J. Econ. 2002, 117, 339–376. [Google Scholar] [CrossRef]
  49. Teece, D.J. Profiting from technological innovation: Implications for integration, collaboration, licensing and public policy. Res. Policy 1986, 15, 285–305. [Google Scholar] [CrossRef]
  50. Tomor, Z.; Meijer, A.; Michels, A.; Geertman, S. Smart Governance for Sustainable Cities: Findings from a Systematic Literature Review. J. Urban. Technol. 2019, 26, 3–27. [Google Scholar] [CrossRef]
  51. Neirotti, P.; De Marco, A.; Cagliano, A.C.; Mangano, G.; Scorrano, F. Current trends in Smart City initiatives: Some stylised facts. Cities 2014, 38, 25–36. [Google Scholar] [CrossRef]
  52. Tan, S.Y.; Taeihagh, A. Smart City Governance in Developing Countries: A Systematic Literature Review. Sustainability 2020, 12, 899. [Google Scholar] [CrossRef]
  53. Wang, J.; Zhou, X. Measurement and synergistic evolution analysis of economic resilience and green economic efficiency: Evidence from five major urban agglomerations, China. Appl. Geogr. 2024, 168, 103302. [Google Scholar] [CrossRef]
  54. Cui, R.; Li, G. Regional differences and distributional dynamics of internet level in China: 2006–2018. J. Quant. Technol. Econ. 2021, 38, 3–20. [Google Scholar]
  55. Zhao, X.; Li, X.; Deng, G.; Xi, Y. Decoupling relationship between resource environment and high-quality economic development in the yellow river basin. Sustainability 2023, 15, 9385. [Google Scholar] [CrossRef]
  56. Wang, S.J.; Kong, W.; Ren, L.; Zhi, D.D. Research on misuses and modification of coupling coordination degree model in China. J. Nat. Resour. 2021, 36, 793–810. [Google Scholar] [CrossRef]
  57. Gong, Z.; Yuan, Y.; Qie, L.; Huang, S.; Xie, X.; Zhong, R.; Pu, L. Spatiotemporal differentiation and coupling coordination relationship of the production–living–ecological function at county scale: A case study of Jiangsu province. Land 2023, 12, 2027. [Google Scholar] [CrossRef]
  58. Shi, T.; Yang, S.; Zhang, W.; Zhou, Q. Coupling coordination degree measurement and spatiotemporal heterogeneity between economic development and ecological environment—Empirical evidence from tropical and subtropical regions of China. J. Clean. Prod. 2020, 244, 118739. [Google Scholar] [CrossRef]
  59. Zhang, H.; Zhang, Y.; Wang, R.; Zhang, X. Spatiotemporal Dynamics and Driving Factors of the Urban Tourismification–Transportation Quality–Ecological Resilience System: A Case Study of 80 Cities in Central China. Land 2025, 14, 1263. [Google Scholar] [CrossRef]
  60. Friedman, J.H. Greedy function approximation: A gradient boosting machine. Ann. Stat. 2001, 29, 1189–1232. [Google Scholar] [CrossRef]
  61. Chen, T.; Guestrin, C. XGBoost: A Scalable Tree Boosting System. In Proceedings of the 22nd ACM SIGKDD International Conference on Knowledge Discovery and Data Mining; Association for Computing Machinery: New York, NY, USA, 2016; pp. 785–794. [Google Scholar]
  62. Lundberg, S.M.; Lee, S.I. A unified approach to interpreting model predictions. Adv. Neural Inf. Process. Syst. 2017, 30, 4765–4774. [Google Scholar]
  63. The Central People’s Government of the People’s Republic of China. The State Council Issues the 15th Five-Year Plan for Urban Renewal; The Central People’s Government of the People’s Republic of China: Beijing, China, 2026. Available online: https://www.gov.cn/yaowen/liebiao/202605/content_7070541.htm (accessed on 9 June 2026).
  64. Peng, W.; Di, Y.; Kuang, C.; Su, X.; Ning, Y.; Zhao, D. The coupling effect of urban renewal and ecological resilience and its influencing factors in the Changsha-Zhuzhou-Xiangtan Sur-rounding Area. J. Nat. Resour. 2025, 40, 1569–1585. [Google Scholar] [CrossRef]
  65. Huang, J.; Zhong, P.; Zhang, J.; Zhang, L. Spatial-temporal differentiation and driving factors of ecological resilience in the Yellow River Basin, China. Ecol. Indic. 2023, 154, 110763. [Google Scholar] [CrossRef]
  66. Peng, W.; Kuang, C.; Li, W.; Di, Y. Spatial correlation network and impacts of urban renewal and ecological resilience in urban agglomerations in the middle reaches of the Yangtze River. Geogr. Sci. 2024, 44, 1936–1945. [Google Scholar]
  67. Huang, H.; Yang, X. Spatiotemporal Evolution Mechanism and Dynamic Simulation of the Urban Resilience System in the Chengdu–Chongqing Economic Circle. Sustainability 2025, 17, 3448. [Google Scholar] [CrossRef]
  68. Sun, P.; Dai, P.; Hui, Y.; Zhang, J.; Zhi, Z. Spatio-temporal coupling and influencing factors of urban green innovation efficiency and ecological resilience in the Yellow River Basin. J. Northwest Univ. Nat. Sci. Ed. 2025, 55, 772–785. [Google Scholar]
  69. Wang, H.; Cui, W. Network Evolution of Digital Technology Transfers and Implications for Urban Digital Innovation Governance: Evidence from Chinese Patent Transactions. Sustainability 2025, 17, 9584. [Google Scholar] [CrossRef]
  70. Wang, K.; Fu, L. Public Data Openness and Urban Green Development Efficiency: Evidence from a Quasi-Natural Experiment of Government Data Platform Launch. Sci. Technol. Prog. Policy 2025, 42, 106–118. [Google Scholar]
  71. China National Intellectual Property Administration. Notice of the General Office of the China National Intellectual Property Administration on Issuing the Classification System for Key Digital Technology Patents (2023); China National Intellectual Property Administration: Beijing, China, 2023. Available online: https://www.cnipa.gov.cn/art/2023/9/25/art_75_187769.html (accessed on 9 May 2026).
  72. UN-Habitat. World Cities Report 2022: Envisaging the Future of Cities, United Nations Human Settlements Programme; United Nations: Nairobi, Kenya, 2022. [Google Scholar]
  73. Kopczewska, K.; Kubara, M.; Kopyt, M. Population density as the attractor of business to the place. Sci. Rep. 2024, 14, 22234. [Google Scholar] [CrossRef] [PubMed]
  74. Dastjerdi, H.R.; Mohammadi, S.; Saeidi, M.; Koohikamali, M. Developing a Population-Density-Weighted Community Health Vulnerability Index for Heat and Air Quality to Support Targeted Public Health Interventions: A Multihazard Assessment Using Remotely Sensed and Socio-economic Data in Los Angeles. Sustain. Cities Soc. 2026, 142, 107274. [Google Scholar] [CrossRef]
  75. Li, J.; Huang, Y.; Zhang, C.; Yao, D. How does public transport development contribute to carbon emission reduction? Transp. Res. Part. A Policy Pract. 2025, 191, 104327. [Google Scholar] [CrossRef]
  76. Martínez-Zarzoso, I.; Chelala, S. Trade agreements and international technology transfer. Rev. World Econ. 2021, 157, 631–665. [Google Scholar] [CrossRef]
  77. Appiah, K.; Worae, T.A.; Yeboah, B.; Yeboah, M. The causal nexus between trade openness and environmental pollution in selected emerging economies. Ecol. Indic. 2022, 138, 108872. [Google Scholar] [CrossRef]
  78. Xie, W.; Li, X. Can industrial agglomeration facilitate green development? Evidence from China. Front. Environ. Sci. 2021, 9, 745465. [Google Scholar] [CrossRef]
  79. Noring, L. Public asset corporation: A new vehicle for urban regeneration and infrastructure finance. Cities 2019, 88, 125–135. [Google Scholar] [CrossRef]
  80. Wang, Y.; Li, S. Green fiscal policy and urban land green utilization efficiency. Land 2025, 14, 727. [Google Scholar] [CrossRef]
  81. Huang, J.; Zheng, B.; Du, M. How digital economy mitigates urban carbon emissions: The green facilitative power of industrial coagglomeration. Appl. Econ. 2025, 58, 3457–3475. [Google Scholar] [CrossRef]
  82. Li, J.; Zhan, S.; Huang, T.; Nie, D. The Green Innovation Effect of Environmental Regulation: A Quasi–Natural Experiment from China. Energies 2022, 15, 7746. [Google Scholar] [CrossRef]
  83. Li, C.; Xia, W.; Wang, L. Synergies of green policies and their pollution reduction effects: Quantitative analysis of China’s green policy texts. J. Clean. Prod. 2023, 412, 137360. [Google Scholar] [CrossRef]
  84. Cheng, C.; Li, F. Ecosystem restoration and management based on nature-based solutions in China: Research progress and representative practices. Nat.-Based Solut. 2024, 6, 100176. [Google Scholar] [CrossRef]
  85. Xie, F.; Liu, G.; Zhuang, T. A comprehensive review of urban regeneration governance for developing appropriate governance arrangements. Land 2021, 10, 545. [Google Scholar] [CrossRef]
  86. Chen, Y. Financialising urban redevelopment: Transforming Shanghai’s waterfront. Land Use Policy 2022, 112, 105126. [Google Scholar] [CrossRef]
  87. Swensen, G.; Hagen, O.H.; Mehmood, A. Implementing transformative resilience in urban regeneration: Recommendations for local planning practice. Plan. Pract. Res. 2025, 40, 214–232. [Google Scholar]
  88. Ministry of Ecology and Environment of the People’s Republic of China. The Outline of the Development Plan for the Yangtze River Economic Belt Was Officially Issued: Strengthening Ecological Restoration and Promoting Harmony Between Rivers and Lakes; Ministry of Ecology and Environment of the People’s Republic of China: Beijing, China, 2016. Available online: https://www.mee.gov.cn/xxgk/hjyw/201609/t20160912_363929.shtml (accessed on 9 June 2026).
  89. Ministry of Ecology and Environment of the People’s Republic of China. Yangtze River Protection Law of the People’s Republic of China; Ministry of Ecology and Environment of the People’s Republic of China: Beijing, China, 2020. Available online: https://www.mee.gov.cn/ywgz/fgbz/fl/202012/t20201227_814985.shtml (accessed on 9 June 2026).
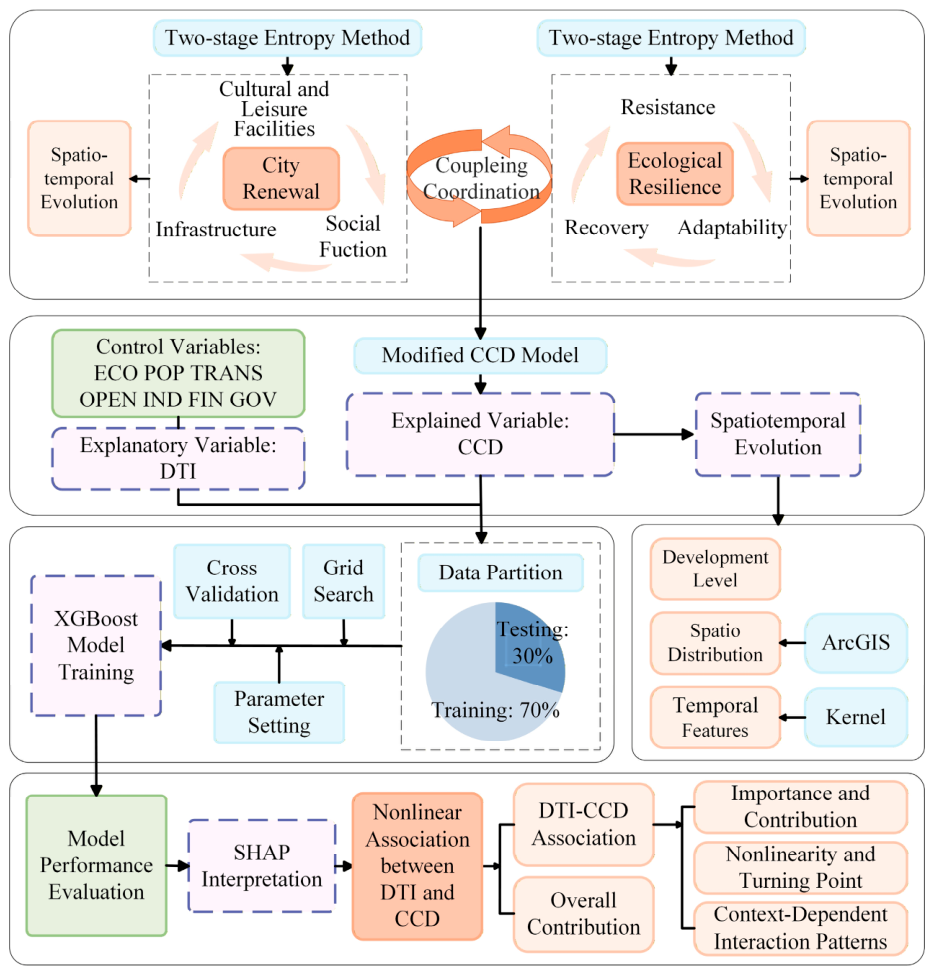
Figure 1. Research framework.
Sustainability 18 06322 g001
Figure 2. Study area.
Sustainability 18 06322 g002
Figure 3. Temporal development of UR.
Sustainability 18 06322 g003
Figure 4. Spatial pattern of UR.
Sustainability 18 06322 g004
Figure 5. Temporal development of ER.
Sustainability 18 06322 g005
Figure 6. Spatial pattern of ER.
Sustainability 18 06322 g006
Figure 7. Temporal development of CCD.
Sustainability 18 06322 g007
Figure 8. Spatial pattern of CCD.
Sustainability 18 06322 g008
Figure 9. Kernel density estimation of CCD. (a) Overall distribution of CCD in the YREB; (b) CCD distribution in the upper reaches; (c) CCD distribution in the middle reaches; (d) CCD distribution in the lower reaches.
Sustainability 18 06322 g009
Figure 10. Ranking of influencing factor importance.
Sustainability 18 06322 g010
Figure 11. SHAP dependence patterns of the predictors.
Sustainability 18 06322 g011
Figure 12. SHAP interaction patterns between DTI and the control variables.
Sustainability 18 06322 g012
Table 1. Classification criteria for CCD.
RangeDegreeSubsystem StatusDevelopment Type
0.8 < Di ≤ 1Quality coordination
(L1)
CUR > CERER lagging
CUR ≈ CERER-UR synchronized
CUR < CERUR lagging
0.6 < Di ≤ 0.8Moderate coordination (L2)CUR > CERER lagging
CUR ≈ CERER-UR synchronized
CUR < CERUR lagging
0.5 < Di ≤ 0.6Primary coordination
(L3)
CUR > CERER lagging
CUR ≈ CERER-UR synchronized
CUR < CERUR lagging
0.4 < Di ≤ 0.5Basic incoordination
(L4)
CUR > CERER lagging
CUR ≈ CERER-UR synchronized
CUR < CERUR lagging
0.2 < Di ≤ 0.4Moderate incoordination (L5)CUR > CERER lagging
CUR ≈ CERER-UR synchronized
CUR < CERUR lagging
0 < Di ≤ 0.2Severe incoordination (L6)CUR > CERER lagging
CUR ≈ CERER-UR synchronized
CUR < CERUR lagging
Note: CUR ≈ CER indicates that ∣CUR − CER∣ ≤ 0.1.
Table 2. Indicator systems for UR and ER.
SystemsDimensionsIndicatorsUnitDirectionsData Sources
URInfrastructure constructionBuilt-up areakm2+China Urban Construction Statistical Yearbook
Urban road area per capitam2/P+
Density of water supply pipelines in built-up areaskm/km2+
Gas penetration rate%+
Social function developmentNumber of regular higher education institutionsInstitutions+China City Statistical Yearbook, municipal statistical yearbooks
Personnel in public administration and social organizations10,000 P+
Number of medical and health institutionsInstitutions+
Education expenditure per capitaYuan/P+
Cultural and leisure facility constructionLand area for commercial and service facilitieskm2+China Urban Construction Statistical Yearbook
Public library collections10,000
Volumes
+
Number of road lighting lampsLamps+
Number of star-rated hotelsHotels+Municipal statistical bureaus
ERResistanceIndustrial wastewater discharge per unit of GDPTons/10,000 YuanChina City Statistical Yearbook; municipal statistical yearbooks
Industrial SO2 emissions per unit of GDPTons/10,000 Yuan
Industrial soot and dust emissions per unit of GDPTons/10,000 Yuan
Chemical fertilizer useTonsMunicipal statistical yearbooks
AdaptabilityProportion of days with good air quality%+https://www.weather.com.cn/ (accessed on 9 June 2026)
Comprehensive utilization rate of general industrial solid waste%+China City Statistical Yearbook; municipal bulletins
Harmless treatment rate of domestic waste%+China Urban Construction Statistical Yearbook
Centralized wastewater treatment rate%+
RecoverabilityGreen coverage rate of built-up areas%+
Park green space per capitam2/P+
Share of energy conservation and environmental protection expenditure in public budget expenditure%+Municipal statistical yearbooks and finance bureaus
Number of green patentsPatents+China National Intellectual Property Administration
Note: “+” indicates a positive indicator, whereas “−” indicates a negative indicator.
Disclaimer/Publisher’s Note: The statements, opinions and data contained in all publications are solely those of the individual author(s) and contributor(s) and not of MDPI and/or the editor(s). MDPI and/or the editor(s) disclaim responsibility for any injury to people or property resulting from any ideas, methods, instructions or products referred to in the content.