Article

Graphing the European Green Deal: A Graph Retrieval-Augmented Generation Pipeline for Policy Documents Analysis


by
Eleftheria Arkadopoulou
1,
Ioanna Mandilara
1,
Christina-Maria Androna
1,
Eleni Fotopoulou
1,
Anastasios Zafeiropoulos
1,*,
Dimitrios Dechouniotis
2 and
Symeon Papavassiliou
1
1
School of Electrical and Computer Engineering, National Technical University of Athens, 15780 Athens, Greece
2
Department of Electrical and Computer Engineering, University of Peloponnese, 26334 Patras, Greece
*
Author to whom correspondence should be addressed.
Sustainability 2026, 18(12), 6193; https://doi.org/10.3390/su18126193
Submission received: 29 April 2026 / Revised: 8 June 2026 / Accepted: 13 June 2026 / Published: 16 June 2026
(This article belongs to the Section Development Goals towards Sustainability)

Abstract

The European Green Deal (EGD) is the European Union’s comprehensive growth strategy for achieving climate neutrality by 2050. It comprises 17 interrelated policy documents, spanning sectors from energy and transport to biodiversity and sustainable finance. Despite their collective importance, these documents are characterized by significant heterogeneity in structure, terminology, and scope, making it challenging for non-technical stakeholders to navigate, cross-reference, extract, and validate information across their corpus as a whole. Considering the limitations of Natural Language Processing (NLP) approaches targeting the accessibility of policy documents and the lack of prior work explicitly focusing on the EGD and sustainability, we introduce a graph retrieval-augmented generation (GraphRAG) pipeline for natural language question answering (QA) over the EGD corpus. Our contributions include the conceptualization of a generalizable entity type set for policy documents for the EGD and its representation in the form of a knowledge graph, the development of two novel graph-based retrieval strategies that exploit the pre-computed structural properties of the knowledge graph, and the release of a specialized evaluation dataset, built on persona profiles matching real-world user profiles. The implementation and evaluation of the proposed approach are detailed, highlighting its effectiveness for the analysis of policy documents for the EGD against other GraphRAG baselines.

1. Introduction

Policy documents by nature present significant challenges for human navigation: they are characterized by dense, domain-specific language and terminology, heterogeneity in structure, and complex cross-references. This hinders the process of validating information across them, particularly for non-technical stakeholders who lack the expertise to navigate such documents and synthesize their content [1], and often leaves the extraction of knowledge to expert groups and extensive manual procedures [2]. These challenges are amplified in large multi-document policy corpora, where information is distributed across numerous interrelated documents with overlapping scope and no systematic representational framework to support cross-document analysis [2]. The European Green Deal (EGD) exemplifies this issue: as the European Union’s most comprehensive growth strategy to achieve a climate-neutral sustainable economy [3], it encompasses 17 interrelated policy documents that span different sectors [4], each independently produced with its own structure, terminology, and level of technicality. The absence of a unified and structured representation of the EGD documents creates barriers to informed decision-making and limits how policymakers and citizens engage and act on European Union (EU) sustainability policies.
Complex policy document collections pose a well-established challenge for automated analysis due to their inherent structural and linguistic characteristics. Prior efforts have sought to make policy corpora accessible for querying using approaches based on Natural Language Processing (NLP) [1]. Within EU text corpora, contributions to make legislative and policy collections explorable have ranged from text classification and information extraction [1,2] to conversational interfaces for question answering (QA) over legal documents [5]. Specifically around the Green Deal, existing work has focused on mapping EGD documents to the Sustainable Development Goals (SDGs) of the United Nations through automated NLP pipelines [6], as well as structured knowledge graph representations that integrate EGD documents into broader progress tracking frameworks of the SDGs, such as the SustainGraph [7].
Although these approaches improve accessibility, a key downstream task is QA on policy documents. As far as this is concerned, two issues emerge as most persistent: text length limitations and failure to synthesize information originating from diverse documents that require cross-referencing. These limitations motivate Retrieval-Augmented Generation (RAG) approaches, which focus on retrieving data from external knowledge bases before generating answers. However, standard RAG is constrained by flat chunk-based retrieval and struggles to capture hidden relationships in different documents [8,9]. To address these limitations, graph retrieval-augmented generation (GraphRAG) has emerged as a widely adopted framework for Large Language Model (LLM)-based QA over large text corpora, demonstrating consistent improvements over standard retrieval generation techniques in comprehensiveness, diversity, and contextual depth of generated answers [8,9,10]. Its core design, which includes the encoding of the document corpus into a structured knowledge graph, enables the retrieval of knowledge that is not constrained by the length or scope of the individual document, and supports the synthesis of information spanning multiple sources [9,11].
Building on these developments, we propose an extension of the Microsoft Graph RAG framework [9] in the EGD domain, enhanced with a cost-effective retrieval stage. Specifically, our work extends the SustainGraph initiative, which provides unified knowledge representation for environmental intelligence by transforming existing representations of the EGD corpus from isolated entities into a unified structured graph, enabling more effective cross-document reasoning. Our cost-effective domain adaptation pipeline is tailored to the EGD and sustainability domain, allowing effective retrieval and reasoning over specialized policy documents. The objective is to develop policy analysis techniques in the EGD domain that can enable policymakers, scientists, business stakeholders, and citizens to easily navigate the wide set of available and complex information, extract insights, examine adoption, identify trends and inefficiencies in existing legislation. Focus is given on the development and performance assessment of policy document analysis techniques, putting the basis for the development of user-friendly applications in the future that can be accessible by a wide public. To achieve this, we model the EGD corpus as a knowledge graph, capturing latent and semantic relationships between entities mentioned in the diverse set of EGD documents. To further improve QA performance, we introduce two context-aware and cost-effective retrieval strategies for precise and accurate answer generation [11,12]. Overall, the current work aims to improve the factual grounding of LLMs, mitigate phenomena of hallucination in multi-document settings, and provide traceable answers to multi-context queries in relation to policy document collections. The source code is available in the Gitlab repository [13].
In summary, the key contributions of this work are highlighted as follows:
  • We propose a standardized and generalizable entity type set that captures the core properties of policy documents, focusing on the EGD. We further integrate these entities into a knowledge graph schema, tailored to the EGD domain. This knowledge graph captures semantic relationships across policy documents and supports graph-based reasoning for QA.
  • We design two graph-based, cost-efficient retrieval strategies that take advantage of the inherent structural properties of the EGD knowledge graph. The experimental results show that these strategies offer a compelling trade-off between QA performance and computational efficiency compared to established graph-retrieval methods, such as Microsoft’s GraphRAG framework.
  • We introduce a specialized evaluation dataset for the EGD domain, built from real-world user personas, designed to align with policy document queries across multiple and individual policy documents.
  • We demonstrate that open-source LLMs can achieve comparable performance on graph generation and retrieval tasks, reinforcing the reproducibility and community-driven development of high-quality GraphRAG pipelines, which are no longer dependent on closed-source models.

2. Related Work

The application of NLP to policy and regulatory documents has attracted growing research interest, driven by the need to make large, heterogeneous document collections more accessible for analysis and querying [1,14]. Existing work includes a chatbot interface for QA on legislative corpora [5], the application of text classification, topic modeling, and event extraction methods on policymaking tasks [1,14], and the investigation of LLMs for climate policy analysis [2]. However, prior approaches often treat documents in isolation and therefore struggle to capture cross-document relationships or synthesize information across large, interrelated collections, noting performance degradation significantly on queries requiring multi-document synthesis [5]. Within the EGD domain specifically, existing computational work has focused on mapping EGD documents to the United Nations SDGs through automated NLP pipelines [6,15] and on structured knowledge graph representations incorporating EGD policy content as part of a broader SDG progress-tracking infrastructure [7]. These approaches support analytical tasks such as classification and alignment but are not designed for interactive natural language querying over the full corpus.
RAG aims to solve the problem of grounding LLM responses to knowledge corpora by retrieving text passages (chunks) from an external corpus based on their lexical or semantic similarity to the query, providing relevant context at inference time to enhance generation quality [16,17,18]. However, such approaches struggle to capture cross-passage relationships or answer broad corpus-level queries [9]. Previous efforts have attempted to go beyond traditional RAG by leveraging different data structures (e.g., trees) to store text chunks in, such as RAPTOR [19]. Within these approaches, GraphRAG has emerged as a prominent variant, representing information as graph structures, such as knowledge graphs, and explicitly encoding relationships between entities, allowing more precise, comprehensive, and context-aware retrieval [11,12].
GraphRAG approaches manage to mitigate well-known issues when it comes to generative model grounding, such as restricted context windows, hallucination, lack of domain-specific knowledge, and dependence on outdated information [8,11]. They generally follow a two-stage pipeline: an indexing stage, where an index database is constructed from the knowledge corpus, followed by a retrieval stage, in which the user question is used to navigate the database and retrieve relevant information to pass to the LLM which will generate an answer [11,12]. The design choices at each stage vary significantly across frameworks, giving rise to diverse approaches regarding retrieval granularity, computational cost, and answer quality [10]. A prominent GraphRAG approach is Microsoft GraphRAG [9], which has become the most widely used baseline [8,11]: it constructs a hierarchical knowledge graph through LLM-based entity and relationship extraction, enriched with community detection and LLM-generated community summaries, and follows with the application of a two-fold search method approach. Other similar recognized literature [10] includes Knowledge Graph Prompting [20], which creates a passage-based knowledge graph, HippoRAG, which integrates PageRank for passage integration in the graph, and LightRAG [21], which offers a lightweight Knowledge Graph alternative to Microsoft GraphRAG.
Limited GraphRAG approaches have been explored in the context of policy documents. GraphCompliance [22], which constructs knowledge graphs from regulatory documents, demonstrates the utility of graph structure for navigating cross-referenced policy content, while [23] extracts a knowledge graph from EU energy efficiency guidance and regulatory documents and applies graph-based retrieval to answer user questions. Regarding the realm of sustainability as a whole, ref. [24] applies the Microsoft GraphRAG algorithm to a corpus of climate change reviews and demonstrates that GraphRAG improves performance on cross-document sustainability queries compared to traditional RAG by capturing relationships between sustainability concepts more effectively, while [25] explores the application of RAG for climate-specific decision making based on technical documents. Although these works demonstrate the growing interest in climate policy and sustainability document corpora, the domain of the EGD specifically has received limited attention by relevant RAG or GraphRAG approaches, particularly with respect to cross-document natural language QA.

3. Methodology

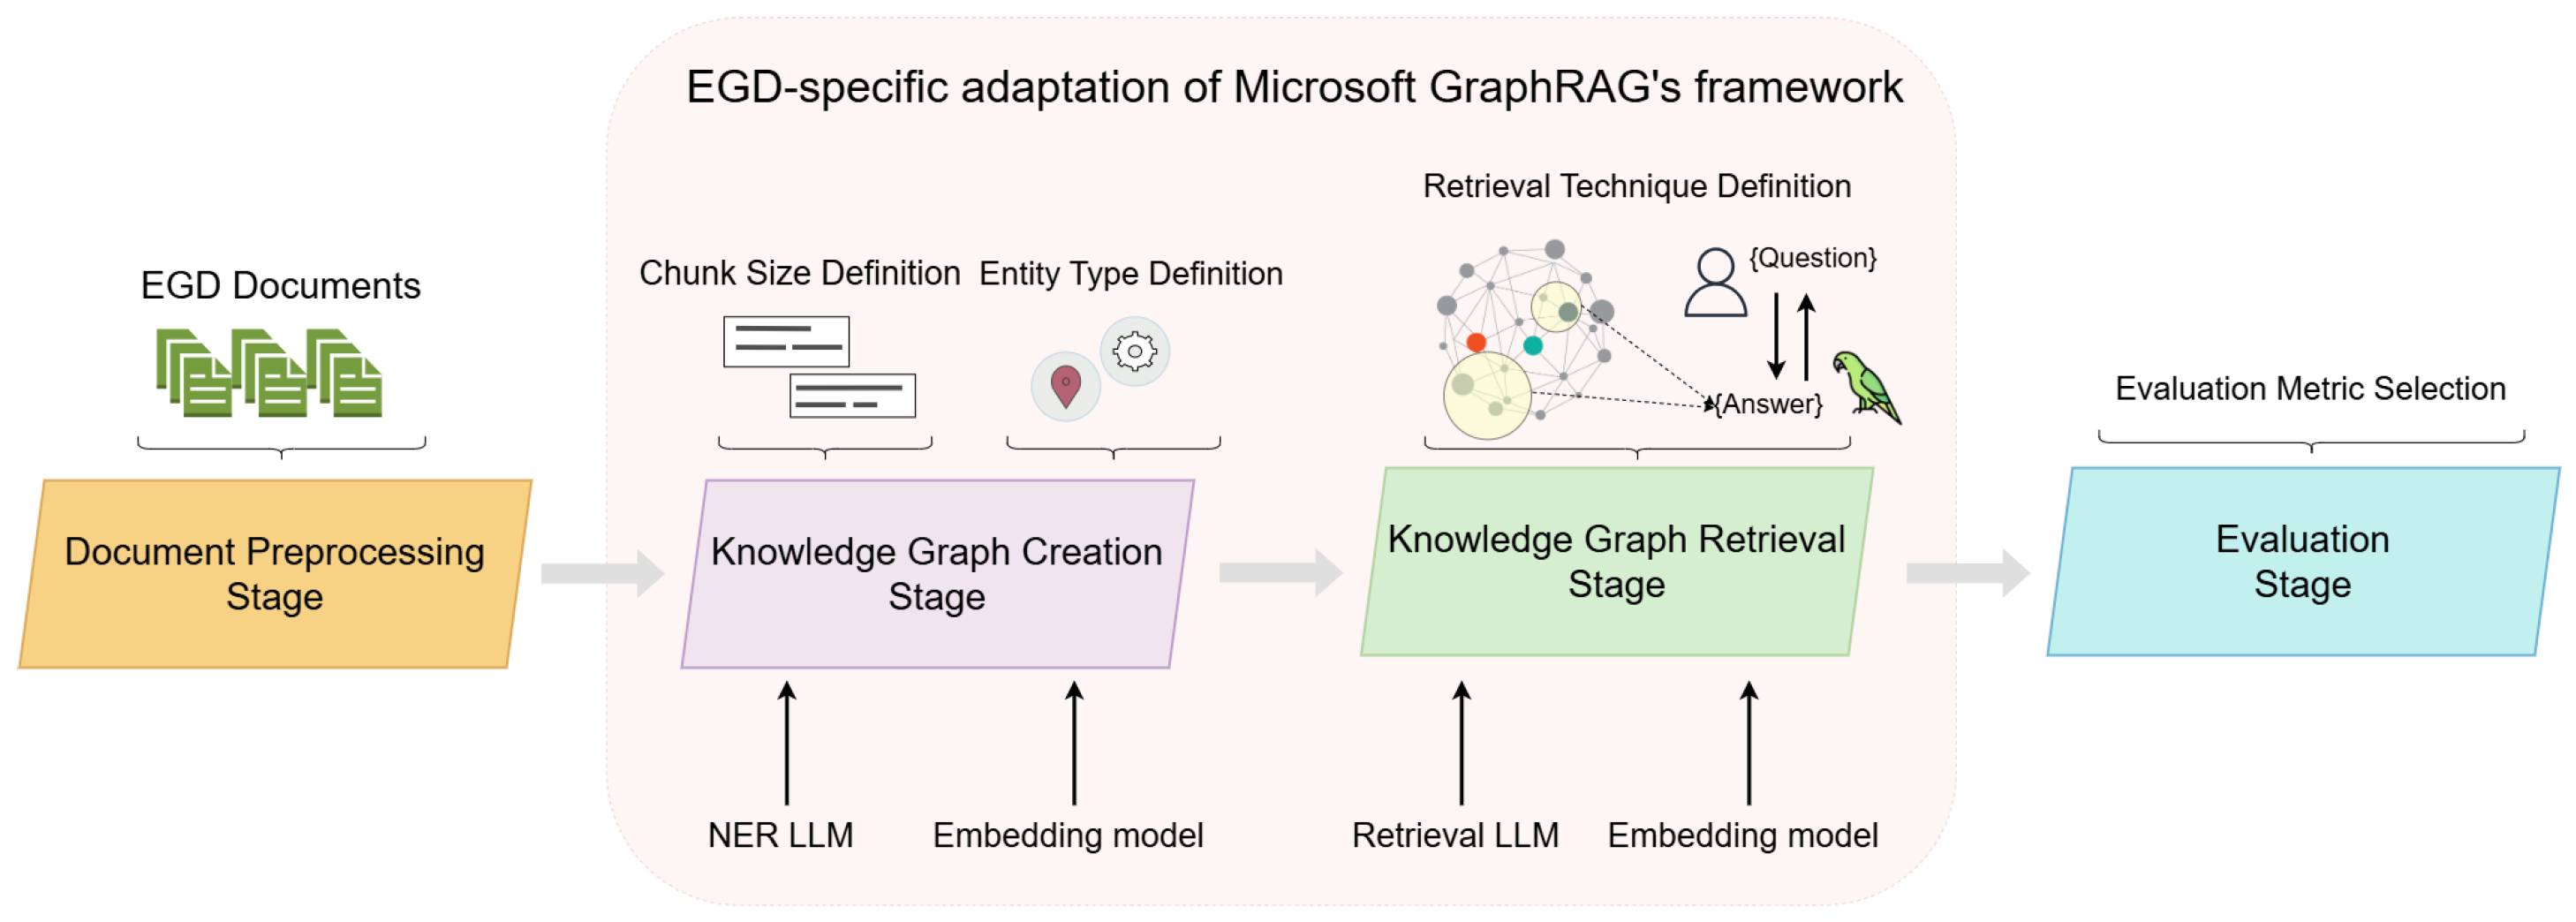
The GraphRAG pipeline of the EGD-domain implemented in our work is illustrated in Figure 1. Our implementation comprises four stages, which are described below: the Document Preprocessing stage, the Knowledge Graph Creation stage, the Knowledge Graph Retrieval stage, and the Evaluation stage. The Document Preprocessing stage receives the 17 policy documents in question as input and prepares them for knowledge graph construction. As per Microsoft Graph RAG approach, the Knowledge Graph Creation stage constructs the domain-specific knowledge graph from the preprocessed corpus, guided by two key design choices introduced in this work: a custom chunk size definition derived from corpus token analysis and a custom entity type definition tailored to the EGD domain, while the Knowledge Graph Retrieval stage focuses on graph retrieval techniques, processing natural language questions to extract relevant context from the constructed knowledge graph. Finally, our Evaluation stage assesses the quality of generated answers through a combination of a purpose-built evaluation dataset and a set of complementary evaluation metrics. Each stage is described in detail in the following subsections.

3.1. Document Preprocessing Stage

The first stage involves the preprocessing of the 17 individual EGD documents and their transformation into a unified text corpus. The documents are sourced in HTML format from the EU law repository [4], from which headers, footers, and other non-content elements are stripped. The cleaned files serve as input to the knowledge graph construction stage.

3.2. Knowledge Graph Creation Stage

This stage covers the construction of the knowledge graph from our document corpus through a multi-stage LLM pipeline, which closely follows the implementation of the Microsoft GraphRAG framework [9], tailored to our domain of Green Deal documents. The process begins by splitting the entirety of the text into text chunks of a pre-defined, custom size, which are passed to an LLM prompted to perform Named-Entity Recognition (NER) from a set of custom entity types. Both chunk size and entity definition are key parameters for the NER process, as they directly affect its granularity and completeness [9,26]. This design choice is also important for adapting Microsoft’s GraphRAG framework to our EGD domain, ensuring that the constructed knowledge graph effectively captures relevant contextual information. The LLM used for NER and the embedding model used to calculate the entities’ embeddings are configurable components of this stage and can be varied across implementations.
Chunk size determines the amount of context available to the LLM at each passing; phenomena whereby information at the upper and lower boundaries of a text chunk is lost during retrieval directly impact the quality and quantity of data the LLM is able to extract [27]. Prior work on optimal chunk size selection consistently demonstrates that larger chunks of 512–1024 tokens improve retrieval quality in domains requiring broader contextual understanding [27] and for long, domain-specific documents like the EGD [28]. The chunk size for our customized configurations was determined through a token-based analysis of the EGD corpus, which involved segmenting the documents into structural sections, and analyzing the token distribution within each section for all 17 documents.
Entity types, on the other hand, define which concepts are captured as nodes in the graph, affecting its density and therefore the quality of retrieval of information from within it. Entity types were derived through a corpus analysis pass in which a general-purpose NER model with a built-in, predefined entity type set was used to automatically identify and aggregate the types of named entities within the corpus. The resulting candidate types were then ranked by frequency of occurrence and manually inspected to identify recurring, policy-relevant conceptual categories, based on domain expertise and prior findings [2]. This yielded a proposed schema of domain-specific entity types reflecting the structure of EGD policy documents. This schema was further validated through a complementary zero-shot extraction pass, in which a NER model trained to extract entities against user-defined type labels was given the text corpus without any task-specific training to confirm that all proposed entity types yielded matches across the text. This process resulted in a generalizable, standardized entity vocabulary for policy document representation in the EGD, which is presented in Table 1.
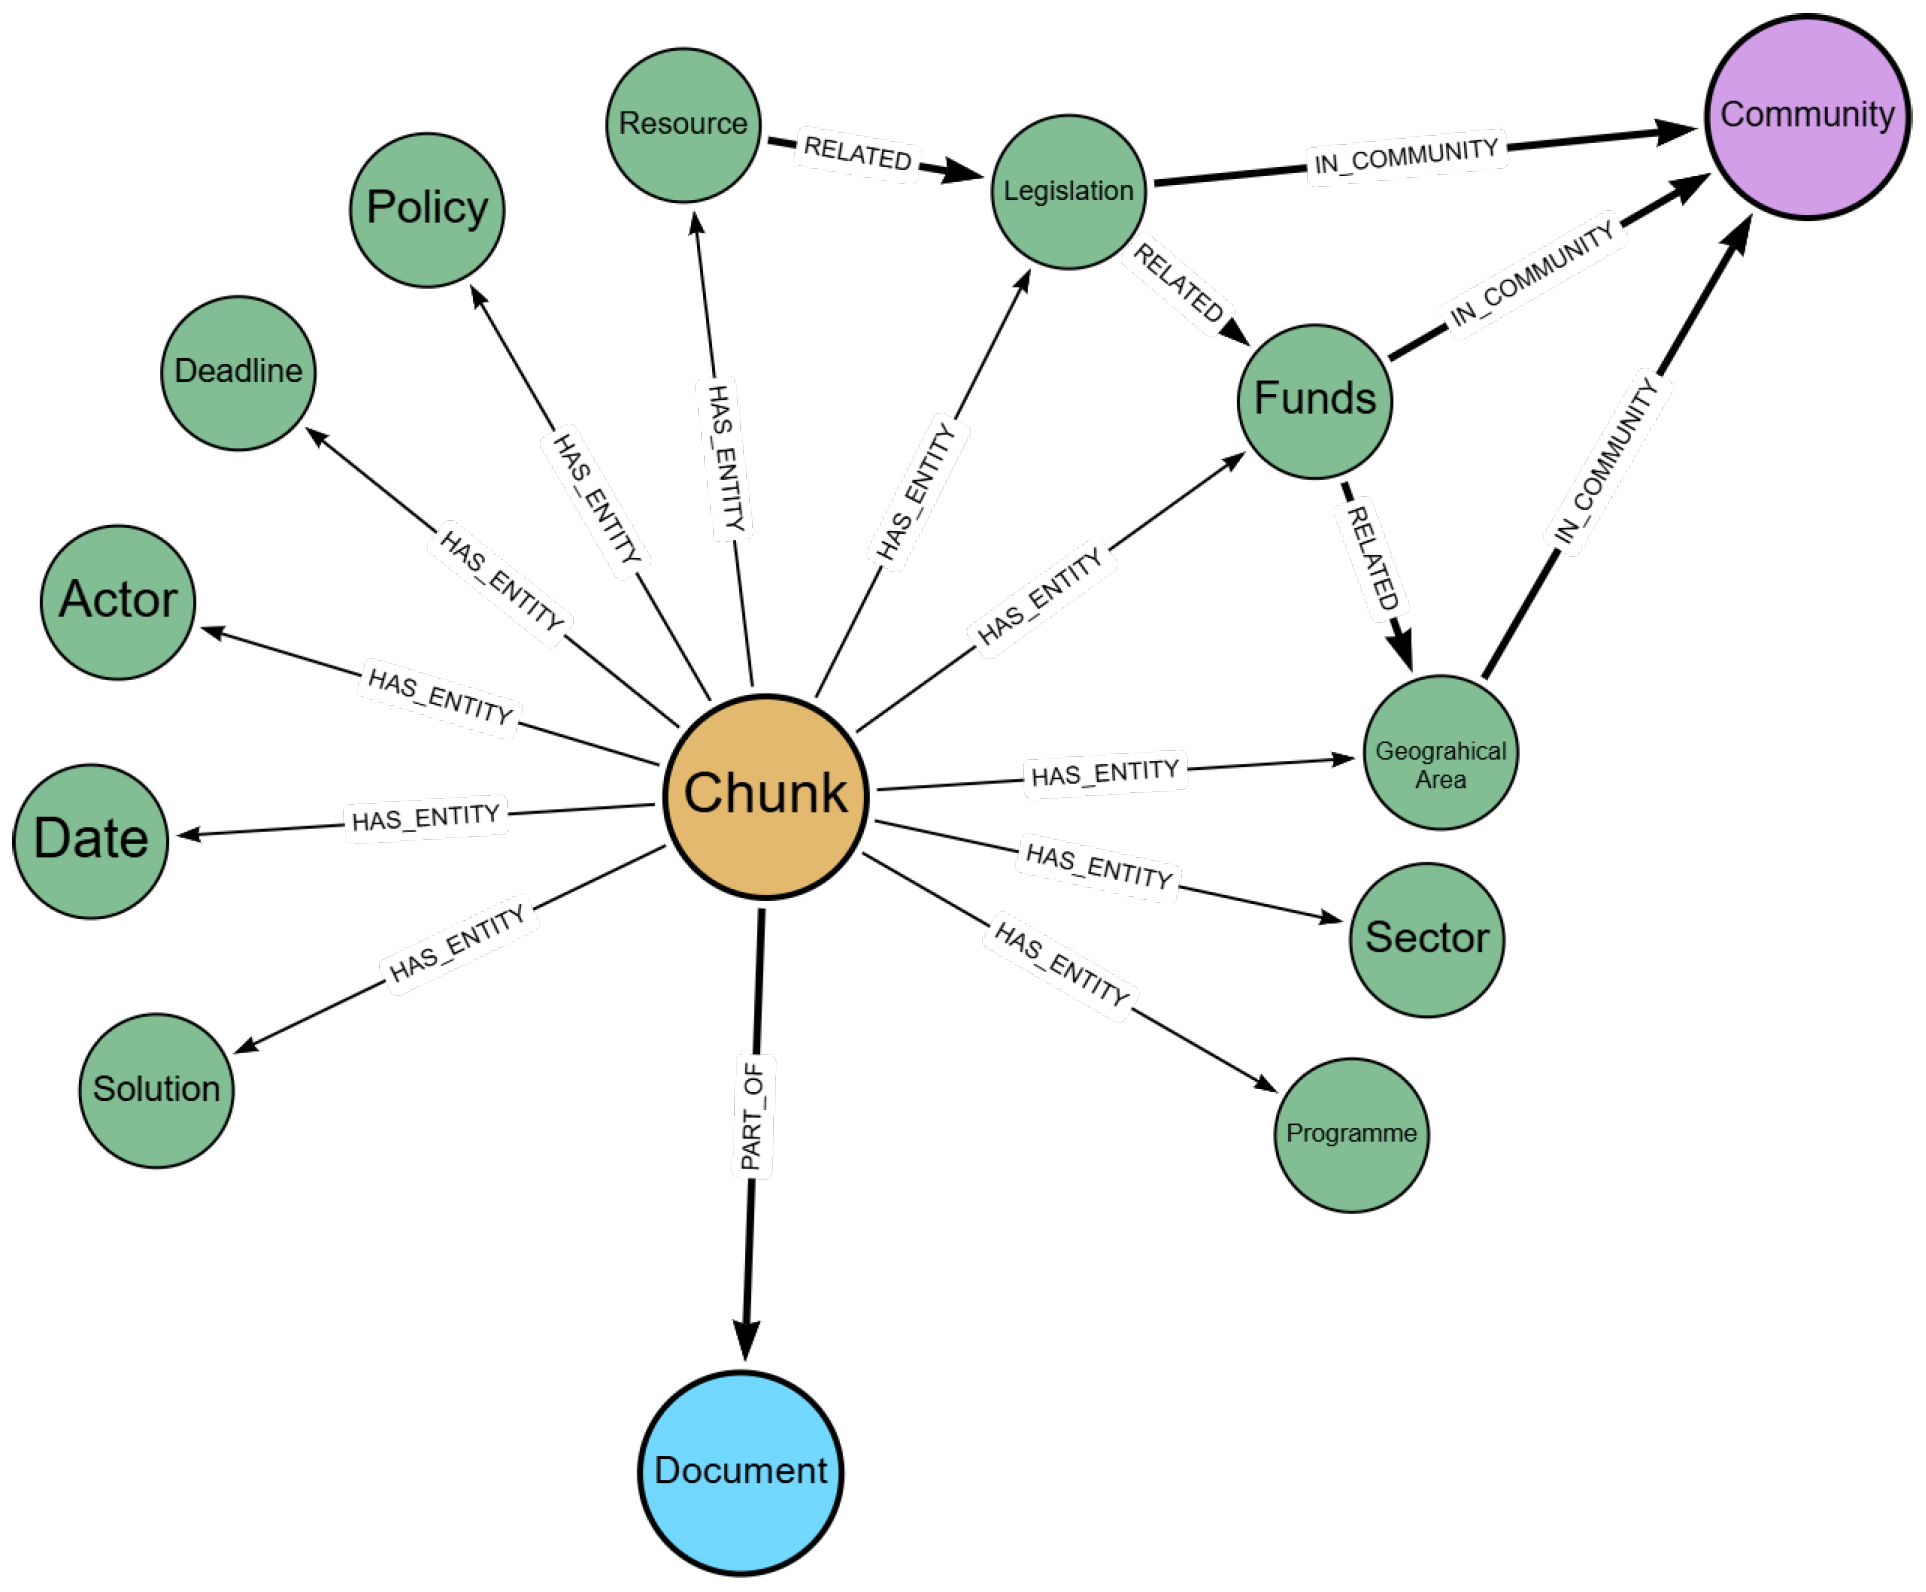
Following the process of chunk size and entity type selection, the knowledge graphis constructed; it comprises our proposed entity types that reflect the thematic connections within the different EGD documents, along with their corresponding relationships, descriptions, embeddings, and communities detected using the Leiden community detection algorithm [29], per the Microsoft GraphRAG framework. An indicative representation of the resulting knowledge graph schema is illustrated in Figure 2. Green nodes represent the eleven domain-specific entity types, which are interconnected through RELATED relationships, reflecting the cross-referential base of our text corpus. The orange node represents text chunks, linked to entity nodes via HAS_ENTITY edges and to the blue document node via a PART_OF relationship, encoding the hierarchical nature of extracted entities tracing back to their source documents. The pink node represents detected communities, connected to entity nodes through IN_COMMUNITY edges. Entity and community descriptions and embeddings are encoded into the graph as node properties.

3.3. Knowledge Graph Retrieval Stage

Once the knowledge graph has been constructed, the Knowledge Graph Retrieval stage extracts relevant information in response to user questions. This stage involves selecting an appropriate retrieval strategy, along with configuring the LLM used for prompt-based answer generation and the embedding model for similarity-based search over the graph representations.
Regarding the retrieval strategies, the Microsoft GraphRAG implementation provides two main retrieval strategies: local and global search. Both strategies have practical limitations. The boundary between entity-focused and corpus-level queries is often ambiguous and the proposed system needs explicit guidance on which strategy to use; distinguishing which queries are best suited for local and which for global search poses a significant challenge [8]. Furthermore, these graph retrieval methods incur a large number of LLM invocations, thereby making them computationally expensive, and they do not fully exploit the constructed knowledge graph. This motivated the design of the two custom retrieval strategies presented in this work. These strategies leverage the knowledge graph constructed in the previous stage and avoid the need for redundant preprocessing of text chunks at query time by invoking the LLMs in an iterative manner.
The proposed community-based retrieval strategy leverages community reports stored in the constructed knowledge graph, representing high-level summaries of the proposed entities. User questions are embedded using the same embedding models used in the previous stage, and their cosine similarity is assessed against the precomputed embeddings of community reports. The top-k similar community reports are retrieved and provided to an LLM generation prompt to produce an answer. This strategy exploits the hierarchical community structure already encoded in the constructed Knowledge Graph, and thereby eliminates the need for reprocessing or resummarizing any graph content. Furthermore, it leverages the pre-computed embeddings of the communities stored in the knowledge graph. Thus, it is more computationally efficient than the search methods proposed by Microsoft GraphRAG, which perform multiple LLM iterations over all generated community reports per query and conduct several LLM-based map-reduce aggregations. This method aims to enable target access to thematic clusters of the graph without the computational overhead of exhausting processing.
The second proposed retrieval strategy (entity-based) is grounded in the entities that formulate the community reports within the constructed knowledge graph. At first, the user question is embedded using the same embedding models used in the previous stage and cosine similarity is computed with the entities entailed in the graph. Then, the top-n most relevant entities against the user question are selected. These entities are mapped to their associated communities, and each community report is assigned a similarity score corresponding to the highest cosine similarity among its constituent entities. The top-k community reports are retrieved along with the top-n entity descriptions, and both are provided jointly to the LLM generation prompt to provide the answer. This strategy combines specific entity-level facts with broader community-level context in the generated answer. In doing so, entity-based retrieval leverages the relational structure of the graph to bridge fine-grained entity knowledge together with a broader thematic context.

3.4. Evaluation Stage

To evaluate the performance of our EGD-domain pipeline, we sought to generate a diverse synthetic dataset of QA pairs, spanning the entirety of the 17 EGD documents. A comprehensive and holistic evaluation of our GraphRAG system would require questions of varying complexity; therefore, we decided to include both single-document questions that assess precise retrieval and multi-document questions that assess the ability of the system to integrate information across multiple sources [16,17]. Our evaluation dataset was constructed around a set of carefully designed personas, which represented realistic profiles of users inquiring about the Green Deal corpus and related policy documents. Persona profiles were selected based on domain expertise, to ensure that the generated queries reflect the diversity of information needs and perspectives of real-world engagement. Similarly to the domain-specific entity schema proposed in Section 3.2, the defined personas were designed to be generalizable beyond the EGD corpus, representing a standardized set of user profiles applicable to EU policy documentation related to environmental, climate change, and sustainability aspects more broadly, and reusable as a reference framework for future evaluation datasets in the policy QA domain. The inclusion of personas in dataset generation assisted in the provision of further contextual reference for the queries. Our chosen persona profiles, along with their assigned role descriptions, are presented in Table 2.
Another critical step in the evaluation process is the selection of appropriate evaluation criteria to be used to evaluate the quality of the responses in all our implementations of the retrieval strategy. The assessment framework proposed by Microsoft GraphRAG assesses the quality of the answers through pairwise, head-to-head comparisons judged by an LLM on four criteria: comprehensiveness, diversity, directness, and empowerment. However, our experiments in LLM-as-a-judge pairwise comparisons proved it to be prone to the phenomenon of position bias, whereby the order in which answers are presented to the LLM in the prompt influences the generated outcome [30,31]. To mitigate this, instead we transformed the four criteria descriptions as defined in [9] into rubric-based scorers [32], whereby each answer is evaluated independently and objectively against a scoring rubric rather than in relation to a competing answer. A rubric defines a set of descriptive criteria at discrete score levels, against which an LLM judge evaluates each answer in isolation. The judge assigns a score based on how well the answer meets the defined criteria at each level [30], eliminating the influence of the order of the answers on the evaluation outcome. To provide a more comprehensive answer evaluation, we complemented these rubric scores with additional LLM-based metrics.

4. Experimental Setup

4.1. Knowledge Graph Creation

For the Knowledge Graph Creation stage, we experimented with various configurations to construct a knowledge graph tailored to the EGD domain. These configurations include the definition of the LLM used in an extraction prompt to perform NER, the text embedding model required for retrieval, and two key parameters for effective NER in the corpus: the chunk size (including token overlap) and the candidate entity types.
As a first step, the SpaCy [33] library, an NLP library with built-in, predefined types for entity recognition, is used to perform our corpus analysis, which aims to extract the candidate entity types for our domain. Running the SpaCy en_core_web_lg v3.8.0 model [34], a large NLP pipeline based on a token-to-vector architecture over our preprocessed document corpus yielded a total of seventeen unique entity types, which we subsequently filtered for domain relevance and enriched with additional types based on domain expertise. The resulting set of eleven candidate entities is presented in Table 1. To further validate the effectiveness of our entity definition, we conducted a complementary zero-shot extraction pass, for which we selected GLiNER [35], a generalist model for zero-shot NER that enables extraction against arbitrary entity types. GLiNER confirmed the presence of entities matching all eleven domain-specific types across the corpus, with all categories yielding substantive extractions—amounting to 5098 unique entities in total—and thus verifying that the proposed entity extraction schema is empirically grounded in the corpus. The breakdown per entity type spotted by GLiNER in the corpus, together with examples extracted from each type, is presented in Appendix A.
Following this, to determine the best suited chunk size for our text corpus, we conducted an analysis of token distribution across the EGD, treating each document section as a standalone unit of analysis. The distribution of section lengths is highly skewed and reflects heterogeneous document structures. Across the full corpus, the 75th percentile of the distribution falls at 1136 tokens; moreover, many sections are extremely short (median = 22 tokens), driven by highly segmented documents. It is also to be noted that a subset of policy-oriented documents contains substantially longer sections. A chunk size of 1024 tokens with a 100-token overlap was therefore selected as the most natural fit, informed by two complementary considerations. First, prior work demonstrates that chunks of 512–1024 tokens yield better retrieval results in domain requiring thematic, contextual understanding, while smaller chunks are better suited for concise, fact-based queries [27]. NVIDIA’s technical guidelines similarly recommend 512–1024 token chunks for long, domain-specific documents [28], which is consistent with the lengthy, policy-dense nature of the EGD corpus. Second, our corpus analysis dictates that the threshold of 1024 tokens accommodates most sections below the 75th percentile without fragmentation. This minimizes the likelihood that sentences or semantically related content are divided between chunk boundaries, preserving contextual coherence and limiting information loss. At the same time, the threshold remains below the upper quartile of section lengths, avoiding excessive context padding while maintaining a balance between section integrity and computational efficiency.
After determining the key parameters for the NER process, we experimented with different LLMs for NER and embedding models. In particular, we considered GPT-4o [36], which serves as the default LLM used by Microsoft GraphRAG in the prompts responsible for NER, alongside with the text-embedding-3-small [37] embedding model, and two open-source variations of this configuration: the LLama-8B model [38] and the Llama-70b model [38], with the nomic-embed-text embedding model [39]. Table 3 presents our four experimental configurations in detail: the Microsoft GraphRAG configuration in its default setting, which served as a baseline (Microsoft GraphRAG with GPT-4o); a customized variant that extends this configuration with the validated EGD entity types and a chunk size of 1024 with a 100 token overlap (EGD GraphRAG with GPT-4o); an open-source adaptation of the customized configuration using LLama-8b, to assess the viability of a cost-free solution (EGD GraphRAG with Llama-8b); and an open source adaptation of the customized configuration using Llama-70b, to further investigate open-source alternatives and explore the offered trade-off between cost and performance. In the case of the Llama-8b open-source variation configuration, the models are deployed in an NVIDIA Tesla T4 16 GB GPU. The selected configurations ensure a controlled and fair comparison between the default Microsoft GraphRAG configuration and a customized EGD-adapted version, which aligns both chunk size and entity types within the EGD domain, where the NER process is performed using both open-source and close-source models. The extraction prompt used in the customized variants that incorporate our proposed entity types is presented in Appendix B.
The four different graphs generated by the knowledge graph configurations were imported into a local instance of the Neo4j graph database and enriched with the pre-computed entity and community report embeddings as node properties, following the integration approach described in [40]. In this way, the proposed graph retrieval strategies can effectively leverage the constructed knowledge graphs, and a graphical visualization of the constructed graphs is available. The neo4j dumps of the four knowledge graphs can be found in our Gitlab repository [13].

4.2. Graph Retrieval

For the Graph Retrieval stage, we experimented with different retrieval LLMs and retrieval strategies for answer generation. Regarding the retrieval models, the GPT-4o serves as the baseline retrieval model across all knowledge graph configurations. For the open-source configurations presented in Table 3, we also employed the same open-source models (Llama-8b, Llama-70b) used during knowledge graph construction in the Knowledge Graph Retrieval stage. This serves a dual purpose: it allows for the assessment of whether matching the retrieval model to the graph construction model affects answer quality, and for the evaluation of the viability of fully open-source GraphRAG pipelines as accessible alternatives. Regarding the retrieval strategies, we experimented with the global and local strategies proposed by Microsoft GraphRAG as a baseline, along with our proposed techniques. For the case of our custom retrieval techniques, the generation prompts are presented in Appendix C. For all strategies, we experimented with the same embedding model used during the knowledge graph creation stage.
For both community- and entity-based retrieval strategies, we conducted a sensitivity analysis on the parameters k and n, with the purpose of examining the effect the provided context would have on the generation of answers. For the community-based retrieval strategy, we experimented with two different parameter configurations: k = 5 and k = 10 . For the entity-based retrieval strategy, we also experimented with two different parameter configurations: k = 5 / n = 10 , and  k = 10 / n = 15 . Our choice of parameter values was made on the basis of the need to balance a sufficiently representative context against the risk of exceeding the effective context window and introducing noise.

4.3. Evaluation Dataset Generation and Criteria

The evaluation of our GraphRAG pipeline required the design of a high-quality synthetic dataset. Through experimentation with different testset generation approaches, we inferred that prompting an LLM with individual documents produces only single-document QA pairs [26,41], while prompting with a high-level corpus description [9,21] cannot guarantee that the questions are grounded in the actual content of the document, nor provide the reference answers required for ground truth evaluation. To address these issues, we opted to use the RAGAS TestsetGenerator module [42], which allowed us to generate a synthetic testset spanning both single- and cross-document queries of varying difficulty levels and different characteristics such as reasoning, conditioning, and multi-context [42]. We used GPT-4o as the backbone LLM for the prompts used in RAGAS, similarly to [26,43]. We configured the parameters of the RAGAS module in order to produce an evaluation dataset consisting of 103 QA pairs, with 40% of them being single-hop and 60% being multi-hop, ensuring coverage across varying levels of reasoning complexity. Additionally, each sample question in our dataset is associated with one of the seven predefined personas, as presented in Table 2.
Following the construction of the evaluation dataset, the selection of appropriate evaluation criteria is a critical step. We adapted the four Microsoft GraphRAG evaluation criteria mentioned in Section 3.4 into rubric-based scorers [32] in order to integrate them within the RAGAS evaluation framework [16] to leverage its structured, LLM-based assessment capabilities. The descriptions used for the rubric adaptation are presented in Appendix D. These criteria were complemented with additional RAGAS LLM-based assessment metrics [16]—AnswerRelevancy, AnswerAccuracy, SemanticSimilarity, and FactualCorrectness—implemented directly as provided by the RAGAS framework, and selected to provide a more granular evaluation of answer quality along dimensions not covered by the adapted rubrics, similarly to [23]. Several of the selected metrics naturally overlap. Comprehensiveness, Diversity, and Directness all feed into Answer Relevancy, since an answer that is thorough, multi-faceted, and on topic is more likely to address the user’s intent. Answer Accuracy and Factual Correctness measure the same underlying property, namely agreement with a reference answer, but one scores it holistically while the other breaks it down claim by claim. Semantic Similarity complements both by capturing cases where answers express the same facts in different words. Finally, Empowerment can be seen as an outcome of the rest, as an answer that is comprehensive, direct, and factually correct will naturally help the reader reason and judge more confidently. A detailed description of all the evaluation criteria we used is presented in Table 4. Rubric-based scores, originally assigned on a 1–4 scale, were normalized to the [ 0 , 1 ] range to ensure consistency with the other metrics. To ensure statistical robustness and mitigate the non-determinism inherent in LLM-based evaluation [30], each generated answer was assessed over three evaluative iterations, and the evaluation metrics reported were calculated as the average between the iterations. All metrics, including the four rubric-based scorers, were computed using the default implementation settings provided by the RAGAS framework (version 0.4.3), without any modifications to the underlying prompts.

5. Performance Evaluation

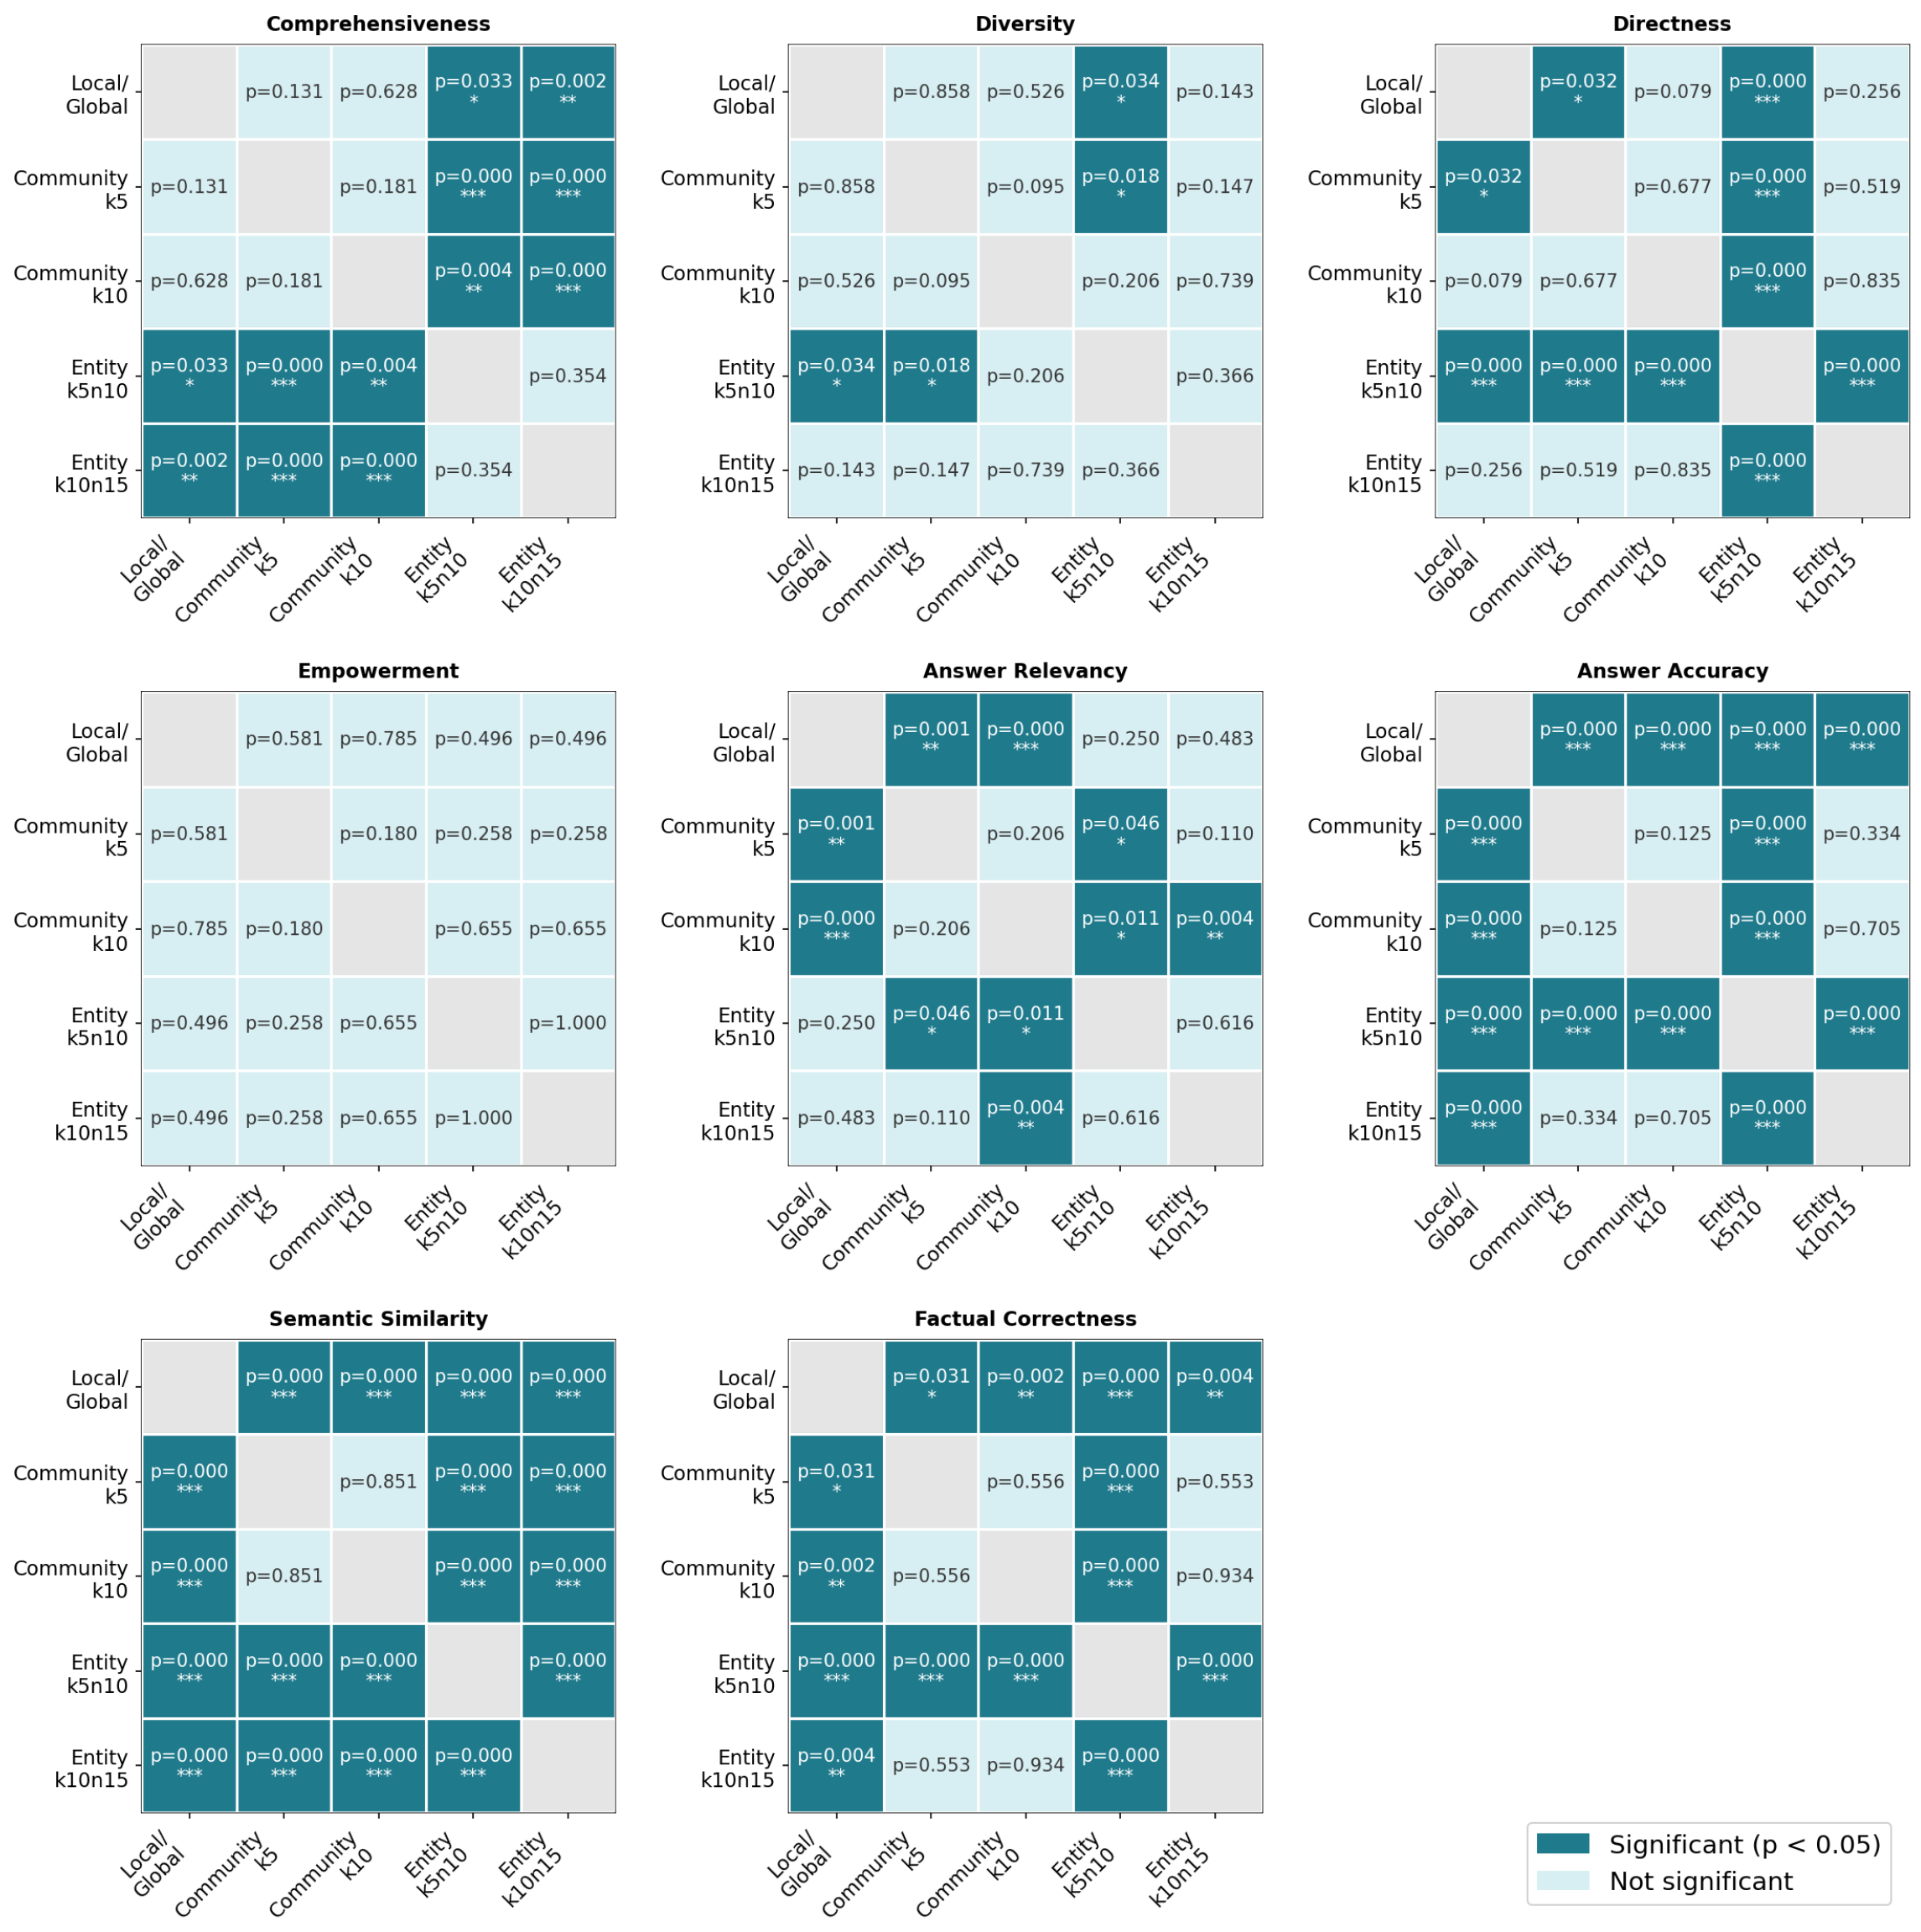
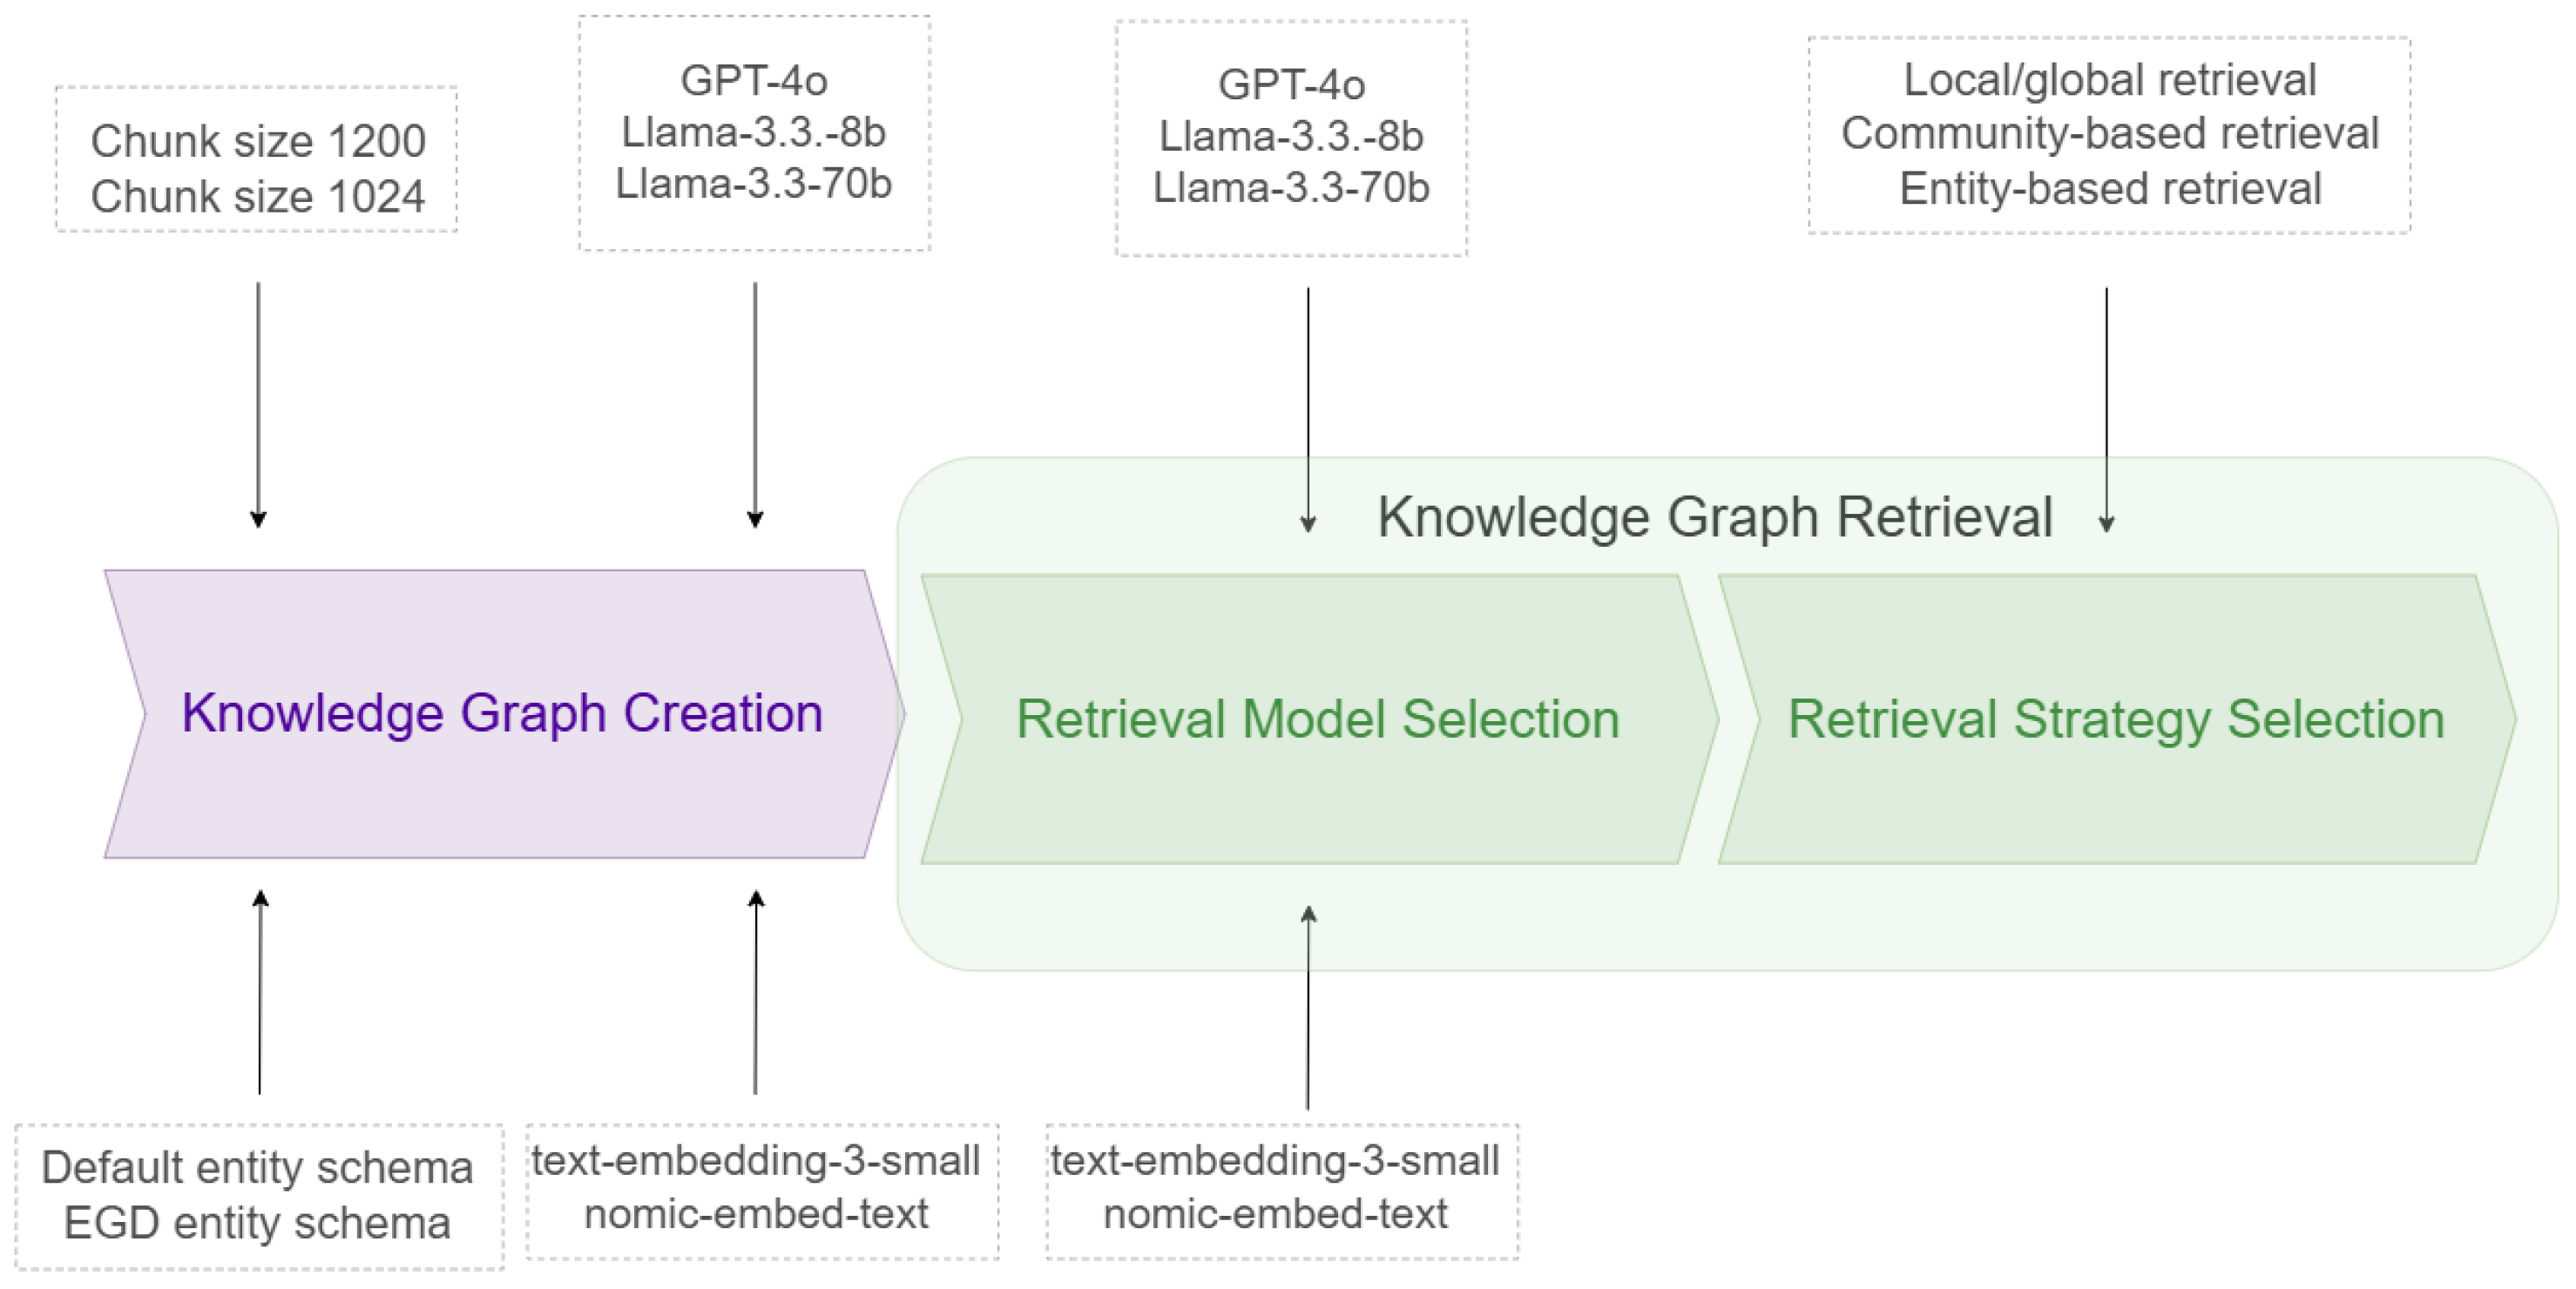
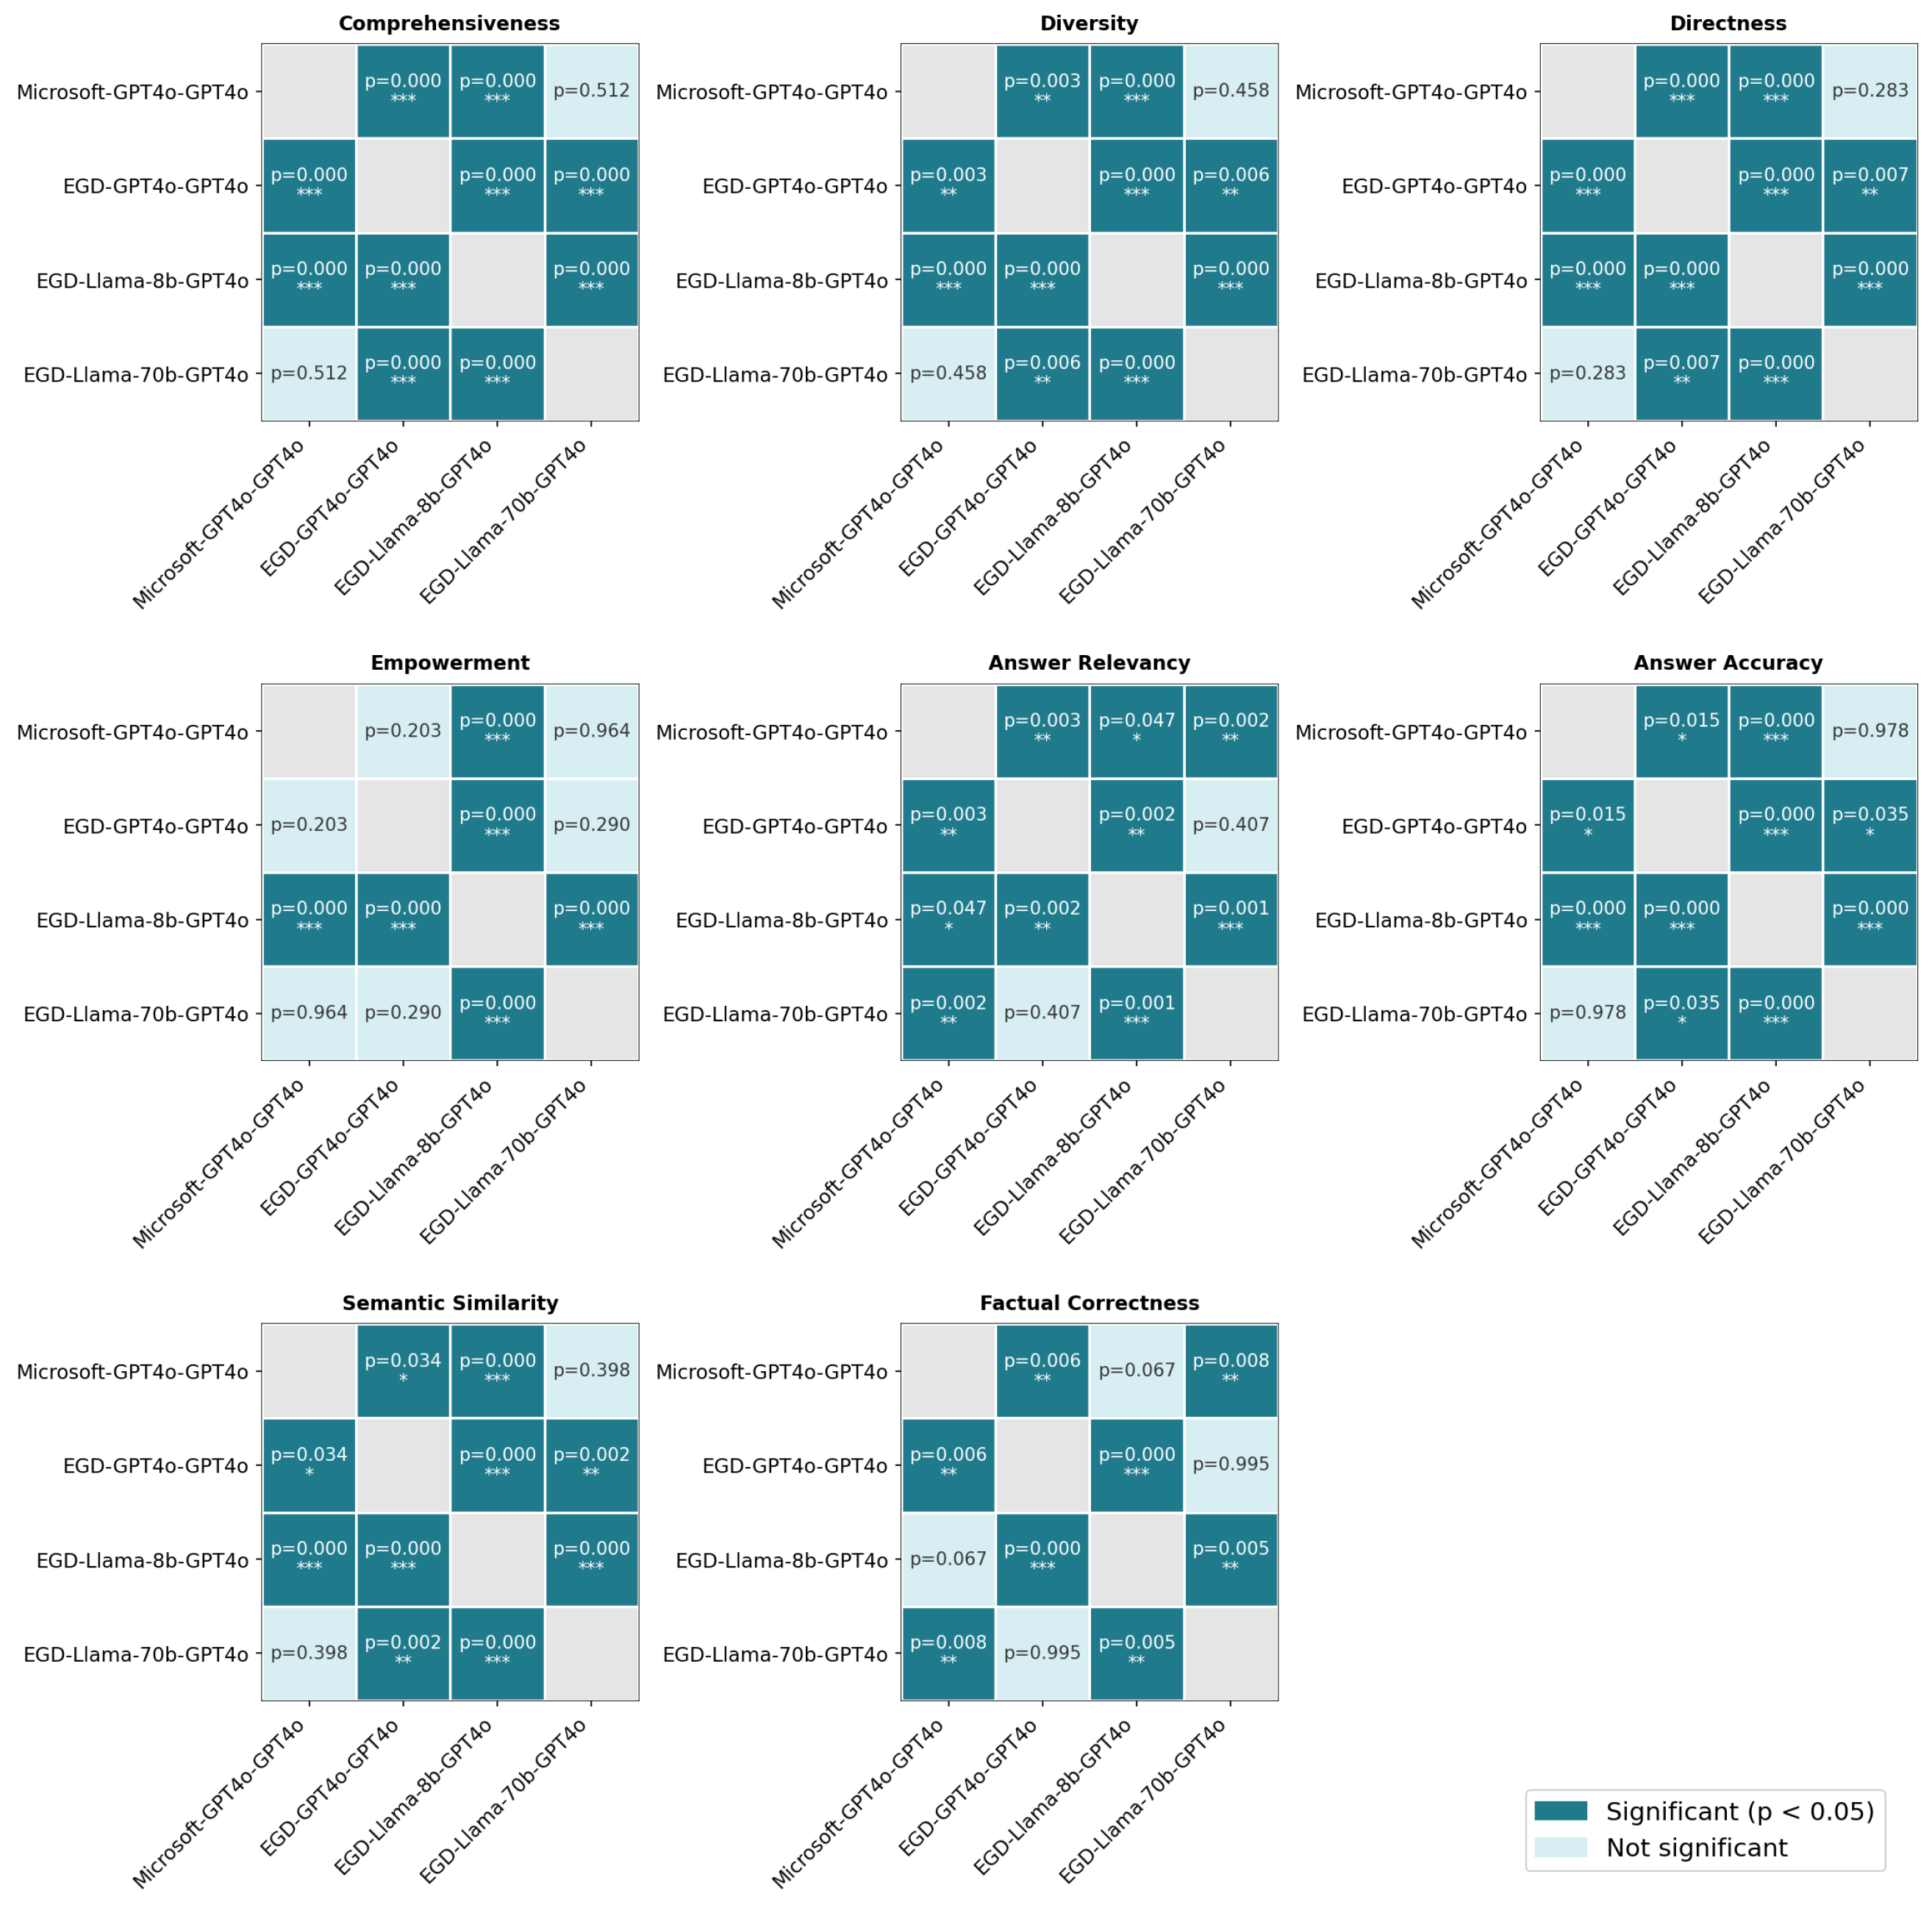
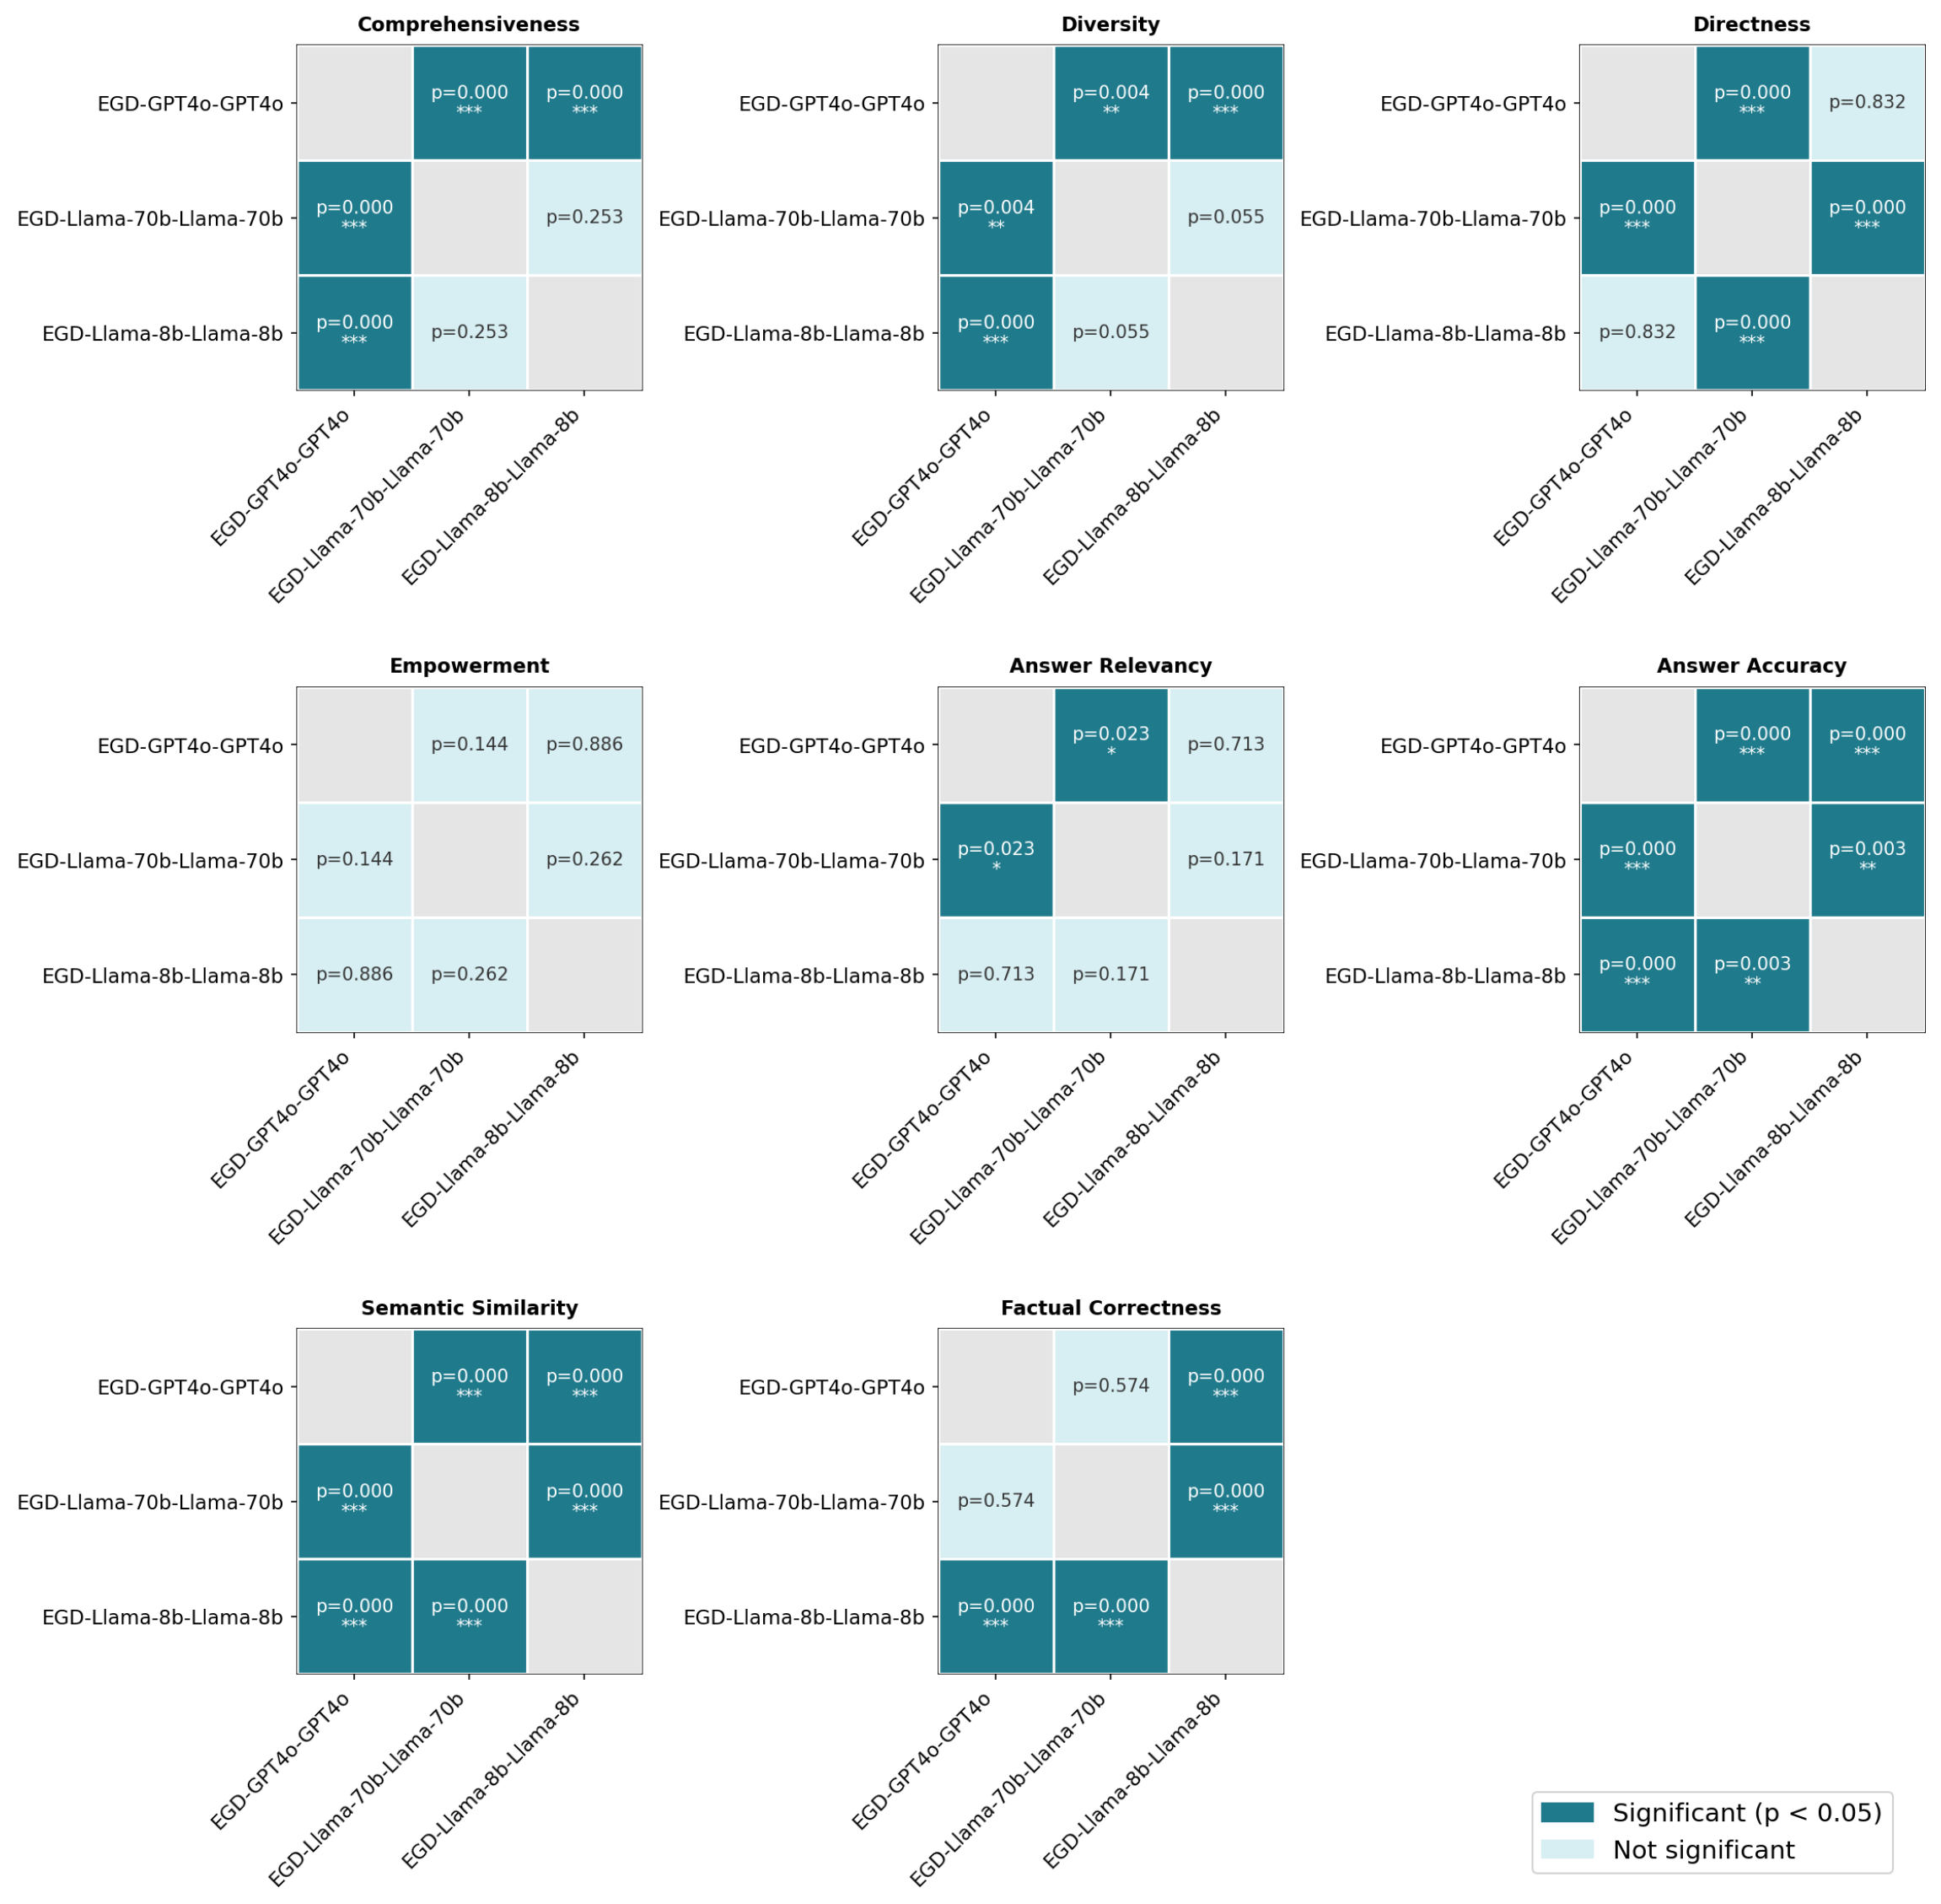
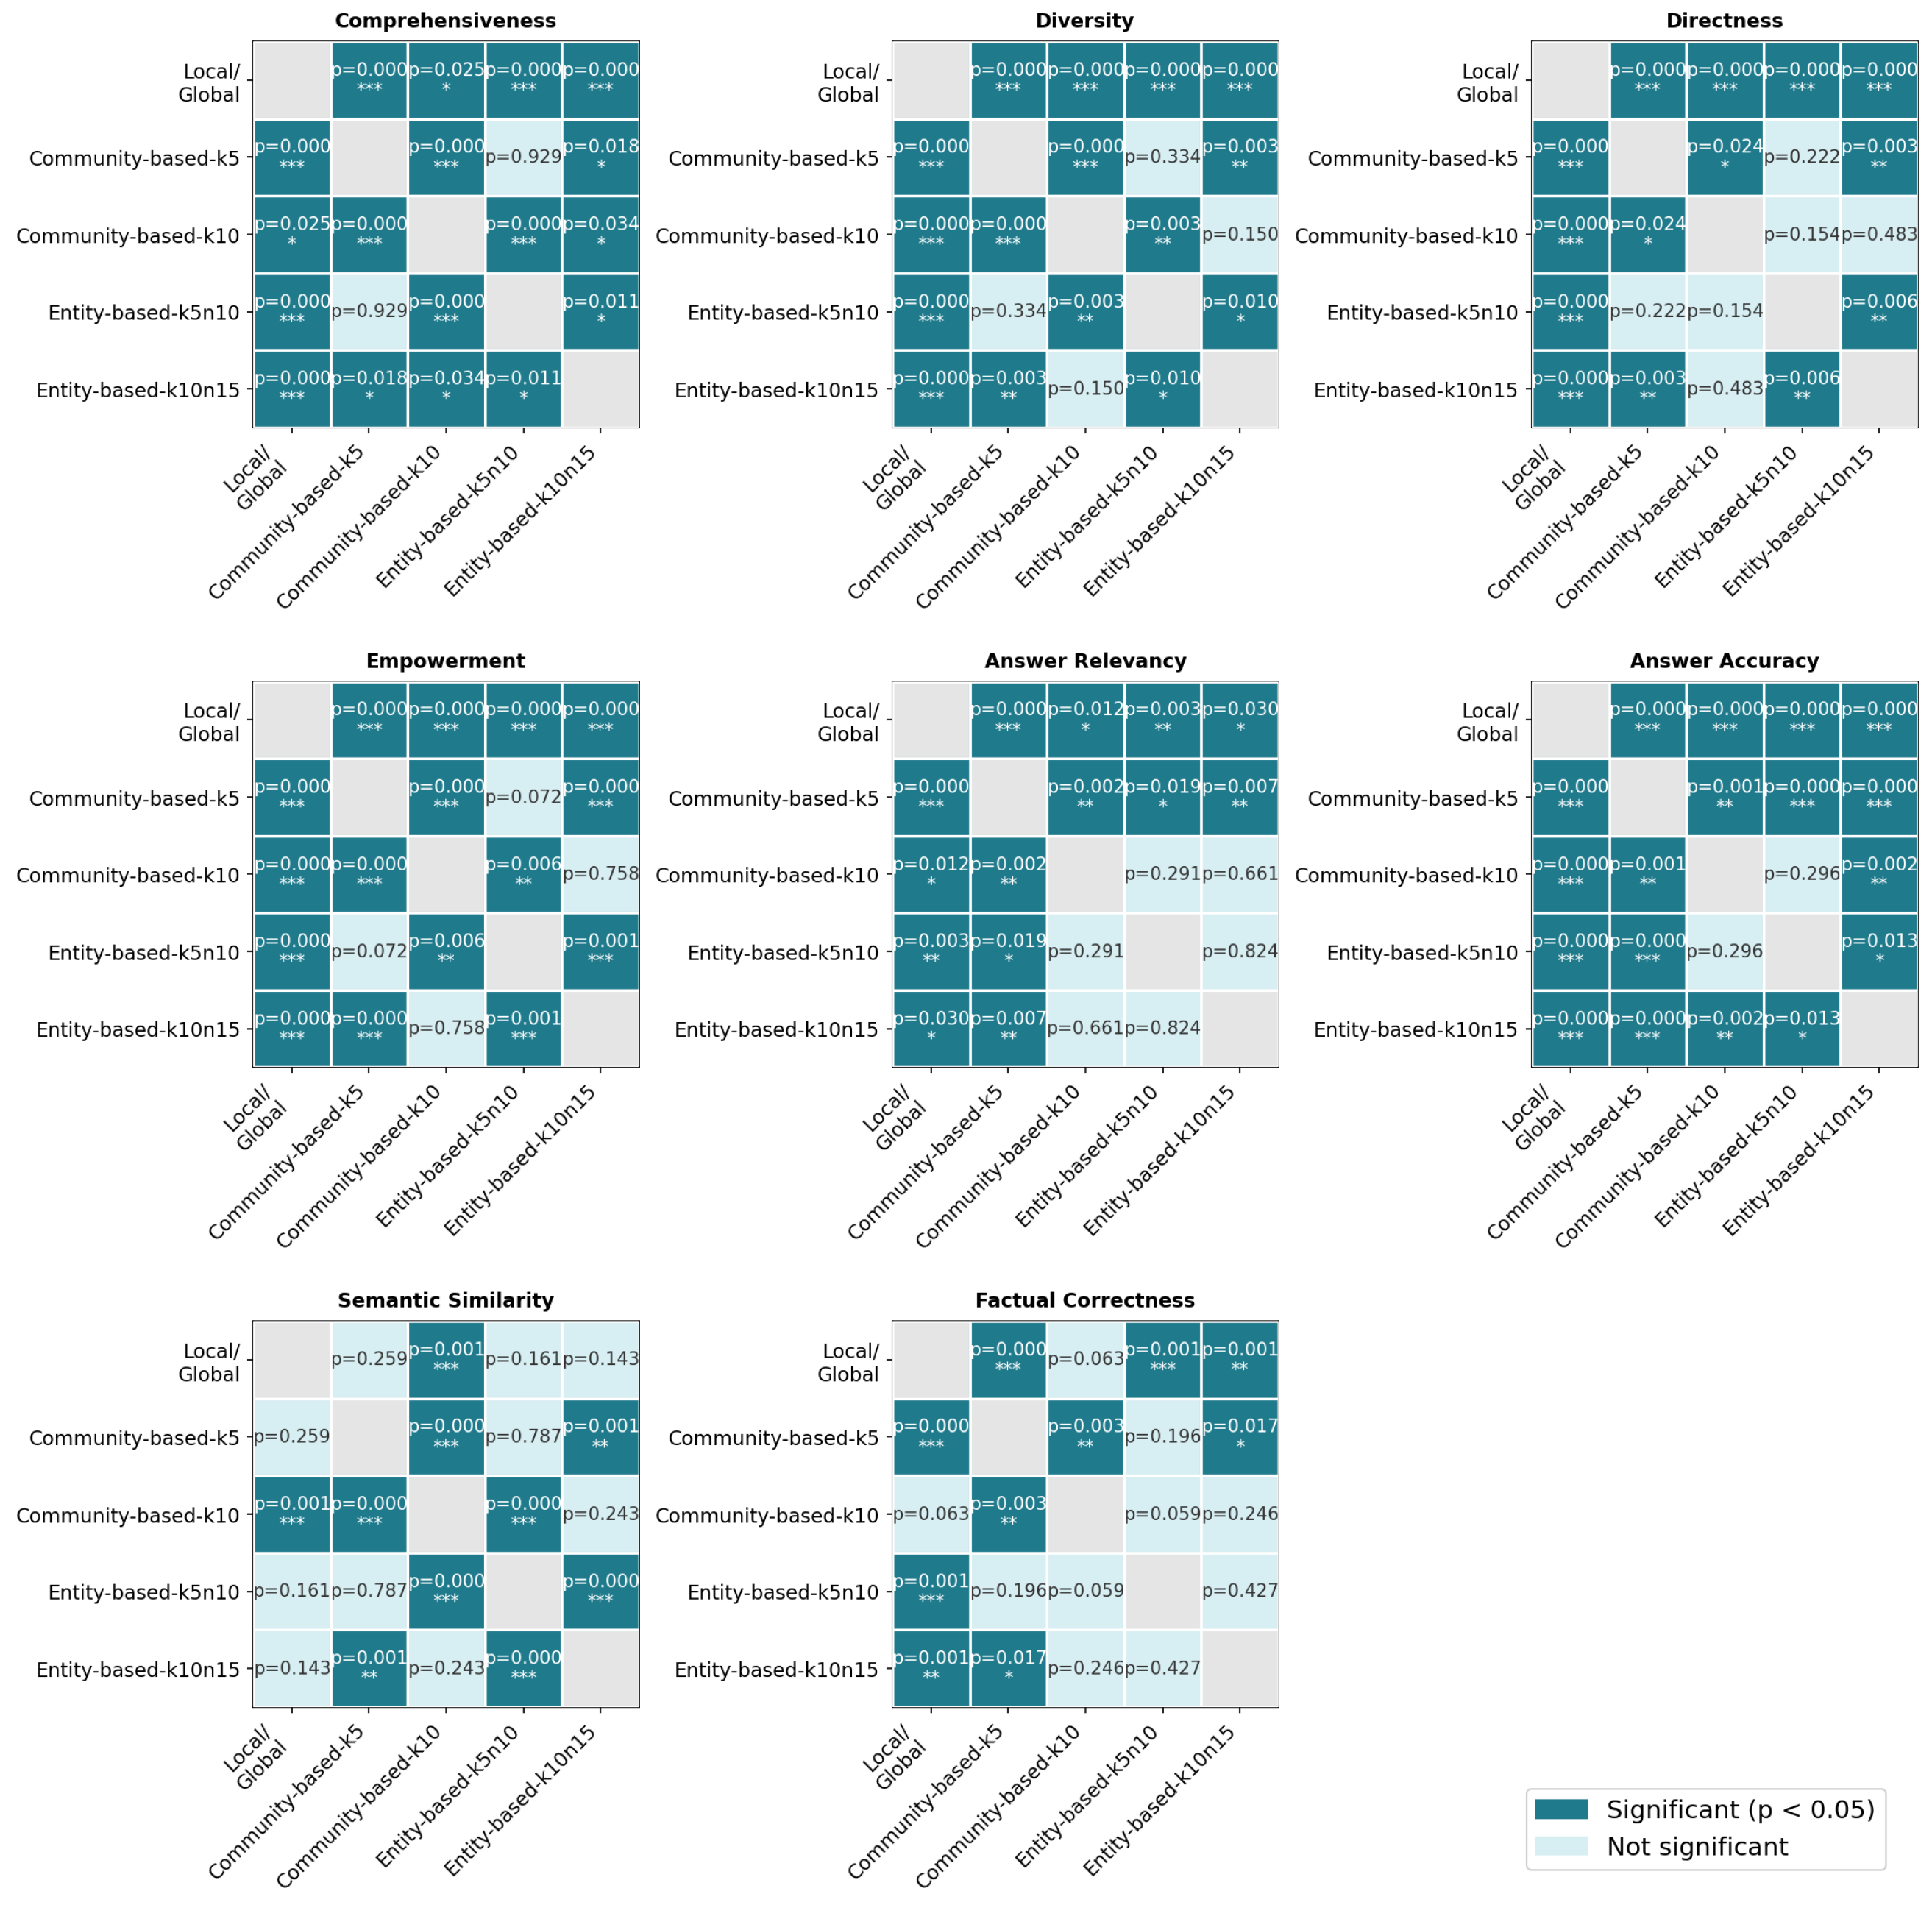
In this section, we assess the quality of the responses generated from our combinatorial configuration experiments. The information retrieval flow of Figure 3 is investigated sequentially while keeping the remaining stages intact at their baseline Microsoft GraphRAG settings: we first experiment with different knowledge graph configurations (Microsoft GraphRAG with GPT-4o, EGD GraphRAG with GPT-4o, EGD GraphRAG with Llama-8b, and EGD GraphRAG with Llama-70b) as presented in Table 3, while using GPT-4o as the retrieval model and local/global search as the retrieval strategy; we then experiment with different retrieval models (Llama-8b and Llama-70b on the corresponding open-source knowledge graphs) on a subset of the knowledge graph configurations from the previous stage, retaining local/global search as the retrieval method; and finally, we experiment with different retrieval techniques (community-based and entity-based retrieval) on selected configurations, replacing the default local/global search. To ensure the statistical significance of differences across experimental configurations, we conduct pairwise statistical tests on metric scores over all 103 questions for each configuration pair and evaluation metric. More specifically, a Shapiro–Wilk normality test [44], followed by either a pairwise t-test [44] if the differences were normally distributed or a Wilcoxon signed-rank test [44] otherwise, is applied. The correlograms illustrating statistical significance across experimental configurations for all metrics can be found in Appendix E. Our experimental results are also publicly available in our Gitlab repository [13].

5.1. Knowledge Graph Quality Assessment

To evaluate the different knowledge graphs in terms of token demand, cost, and graph density, the cost for graph creation, as well as the density of the derived graphs in terms of entities and relationships, are shown in Table 5. The entity type breakdown for each of our constructed EGD GraphRAG knowledge graph configurations, including total counts and examples derived from the knowledge graphs, are presented in Table 6.
The EGD GraphRAG with GPT-4o configuration produces a substantially larger graph compared to the Microsoft GraphRAG with GPT-4o configuration. This clearly reflects the impact of the choice of a smaller chunk size and a more detailed candidate entity set. The denser knowledge graph structure comes at a higher cost, amounting to ∼12.1 M tokens, as opposed to ∼5.7 M. The EGD GraphRAG configuration using Llama-8b produces a substantially sparser graph than the customized GPT-4o and Llama-70b variants, despite employing the same entity definition and chunk size. It extracts fewer entities and relationships, a finding consistent with prior work showing that smaller language models generally exhibit weaker information extraction and instruction following capabilities [45,46]. In contrast, Llama-70b identifies considerably more entities and relationships, producing a graph comparable to, and in some respects denser than, the GPT-4o configuration at a substantially lower cost. These results suggest that larger open-source models can provide a cost-effective alternative to closed-source models for NER and knowledge graph construction.
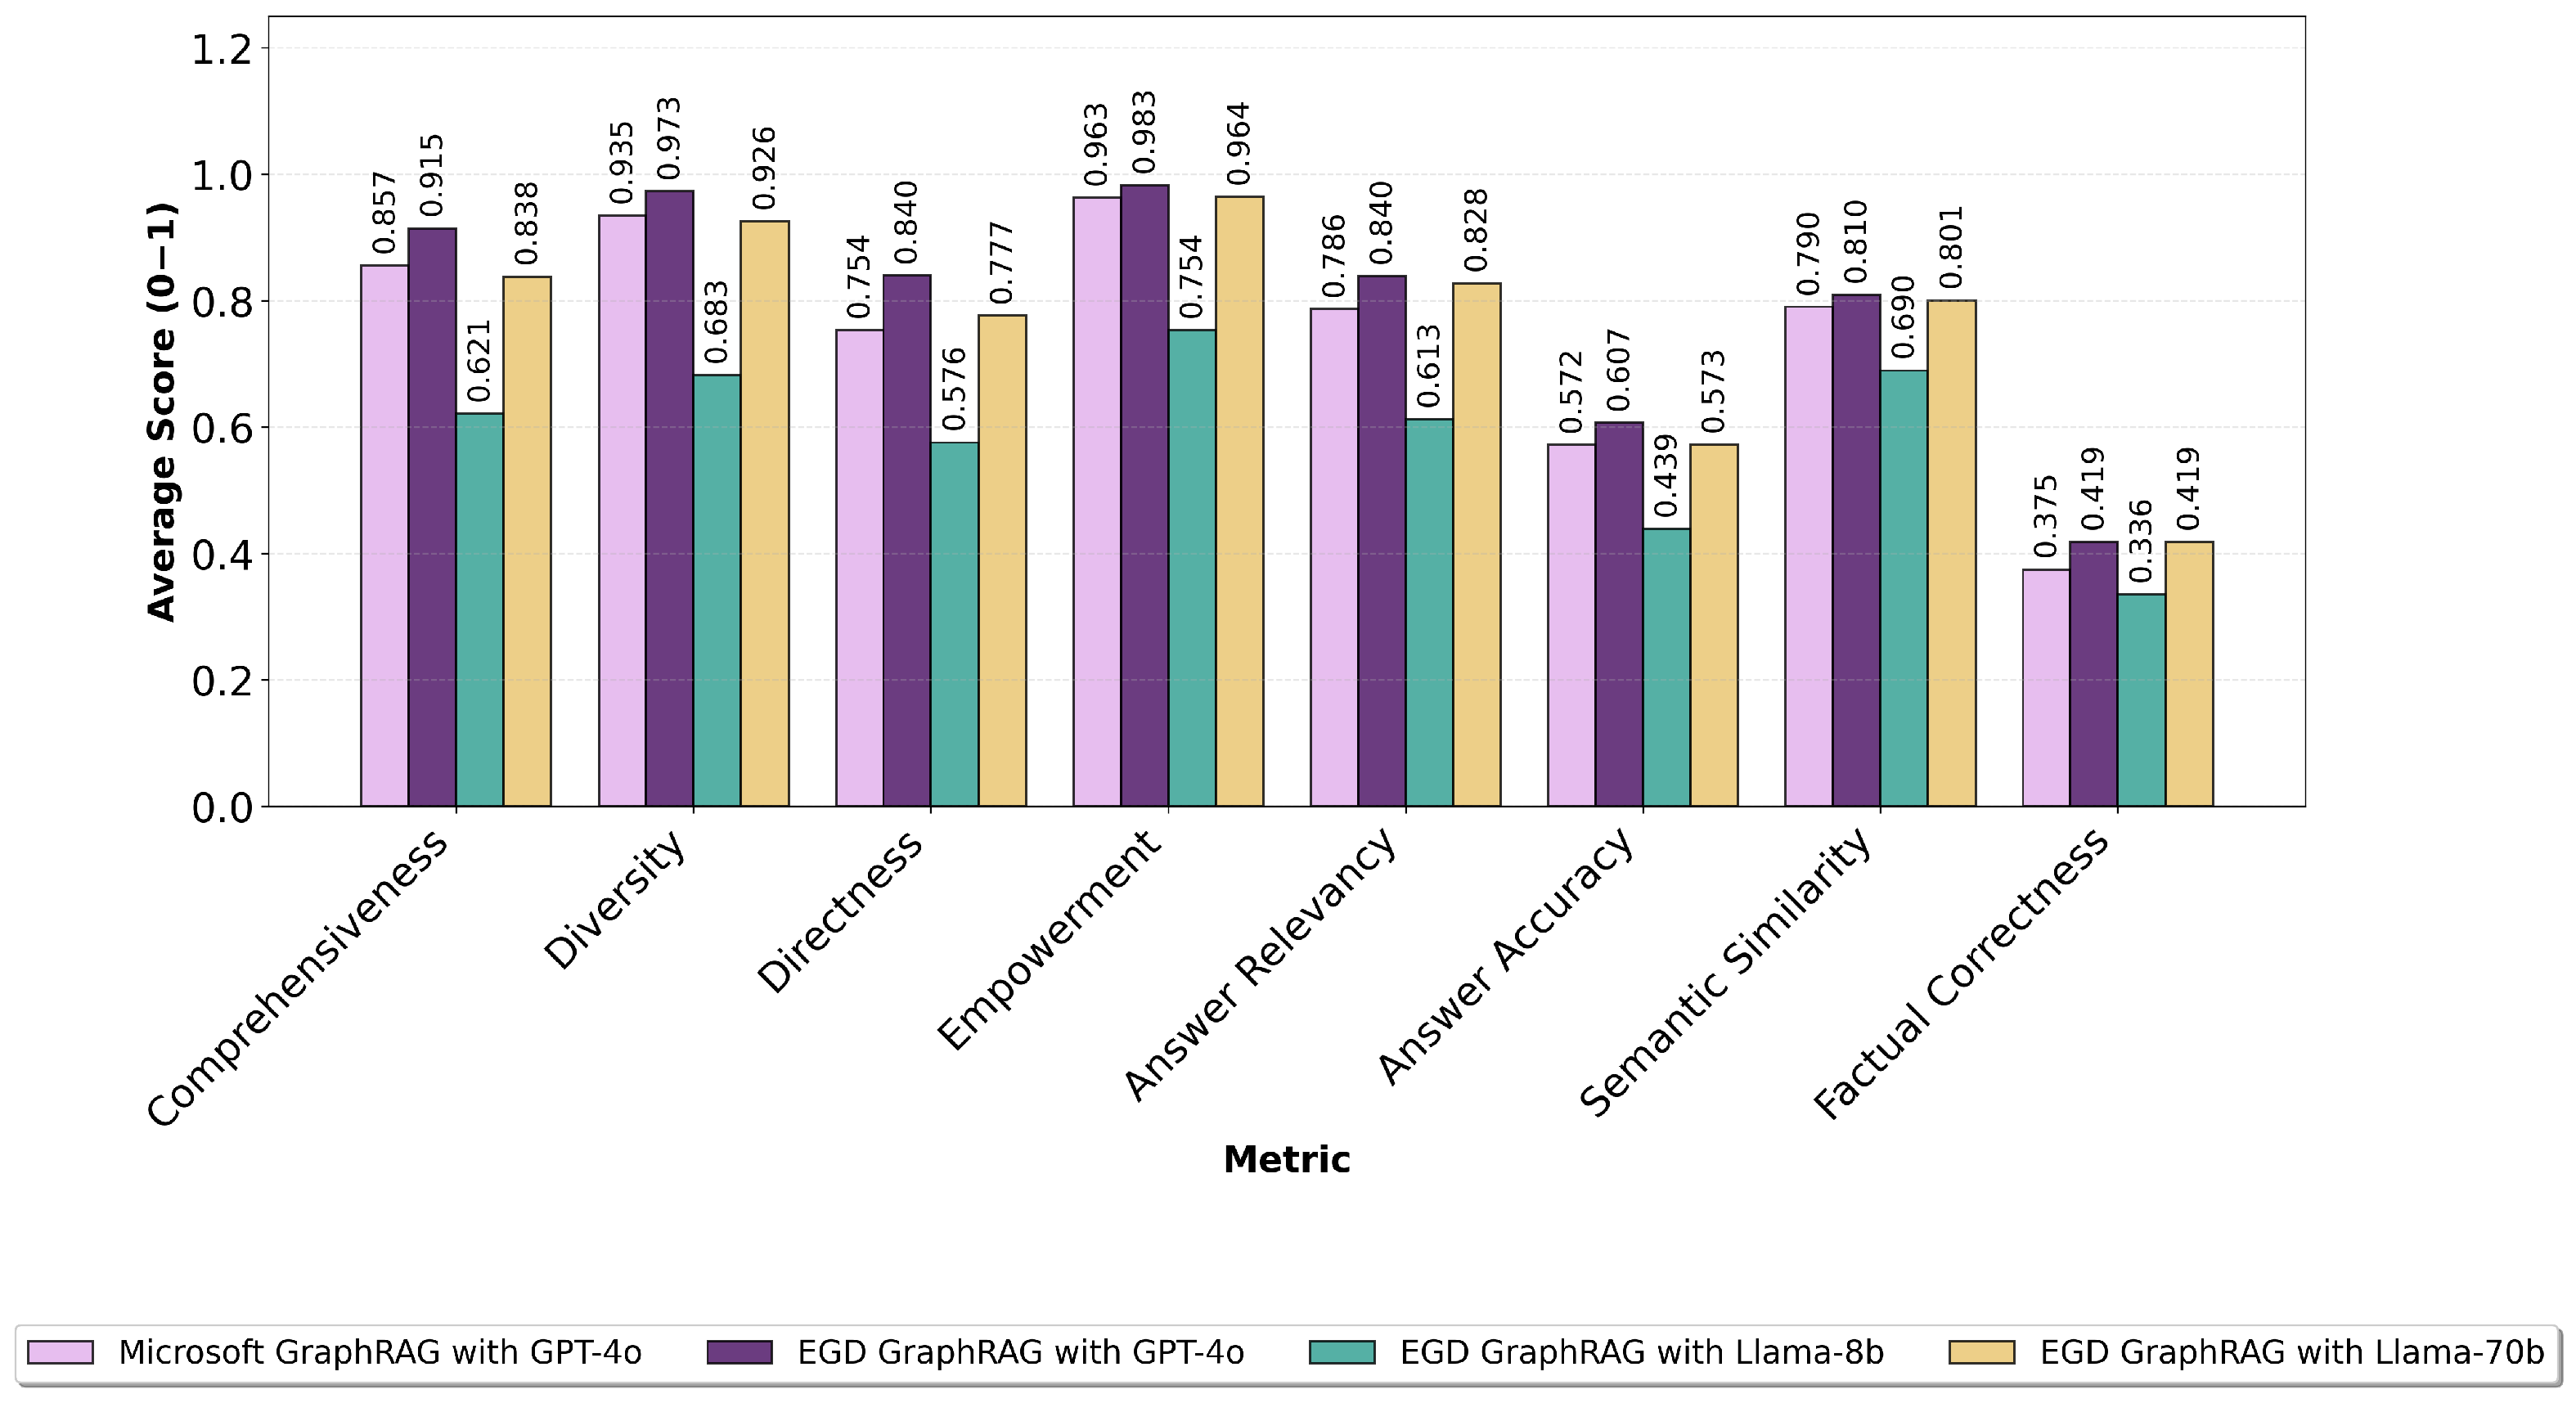
To assess the quality of the constructed knowledge graphs within the GraphRAG pipeline, we evaluated the generated answers by applying the baseline local/global retrieval methods and using only GPT-4o as retrieval LLM to our synthetic testset of questions to ensure a uniform comparison of the knowledge graphs. Figure 4 presents the mean performance across the eight evaluation metrics for each knowledge graph configuration. The corresponding statistical significance correlogram is presented in Figure A1 of Appendix E.
The EGD-specific construction methodology yielded statistically significant improvements over the Microsoft GraphRAG baseline in seven of the eight evaluated dimensions, according to the correlogram of Figure A1. The highest scores in all metrics are consistently achieved by the EGD GraphRAG with GPT-4o and Llama-70b knowledge graphs. The EGD GraphRAG with Llama-8b configuration consistently underperformed compared to the rest of the knowledge graph configurations; this can be attributed to the significantly sparser nature of the constructed graph, as presented in Table 5.
While the GPT-4o and Llama-70b knowledge graph configurations produced similar average scores on several metrics, including Factual Correctness and Answer Relevancy, the observed differences were not statistically significant. The only statistically significant difference between the GPT-4o and Llama-70b knowledge graphs is observed in Semantic Similarity, where the GPT-4o graph achieves a slightly higher score (0.810 vs. 0.801, p = 0.002 ). This suggests that answers generated from the GPT-4o graph are more consistently aligned with the reference answers in semantic terms. It is worth noting that the Answer Accuracy and Factual Correctness score considerably lower than the remaining metrics across all four configurations; this is attributed to the fact that, unlike the other metrics, both of these are reference-based and rely on direct comparison with the ground-truth answers in the test set [16]. Consequently, they are more sensitive to lexical and structural variations, even when the generated answers remain factually correct and informative.

5.2. Retrieval Model Assessment

Given the superior performance of the EGD-specific knowledge graphs compared to the Microsoft GraphRAG baseline, we subsequently focus on evaluating how the choice of retrieval model influences the quality of the generated answers; we experiment with matching the retrieval model to the knowledge graph creation model. Table 7 presents the token demand and cost across the experiments with Llama-8b and Llama-70b as the retrieval models, as well as those using the baseline GPT-4o as the retrieval model. Note that embedding costs for retrieval were negligible (∼20 K tokens) and are therefore omitted. Under uniform GPT-4o retrieval, the EGD GraphRAG with GPT-4o and EGD GraphRAG with Llama-70b are the most costly configurations at ∼27.58 M and ∼22.72 M tokens, respectively, incurring significantly larger costs compared to the Microsoft GraphRAG with GPT-4o and EGD GraphRAG with Llama-8b configurations, at ∼4.37 M and ∼3.68 M tokens. This can be attributed to the denser graph structure produced by the extraction LLMs of the former two configurations compared to the sparser graph of the latter. Notably, the open-source Llama-70b model incurs half the cost of the closed-source GPT-4o when utilized for retrieval under the EGD GraphRAG with Llama-70b knowledge graph, even though the retrieval demanded more tokens (∼37.25 M as opposed to ∼22.72 M), further asserting the viability of open-source models as cost-effective alternatives.
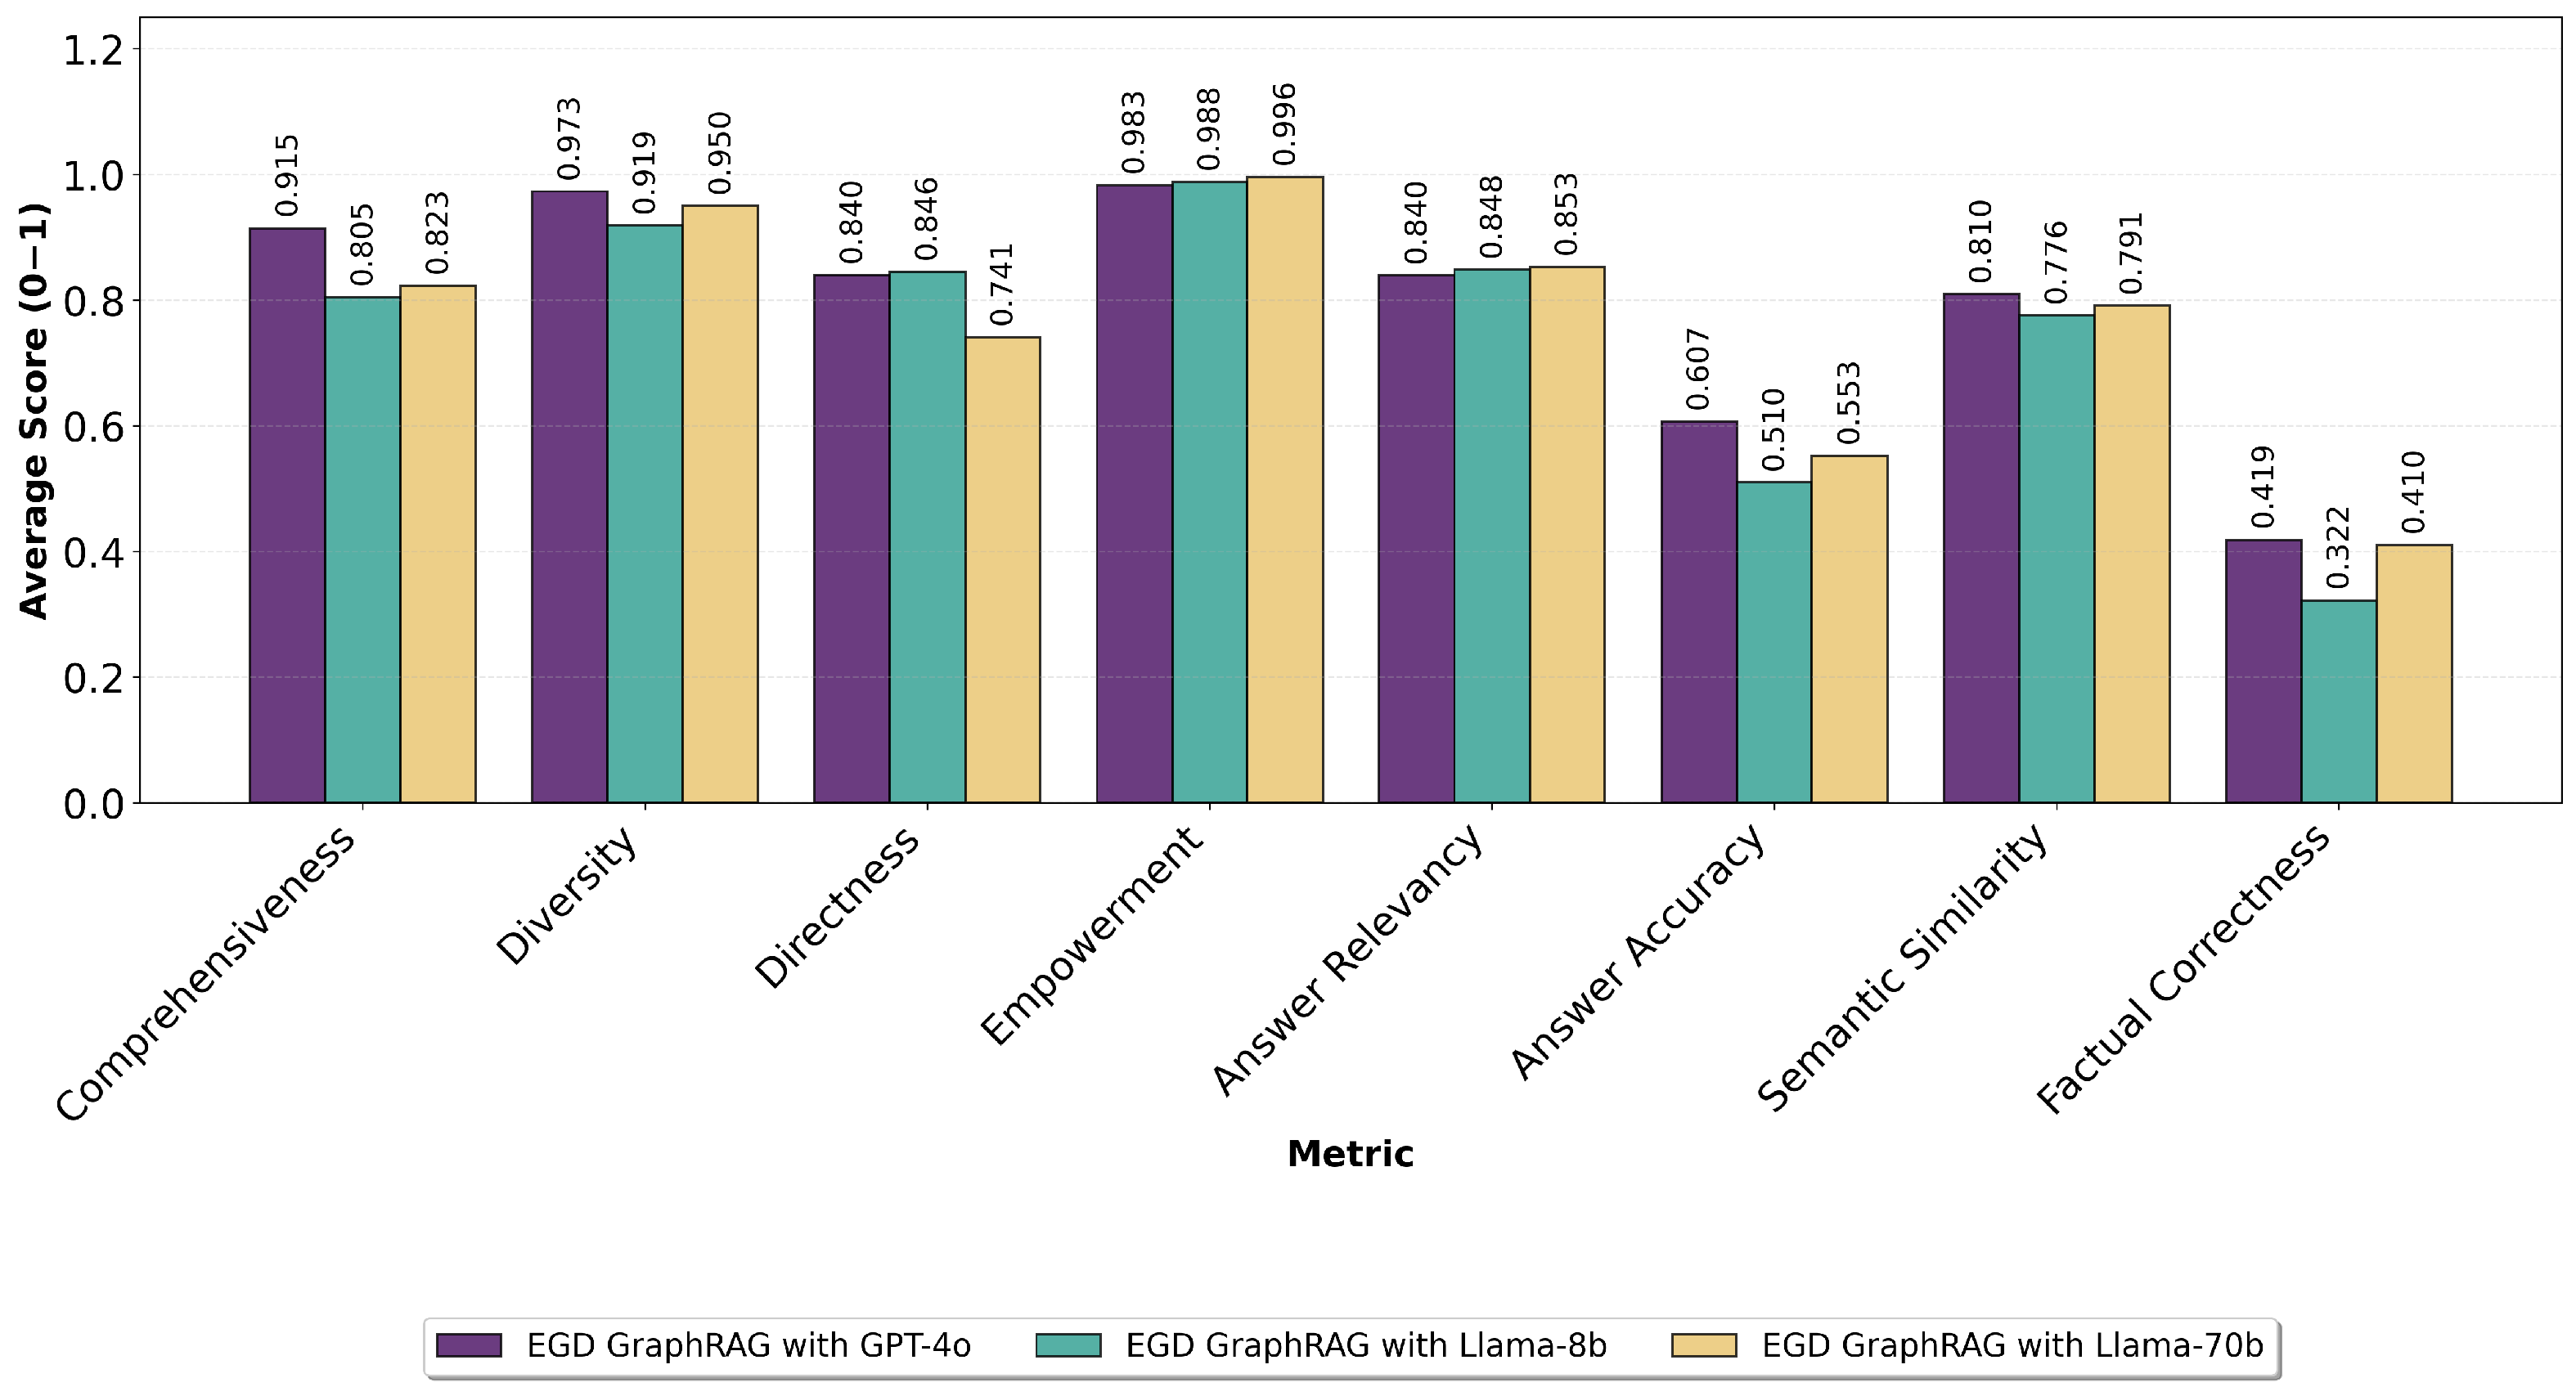
Figure 5 illustrates the corresponding experimental results, with the statistical significance correlogram being presented in Figure A2 of Appendix E. Overall, the GPT-4o and Llama-70b configurations emerge as the strongest performers across the evaluated metrics, substantially outperforming the Llama-8b configuration. Notably, regarding the ground truth-related metrics (Answer Relevancy, Semantic Similarity, and Factual Correctness), performance varies. In terms of Answer Relevancy, Llama-70b achieves the highest score (0.853), with the difference being statistically significant compared to GPT-4o but insignificant compared to Llama-8b. In terms of Semantic Similarity, none of the differences in performance present as statistically significant, albeit GPT-4o achieving a higher score of 0.810 as compared to 0.776 and 0.791 from the open-source models. Lastly, when it comes to Factual Correctness, GPT-4o achieves a score of 0.419, higher than Llama-70b (0.410, although at a non-significant difference) and than Llama-8b (0.322, at a significant difference).
Notably, comparing these results to those of the uniform GPT-4o retrieval experiments reveals that matching the retrieval model to the construction model does not consistently improve performance. While the Llama-8b configuration exhibits substantial improvements across all evaluation metrics when paired with a matching retrieval model, the corresponding Llama-70b configuration generally achieves slightly lower scores than those obtained with GPT-4o retrieval. Nevertheless, the results indicate that the fully open-source configurations achieve performance levels that are often close to those of the fully closed-source GPT-4o configuration while incurring substantially lower computational costs, as shown in Table 7.

5.3. Retrieval Strategy Assessment

Given that fully open-source configuration with LLama-70b can attain performance that is comparable to that of the closed-source GPT-4o configuration, we evaluated our proposed community- and entity-based retrieval strategies on both of these configurations. For each proposed strategy, we experimented with different parameter setups, as described in Section 4.2. Table 8 presents the token demand and cost per retrieval strategy and configuration examined in this phase, alongside the local/global baseline costs for direct comparison. The results demonstrate a significant reduction in token consumption and cost across all custom retrieval strategies compared to retrieval baseline. We observe that community-based retrieval with k = 5 reduces cost by approximately 98% for both configurations (USD 1.50 vs USD 73.10 for GPT-4o and USD 0.54 vs USD 32.78 for Llama-70b), while even the most token-intensive custom strategy—entity-based retrieval with k = 10 , n = 15 —remains significantly cheaper (USD 2.79 and USD 0.90, respectively). Notably, the Llama-70b configuration consistently incurs lower costs than GPT-4o across all retrieval strategies, due to its significantly lower per-token rate, further reinforcing its viability as a cost-effective alternative for GraphRAG deployments.
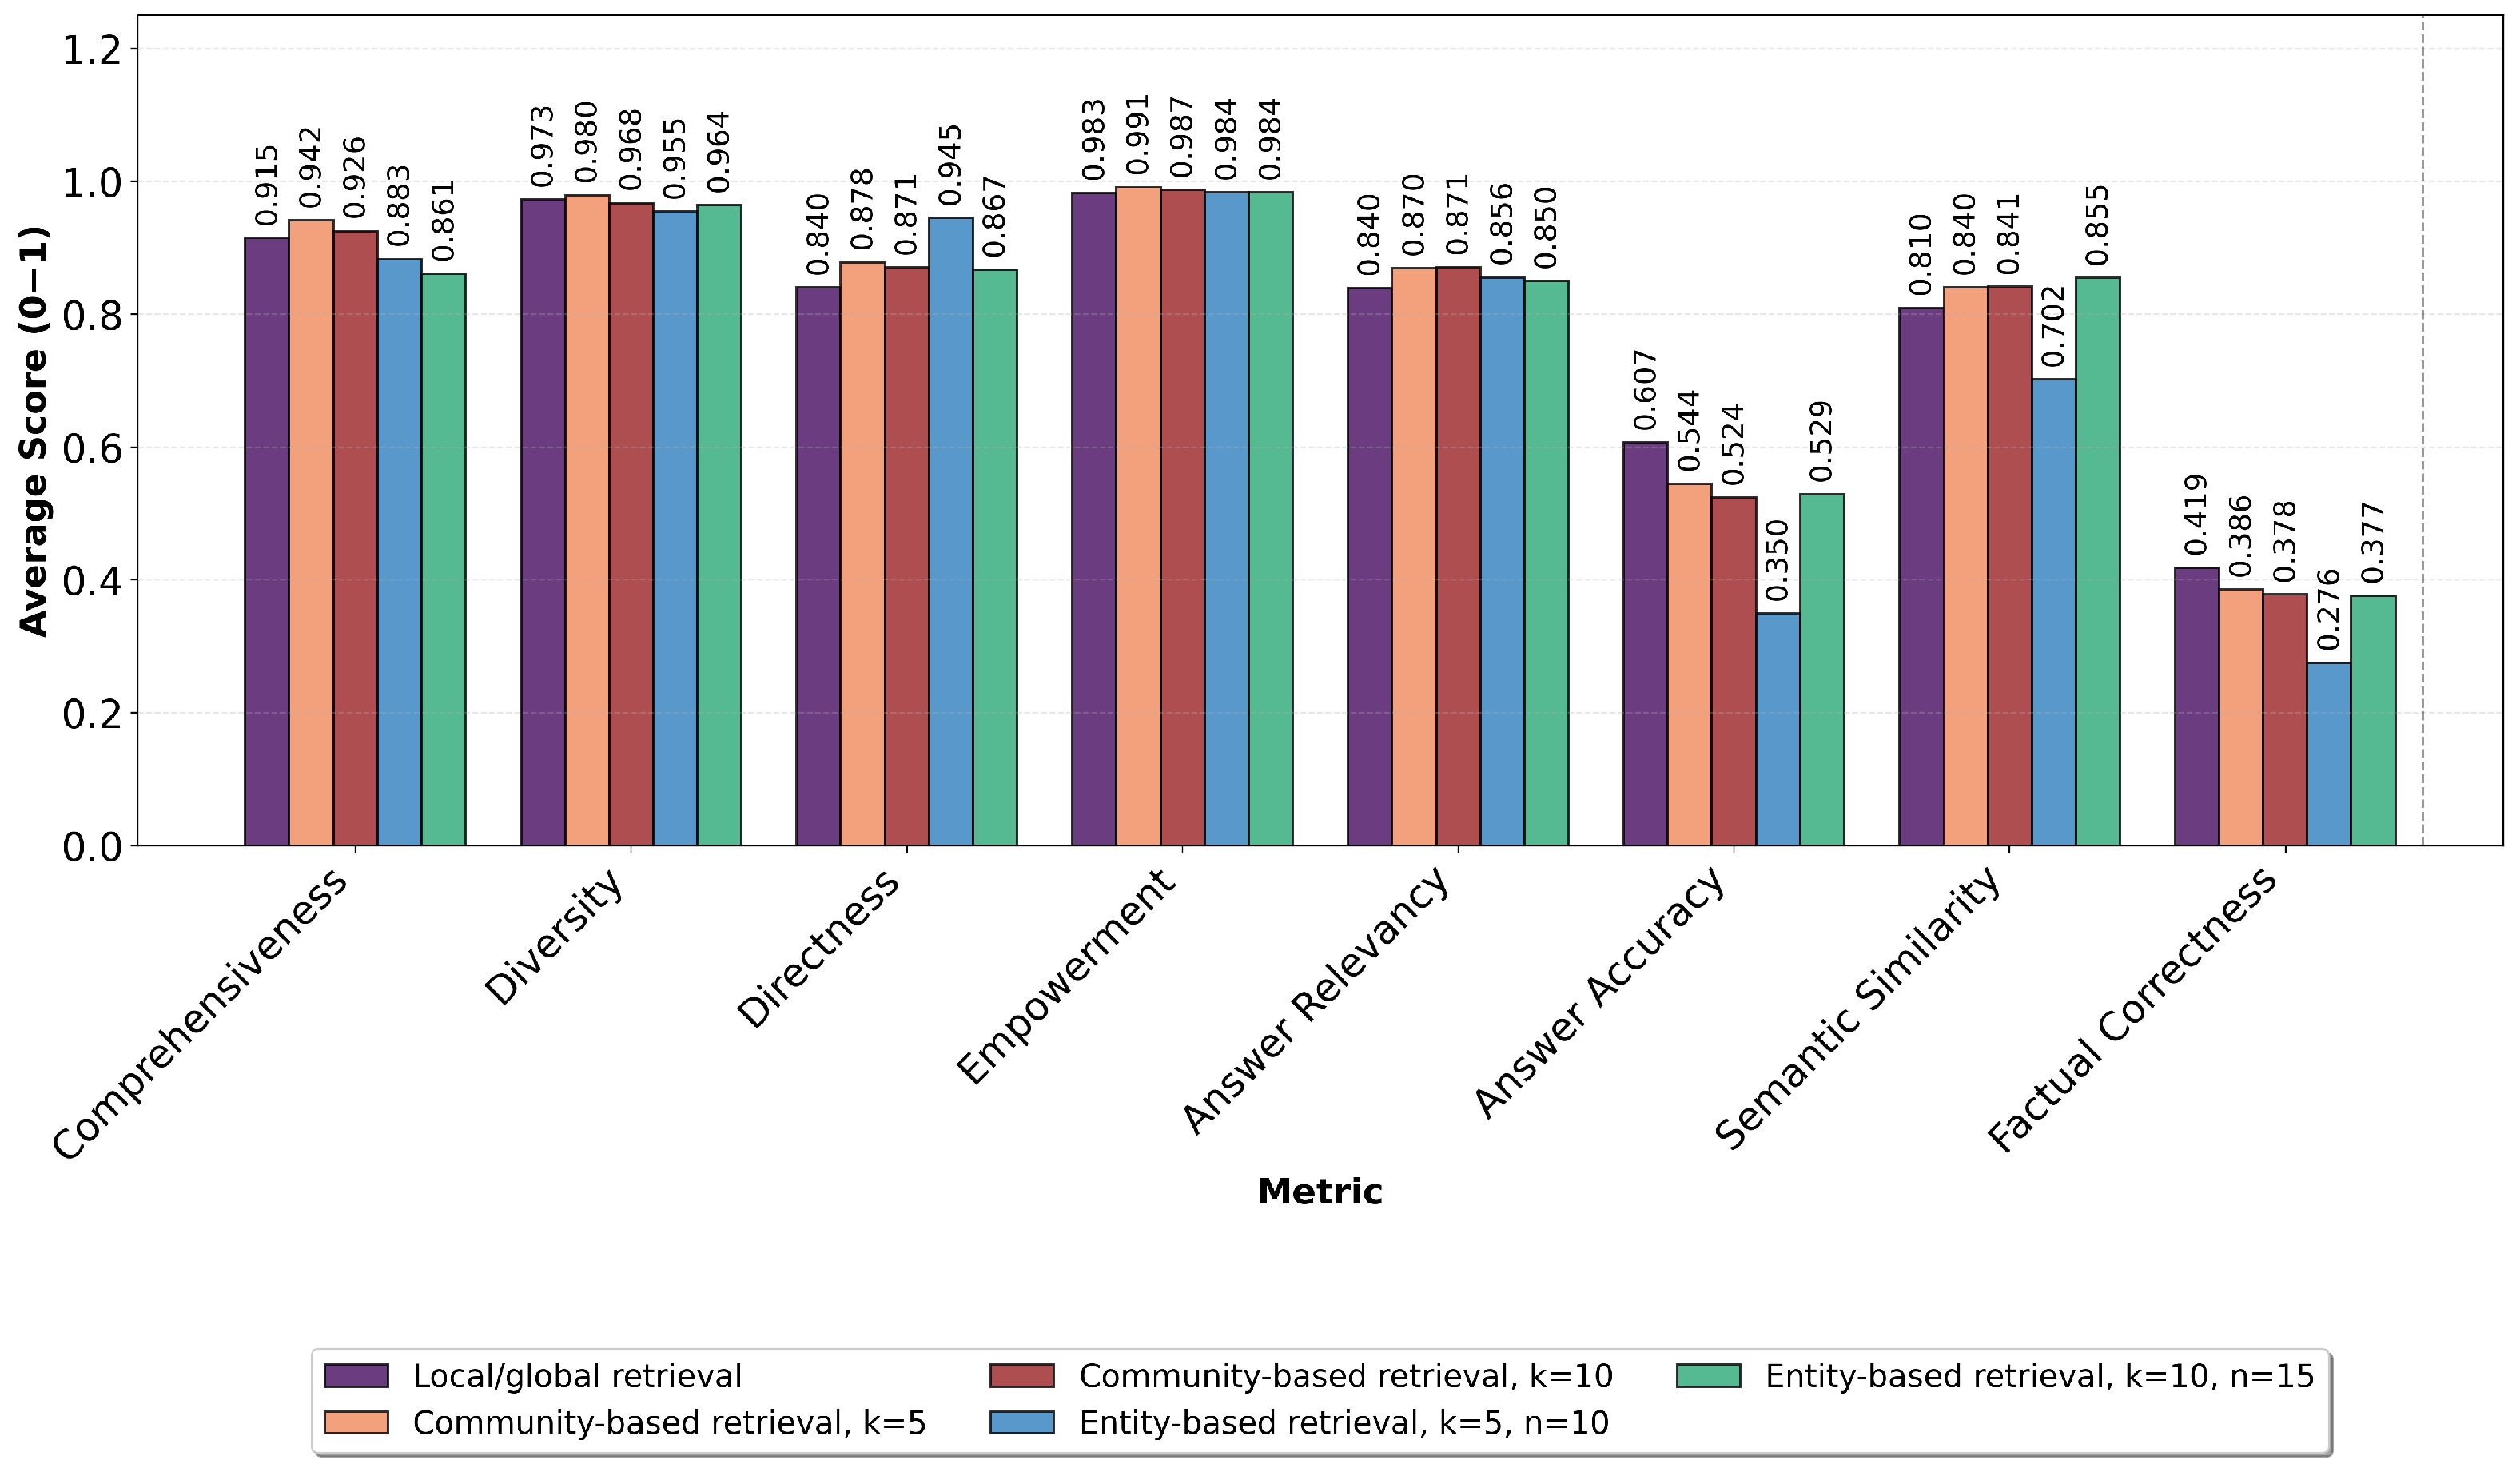
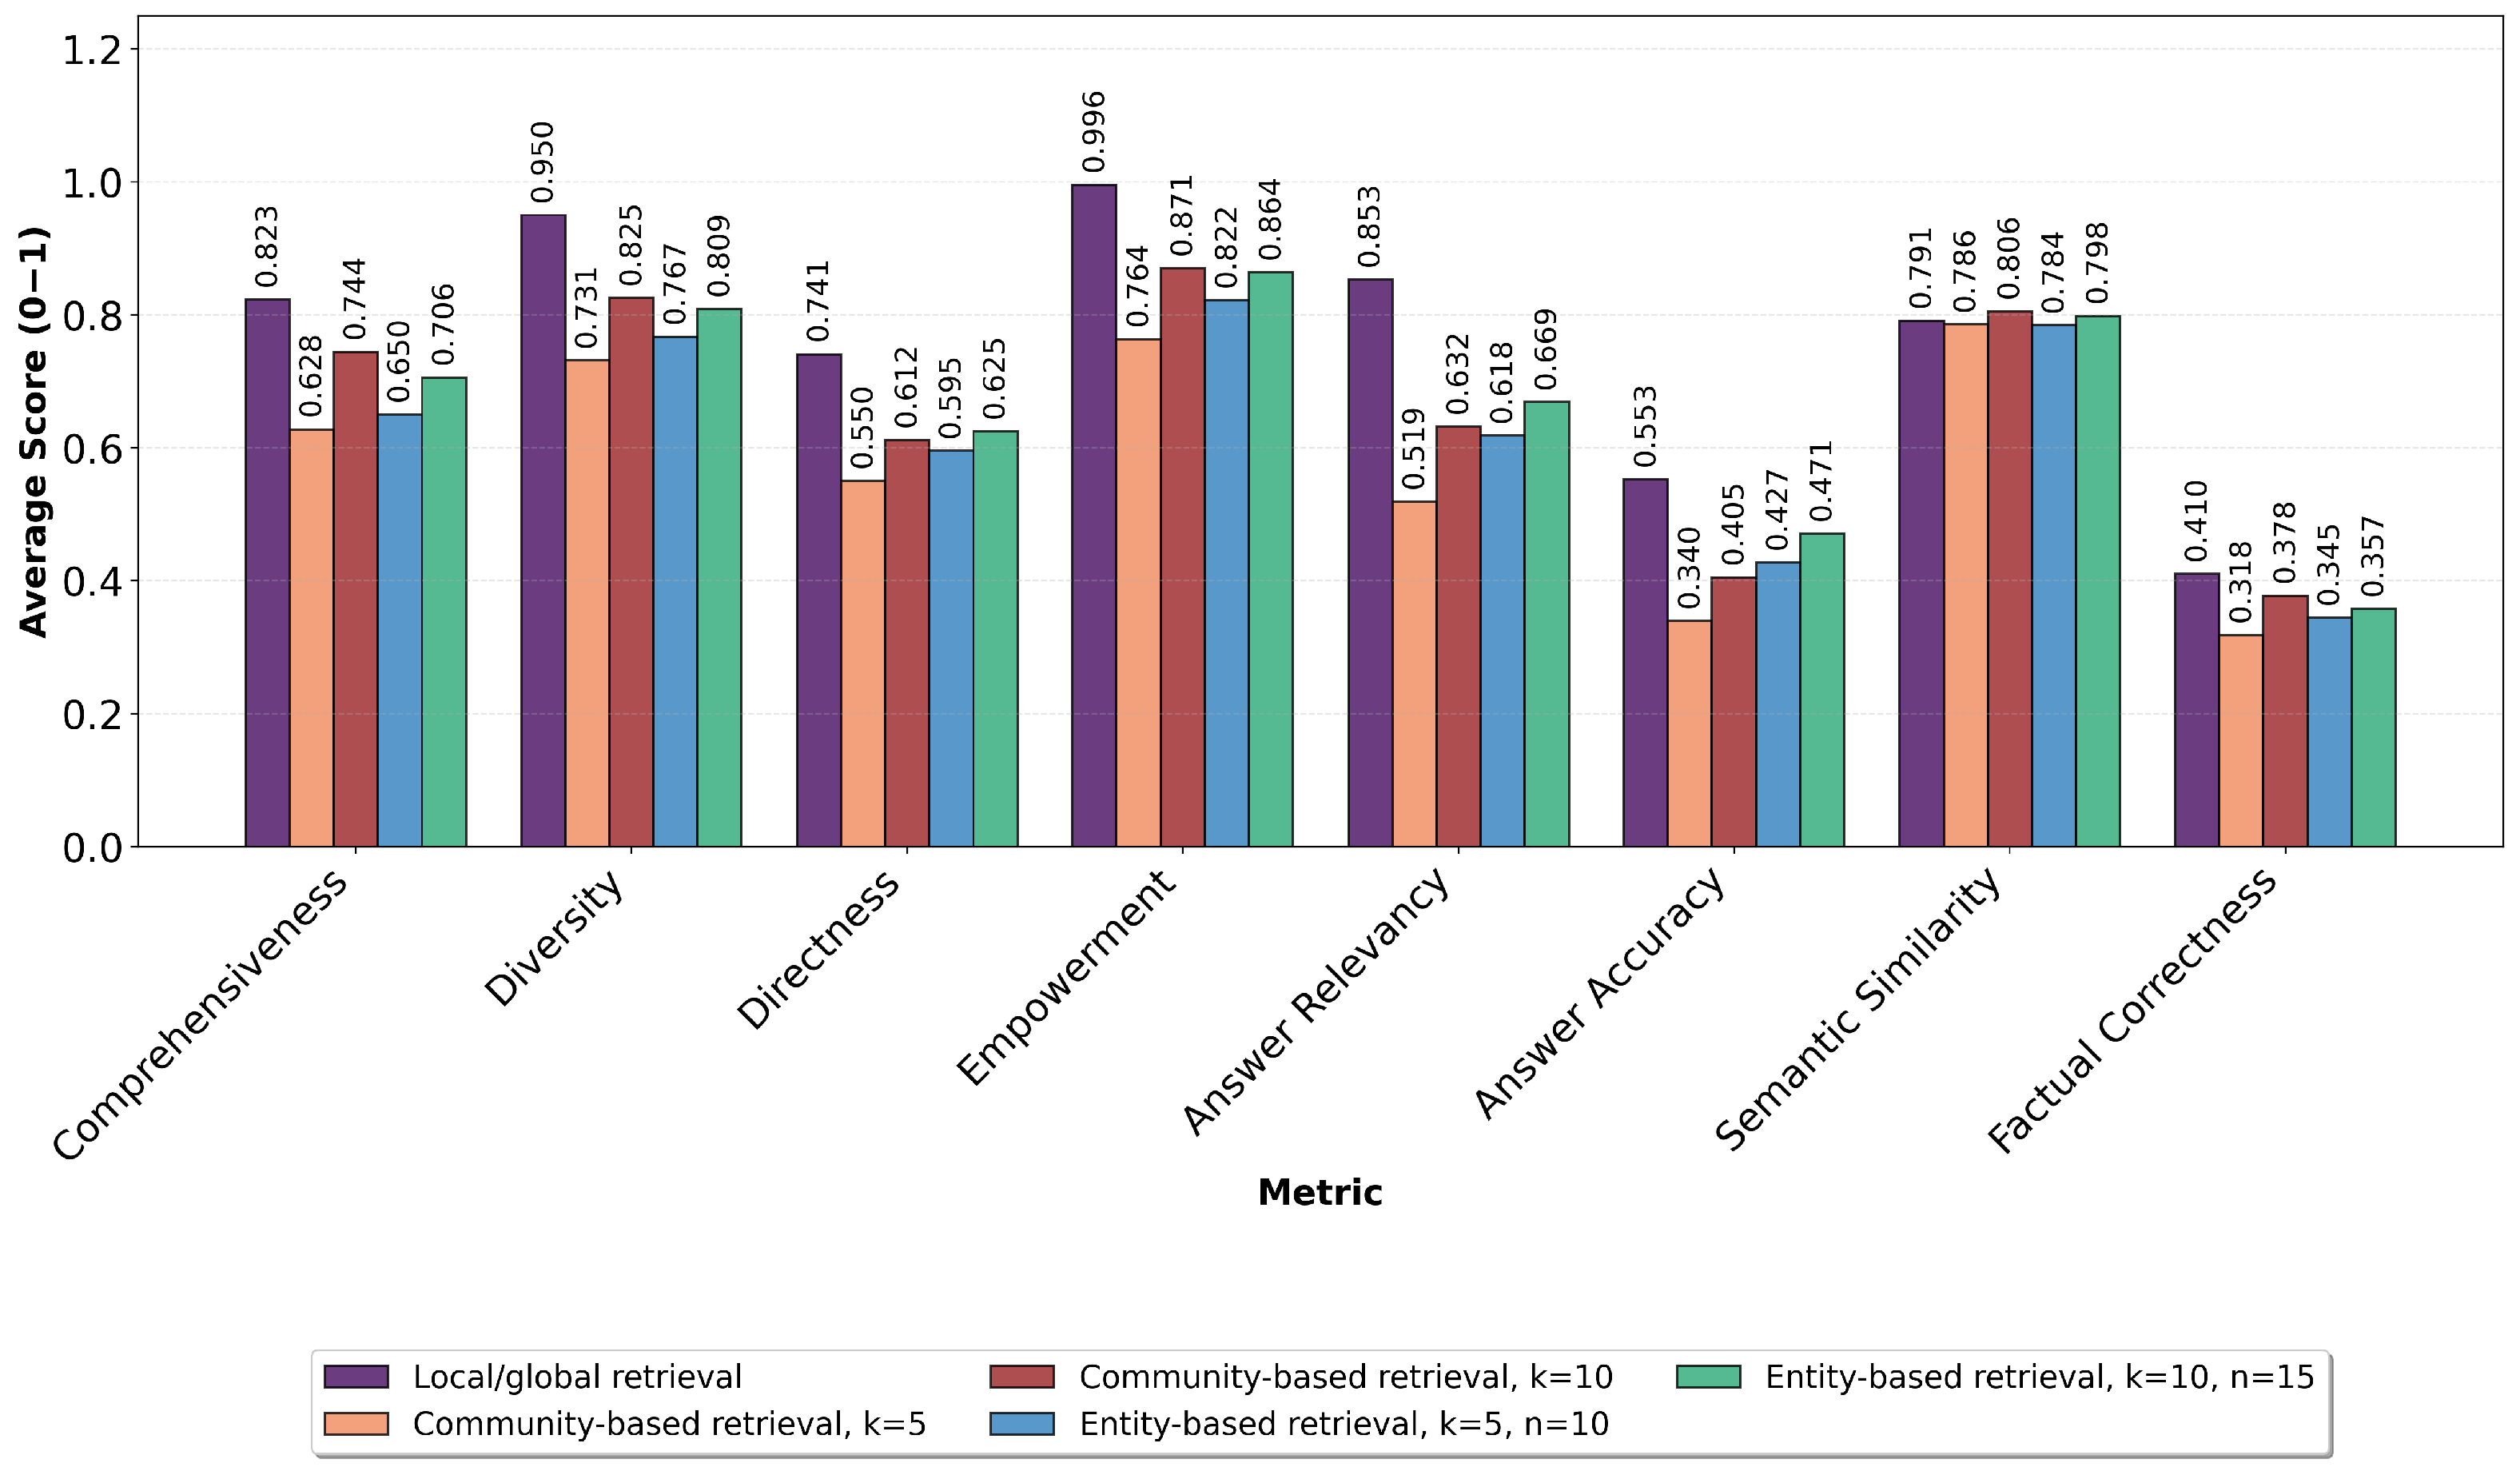
Figure 6 and Figure 7 present the performance assessment results of the aforementioned experiments on the fully closed-source and fully open-source configurations, respectively. The corresponding correlograms can be found in Figure A3 and Figure A4 of Appendix E. Regarding Figure 6, community-based retrieval with k = 5 and k = 10 is observed to achieve the highest scores across the majority of metrics, consistently outperforming the baseline local/global retrieval strategy. These improvements remain statistically significant across the semantically sensitive metrics of Answer Relevancy, Semantic Similarity, and Factual Correctness; this can be attributed to the nature of community reports as pre-generated, thematically coherent summaries of related entities. By retrieving only the most semantically relevant reports, the retrieval model is provided with focused, query-aligned context, avoiding the dilution introduced by the exhaustive processing of all community reports in the global search strategy. A similar trend is observed for entity-based retrieval with k = 10 and n = 15 , whereas the more restrictive k = 5 , n = 10 configuration performs significantly worse, particularly in Semantic Similarity and Factual Correctness.
Regarding Figure 7, the overall pattern is different compared to Figure 6: local/global search retains a clear advantage across the majority of the metrics, with the derived differences remaining, for the most part, statistically significant. It is to be noted that, for Semantic Similarity and Factual Correctness, the differences between local/global search and community-based retrieval ( k = 5 and k = 10 ) are small and not statistically significant. This suggests that the effectiveness of a retrieval strategy depends on the retrieval model employed, as the performance gains observed for community-based retrieval under GPT-4o are less pronounced under Llama-70b. Nevertheless, the present evaluation does not provide evidence of a difference between local/global search and community-based retrieval on Semantic Similarity and Factual Correctness, while the latter incurs substantially lower computational costs (USD 0.54–USD 0.64 compared to USD 32.78 per 103 questions). These results suggest that community-based retrieval may offer a favorable cost–performance trade-off under the Llama-70b configuration.
Overall, our experimental results suggest that the domain-specific knowledge graph construction for the EGD corpus can achieve superior answer quality within the Microsoft GraphRAG pipeline, by using either the closed-source model GPT-4o or the open-source mid sized-model Llama-70b and the default local/global retrieval methods. The performance assessment of the variations of the EGD GraphRAG with Llama-70b configuration demonstrate that open-source models are capable of performing NER and constructing knowledge graphs of comparable or greater density than their closed-source counterparts at approximately one third of the cost, while delivering statistically equivalent performance on the majority of fact-sensitive, ground truth-related metrics—which are deemed most critical for QA systems—under the same retrieval model. A significant observation in this aspect is that utilizing the same model for knowledge graph construction and retrieval does not necessarily yield superior performance. Lastly, our proposed community- and entity-based retrieval strategies reduce token consumption and cost by more than 96% compared to the local/global search baseline. In the case of GPT-4o, they achieve equal performance with the baseline local/global methods, suggesting a strong, significantly computationally cheaper alternative; in the case of the open-source Llama-70b, which appears to benefit more from the practices of local/global search, there is no similar improvement in performance. This suggests an overall model dependence when it comes to exploiting these techniques for context retrieval. On the whole, our findings suggest that for applications where computational cost and scalability are primary concerns, open-source graph extraction models combined with structure-exploiting retrieval strategies represent a viable and cost-efficient alternative, without incurring substantial penalties in answer quality.

6. Conclusions

In this work, we proposed an adaptation of the Microsoft Graph RAG approach in the EGD domain for reasoning about natural language QA over EGD documents. Our domain-adaptation pipeline offers two notable advantages. The first is that it proposes a knowledge graph for the domain of the EGD by extending prior initiatives around sustainability and environmental objectives, i.e., the SustainGraph. The second is that it provides two cost-efficient graph-based retrieval strategies that provide a favorable tradeoff between computational cost and ability to retrieve semantically accurate information from the large EGD policy corpus. As a result, non-technical users can extract actionable information from the corpus without requiring domain expertise or familiarity with its complex, heterogeneous structure. Furthermore, the proposed EGD entity schema and persona-based evaluation dataset developed for our experiments are designed to generalize in the environmental, climate change, and sustainability domains beyond the EGD corpus, serving as reusable resources for future GraphRAG applications over relevant policy documentation. Specifically, in the presented work, we focused on the EGD as a main initiative in EU legislation related to the aforementioned aspects. However, the approach can be applied to documents that are not strictly produced under the EGD umbrella, but related with the EGD (e.g., strategies and documents provided by UN, OECD, WEF, policy documents connecting other domains with climate change and sustainability).
Our experiments validated that the constructed EGD knowledge graphs, consisting of EGD-specific entity types, produced a computationally efficient pipeline that yields competitive results compared to widely used GraphRAG pipelines. Our evaluation of open-source model alternatives demonstrated that our EGD-tailored knowledge graph schema achieves statistically equivalent performance to their GPT-4o counterpart in quality-sensitive metrics at a fraction of the cost, suggesting that the performance gap between open- and closed-source models is narrow, making a fully open-source GraphRAG pipeline a feasible solution for policy document QA. Furthermore, our proposed community- and entity-based retrieval strategies demonstrated that, in the case of GPT-4o, targeted, structure-exploiting retrieval over pre-computed graph artifacts can match or outperform the search baseline, while dramatically reducing token consumption and associated costs.
One limitation of this work concerns the sole use of GPT-4o as the LLM judge in all evaluation techniques. This introduces a potential model-dependence bias; specifically, the evaluation framework may implicitly favor answers whose style and framing align with GPT-4o’s output tendencies, potentially inflating scores for GPT-4o-based configurations relative to open source alternatives, and introducing a degree of circularity within the evaluation framework. In addition, low performance scores are generally observed in answer accuracy and factual correctness metrics across all retrieval strategies at hand. This reflects a known limitation of GraphRAG-based systems, whose verbose answers are misaligned with the reference answers used by fact-level evaluation metrics [9], and suggests a weakness in the current frameworks deployed for GraphRAG system evaluation.
In our future work, we aim to focus on exploring alternative options to exploit the pre-built topological knowledge graph structure for context retrieval at a low cost. An example of this is the use of Graph Neural Networks (GNNs) to facilitate the retrieval process by propagating information across multi-hop neighborhoods of differently positioned nodes within the knowledge graph. This could assist in the process of capturing high-order relational graph patterns, which would otherwise be overlooked by cosine similarity over individual entities or communities. We would also like to further investigate the application of our proposed retrieval techniques with open-source models, specifically the driving factor between models such as Llama-70b not performing as well as their closed-source counterparts. The persona-driven evaluation dataset constructed in this work could also pave the way towards systematic persona-based performance analysis to examine how the diverse needs of each stakeholder profile are served by each of the retrieval strategies and to further explore the practical relevance of our work. This could inform the design of persona-adaptive retrieval mechanisms tailored to specific requirements. In the same aspect, we envision that further investigation of low-achieving answers and a subsequent error analysis could provide us with insight regarding the context of information that is being retrieved from the knowledge graph and where the current system struggles in generating answers from it, enabling targeted improvements. With respect to similar policy-driven coverage, we envision to extend the proposed pipeline to additional sustainability policy corpora included in the SustainGraph, such as the Country-Specific Recommendation (CSR) and Nationally Determined Contribution (NDC) document collections, which have been partially explored within the context of the SustainGraph, towards a more comprehensive graph-based knowledge infrastructure. Lastly, given the development of the policy analysis mechanisms around the EDG, efforts are planned to be given to develop a web application that can make the developed workflows available to the wide public (including policymakers, Non-Governmental Organizations—NGOs, enterprises, and citizens) and assess their usability and effectiveness in the design of policies and solutions to address climate adaptation needs.

Author Contributions

Conceptualization, E.A., I.M., C.-M.A., E.F., A.Z., D.D. and S.P.; methodology, E.A., I.M., C.-M.A., E.F. and A.Z.; software, E.A., I.M. and C.-M.A.; validation, E.A., I.M., C.-M.A., E.F., A.Z. and D.D.; data curation, E.A., I.M. and C.-M.A.; writing—review and editing, E.A., I.M., C.-M.A., E.F., A.Z., D.D. and S.P.; visualization, E.A., I.M., C.-M.A., E.F. and A.Z.; supervision, S.P. All authors have read and agreed to the published version of the manuscript.

Funding

This research has received funding for the NAIADES project (Grant No: 0559897) from the Research Excellence Partnerships of the National Recovery and Resilience Plan “Greece 2.0” that is co-funded by the European Union—NextGenerationEU.

Institutional Review Board Statement

Not applicable.

Informed Consent Statement

Not applicable.

Data Availability Statement

The datasets used in this manuscript are available in the Gitlab repository at [13].

Conflicts of Interest

The authors declare no conflicts of interest.

Abbreviations

The following abbreviations are used in this manuscript:
EGDEuropean Green Deal
EUEuropean Union
GraphRAGGraph Retrieval-Augmented Generation
LLMLarge Language Model
NERNamed-Entity Recognition
NLPNatural Language Processing
QAQuestion Answering
RAGRetrieval-Augmented Generation
SDGsSustainable Development Goals

Appendix A. Entity Types Located in the Corpus by GLiNER

Table A1. Entity type breakdown for the entirety of the EGD corpus as extracted by GLiNER.
Entity TypeCountExample Entities Detected
Actor844Member States, Consumers, Citizens
Legislation715State Aid Rules, Industrial Emissions Directive
Sector622Industry, Agriculture, Aquaculture
Policy607Common Agricultural Policy, Trade Policy
Programme519Horizon Europe, LIFE Programme, InvestEU Programme
Resource480Fossil Fuels, Natural Resources, Raw Materials
Geographical Area435Europe, Africa, Rural Areas
Solution287Clean Air Directive, Vertical Farming, Carbon Farming
Funds253EU Funding, Investments, Innovation Fund
Date2382030, 2021, 2020
Deadline98End of 2021, 2021–2027, June 2021
Total5098

Appendix B. Knowledge Graph Extraction

Table A2. Prompt passed to the LLM for NER and knowledge graph creation. Note that only one of the four few-shot examples we used is presented in the table.
Prompt Instructions
--Goal--
Given a text document that is potentially relevant to this activity and a list of entity types, identify all entities of those types from the text and all relationships among the identified entities.
--Steps--
1. Identify all entities. For each identified entity, extract the following information:
- entity_name: Name of the entity, capitalized
- entity_type: One of the following types: [{entity_types}]
- entity_description: Comprehensive description of the entity’s attributes and activities
Format each entity as ("entity" {tuple_delimiter} <entity_name> {tuple_delimiter} <entity_type> {tuple_delimiter} <entity_description>)
2. From the entities identified in step 1, identify all pairs of (source_entity, target_entity) that are *clearly related* to each other.
For each pair of related entities, extract the following information:
- source_entity: name of the source entity, as identified in step 1
- target_entity: name of the target entity, as identified in step 1
- relationship_description: explanation as to why you think the source entity and the target entity are related to each other
- relationship_strength: a numeric score indicating strength of the relationship between the source entity and target entity
Format each relationship as ("relationship" {tuple_delimiter} <source_entity> {tuple_delimiter} <target_entity> {tuple_delimiter} <relationship_description> {tuple_delimiter} <relationship_strength>)
3. Return output in English as a single list of all the entities and relationships identified in steps 1 and 2. Use **{record_delimiter}** as the list delimiter.
4. When finished, output {completion_delimiter}
-Example:-
...
Entity_types: DATE, GEOGRAPHICAL_AREA, POLICY, ACTOR, SECTOR, DEADLINE, RESOURCE, LEGISLATION, FUNDS
Text: Europe will need an estimated EUR 350 billion in additional investment per year over this decade to meet its 2030 emissions-reduction target in energy systems alone, alongside the EUR 130 billion it will need for other environmental goals. Under the 2021–2027 Multiannual Financial Framework (MFF) and Next-Generation-EU (NGEU), the Union aims to spend up to EUR 605 billion on projects addressing the climate crisis and EUR 100 billion in projects supporting biodiversity. Of the EUR 750 billion allocated for Next-Generation-EU, 30% will be raised through issuance of NGEU green bonds.
Output:
("entity" {tuple_delimiter} EUROPE {tuple_delimiter} GEOGRAPHICAL_AREA {tuple_delimiter} European region requiring investment for emissions-reduction targets) {record_delimiter}
("entity" {tuple_delimiter} EUR 350 BILLION {tuple_delimiter} FUNDS {tuple_delimiter} Estimated additional investment per year needed over this decade for emissions-reduction targets in energy systems) {record_delimiter}
("entity" {tuple_delimiter} 2030 {tuple_delimiter} DEADLINE {tuple_delimiter} Target deadline for emissions-reduction goals) {record_delimiter}
("entity" {tuple_delimiter} ENERGY SYSTEMS {tuple_delimiter} SECTOR {tuple_delimiter} Energy sector requiring investment for emissions-reduction) {record_delimiter}
("entity" {tuple_delimiter} EUR 130 BILLION {tuple_delimiter} FUNDS {tuple_delimiter} Additional funding needed for other environmental goals) {record_delimiter}
("entity" {tuple_delimiter} 2021-2027 {tuple_delimiter} DATE {tuple_delimiter} Time period for the Multiannual Financial Framework) {record_delimiter}
("entity" {tuple_delimiter} MULTIANNUAL FINANCIAL FRAMEWORK {tuple_delimiter} LEGISLATION {tuple_delimiter} EU budget framework for 2021-2027 period) {record_delimiter}
("entity" {tuple_delimiter} NEXT-GENERATION-EU {tuple_delimiter} POLICY {tuple_delimiter} EU recovery instrument to address climate and environmental challenges) {record_delimiter}
("entity" {tuple_delimiter} THE UNION {tuple_delimiter} ACTOR {tuple_delimiter} The European Union spending on climate and biodiversity projects) {record_delimiter}
("entity" {tuple_delimiter} EUR 605 BILLION {tuple_delimiter} FUNDS {tuple_delimiter} Amount to be spent on climate crisis projects under MFF and NGEU) {record_delimiter}
("entity" {tuple_delimiter} EUR 100 BILLION {tuple_delimiter} FUNDS {tuple_delimiter} Amount to be spent on biodiversity projects) {record_delimiter}
("entity" {tuple_delimiter} EUR 750 BILLION {tuple_delimiter} FUNDS {tuple_delimiter} Total amount allocated for Next-Generation-EU) {record_delimiter}
("entity" {tuple_delimiter} NGEU GREEN BONDS {tuple_delimiter} RESOURCE {tuple_delimiter} Financial instrument through which 30% of NGEU funding will be raised) {record_delimiter}
("relationship" {tuple_delimiter} EUROPE {tuple_delimiter} EUR 350 BILLION {tuple_delimiter} Europe will need EUR 350 billion in additional investment per year {tuple_delimiter} 10) {record_delimiter}
("relationship" {tuple_delimiter} EUR 350 BILLION {tuple_delimiter} 2030 {tuple_delimiter} EUR 350 billion in investment is needed per year to meet 2030 emissions targets {tuple_delimiter} 10) {record_delimiter}
("relationship" {tuple_delimiter} EUR 350 BILLION {tuple_delimiter} ENERGY SYSTEMS {tuple_delimiter} Investment is specifically needed for energy systems sector {tuple_delimiter} 10) {record_delimiter}
("relationship" {tuple_delimiter} EUROPE {tuple_delimiter} EUR 130 BILLION {tuple_delimiter} Europe will need EUR 130 billion for other environmental goals {tuple_delimiter} 9) {record_delimiter}
("relationship" {tuple_delimiter} MULTIANNUAL FINANCIAL FRAMEWORK {tuple_delimiter} 2021-2027 {tuple_delimiter} MFF covers the 2021-2027 period {tuple_delimiter} 10) {record_delimiter}
("relationship" {tuple_delimiter} THE UNION {tuple_delimiter} EUR 605 BILLION {tuple_delimiter} The Union aims to spend EUR 605 billion on climate crisis {tuple_delimiter} 10) {record_delimiter}
("relationship" {tuple_delimiter} THE UNION {tuple_delimiter} EUR 100 BILLION {tuple_delimiter} The Union aims to spend EUR 100 billion on biodiversity {tuple_delimiter} 10) {record_delimiter}
("relationship" {tuple_delimiter} MULTIANNUAL FINANCIAL FRAMEWORK {tuple_delimiter} EUR 605 BILLION {tuple_delimiter} EUR 605 billion comes from MFF and NGEU {tuple_delimiter} 9) {record_delimiter}
("relationship" {tuple_delimiter} NEXT-GENERATION-EU {tuple_delimiter} EUR 605 BILLION {tuple_delimiter} EUR 605 billion comes from MFF and NGEU {tuple_delimiter} 9) {record_delimiter}
("relationship" {tuple_delimiter} NEXT-GENERATION-EU {tuple_delimiter} EUR 750 BILLION {tuple_delimiter} EUR 750 billion is allocated to Next-Generation-EU {tuple_delimiter} 10) {record_delimiter}
("relationship" {tuple_delimiter} NGEU GREEN BONDS {tuple_delimiter} EUR 750 BILLION {tuple_delimiter} 30% of EUR 750 billion will be raised through green bonds {tuple_delimiter} 9) {record_delimiter}
("relationship" {tuple_delimiter} NGEU GREEN BONDS {tuple_delimiter} NEXT-GENERATION-EU {tuple_delimiter} Green bonds are the funding mechanism for NGEU {tuple_delimiter} 10) {completion_delimiter}
...
--Real Data--
Entity_types: {entity_types}
Text: {input_text}
Output:

Appendix C. Community- and Entity-Based Retrieval

Table A3. Prompt passed to the LLM to generate responses via the entity-based retrieval strategy.
Prompt Instructions
You are an expert assistant analyzing information from a knowledge graph about the European Green Deals.
Use the following community reports and entity descriptions to answer the question. Each community represents a cluster of related entities and information.
--CONTEXT--
{context}
--END CONTEXT--
Question: {question}
Instructions:
- Provide a comprehensive answer based on the community reports and the entity descriptions above
- Synthesize information across multiple communities/entities when relevant
- If the communities/entities don’t contain enough information, say so
- Be specific and reference key policies, targets, or mechanisms mentioned
- Only use the data provided in the context
Answer:
Table A4. Prompt passed to the LLM to generate responses via the community-based retrieval strategy.
Prompt Instructions
You are an expert assistant analyzing information from a knowledge graph about the European Green Deals.
Use the following community reports to answer the question. Each community represents a cluster of related entities and information.
--CONTEXT--
{context}
--END CONTEXT--
Question: {question}
Instructions:
- Provide a comprehensive answer based on the community reports above
- Synthesize information across multiple communities when relevant
- If the communities don’t contain enough information, say so
- Be specific and reference key policies, targets, or mechanisms mentioned
- Only use the data provided in the context
Answer:
Table A5. Example of community-based retrieval: question, context provided to the LLM through the retrieved communities, and generated answer.
QuestionWhat is the role of the European Council in the new industrial strategy?
ContextCommunity 64: European Union Strategic Initiatives 2020;
Community 455: European Parliament and Competitiveness Council;
Community 451: European Union Strategic Advisory Bodies;
Community 224: European Manufacturing Strategy;
Community 674: European Union’s Climate and Digital Strategy
AnswerThe European Council plays a significant role in the new industrial strategy of the European Union, as highlighted in the community reports. The Council’s involvement is crucial in facilitating industrial collaboration and strategic partnerships, which are essential components of the EU’s broader strategic initiatives launched in March 2020. These initiatives aim to enhance industrial competitiveness, promote sustainable growth, and address global challenges. The European Council’s role is particularly emphasized in the context of the Competitiveness Council, which oversees the implementation of the EU’s industrial strategy. The Competitiveness Council facilitates dialogue among member states and ensures that their policies align with the EU’s objectives for economic growth and competitiveness. This strategic oversight is vital for fostering a resilient industrial base capable of adapting to global challenges. Moreover, the European Council’s meeting in March 2020 underscored the importance of industrial collaboration, highlighting the EU’s proactive approach to addressing global challenges. This aligns with the EU’s commitment to sustainable growth and global leadership, as reflected in the strategic initiatives focusing on climate neutrality, gender equality, and biodiversity conservation. In summary, the European Council, through its collaboration with the Competitiveness Council and other EU bodies, plays a pivotal role in shaping and implementing the new industrial strategy. This involves promoting strategic partnerships, ensuring policy alignment among member states, and fostering a competitive and sustainable industrial environment across the EU.
Table A6. Example of entity-based retrieval: question, context provided to the LLM through the retrieved entities and communities, and generated answer.
QuestionWhat is the role of the European Council in the new industrial strategy?
Context[POLICY] New Industrial Strategy for Europe; [POLICY] New Industrial Strategy; [POLICY] A New Industrial Strategy for Europe; [ACTOR] Competitiveness Council; [ACTOR] European Council; [POLICY] Industrial Strategy; [DATE] European Council Conclusions Oct. 2020; [ACTOR] The Council; [ACTOR] Council; [POLICY] EU Industrial Leadership
Community 16: European Green Deal and 2050 Climate Goals;
Community 224: European Manufacturing Strategy;
Community 7: European Clean Hydrogen Alliance;
Community 134: Clean Hydrogen and Associated Initiatives;
Community 515: Clean Hydrogen and Strategic Collaborations
AnswerThe European Council plays a pivotal role in the new industrial strategy for Europe by providing strategic direction and setting priorities for the European Union. It is instrumental in supporting industrial transformation partnerships and fostering collaboration and innovation across various sectors. The Council’s involvement is crucial in aligning member states’ policies with the overarching goals of the EU’s industrial strategy, promoting competitiveness and economic growth across the region. In March 2020, the European Council demonstrated its commitment to fostering renewed partnerships, highlighting its role in facilitating cooperation and strategic alliances within the EU. Additionally, the Council has been involved in endorsing the EU Solar Energy Strategy, underscoring its commitment to promoting sustainable energy solutions and addressing climate change, which it recognizes as an existential threat. Furthermore, the European Council has been a key player in the establishment of the Recovery and Resilience Facility, a significant initiative aimed at supporting member states in their economic recovery efforts post-crisis. This facility is designed to bolster resilience and facilitate recovery, ensuring that the EU can effectively respond to and recover from economic challenges. Overall, the European Council is a central body within the EU, tasked with guiding the Union’s political and strategic agenda, supporting partnerships and initiatives that drive transformation and sustainability, and addressing critical issues such as climate change and economic recovery.

Appendix D. Rubric Scorer Descriptions

Table A7. Score descriptions for RAGAS rubric scorers for the adaptation of the four evaluation criteria. First column corresponds to the score the scorer gives to each answer in the range [1, 4].
ComprehensivenessDiversityDirectnessEmpowerment
1Answer is incomplete and misses most key aspects of the question. Major information gaps. Answer is redundant or irrelevant. Less than 30% of important points covered. Example: When asked about multiple policies, answer only mentions one policy.Answer provides single perspective with no variety. Single source or viewpoint. Lacks multiple dimensions. Example: Only mentions greenhouse gas emissions when asked about the different causes and effects of climate change.Answer does not directly address the question. Provides irrelevant or off-topic information. Example: Question asks about a policy and the answer discusses a different policy.Answer provides no reasoning. Claims are unsupported. Example: The answer to a question about the causes of global warming doesn’t reason behind the provided causes.
2Answer covers some aspects but has significant gaps or omissions. Missing several important points. 30–50% of important points covered. Example: When asked about multiple policies, answer mentions main policies but misses secondary policies, key mechanisms or targets referenced in the question.Answer provides limited perspectives, mostly one-dimensional. Minimal variety in viewpoints or sources. Example: Covers 2 aspects of causes of climate change when question requires multiple perspectives.Answer addresses question indirectly. Contains relevant information but lacks clear, direct response. Example: Question asks about how a policy is going to be implemented and answer only references what the policy is.Answer provides minimal reasoning. Some claims explained but many unsupported. Example: The answer to a question about the causes of global warming provides minimal reasoning about the provided causes.
3Answer covers main aspects but lacks some details or depth. Most important points present but incomplete. 50–80% coverage. Example: When asked about multiple policies, answer covers policies and general targets but misses specific timelines asked about in the question.Answer provides variety but could be more multi-faceted. Offers different perspectives or dimensions. Example: Covers environmental and economic causes of climate change, but misses social aspects.Answer addresses question but includes unnecessary details. Direct answer present but mixed with some irrelevant information. Example: Provides correct answer about the policy being asked about in the question, but includes excessive background information.Answer provides moderate reasoning. Main claims explained but supporting details lack depth. Example: The answer to a question about the causes of global warming explains and provides moderate reasoning behind the provided causes.
4Answer is thorough and complete. Covers all aspects with good detail. No significant omissions. 80–100% of important points covered. Example: When asked about multiple policies, answer covers all policies, targets, mechanisms that are referenced in the question.Answer is highly diverse and multi-dimensional. Rich variety of perspectives, sources, and viewpoints. Example: Comprehensive coverage of all relevant dimensions of climate change causes asked about in the question.Answer directly and precisely addresses the question. Clear, concise, focused response without irrelevant information. Example: Question about how a policy is going to be implemented is answered immediately and clearly.Answer provides excellent reasoning and supporting evidence. Most or all claims are well-explained with clear logic. Example: The answer to a question about the causes of global warming provides comprehensive explanations with clear reasoning and evidence throughout about all causes.

Appendix E. Statistical Significance Tests

Figure A1. Pairwise statistical significance tests (Shapiro–Wilk normality test followed by paired t-test or Wilcoxon signed-rank test) for the comparison of knowledge graph configurations using GPT-4o as the retrieval model across all evaluation metrics. Teal cells indicate statistically significant differences (p < 0.05); light blue cells indicate non-significant differences. Significance levels are denoted as follows: * p < 0.05; ** p < 0.01; *** p < 0.001.
Sustainability 18 06193 g0a1
Figure A2. Pairwise statistical significance tests (Shapiro–Wilk normality test followed by paired t-test or Wilcoxon signed-rank test) for the comparison of knowledge graph configurations using their corresponding construction model for retrieval across all evaluation metrics. Teal cells indicate statistically significant differences (p < 0.05); light blue cells indicate non-significant differences. Significance levels are denoted as follows: * p < 0.05; ** p < 0.01; *** p < 0.001.
Sustainability 18 06193 g0a2
Figure A3. Pairwise statistical significance tests (Shapiro–Wilk normality test followed by paired t-test or Wilcoxon signed-rank test) for the comparison of retrieval strategies on the EGD GraphRAG with GPT-4o knowledge graph configuration across all evaluation metrics. Teal cells indicate statistically significant differences (p < 0.05); light blue cells indicate non-significant differences. Significance levels are denoted as follows: * p < 0.05; ** p < 0.01; *** p < 0.001.
Sustainability 18 06193 g0a3
Figure A4. Pairwise statistical significance tests (Shapiro–Wilk normality test followed by paired t-test or Wilcoxon signed-rank test) for the comparison of retrieval strategies on the EGD GraphRAG with Llama-70b knowledge graph configuration across all evaluation metrics. Teal cells indicate statistically significant differences (p < 0.05); light blue cells indicate non-significant differences. Significance levels are denoted as follows: * p < 0.05; ** p < 0.01; *** p < 0.001.
Sustainability 18 06193 g0a4

References

  1. Jin, Z.; Mihalcea, R. Natural Language Processing for Policymaking. In Handbook of Computational Social Science for Policy; Bertoni, E., Fontana, M., Gabrielli, L., Signorelli, S., Vespe, M., Eds.; Springer: Berlin/Heidelberg, Germany, 2023; pp. 141–162. [Google Scholar] [CrossRef]
  2. Larosa, F.; Hoyas, S.; Conejero, H.A.; Garcia-Martinez, J.; Fuso Nerini, F.; Vinuesa, R. Large Language Models in Climate and Sustainability Policy: Limits and Opportunities. arXiv 2025, arXiv:2502.02191. [Google Scholar] [CrossRef]
  3. European Commission. The European Green Deal; European Commission: Brussels, Belgium, 2024.
  4. Publications Office of the European Union. EUR-Lex: Access to European Union Law. 2024. Available online: https://eur-lex.europa.eu/ (accessed on 15 November 2025).
  5. Cherubini, M.; Romano, F.; Bolioli, A.; De Mattei, L.; Sangermano, M. Improving the Accessibility of EU Laws: The Chat-EUR-Lex Project. In Proceedings of the Ital-IA 2024: 4th National Conference on Artificial Intelligence, Naples, Italy, 29–30 May 2024; CEUR Workshop Proceedings. Volume 3762. [Google Scholar]
  6. Mandilara, I.; Fotopoulou, E.; Androna, C.M.; Zafeiropoulos, A.; Papavassiliou, S. Knowledge Graph Data Enrichment Based on a Software Library for Text Mapping to the Sustainable Development Goals. In Proceedings of the Second International Workshop on Knowledge Graph Generation from Text (Text2KG 2023), Co-Located with ESWC 2023, Hersonissos, Greece, 28 May–1 June 2023; CEUR Workshop Proceedings. Volume 3447. [Google Scholar]
  7. Fotopoulou, E.; Mandilara, I.; Zafeiropoulos, A.; Laspidou, C.; Adamos, G.; Koundouri, P.; Papavassiliou, S. SustainGraph: A Knowledge Graph for Tracking the Progress and the Interlinking among the Sustainable Development Goals’ Targets. Front. Environ. Sci. 2022, 10, 1003599. [Google Scholar] [CrossRef]
  8. Han, H.; Shomer, H.; Wang, Y.; Lei, Y.; Guo, K.; Hua, Z.; Long, B.; Liu, H.; Tang, J. RAG vs. GraphRAG: A Systematic Evaluation and Key Insights. arXiv 2025, arXiv:2502.11371. [Google Scholar]
  9. Edge, D.; Trinh, H.; Cheng, N.; Bradley, J.; Chao, A.; Mody, A.; Truitt, S.; Metropolitansky, D.; Ness, R.O.; Larson, J. From Local to Global: A Graph RAG Approach to Query-Focused Summarization. arXiv 2025. [Google Scholar] [CrossRef]
  10. Xiao, Y.; Dong, J.; Zhou, C.; Dong, S.; Zhang, Q.w.; Yin, D.; Sun, X.; Huang, X. GraphRAG-Bench: Challenging Domain-Specific Reasoning for Evaluating Graph Retrieval-Augmented Generation. arXiv 2025, arXiv:2506.02404. [Google Scholar]
  11. Peng, B.; Zhu, Y.; Liu, Y.; Bo, X.; Shi, H.; Hong, C.; Zhang, Y.; Tang, S. Graph Retrieval-Augmented Generation: A Survey. ACM Trans. Inf. Syst. 2025, 44, 35. [Google Scholar] [CrossRef]
  12. Han, H.; Wang, Y.; Shomer, H.; Guo, K.; Ding, J.; Lei, Y.; Halappanavar, M.; Rossi, R.A.; Mukherjee, S.; Tang, X.; et al. Retrieval-Augmented Generation with Graphs (GraphRAG). arXiv 2025, arXiv:2501.00309. [Google Scholar] [CrossRef]
  13. Androna, C.M.; Mandilara, I.; Arkadopoulou, E. GraphRAG EGD Pipeline Gitlab Repository. 2026. Available online: https://gitlab.com/netmode/egd-graphrag (accessed on 2 June 2026).
  14. Ariai, F.; Demartini, G. Natural Language Processing for the Legal Domain: A Survey of Tasks, Datasets, Models and Challenges. ACM Comput. Surv. 2025, 58, 163. [Google Scholar] [CrossRef]
  15. Koundouri, P.; Alamanos, A.; Plataniotis, A.; Stavridis, C.; Perifanos, K.; Devves, S. Assessing the Sustainability of the European Green Deal and its Interlinkages with the SDGs. npj Clim. Action 2024, 3, 23. [Google Scholar] [CrossRef]
  16. Es, S.; James, J.; Espinosa-Anke, L.; Schockaert, S. RAGAs: Automated Evaluation of Retrieval Augmented Generation. In Proceedings of the 18th Conference of the European Chapter of the Association for Computational Linguistics: System Demonstrations (EACL 2024), St. Julians, Malta, 17–22 March 2024; pp. 150–158. [Google Scholar] [CrossRef]
  17. Tang, Y.; Yang, Y. MultiHop-RAG: Benchmarking Retrieval-Augmented Generation for Multi-Hop Queries. arXiv 2024, arXiv:2401.15391. [Google Scholar]
  18. Fan, W.; Ding, Y.; Ning, L.; Wang, S.; Li, H.; Yin, D.; Chua, T.S.; Li, Q. A Survey on RAG Meeting LLMs: Towards Retrieval-Augmented Large Language Models. In Proceedings of the 30th ACM SIGKDD Conference on Knowledge Discovery and Data Mining; Association for Computing Machinery: New York, NY, USA, 2024; pp. 6491–6501. [Google Scholar] [CrossRef]
  19. Sarthi, P.; Abdullah, S.; Tuli, A.; Khanna, S.; Goldie, A.; Manning, C.D. RAPTOR: Recursive Abstractive Processing for Tree-Organized Retrieval. In Proceedings of the Twelfth International Conference on Learning Representations, ICLR 2024, Vienna, Austria, 7–11 May 2024. [Google Scholar]
  20. Wang, Y.; Lipka, N.; Rossi, R.A.; Siu, A.; Zhang, R.; Derr, T. Knowledge Graph Prompting for Multi-Document Question Answering. In Proceedings of the AAAI Conference on Artificial Intelligence, Vancouver, BC, Canada, 20–27 February 2024; Volume 38, pp. 19206–19214. [Google Scholar] [CrossRef]
  21. Guo, Z.; Xia, L.; Yu, Y.; Ao, T.; Huang, C. LightRAG: Simple and Fast Retrieval-Augmented Generation. In Proceedings of the Findings of the Association for Computational Linguistics: EMNLP 2025, Suzhou, China, 4–9 November 2025; Christodoulopoulos, C., Chakraborty, T., Rose, C., Peng, V., Eds.; Association for Computational Linguistics: Stroudsburg, PA, USA, 2025; pp. 10746–10761. [Google Scholar] [CrossRef]
  22. Chung, J.; Ko, R.; Yoo, W.; Onizuka, M.; Kim, S.; Kim, T.W.; Shin, W.Y. GraphCompliance: Aligning Policy and Context Graphs for LLM-Based Regulatory Compliance. arXiv 2025, arXiv:2510.26309. [Google Scholar]
  23. Campi, R.; Pinciroli Vago, N.O.; Giudici, M.; Rodriguez-Guisado, P.B.; Brambilla, M.; Fraternali, P. A Graph-Based RAG for Energy Efficiency Question Answering. In Web Engineering (ICWE 2025); Lecture Notes in Computer Science; Springer: Cham, Switzerland, 2025; Volume 15749, pp. 41–55. [Google Scholar] [CrossRef]
  24. Stade, C.; Schneider, J.; Fu, Y. From Evidence to Insights: GraphRAG as a Dynamic Knowledge Layer for the Collaboration for Environmental Evidence’s Database of Evidence Reviews. In Proceedings of the 3rd International Workshop on Knowledge Graphs for Sustainability (KG4S 2025), Co-Located with ESWC 2025, Portorož, Slovenia, 1 June 2025. [Google Scholar]
  25. Juhasz, M.; Dutia, K.; Franks, H.; Delahunty, C.; Mills, P.F.; Pim, H. Retrieval-Augmented Generation for Climate Decision Making. arXiv 2024, arXiv:2410.23902. [Google Scholar]
  26. Juvekar, K.; Purwar, A. Introducing a New Hyper-Parameter for RAG: Context Window Utilization. arXiv 2024, arXiv:2407.19794. [Google Scholar] [CrossRef]
  27. Bhat, S.R.; Rudat, M.; Spiekermann, J.; Flores-Herr, N. Rethinking Chunk Size For Long-Document Retrieval: A Multi-Dataset Analysis. arXiv 2025, arXiv:2505.21700. [Google Scholar]
  28. NVIDIA. Finding the Best Chunking Strategy for Accurate AI Responses. 2025. Available online: https://developer.nvidia.com/blog/finding-the-best-chunking-strategy-for-accurate-ai-responses/ (accessed on 2 April 2026).
  29. Traag, V.A.; Waltman, L.; Van Eck, N.J. From Louvain to Leiden: Guaranteeing well-connected communities. Sci. Rep. 2019, 9, 5233. [Google Scholar] [CrossRef] [PubMed]
  30. Zheng, L.; Chiang, W.L.; Sheng, Y.; Zhuang, S.; Wu, Z.; Zhuang, Y.; Lin, Z.; Li, Z.; Li, D.; Xing, E.; et al. Judging LLM-as-a-Judge with MT-Bench and Chatbot Arena. In Proceedings of the Advances in Neural Information Processing Systems; Oh, A., Naumann, T., Globerson, A., Saenko, K., Hardt, M., Levine, S., Eds.; Curran Associates, Inc.: New York, NY, USA, 2023; Volume 36, pp. 46595–46623. [Google Scholar]
  31. Wang, P.; Li, L.; Chen, L.; Cai, Z.; Zhu, D.; Lin, B.; Cao, Y.; Kong, L.; Liu, Q.; Liu, T.; et al. Large Language Models are not Fair Evaluators. In Proceedings of the 62nd Annual Meeting of the Association for Computational Linguistics (Volume 1: Long Papers), Bangkok, Thailand, 11–16 August 2024; Ku, L.W., Martins, A., Srikumar, V., Eds.; Association for Computational Linguistics: Stroudsburg, PA, USA, 2024; pp. 9440–9450. [Google Scholar] [CrossRef]
  32. Ragas Contributors. Rubrics Based Scoring—Ragas Documentation. 2024. Available online: https://docs.ragas.io/en/stable/concepts/metrics/available_metrics/rubrics_based/ (accessed on 20 December 2025).
  33. Explosion AI. spaCy: Industrial-Strength Natural Language Processing. Software. Zenodo. 2024. Available online: https://zenodo.org/records/1212303 (accessed on 20 December 2025).
  34. Explosion AI. spaCy English Pipeline: en_core_web_lg, v3.8.0; Explosion AI: Berlin, Germany, 2024.
  35. Zaratiana, U.; Tomeh, N.; Holat, P.; Charnois, T. GLiNER: Generalist Model for Named Entity Recognition using Bidirectional Transformer. In Proceedings of the 2024 Conference of the North American Chapter of the Association for Computational Linguistics: Human Language Technologies (Volume 1: Long Papers), Mexico City, Mexico, 16–21 June 2024; Association for Computational Linguistics: Stroudsburg, PA, USA, 2024; pp. 5364–5376. [Google Scholar] [CrossRef]
  36. OpenAI. GPT-4 Technical Report. Technical Report, OpenAI. 2024. Available online: https://cdn.openai.com/papers/gpt-4.pdf (accessed on 2 April 2026).
  37. OpenAI. New Embedding Models and API Updates. 2024. Available online: https://openai.com/index/new-embedding-models-and-api-updates/ (accessed on 2 April 2026).
  38. Grattafiori, A.; Dubey, A.; Jauhri, A.; Pandey, A.; Kadian, A.; Al-Dahle, A.; Letman, A.; Mathur, A.; Schelten, A.; Vaughan, A.; et al. The Llama 3 Herd of Models. arXiv 2024, arXiv:2407.21783. [Google Scholar] [CrossRef]
  39. Nussbaum, Z.; Morris, J.X.; Duderstadt, B.; Mulyar, A. Nomic Embed: Training a Reproducible Long Context Text Embedder. arXiv 2024, arXiv:2402.01613. [Google Scholar]
  40. Bratanic, T. Integrating Microsoft GraphRAG into Neo4j. 2024. Available online: https://neo4j.com/blog/developer/microsoft-graphrag-neo4j/ (accessed on 2 April 2026).
  41. van Elburg, J.; van der Putten, P.; Marx, M. Can We Evaluate RAGs with Synthetic Data? arXiv 2025, arXiv:2508.11758. [Google Scholar] [CrossRef]
  42. Ragas Contributors. Testset Generation—Ragas Documentation. 2024. Available online: https://docs.ragas.io/en/stable/getstarted/rag_testset_generation/ (accessed on 20 December 2025).
  43. Driouich, I.; Cao, H.; Thomas, E. Diverse and Private Synthetic Datasets Generation for RAG Evaluation: A Multi-Agent Framework. In Proceedings of the TRUST-AI: The European Workshop on Trustworthy AI, Co-Located with ECAI 2025, Bologna, Italy, 25–26 October 2025. [Google Scholar]
  44. Freund, R.J.; Wilson, W.J. Statistical Methods; Elsevier: Amsterdam, The Netherlands, 2003. [Google Scholar]
  45. Heo, J.; Xiong, M.; Heinze-Deml, C.; Narain, J. Do LLMs estimate uncertainty well in instruction-following? In Proceedings of the Neurips Safe Generative AI Workshop 2024, Vancouver, BC, Canada, 14–15 December 2024. [Google Scholar]
  46. Li, M.; Zhang, R. How Far is Language Model from 100% Few-Shot Named Entity Recognition in Medical Domain. arXiv 2023, arXiv:2307.00186. [Google Scholar]
Figure 1. High-level view of the of EGD GraphRAG pipeline.
Sustainability 18 06193 g001
Figure 2. Schema of the constructed knowledge graph. Green nodes represent the eleven domain-specific entity types, the orange node represents text chunks, the blue node represents source documents, and the pink node represents communities.
Sustainability 18 06193 g002
Figure 3. Experimental setup flow of stages and implemented modifications at each stage.
Sustainability 18 06193 g003
Figure 4. Performance comparison of answers derived using the baseline local/global retrieval methods across the four knowledge graph configurations, evaluated on our synthetic testset using the selected evaluation metrics.
Sustainability 18 06193 g004
Figure 5. Performance comparison of answers derived using the baseline local/global retrieval methods, using GPT-4o for retrieval for the EGD GraphRAG with GPT-4o configuration, Llama-70b for the for the EGD GraphRAG with Llama-70b configuration, and Llama-8b for the EGD GraphRAG with Llama-8b configuration, evaluated on our synthetic testset using the selected evaluation metrics.
Sustainability 18 06193 g005
Figure 6. Performance comparison of answers derived using the baseline local/global and our proposed community- and entity-based retrieval methods based on the EGD GraphRAG with GPT-4o knowledge graph configuration using the same retrieval model, evaluated on our synthetic testset using the selected evaluation metrics.
Sustainability 18 06193 g006
Figure 7. Performance comparison of answers derived using the baseline local/global and our proposed community- and entity-based retrieval methods based on the EGD GraphRAG with Llama-70b knowledge graph configuration using the same retrieval model, evaluated on our synthetic testset using the selected evaluation metrics.
Sustainability 18 06193 g007
Table 1. Entity labels used for knowledge graph construction, capturing the core semantic dimensions of policy content. The entity type schema is designed to be generalizable beyond the EGD corpus to broad policy documentation.
Entity TypeDescription
SolutionMeasures, actions, or mechanisms proposed to address a challenge
DateSpecific dates or time references mentioned in the documents
Geographical AreaCountries, regions, cities, and other spatial references
PolicyEU and international policy frameworks and strategies
ActorEU and international bodies, organizations, and stakeholders
SectorIndustry sectors
DeadlineTarget dates for goals
ResourceNatural resources, raw materials, and energy sources
LegislationBinding legal instruments and regulatory frameworks or obligations
FundsFunds and financial instruments
ProgrammeEU programmes and initiatives
Table 2. EGD-tailored personas used for testset generation.
PersonaRole Description
PolicymakerDevelops and implements European policies. Needs technical information on policy mechanisms, implementation timelines, and cross-sector coordination.
Academic ResearcherConducts scholarly research on EGD strategies. Requires rigorous evidence, methodological details, and policy impact assessments.
Climate Advocacy WorkerWorks for climate justice Non-Governmental Organizations to analyze and campaign around EGD strategies. Seeks information on policy ambition gaps and implementation progress.
General CitizenInterested in how EGD policies affect everyday life. Requires accessible explanations without technical jargon or prior policy knowledge.
Industry RepresentativeRepresents businesses navigating EU climate regulations. Focuses on compliance pathways, transition costs, and available support mechanisms.
JournalistReports on policy developments for media outlets. Needs fact-checkable information and context on political debates and stakeholder positions.
Local Government OfficialImplements EU climate policies at municipal level. Requires guidance on funding mechanisms and coordination with national frameworks.
Table 3. Experimental knowledge graph configurations.
Microsoft GraphRAG with GPT-4oEGD GraphRAG with GPT-4oEGD GraphRAG with Llama-8bEGD GraphRAG with Llama-70b
EntitiesDefaultEGD-relatedEGD-relatedEGD-related
Chunk Size1200102410241024
NER LLMgpt-4ogpt-4ollama-8bllama-70b
Embedding Modeltext-embedding-3-smalltext-embedding-3-smallnomic-embed-textnomic-embed-text
Table 4. Evaluation metrics used for answer quality assessment.
MetricDescription
ComprehensivenessHow much detail the answer provides to cover all aspects of the question. A comprehensive answer is thorough and complete, without being redundant or irrelevant.
DiversityHow varied and rich the answer is in providing different perspectives and insights on the question. A diverse answer is multi-faceted, offering different viewpoints and supporting evidence.
DirectnessHow specifically and clearly the answer addresses the question. A direct answer is concise and focused, without unnecessary or irrelevant information.
EmpowermentHow well the answer helps the reader make informed judgments, by clearly explaining the reasoning and sources behind its claims.
Answer RelevancyHow well the response addresses the intent of the user input, penalising incomplete or off-topic answers, without evaluating factual accuracy.
Answer AccuracyAgreement between the generated response and the reference answer via two LLM-as-a-Judge prompts, averaged into a final score.
Semantic SimilaritySemantic resemblance between the generated response and the reference answer using embedding-based cosine similarity.
Factual CorrectnessFactual alignment between answer and reference determined by decomposing both into claims and computing precision, recall, and F1 of factual overlap.
Table 5. Computational cost for graph creation across our four configurations; tokens calculated based on current pricing of USD 2.5/1 M for input and USD 10/1 M for output for GPT-4o, USD 0.88/1 M for both input and output for Llama-70b, and USD 0.02/1 M for text-embedding-3-small; derived graph density across our four knowledge graph configurations expressed in entities, relationships, communities and chunks.
Microsoft GraphRAG
with GPT-4o
EGD GraphRAG with GPT-4oEGD GraphRAG with Llama-70bEGD GraphRAG with Llama-8b
Input Tokens∼4.6 M∼10.88 M∼13.12 M0 *
Output Tokens∼0.09 M∼0.22 M∼0.27 M0 *
Embedding Tokens∼1 M∼1 M0 *0 *
Total Tokens∼5.7 M∼12.1 M∼13.390 *
Total CostUSD 12.47USD 29.43USD 11.780 *
Entities130247145198868
Relationships197157755874236
Communities12387891135
Chunks182218218218
*: Deployed locally; no API calls and therefore no token costs incurred.
Table 6. Entity type breakdown of the entities extracted from Llama-70b, Llama-8b and GPT-4o in the EGD GraphRAG with Llama-70b, EGD GraphRAG with Llama-8b and EGD GraphRAG with GPT-4o knowledge graph Configurations, respectively.
Entity TypeGPT-4oLlama-70bLlama-8bExample Entities
Actor37136779Member States, Consumers
Legislation405606175National Energy and Climate Plans, Renewable Energy Directive
Sector5911154125Renewable Energy, Healthy Housing
Policy64726552Common Agricultural Policy, Trade Policy
Programme29137997Horizon 2020, European Local Energy Assistance
Resource1132916131Fossil Fuels, Biobased Products
Geographical Area13415719Western Balkans, Africa
Solution61210106Recovery and Resilience Plans, Smart Buildings
Funds17220727Next Generation EU Funds, Investments
Date968326September 2020, 2023
Deadline31255Summer 2021, 2022–2024
Total44825169742
Table 7. Computational cost for knowledge graph retrieval for the 103 synthetic QA pairs across our configurations using local/global retrieval methods; tokens calculated based on current pricing of USD 2.50/1 M for input and USD 10.00/1 M for output for GPT-4o, and USD 0.88/1 M for both input and output for Llama-70b.
Retrieval Model Microsoft GraphRAG
with GPT-4o
EGD GraphRAG with GPT-4oEGD GraphRAG with Llama-8bEGD GraphRAG with Llama-70b
GPT-4oInput Tokens∼4.28 M∼27.03 M∼1.36 M∼22.27 M
Output Tokens∼0.09 M∼0.55 M∼0.03 M∼0.45 M
Total Tokens∼4.37 M∼27.58 M∼1.39 M∼22.72 M
CostUSD 11.57USD 73.10USD 3.68USD 60.22
Llama-70bInput Tokens∼36.50 M
Output Tokens∼0.75 M
Total Tokens∼37.25 M
CostUSD 32.78
Llama-8bInput Tokens0 *
Output Tokens0 *
Total Tokens0 *
Cost0 *
* Deployed locally; no API calls and therefore no token costs incurred.
Table 8. Computational cost for knowledge graph retrieval for the 103 synthetic QA pairs across the EGD GraphRAG with GPT-4o and EGD GraphRAG with Llama-70b configurations using both the baseline and our proposed retrieval methods; tokens calculated based on current pricing of USD 2.50/1 M for input and USD 10.00/1 M for output for GPT-4o, and USD 0.88/1 M for both input and output for Llama-70b.
Retrieval Strategy EGD GraphRAG with GPT-4oEGD GraphRAG with Llama-70b
Local/GlobalTotal Tokens∼27.58 M∼22.27 M
Total CostUSD 73.10USD 32.78
Cost per QuestionUSD 0.709USD 0.318
Community k = 5 Total Tokens∼389 K∼340 K
Total CostUSD 1.50USD 0.54
Cost per QuestionUSD 0.015USD 0.005
Community k = 10 Total Tokens∼725 K∼612 K
Total CostUSD 2.22USD 0.64
Cost per QuestionUSD 0.021USD 0.006
Entity k = 5 , n = 10 Total Tokens∼555 K∼596 K
Total CostUSD 1.54USD 0.54
Cost per QuestionUSD 0.013USD 0.005
Entity k = 10 , n = 15 Total Tokens∼855 K∼1 M
Total CostUSD 2.79USD 0.90
Cost per QuestionUSD 0.027USD 0.009
Disclaimer/Publisher’s Note: The statements, opinions and data contained in all publications are solely those of the individual author(s) and contributor(s) and not of MDPI and/or the editor(s). MDPI and/or the editor(s) disclaim responsibility for any injury to people or property resulting from any ideas, methods, instructions or products referred to in the content.