Article

Sustainable Urban Accessibility and Retail Choices: Consumer Behaviour Through Discrete Choice Analysis in Southern Italy


1
Department of Engineering and Architecture, University of Enna Kore, Cittadella Universitaria, 94100 Enna, Italy
2
School of Rural & Surveying Engineering, Faculty of Engineering, Aristotle University of Thessaloniki, 54124 Thessaloniki, Greece
*
Author to whom correspondence should be addressed.
Sustainability 2026, 18(12), 6081; https://doi.org/10.3390/su18126081
Submission received: 7 May 2026 / Revised: 7 June 2026 / Accepted: 8 June 2026 / Published: 12 June 2026
(This article belongs to the Special Issue Sustainable Urban Green Transport and Mobility: Lessons from Practice)

Abstract

Shopping mobility accounts for a significant share of total travel, while the growth of e-commerce is reshaping consumer purchasing behaviour and retail dynamics. Comprehending how territorial and sociodemographic factors shape the choice between physical and digital retail channels is therefore a key issue for transport planning and sustainable urban mobility. In this context, it is important to understand how accessibility to different classes of retailers is configured and how it can impact purchasing choices. Through a discrete choice analysis, this study examines the sociodemographic and territorial determinants of purchasing behaviour, focusing on the clothing market. Four purchase alternatives are considered: medium-sized and small urban retail stores, shopping malls, online purchasing, and no purchase. This multi-alternative framework enables the direct estimation of substitution patterns not only between physical and digital retail, but also between distinct forms of physical retail. Data were collected through a survey conducted in Southern Italy, providing empirical evidence from a territorial setting that is structurally underrepresented in the existing literature. A multinomial logit model and a two-level hierarchical logit model incorporating pedestrian accessibility—measured as walking time from residence to the nearest clothing store—alongside sociodemographic and territorial attributes were calibrated to analyse alternative choice behaviour. The calibrated models show interesting results, highlighting the role of pedestrian accessibility in the choice of clothing stores in city centres. Age, income, and territorial variables further differentiate channel preferences across population segments. The findings offer relevant implications for policymakers, governance managers, urban planners, and researchers concerned with retail location, sustainable accessibility, and consumer behaviour. These insights are highly valuable for developing planning that addresses the United Nations 2030 Agenda, particularly Sustainable Development Goal 11.

1. Introduction

The United Nations 2030 Agenda for Sustainable Development places strong emphasis on the sustainability of transport system transformations, mobility patterns, and user behaviour. The Agenda establishes 17 Sustainable Development Goals (SDGs), each designated by a sequential number; of these, three are of direct relevance to the themes addressed in this paper. SDG 11, “Make cities and human settlements inclusive, safe, resilient and sustainable”, highlights the importance of accessibility to transport systems, sustainable urbanisation, and integrated policies and planning strategies aimed at social inclusion. SDG 12, “Ensure sustainable consumption and production patterns”, promotes more sustainable forms of consumption, while SDG 13, “Take urgent action to combat climate change and its impacts”, underlines the need to shift towards activities that actively contribute to climate change mitigation [1]. Consequently, the ways in which people access consumption represent a key dimension of sustainability, cutting across economic, social, and environmental domains.
Shopping is one of the main reasons for travel. Despite the natural decline associated with the COVID-19 pandemic, it continues to account for a significant portion of travel. In Italy, for example, in 2022, shopping trips accounted for 15.8% of total urban pax*km [2]. At the same time, over recent decades, e-commerce has experienced exponential growth, a trend further accelerated by the COVID-19 pandemic. Restrictions on mobility and social interaction during the pandemic fostered a widespread reliance on home-based purchasing and delivery services, intensifying a process already underway since the early 2000s, particularly in the United States [3]. The development of e-commerce has profoundly altered interactions among consumers, logistics operators, retail activities, and the urban environment. E-commerce reshapes relationships within supply chains and induces significant changes in urban transport systems, which accommodate last-mile delivery operations. Business-to-Consumer (B2C) e-commerce directly connects firms with end consumers, partially avoiding traditional retailers and reconfiguring last-mile logistics structures [4].
An illustrative urban logistics scheme is shown in Figure 1. The urban supply chain can be schematised into three players that move goods, generating three flows. In the traditional supply chain, large distribution operators or manufacturers supply retailers from warehouses generally located outside urban areas. End-user mobility for purchases connects residences and retailers. E-commerce flows directly connect manufacturers/distributors with the end consumer.
Several externalities are associated with changes in urban logistics. These include delivery fragmentation [5], unattended deliveries and returns [6,7,8,9], increased pollutant emissions [10,11,12], and a general rise in commercial vehicle traffic within urban areas [13]. Such effects have direct implications for urban decarbonisation strategies (SDG 13), for sustainable consumption (SDG 12) and for the overall sustainability of cities (SDG 11).
From a user perspective, these changes in consumption behaviour have resulted in a pronounced channel shift, from traditional retail purchasing—whether in small neighbourhood shops or large shopping centres—towards online shopping. The transition from a paradigm centred on purchase mobility to one based on online consumption has far-reaching consequences for logistics systems, urban form, and social sustainability. Increased reliance on e-commerce leads to a growth in last-mile delivery flows, amplifying the negative externalities discussed above; however, it determines progressive transformation and reduction of traditional retail activities, particularly small, local shops, contributing to what the urban retail literature describes as commercial desertification—a phenomenon with documented effects on the social and economic viability of city centres [14,15,16]. Conversely, consolidated delivery systems may enable more efficient management of last-mile flows, as logistics operators can exert greater control over vehicle routing and delivery schedules, provided that demand patterns are adequately understood and managed [17].
The concept of sustainable accessibility provides a unifying theoretical lens through which the relationships between transport, land use, and the SDGs can be articulated. Accessibility—defined as the ease with which individuals can reach destinations and activities—represents a multidimensional construct that encompasses infrastructural, temporal, and individual dimensions [18,19]. In the context of this research, two main SDG targets may be considered: targets 11.1 and 11.2 make explicit reference to users’ access to essential services and public transport, with reference to users in disadvantaged conditions. This objective may be undermined if the shift towards e-commerce and peripheral retail formats progressively erodes pedestrian accessibility to neighbourhood retail services. This hypothesis motivates the empirical investigation conducted in this paper. Access to basic retail services must therefore be analysed as an explicit determinant of channel choice, thereby establishing a direct and measurable link between the concept of sustainable accessibility and observed consumer behaviour.
Within this framework, the analysis of accessibility to retail activities emerges as a potentially decisive factor in understanding consumer demand patterns. Investigating user choice behaviour between traditional retail channels and online purchasing is therefore a central issue for transport planning, in line with the 2030 Agenda [1,20] and Sustainable Urban Mobility Plans (SUMPs) [21]. Transport administrators require quantitative indicators and methodologies to address this challenge [22,23]. With specific reference to SDG 13, it is important to recall that last-mile delivery operations represent a substantial source of CO2 emissions in urban contexts [1,20,24].
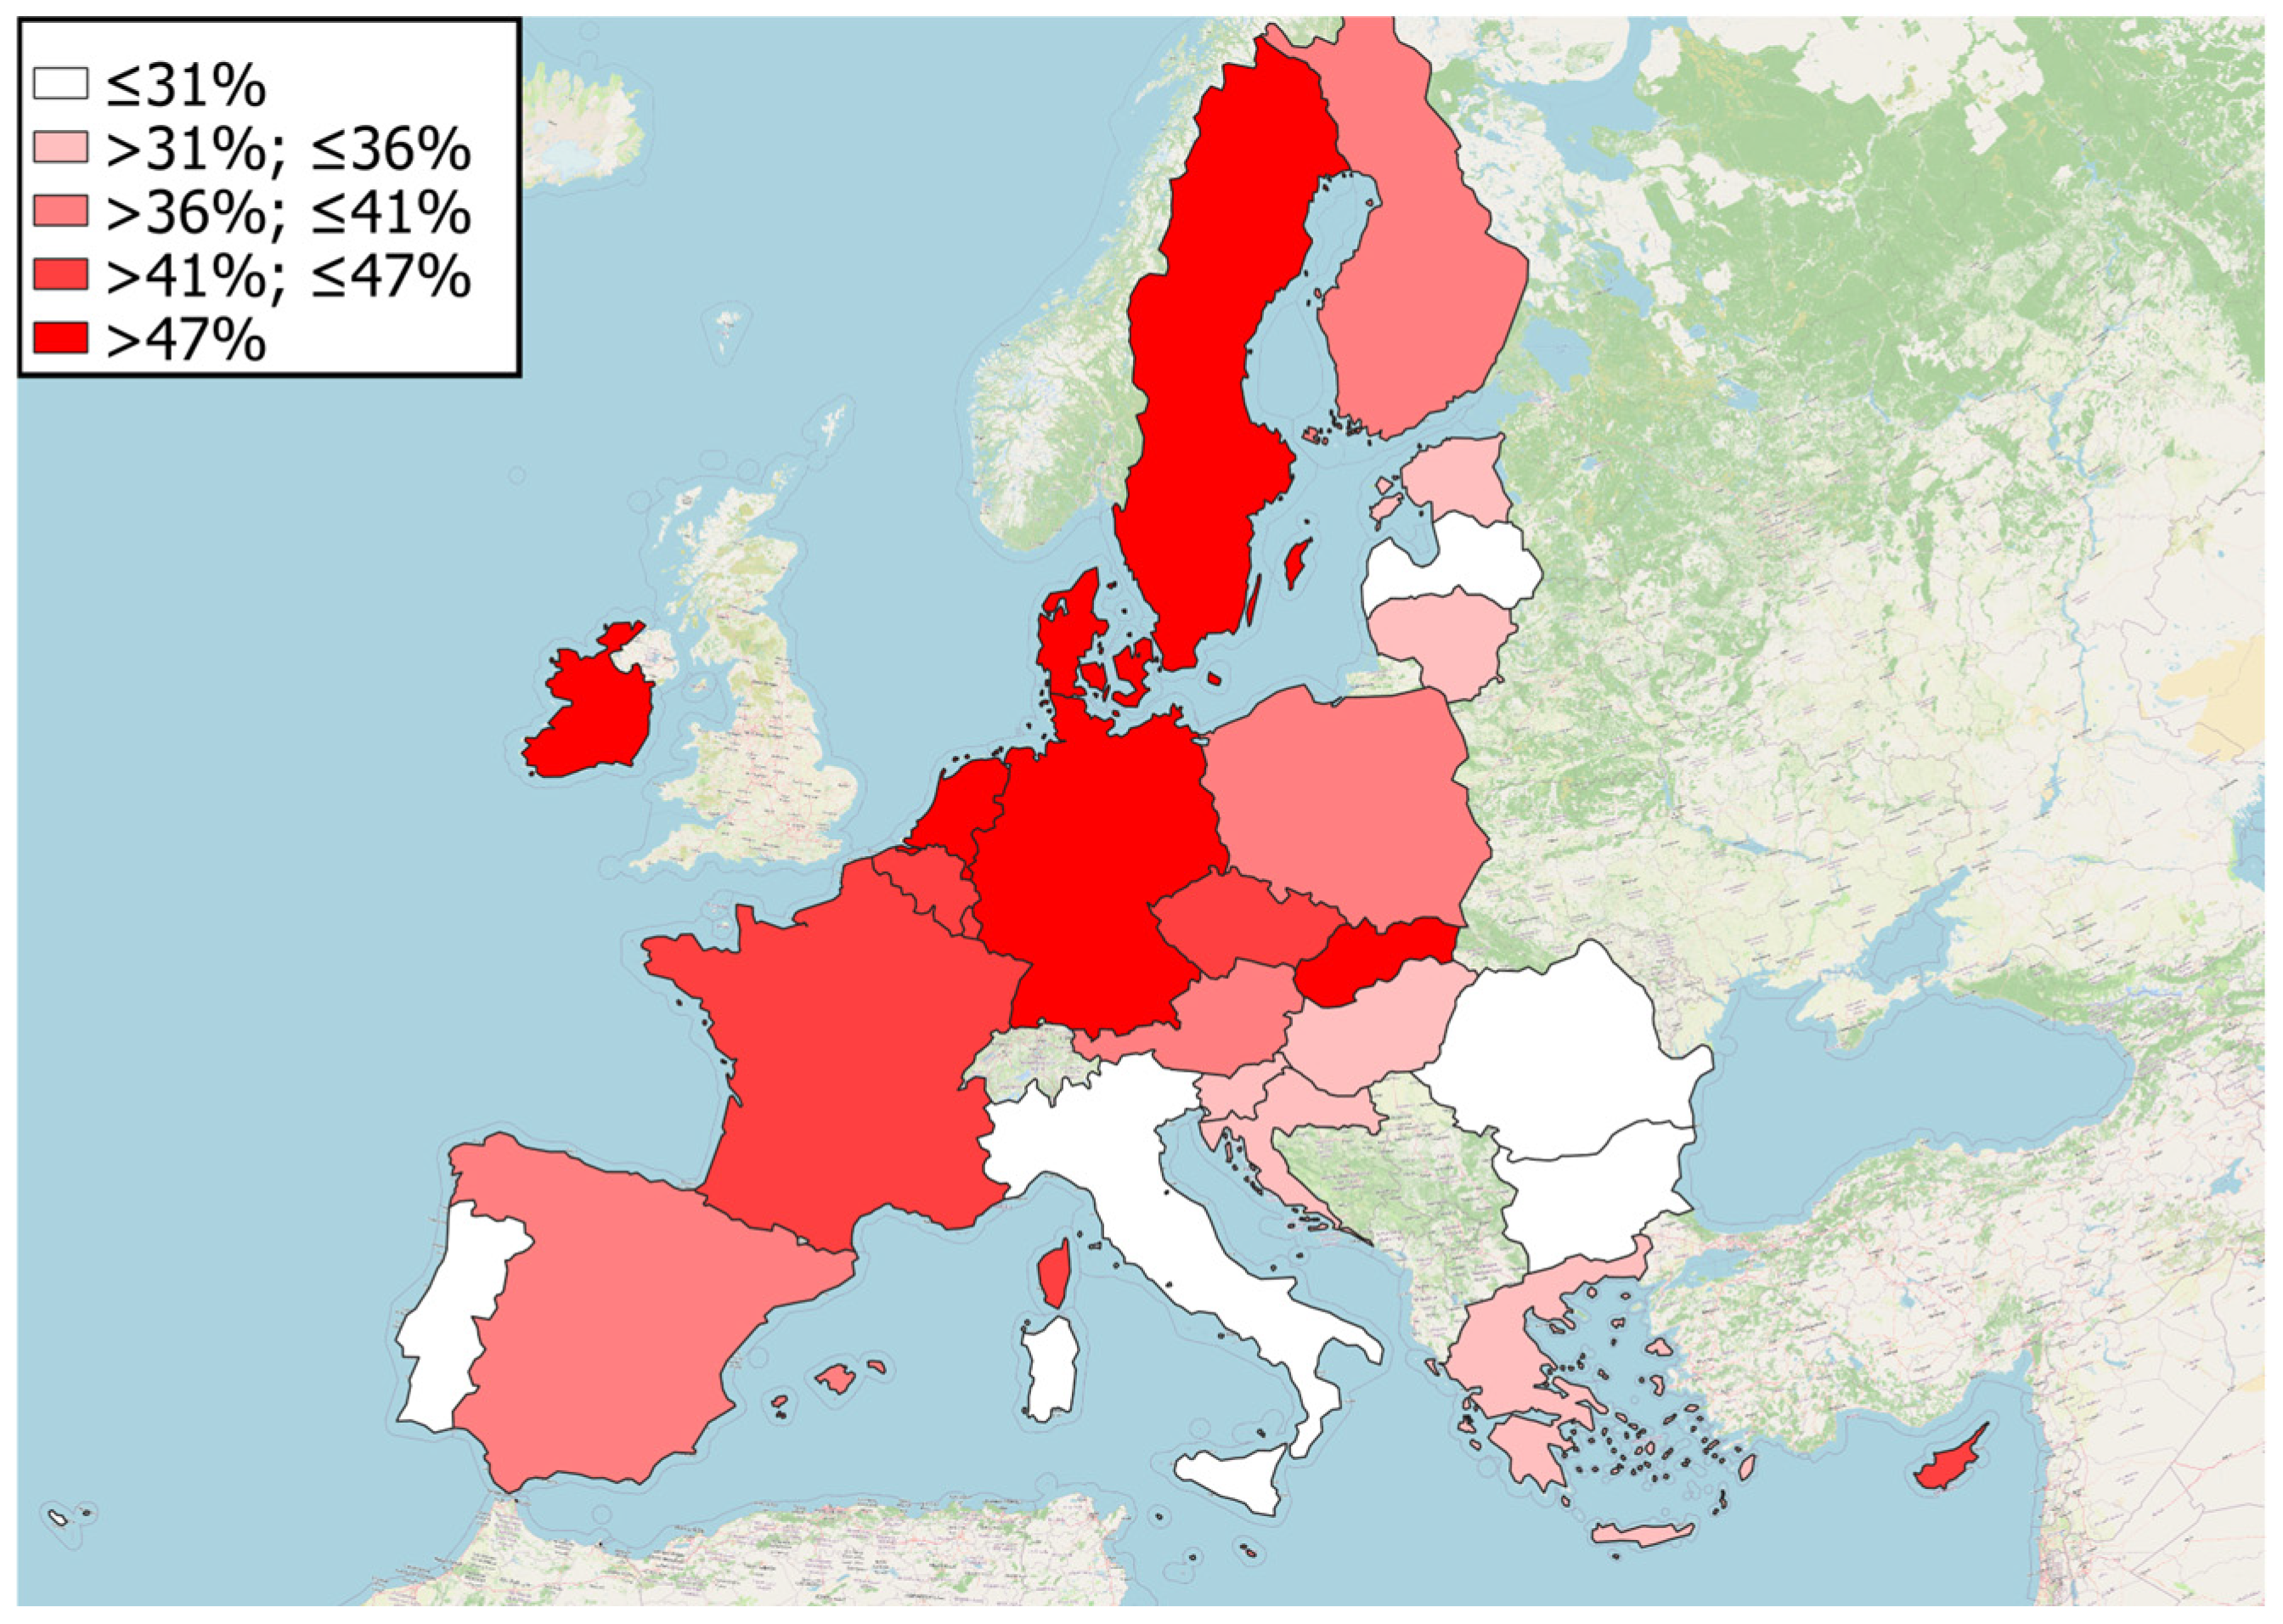
The present study aims to analyse the sociodemographic and territorial characteristics of consumers, examining their purchasing choices between online and physical retail channels. The empirical analysis focuses on Southern Italy, a region that exhibits among the lowest levels of e-commerce adoption in Western Europe [25], and specifically in two regions with delayed development. The study concentrates on a specific product category—clothing—which represents one of the most widely purchased categories online across several European countries. The proportion of consumers purchasing clothing online in the European Union is illustrated in Figure 2.
The study is conducted in a territorial context characterised by below-average e-commerce adoption relative to the European Union. The selection of clothing responds to two main motivations. It is the most purchased category online across European countries, ensuring the relevance of the online alternative within the choice set. Also, its strong experiential and proximity-based dimensions sustain demand for physical retail, making it suitable for analysing competition between channels.
Building on the sustainability challenges outlined in the context of the 2030 Agenda, this research investigates the sociodemographic and territorial determinants of consumer purchasing behaviour, with particular attention to the adoption of e-commerce in the regions under analysis. The study employs Random Utility Models (RUMs) to analyse individual choice behaviour across alternative purchasing channels—small-scale neighbourhood retail stores, large shopping malls, and online purchasing—while explicitly accounting for the “no purchase” option.
The paper integrates an accessibility measure, time to the nearest physical retail outlet, with sociodemographic and territorial attributes and distinguishes between traditional and digital retail channels. This approach contributes to understanding how consumption choices interact with urban form, transport systems, and last-mile logistics. These factors are particularly relevant considering the growing role of e-commerce in shaping urban freight mobility and its associated environmental and social externalities. The role of walking time is also highlighted, considering the importance of urban walking in the context of SDG 11 on Sustainable Cities and Communities [26,27].
The main novelty of the paper lies in the joint treatment of pedestrian accessibility as a channel-level predictor and the inclusion of non-purchase as a modelled alternative tested in the context of clothing consumption in a low-e-commerce-adoption region.
The empirical analysis is based on original survey data collected by the authors in the study area and is conducted through the estimation of both a multinomial logit model and a two-level hierarchical logit model. In the hierarchical specification, small and medium-sized neighbourhood stores and shopping malls are grouped within a common nest representing traditional retail channels, allowing for correlation in unobserved factors affecting these alternatives. The modelling results offer insights that are potentially relevant for sustainable mobility policies, retail planning, and strategies aimed at fostering a balanced coexistence between digital and physical consumption channels, in line with the objectives of the United Nations 2030 Agenda.
The remainder of the paper is organised as follows. Section 2 reviews the relevant literature and outlines the state of the art on online purchasing behaviour, with a specific focus on clothing consumption. Section 3 presents the theoretical framework and the mathematical formulation of the adopted Random Utility Models. Section 4 describes the survey design, the descriptive analysis of the data, and the calibration results of the proposed models. Section 5 discusses the main findings and their policy implications, while Section 6 concludes the paper and highlights directions for future research.

2. Research Background

2.1. Discrete Choice Modelling Background

Discrete choice modelling (DCM) has long been recognised as a foundational approach for analysing transport demand and user behaviour. Early contributions by McFadden [28], Ben-Akiva [29], and Domencich and McFadden [30] identified transport demand as a primary application domain for these models, highlighting the central role of behavioural analysis in forecasting travel demand. Since the 1970s, discrete choice models have been extensively employed to investigate decision-making processes in contexts where individuals select among a finite set of alternatives. A robust understanding of demand behaviour and of the motivations underlying users’ movements represents a crucial prerequisite for the effective planning of mobility policies. By modelling these behavioural processes, it becomes possible to simulate future scenarios and to evaluate the impacts of infrastructural, regulatory, or pricing interventions.
These aspects are particularly relevant in the development of Sustainable Urban Mobility Plans (SUMPs), which require detailed, data-driven analyses of user behaviour in order to support coherent and sustainable strategic decisions [21]. In recent years, discrete choice modelling has undergone substantial theoretical and applied advancements, driven by the introduction of functional forms of logit and probit models [31,32,33]. These extensions have increased modelling flexibility, allowing researchers to relax some of the restrictive assumptions of classical models and to achieve a closer representation of observed behaviour.
Historically, discrete choice models have developed in connection with transport demand forecasting frameworks, although they do not represent the sole methodological evolution in this field [34,35,36]. Traditional transport demand models have predominantly focused on systematic mobility, such as home-to-work or home-to-school trips, which place the greatest burden on transport supply systems. Within classical Transportation System Modelling, mobility decisions are typically structured around four main dimensions: the decision to travel, destination choice, mode choice, and route choice [37]. The four-stage model conceptualises overall user behaviour as a sequence of interrelated decisions, encompassing trip generation, destination selection, transport mode, and route choice [38,39]. However, discrete choice models have also been successfully applied to non-systematic and non-work-related trips, including short-distance choices and discretionary activities [40]. Among these, shopping trips represent a particularly relevant category.

2.2. Application of DCM to Purchase Behaviour Analysis

In this context, the analysis of user behaviour plays a central role in urban logistics modelling. Consumer mobility for shopping purposes, together with the spatial distribution of retail activities, constitutes a starting point for modelling urban freight distribution systems [41].
An integrated methodology for forecasting shopping-related mobility is proposed by Comi [42], who analyses the interaction between consumer purchasing trips and distributor restocking trips. A key novelty of this framework lies in the explicit integration of e-commerce-related trips. Consumer purchasing behaviour directly affects freight distribution patterns: the choice of an online alternative generates a direct delivery trip from producers or large-scale distributors to the consumer’s residence (Figure 1) or to a collection-and-delivery point, thereby reshaping last-mile logistics. Distance and time to reach the stores are attributes commonly used in the literature to describe the utility that the user associates with a generic store [43,44]. The literature shows that, in the case of grocery stores, increasing distance leads to a reduction in the utility associated with a general store. In the furniture sector, identifying a large city as a place of residence has a positive impact on the utility of an online store, but a negative impact on the utility of a retail store. Furthermore, it has been shown that proximity to retail stores did not affect the likelihood of online purchases but did influence the choice of travel mode for retail shopping for various product categories [45,46,47].
From a consumer behaviour perspective, the coexistence of physical and digital retail alternatives has been theorised within multichannel and omnichannel frameworks, which conceptualise channel choice as a utility-maximising decision shaped by channel attributes, individual characteristics, and contextual factors [48,49].
Building on this theoretical foundation, a growing body of literature has examined the factors influencing the choice between physical retail and online purchasing channels, highlighting the role of sociodemographic and territorial attributes [50,51,52]. Several studies report that income, education level, and male gender are positively associated with online purchasing propensity [53,54]. Conversely, women, elderly individuals, and larger households tend to generate a higher number of shopping trips to physical stores [55,56]. More recently, Russo et al. [57] analysed online food delivery platform usage in Southern Italy. Their results indicate that walking time to the nearest grocery store, belonging to the millennial age group, and male gender positively influence online purchasing behaviour, while low income, residence in rural areas, and older age exert a negative effect.

2.3. Consumer Behaviour in the Clothing Market

Relatively fewer contributions focus specifically on clothing purchases. Mokhtarian and Tang [58] investigated the relationship between pre-purchase and purchase channel choices for clothing, analysing how channel attributes, sociodemographic characteristics, and situational factors influence behaviour. Comi and Nuzzolo [59] found that young adults and middle-aged individuals generate more clothing-related shopping trips than older consumers, and that women make more trips than men; however, their multinomial logit model of retailer type choice does not explicitly consider online alternatives. The integrated framework proposed by Comi [42] identifies purchase generation as a key sub-model for urban freight distribution, linking it to user characteristics and product categories. In this context, Comi and Nuzzolo [60] estimate a hierarchical logit model showing that female consumers exhibit a stronger preference for retail purchases, while younger individuals and students purchase more frequently across both channels. Nevertheless, the type of retail outlet is treated separately from the purchase generation process. Furthermore, the attributes considered are mainly sociodemographic.
Alongside these developments, consumer segmentation approaches have evolved beyond basic demographic classifications, increasingly adopting data-driven and persona-oriented frameworks suitable for modelling complex consumption decisions such as clothing preferences. Personas, understood as structured representations of consumer groups, are widely used in digital commerce to support personalisation, behavioural targeting, and sustainable logistics design. Jansen et al. [61] propose a data-driven framework for persona construction based on behavioural, demographic, and psychographic variables, closely aligned with latent segmentation approaches in discrete choice modelling.
Similarly, An et al. [62] demonstrate how aggregated digital platform data can be used to identify distinct behavioural segments through hybrid demographic–behavioural profiling, conceptually consistent with latent class and mixed logit models. At the same time, Salminen et al. [63] caution against the oversimplification inherent in traditional personas, advocating for dynamic and evidence-based segmentation approaches made possible by real-time behavioural data. From a methodological perspective, Gomes and Meisen [64] review customer segmentation techniques in e-commerce and highlight the robustness of advanced discrete choice models—such as latent class and mixed logit—in capturing preference heterogeneity, particularly in multidimensional product categories like clothing.
Recent contributions have also begun to integrate sustainability-related attitudes into consumer segmentation. Cauwelier et al. [65] introduce attitudinal sustainability profiles linking behavioural tendencies with environmentally oriented logistics preferences, a perspective that is particularly relevant given the growing attention to sustainable fashion consumption. These insights complement discrete choice approaches by embedding psychographic and environmental dimensions into behavioural modelling.
From a theoretical standpoint, McFadden’s work [28] provides the foundational framework for conditional logit modelling adopted in this study, while Train [66] offers advanced methodologies for estimating and simulating discrete choice models with heterogeneous preferences. Beyond modelling techniques, several studies highlight that clothing consumption is often driven by values, identity, and social signalling. Niinimäki [67] shows how eco-fashion choices reflect ideological and identity-based motivations, while Heffetz [68] emphasises the role of visibility in consumption, suggesting that clothing serves as a public signal of status and taste. Kapferer and Bastien [69] further contribute by analysing the luxury fashion segment, where exclusivity, craftsmanship, and brand perception play a decisive role in consumer choice.

2.4. Paper Positioning

The literature reviewed suggests that the shift from purchase mobility to home delivery reconfigures not only logistics systems but also the spatial logic of urban retail and the behavioural determinants of consumer choice. From a consumer behaviour perspective, this transition can be interpreted through the lens of channel utility maximisation, in which accessibility, habit, and sociodemographic characteristics jointly determine the relative attractiveness of physical and digital purchasing alternatives [48,49]. From the urban retailer resilience standpoint, the progressive erosion of pedestrian demand for city centre stores represents a structural challenge to the commercial viability of urban cores, with implications for land use, public space, and social sustainability [70]. Discrete choice modelling provides the methodological bridge between these two perspectives, enabling the formal estimation of how accessibility and sociodemographic attributes translate into channel preferences at the individual level, and how aggregate shifts in those preferences feed back into urban freight and mobility systems [42].
Overall, the literature reveals that while quantitative studies on e-commerce and consumer purchasing behaviour are extensive, analyses focusing on specific product categories—such as clothing—remain relatively limited. Moreover, existing models do not always explicitly compare different forms of physical retail (e.g., small neighbourhood stores versus shopping malls) with online alternatives within a unified behavioural framework. Distance from stores is often indicated as an attribute that contributes to user utility; however, there are no widespread models that explicitly try to evaluate the relationship between this accessibility measure and different channels in an integrated way.
Against this theoretical background, the present paper advances the literature along different dimensions. The paper employs discrete choice modelling techniques to directly compare e-commerce with multiple retail purchasing options. It models channel choice as a decision among a fully differentiated set of alternatives, comparing not only different retailers but also online and non-purchase alternatives. The explicit inclusion of non-purchase as a modelled alternative enables the framework to capture demand suppression effects alongside channel substitution, contributing to a more complete behavioural representation of urban shopping mobility. It introduces pedestrian accessibility as an explanatory variable of the user’s channel choice, rather than as an attribute of individual store utility. This allows the analysis to estimate how spatial proximity conditions the relative utility of urban retail versus other modelled alternatives.

3. Materials and Methods

Random Utility Models (RUM) are a class of models suitable for representing the behaviour and choices of individuals. As defined in the literature [28,71], these models are appropriate for the analysis of transport choices; they can adequately model, in closed form, users’ choice probabilities starting from the representation of their individual utility. For the discussion below, reference has been made to Ben-Akiva et al. [72], Marcucci [73], Train [66], Cascetta [37] and Cantarella et al. [74].
In random utility modelling, it is assumed that each user i is a rational decision maker who, having to choose an alternative j from a finite set I i , has the objective of maximising the utility U j i . Expressed as a probability, it is
p i j / I i = Pr U j i > U k i ,             k j               k , j I i
Definition of utility is
U j i = V j i + ε j i       j I i
where V j i is the systematic component, which is assumed to share the same functional form across all individuals i with respect to choice j , while ε j i is the random residual that allows us to model the variations around the mean value, expressed by the systematic utility. RUMs can assume different functional forms, based on the characteristics of the covariance of the random residuals.
The simplest functional form is expressed by the multinomial logit model (MNL), in which it is assumed that random residuals are independently and identically distributed (i.i.d.) according to a Gumbel random variable with zero mean and θ parameter. In an MNL model, the probability that user i chooses alternative j within set I i can be expressed as
p i j / I i = e x p ( V j / ϑ ) k = 1 m e x p ( V k / ϑ )
where I i = [ 1 , , k , , m ] .
In the MNL the alternatives are assumed to be uncorrelated. Actually, there is the possibility that the alternatives are not identically independent from each other; instead, some subsets may present common elements. In the paper, conditions are explored under which alternatives may exhibit elements of covariance. The hierarchical logit model allows one to partially overcome the i.i.d. hypothesis, admitting the existence of j , k alternatives characterised by C o v ( ε j i , ε k i ) 0 . In this case, different j , k alternatives are related, and they are grouped within the same subset, defined as a nest. The formulation of hierarchical logit model is reported in Appendix A.
The functional forms identified, MNL and hierarchical logit model, both refer to the class of logit models. For the characterisation of the attributes, referring to Croissant [75], the following will be considered:
  • Alternative specific variables x i j with a generic coefficient β ;
  • Individual specific variables z i with an alternative specific coefficient γ j ; they are attributes related to generic decision-makers [75], like the sociodemographic attributes;
  • Alternative specific variables w i j with an alternative specific coefficient d j ;
  • Intercepts α j , related only to alternative j .
For model calibration, Maximum Likelihood (ML) estimation is used. The basic hypothesis under ML estimation is that a better model can better resemble and replicate the choice of the sample. Therefore, it is necessary to study the parameters ( β , ϑ ) M L to obtain the maximisation of the probability that the model observes the choices adopted by the sample of users. This estimate is obtained by maximising the following function:
( β , ϑ ) M L = arg max l n L β , θ = arg m a x i = 1 , , n l n p i ( j ( i ) ) ( X i , β , θ )
Due to the specific nested structure of the hierarchical model, additional details regarding the calibration procedure are provided in Appendix A, with reference to [73,76].
For validation, formal and informal tests are carried out. Informal tests are related to an evaluation of the parameter not obtained through the calculation of a statistic or indicator, but only starting from the consistency of the value itself. Usually, the evaluation of the parameter’s sign is a good informal test on coefficients. For formal validation, the following are considered:
  • t-test, which is a formal test on individual coefficients, used to determine whether a specific explanatory variable has a statistically significant relationship with the dependent variable;
  • % of right, which identifies the percentage of choices that the model correctly predicted;
  • McFadden’s ρ 2 , which allows a comparison between the calibrated model, with L ( β ) M L , and the model without any explanatory capacity, characterised by L(0).

4. Results

4.1. Survey Results

The data used for the study are summarised in this section. The survey is of the Revealed Preference type and is aimed at analysing the choices already made by users.
The survey was developed on Google Forms [77] and distributed on social media (Facebook and LinkedIn) between July and September 2022. Overall, 219 responses were obtained, of which 13 were discarded because they were incomplete.
The remaining 206 responses represent the dataset adopted in this work. The results related to the two main sections (sociodemographic data and clothing habits) are presented below. The final sample comprises 52% male and 48% female respondents, indicating a relatively balanced gender distribution. The age structure shows a prevalence of younger adults, with 31.6% aged 18–22, 19.9% aged 27–35, 26.7% aged 36–50, and 21.8% over 50 years old. Regarding occupational status, 50.5% identified as workers and 36.9% as students, while a smaller fraction was retired (3.4%), unemployed (4.4%), or selected “other” (4.8%). Educational attainment was relatively high, with 60.7% of respondents holding at least a three-year university degree. Income distribution indicates that 44.7% earn less than €30,000 annually, 39.3% earn between €30,000 and €50,000, and 16% report incomes above €50,000. Household composition varied, with the majority living in families of four members (40.8%), while 23.3% lived in three-member households. Territorial distribution shows that 66.5% of respondents are from Sicily and 33.5% from Calabria. In terms of residential location, 43.7% reside in urban areas, 32.5% in peri-urban areas, and 23.8% in rural areas.
Summary statistics for the clothing section are reported below. Table 1 summarises the four classes of information requested from respondents in the section relating to online purchasing habits. There are four groups of questions. The first one considers the most frequent purchase made by the respondents. Four attributes of this purchase are investigated: item purchased, time of the last purchase, channel considered (store, shopping mall, online) and monetary amount.
Other questions focus on the frequency of purchases, other actions (like checking online information before the purchase) and a section about the accessibility to nearest store, in terms of distances and time with different modes of transport.
The main characteristics of the purchase made are requested. The four pieces of information requested and the percentages of responses are reported in the following:
  • The first question is related to the item purchased. Five answers are possible: 57.3% of respondents indicated “general clothing item”; 27.2% “shoes”; and the remaining 15.5% is made up of the “accessories”, “other” and “don’t know” categories.
  • The second question is about time of purchase: 23.8% of respondents indicated the last week, 44.7% indicated “Beyond the last week but in the last month”, 30.6% indicated “More than a month ago”, and only 1% expressly indicated that they “had not made any purchases/don’t know”.
  • The third question related to this topic involves the purchase channel: 39.3% indicated “store in city centre”, 26.2% indicated “store in shopping mall”, 33.5% indicated “online”, and the remaining 1% indicated they had not made any purchases. The percentage of “online” buyers is high, demonstrating how online purchases in the clothing sector are a widespread habit.
  • Considering the price of the last purchase, 54.9% indicated that the amount was between €10 and €50, while only 4.4% indicated an expense of less than €10 and finally 39.8% indicated more than €50.
Table 2 shows the results relating to the number of purchases made in the last month: 31.5% of respondents made zero purchases in the last month; notably, almost 25% made three (3) or more, indicating a high purchase frequency for a substantial part of the sample.
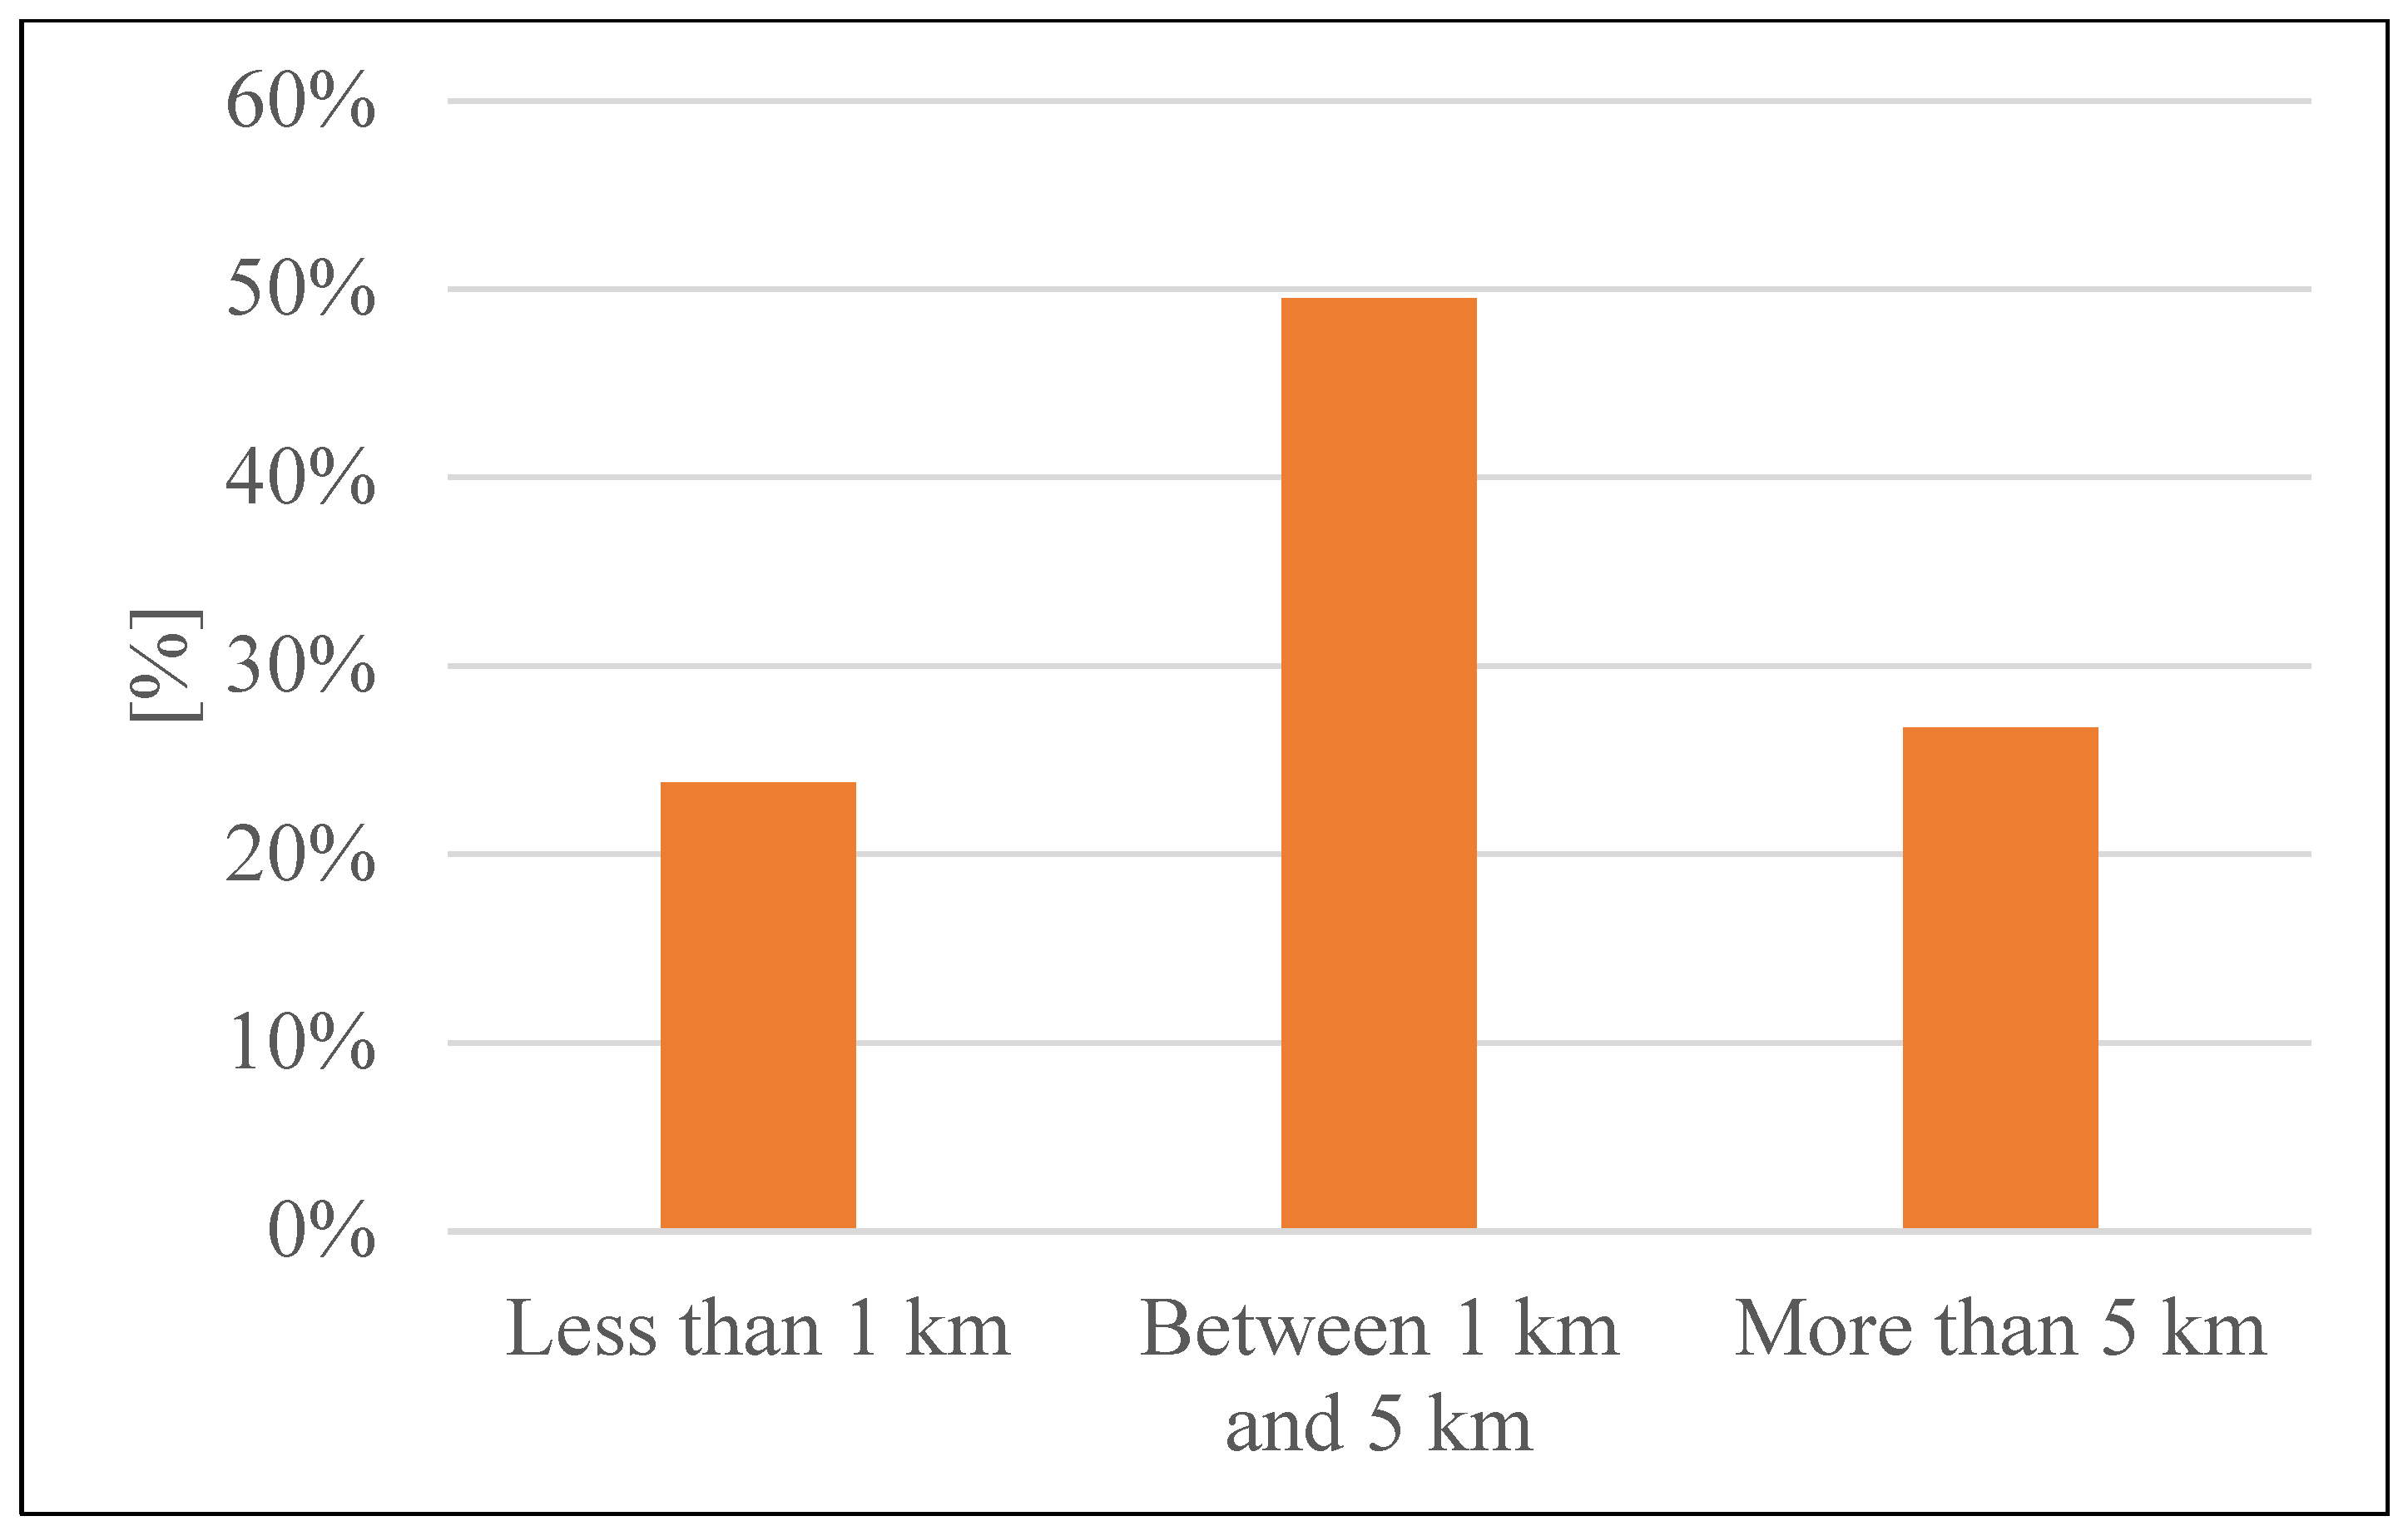
Results on distances are reported in Figure 3. The distribution is approximately symmetric around the central size class, between 1 and 5 km, indicating that the clothing store is not, on average, characterised by “proximity” to the residence.
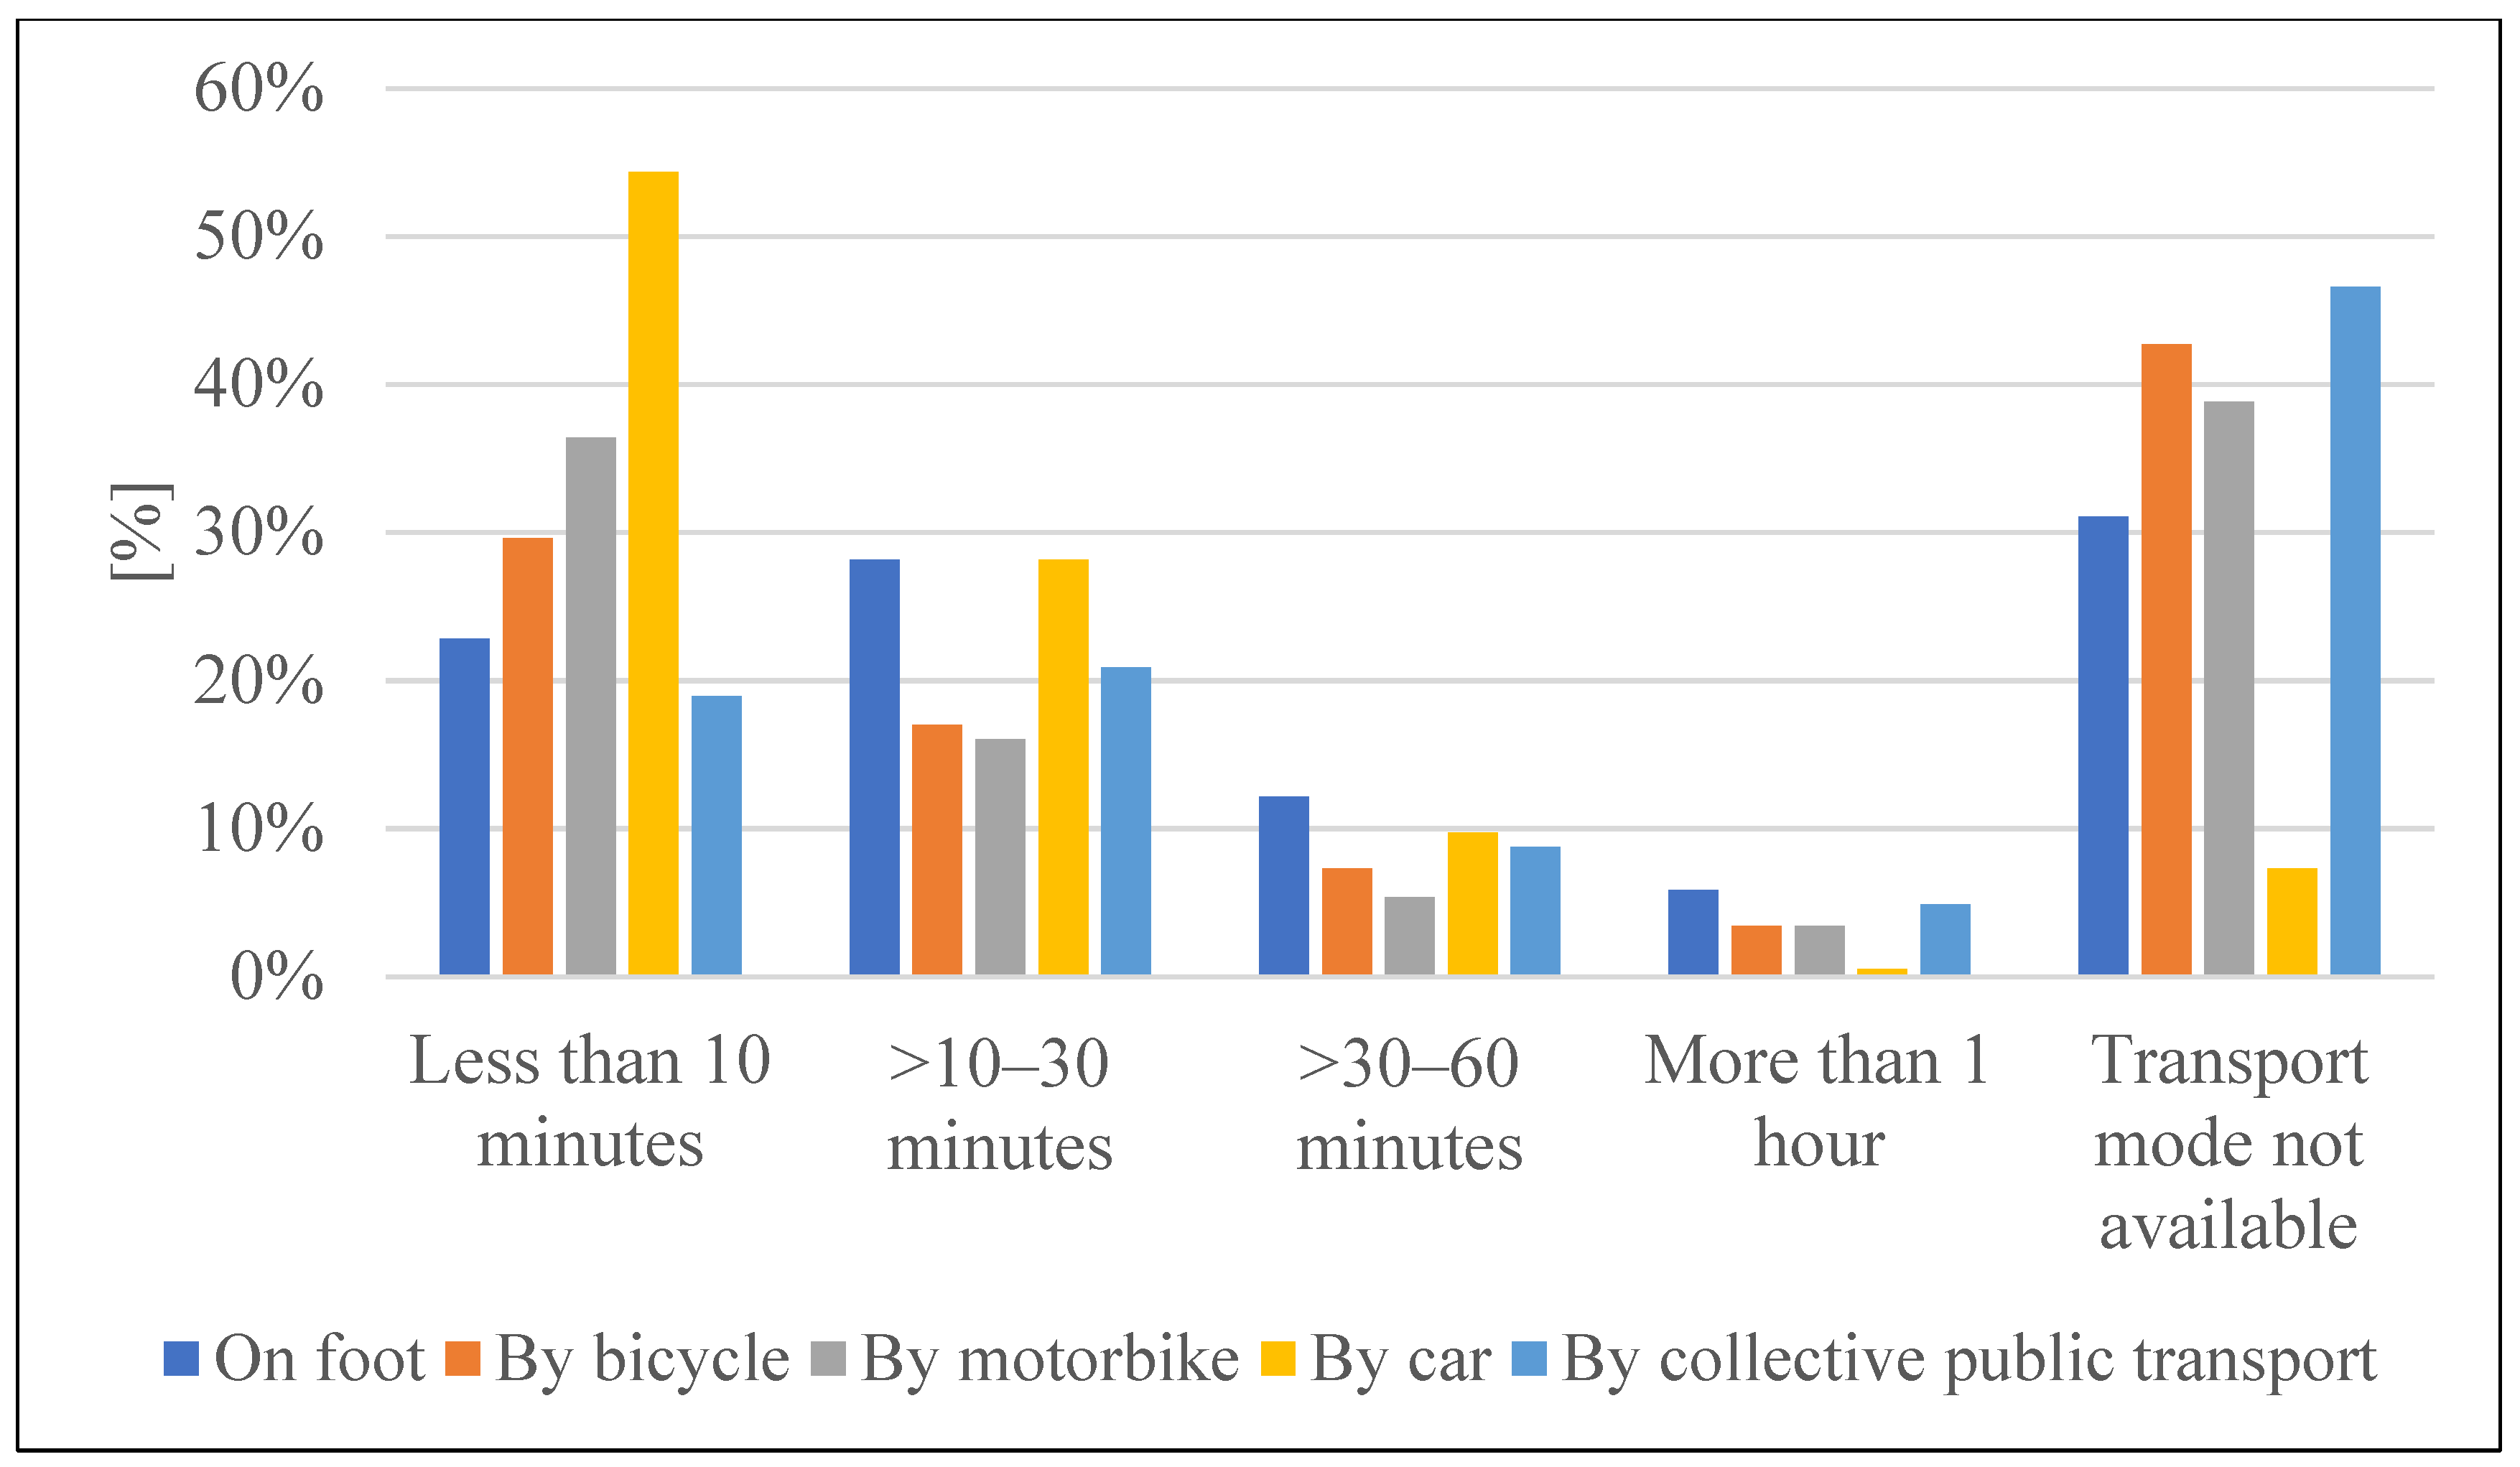
Percentages referring to “Times to nearest shop by means of transportation” are reported in Figure 4. Percentages decrease for the five modes of transport with the increase in time, except for the “Mode of transport not available” class.
In this case, it is also shown that the car mode of transport sees a substantial reduction as the time classes increase, although it should be considered (in this case the result agrees with the previous one on distances) that almost 40% of the respondents indicate a distance greater than 10 min and less than an hour.
Finally, the respondent is asked to indicate whether any complementary activities were carried out online or in store prior to the purchase. The study also investigates the preferences of users in terms of preferred channel for checking the specifications of the product to be purchased: online or in person. The results are shown in Table 3. The three (3) classes are almost equivalent in terms of number; in-store checking is preferred, even if online checking in general is indicated by more than 31%.

4.2. Modelling Results

4.2.1. Modelling Systematic Utility Specifications

The study focused on the analysis of the sociodemographic and territorial determinants of the purchasing channel. The modelling presented in this section, with the methodology described in Section 3, analyses the purchasing channel as an elementary choice.
The choice alternatives for the clothing sector available to the general user were identified by considering the four possibilities, referring to the purchase made. The alternatives studied are:
  • City centre, last purchase made in a shop in an urban centre, characterised by systematic utility V C ;
  • Shopping mall, last purchase made in a shop within a shopping park, characterised by systematic utility V M ;
  • Online, last purchase made on an e-commerce platform, characterised by systematic utility V O ;
  • No purchase, no clothing purchase has been made in the last month, characterised by systematic utility V N .
Due to the number of potentially useful attributes present, and given the complexity of the problem, multiple specifications have been proposed. The first specification is a multinomial logit model retaining all attributes with p-value < 0.1. Subsequent specifications maintain the same attributes and systematic utility expressions, varying only the assumptions on the variance–covariance matrix of the residuals across alternatives. For theoretical necessity, the same specification as for multinomial logits is used in calibrating the functional forms of hierarchical logits, even with variations in statistical significance. This allows for a direct comparison of the models’ goodness-of-fit using the same attributes. To verify the results obtained, each calibration is performed twice, the first time on R and a second time on MS Excel, to verify its functional form [78,79]. The set of attributes is the same for the proposed calibrations. For each of the proposed models, choice structure, utility and probability are proposed separately.
The aim is twofold:
  • To identify the variables that most significantly characterise users and their purchasing behaviour;
  • To assess whether hierarchical model configurations improve on the MNL baseline or reveal correlations among alternatives.
Equations (5)–(8) reports the specification of systematic components of utility function.
V C = β T F , C T F + β A 50 , C A 50 + β S , C S + β M C , C M C + β A S A , C A S A C
V M = β 1822 , M A 1822 + β M C , M M C
V O = β I , O I N + β S , O S + β A S A , O A S A O
V N = β M , N M A L E + β A 50 , N A 50 + β S , N S + β A S A , N A S A N
where
  • T F is a variable that indicates the average time to reach, on foot, the shop closest to the place of residence.
  • A 50 is a dummy variable that is equal to 1 if the user’s age is greater than 50 years.
  • I N is a dummy variable that is equal to 1 if the annual income is less than €30,000/y.
  • M A L E is a dummy variable that is equal to 1 if the user is male.
  • S is a dummy variable that is equal to 1 if the respondent is resident in Sicily.
  • M C is a dummy variable that is equal to 1 if the respondent is resident in a municipality with a population greater than 100,000 inhabitants.
  • A 1822 is a dummy variable that is equal to 1 if the user is between 18 and 22 years old.
  • A S A C , A S A O , A S A N are the alternative specific attributes characterising city centre, online and no purchase respectively.

4.2.2. Model Structure Specifications

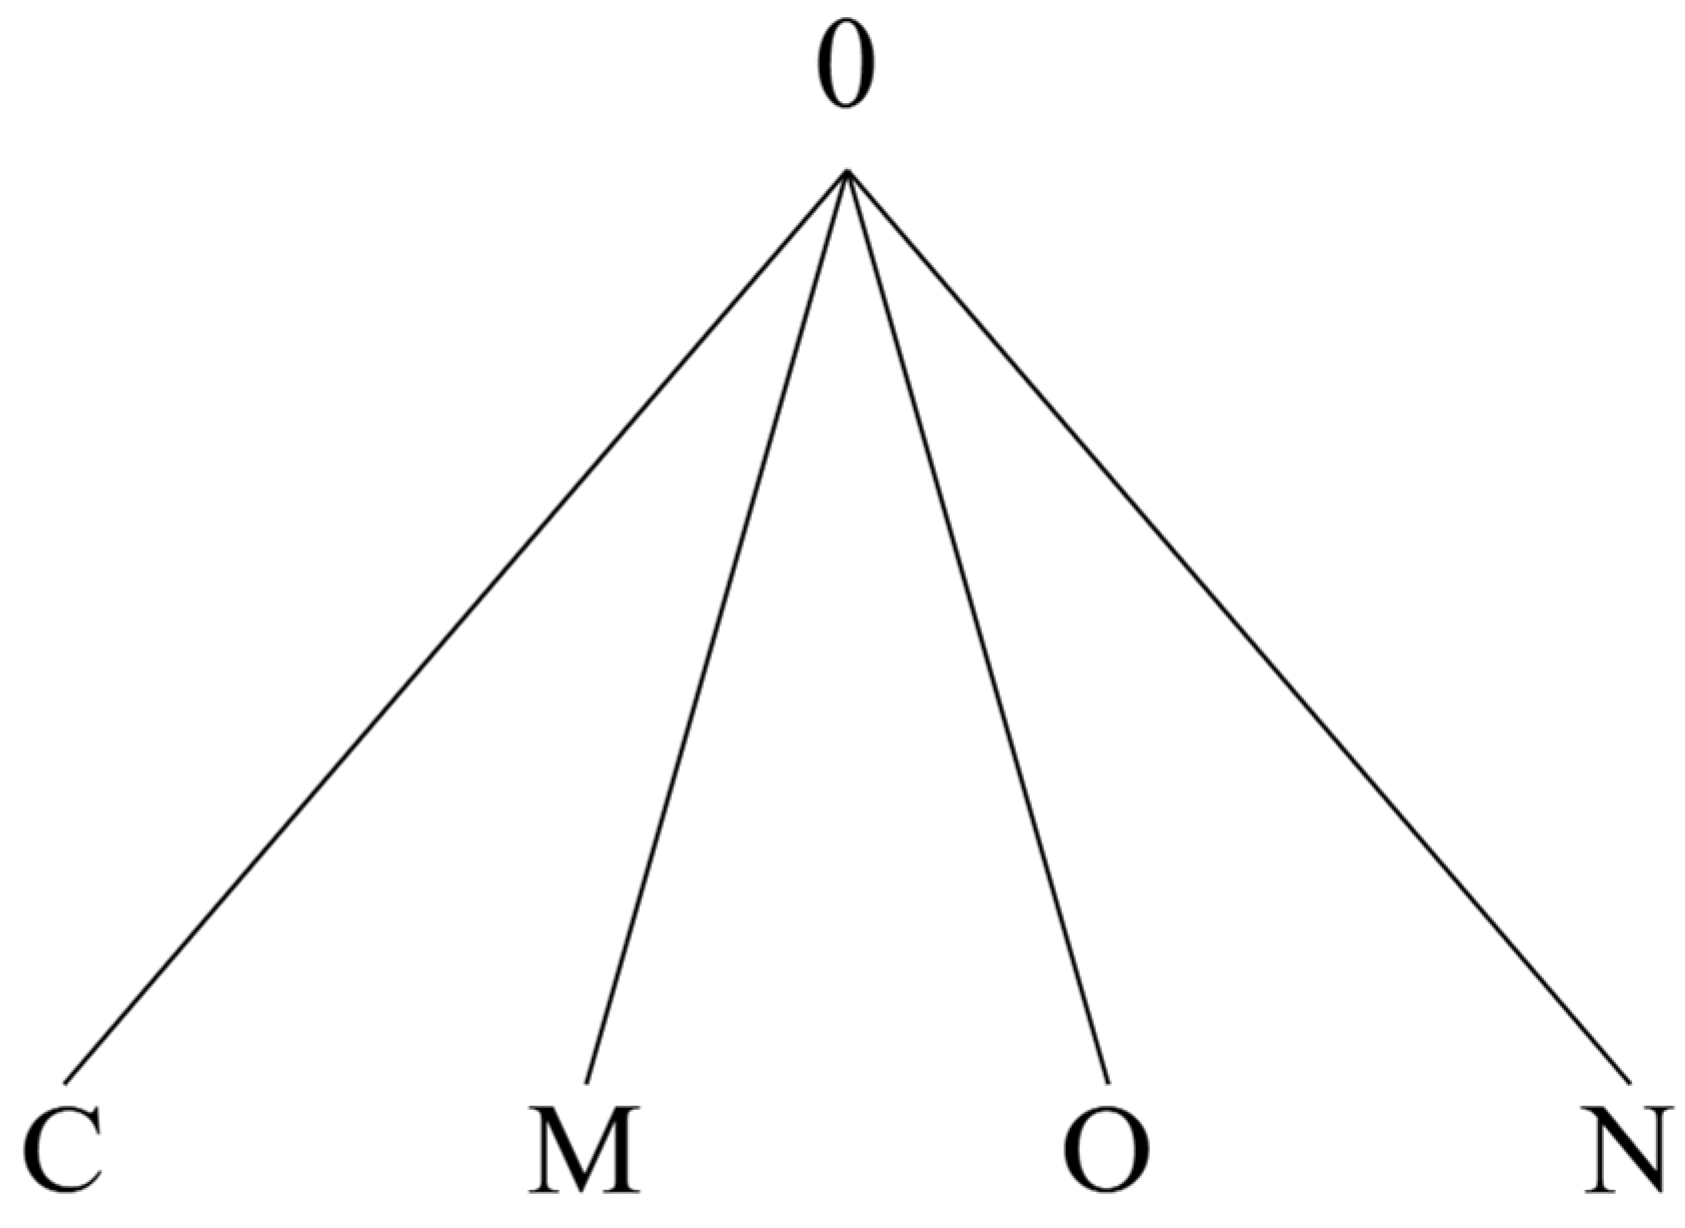
The first proposed model is a classical multinomial logit with four independent alternatives. The probability formulation is expressed by Equation (3). The choice structure is reported in Figure 5.
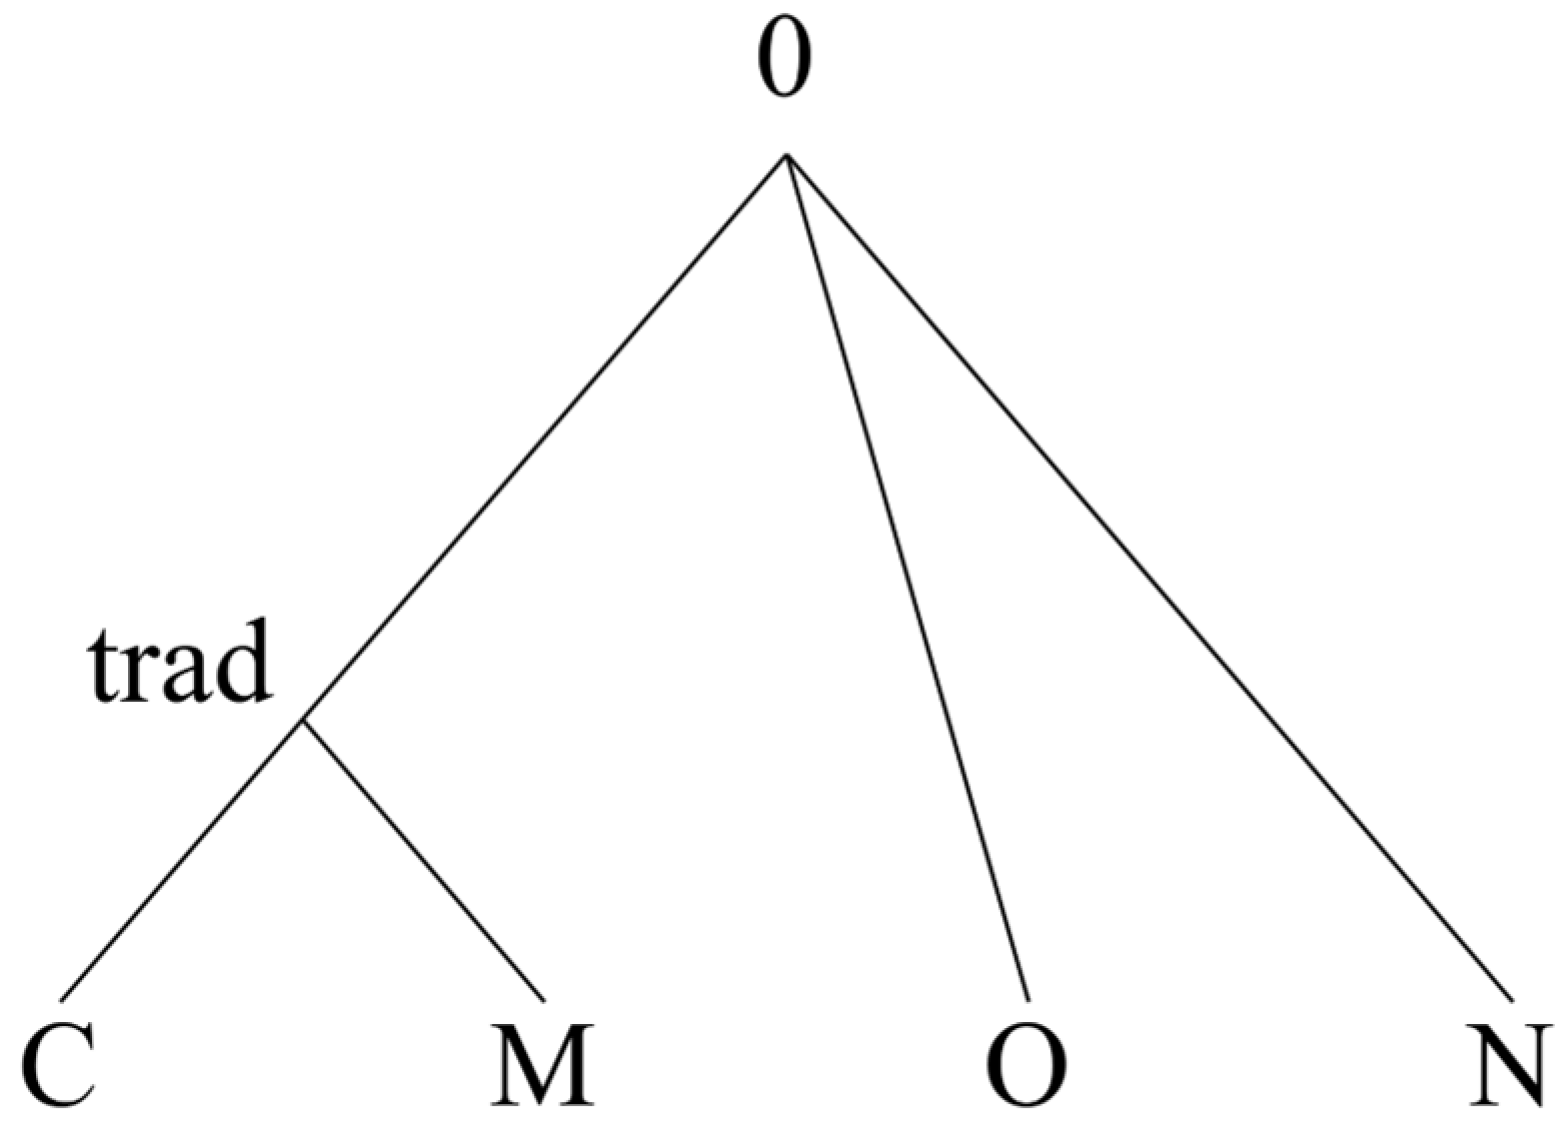
The second proposed model is a two-level hierarchical model where the city centre and mall alternatives are aggregated in the same nest, “traditional retail”, against the alternatives “no purchase” and “online”. This specification aims to investigate the potentially unobserved attributes shared by the two alternatives that require a physical trip of the customers: city centre and mall. Figure 6 represents the choice structure.
Lower model:
p C | t r a d = e V C / θ t r a d e V C / θ t r a d + e V M / θ t r a d
p M | t r a d = e V M / θ t r a d e V C / θ t r a d + e V M / θ t r a d
Upper model:
p t r a d = e δ t r a d Y t r a d e δ t r a d Y t r a d + e V O / θ 0 + e V N / θ 0
p O = e V O / θ 0 e δ t r a d Y t r a d + e V O / θ 0 + e V N / θ 0
p N = e V N / θ 0 e δ t r a d Y t r a d + e V O / θ 0 + e V N / θ 0
With
p ( C ) = p ( C / t r a d ) p ( t r a d )
p ( M ) = p ( M / t r a d ) p ( t r a d )
θ t r a d θ 0 = δ t r a d
Y t r a d = ln ( e V C / θ t r a d + e V M / θ t r a d )

4.2.3. Calibration Results

Calibration results for the two models are reported in Table 4. The parameters maintain the same signs in the two models. This constitutes an informal validation of the parameters, already discussed in the previous section. The quality of the proposed specification is also validated by the δ value, which is less than 1 and with significance < 1%. The value of approximately 0.78 also indicates a weak correlation at the “traditional retail” node.
In Table 5 results of the main validation indicators of the models are proposed. The hierarchical model does not show a significant improvement in the main goodness-of-fit statistics, as indicated in Table 5.
Although the estimated dissimilarity parameter δ = 0.797 is statistically different from zero ( t = 2.397, p < 0.05), this test only confirms that the nest is not degenerate; it does not demonstrate that the hierarchical model outperforms the MNL. To test the MNL restriction ( δ = 1), a likelihood ratio test was conducted. The final log-likelihoods are approximately −231.5 for the MNL and −231 for the hierarchical model. The resulting LR statistic is 1 (df = 1) which does not exceed the critical value of 3.84 at the 5% significance level. Therefore, the null hypothesis of no improvement over the MNL cannot be rejected at the 5% significance level. Consequently, the nesting structure is best regarded as theoretically motivated—reflecting the shared physical-trip nature of city centre and mall shopping—rather than as a statistically decisive improvement.
The structure of the alternatives, for the case analysed, thus shows an unobserved component common to the “traditional retail” alternatives, while no correlations emerge between the highlighted node and the other two alternatives (N and O). This result should not, however, be interpreted as evidence against the hierarchical specification. The near-identical fit statistics reflect a dataset in which the unobserved utility components shared within the retail nest are present but modest in magnitude—a finding that is itself substantively informative, rather than a failure of the model. The result also provides indications to be developed on the structure of the purchasing choice. The significant parameter δ (t = 2.397) indicates that some degree of correlation in unobserved utility does exist among physical retail alternatives, suggesting that attributes not captured by the model may generate correlated preferences between city centre retailers and shopping malls. Alternative nesting structures, such as aggregating the three purchase options within a nest alternative to the no-purchase option, have been tested but have not provided plausible results in terms of δ value. This finding points to a relevant direction for future research.
To further assess the robustness of the estimated coefficients to the overrepresentation of highly educated respondents in the sample, a weighted re-estimation of the MNL model was conducted. The share of respondents with at least a three-year university degree is 60.7%, higher than regional values reported by Eurostat, with a reference value of about 18% for the two regions under examination [80]. Weights were assigned inversely proportional to the probability of inclusion in the sample. Graduates received a weight of 0.3 and non-graduates a weight of 2. The weighted estimation yields coefficients that are consistent in sign and direction with the baseline model across all 14 parameters. Some coefficient magnitudes exhibit moderate variation. The estimate for the low-income coefficient is −0.801, compared to the value of −0.626 for the main model, indicating that the calibrated model slightly underestimates the deterrent effect of low income on e-commerce adoption. This is a directional bias consistent with the overrepresentation of higher-income graduates in the sample. The result confirms the robustness of the main findings, highlighting a limited bias.

4.2.4. The Role of Walking Time as Accessibility Measure

In the calibrated models, walking distance from the nearest generic clothing store affects the purchase of goods in small retailers in urban centres. The identified attribute, defining a pedestrian distance from the nearest generic store, represents a measure of accessibility to the retailer system. Therefore, the relationship between the probability of purchasing in the city centre, p ( C ) , and the distance from the stores emerges. The relationship shows that, as this distance increases, the user tends to assign less utility to retail choices located in urban centres in favour of the other alternatives. Considering the nested structure of Model 2, it is assumed that the impact is different between alternatives M (shopping mall) compared to O (online) and N (No purchase).
Direct elasticity of attribute T F with respect to alternative C is studied; similarly, cross-elasticities of attribute TF with respect to alternatives M, O, and N are studied. Given the choice structure, and considering Cascetta (2013) [37], the cross-elasticity with respect to alternative M will be different than the cross-elasticity with respect to alternatives O and N, which are outside the “trad” nest. The results obtained are shown in Table 6. Elasticities for specific categories “over 50 years old” and “male” are also evaluated.
Considering the average values, it is obtained that the choice of alternative C is negatively sensitive to the increase in time. The cross-elasticity of the other three alternatives varies: approximately 0.21 for alternative M, and approximately 0.16 for alternatives O and N.
Elasticity is also reported for some specific user clusters. Consider the category of users over 50; age greater than 50 is a dummy variable that appears in the specifications of alternatives C and N.
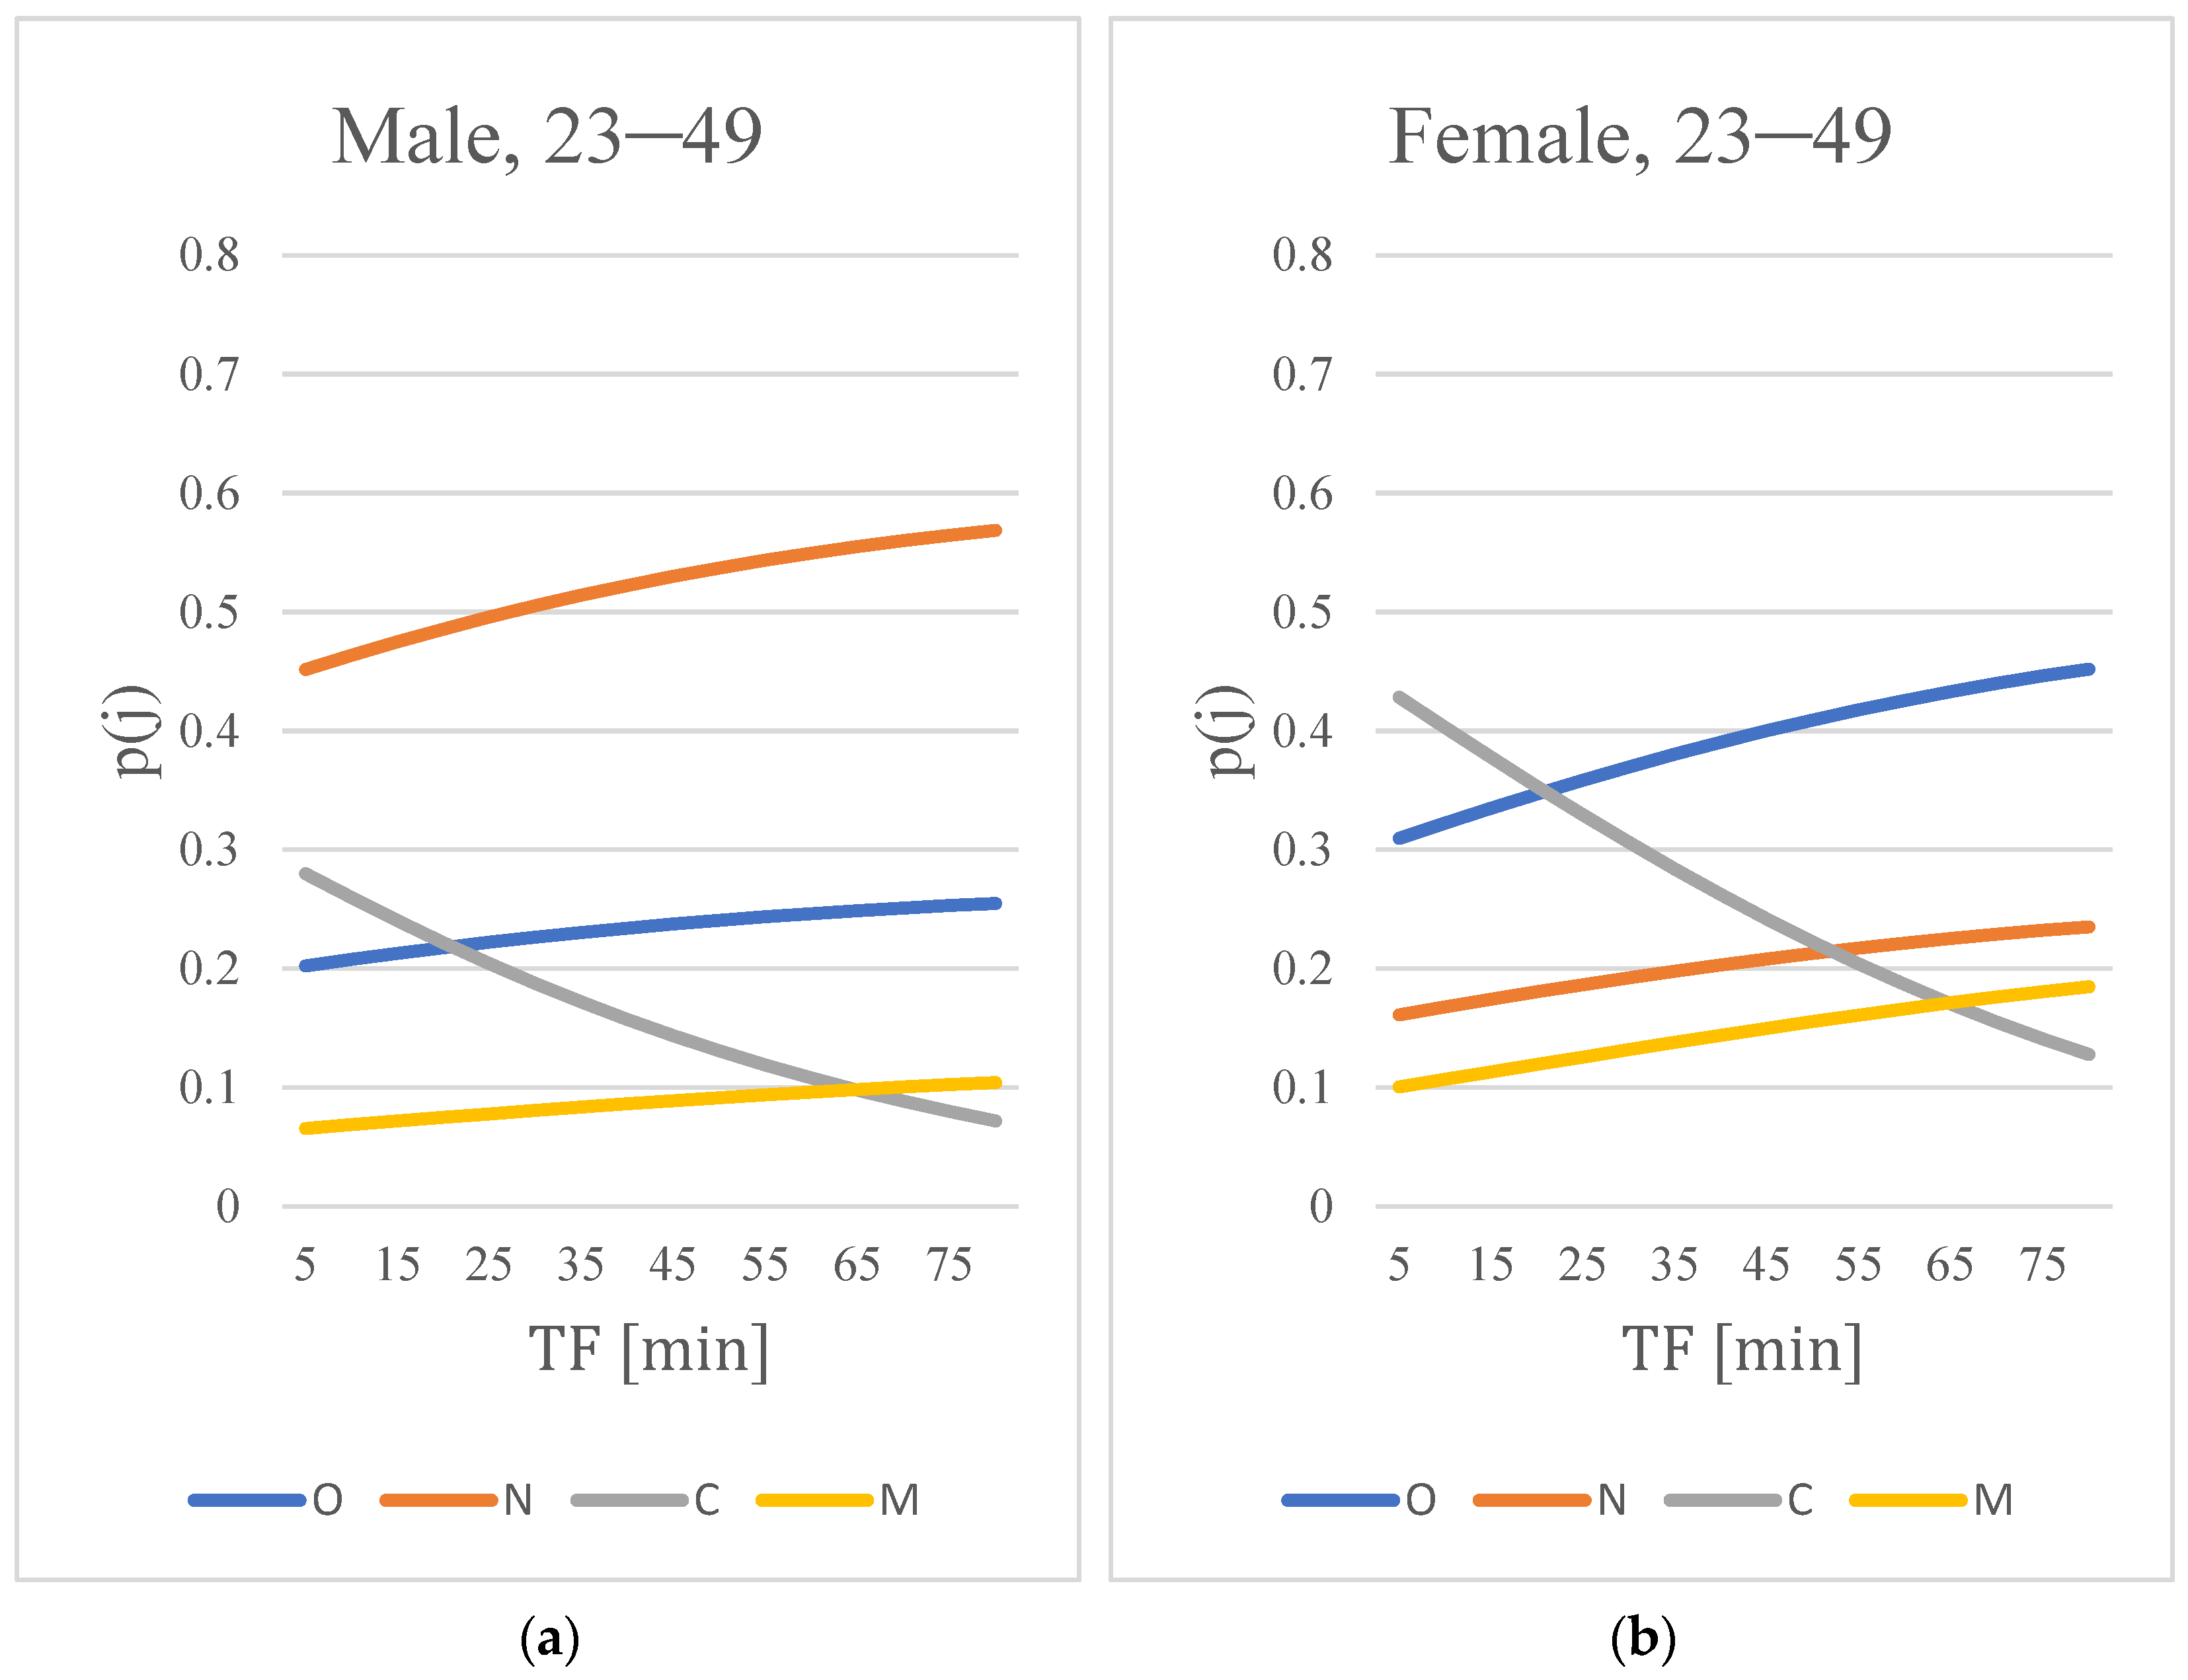
The value of −0.36 for the direct elasticity associated with alternative C shows a lower-in-absolute-value sensitivity to time; similarly, the cross-elasticities are lower for alternative M and higher for alternative N. For male users, a greater sensitivity to walking time emerged (direct elasticity higher than 0.8), a lower sensitivity for alternative M, and a slightly greater sensitivity for alternatives N and O. To further highlight the impact of walking time and accessibility to shops, the utility function of the four alternatives with respect to time is studied. The case for users aged 23–49 is presented in Figure 7, distinguishing between male ( M A L E = 1) and female ( M A L E = 0) respondents. All other attributes were set to zero.
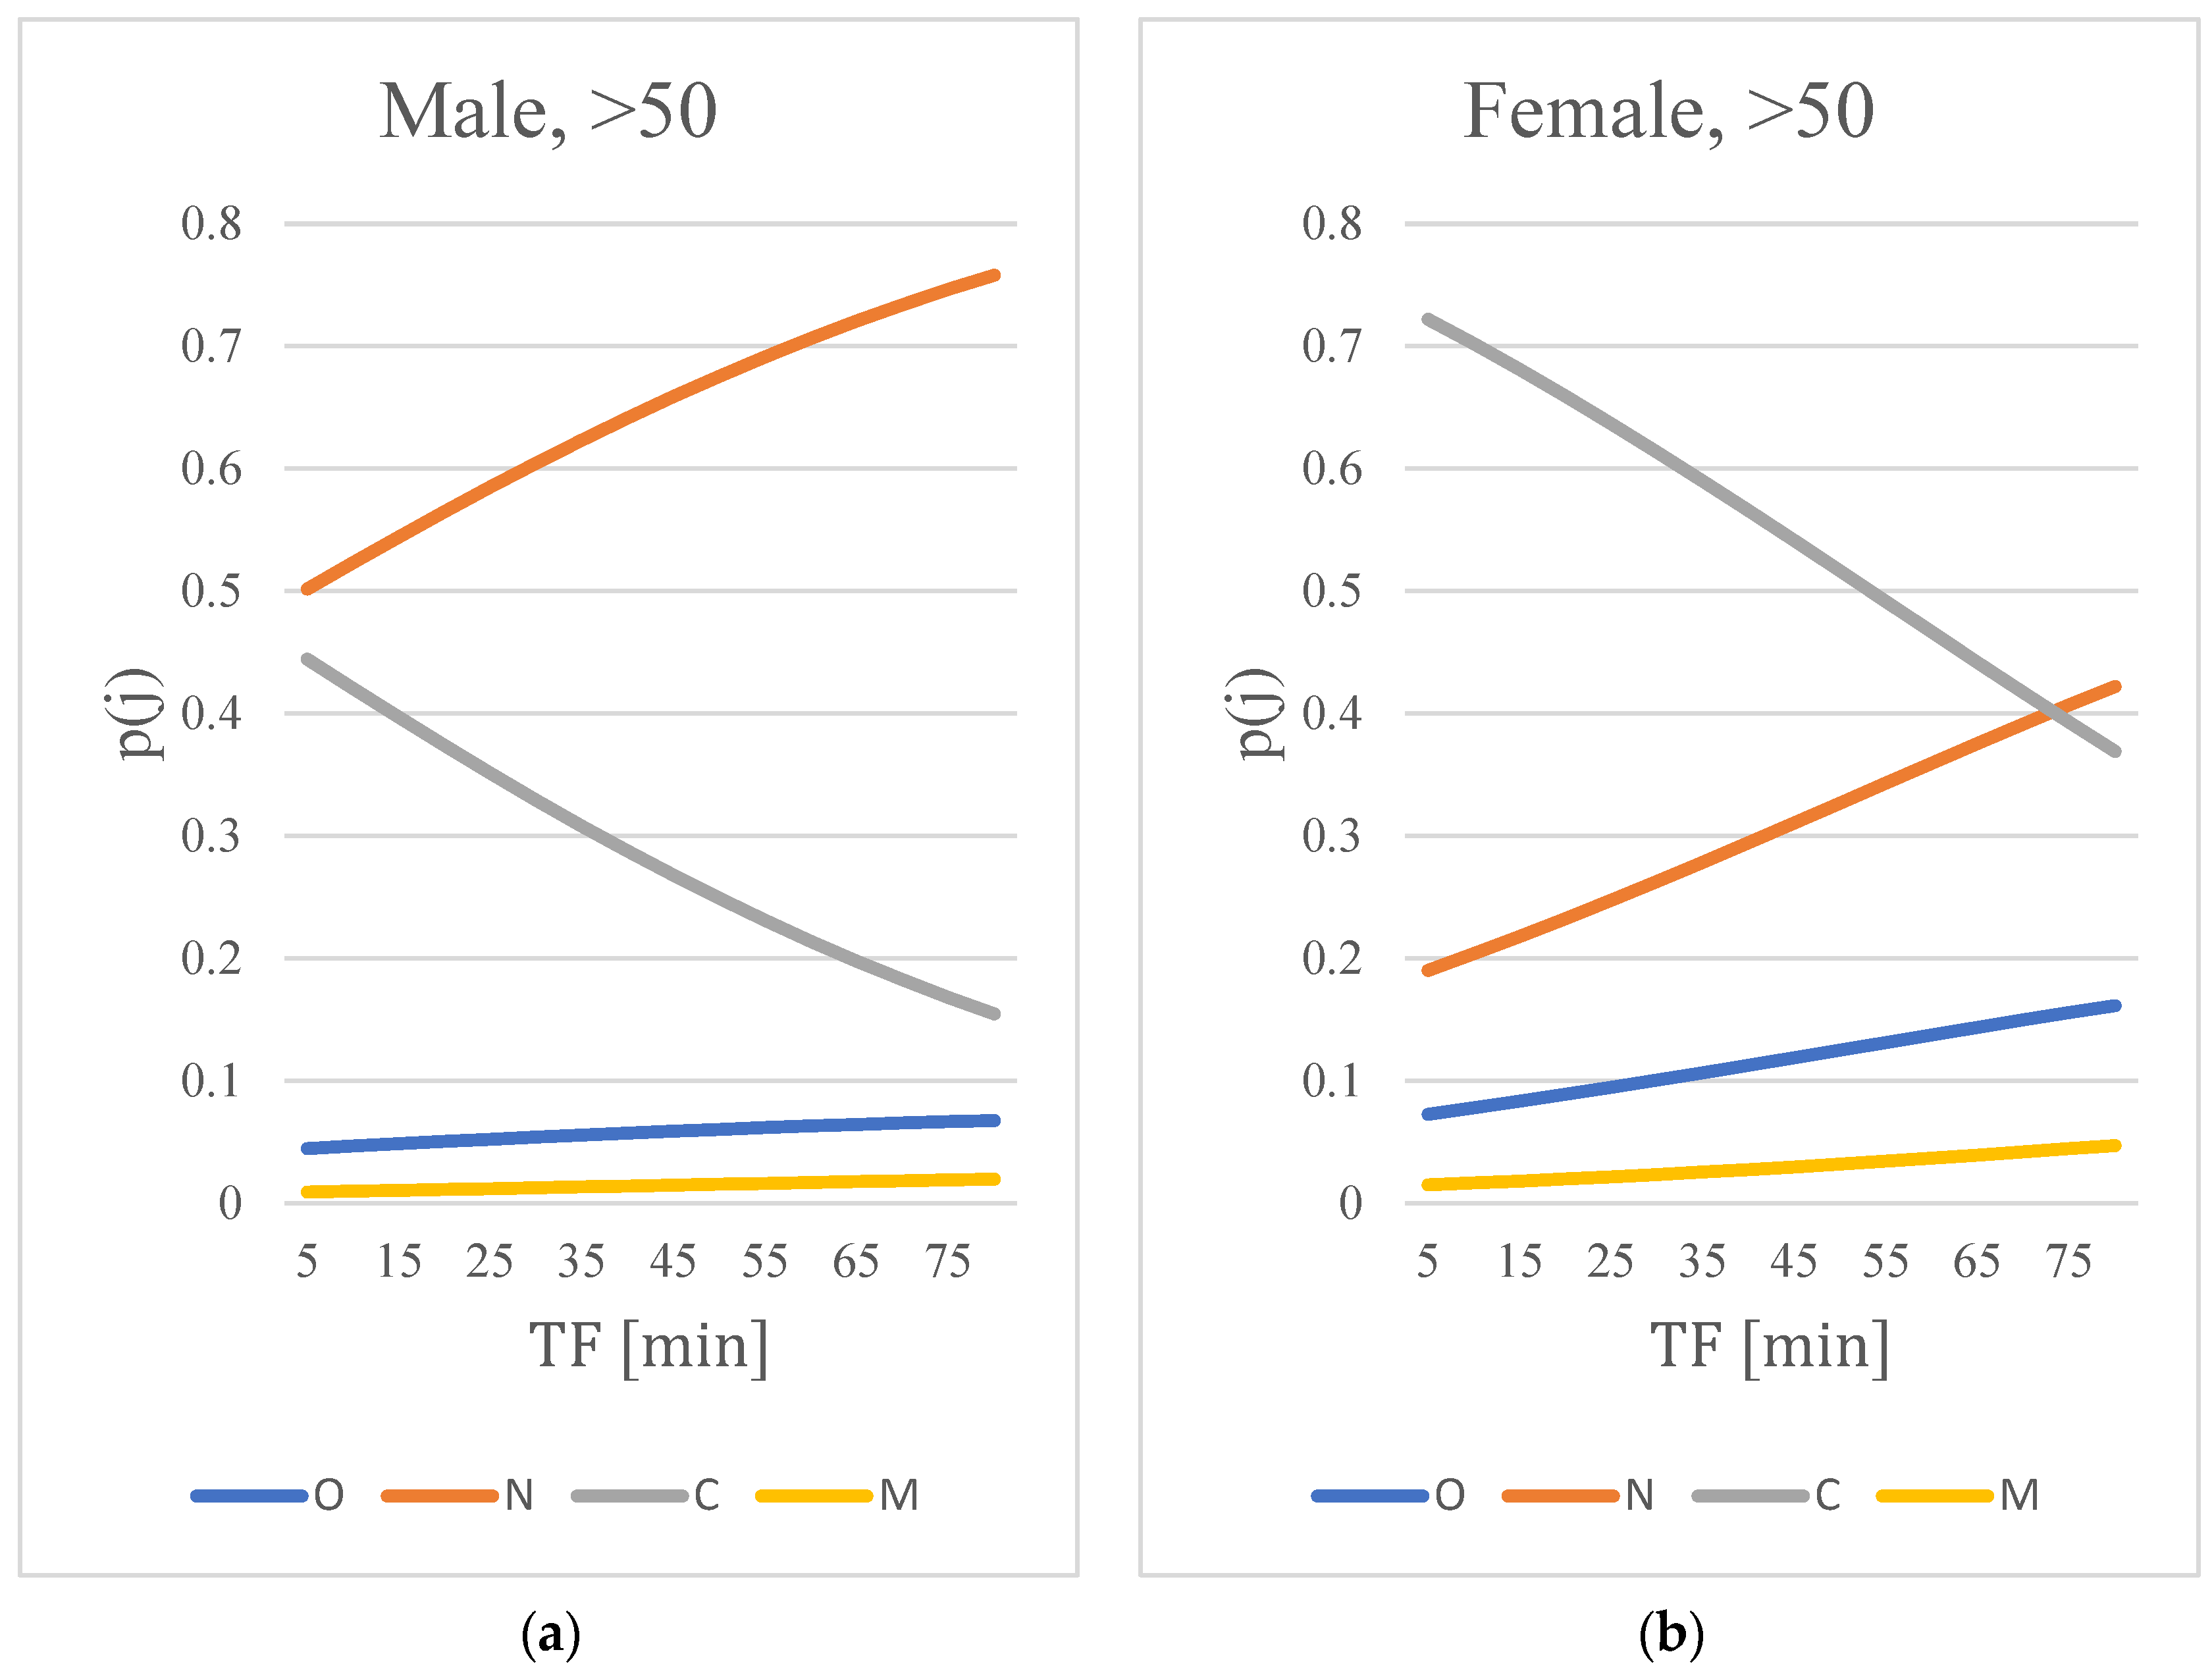
The same analysis is replicated in Figure 8 for users aged over 49 ( A 50 = 1), distinguishing between male and female respondents, with all remaining attributes set to zero.
When M A L E = 1 , alternative N is dominant for both age groups considered. For the age group over 50, however, alternative C has probability values of similar magnitude to those of N when T F is very low; the two probabilities diverge as T F increases. In the case where the age is between 27 and 49, two points are identified, T F = 20   m i n and T F = 65   m i n , in which the choice probabilities respectively associated with O and M equal the probability associated with C. For male users, residence within 20 min on foot from urban retail is the threshold for city centre purchasing. Beyond this distance, male consumers tend to shift toward online or shopping mall alternatives, the latter being predominantly peripheral and accessible only by private vehicle in the study areas. When M A L E = 0 , there is a decrease in the value of the curve associated with p ( N ) , in line with the model specification. The trend of the other curves remains similar. In the case of the 27–49 age group, the trend of the alternatives C, O and M and the times remain similar to the previous case. In the case of ages greater than 50, the dominant alternative remains C up to a very high T F value, approximately equal to 75 min.

5. Discussion

5.1. Role of Attributes

Several attributes consistently emerge as significant determinants of purchasing behaviour in the estimated models.
Walking time to the nearest clothing store captures the proximity between the user’s residence and the physical retail system. This variable enters exclusively the urban centre retail alternative with a negative coefficient, indicating that increasing pedestrian access time reduces the utility of purchasing from traditional neighbourhood retailers relative to other options. A more detailed elasticity analysis reveals a moderate sensitivity of choice probabilities to pedestrian access time, with lower sensitivity among individuals aged over 50 and slightly higher sensitivity among male users. Furthermore, probability trend analysis suggests the existence of distinct time thresholds for male consumers. These findings are consistent with previous evidence reported by Russo et al. [57], confirming that increasing distance penalises physical retail alternatives.
Age also plays a significant role. Individuals aged over 50 exhibit a stronger attachment to traditional retail purchasing, as reflected by a positive coefficient associated with the urban centre alternative. The same age group also shows a positive association with the no-purchase alternative, suggesting a general reluctance towards both online purchasing and shopping malls. This result aligns with earlier findings indicating a lower propensity among older users to adopt online channels [57].
Individuals aged between 18 and 22 display a positive association with the shopping mall alternative. This segment—largely composed of young adults born in the twenty-first century—may perceive shopping centres not only as retail locations but also as social and recreational spaces. Other age groups were excluded from the final specification due to statistical insignificance; no robust inference regarding these segments can be drawn from the present study.
Gender effects also emerge clearly from the models. Male users exhibit a higher utility for the no-purchase alternative, suggesting a lower overall propensity to engage in clothing purchases compared to female users. This finding is consistent with evidence from e-grocery studies and may reflect persistent cultural norms associated with gender roles and consumption behaviour.
Income level further influences channel choice. Low-income individuals display a lower utility for online purchasing, which may be explained by the combined effects of the digital divide and greater price sensitivity, leading such users to favour alternative purchasing channels perceived as more cost-effective.
Two territorial attributes are also significant. Residence in a main city—defined as a municipality with more than 100,000 inhabitants, such as Messina, Reggio Calabria, or Catania—positively affects the utility of both urban retail centre and shopping mall alternatives. This result may reflect the higher density and variety of retail opportunities in large urban areas. A regional dummy variable distinguishing Sicilian users from Calabrian users reveals a negative effect on the utility of urban centre retail, online purchasing, and no purchase. This outcome indicates that being a Sicilian resident is associated with a systematically higher relative utility for the shopping mall alternative compared to all other alternatives. The interpretation of this regional effect requires caution, as the dummy variable captures the aggregate influence of all unobserved regional factors not explicitly included in the model. One plausible contributing factor may be the differential distribution and accessibility of large-format retail in the two regions, with Sicily hosting several of Southern Italy’s largest shopping complexes [81]. However, this hypothesis should be treated as a direction for future investigation rather than an empirically confirmed explanation.
The hierarchical specification allows for correlation among alternatives by grouping them within a nested structure. In the proposed configuration, the first decision level distinguishes between retail channel, online channel and not purchasing, with the traditional retail channel branched into two alternatives. The estimated dissimilarity parameter (δ) is approximately equal to 0.78, satisfying the theoretical requirement that δ lies between 0 and 1 and indicating a moderate degree of correlation among traditional purchasing alternatives. Other alternative nesting structures were tested but yielded dissimilarity parameters close to or exceeding unity, suggesting that such configurations are not analytically appropriate.
The elasticity analysis reported in Table 6 differentiates cross-elasticities between alternatives inside and outside the “traditional retail” nest. Because the likelihood ratio test does not reject the MNL at the 5% level, these differential cross-elasticities should be interpreted cautiously. However, the estimated coefficients maintain the same signs and comparable magnitudes across both specifications (Table 4), indicating that the core policy insights are robust to the nesting assumption. The hierarchical specification thus serves as a theoretically grounded sensitivity analysis: it corroborates the MNL findings by showing that even when correlation among physical retail alternatives is permitted, the direction and significance of the sociodemographic and accessibility effects remain unchanged. Future research could explore alternative nesting configurations (e.g., grouping all purchase alternatives against “no purchase”) or mixed logit specifications to capture unobserved heterogeneity more flexibly.

5.2. Policy Implications

The negative coefficient of walking time to the nearest clothing store on the utility of the urban centre alternative is consistent with the objectives of sustainable urban mobility frameworks, including the concept of the 15 min city and the EU SUMP guidelines [21]. This result suggests that pedestrian accessibility may play a role in sustaining physical retail demand; however, the causal direction of this relationship and its magnitude at the urban level would require further investigation.
From an urban planning perspective, the result on walking time could suggest that the competitive disadvantage of city centre retail relative to online channels is partially a function of the spatial organisation of the urban area rather than a structural trend driven by technology alone. In contexts such as Southern Italy, where the retail landscape is still dominated by small independent stores and e-commerce penetration remains relatively low, the erosion of pedestrian accessibility may accelerate the substitution of urban retail by online channels in ways that compound existing territorial disadvantages. Conversely, policies that reduce walking time to city centre retail—including mixed land-use zoning, fine-grained retail planning, and pedestrian infrastructure investment—may partially counteract this substitution dynamic, particularly among age groups that already exhibit a structural preference for physical retail.
The age-differentiated patterns carry implications for the long-term viability of different retail formats. The structural preference of older consumers for urban retail suggests that city centre stores may retain a stable demand base among this segment, even under competitive pressure from online channels. However, given demographic ageing trends in Southern Italy, local administrations should consider whether policies aimed at sustaining urban retail accessibility also serve broader social inclusion objectives for a population cohort that is less likely to shift to digital alternatives.
The result about income introduces an equity dimension that is often absent from channel choice analyses framed purely in terms of logistics efficiency. If low-income consumers exhibit a lower propensity for online purchasing, then the progressive erosion of urban retail networks disproportionately affects the most economically vulnerable segments of the population. This suggests that commercial desertification in city centres is not only an urban economic problem but also a social accessibility problem, with implications for equitable access to consumer goods that extend beyond the scope of transport planning.
This result may reflect the higher density and variety of retail formats available in larger municipalities, including peri-urban malls which offer economies of scope, price advantages, and accessibility benefits, especially when well connected to the transport network. From a planning perspective, this result suggests that the spatial distribution of retail supply across the urban territory is not neutral with respect to aggregate channel choice. Where retail density is high and formats are diversified—as in larger municipalities—consumers are more likely to opt for physical purchasing in some form, regardless of channel type. This implies that decisions concerning the localisation and governance of retail activities, including the regulation of peripheral large-format retail development and the incentivisation of fine-grained city centre commercial density, may influence not only the economic viability of individual retail formats. More broadly, the spatial governance of retail supply appears to shape the aggregate balance between physical and online purchasing at the city scale.
Table 7 summarises the main possible policy implications linked to the results.

6. Conclusions

This paper has analysed the sociodemographic and territorial determinants of purchasing behaviour in a low-e-commerce-adoption context—Southern Italy—focusing on the clothing sector. Through the calibration of multinomial and two-level hierarchical logit models on original survey data from Sicily and Calabria, the study has examined how pedestrian accessibility and individual characteristics shape choice among four alternatives: urban retail, shopping mall, online purchasing, and no purchase. The core results and their implications are summarised below.
Several elements of novelty characterise this study. Particular attention is devoted to the selection of the study area. Southern Italy, and specifically Calabria and Sicily, represents a context of interest for analysing high-tech and innovative phenomena in less economically developed regions of the European Union. These areas are characterised by relatively underdeveloped transport infrastructures, limited diffusion of fast mobile networks, and lower levels of GDP per capita. Italy already exhibits comparatively low levels of e-commerce adoption at the European scale, and its southern regions—consistently positioned at the lower end of key socioeconomic indicators—therefore provide a particularly informative case study. In this framework, regional specificities are explicitly considered.
The choice of the product category constitutes an additional contribution. Clothing is selected as a representative category due to its prominence in online retail markets across Europe. The modelling framework distinguishes among four alternatives: online purchasing, no purchase, and two forms of traditional retail—small- and medium-sized urban stores and shopping malls. Different functional specifications are tested in order to capture heterogeneity in purchasing behaviour across channels.
The combination of territorial context and product category yields original insights. The results indicate that, within the study areas considered, traditional retail channels exhibit significant internal correlation, despite marked sociodemographic differences between shopping mall users and customers of urban neighbourhood retailers. This finding supports the adoption of a hierarchical modelling structure and highlights the behavioural distinction between traditional and digital consumption channels.
The research therefore provides empirical support for residential proximity to clothing retail as a predictor of in-store purchasing in city centres, over online channels and suburban shopping malls. These results are consistent with the hypothesis that walkability and short-distance accessibility may constitute relevant factors in sustaining demand for urban retail. The observed association between pedestrian accessibility and preference for centrally located retailers is aligned with planning frameworks emphasising mixed land use and the 15 min city, suggesting a potential reinforcing dynamic between accessibility conditions and retail viability that future longitudinal research could investigate more rigorously. These findings offer indicative support for planning strategies that enhance walkability and retail accessibility. Such strategies could contribute to the economic resilience of city centre commerce and to sustainable mobility objectives, particularly in sectors like clothing, where proximity and experiential dimensions remain relevant to consumer choice.
From a theoretical perspective, the study offers several implications. In particular, the estimation of hierarchical logit models enables meaningful interpretation of the dissimilarity parameter ( δ ), which indicates the presence of correlated unobserved components among traditional retail alternatives when compared to online purchasing. Moreover, the calibrated models demonstrate strong explanatory power while relying on attributes that are readily available and replicable. In the Italian context, sociodemographic variables can be sourced from the institutes of statistics at a high spatial resolution, down to the census tract level. Similarly, accessibility indicators—such as walking time to the nearest retail activity—can be efficiently derived from georeferenced open datasets. As such, the proposed models may serve as a reference framework characterised by both interpretability and operational simplicity.
Several limitations of the present study should be acknowledged. The analysis is based on a pilot survey and should therefore be regarded as exploratory. The sample was collected via an online questionnaire distributed through social media, a recruitment strategy that introduces a degree of bias. As discussed in Section 4, certain sample characteristics—such as the overrepresentation of highly educated respondents—may introduce bias relative to the regional population. Given that higher education is typically associated with greater digital literacy, the coefficients associated with the online alternative may overestimate the propensity for e-commerce adoption in the broader regional population. This overrepresentation of highly educated respondents was studied with a re-estimation of the model, highlighting a limited directional bias, confirming the robustness of the main coefficients to this imbalance. These directional effects should be kept in mind when interpreting the results. The results of the pilot study are less generalisable, but their applicability is potentially valid in certain contexts, such as the Enna area in Sicily, characterised by a high incidence of university-level education.
Also, the model specification focuses on user and choice-situation attributes, while excluding alternative-specific attributes such as travel times and monetary costs. This limitation is consistent with the study’s positioning within the purchase generation modelling framework but implies that random taste heterogeneity associated with continuous variables is not explicitly captured.
Finally, the data were collected in a specific temporal window that partially overlaps with the post-pandemic recovery phase. Although the survey was distributed at a time when travel restrictions during the pandemic had been fully lifted in Italy, possible residual post-pandemic effects may have influenced the results on e-commerce adoption.
These limitations open several paths for future research. Further developments could include the incorporation of alternative-specific attributes, as well as the estimation of more advanced model structures—such as random parameter logit or probit models—to better account for unobserved heterogeneity and random effects in consumer preferences.
The contribution carries relevant policy implications and is of interest to multiple stakeholders. For Sustainable Urban Mobility Plan (SUMP) planners, policymakers, and local administrators, the findings provide insights into the territorial and sociodemographic determinants of purchasing behaviour and their implications for mobility and accessibility planning. For researchers, the study contributes to the theoretical and methodological literature on Random Utility Models, particularly with respect to hierarchical specifications. For logistics operators, the results offer valuable information on user characteristics and choice contexts, supporting more efficient and targeted last-mile delivery strategies.

Author Contributions

Conceptualisation, A.R., T.C. and E.B.; methodology, A.R. and T.C.; software, A.R.; validation, T.C., E.B. and S.B.; formal analysis, A.R. and T.C.; investigation, A.R.; resources, T.C. and G.T.; data curation, A.R.; writing—original draft preparation, A.R. and T.C.; writing—review and editing, E.B. and S.B.; visualisation, A.R.; supervision, S.B. and G.T.; project administration, T.C. and G.T.; funding acquisition, G.T. All authors have read and agreed to the published version of the manuscript.

Funding

This research received no external funding.

Institutional Review Board Statement

Ethical review and approval were waived for this study by Institution Committee as per Article 9 of Regulation (EU) 2016/679 (GDPR).

Informed Consent Statement

Patient consent was waived due to Article 9 of Regulation (EU) 2016/679 (GDPR).

Data Availability Statement

The original contributions presented in this study are included in the article. Further inquiries can be directed to the corresponding authors.

Conflicts of Interest

The authors declare no conflicts of interest.

Abbreviations

The following abbreviations are used in this manuscript:
SDGSustainable Development Goal
SUMPSustainable Urban Mobility Plan
DCMDiscrete Choice Modelling
RUMRandom Utility Model
MNLMultinomial Logit
MLMaximum Likelihood

Appendix A

A hierarchical logit model extends the multinomial logit framework by representing the choice process through a multi-level nested structure. The choices are branched in a hierarchical structure. Two types of alternatives are defined:
  • Elementary alternatives, defined also as leaves or terminal nodes, that are the generic final choices j ,   k ;
  • Intermediate alternatives, or intermediate generic node r , which represent conditional choices from a subset of elementary alternatives directly linked to that node.
The choice of alternative j is given by the probability of choosing j within the set I a ( j ) , but this probability is conditioned by the previously made choice of the intermediate node a ( j ) , parent of j .
The probability of choice j may be expressed omitting i as
p ( j ) = e x p ( V j / θ a ( j ) ) e x p ( Y a ( j ) ) r A j e x p ( δ r Y r ) e x p ( Y a ( r ) ) ,             j I
where
  • o is the initial node, the beginning of the decision process.
  • I r is the set of descendant nodes of r .
  • a ( r ) is the parent of node r .
  • δ r = θ r θ a ( r ) and must be included in interval (0,1).
  • Y r , Y a ( r ) , Y a ( j ) are the logsum functions of nodes r , a ( r ) , a ( j ) .
  • A r is the set of ancestors of r .
In hierarchical logit models, in addition to calibrating the β vector, it is therefore necessary to calibrate the δ parameter, the ratio between θ associated with different levels. Referring to Marcucci [73], there are two possibilities to calibrate a hierarchical logit model:
  • The “sequential” method in which the β are calibrated for the lower level and then the δ values are estimated for the higher levels. The value of the logsum function associated with the lower levels is calculated, and the logsum is considered as an attribute of the higher level characterised by a δ parameter.
  • The “simultaneous” method, in which the parameters are calibrated by optimising a single function ln L = j = 1 L ln P ( j | l ) ( P l ) .

References

  1. United Nations. Transforming Our World: The 2030 Agenda for Sustainable Development. 2015. Available online: https://sustainabledevelopment.un.org/post2015/transformingourworld/publication (accessed on 30 April 2026).
  2. Isfort. 20° Rapporto Sulla Mobilità Degli Italiani. 2023. Available online: https://www.isfort.it/2023/11/21/presentazione-del-20-rapporto-audimob/ (accessed on 1 May 2026).
  3. Mokhtarian, P.L. A conceptual analysis of the transportation impacts of B2C e-commerce. Transportation 2004, 31, 257–284. [Google Scholar] [CrossRef] [Scilit]
  4. Taniguchi, E.; Thompson, R.G. (Eds.) City Logistics: Mapping the Future; CRC Press: Boca Raton, FL, USA, 2014. [Google Scholar]
  5. Morganti, E.; Dablanc, L.; Fortin, F. Final deliveries for online shopping: The deployment of pick-up point networks in urban and suburban areas. Res. Transp. Bus. Manag. 2014, 11, 23–31. [Google Scholar] [CrossRef] [Scilit]
  6. Visser, J.; Nemoto, T.; Browne, M. Home Delivery and the Impacts on Urban Freight Transport: A Review. Procedia-Soc. Behav. Sci. 2014, 125, 15–27. [Google Scholar] [CrossRef] [Scilit]
  7. Cardenas, I.D.; Dewulf, W.; Beckers, J.; Smet, C.; Vanelslander, T. The e-commerce parcel delivery market and the implications of home B2C deliveries vs. pick-up points. Int. J. Transp. Econ. 2017, 44, 235–256. [Google Scholar] [CrossRef] [Scilit]
  8. González-Romero, I.; Ortiz-Bas, Á.; Prado-Prado, J.C. Last-mile strategies in e-commerce. Identifying barriers to sustainability from online retailers’ perspectives. Res. Transp. Bus. Manag. 2025, 60, 101367. [Google Scholar] [CrossRef] [Scilit]
  9. Campisi, T.; Russo, A.; Basbas, S.; Bouhouras, E.; Tesoriere, G. Walkability and pick-up points in the Catania Metropolitan Area, Italy: Lessons learned. Transp. Res. Procedia 2025, 90, 631–638. [Google Scholar] [CrossRef] [Scilit]
  10. Ducret, R. Parcel deliveries and urban logistics: Changes and challenges in the courier express and parcel sector in Europe—The French case. Res. Transp. Bus. Manag. 2014, 11, 15–22. [Google Scholar] [CrossRef] [Scilit]
  11. Dablanc, L.; Montenon, A. Impacts of environmental access restrictions on freight delivery activities: Example of low emissions zones in Europe. Transp. Res. Rec. 2015, 2478, 12–18. [Google Scholar] [CrossRef] [Scilit]
  12. Comi, A.; Polimeni, A. An e-delivery system based on pick-up points: Demand forecast, system design and scenario assessment. J. Transp. Geogr. 2026, 133, 104622. [Google Scholar] [CrossRef] [Scilit]
  13. Allen, J.; Piecyk, M.; Piotrowska, M.; McLeod, F.; Cherrett, T.; Ghali, K.; Nguyen, T.; Bektas, T.; Bates, O.; Friday, A.; et al. Understanding the impact of e-commerce on last-mile light goods vehicle activity in urban areas: The case of London. Transp. Res. Part D Transp. Environ. 2018, 61, 325–338. [Google Scholar] [CrossRef] [Scilit]
  14. Viu-Roig, M.; Alvarez-Palau, E.J. The impact of E-Commerce-related last-mile logistics on cities: A systematic literature review. Sustainability 2020, 12, 6492. [Google Scholar] [CrossRef] [Scilit]
  15. Findlay, A.; Sparks, L. Literature Review: Policies Adopted to Support a Healthy Retail Sector and Retail Led Regeneration and the Impact of Retail on the Regeneration of Town Centres and Local High Streets. 2009. Available online: https://dspace.stir.ac.uk/bitstream/1893/11857/2/Sparks_2009_Literature_review_research_findings.pdf (accessed on 10 June 2025).
  16. Teller, C.; Elms, J.R.; Thomson, J.A.; Paddison, A.R. Place marketing and urban retail agglomerations: An examination of shoppers’ place attractiveness perceptions. Place Brand. Public Dipl. 2010, 6, 124–133. [Google Scholar] [CrossRef] [Scilit]
  17. Silva, V.; Amaral, A.; Fontes, T. Sustainable urban last-mile logistics: A systematic literature review. Sustainability 2023, 15, 2285. [Google Scholar] [CrossRef] [Scilit]
  18. Geurs, K.T.; Van Wee, B. Accessibility evaluation of land-use and transport strategies: Review and research directions. J. Transp. Geogr. 2004, 12, 127–140. [Google Scholar] [CrossRef] [Scilit]
  19. Cascetta, E.; Cartenì, A.; Montanino, M. A new measure of accessibility based on perceived opportunities. Procedia-Soc. Behav. Sci. 2013, 87, 117–132. [Google Scholar] [CrossRef] [Scilit]
  20. United Nations. Global Indicator Framework for the Sustainable Development Goals and Targets of the 2030 Agenda for Sustainable Development; United Nations: New York, NY, USA, 2018; pp. 1–21. Available online: https://unstats.un.org/sdgs/indicators/Global%20Indicator%20Framework%20after%202020%20review_Eng.pdf (accessed on 30 April 2026).
  21. European Commission (EC). Guidelines for Developing and Implementing a Sustainable Urban Mobility Plan, 2nd ed.; European Commission: Rupprecht Consult: Cologne, Germany, 2019. Available online: https://urban-mobility-observatory.transport.ec.europa.eu/system/files/2023-09/sump_guidelines_2019_second%20edition.pdf (accessed on 30 April 2026).
  22. Augeri, M.G.; Greco, S.; Nicolosi, V. Planning urban pavement maintenance by a new interactive multiobjective optimization approach. Eur. Transp. Res. Rev. 2019, 11, 17. [Google Scholar] [CrossRef] [Scilit]
  23. Nicolosi, V.; Augeri, M.G.; Leonardi, S.; Distefano, N. Cross-asset resource allocation and the impact on road network performance. Transp. Res. Procedia 2023, 69, 799–806. [Google Scholar] [CrossRef] [Scilit]
  24. United Nations. The Sustainable Development Goals; United Nations Publications: New York, NY, USA, 2017; Available online: https://unstats.un.org/sdgs/files/report/2017/thesustainabledevelopmentgoalsreport2017.pdf (accessed on 30 April 2026).
  25. Eurostat. Internet Purchases by Individuals (2020 Onwards), ISOC_EC_IB20. 2023. Available online: https://ec.europa.eu/eurostat/databrowser/view/ISOC_EC_IB20__custom_6294092/default/table?lang=en&page=time:2020 (accessed on 27 September 2025).
  26. Leonardi, S.; Distefano, N.; Pulvirenti, G. Identification of road safety measures by elderly pedestrians based on k-means clustering and hierarchical cluster analysis. Arch. Transp. 2020, 56, 107–118. [Google Scholar] [CrossRef] [Scilit]
  27. Distefano, N.; Leonardi, S. Fostering urban walking: Strategies focused on pedestrian satisfaction. Sustainability 2023, 15, 16649. [Google Scholar] [CrossRef] [Scilit]
  28. McFadden, D. Conditional logit analysis of qualitative choice behavior. In Frontiers in Econometrics; Academic Press: Cambridge, MA, USA, 1973; pp. 105–142. [Google Scholar]
  29. Ben-Akiva, M. Structure of Passenger Travel Demand Models. Doctoral Dissertation, Massachusetts Institute of Technology, Cambridge, MA, USA, 1973. [Google Scholar]
  30. Domencich, T.A.; McFadden, D. Urban Travel Demand-a Behavioral Analysis; North-Holland Publishing Company: Amsterdam, The Netherlands, 1975; Available online: https://eml.berkeley.edu/~mcfadden/travel/front.pdf (accessed on 27 September 2025).
  31. Papola, A.; Tinessa, F.; Marzano, V. Application of the Combination of Random Utility Models (CoRUM) to route choice. Transp. Res. Part B Methodol. 2018, 111, 304–326. [Google Scholar] [CrossRef] [Scilit]
  32. Tinessa, F.; Marzano, V.; Simonelli, F.; Tocchi, D.; Papola, A. Choice probabilities and correlations in closed form route choice models: Specifications and drawbacks. Transp. Eng. 2023, 13, 100186. [Google Scholar] [CrossRef] [Scilit]
  33. Vitetta, A. The Importance of Modeling Path Choice Behavior in the Vehicle Routing Problem. Algorithms 2023, 16, 47. [Google Scholar] [CrossRef] [Scilit]
  34. Small, K.A.; Rosen, H.S. Applied welfare economics with discrete choice models. Econom. J. Econom. Soc. 1981, 48, 105–130. [Google Scholar] [CrossRef] [Scilit]
  35. Berry, S.T. Estimating discrete-choice models of product differentiation. RAND J. Econ. 1994, 25, 242–262. [Google Scholar] [CrossRef] [Scilit]
  36. Pinkse, J.; Slade, M.E. Contracting in space: An application of spatial statistics to discrete-choice models. J. Econom. 1998, 85, 125–154. [Google Scholar] [CrossRef] [Scilit]
  37. Cascetta, E. Transportation Systems Engineering: Theory and Methods; Springer Science & Business Media: Berlin/Heidelberg, Germany, 2013; Volume 49. [Google Scholar]
  38. McNally, M.G. The four-step model. In Handbook of Transport Modelling; Emerald Group Publishing Limited: Leeds, UK, 2007; Volume 1, pp. 35–53. [Google Scholar]
  39. de Dios Ortúzar, J.; Willumsen, L.G. Modelling Transport; John Wiley & Sons: Hoboken, NJ, USA, 2024. [Google Scholar]
  40. Ben-Akiva, M.; Bierlaire, M. Discrete choice methods and their applications to short term travel decisions. In Handbook of Transportation Science; Springer: Boston, MA, USA, 1999; pp. 5–33. [Google Scholar]
  41. Nuzzolo, A.; Comi, A. Tactical and operational city logistics: Freight vehicle flow modelling. In Freight Transport Modelling; Emerald Group Publishing Limited: Leeds, UK, 2013; pp. 433–451. [Google Scholar]
  42. Comi, A. A modelling framework to forecast urban goods flows. Res. Transp. Econ. 2020, 80, 100827. [Google Scholar] [CrossRef] [Scilit]
  43. Zambrano-Rey, G.; López-Ospina, H.; Pérez, J. Retail store location and pricing within a competitive environment using constrained multinomial logit. Appl. Math. Model. 2019, 75, 521–534. [Google Scholar] [CrossRef] [Scilit]
  44. Méndez-Vogel, G.; Marianov, V.; Lüer-Villagra, A.; Eiselt, H.A. Store location with multipurpose shopping trips and a new random utility customers’ choice model. Eur. J. Oper. Res. 2023, 305, 708–721. [Google Scholar] [CrossRef] [Scilit]
  45. Suel, E.; Polak, J.W. Development of joint models for channel, store, and travel mode choice: Grocery shopping in London. Transp. Res. Part A Policy Pract. 2017, 99, 147–162. [Google Scholar] [CrossRef] [Scilit]
  46. Wieland, T. A micro-econometric store choice model incorporating multi-and omni-channel shopping: The case of furniture retailing in Germany. Geogr. Anal. 2023, 55, 3–30. [Google Scholar] [CrossRef] [Scilit]
  47. Verma, R.; Dalla Chiara, G.; Goodchild, A. Does proximity matter in shopping behavior? Transp. Res. Part A Policy Pract. 2025, 196, 104471. [Google Scholar] [CrossRef] [Scilit]
  48. Neslin, S.A.; Grewal, D.; Leghorn, R.; Shankar, V.; Teerling, M.L.; Thomas, J.S.; Verhoef, P.C. Challenges and opportunities in multichannel customer management. J. Serv. Res. 2006, 9, 95–112. [Google Scholar] [CrossRef] [Scilit]
  49. Verhoef, P.C.; Kannan, P.K.; Inman, J.J. From multi-channel retailing to omni-channel retailing: Introduction to the special issue on multi-channel retailing. J. Retail. 2015, 91, 174–181. [Google Scholar] [CrossRef] [Scilit]
  50. Gonzalez-Feliu, J.; Toilier, F.; Routhier, J.L. End consumer goods movement generation in French medium urban areas. Procedia-Soc. Behav. Sci. 2010, 2, 6189–6204. [Google Scholar] [CrossRef] [Scilit]
  51. Lee, R.J.; Sener, I.N.; Handy, S.L. Picture of online shoppers: Specific focus on Davis, California. Transp. Res. Rec. 2015, 2496, 55–63. [Google Scholar] [CrossRef] [Scilit]
  52. Wang, X.C.; Zhou, Y. Deliveries to residential units: A rising form of freight transportation in the US. Transp. Res. Part C Emerg. Technol. 2015, 58, 46–55. [Google Scholar] [CrossRef] [Scilit]
  53. Swinyard, W.R.; Smith, S.M. Why people (don’t) shop online: A lifestyle study of the internet consumer. Psychol. Mark. 2003, 20, 567–597. [Google Scholar] [CrossRef] [Scilit]
  54. Cao, X.; Chen, Q.; Choo, S. Geographic distribution of e-shopping: Application of structural equation models in the Twin Cities of Minnesota. Transp. Res. Rec. 2013, 2383, 18–26. [Google Scholar] [CrossRef] [Scilit]
  55. Srinivasan, S.; Bhat, C.R. Modeling household interactions in daily in-home and out-of-home maintenance activity participation. Transportation 2005, 32, 523–544. [Google Scholar] [CrossRef] [Scilit]
  56. Van, U.P.; Senior, M. The contribution of mixed land uses to sustainable travel in cities. In Achieving Sustainable Urban Form; Routledge: Abingdon, UK, 2013; pp. 139–148. [Google Scholar]
  57. Russo, A.; Campisi, T.; Bouhouras, E.; Basbas, S.; Tesoriere, G. Online food delivery ordering problems: A discrete choice analysis of less developed areas of Southern Italy. Sustain. Futures 2025, 9, 100650. [Google Scholar] [CrossRef] [Scilit]
  58. Mokhtarian, P.L.; Tang, W.L. Trivariate probit models of pre-purchase/purchase shopping channel choice: Clothing purchases in northern California. In Choice Modelling: The State of the Art and the State of Practice-Selected Papers from the Second International Choice Modelling Conference; Hess, S., Daly, A., Eds.; Edward Elgar Publishing: Cheltenham, UK, 2013; pp. 243–273. [Google Scholar]
  59. Comi, A.; Nuzzolo, A. Simulating urban freight flows with combined shopping and restocking demand models. Procedia-Soc. Behav. Sci. 2014, 125, 49–61. [Google Scholar] [CrossRef] [Scilit]
  60. Comi, A.; Nuzzolo, A. Exploring the relationships between e-shopping attitudes and urban freight transport. Transp. Res. Procedia 2016, 12, 399–412. [Google Scholar] [CrossRef] [Scilit]
  61. Jansen, B.J.; Salminen, J.; Jung, S.-G.; Guan, K. Data-Driven Personas; Springer: Berlin/Heidelberg, Germany, 2021. [Google Scholar] [CrossRef] [Scilit]
  62. An, J.; Kwak, H.; Jung, S.-G. Customer segmentation using online platforms: Isolating behavioral and demographic segments for persona creation via aggregated user data. Soc. Netw. Anal. Min. 2018, 8, 54. [Google Scholar] [CrossRef] [Scilit]
  63. Salminen, J.; Jansen, B.J.; Hamad, J.A.; Kwak, H.; Jung, S.J. Are personas done? Evaluating their usefulness in the age of digital analytics. Pers. Stud. 2018, 4, 47–60. [Google Scholar] [CrossRef] [Scilit]
  64. Gomes, A.M.; Meisen, T. A review on customer segmentation methods for personalized customer targeting in e-commerce use cases. Inf. Syst. e-Bus. Manag. 2023, 21, 527–570. [Google Scholar] [CrossRef] [Scilit]
  65. Cauwelier, K.; Buldeo Rai, H.; Puttemans, K.; Macharis, C.; Mommens, K. From cart to door: Unravelling consumer behaviour through attitudinal sustainability profiles. Transp. Res. Part D Transp. Environ. 2024, 130, 104168. [Google Scholar] [CrossRef] [Scilit]
  66. Train, K.E. Discrete Choice Methods with Simulation, 2nd ed.; Cambridge University Press: Cambridge, UK, 2009. [Google Scholar] [CrossRef] [Scilit]
  67. Niinimäki, K. Eco-clothing, consumer identity and ideology. Sustain. Dev. 2010, 18, 150–162. [Google Scholar] [CrossRef] [Scilit]
  68. Heffetz, O. A test of conspicuous consumption: Visibility and income elasticities. Rev. Econ. Stat. 2011, 93, 1101–1117. [Google Scholar] [CrossRef] [Scilit]
  69. Kapferer, J.-N.; Bastien, V. The Luxury Strategy: Break the Rules of Marketing to Build Luxury Brands; Kogan Page: London, UK, 2009. [Google Scholar]
  70. Cachinho, H. Consumerscapes and the resilience assessment of urban retail systems. Cities 2014, 36, 131–144. [Google Scholar] [CrossRef] [Scilit]
  71. McFadden, D. The measurement of urban travel demand. J. Public Econ. 1974, 3, 303–328. [Google Scholar] [CrossRef] [Scilit]
  72. Ben-Akiva, M.; Walker, J.; Bernardino, A.T.; Gopinath, D.A.; Morikawa, T.; Polydoropoulou, A. Integration of choice and latent variable models. In Perpetual Motion: Travel Behaviour Research Opportunities and Application Challenges; Mahmassani, H.S., Ed.; Emerald Group Publishing: Bingley, UK, 2002; pp. 431–470. [Google Scholar]
  73. Marcucci, E. I Modelli a Scelta Discreta per l’analisi dei Trasporti: Teoria, Metodi e Applicazioni; Carocci: Rome, Italy, 2005. [Google Scholar]
  74. Cantarella, G.E.; Watling, D.; De Luca, S.; Di Pace, R. Dynamics and Stochasticity in Transportation Systems: Tools for Transportation Network Modelling; Elsevier: Amsterdam, The Netherlands, 2019. [Google Scholar]
  75. Croissant, Y. Estimation of random utility models in R: The mlogit package. J. Stat. Softw. 2020, 95, 1–41. [Google Scholar] [CrossRef] [Scilit]
  76. Ben-Akiva, M.; Lerman, S.R. Discrete Choice Analysis: Theory and Application to Travel Demand; MIT Press: Cambridge, MA, USA, 1985; Volume 9. [Google Scholar]
  77. Google LLC. Google Forms. 2025. Available online: https://www.google.com/forms (accessed on 30 April 2026).
  78. R Core Team. R: A Language and Environment for Statistical Computing; R Foundation for Statistical Computing: Vienna, Austria, 2025; Available online: https://www.R-project.org/ (accessed on 30 April 2026).
  79. Microsoft Corporation. Microsoft Excel, Office 365 Version; Microsoft Corporation: Washington, DC, USA, 2025. Available online: https://www.microsoft.com/it-it/microsoft-365?rtc=1 (accessed on 30 April 2026).
  80. Eurostat. Education and Training Outcomes (t_educ_outc). 2026. Available online: https://ec.europa.eu/eurostat/databrowser/view/tgs00109/default/table?lang=en&category=t_educ.t_educ_outc (accessed on 3 May 2026).
  81. Cirelli, C.; Graziano, T.; Mercatanti, L.; Nicosia, E.; Porto, C.M. Rileggendo la città: Le recenti trasformazioni del commercio a Catania. Geotema 2016, 51, 48–59. [Google Scholar]
Figure 1. Urban logistics general scheme.
Sustainability 18 06081 g001
Figure 2. Percentage of users who bought clothes online in 2023 per European Union country (source: authors’ elaboration based on [25]).
Sustainability 18 06081 g002
Figure 3. Distances from nearest clothing shop: sample results.
Sustainability 18 06081 g003
Figure 4. Times from nearest clothing shop by means of transportation: sample results.
Sustainability 18 06081 g004
Figure 5. Model 1: choice structure.
Sustainability 18 06081 g005
Figure 6. Model 2: choice structure.
Sustainability 18 06081 g006
Figure 7. Probability of choosing alternative j vs. TF: (a) MALE = 1, A50 = 0; (b) MALE = 0, A50 = 0.
Sustainability 18 06081 g007
Figure 8. Probability of choosing alternative j vs. TF: (a) MALE = 1, A50 = 1; (b) MALE = 0, A50 = 1.
Sustainability 18 06081 g008
Table 1. Survey information (clothing section).
Survey Questions
Information about most frequent purchase
  • Type of purchased item
  • Time of purchase
  • Channel
  • Monetary expenses
Number of purchase (last month)
Accessibility information to stores
  • Distance
  • Time with different transportation mode
Other actions
Table 2. Number of purchases in last month: sample results.
Number of Purchases%
031.5%
123.8%
219.9%
3 or more24.8%
Table 3. Additional actions: sample results.
Other Actions%
Check product features and price online31.6%
Check the characteristics of the product and the price in the shop (in the one where you made the purchase or in another)38.8%
None of the above29.6%
Table 4. Models calibration results (***, **, * significance at 1%, 5%, 10% level).
AttributeSymbolCoefficientAlternativeMNL2-Level Hierarchical
EstimateSignificanceEstimateSignificance
Walking time T F β T F , C City centre−0.021
(0.006)
−3.538 ***−0.019
(0.007)
−2.845 ***
Age > 50 A 50 β A 50 , C City centre2.101
(0.543)
3.867 ***1.932
(0.577)
3.350 ***
Gender male M A L E β M A L E , N No purchase1.468
(0.352)
4.171 ***1.456
(0.365)
3.987 ***
Low income I N β I , O Online−0.626
(0.369)
−1.698 *−0.623
(0.358)
−1.741 *
Age > 50 A 50 β A 50 , N No purchase1.705
(0.578)
2.947 ***1.614
(0.602)
2.682 ***
Age 18–22 A 1822 β 1822 , M Mall1.370
(0.477)
2.872 ***1.142
(0.576)
1.981 **
Sicilian resident S β S , C City centre−3.243
(0.915)
−3.546 ***−2.731
(1.229)
−2.221 **
Sicilian resident S β S , N No purchase−3.437
(0.903)
−3.807 ***−3.033
(1.192)
−2.544 **
Sicilian resident S β S , O Online−4.439
(0.921)
−4.819 ***−4.029
(1.252)
−3.218 ***
Main city M C β M C , C City centre1.087
(0.567)
1.917 *1.125
(0.578)
1.948 *
Main city M C β M C , M Mall2.534
(0.671)
3.776 ***2.345
(0.792)
2.960 ***
ASA city centre A S A C β A S A , C City centre4.689
(1.061)
4.419 ***3.981
(1.560)
2.551 **
ASA no purchase A S A N β A S A , N No purchase3.821
(1.072)
3.563 ***3.167
(1.568)
2.019 **
ASA pnline A S A O β A S A , O Online5.487
(1.061)
5.172 ***4.817
(1.636)
2.945 ***
Logsum trad Y t r a d δ t r a d Trad retail[-][-]0.797
(0.332)
2.397 **
Table 5. Main results of the two models.
IndicatorMNL2-Level Hierarchical
ρ 2 0.1680.171
% of right0.470.47
N β 1415
ρ 2 a d j 0.120.12
Table 6. Elasticity analysis.
E T F p ( C ) E T F p ( M ) E T F p ( O ) , E T F p ( N )
Average−0.730.210.16
A 50 = 1 −0.360.030.27
M = 1 −0.810.210.12
Table 7. Summary of potential policy implications.
AttributeFindingInterpretationPossible Policy Implication
Walking timeNegatively affects CResidential proximity to retail positively affects the choice to purchase at retailerInvestments in walkability and mixed land-use counter the migration to online
Age > 50Positively affects C and NHigh propension to purchase via traditional channelUrban accessibility policies also serve social inclusion objectives
Low incomeNegatively affects OThe digital divide can negatively impact the purchasing decisions of low-income usersUrban commercial desertification has regressive effects on accessibility to goods
Main cityPositively affects C and MPresence of dense retail supply system in urban areas increases the likelihood of physical purchase in all formsTerritorial governance of retail location can modulate the balance between physical and online channel adoption at the city scale
Disclaimer/Publisher’s Note: The statements, opinions and data contained in all publications are solely those of the individual author(s) and contributor(s) and not of MDPI and/or the editor(s). MDPI and/or the editor(s) disclaim responsibility for any injury to people or property resulting from any ideas, methods, instructions or products referred to in the content.