1. Introduction
Water scarcity has become one of the most critical global environmental and socio-economic challenges of the twenty-first century. Rapid population growth, urbanization, industrial development, and climate change are exerting increasing pressure on available freshwater resources. Recent global assessments indicate that about 3.6 billion people currently face water shortages, and this number is expected to exceed 5 billion by 2050 [
1]. In parallel, global water demand is expected to rise further by 2050 due to population growth and economic development [
2,
3]. At the same time, large quantities of wastewater are generated worldwide. Despite advances in sanitation infrastructure, a significant fraction of this wastewater is discharged into the environment with insufficient treatment. Recent global assessments indicate that only about half of the wastewater produced worldwide is treated, while the remaining portion is released into rivers, lakes, and coastal waters, leading to serious environmental pollution and public health risks [
4,
5].
Wastewater therefore represents not only a potential pollution source but also a valuable water resource that can be recovered and reused. However, the reuse of treated wastewater remains relatively limited worldwide. Current estimates suggest that only about 11% of treated wastewater is reused globally, highlighting a significant untapped potential for water resource recovery and sustainable water management [
6]. Wastewater reuse has consequently emerged as a key strategy to address both water scarcity and environmental protection. Reclaimed wastewater can be used for a wide range of applications, including agricultural irrigation, industrial processes, groundwater recharge, and urban non-potable uses, thereby reducing pressure on conventional freshwater resources and contributing to a circular water economy [
7].
The challenge of water scarcity is particularly acute in Egypt, where renewable freshwater resources are limited and largely dependent on the fixed annual allocation of Nile water under the 1959 Nile Waters Agreement. Combined with rapid population growth and expanding agricultural and industrial demand, this situation has resulted in a per capita water availability far below global water scarcity thresholds. Consequently, treated municipal wastewater has emerged as an essential alternative water source, particularly for agricultural irrigation, landscape irrigation, and industrial applications. The feasibility and safety of such reuse depend fundamentally on the ability of wastewater treatment plants (WWTPs) to produce effluent that consistently meets regulatory and health-based quality targets. In Egypt’s updated Nationally Determined Contribution (NDC), wastewater reuse is recognized as an important strategy for addressing water scarcity and climate adaptation [
8].
In most wastewater treatment plants, secondary biological treatment processes, such as activated sludge systems, remove the majority of biodegradable organic matter. However, secondary effluents still contain residual suspended solids, turbidity, nutrients, and microorganisms, which may limit their direct reuse or discharge into sensitive receiving water bodies. Consequently, tertiary treatment processes are often required to further polish secondary effluents and produce reclaimed water of sufficient quality for reuse applications. Among tertiary treatment technologies, granular media filtration, particularly sand filtration, is widely applied due to its simplicity, operational robustness, and relatively low cost. Sand filters effectively remove residual suspended solids, turbidity, and associated contaminants, thereby improving the quality of treated wastewater prior to disinfection or reuse [
9,
10].
Traditional rapid sand filters operate in batch mode and require periodic backwashing to remove accumulated solids within the filter bed, which interrupts filtration and increases operational complexity. In contrast, continuous up-flow sand filters, also referred to as moving-bed or continuous backwash sand filters, operate with simultaneous filtration and media cleaning. In these systems, wastewater flows upward through the sand bed while the filter media is continuously circulated and washed through an internal cleaning mechanism. This configuration allows uninterrupted filtration, improving operational stability and reducing downtime compared with traditional filtration systems.
Several technologies are available for the tertiary polishing of secondary wastewater effluents, including granular media filtration, membrane filtration, activated carbon adsorption, and advanced oxidation processes (AOPs) [
11,
12,
13]. Membrane-based systems can produce high-quality effluents and are widely used in advanced treatment and reuse applications; however, their broader application may be constrained by higher capital and operating costs, membrane fouling, greater energy demand, periodic cleaning, membrane replacement, and increased operational complexity [
14,
15]. Activated carbon adsorption is effective for removing dissolved and recalcitrant organic pollutants, but its long-term operation requires careful monitoring of breakthrough, exhausted media management, and periodic regeneration or replacement, which increases both operational cost and process complexity [
16]. AOPs are effective for degrading refractory organic contaminants and enhancing disinfection, yet their performance is highly dependent on water matrix characteristics, oxidant or energy demand, by-product formation, process control requirements, and relatively complex operation [
17,
18]. In comparison, sand and granular media filtration provide a simpler, lower-cost, and operationally robust polishing option for removing residual suspended solids, turbidity, and particle-associated pollutants from secondary effluents. Accordingly, sand filtration remains an attractive tertiary polishing option for wastewater reuse because it is simple, cost-effective, reliable, and easy to integrate into existing treatment plants. [
11,
13].
Continuous sand filtration systems are therefore considered a promising technology for the polishing of secondary wastewater effluents and the production of reclaimed water suitable for reuse. However, the performance of continuous up-flow sand filtration may be influenced by influent water quality, hydraulic loading rate, upstream chlorination, and the use of coagulants or chemical pretreatment [
19]. Although these factors have been addressed in previous studies, limited work has evaluated their combined effects under pilot-scale continuous up-flow operation using real secondary effluent from an operating wastewater treatment plant. Accordingly, this study investigates the performance of a pilot-scale continuous up-flow sand filter installed at an existing WWTP as a tertiary treatment process for secondary wastewater effluent. The filter was evaluated under varying influent quality, different flow conditions, with and without upstream chlorination, and with alum or ferric chloride addition. The assessment focused on the removal of key water quality parameters, including turbidity, total suspended solids (TSS), biochemical oxygen demand (BOD
5),
E. coli, and nutrients. The study provides practical insights into the operational stability, pollutant removal efficiency, and applicability of continuous up-flow sand filtration for wastewater polishing and the production of reclaimed water suitable for sustainable reuse.
2. Materials and Methods
2.1. Description of the Pilot-Scale Setup
A pilot-scale setup of a continuous up-flow sand filter (DynaSand
®, Nordic Water Products, Mölndal, Sweden) was installed downstream of secondary treatment at Qaha wastewater treatment plant (QWWTP), Egypt. The QWWTP includes screens, grit removal, oxidation-ditch-activated sludge process and finally chlorine disinfection. The pilot-scale setup was installed after the contact tank of the chlorine disinfection. The continuous up-flow sand filter operates as a moving-bed granular media filter, in which influent water flows upward through a sand bed where suspended solids are retained. The filter media is continuously washed by an internal air-lift system and sand washer, allowing simultaneous filtration and media cleaning without interrupting operation.
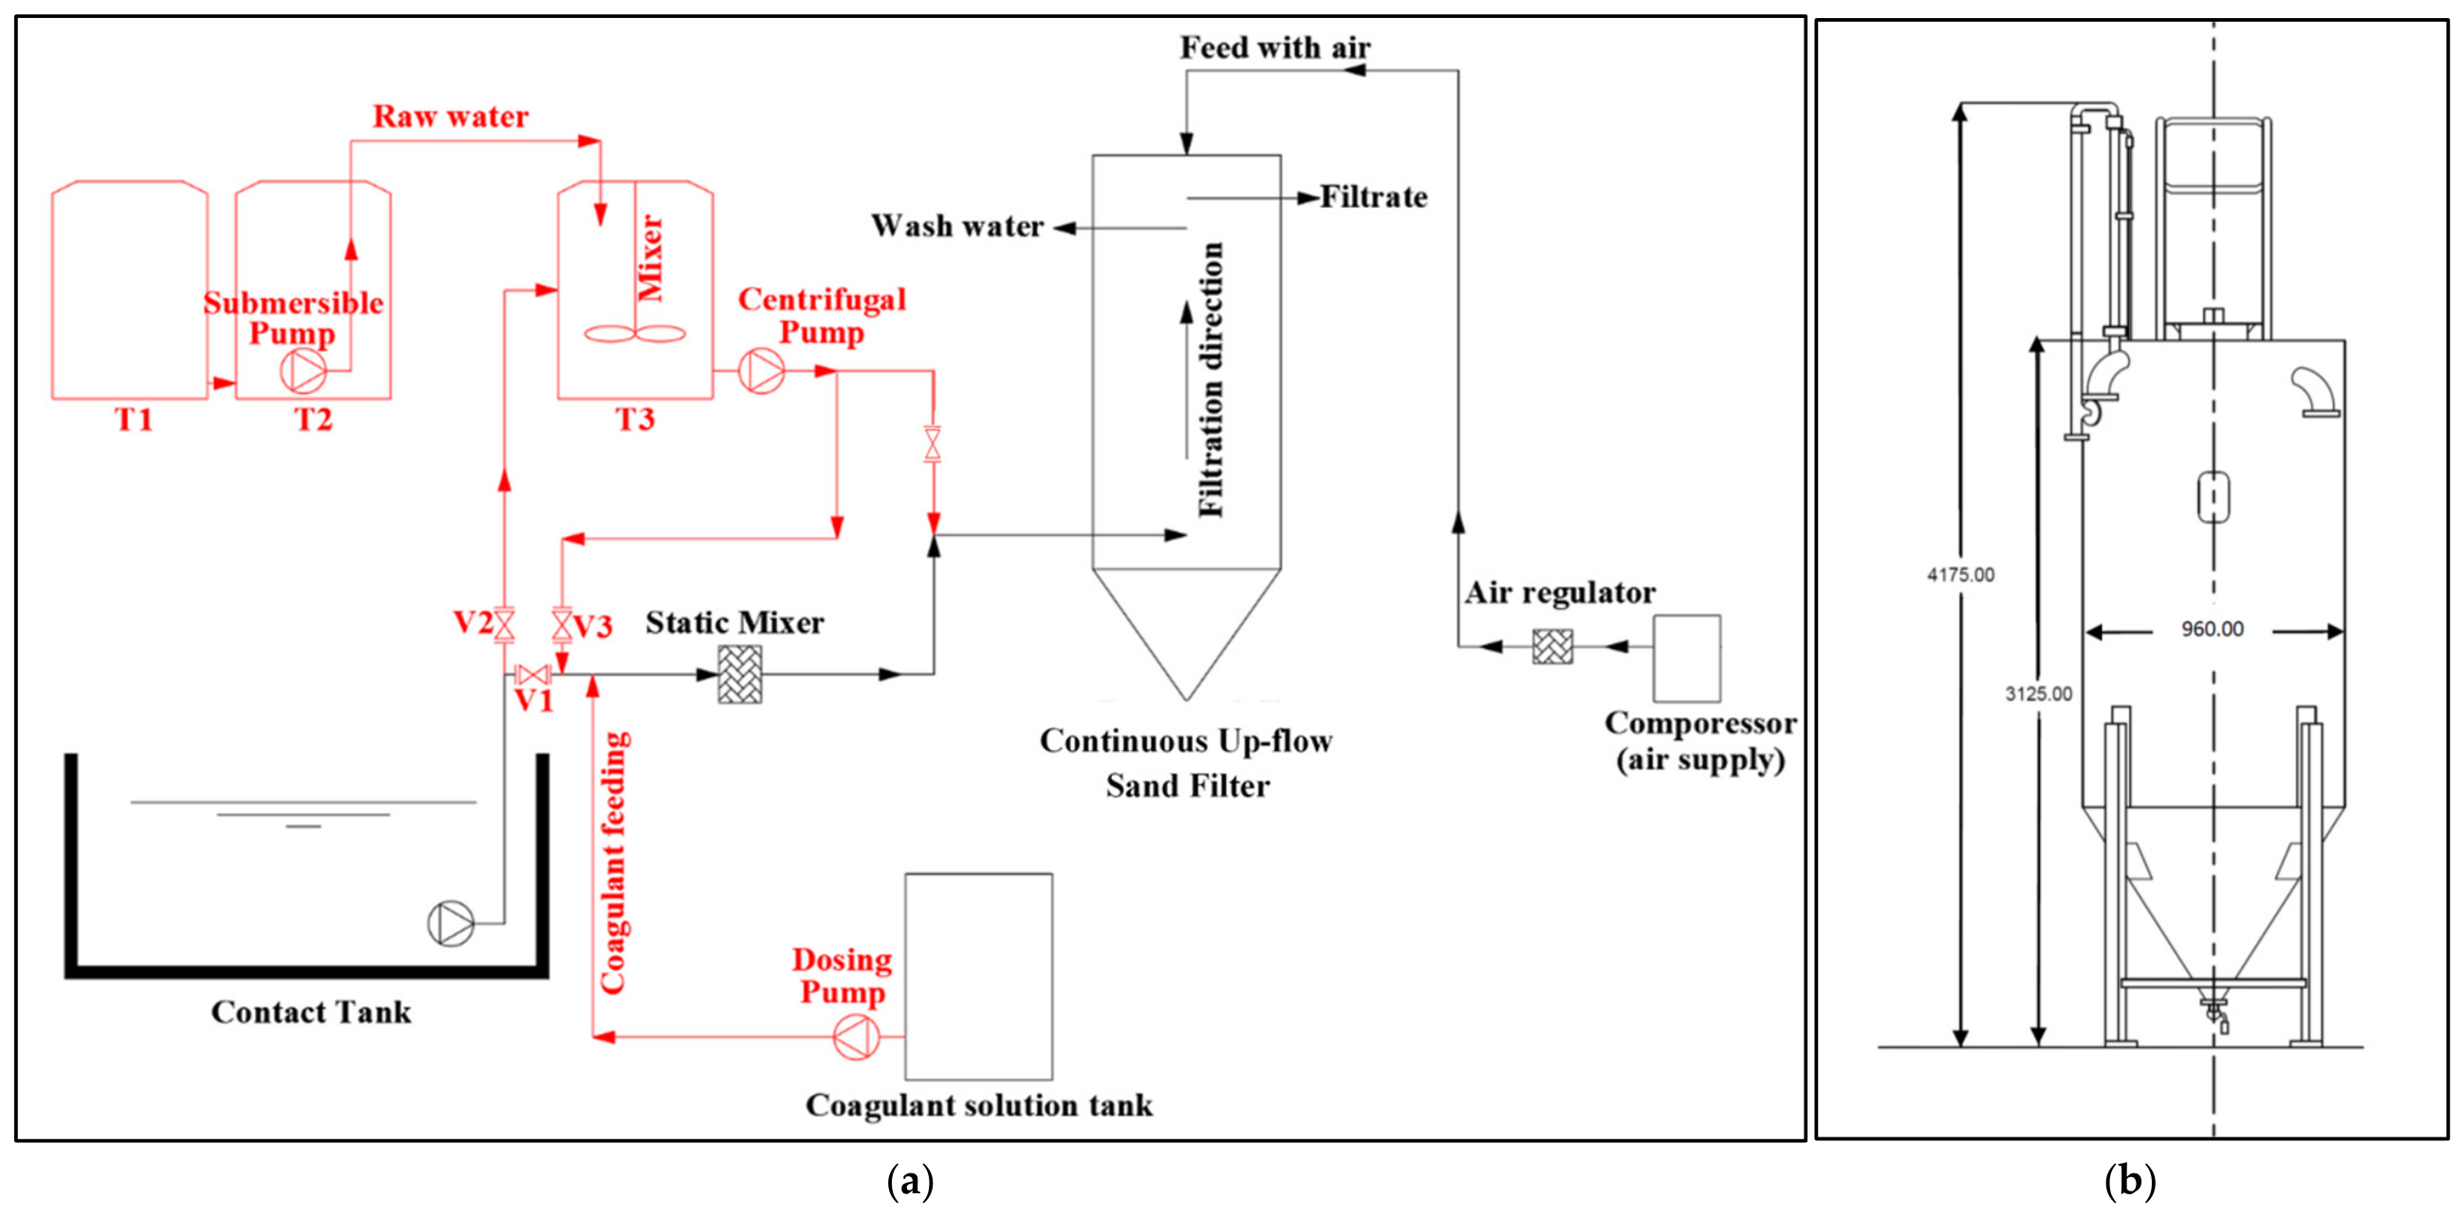
Figure 1a illustrates the schematic diagram of the pilot-scale setup installed at QWWTP.
Figure 1b shows a schematic diagram of the continuous up-flow sand filter with dimensions.
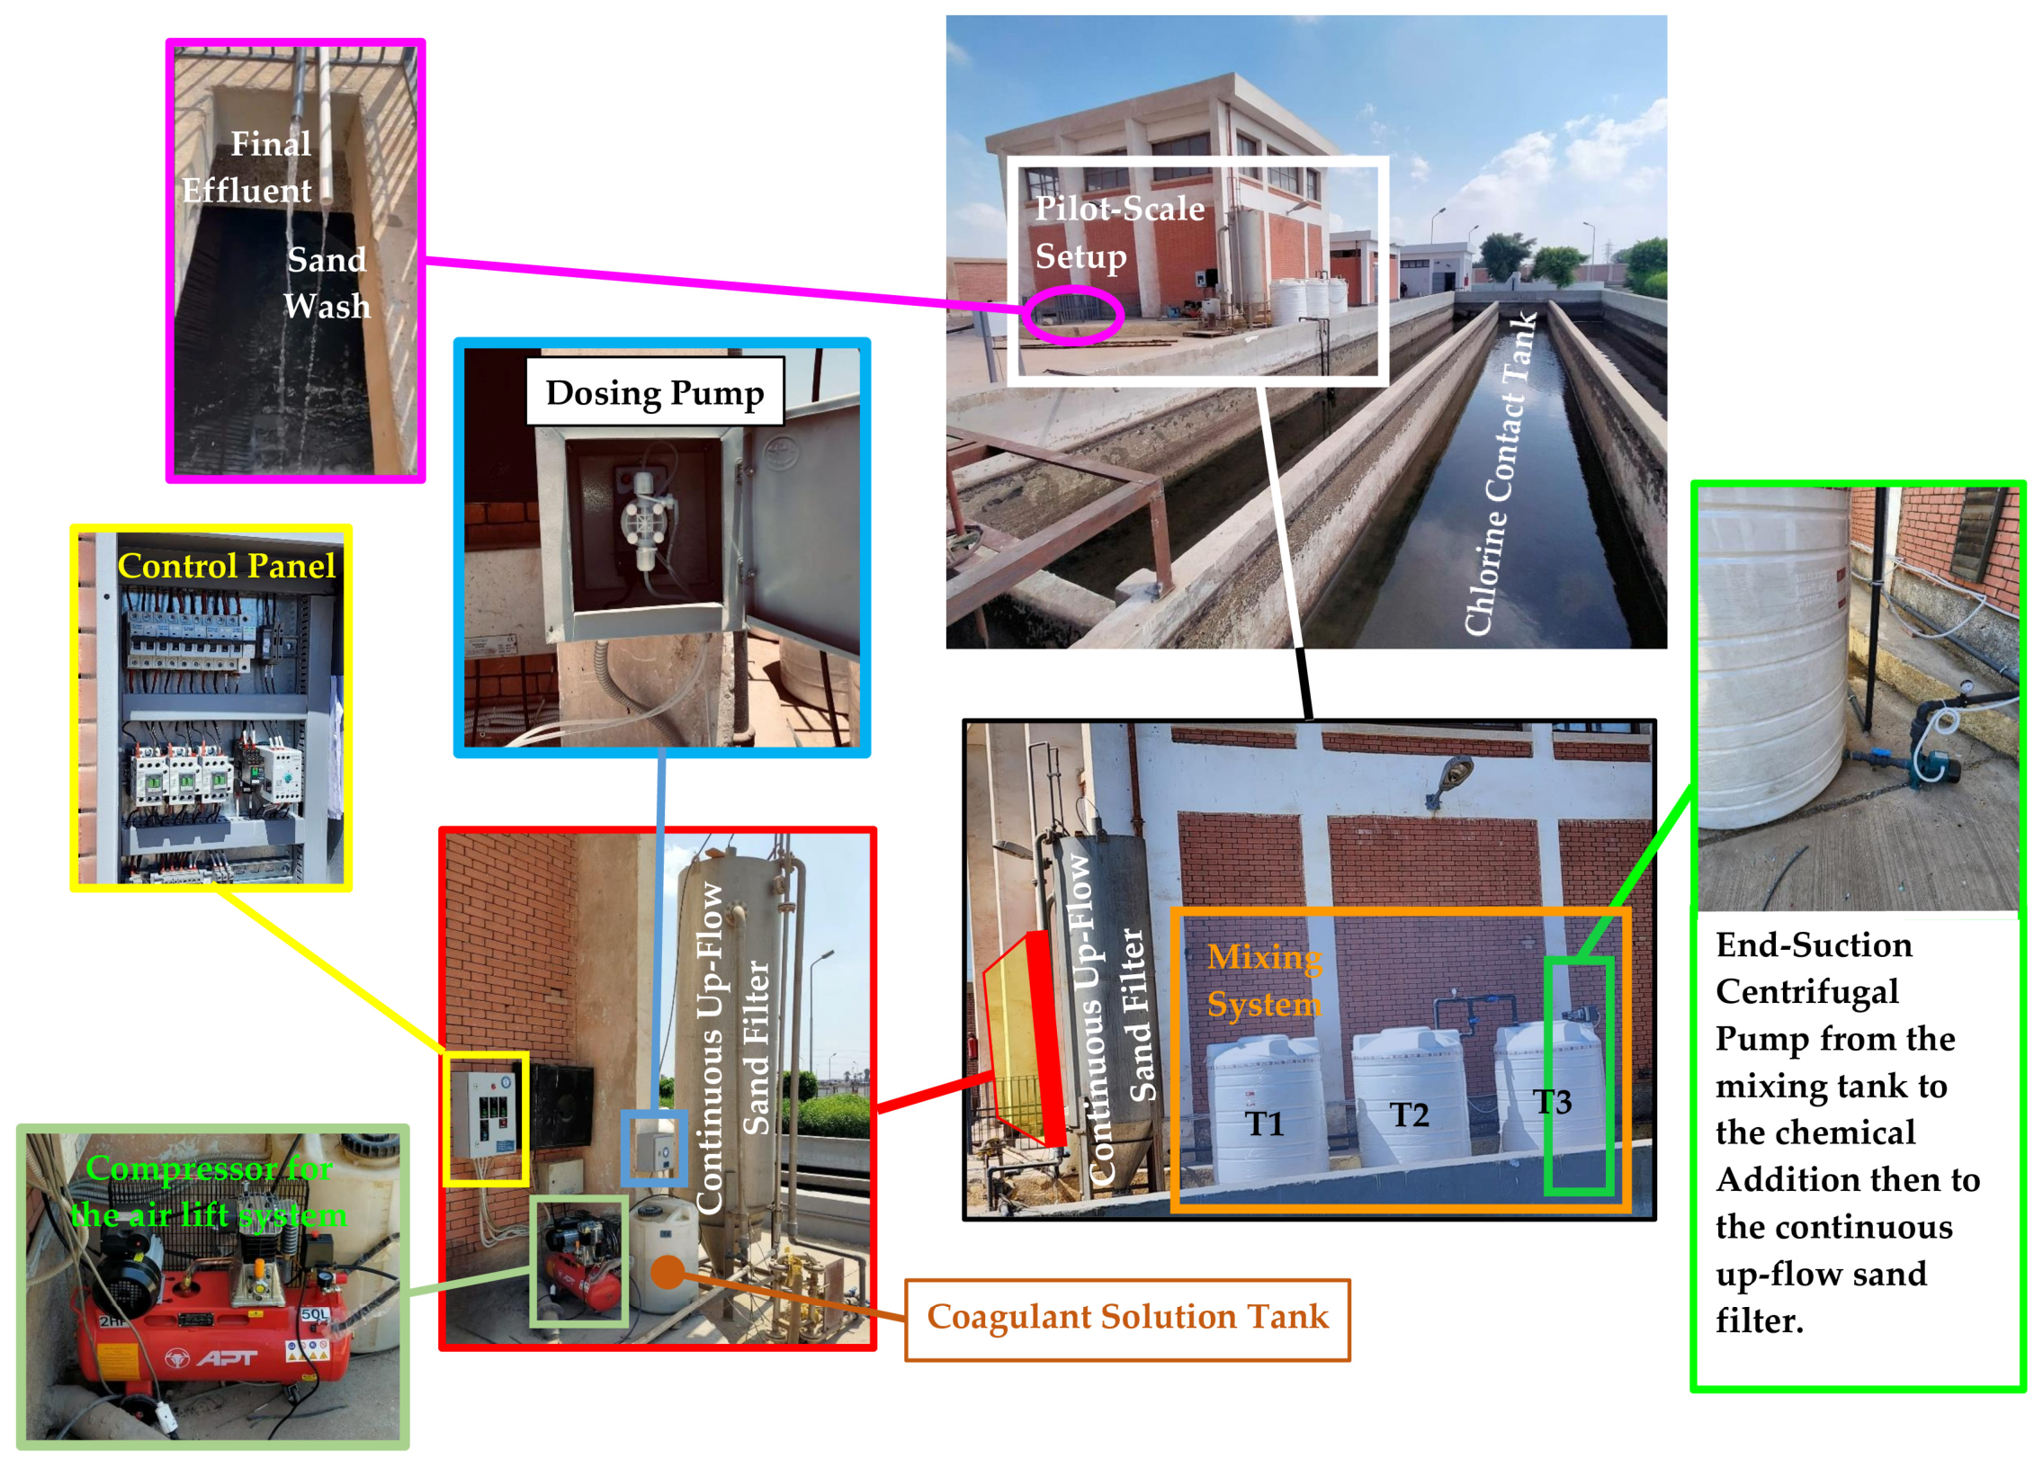
Figure 2 shows photos of the pilot-scale setup.
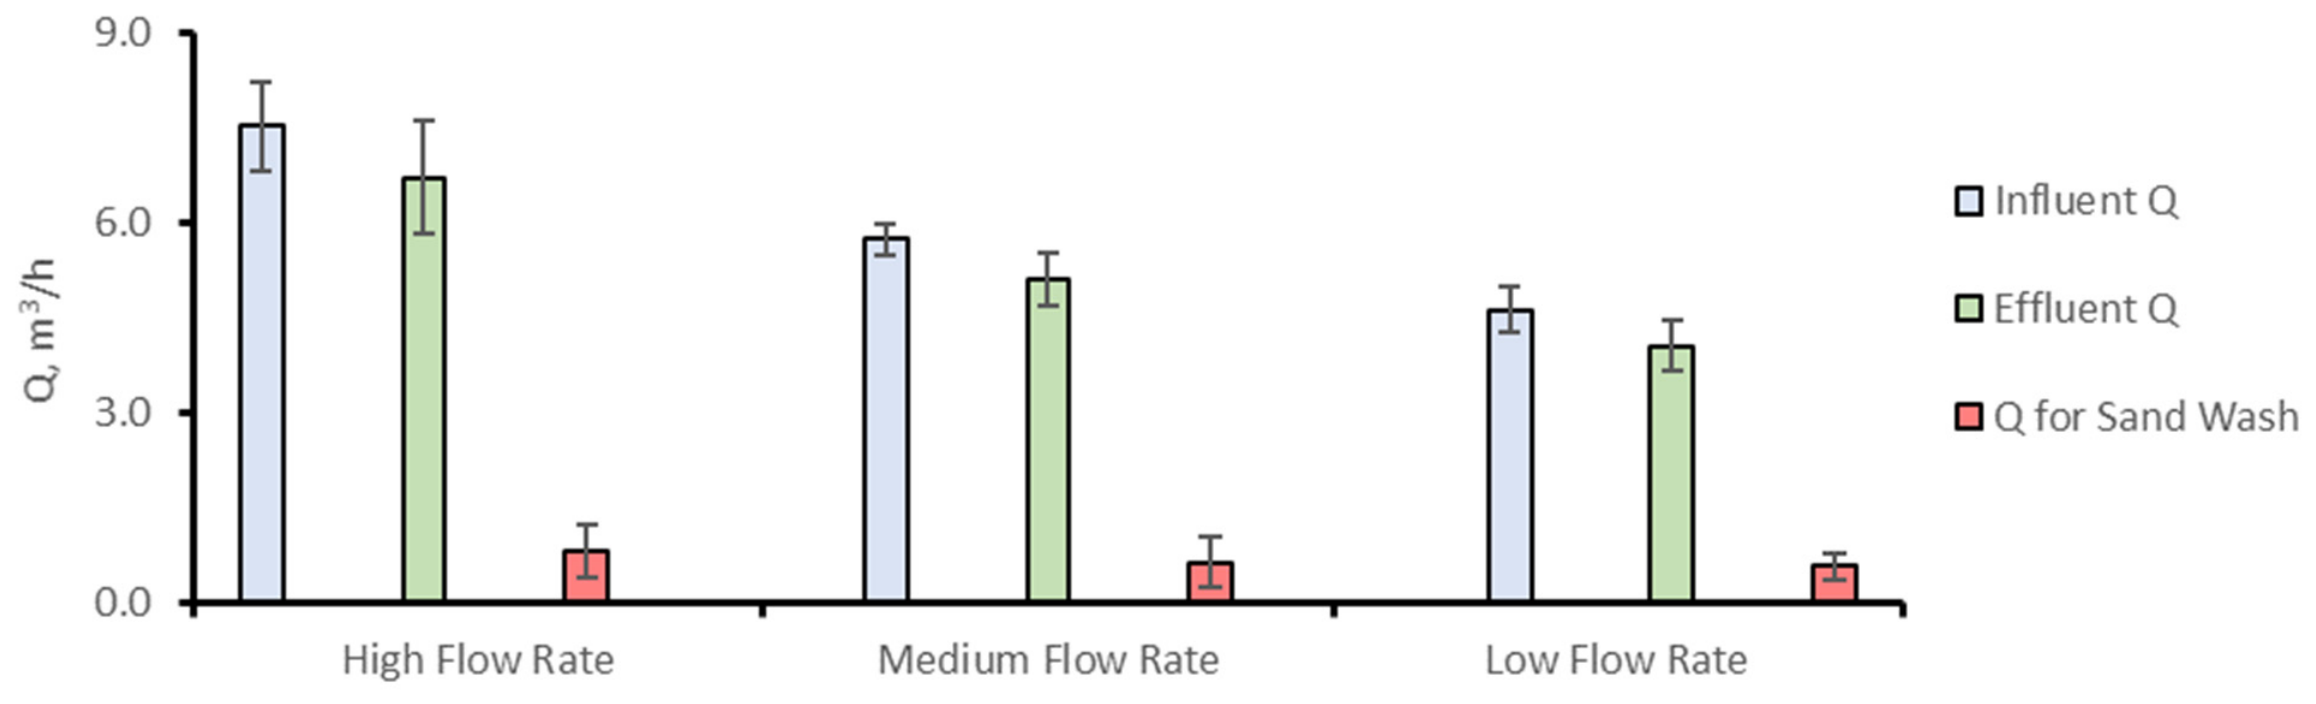
The continuous up-flow sand filter unit used in the pilot-scale setup had a total height of 4.175 m and a diameter of 0.960 m. The effective filter bed height was 3.125 m, and the additional height of approximately 1.05 m corresponded to the upper air-lift and sand-washing piping above the active filter bed. The sand bed depth was 1.5 m. During the experiment, the filter was operated at wastewater flow rates ranging from 3.9 to 8.5 m3/h, adjusted by throttling a valve upstream of the filter. The air flow rate for the air-lift pump was 1.9 m3/h, and the air pressure was adjusted to 4 bars. The sand used in the filter had a size range of 1.2–2.0 mm and a total volume of 1.7 m3. The pilot-scale system was operated using real secondary treated wastewater that was pumped from the chlorine contact tank effluent.
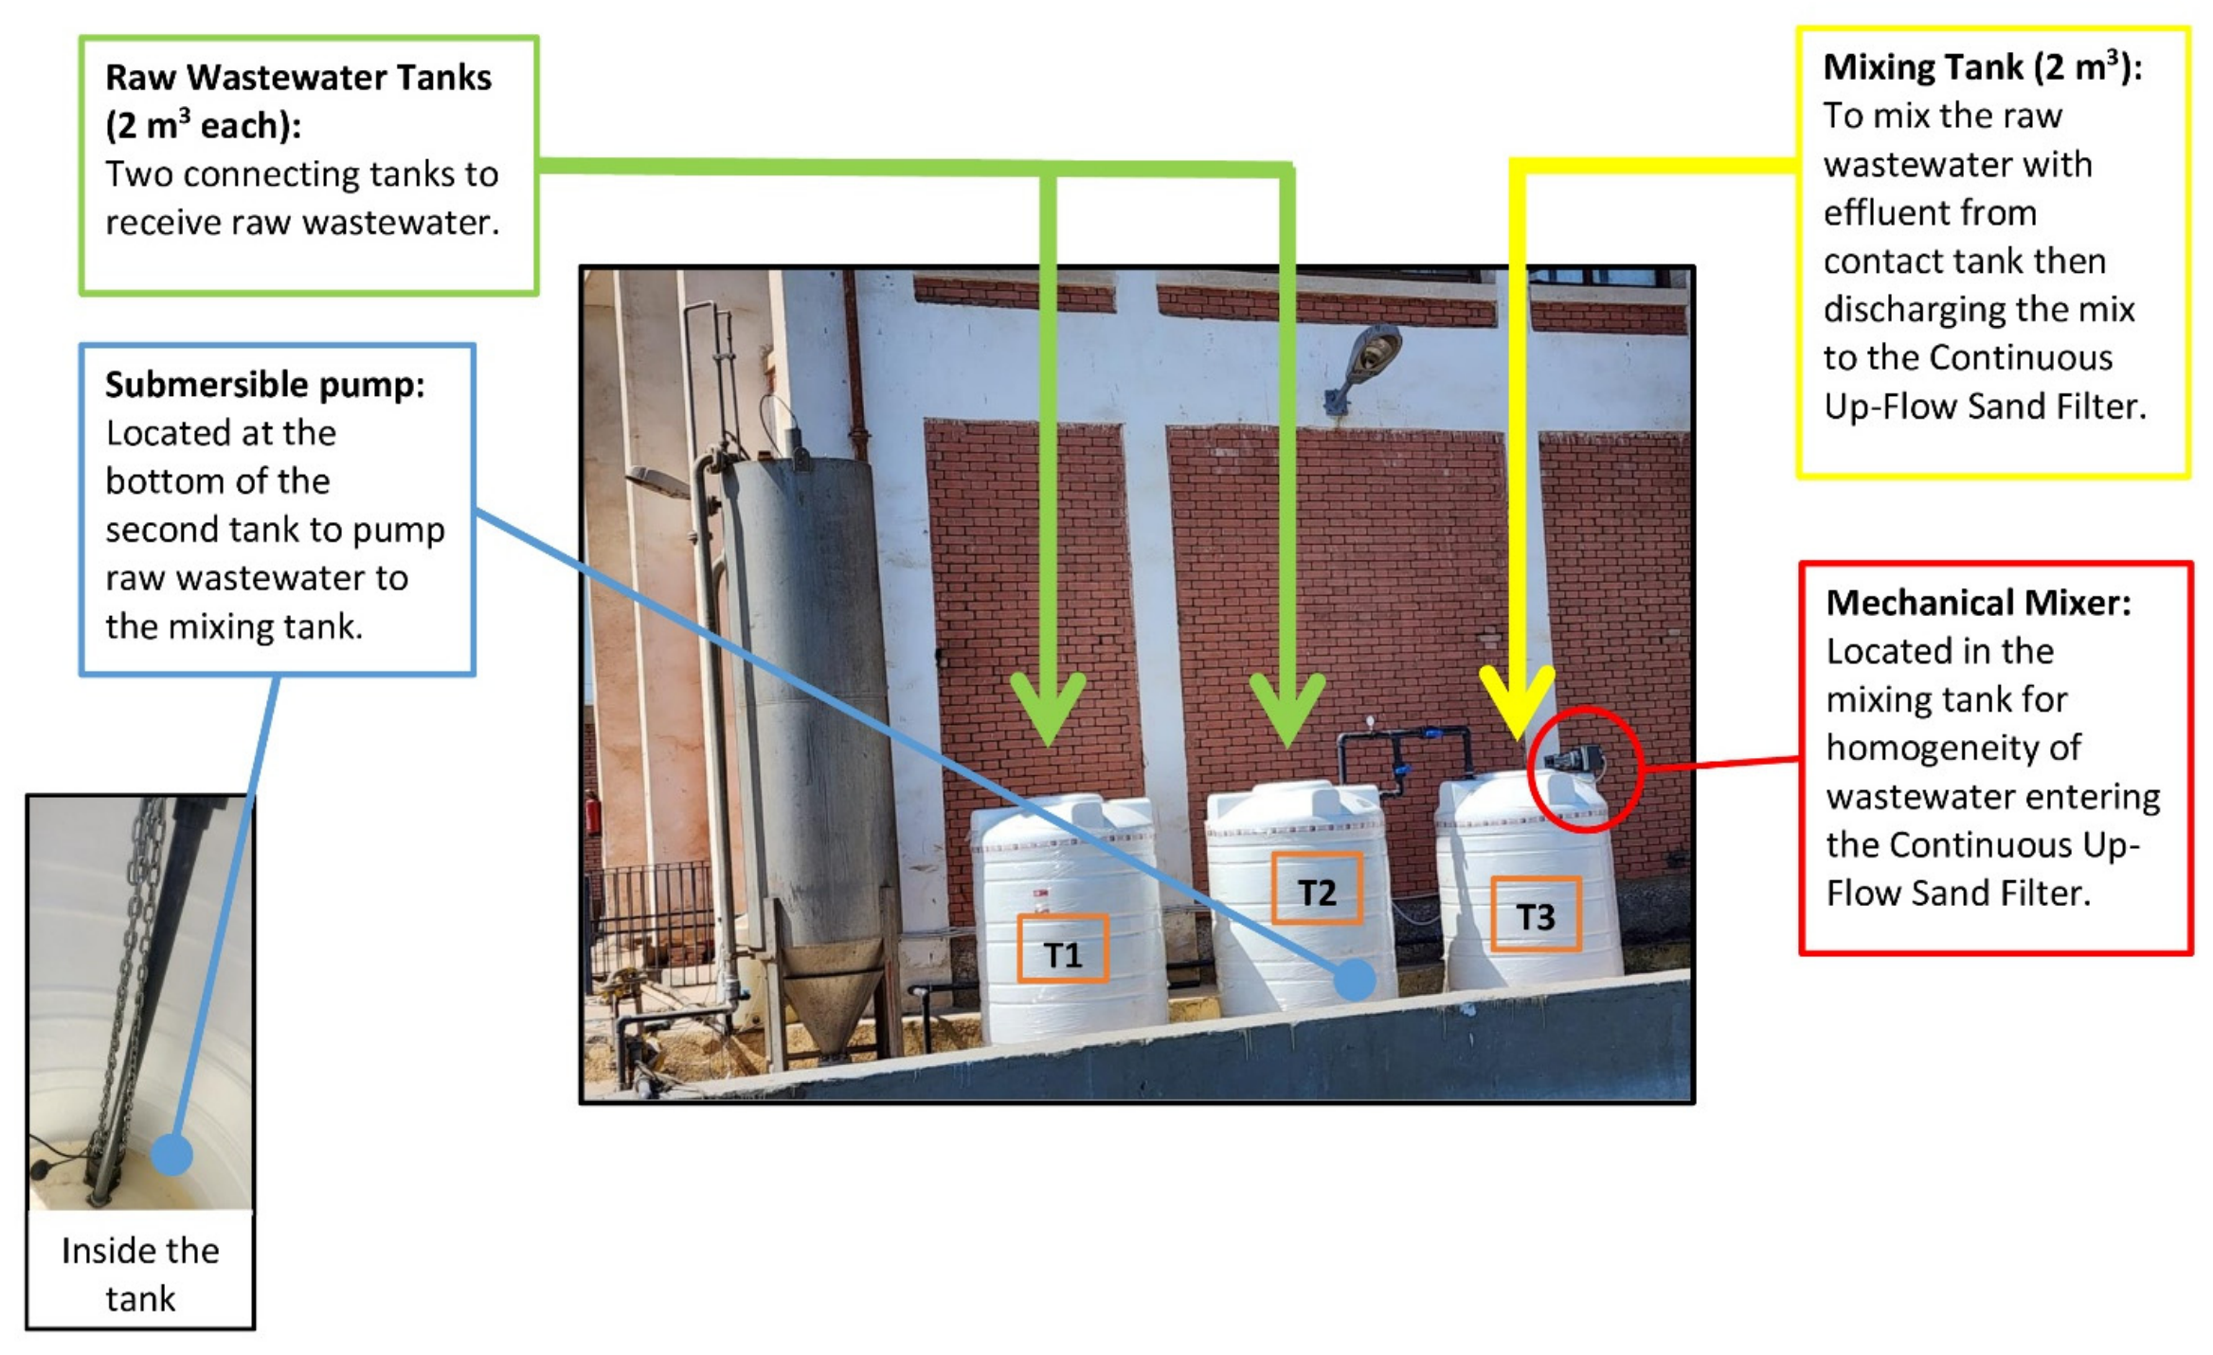
In order to assess the performance of the continuous up-flow sand filter under different wastewater quality conditions, a mixing system was designed and installed as depicted in the schematic diagram of
Figure 1a and the photos of
Figure 3. This approach involved blending secondary treated effluent with raw wastewater to simulate different influent water qualities for the pilot-scale system. The mixing system consisted of three polypropylene tanks, T1, T2 and T3, each with a capacity of 2 m
3. T3 received secondary treated wastewater from the chlorine contact tank and was equipped with a mechanical mixer to ensure homogeneous mixing. T1 and T2 were filled with raw wastewater and were hydraulically connected. A submersible pump installed in T2 transferred raw wastewater to T3, where it was blended with the secondary treated effluent. The mixed wastewater was then pumped from T3 to the filtration unit using an end-suction centrifugal pump. The pilot system was equipped with valves to allow two operating modes: direct feed from the chlorine contact tank to the filter, or diversion of the effluent to T3 for mixing with raw wastewater before filtration. According to the pump nameplate, the end-suction centrifugal pump installed at T3 to convey wastewater to the filter had a maximum flow capacity of 275 L/min (16.5 m
3/h) and a maximum head of 20 m. The actual flow to the filter was controlled by throttling the valve installed upstream of the filter unit. The submersible pump installed in T2 had a maximum flow rate of 2 m
3/h and a maximum head of 10 m. The mechanical mixer installed in T3 had a power of 0.55 kW and an operating speed of 100–150 rpm, controlled by a gearbox.
To simulate different influent wastewater quality, secondary treated wastewater was pumped from the final effluent of the contact tank at QWWTP to the mixing tank (T3), where it was mixed with raw wastewater pumped from T1 and T2. The pilot-scale system was also operated using the effluent from the contact tank directly without mixing with raw wastewater.
The system was equipped with a chemical dosing system for the addition of coagulants such as ferric chloride or aluminum sulfate (Alum) as shown in
Figure 1a and
Figure 2. The chemical dosing system included a chemical tank that held the coagulant solution and a dosing pump with a maximum flow rate of 5 L/h and a maximum head of 5 bars. The chemical dosing pump was used to inject the coagulants (Alum or Ferric Chloride) from the chemical tank into the influent of the continuous up-flow sand filter at the required dosages.
An in-line static mixer was installed immediately downstream of the coagulant injection point to ensure rapid dispersion before the filter inlet. The mixer diameter and velocity gradient (G value) were not separately determined in this study, as the focus was on evaluating treatment performance under variable operating flow conditions rather than on characterizing the mixer hydraulics. The coagulant dosing rate was low relative to the main wastewater flow, and the dosing pump was calibrated by measuring delivered volume versus time. The coagulant dose was adjusted for each run based on the measured flow rate to maintain the target dosage across the tested operating range of the flow rate. Each coagulant, alum or ferric chloride, were tested in separate experiments using the same chemical dosing arrangement. The dosing line was flushed between runs to prevent cross-contamination.
uPVC pipes and proper controls including fittings, valves and accessories were installed to connect and control all units. A control electrical panel was also installed for the operation of the electromechanical equipment.
2.2. Experimental Program and Operation Phases
Several experimental runs were conducted to evaluate system performance under the different conditions using secondary treated effluent. The experimental work was conducted in three phases: Phase I, baseline operation and log-removal of the filter; Phase II, effect of variable influent quality; and Phase III, coagulant-assisted filtration. Before each phase, the pilot system was allowed to stabilize for at least one week to ensure steady operating conditions. Following stabilization, the unit was operated continuously on a daily basis, while samples were collected intermittently according to the experimental schedule. Phase I lasted approximately four months and was conducted at flow rates ranging from 3.9 to 5.6 m3/h. Phase II lasted about two weeks and was operated at flow rates of 4.7–8.5 m3/h. Phase III lasted more than one month and was operated at flow rates of 5.0–7.3 m3/h.
2.2.1. Phase I: Baseline Operation and Log-Removal of the Filter
In the first phase, the continuous up-flow sand filter was operated using secondary treated effluent pumped from the chlorine contact tank at QWWTP. In this phase, the pilot was operated at steady flow rates of two conditions including chlorine addition and no chlorine addition in the disinfection stage preceding the pilot. This phase established the baseline performance of the filter under typical operating conditions of the treatment plant. This phase can also provide the log-removal of the pathogenic indicators for this type of filter. Chlorinated and non-chlorinated runs were conducted on separate days. After switching from chlorinated to non-chlorinated operation, the system was operated without chlorine addition for at least 18 h before sample collection, allowing residual oxidant effects to dissipate.
2.2.2. Phase II: Effect of Variable Influent Quality
In Phase II, the continuous up-flow sand filter was tested at different influent water quality. The influent quality was changed by mixing the secondary treated effluent with raw wastewater to simulate higher influent pollutant loads. This phase aimed to assess the robustness and operational stability of the filter under deteriorated influent quality conditions. The mixed wastewater was homogenized in the mixing tank prior to being fed to the filter.
2.2.3. Phase III: Coagulant-Assisted Filtration
In Phase III, the performance of the continuous up-flow sand filter was investigated with the use of aluminum sulfate, Al2SO4 (alum) or Ferric Chloride (FeCl3). Before conducting Phase III, Jar Tests were carried out for initial investigation of coagulant doses to be used in pilot-scale experiments. According to the results of the Jar Tests, the coagulants were injected into the influent of the filter in the pilot-scale setup at different concentrations. The coagulant was injected upstream of a static mixer to ensure adequate dispersion prior to filtration.
2.3. Coagulants Used in the Experiments
Each coagulant solution used in the current study was prepared in the chemical tank by diluting the concentrated solution with tap water immediately before each experiment to minimize residence time. The pH of the coagulant solution was not continuously monitored. The working concentration was calculated from the target coagulant dose, the measured wastewater flow rate, and the calibrated dosing-pump flow rate. The dosing pump was then adjusted accordingly, and the required coagulant solution was injected inline before the static mixer installed on the influent pipe of the filter.
The coagulants were received as concentrated solutions from ChemiArt company (Cairo, Egypt). The Alum concentrated solution used in the experiments had a concentration of 7% Al
2O
3, corresponding to approximately 3.7% Al. The ferric chloride concentrated solution used in the experiments had an iron concentration of 10–12%. All coagulant concentrated solutions used in the experiments were certified to NSF/ANSI 60 [
20]. The ferric chloride working solution was prepared according to the batch concentration specified by the manufacturer, and the dosing pump was calibrated by measuring delivered volume versus time before each run to maintain the target dose. No separate density analysis or titration was performed for each experimental run.
2.4. Jar Tests
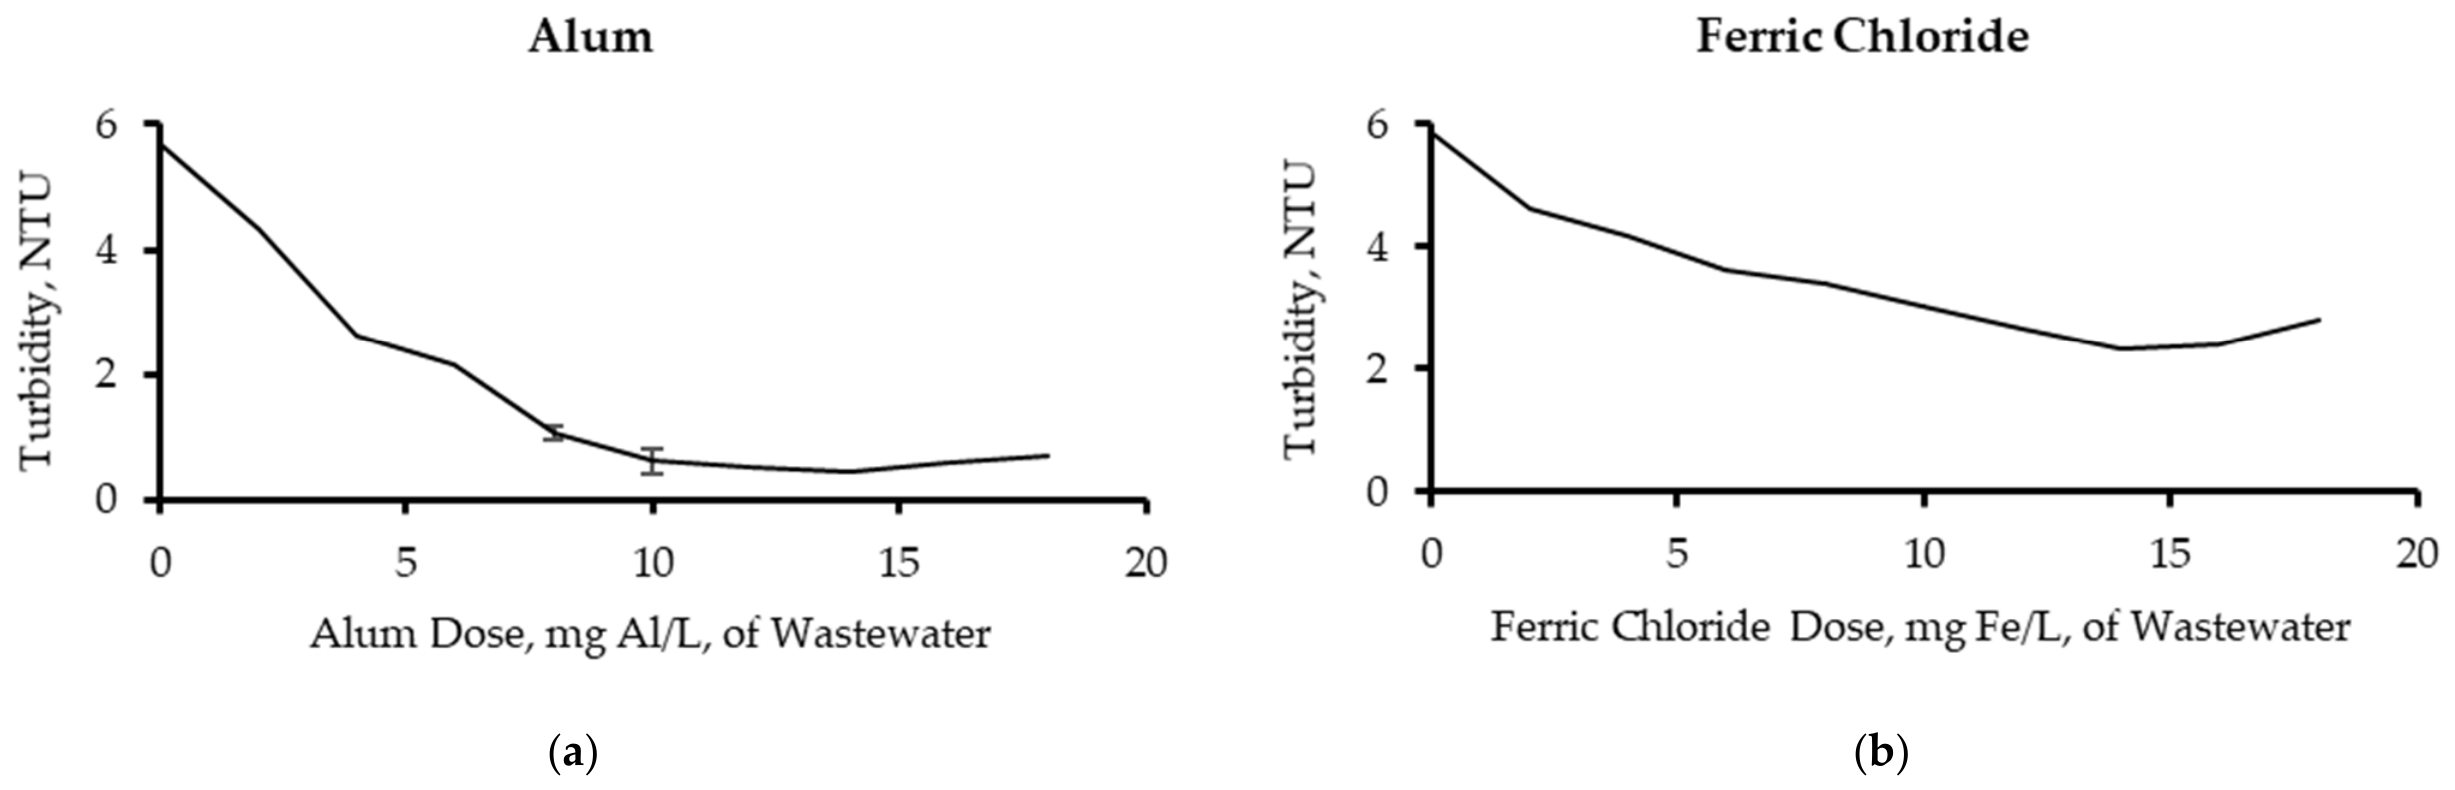
A standard jar test procedure was conducted to determine the optimal doses of alum and ferric chloride for improving the performance of the filter prior to implementing chemical addition during the pilot-scale experiments (Phase III). Wastewater samples used in the jar tests were collected from the effluent of the chlorination contact tank at QWWTP. The contact-tank effluent had a pH of 7.71–7.84 during testing, while it generally ranged from 7.5 to 8.2 during normal operation. Alkalinity and dissolved organic carbon (DOC) were not measured in the current study. Additional measured characteristics of the jar-test feed water included TSS (13.6 mg/L), BOD (10.8 mg/L), chemical oxygen demand (COD) (32.8 mg/L), oil and grease (0.4 mg/L), residual chlorine (0.7 mg/L), and dissolved oxygen (5 mg/L).
In the jar test experiments, coagulant doses of 2, 4, 6, 8, 10, 12, 14, 16, and 18 mg/L were added to separate 1 L wastewater samples. The samples were first subjected to rapid mixing at 180 rpm for 1 min to ensure proper dispersion of the coagulant and to initiate the coagulation process. This was followed by slow mixing at 30 rpm for 20 min to promote floc formation. During this stage, the coagulant reacts with suspended solids and colloidal particles, facilitating their aggregation into larger flocs.
After the slow mixing phase, the jars were allowed to settle undisturbed for 15 min to complete the conventional jar-test procedure and to permit comparison of residual turbidity after floc formation and settling. Following the settling period, samples were collected from each jar, and turbidity was measured to evaluate the effectiveness of the different coagulant doses and to determine the optimum coagulant dosage. The optimum coagulant dose was selected as the dose producing the lowest residual turbidity. Although turbidity is not a direct surrogate for all removal targets, it was used here to identify the dose range most likely to improve overall filtration performance, after which the selected doses were validated in the pilot-scale system.
Turbidity was measured using a VELP SCIENTIFICA TB1 portable turbidimeter (VELP Scientifica Srl, Usmate, Italy). This instrument operates on the nephelometric principle of turbidity measurement and is designed to meet the criteria specified in ISO 7027 [
21]. The instrument was calibrated using the supplied NIST-traceable standards (0.02, 20, 100, and 800 NTU) before sample analysis, and results were reported in NTU.
The jar tests were conducted as an initial screening stage to identify suitable coagulant doses for the pilot-scale experiments. Under controlled batch conditions, the tests provided a rapid comparison of alum and ferric chloride performance and helped determine the dose range that produced the lowest residual turbidity. These results were then used to select the doses applied in the pilot-scale continuous up-flow sand filter, where the same coagulants were evaluated under continuous-flow conditions and with the additional influence of filtration through the sand bed. In this way, the jar tests served as a laboratory-scale optimization step, while the pilot tests verified the practical effectiveness of the selected doses in a real tertiary treatment configuration. These jar tests were used as an initial screening tool for dose selection and were not intended to replicate the hydraulics of the pilot-scale direct-filtration system, where coagulant was injected inline without a sedimentation stage.
2.5. Performance Evaluation of the Continuous Up-Flow Sand Filter
The performance of the continuous up-flow sand filter was evaluated during different experimental runs by measuring the flow rates of the effluent and the sand wash streams. In addition, composite samples were collected, as time-composite samples during each run under constant flow conditions, and analyzed from the influent, effluent, and sand wash of the filter unit. Unlike conventional rapid sand filters, the continuous up-flow sand filter operates continuously without discrete backwashing; the sand is washed during operation while filtration continues, and the reject stream was used here to quantify wash-water losses. Several water quality parameters were routinely measured in these samples, including total suspended solids (TSS), five-day biochemical oxygen demand (BOD
5), and turbidity. In addition to the routine parameters,
Escherichia coli (
E. coli), total nitrogen (TN), and total phosphorus (TP) were also analyzed in selected runs only, depending on laboratory availability, sample timing, and cost constraints. The concentrations of these parameters were compared with the limits specified in the Egyptian Code of Practice for Effluent Reuse in Agriculture (ECP 501/2015) [
22].
In the Egyptian regulatory framework, the reuse of treated domestic wastewater in agriculture is governed by the Egyptian Code of Practice ECP 501/2015 [
22]. The code specifies water quality limits for physical, chemical, and microbiological parameters in treated wastewater for different reuse applications, including unrestricted and restricted landscape irrigation in urban areas as well as agricultural irrigation of edible and non-edible crops. The code defines four categories of treated wastewater quality, namely A, B, C, and D. The key parameters used to define these categories include biochemical oxygen demand (BOD
5), total suspended solids (TSS), turbidity, and pathogen indicators such as
E. coli and nematode eggs, with threshold values designed to protect agricultural workers, consumers of irrigated crops, and the environment [
22].
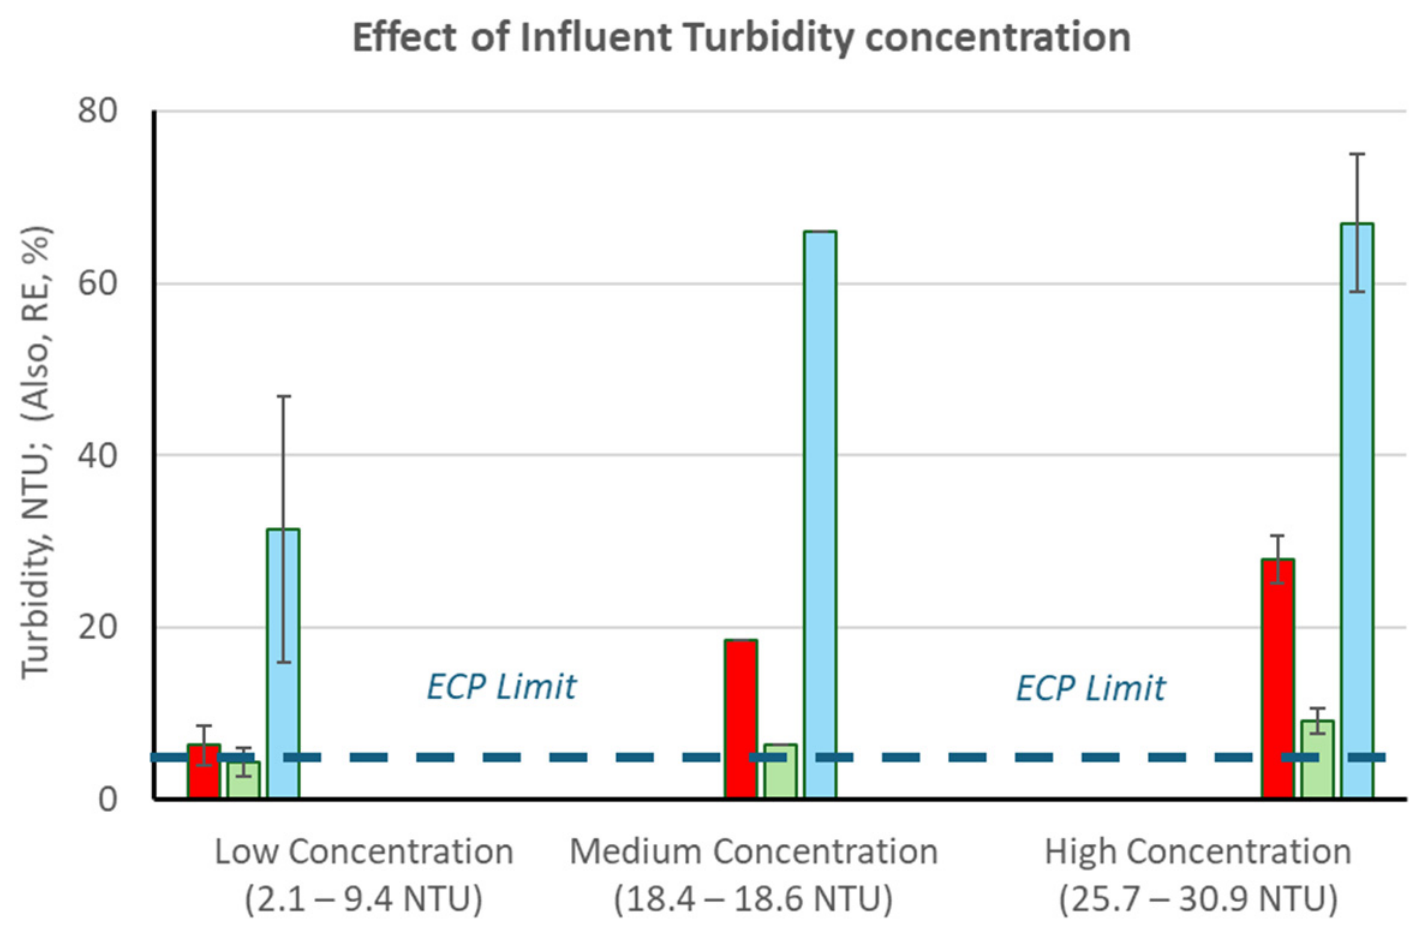
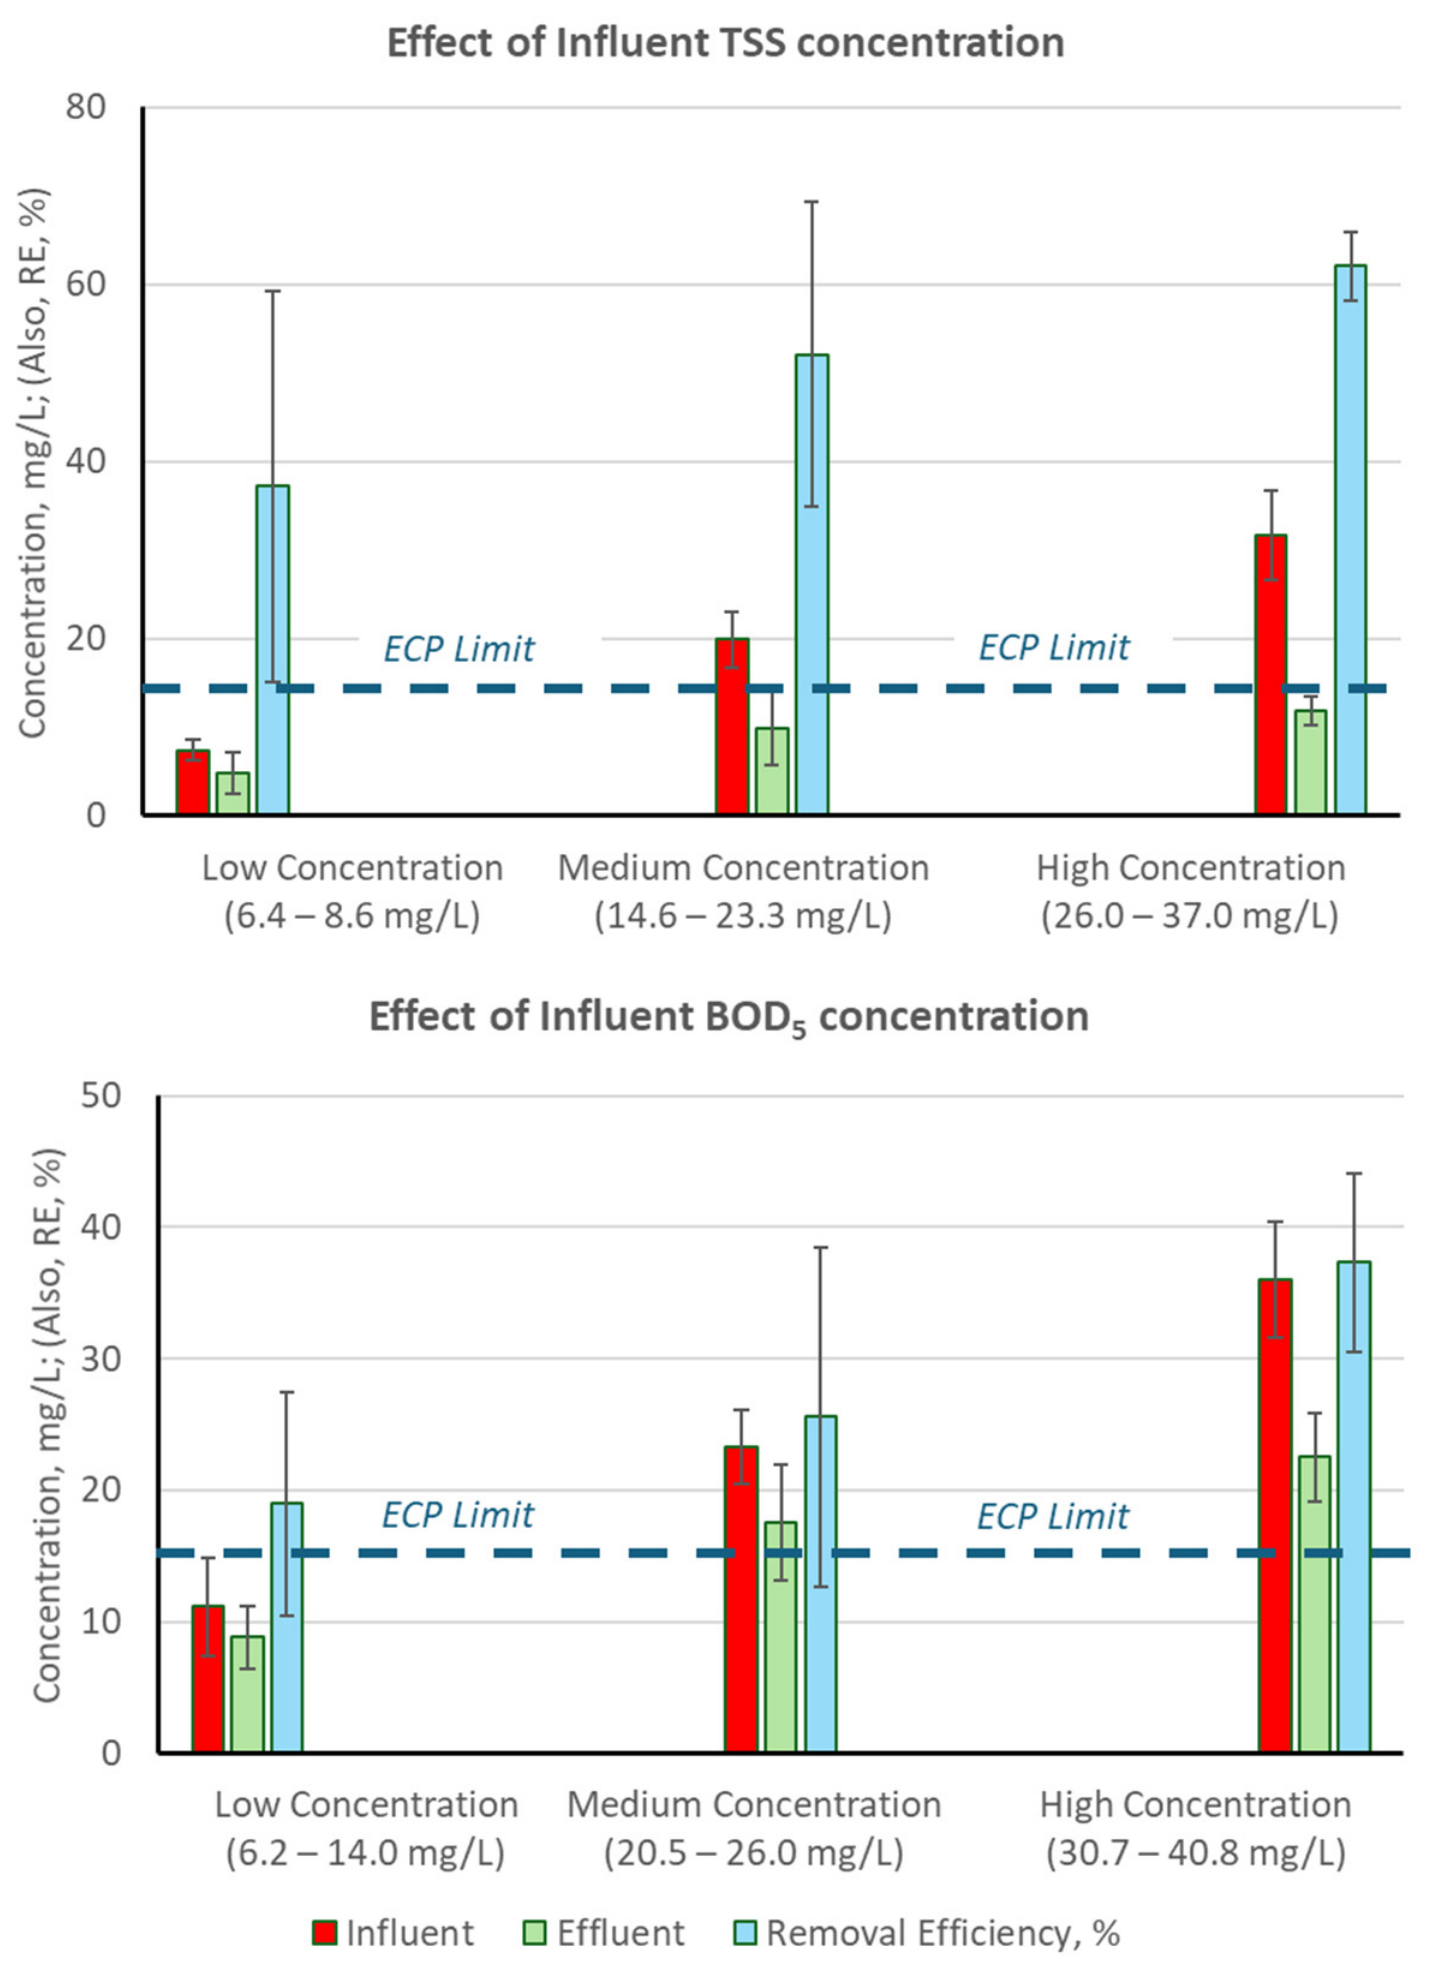
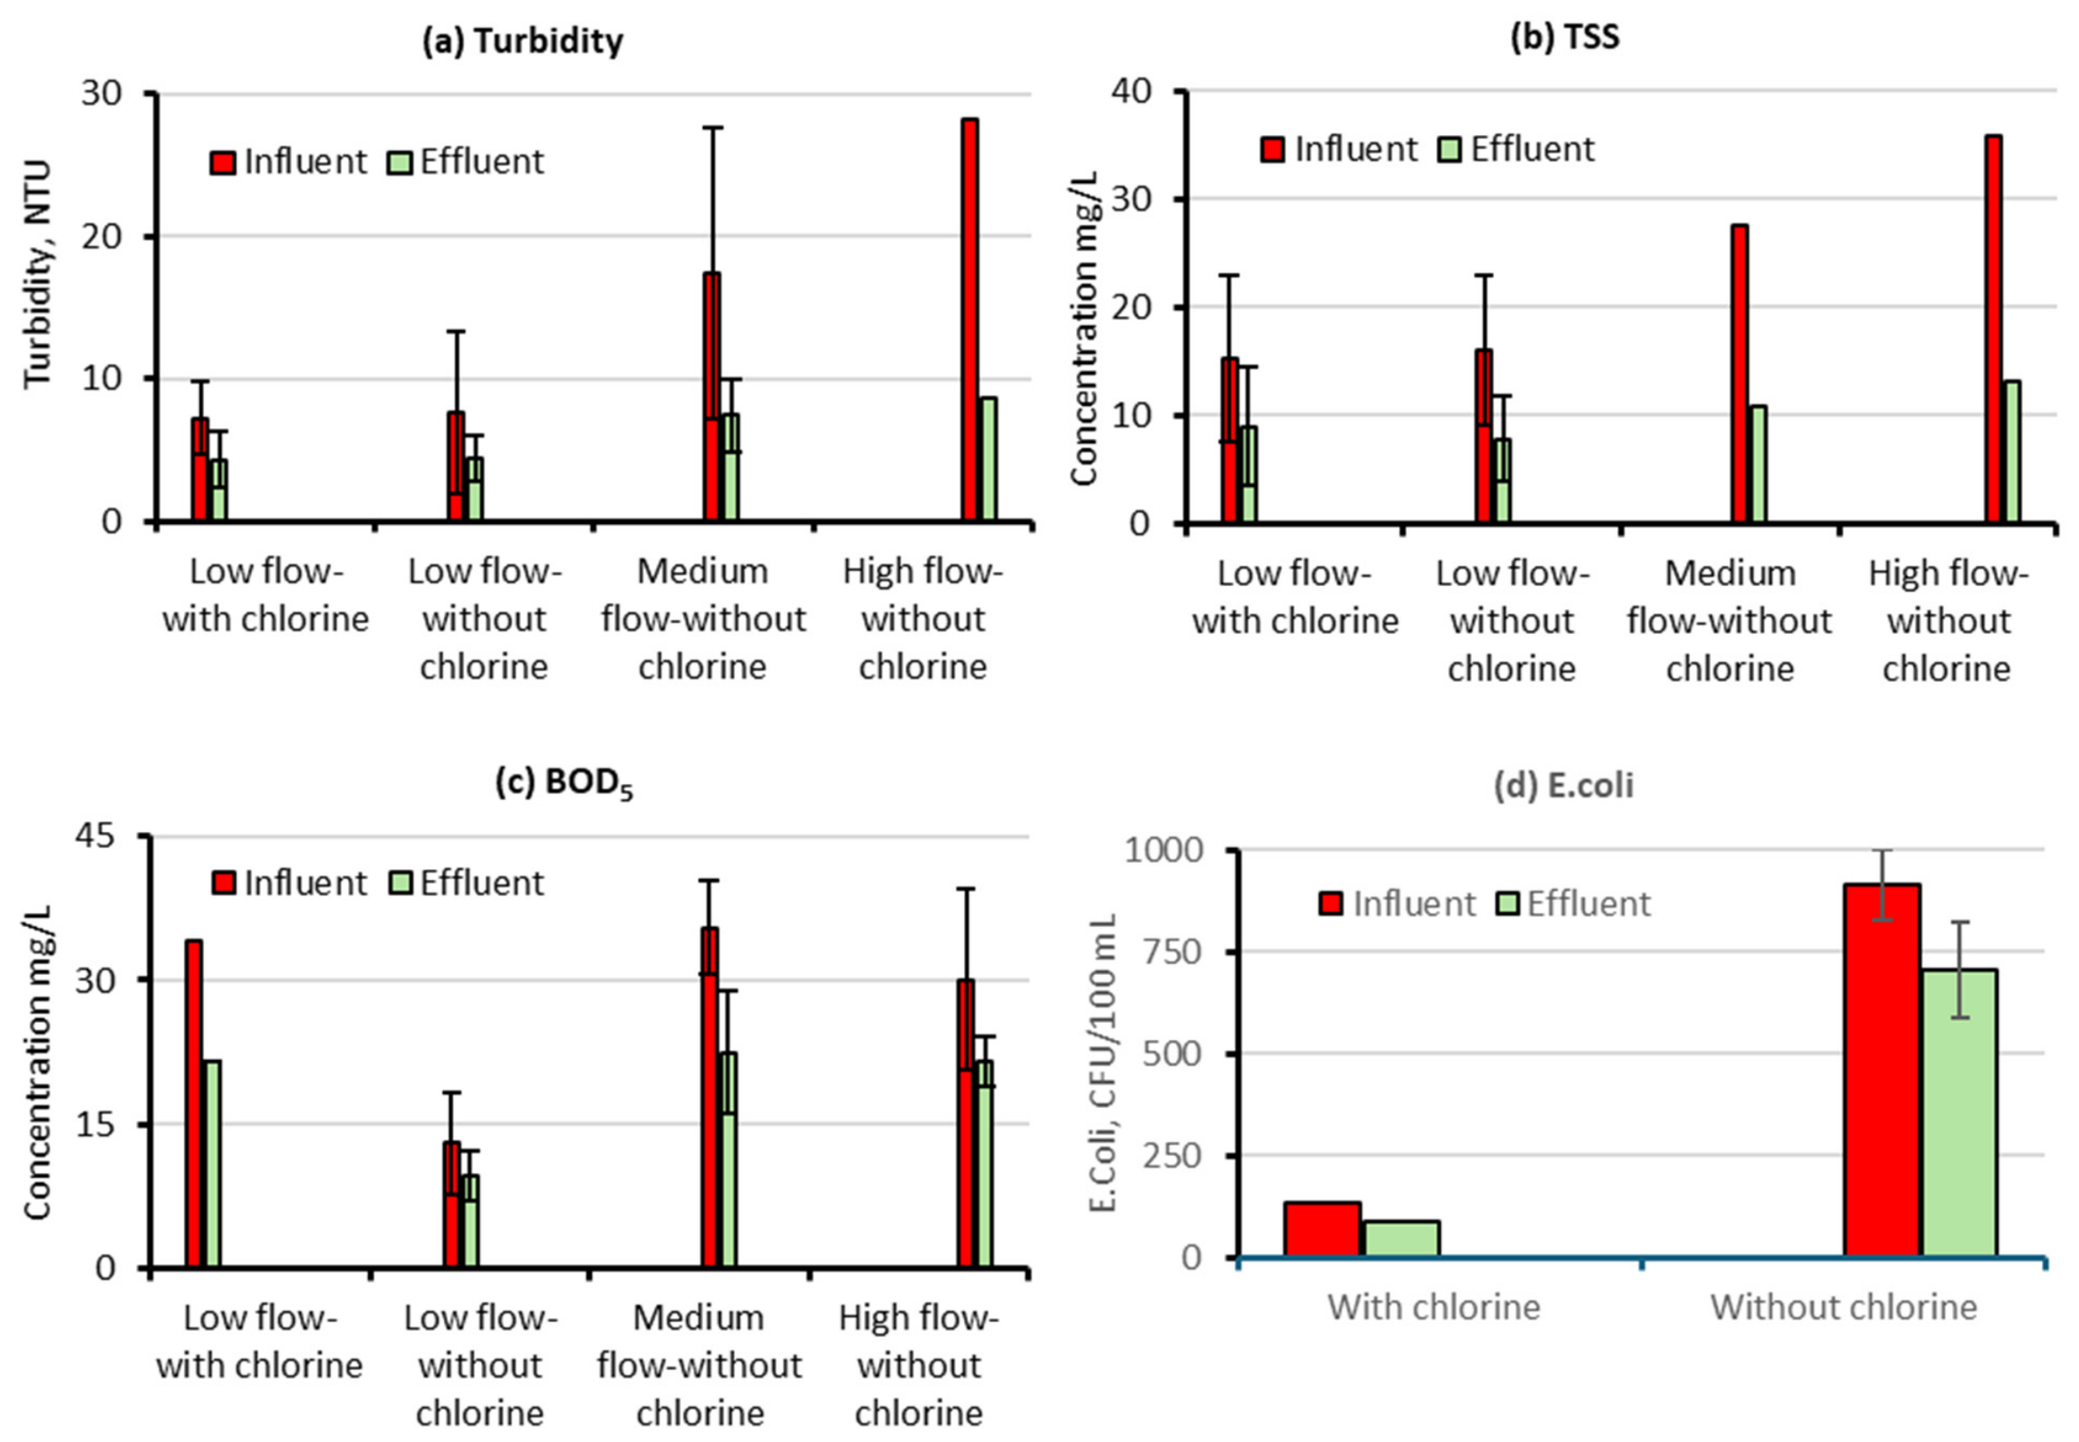
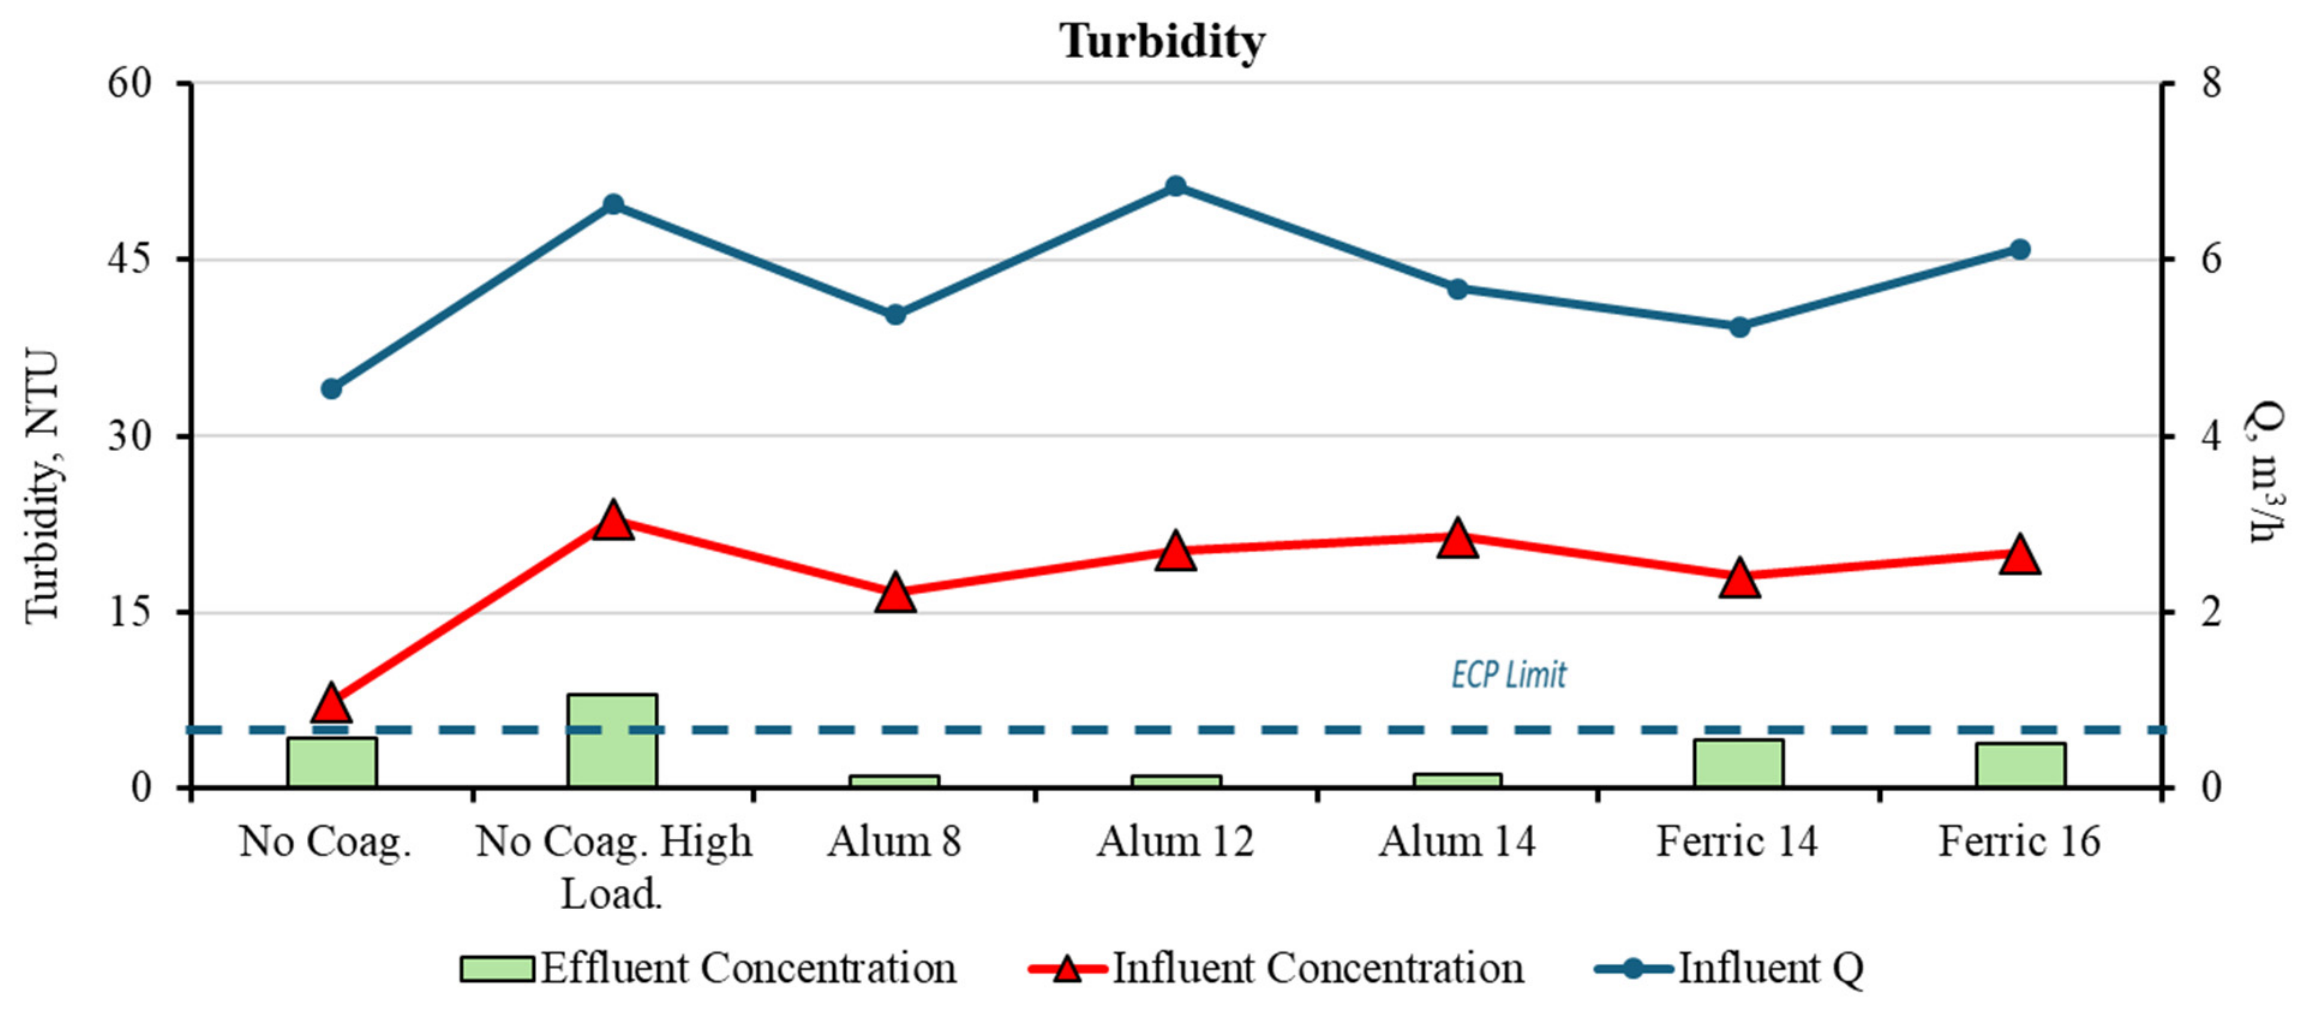
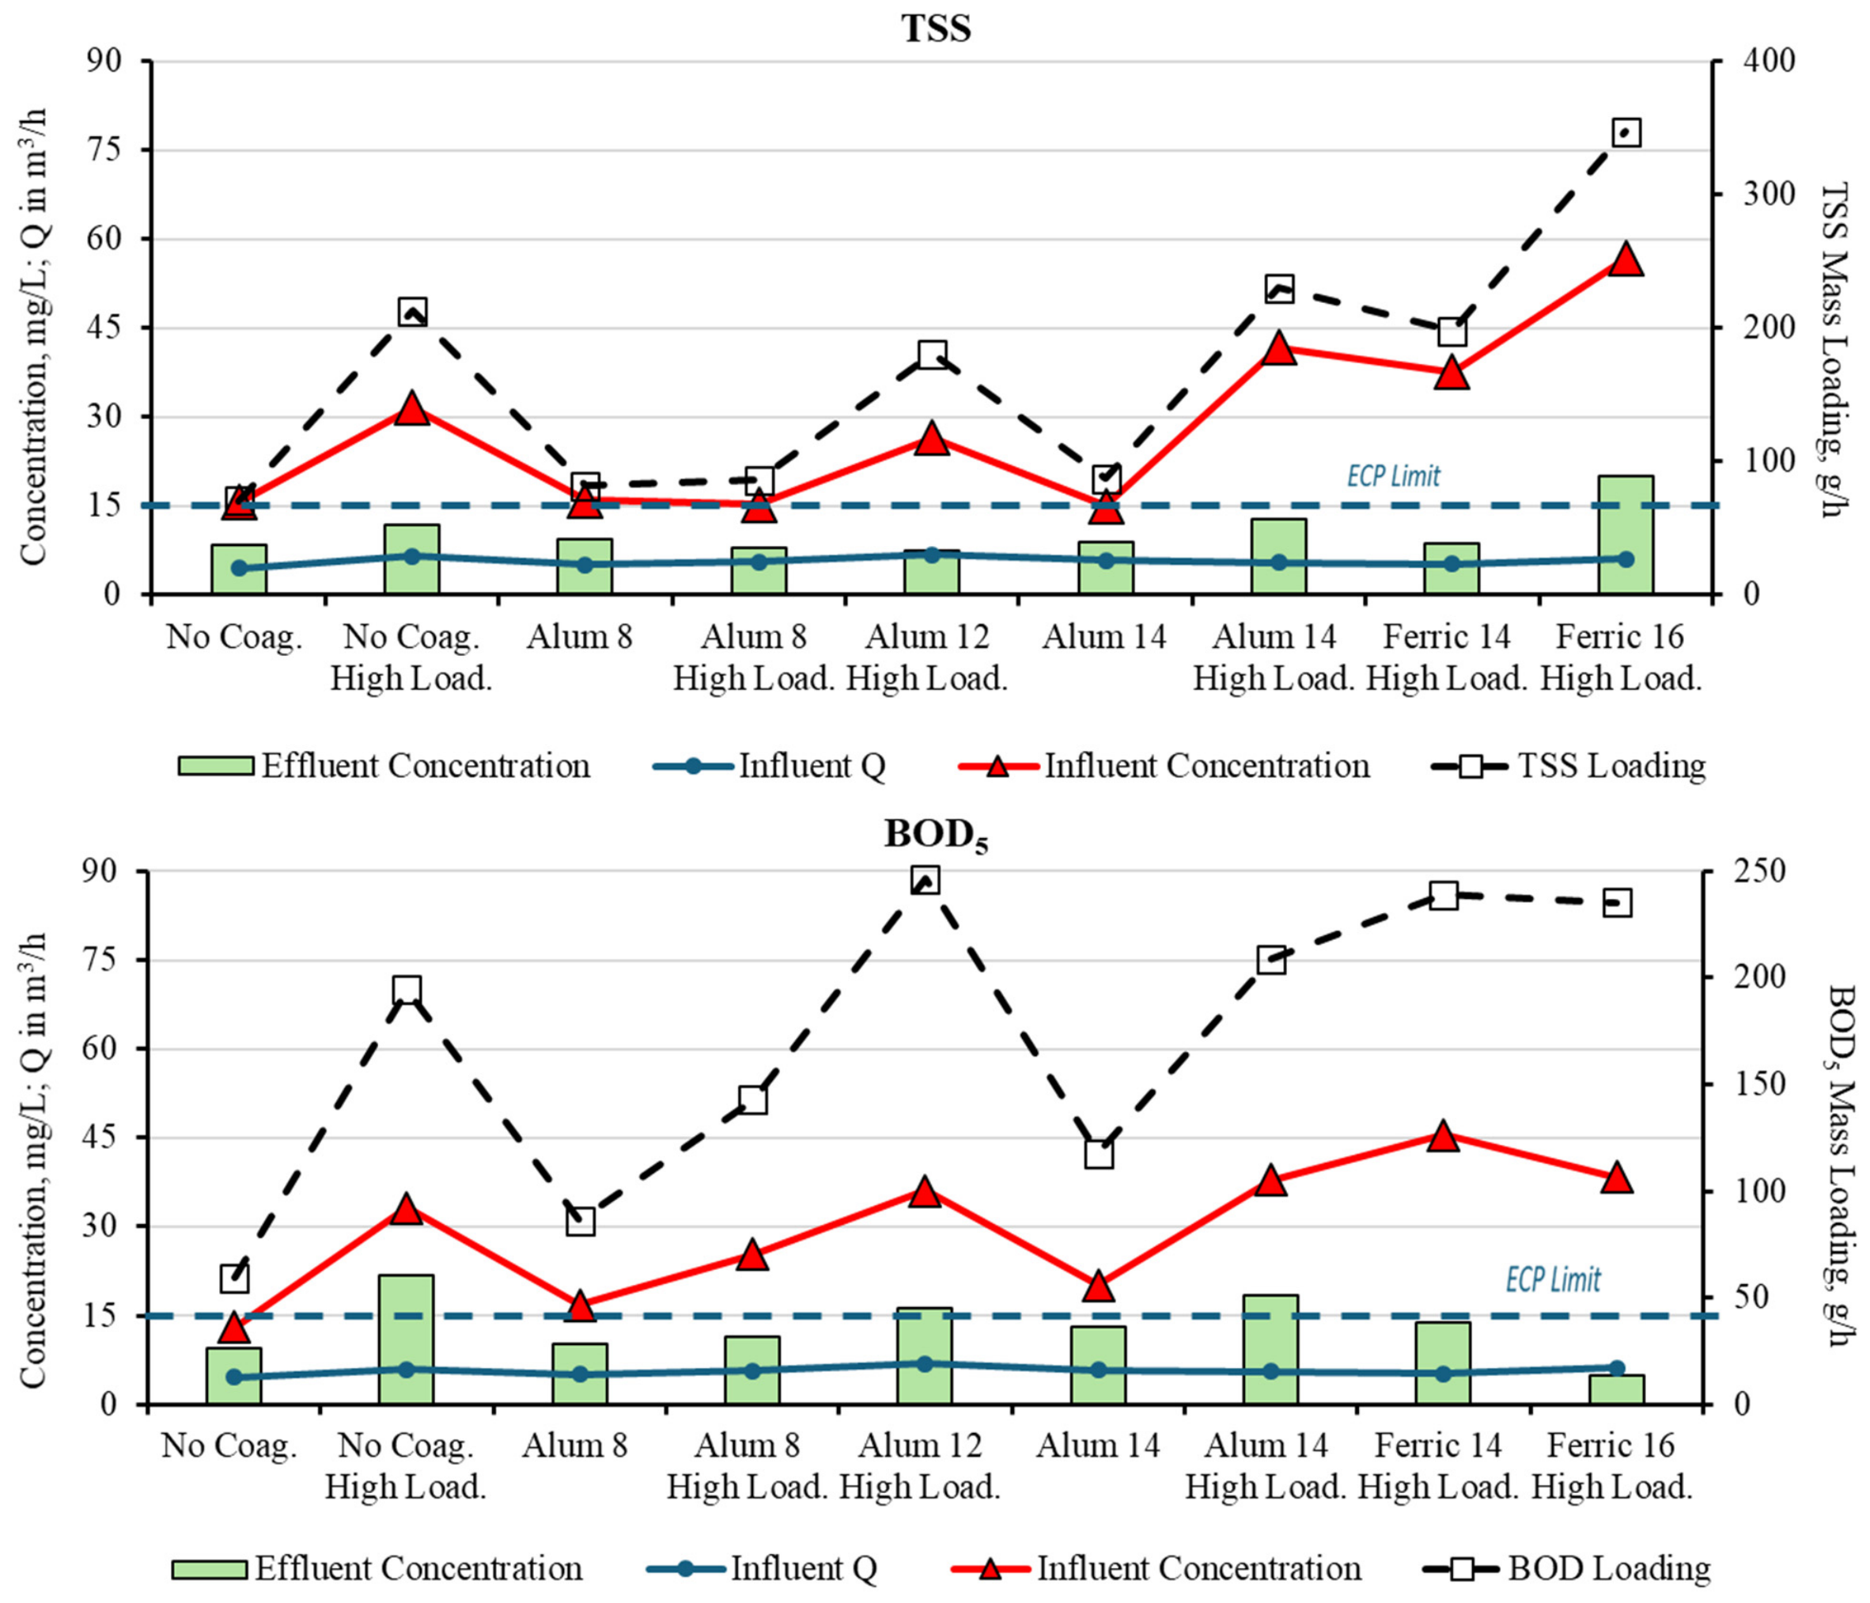
The current study evaluates the quality of the treated water for reuse by comparing the measured parameters with the limits specified for Category A, which represents the most stringent water quality class and exceeds the requirements of the other three categories. For Category A, turbidity, TSS, and BOD5 should not exceed 5 NTU, 15 mg/L, and 15 mg/L, respectively, while the E. coli concentration should not exceed 20 MPN/100 mL. In the current study, E. coli was analyzed using a culture-based method and reported as CFU/100 mL; the Egyptian Code of Practice limit is expressed as MPN/100 mL and is used here only as the regulatory reference value.
4. Conclusions
This study evaluated the performance of a pilot-scale continuous up-flow sand filter for the tertiary treatment of secondary wastewater effluent. The system was tested under varying influent water quality and with the addition of coagulants to assess its suitability for producing effluent suitable for agricultural reuse in accordance with the Egyptian Code of Practice (ECP 501/2015). The results demonstrated that the filter achieved stable operation under varying influent flow rates ranging from 3.9 to 8.5 m3/h. Chlorine addition upstream of the filtration unit showed no significant effect on the removal of turbidity, TSS, or BOD5, indicating that the removal of these parameters is primarily governed by physical filtration processes. However, upstream chlorination slightly enhanced E. coli removal, increasing the log reduction from 0.12 without chlorine to 0.19 with chlorine addition. The filtration process effectively removed TSS and turbidity, with effluent TSS and turbidity consistently below the Category A limits of 15 mg/L and 5 NTU, respectively, under most tested conditions. Nevertheless, turbidity and BOD5 removal without coagulant addition were influenced by influent water quality, and the Category A turbidity limit was achieved only under low influent concentrations. On another note, additional post-disinfection is required to achieve full microbiological compliance.
The application of coagulants significantly improved filtration performance. Jar test experiments indicated optimal coagulant doses of 8–14 mg Al/L for alum and 14–16 mg Fe/L for ferric chloride. Coagulant-assisted filtration enhanced the removal of turbidity, TSS, and BOD5 under all tested influent conditions. Alum demonstrated superior performance in turbidity and TSS removal, whereas ferric chloride achieved greater BOD5 reduction, likely due to the formation of dense ferric hydroxide precipitates capable of adsorbing organic matter. A coagulant dose of approximately 14 mg/L for both alum and ferric chloride was found to produce effluent quality that complies with the ECP Category A limits. This showed that the selected operating condition is reliable under the studied wastewater quality ranges. This suggests that the continuous up-flow sand filter can maintain acceptable effluent quality under repeated operation, which is encouraging for practical application. However, long-term durability under extended continuous operation was not directly evaluated in this study and should be investigated in future work before full-scale deployment.
The continuous up-flow sand filter showed limited removal of TN and TP, which is expected because these nutrients are predominantly present in dissolved forms in secondary effluent. Overall, the findings confirm that continuous up-flow sand filtration is a reliable tertiary treatment technology for polishing secondary wastewater effluent and supporting safe wastewater reuse, particularly in water-scarce regions such as Egypt. The results also highlight the potential of coagulant-assisted filtration as a polishing step for achieving stricter reuse standards under higher influent pollutant loads, while emphasizing the need to consider chemical consumption, sludge production, and potential residual coagulant-related risks. When aluminum-based coagulants are used, part of the coagulant-associated solids is expected to be removed with the sand-wash effluent and sent to the sludge treatment line; however, residual dissolved aluminum in the treated effluent was not measured in this study, so its carryover could not be directly assessed. Future work should evaluate long-term operational stability, residual coagulant concentrations, sludge handling, and broader applicability under varying influent conditions.



 ,
,